Submitted:
29 November 2025
Posted:
01 December 2025
You are already at the latest version
Abstract
The snow leopard (Panthera uncia) represents one of the most endangered large felids globally, with population monitoring presenting significant challenges due to the species’ elusive nature and remote mountainous habitat. This study presents the first automated detection system specifically designed for snow leopard identification in camera trap imagery within the Kyrgyz Republic. We propose a two-stage classification pipeline combining motion detection preprocessing with a fine-tuned MobileNetV2 architecture enhanced by squeeze-and-excitation attention mechanisms. The system was trained on a curated dataset of 2,660 images and evaluated using 5-fold stratified cross-validation. The model achieved an AUC-ROC of 97.25%, Average Precision of 92.88%, and sensitivity of 99.9% (±0.2%), missing only 1 snow leopard image out of 916 across all validation folds. Threshold optimization analysis demonstrated that adjusting the decision boundary from 0.5 to 0.95 improves specificity from 64% to 88% while maintaining 99% sensitivity. The model has been deployed as a functional web application, representing a pioneering contribution to technology-assisted wildlife conservation efforts in Central Asia. This work establishes a foundation for automated biodiversity monitoring systems in the region and demonstrates the viability of transfer learning approaches for species-specific detection tasks with limited training data.
Keywords:
snow leopard detection
; deep learning
; camera trap analysis
; wildlife conservation
; transfer learning
; MobileNetV2
; attention mechanism
; Kyrgyzsta
1. Introduction
1.1. Background and Motivation
The snow leopard (Panthera uncia) inhabits the high-altitude mountain ecosystems of Central Asia, with an estimated global population of 4,000–6,500 individuals distributed across twelve range countries [12]. The species is classified as “Vulnerable” on the IUCN Red List, facing persistent threats including habitat fragmentation, prey depletion, retaliatory killing by herders, and climate change impacts on alpine ecosystems [16]. The Kyrgyz Republic, characterized by its extensive Tien Shan mountain ranges, constitutes one of the core habitats for this species, harboring an estimated 300–400 individuals representing approximately 8–10% of the global population [17].
Contemporary snow leopard monitoring relies predominantly on camera trap networks deployed throughout the species’ range. These passive infrared-triggered cameras generate substantial image volumes, with a single survey potentially producing tens of thousands of photographs requiring manual classification [13]. This manual review process presents significant bottlenecks: it is labor-intensive, time-consuming, prone to observer fatigue and inconsistency, and delays the availability of population data critical for conservation decision-making [18].
1.2. Problem Statement
Despite the global advancement of deep learning applications in wildlife monitoring, no automated detection system has been developed specifically for snow leopard identification within the Central Asian context. Existing general-purpose wildlife classifiers demonstrate reduced performance when applied to species with cryptic coloration patterns operating in snow-covered environments, where the subject-background contrast is minimal [15]. Furthermore, the Kyrgyz Republic lacks institutional infrastructure for implementing such technological solutions, resulting in continued reliance on manual image processing that limits the scale and frequency of population assessments.
1.3. Research Objectives
This study addresses the identified gap through the following objectives:
- To develop and validate a deep learning model optimized for snow leopard detection in camera trap imagery
- To implement a preprocessing pipeline that enhances detection accuracy while reducing computational requirements
- To deploy the system as an accessible web application suitable for use by conservation practitioners
- To establish baseline performance metrics for automated snow leopard detection in the Kyrgyz context
1.4. Contributions
This work presents several contributions to the fields of conservation technology and applied machine learning:
- First regional implementation: To our knowledge, this represents the first automated snow leopard detection system developed for and deployed within the Kyrgyz Republic
- Two-stage detection pipeline: We introduce a preprocessing approach combining motion detection with deep classification, reducing computational overhead while maintaining detection sensitivity
- Attention-enhanced architecture: We demonstrate the effectiveness of squeeze-and-excitation mechanisms for species-specific detection in challenging environmental conditions
- Comprehensive evaluation: We provide rigorous performance assessment using 5-fold cross-validation with multiple evaluation metrics
- Practical deployment: The system has been implemented as a functional web application, facilitating adoption by conservation organizations
2. Related Work
2.1. Deep Learning for Camera Trap Image Analysis
The application of deep learning to automated wildlife image classification has undergone rapid development over the past decade, transforming ecological monitoring capabilities. [13] demonstrated that deep convolutional neural networks could achieve human-level accuracy in classifying wildlife species from the Snapshot Serengeti dataset, correctly identifying species in 93.8% of images containing 48 species across 3.2 million photographs. Their work established transfer learning from ImageNet-pretrained models as the dominant paradigm for wildlife classification tasks, significantly reducing the data requirements for training effective classifiers.
[18] developed the Machine Learning for Wildlife Image Classification (MLWIC) system, providing an accessible framework enabling ecologists without machine learning expertise to train custom classifiers. Their systematic evaluation across multiple camera trap datasets from North America demonstrated that model performance varies substantially with image quality, species characteristics, and environmental conditions, achieving 97.6% accuracy on species-level classification when sufficient training data was available.
[1] introduced the iWildCam challenge dataset, explicitly addressing the domain shift problem wherein models trained on imagery from one geographic region exhibit substantially degraded performance when deployed in novel locations. Their analysis revealed that naïve transfer between regions resulted in accuracy reductions of 20–40%, emphasizing the need for region-specific model development or sophisticated domain adaptation techniques.
[15] conducted a comprehensive comparative evaluation of deep learning object detection methods for ecological camera trap data, benchmarking Faster R-CNN and YOLO architectures. Their findings indicated that Faster R-CNN achieved superior accuracy on complex field images (mAP of 93.0% vs. 76.7% for YOLOv2), though at increased computational cost, suggesting architecture selection should consider deployment constraints.
Recent systematic reviews have synthesized the rapidly expanding literature in this domain. [22] analyzed 167 studies employing machine learning for camera trap image processing, identifying best practices including the use of hierarchical classification schemes, ensemble methods, and human-in-the-loop validation workflows. Their meta-analysis revealed mean classification accuracies of 87.2% across studies, with performance strongly correlated with dataset size and class balance.
[19] benchmarked mainstream deep learning architectures including YOLOv5, EfficientNet, and ResNet variants on camera trap imagery from the Northeast Tiger and Leopard National Park in China. Their comparative analysis demonstrated that EfficientNet-B4 achieved the highest species classification accuracy (94.3%) while maintaining reasonable inference speed, though lightweight architectures such as MobileNetV2 offered superior efficiency for resource-constrained deployments.
2.2. Attention Mechanisms in Visual Recognition
Attention mechanisms have emerged as a transformative approach for enhancing CNN performance by enabling networks to selectively focus on task-relevant image regions while suppressing irrelevant information. [9] introduced the Squeeze-and-Excitation (SE) network, which recalibrates channel-wise feature responses through explicit modeling of inter-channel dependencies. The SE mechanism operates through global average pooling (squeeze) followed by a gating mechanism with sigmoid activation (excitation), enabling adaptive feature recalibration with minimal computational overhead (approximately 2.5% additional parameters). SE-ResNet-50 won the ILSVRC 2017 classification challenge, reducing top-5 error to 2.25%—a relative improvement of 25% over the previous state-of-the-art.
[23] proposed the Convolutional Block Attention Module (CBAM), which extends channel attention by incorporating spatial attention mechanisms. CBAM sequentially applies channel and spatial attention, enabling simultaneous emphasis of “what” (which features) and “where” (which spatial locations) are most informative. Comparative evaluation demonstrated consistent accuracy improvements across ResNet, MobileNet, and other backbone architectures.
[21] developed the Residual Attention Network, employing a trunk-and-mask architecture wherein attention modules learn soft weights for feature map positions. Their approach achieved state-of-the-art performance on fine-grained visual recognition tasks, which share characteristics with wildlife detection: the need to identify subtle distinguishing features (pelage patterns, morphological details) against complex, variable backgrounds.
The application of attention mechanisms to wildlife detection remains relatively unexplored. [25] demonstrated that SE blocks improved bird species classification accuracy by 3.2% compared to baseline ResNet models, suggesting potential benefits for other cryptically-patterned species.
2.3. Transfer Learning with Lightweight Architectures
Resource-efficient neural network architectures have become essential for deploying deep learning in field conditions and web-based applications where computational resources are constrained. [8] introduced MobileNet, utilizing depthwise separable convolutions to dramatically reduce model complexity—achieving comparable accuracy to VGG-16 with 32× fewer parameters and 27× fewer multiply-add operations.
[14] extended this work with MobileNetV2, introducing inverted residual blocks with linear bottlenecks that further improved the accuracy-efficiency trade-off. MobileNetV2 achieved 72.0% top-1 accuracy on ImageNet with only 3.4 million parameters, making it highly suitable for mobile and embedded deployment scenarios.
[20] proposed EfficientNet, employing neural architecture search (NAS) to systematically optimize network scaling across depth, width, and resolution dimensions. EfficientNet-B0 achieved 77.1% top-1 accuracy with 5.3 million parameters, while the scaled EfficientNet-B7 achieved 84.3% accuracy, establishing new state-of-the-art results across multiple image classification benchmarks.
In wildlife classification contexts, [4] demonstrated that MobileNetV2 with transfer learning achieved 89.7% accuracy on a 20-species wildlife dataset while maintaining real-time inference capability on mobile devices. [24] showed that combining MobileNet backbones with attention mechanisms yielded 4.1% accuracy improvements over baseline models for animal detection in camera trap imagery.
2.4. Addressing Class Imbalance in Wildlife Detection
Class imbalance represents a persistent and severe challenge in camera trap image classification, where target species images may constitute less than 1% of the total dataset. [11] introduced Focal Loss, which addresses class imbalance by down-weighting well-classified examples through a modulating factor . This focusing mechanism directs learning toward hard, misclassified examples, proving particularly effective for object detection where background samples vastly outnumber foreground objects. Focal Loss enabled RetinaNet to achieve state-of-the-art detection accuracy while maintaining single-stage efficiency.
[3] conducted systematic evaluation of strategies for handling imbalanced data in deep learning, comparing oversampling, undersampling, and loss modification approaches. Their analysis revealed that optimal strategies depend on the degree of imbalance: for moderate imbalance (1:10 to 1:100), oversampling combined with data augmentation proves effective, while severe imbalance (>1:100) benefits from cost-sensitive learning approaches.
[5] proposed Class-Balanced Loss based on effective number of samples, providing theoretical grounding for reweighting strategies. Their approach demonstrated consistent improvements across long-tailed recognition benchmarks, with particular benefits for rare classes.
In ecological contexts, [6] specifically addressed class imbalance in camera trap datasets, demonstrating that combining minority class oversampling with Focal Loss yielded superior performance (F1-score improvement of 8.3%) compared to either approach in isolation.
2.5. Snow Leopard Conservation Technologies
Snow leopard (Panthera uncia) conservation has increasingly incorporated technological approaches, though automated detection systems remain limited. [16] reviewed camera trapping methodologies for snow leopard population estimation across the twelve range countries, documenting that image processing represents the primary bottleneck limiting survey scale, with typical surveys requiring 3–6 months of manual classification effort.
[2] evaluated the combination of human expertise with artificial intelligence for snow leopard camera trap classification in Mongolia and Nepal. Using the Whiskerbook platform for individual identification, they demonstrated that AI-assisted classification reduced expert time requirements by 64% while improving identification consistency. Critically, their analysis revealed that pure AI approaches without human verification produced unacceptable error rates for population estimation.
[10] developed a CNN-based snow leopard detection system for Nepal, achieving 89% accuracy on a test set of 500 images. Their work represented an important proof-of-concept, though the model was not deployed operationally, and performance in different geographic contexts remained unvalidated.
The Snow Leopard Network has advocated for technological solutions to accelerate camera trap data processing, identifying this as a priority need across range countries [12]. Despite these calls, no automated detection system has been developed for or deployed within the Kyrgyz Republic, despite the country’s significance as core snow leopard habitat.
2.6. Research Gap and Motivation
The preceding review identifies a clear research gap: while deep learning methods have proven effective for camera trap image classification generally, and while snow leopard conservation urgently requires automated processing solutions, no system has been developed specifically for the Central Asian context. The Kyrgyz Republic, representing critical snow leopard habitat, lacks technological infrastructure for automated image processing.
This study addresses these gaps by developing, validating, and deploying the first automated snow leopard detection system specifically designed for the Kyrgyz context, establishing foundational infrastructure for technology-assisted conservation in the region.
3. Materials and Methods
3.1. Study Context
This research was conducted in the context of snow leopard monitoring programs operating in the Kyrgyz Republic, where camera trap networks are deployed across the Tien Shan and Pamir-Alai mountain ranges. The system was designed to process imagery from these ongoing monitoring efforts, with the goal of reducing the manual labor required for image classification.
3.2. Dataset Compilation
3.2.1. Data Sources
The training dataset was compiled from multiple sources to ensure adequate sample size and variation:
- Camera trap archives: Authentic camera trap images were obtained from conservation partner organizations operating in Kyrgyzstan, comprising field-captured photographs from monitoring surveys. Images were captured using Bushnell Trophy Cam units, providing both daytime color imagery and nighttime infrared captures with embedded metadata (temperature, date, time).
- Controlled environment captures: To supplement the limited availability of wild snow leopard images, additional footage was collected from camera traps deployed at a wildlife sanctuary housing two snow leopards. Video recordings were processed to extract frames representing diverse poses, lighting conditions, and times of day.
- Public repositories: Additional snow leopard images were sourced from publicly available wildlife image databases, including iNaturalist and Flickr Creative Commons collections, filtered for image quality and taxonomic accuracy.
3.2.2. Dataset Characteristics
The final dataset comprised 2,660 images distributed across two classes. Table 1 presents the dataset composition.
The negative class comprised:
- Empty camera trap frames showing landscape without wildlife
- Images of sympatric species (ibex, wolves, foxes, marmots, birds)
- Various environmental conditions (snow cover, bare rock, vegetation)
Images were captured across diverse conditions including daytime color imagery and nighttime infrared captures, multiple seasons with varying snow cover, and different camera trap locations and viewing angles.
3.3. Preprocessing Pipeline
3.3.1. Motion Detection Stage
A two-stage preprocessing approach was implemented to optimize computational efficiency. The initial stage employs motion detection to identify frames containing potential activity, filtering static images that are unlikely to contain wildlife.
The motion detection algorithm computes the absolute difference between consecutive frames, applies Gaussian blurring (kernel size: ) for noise reduction, and thresholds the result to identify regions of significant change. Frames exhibiting motion above the threshold are forwarded to the classification stage.
3.3.2. Image Preprocessing
Images forwarded to the classification stage undergo standardized preprocessing:
- Resizing: Images are resized to pixels to match the input dimensions expected by the MobileNetV2 architecture
- Normalization: Pixel values are scaled to the range
- Channel standardization: RGB channel values are normalized using ImageNet statistics
3.4. Model Architecture
3.4.1. Base Architecture Selection
MobileNetV2 [14] was selected as the base architecture based on the following criteria:
- Computational efficiency: Depthwise separable convolutions reduce parameter count and inference time, facilitating deployment on resource-constrained systems
- Transfer learning compatibility: Pre-trained ImageNet weights provide robust feature extraction capabilities
- Proven performance: Demonstrated effectiveness in wildlife classification tasks [18]
The model was initialized with weights pre-trained on ImageNet [7], with the convolutional base frozen to preserve learned feature representations.
3.4.2. Attention Mechanism Integration
Squeeze-and-Excitation (SE) blocks were integrated to enhance feature discrimination. The SE mechanism operates through three stages:
- Squeeze: Global average pooling compresses spatial dimensions to a channel descriptor
- Excitation: A two-layer fully connected network learns channel-wise dependencies with reduction ratio of 16
- Recalibration: Original features are scaled by the learned channel weights
This attention mechanism enables the network to emphasize features most relevant to snow leopard detection while suppressing less informative channels.
3.4.3. Complete Architecture
Table 2 presents the complete model architecture configuration.
3.5. Training Procedure
3.5.1. Loss Function
Focal Loss [11] was employed to address class imbalance and focus learning on difficult examples:
where is the predicted probability for the correct class, is set to 0.25, and (focusing parameter) is set to 2.0.
3.5.2. Optimization Configuration
Table 3 presents the training hyperparameters.
3.5.3. Data Augmentation
Training images underwent stochastic augmentation to improve generalization. Table 4 presents the augmentation parameters.
Augmentation was applied exclusively to training data; validation and test sets underwent only deterministic preprocessing.
3.5.4. Cross-Validation
To obtain robust performance estimates and assess model stability, 5-fold stratified cross-validation was employed. The dataset was partitioned into five equal folds with stratification ensuring proportional class representation in each fold. Each fold served as the validation set once while the remaining four folds comprised the training set. Performance metrics were aggregated across all folds.
3.5.5. Training Infrastructure
Model training was conducted using TensorFlow 2.20.0 on an Intel Core processor without GPU acceleration. Total training time for 5-fold cross-validation was 5 hours 27 minutes.
3.6. Evaluation Metrics
Model performance was evaluated using standard classification metrics:
- Accuracy: Overall proportion of correct predictions
- Sensitivity (Recall): True positive rate—ability to correctly identify snow leopard images
- Specificity: True negative rate—ability to correctly identify non-snow leopard images
- Precision: Positive predictive value
- F1 Score: Harmonic mean of precision and recall
- AUC-ROC: Area under the Receiver Operating Characteristic curve
- Average Precision (AP): Area under the Precision-Recall curve
For conservation applications, sensitivity was prioritized over specificity, as failing to detect a snow leopard presence (false negative) carries greater consequence than incorrectly flagging an image for review (false positive).
4. Results
4.1. Training Dynamics
The model demonstrated consistent convergence across all five cross-validation folds. Figure 1 presents the training and validation curves for the best-performing fold.
Both training and validation loss decreased monotonically throughout training, with no divergence indicating overfitting. Notably, validation accuracy consistently exceeded training accuracy—an expected result given that aggressive data augmentation increases training difficulty while validation data undergoes only standard preprocessing.
Figure 2 presents the learning dynamics analysis across all folds.
The overfitting analysis (Figure 3) confirms that the train-validation gap remained small and stable across all metrics and folds, indicating appropriate model complexity and regularization.
4.2. Cross-Validation Results
Table 5 presents the aggregated performance metrics across all five cross-validation folds.
The model achieved exceptional sensitivity of 99.9% (±0.2%), missing only 1 snow leopard image out of 916 across all validation folds. This performance characteristic is critical for conservation applications where detection completeness is paramount.
Figure 4 presents the per-fold performance breakdown.
Figure 5 presents the training curves across all folds, demonstrating consistent learning behavior.
4.3. Aggregated Confusion Matrix
Figure 6 presents the confusion matrix aggregated across all cross-validation folds.
Table 6 presents the aggregated confusion matrix values.
4.4. ROC and Precision-Recall Analysis
Figure 7 presents the Receiver Operating Characteristic (ROC) curve and Precision-Recall curve.
The AUC-ROC of 0.9725 indicates excellent discriminative capability—the model effectively separates snow leopard images from non-target images across the full range of decision thresholds. The Average Precision of 0.9288 confirms strong performance even under the class-imbalanced evaluation regime.
4.5. Prediction Score Distribution
Figure 8 presents the distribution of prediction scores for both classes.
The bimodal distribution demonstrates that the model makes highly confident predictions for both classes. Snow leopard images predominantly receive scores above 0.9, while the majority of negative images receive scores below 0.1. The overlap region between 0.9 and 1.0 represents the primary source of false positives.
4.6. Threshold Optimization Analysis
Figure 9 presents the relationship between the decision threshold and performance metrics.
Table 7 presents the performance at different decision thresholds.
The analysis reveals that the default threshold of 0.5 maximizes sensitivity at the cost of specificity. Increasing the threshold to 0.95 substantially improves specificity (from 64% to 88%) and overall accuracy (from 76% to 91%) while maintaining sensitivity above 99%.
5. Discussion
5.1. Interpretation of Results
The proposed system demonstrated exceptional sensitivity (99.9%) in detecting snow leopard presence, missing only a single image across 916 positive samples evaluated through 5-fold cross-validation. This performance characteristic aligns with conservation requirements where failing to detect a snow leopard (false negative) carries substantially greater consequences than flagging additional images for human review (false positive).
The high AUC-ROC (97.25%) and Average Precision (92.88%) indicate that the model effectively learns discriminative features for snow leopard identification. The bimodal prediction score distribution (Figure 8) demonstrates confident predictions for both classes, suggesting robust feature extraction rather than uncertain boundary placement.
The observed specificity limitation at the default threshold (64. 0%) results from the model’s conservative detection behavior—prioritizing recall over precision. Analysis of false positive images revealed several contributing factors:
- Cryptic background patterns: Snow-covered rocky terrain creates visual textures similar to snow leopard pelage patterns
- Partial occlusions: Images where rocks or vegetation create edge patterns resembling animal contours
- Similar-sized sympatric species: Ibex and wolves in certain poses triggered false detections
5.2. Threshold Selection for Deployment
The threshold optimization analysis (Figure 9) provides practitioners with flexibility to calibrate system behavior according to operational requirements:
High-sensitivity mode (threshold = 0.5): Suitable for initial screening where detection completeness is paramount. Accepts higher false positive rates in exchange for near-perfect detection (99.9% sensitivity).
Balanced mode (threshold = 0.7–0.9): Appropriate for workflows where moderate false positive reduction is desired while maintaining very high detection rates (>99% sensitivity).
High-specificity mode (threshold = 0.95): Optimal for reducing manual review burden while accepting minimal detection loss (∼1%). Achieves 88% specificity and 91% overall accuracy.
We recommend deploying with adjustable thresholds, allowing users to select operating points based on their specific requirements and available review capacity.
5.3. Comparison with Prior Work
The sensitivity achieved (99.9%) substantially exceeds that reported by [10] for snow leopard detection in Nepal (89%), although direct comparison is limited by differences in dataset composition and evaluation protocols. Our AUC-ROC (97.25%) compares favorably with general wildlife classifiers reported in the literature.
Compared to the AI-assisted approach evaluated by [2], which required human verification to achieve acceptable accuracy, our system demonstrates potential for autonomous first-pass screening, with human review reserved for positive detections or cases of threshold-boundary.
5.4. Practical Implications
Despite specificity limitations at default thresholds, the system offers substantial practical utility for conservation workflows:
- Screening efficiency: The model can process thousands of images rapidly, flagging potential snow leopard detections for expert review
- Reduced missed detections: The 99.9% sensitivity ensures virtually no snow leopard images are incorrectly discarded
- Flexible operation: Threshold adjustment enables calibration for different use cases
- Accessible deployment: The web application interface requires no technical expertise
For a typical camera trap survey generating 50,000 images with 0.5% containing snow leopards (250 images), the system at threshold 0.5 would:
- Correctly identify ∼250 of 250 snow leopard images
- Flag approximately 17,888 false positives for review
- Reduce manual review from 50,000 to ∼18,138 images (64% reduction)
At threshold 0.95:
- Correctly identify ∼248 of 250 snow leopard images (missing ∼2)
- Flag approximately 5,970 false positives
- Reduce manual review to ∼6,218 images (88% reduction)
5.5. Significance for Kyrgyzstan
This work represents the first implementation of automated snow leopard detection technology within the Kyrgyz Republic. The deployment of a functional web application establishes an infrastructure for technology-assisted conservation that was previously unavailable in the region. This contribution is particularly significant given:
- The importance of the country as the main snow leopard habitat (8–10% of the global population)
- Limited technological resources available to local conservation organizations
- The urgent need to scale monitoring efforts in response to climate change and anthropogenic pressures
5.6. Limitations
Several limitations should be acknowledged:
- Dataset constraints: The limited availability of verified wild camera trap images necessitated supplementation with controlled-environment captures. While we implemented strict protocols to prevent data leakage between training and evaluation sets, the model’s generalization to novel wild individuals requires continued validation.
- Individual diversity: A substantial portion of positive training samples were derived from two captive individuals. Although data augmentation was employed to increase variability, the model’s ability to generalize across the full phenotypic diversity of wild snow leopard populations warrants further investigation.
- Geographic specificity: Training data was drawn primarily from Kyrgyz contexts; performance in other range countries may differ due to variation in camera trap equipment, environmental conditions, and background characteristics.
- Specificity-sensitivity trade-off: The current model prioritizes sensitivity; applications requiring higher precision may need threshold adjustment or architectural modifications.
- Temporal validation: Long-term performance stability across seasonal conditions and equipment variations requires ongoing monitoring.
5.7. Future Directions
Several avenues for future development are identified:
- Dataset expansion: Continued collection of verified camera trap images from diverse locations will enable model refinement and improved generalization
- Multi-species classification: Extending the system to identify prey species (ibex, argali) and potential competitors (wolves) would enhance ecological utility
- Individual identification: Integration with pattern-matching algorithms (e.g., Whiskerbook) could enable automated individual identification for population studies
- Active learning: Implementing human-in-the-loop workflows where uncertain predictions trigger expert review could accelerate dataset growth while maintaining quality
- Edge deployment: Optimizing the model for deployment on camera trap hardware could enable real-time detection and selective image transmission, reducing data storage and transfer requirements
- Regional validation: Systematic testing across snow leopard range countries would establish generalizability and identify context-specific adaptations
6. Conclusion
This study presented the first automated snow leopard detection system developed for deployment in the Kyrgyz Republic. The proposed system, which combined the MobileNetV2 architecture with squeeze-and-excitation attention mechanisms and trained using focal loss, achieved exceptional detection performance validated through rigorous 5-fold cross-validation.
Key findings include:
- AUC-ROC of 97.25% demonstrating excellent discriminative capacity
- Sensitivity of 99.9% missing only 1 of 916 snow leopard images
- Flexible threshold optimization enabling specificity adjustment from 64% to 88% while maintaining >99% sensitivity
- Practical deployment as an accessible web application
The high sensitivity of the system makes it suitable for first-pass screening of camera trap imagery, substantially reducing manual review burden while ensuring minimal missed detections. The threshold optimization capability allows practitioners to calibrate the operation according to specific requirements.
This work establishes a foundational infrastructure for technology-assisted snow leopard conservation in Central Asia. The methodology and findings contribute to the growing body of evidence supporting deep learning applications in biodiversity monitoring, while the practical deployment addresses an immediate need identified by the conservation community.
Future work will focus on expanding the training dataset through continued collaboration with conservation partners, extending functionality to multi-species classification, and validating performance across the broader snow leopard range.
References
- Beery, Sara, Grant Van Horn, and Pietro Perona. 2018. Recognition in terra incognita. In Proceedings of the European Conference on Computer Vision (ECCV), pp. 456–473.
- Bohnett, Eve, Mark Holton, Mohammad Sadegh Norouzzadeh, Sharon Rosen, Koustubh Sharma, Örjan Johansson, Symon and"; Oduor, et al. 2022. Human expertise combined with artificial intelligence improves performance of snow leopard camera trap studies. Global Ecology and Conservation 41, e02350. [CrossRef]
- Buda, Mateusz, Atsuto Maki, and Maciej A. Mazurowski. 2018. A systematic study of the class imbalance problem in convolutional neural networks. Neural Networks 106, 249–259. [CrossRef]
- Chen, Yue, Jing Li, Xiaoming Zhang, and Kun Wang. 2021. MobileNet-based wildlife classification for edge computing applications. Ecological Informatics 64, 101376. [CrossRef]
- Cui, Yin, Menglin Jia, Tsung-Yi Lin, Yang Song, and Serge Belongie. 2019. Class-balanced loss based on effective number of samples. In Proceedings of the IEEE Conference on Computer Vision and Pattern Recognition, pp. 9268–9277. [CrossRef]
- Cunha, Fabrício, Jorge Chicaiza, and Eulanda M. Dos Santos. 2021. Addressing class imbalance in camera trap image classification. Ecological Informatics 64, 101367. [CrossRef]
- Deng, Jia, Wei Dong, Richard Socher, Li-Jia Li, Kai Li, and Li Fei-Fei. 2009. ImageNet: A large-scale hierarchical image database. In Proceedings of the IEEE Conference on Computer Vision and Pattern Recognition, pp. 248–255. [CrossRef]
- Howard, Andrew G., Menglong Zhu, Bo Chen, Dmitry Kalenichenko, Weijun Wang, Tobias Weyand, Marco Andreetto, and Hartwig Adam. 2017. MobileNets: Efficient convolutional neural networks for mobile vision applications. arXiv preprint arXiv:1704.04861.
- Hu, Jie, Li Shen, and Gang Sun. 2018. Squeeze-and-excitation networks. In Proceedings of the IEEE Conference on Computer Vision and Pattern Recognition, pp. 7132–7141. [CrossRef]
- Khanal, Saroj, Shant Sharma, and Tej Bahadur Thapa. 2020. Applying deep learning for snow leopard detection from camera trap images in nepal. Conservation Science and Practice 2(11), e289. [CrossRef]
- Lin, Tsung-Yi, Priya Goyal, Ross Girshick, Kaiming He, and Piotr Dollár. 2017. Focal loss for dense object detection. In Proceedings of the IEEE International Conference on Computer Vision, pp. 2980–2988. [CrossRef]
- McCarthy, Tom, David Mallon, Rodney Jackson, Peter Zahler, and Kyle McCarthy. 2017. Panthera uncia. The IUCN Red List of Threatened Species 2017. e. T22732A50664030. [CrossRef]
- Norouzzadeh, Mohammad Sadegh, Anh Nguyen, Margaret Kosmala, Alexandra Swanson, Meredith S. Palmer, Craig Packer, and Jeff Clune. 2018. Automatically identifying, counting, and describing wild animals in camera-trap images with deep learning. Proceedings of the National Academy of Sciences 115(25), E5716–E5725. [CrossRef]
- Sandler, Mark, Andrew Howard, Menglong Zhu, Andrey Zhmoginov, and Liang-Chieh Chen. 2018. MobileNetV2: Inverted residuals and linear bottlenecks. In Proceedings of the IEEE Conference on Computer Vision and Pattern Recognition, pp. 4510–4520. [CrossRef]
- Schneider, Stefan, Graham W. Taylor, and Stefan C. Kremer. 2020. Deep learning object detection methods for ecological camera trap data. In Proceedings of the 15th Conference on Computer and Robot Vision, pp. 321–328. [CrossRef]
- Sharma, Koustubh, Girish A. Punjabi, Rodney Jackson, and Charudutt Mishra. 2023. Camera trapping for snow leopard population assessment: Advances and challenges. Oryx 57(2), 145–157. [CrossRef]
- Snow Leopard Trust. 2022. State of the snow leopard report: Kyrgyzstan. Technical report, Snow Leopard Trust, Seattle, WA.
- Tabak, Michael A., Mohammad S. Norouzzadeh, David W. Wolfson, Steven J. Sweeney, Kurt C. VerCauteren, Nathan P. Snow, Joseph M. Halseth, Paul A. Di Salvo, Jesse S. Lewis, Michael D. White, Ben Teton, James C. Beasley, Peter E. Schlichting, Raoul K. Boughton, Bethany Wight, Eric S. Newkirk, Jacob S. Ivan, Eric A. Odell, Ryan K. Brook, Paul M. Merkle, Gary W. Witmer, and Ryan S. Miller. 2019. Machine learning to classify animal species in camera trap images: Applications in ecology. Methods in Ecology and Evolution 10(4), 585–590. [CrossRef]
- Tan, Ming, Xiaoyu Chen, Yue Liu, and Jie Zhang. 2022. Animal detection and classification from camera trap images using different mainstream object detection architectures. Animals 12(15), 1976. [CrossRef]
- Tan, Mingxing and Quoc V. Le. 2019. EfficientNet: Rethinking model scaling for convolutional neural networks. In International Conference on Machine Learning, pp. 6105–6114.
- Wang, Fei, Mengqing Jiang, Chen Qian, Shuo Yang, Cheng Li, Honggang Zhang, Xiaogang Wang, and Xiaoou Tang. 2017. Residual attention network for image classification. In Proceedings of the IEEE Conference on Computer Vision and Pattern Recognition, pp. 3156–3164. [CrossRef]
- Whytock, Robin C., Joeri Świeżewski, Jeanine A. Zwerts, Tadeusz Bara-Słupski, Aurélien F. Koumba Pambo, Monika Rogala, Laila Bahaa-el din, Kelly Boekee, Stephanie and"; Brittain, et al. 2021. Robust ecological analysis of camera trap data labelled by a machine learning model. Methods in Ecology and Evolution 12(6), 1080–1092. [CrossRef]
- Woo, Sanghyun, Jongchan Park, Joon-Young Lee, and In So Kweon. 2018. CBAM: Convolutional block attention module. In Proceedings of the European Conference on Computer Vision (ECCV), pp. 3–19.
- Zhang, Xiaoming, Yue Chen, and Wei Li. 2022. Attention-enhanced MobileNet for wildlife detection in camera trap imagery. IEEE Access 10, 45672–45683. [CrossRef]
- Zhu, Xiaolong, Lei Wang, and Hao Chen. 2021. Channel attention for fine-grained bird species classification. Pattern Recognition Letters 147, 85–92. [CrossRef]
Figure 1.
Training dynamics for the best-performing fold. (a) Training and validation accuracy over 50 epochs. Validation accuracy (red) consistently exceeds training accuracy (blue), indicating effective regularization through data augmentation. (b) Training and validation loss curves showing monotonic decrease without divergence, confirming absence of overfitting.
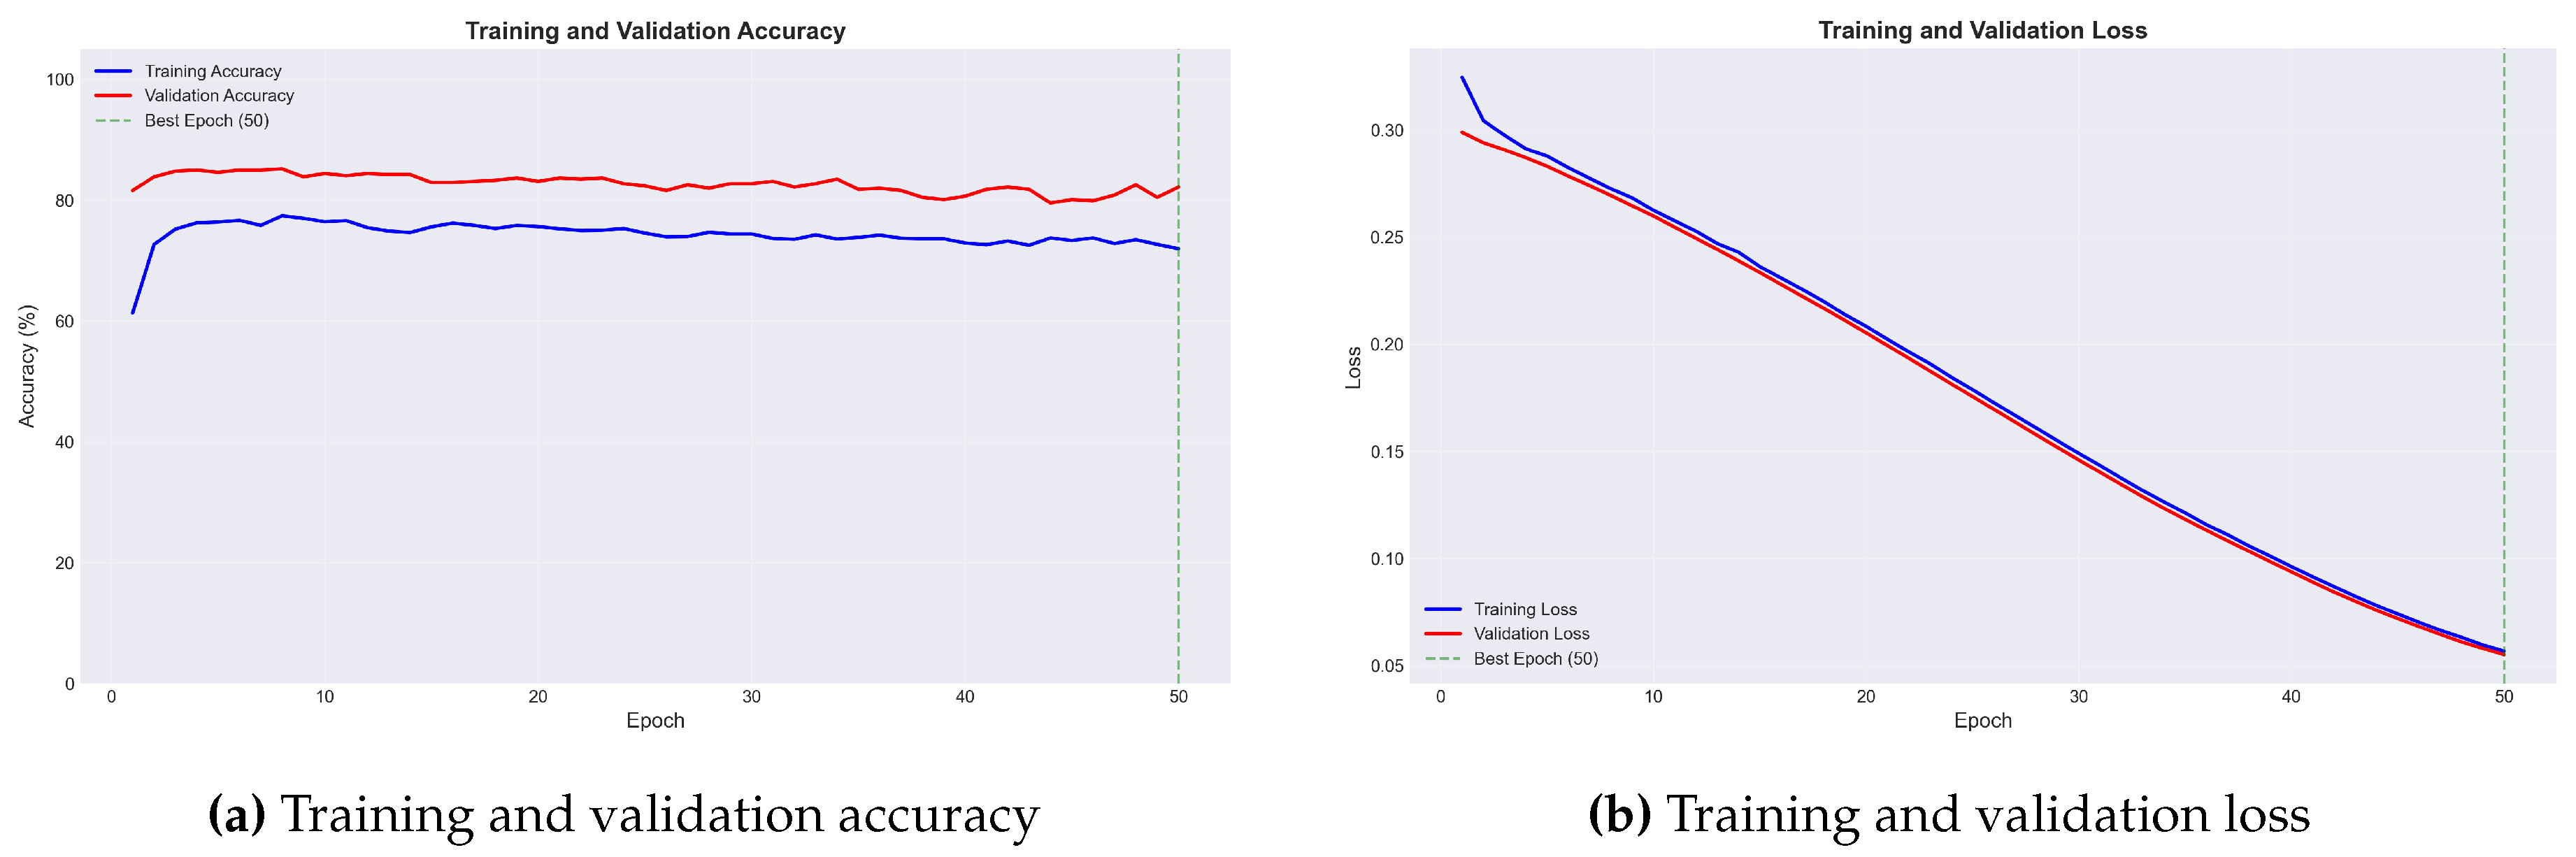
Figure 2.
Learning dynamics analysis across 5-fold cross-validation. (a) Training loss change per epoch showing consistent learning rate across folds. (b) Validation loss change demonstrating stable convergence. (c) Distribution of loss changes confirming uniform learning behavior. (d) Average validation loss with ±1 standard deviation showing low variance across folds.
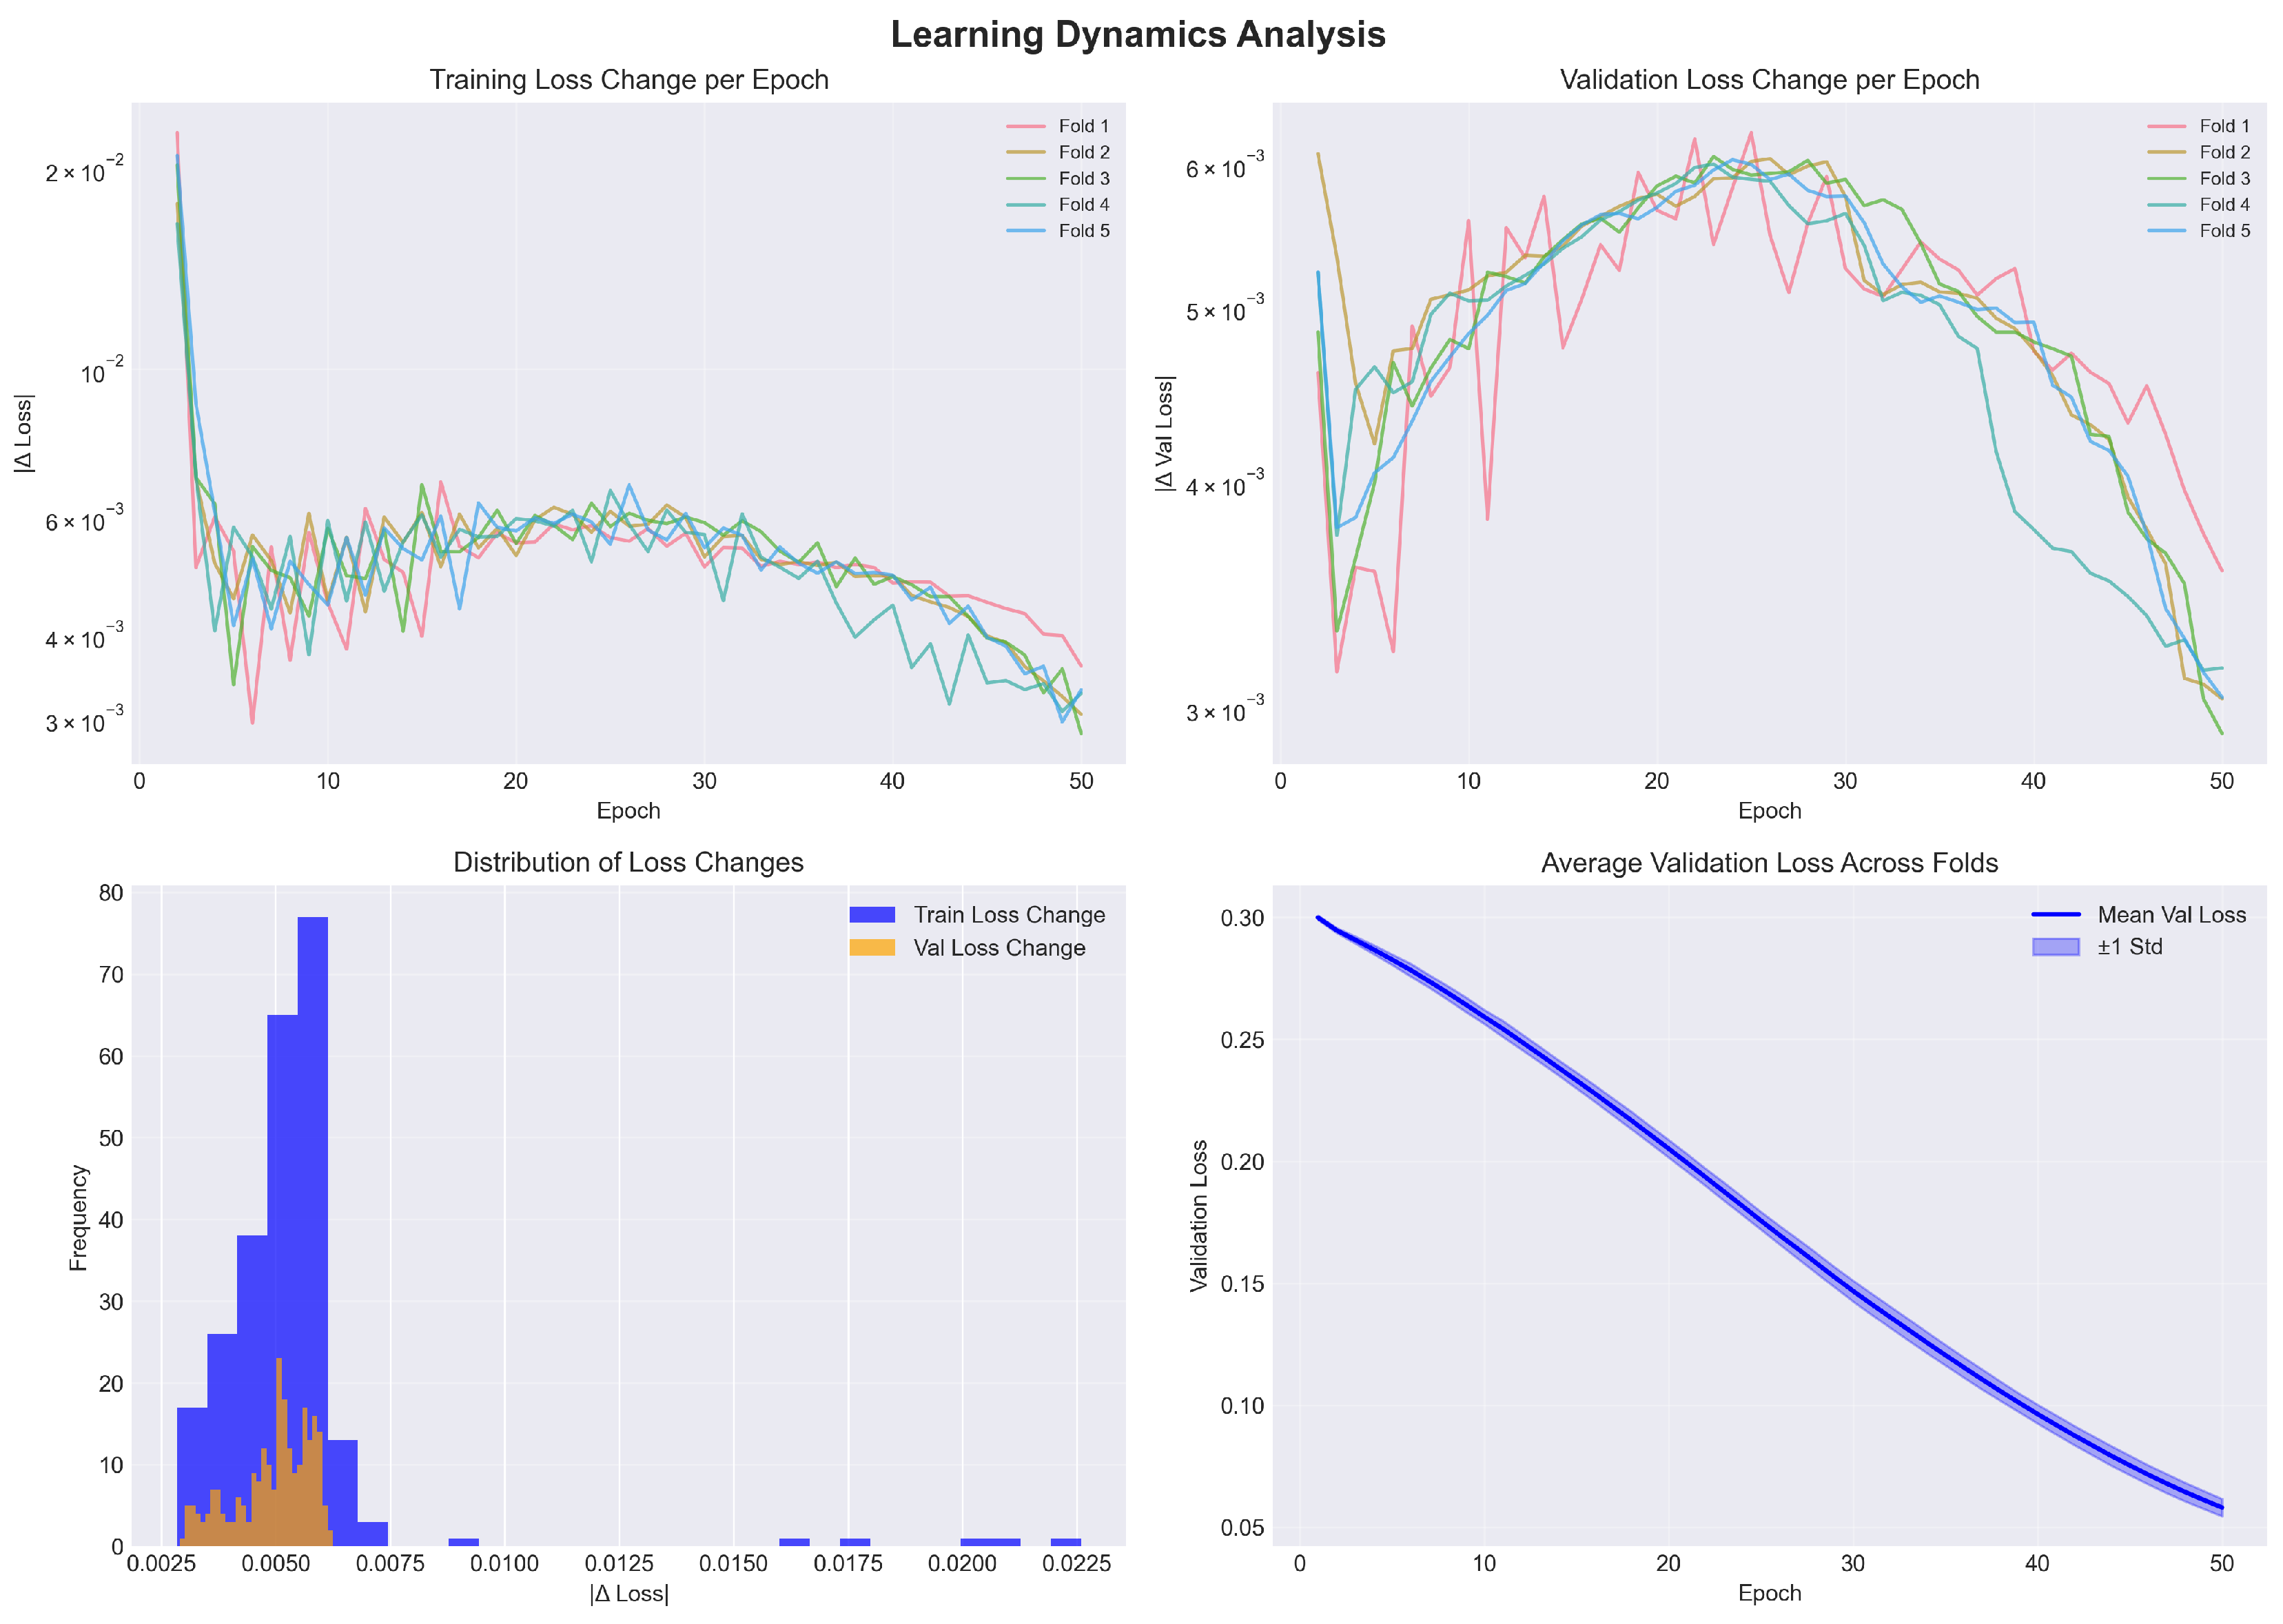
Figure 3.
Overfitting analysis showing train-validation gap across epochs for all folds. The gap approaches zero for loss and remains negative for accuracy metrics (validation > training), confirming effective regularization and absence of overfitting.
Figure 3.
Overfitting analysis showing train-validation gap across epochs for all folds. The gap approaches zero for loss and remains negative for accuracy metrics (validation > training), confirming effective regularization and absence of overfitting.
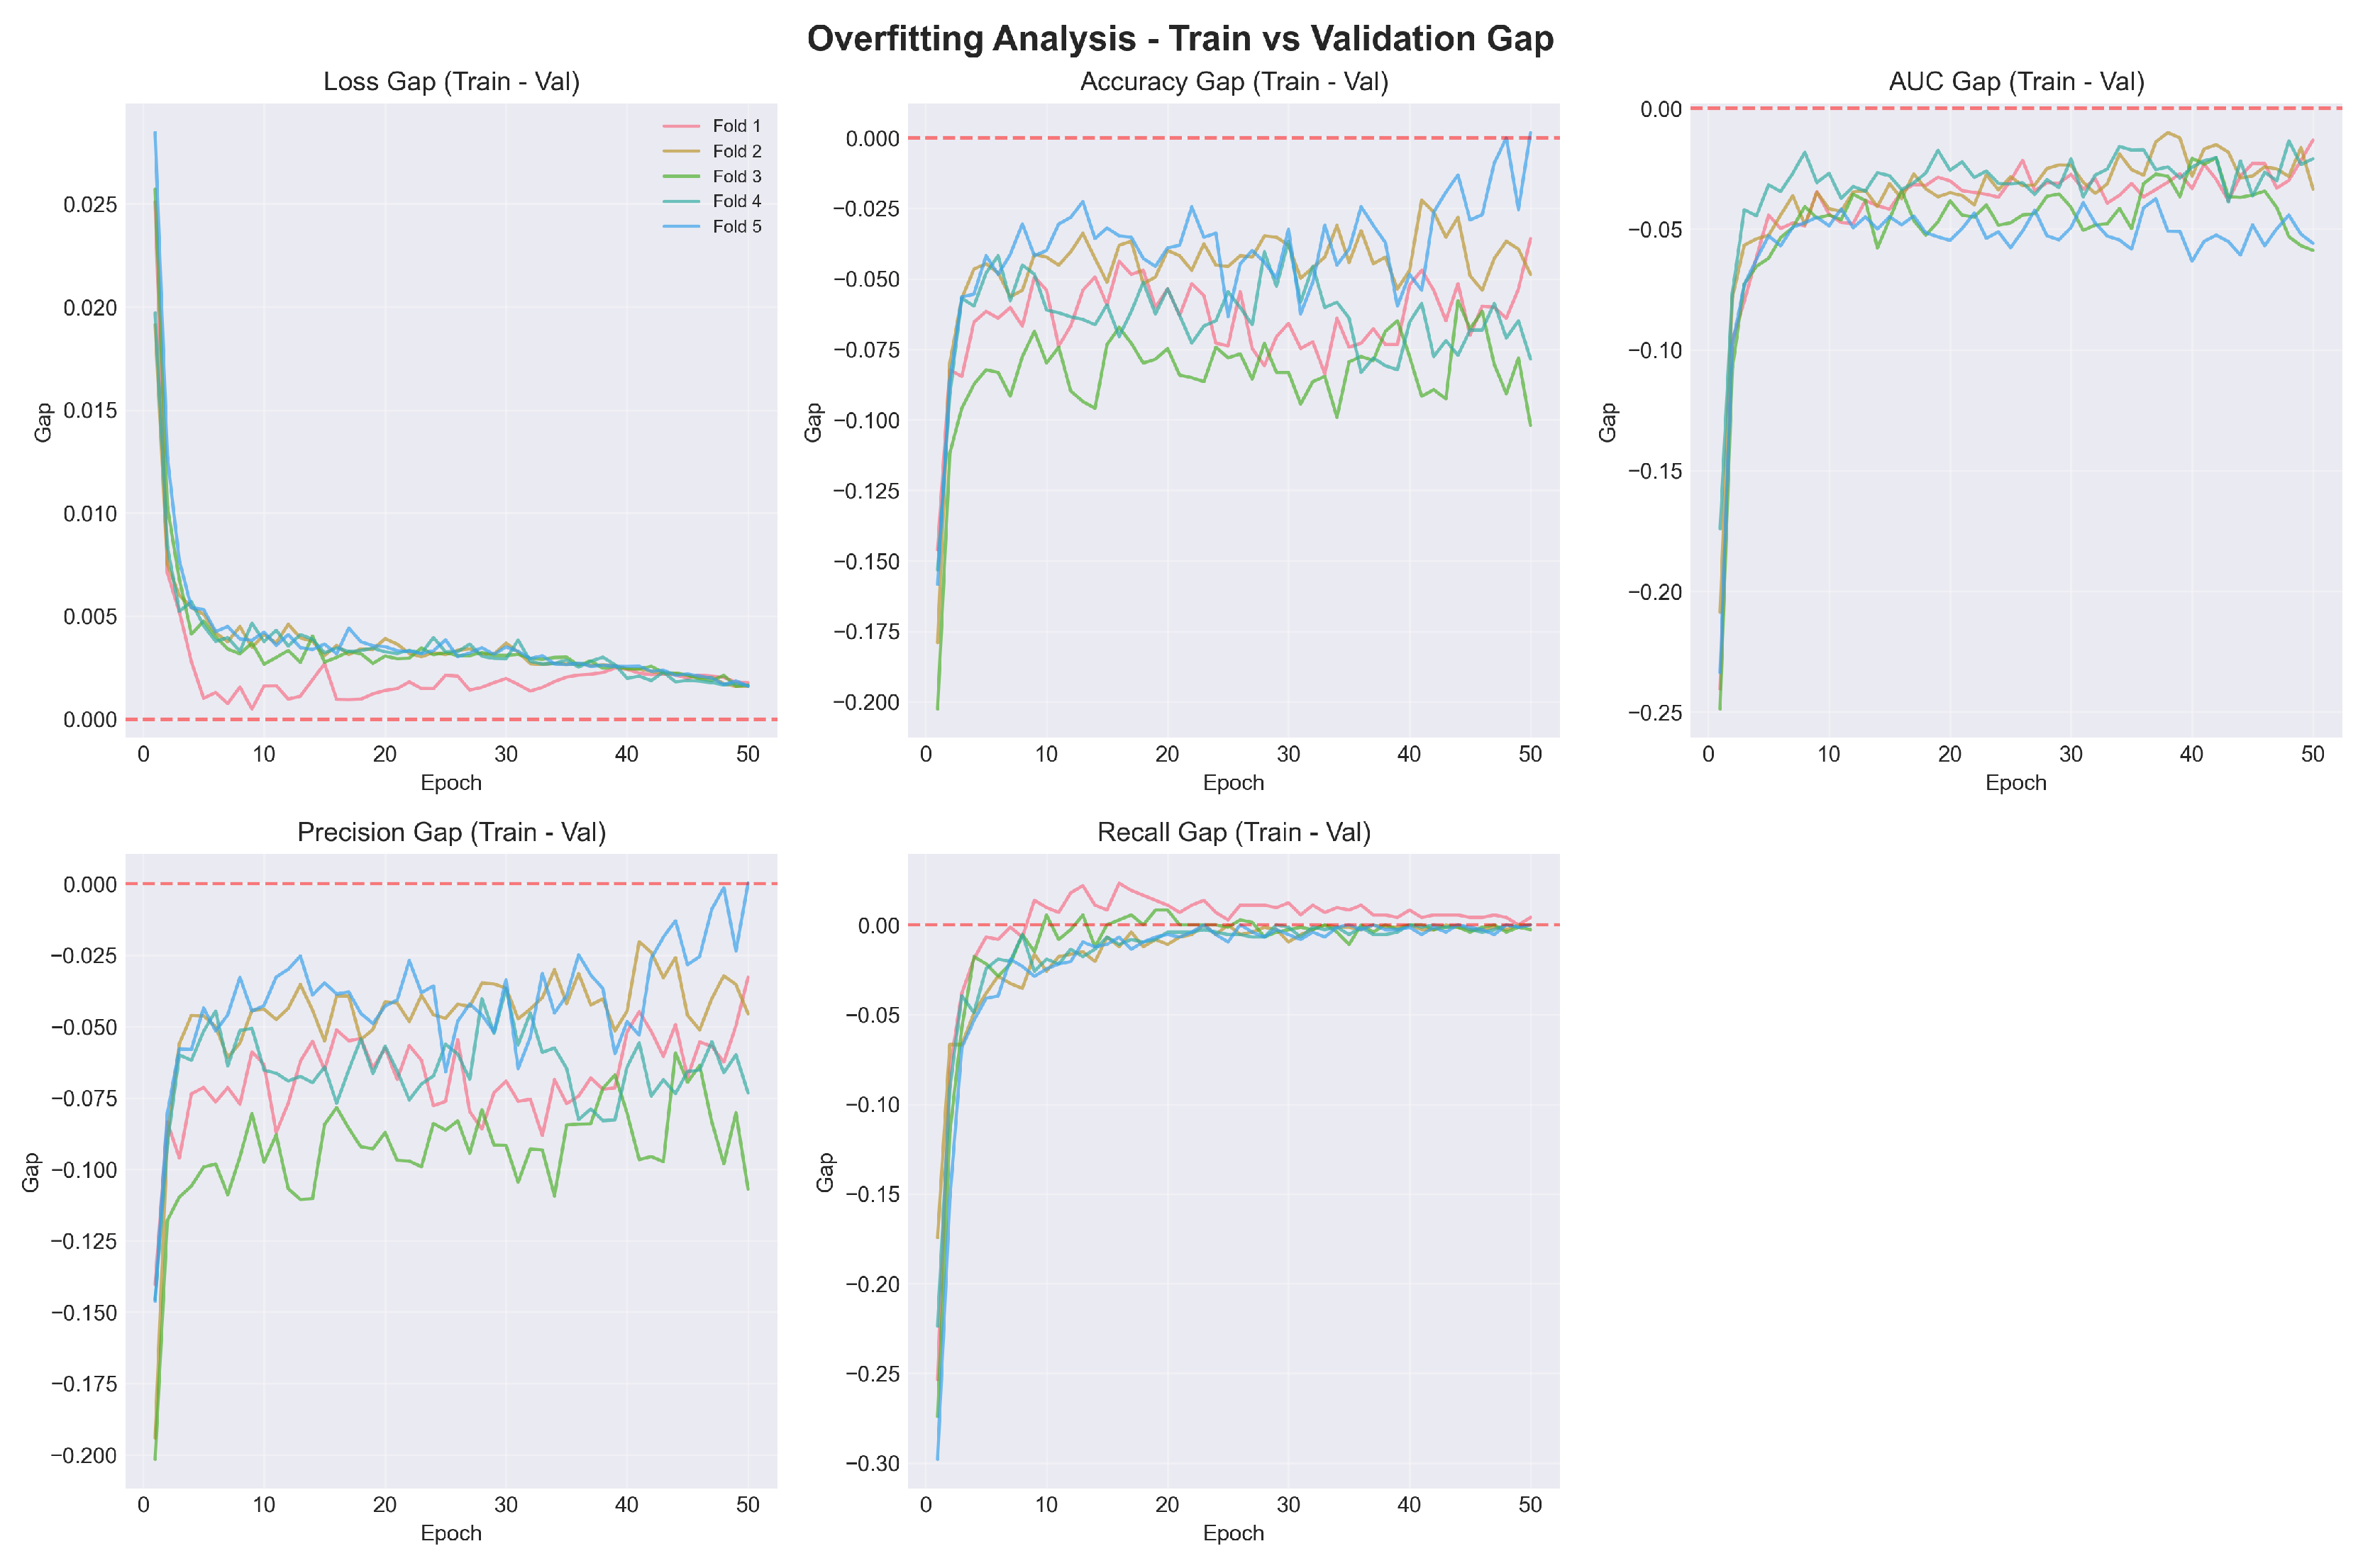
Figure 4.
Performance metrics across 5-fold cross-validation. Sensitivity remains consistently near 100% across all folds, while specificity shows moderate variation (55.5%–72.8%). Red dashed lines indicate mean values.
Figure 4.
Performance metrics across 5-fold cross-validation. Sensitivity remains consistently near 100% across all folds, while specificity shows moderate variation (55.5%–72.8%). Red dashed lines indicate mean values.
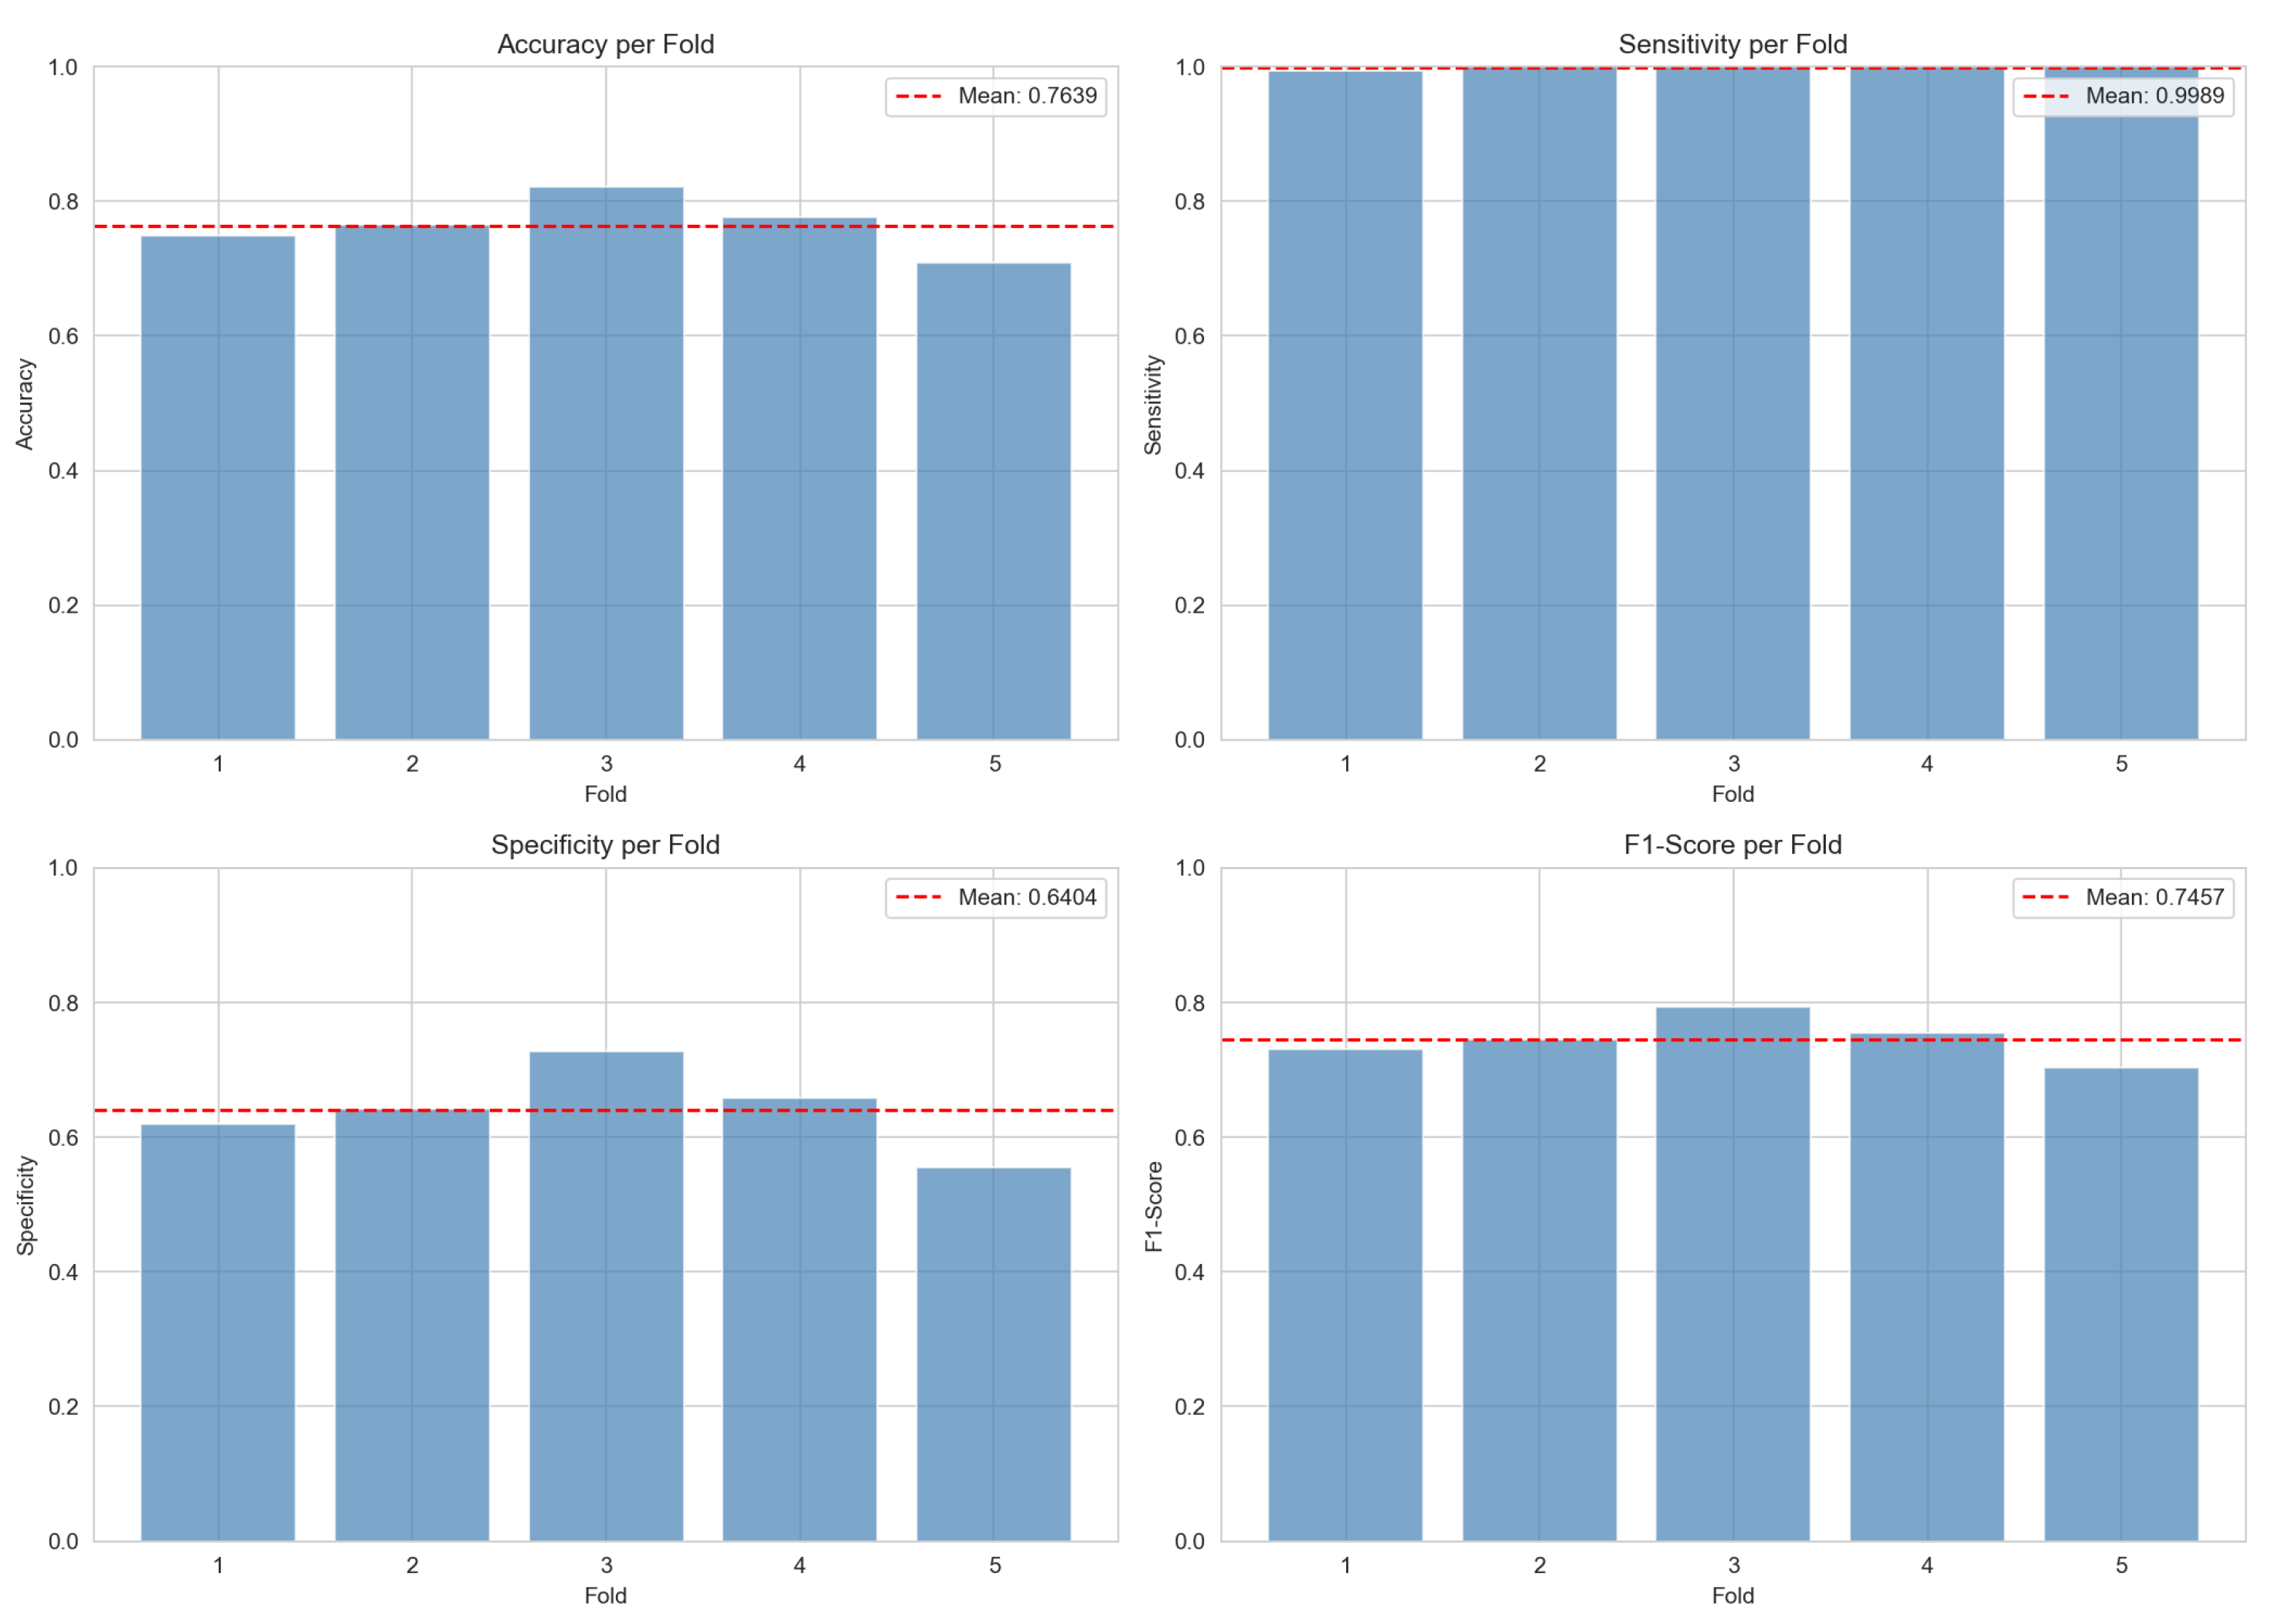
Figure 5.
Training curves across all five folds. Solid lines represent training metrics; dashed lines represent validation metrics. All folds exhibit similar convergence patterns, confirming model stability.
Figure 5.
Training curves across all five folds. Solid lines represent training metrics; dashed lines represent validation metrics. All folds exhibit similar convergence patterns, confirming model stability.
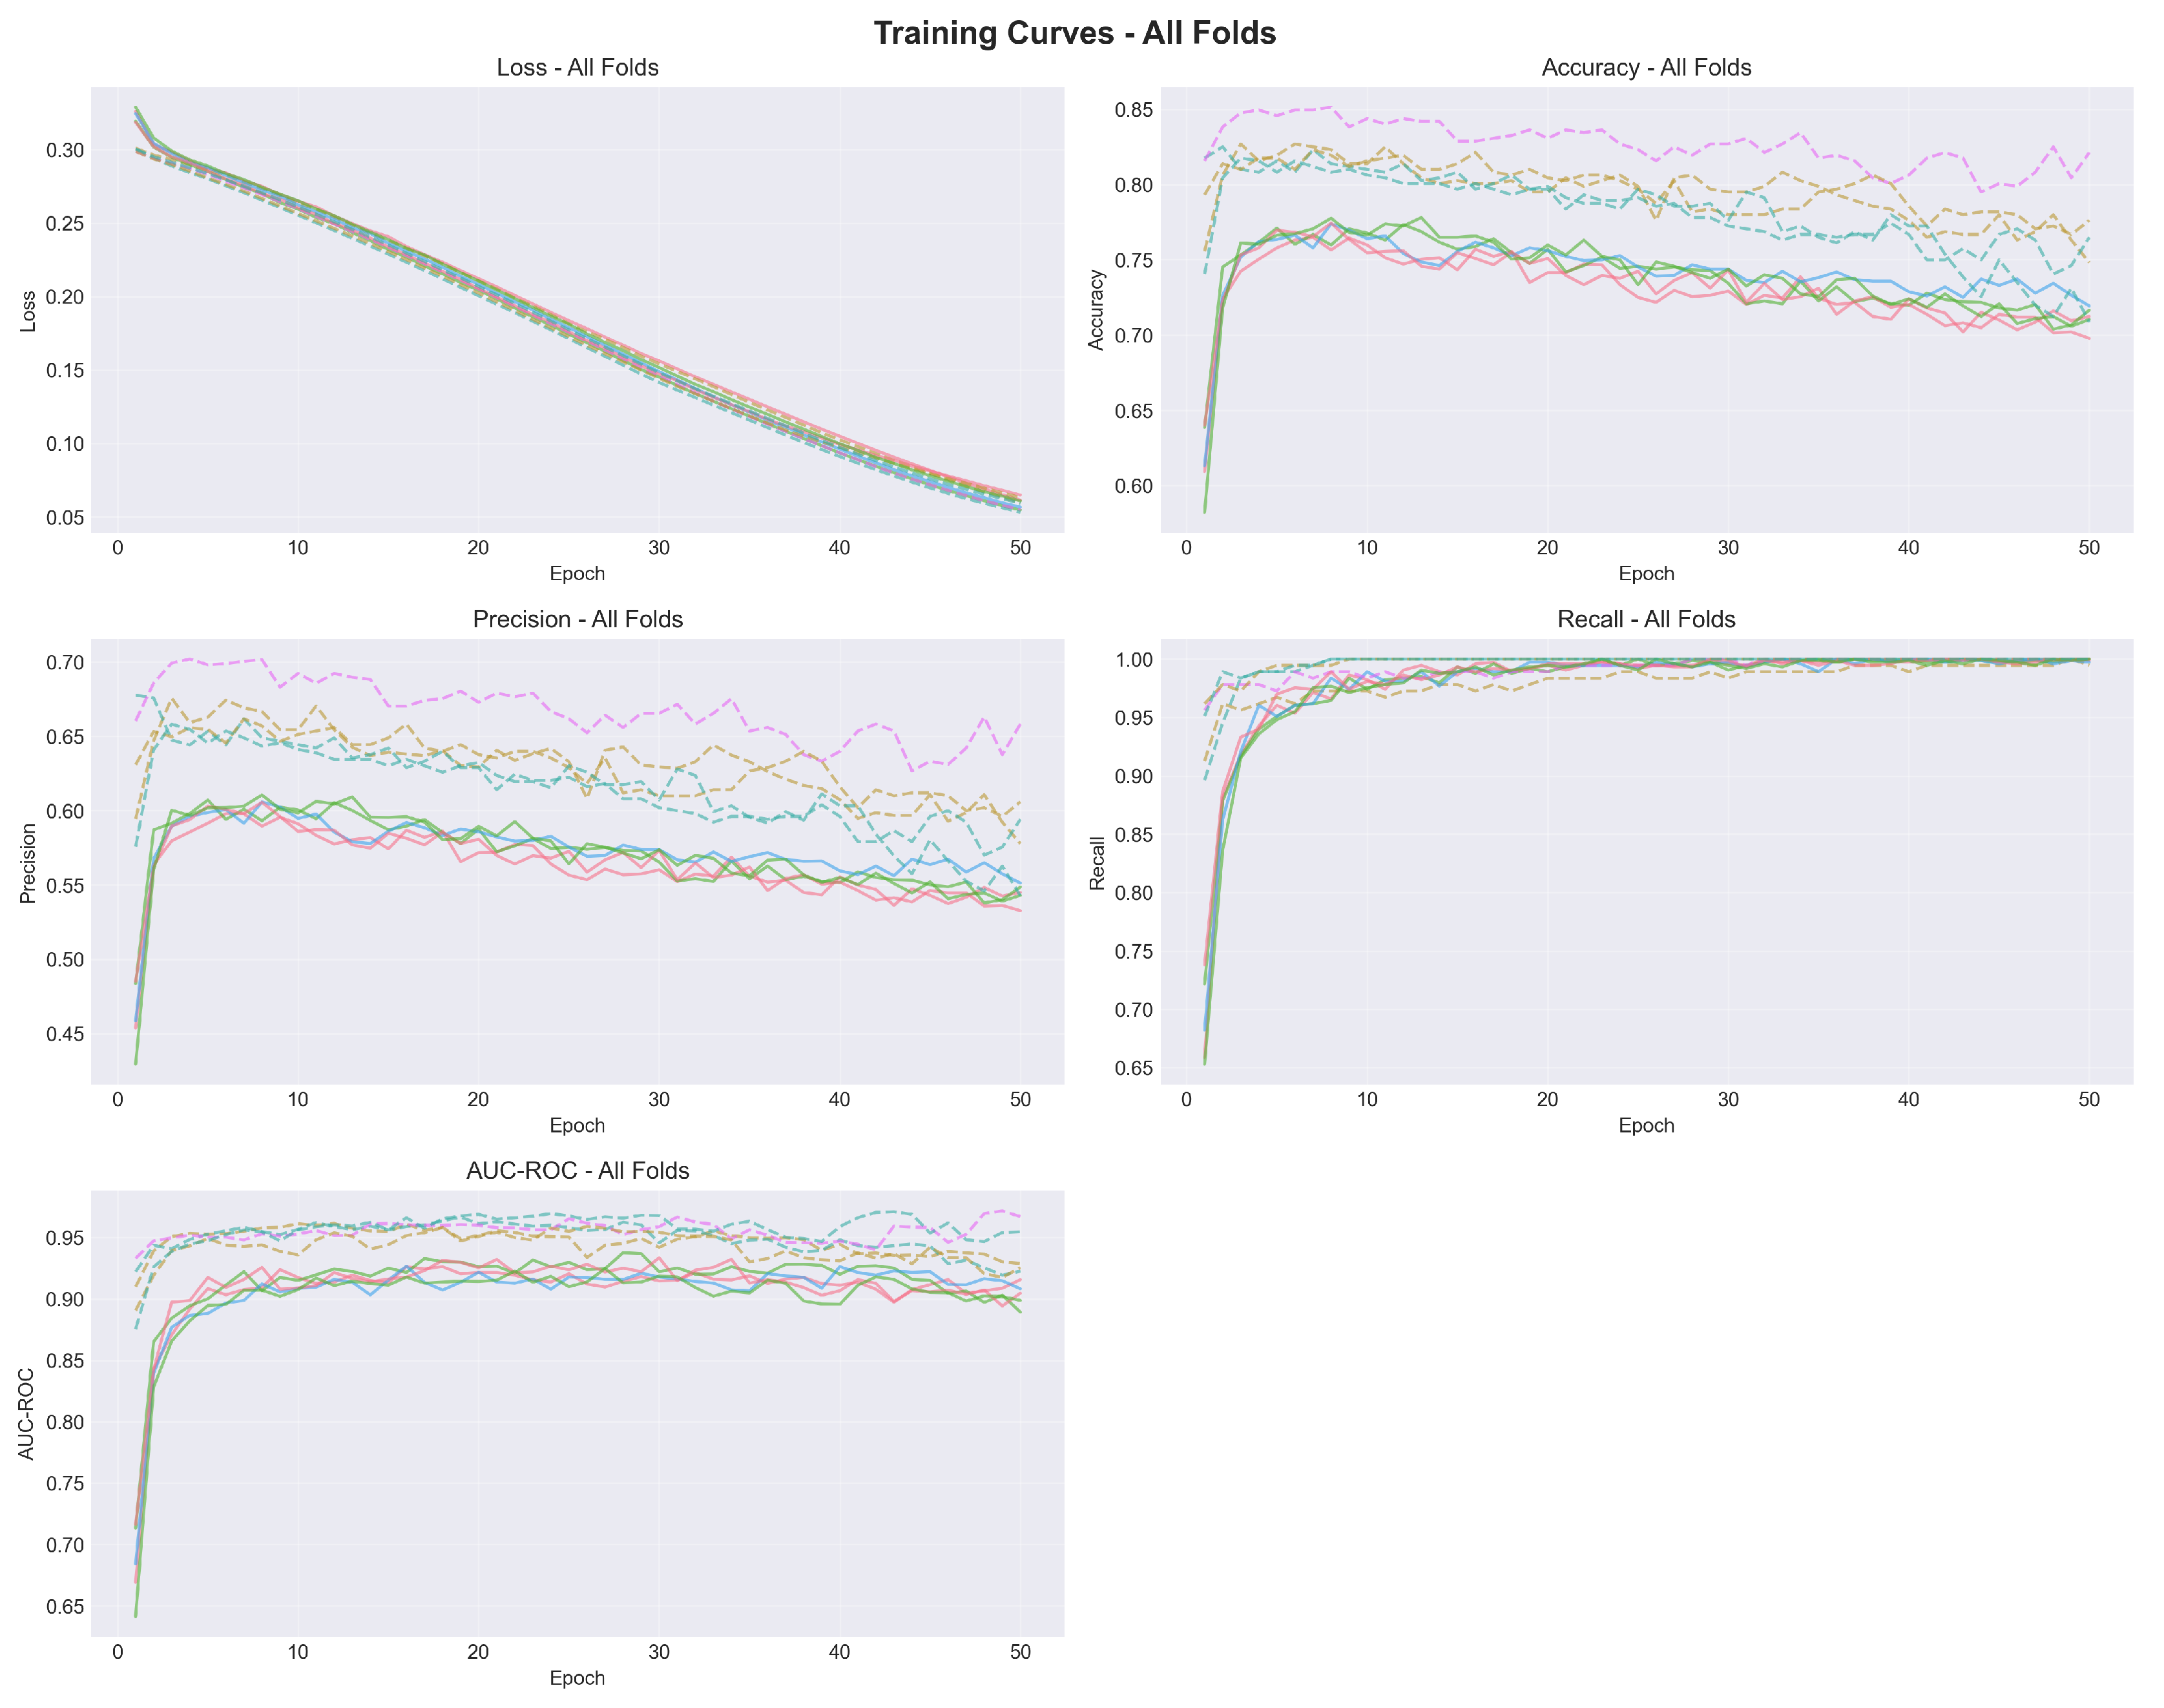
Figure 6.
Confusion matrix aggregated from 5-fold cross-validation (n=2,660). The model correctly identified 915 of 916 snow leopard images (99.9% sensitivity) while producing 627 false positives from 1,744 negative images (64.0% specificity).
Figure 6.
Confusion matrix aggregated from 5-fold cross-validation (n=2,660). The model correctly identified 915 of 916 snow leopard images (99.9% sensitivity) while producing 627 false positives from 1,744 negative images (64.0% specificity).
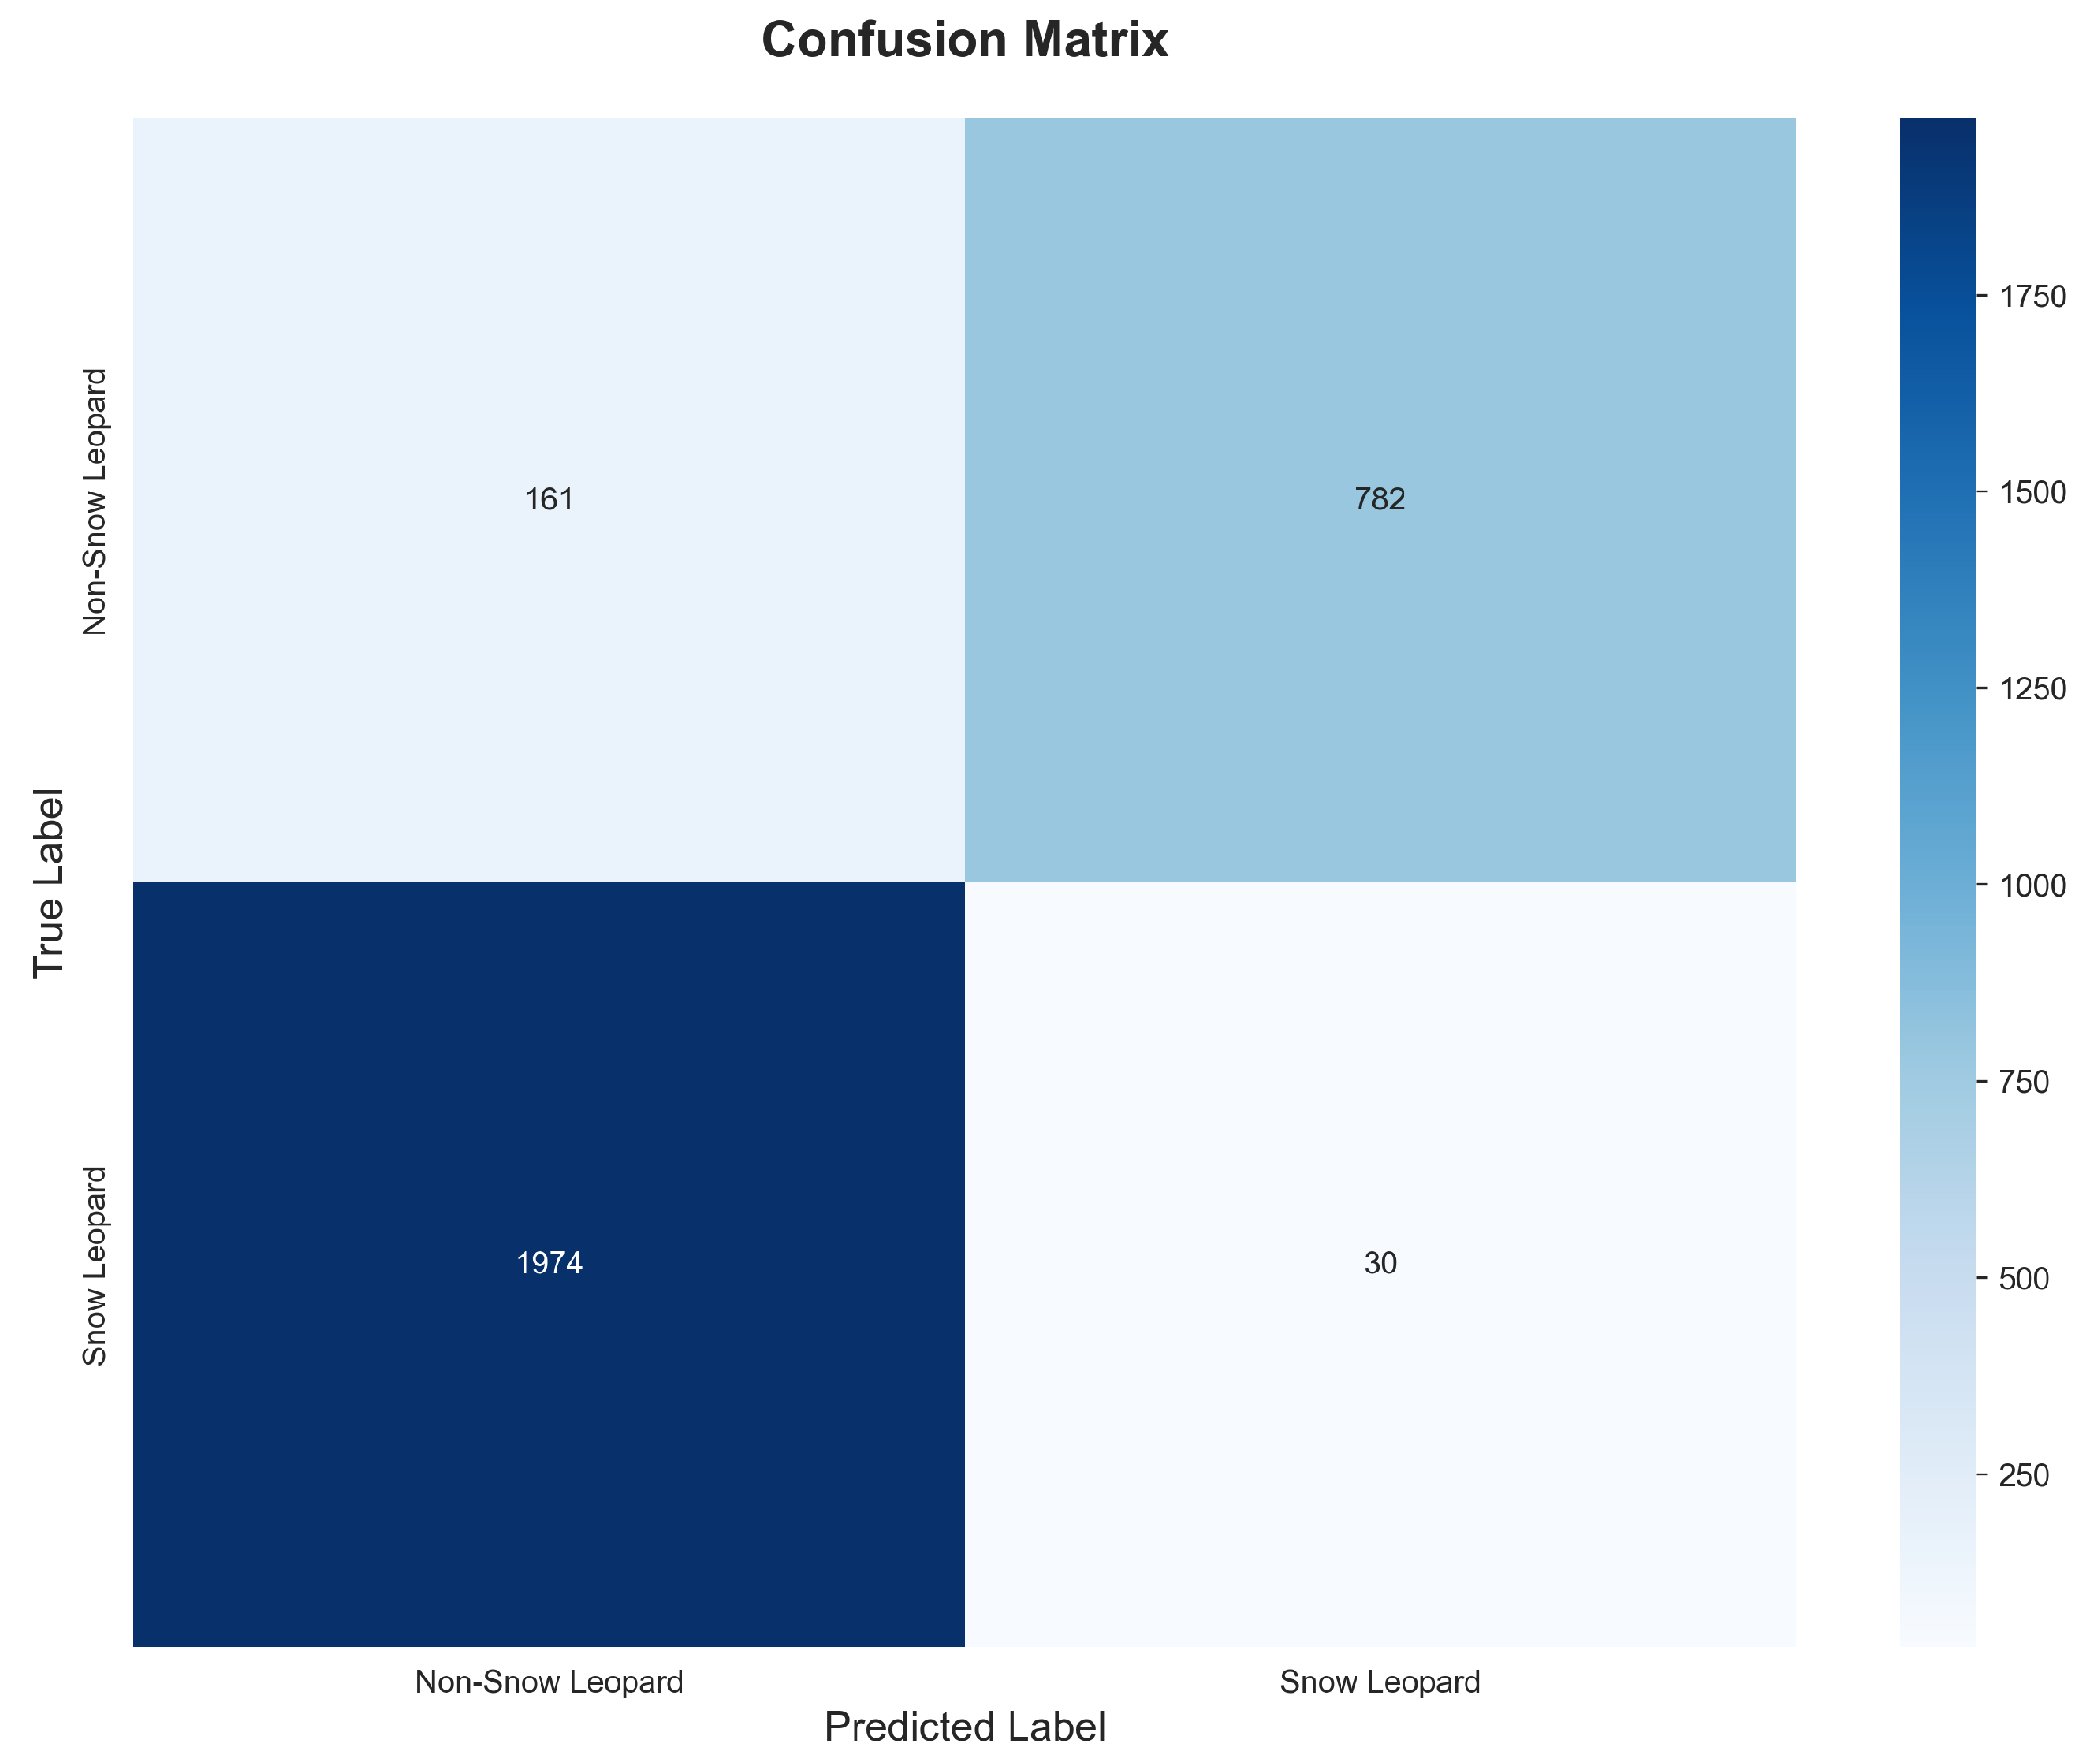
Figure 7.
(a) ROC curve demonstrating AUC of 0.9725, indicating excellent discriminative capability. The curve approaches the upper-left corner, showing high true positive rates achievable at low false positive rates. (b) Precision-Recall curve with Average Precision of 0.9288, substantially exceeding the random baseline of 0.3442.
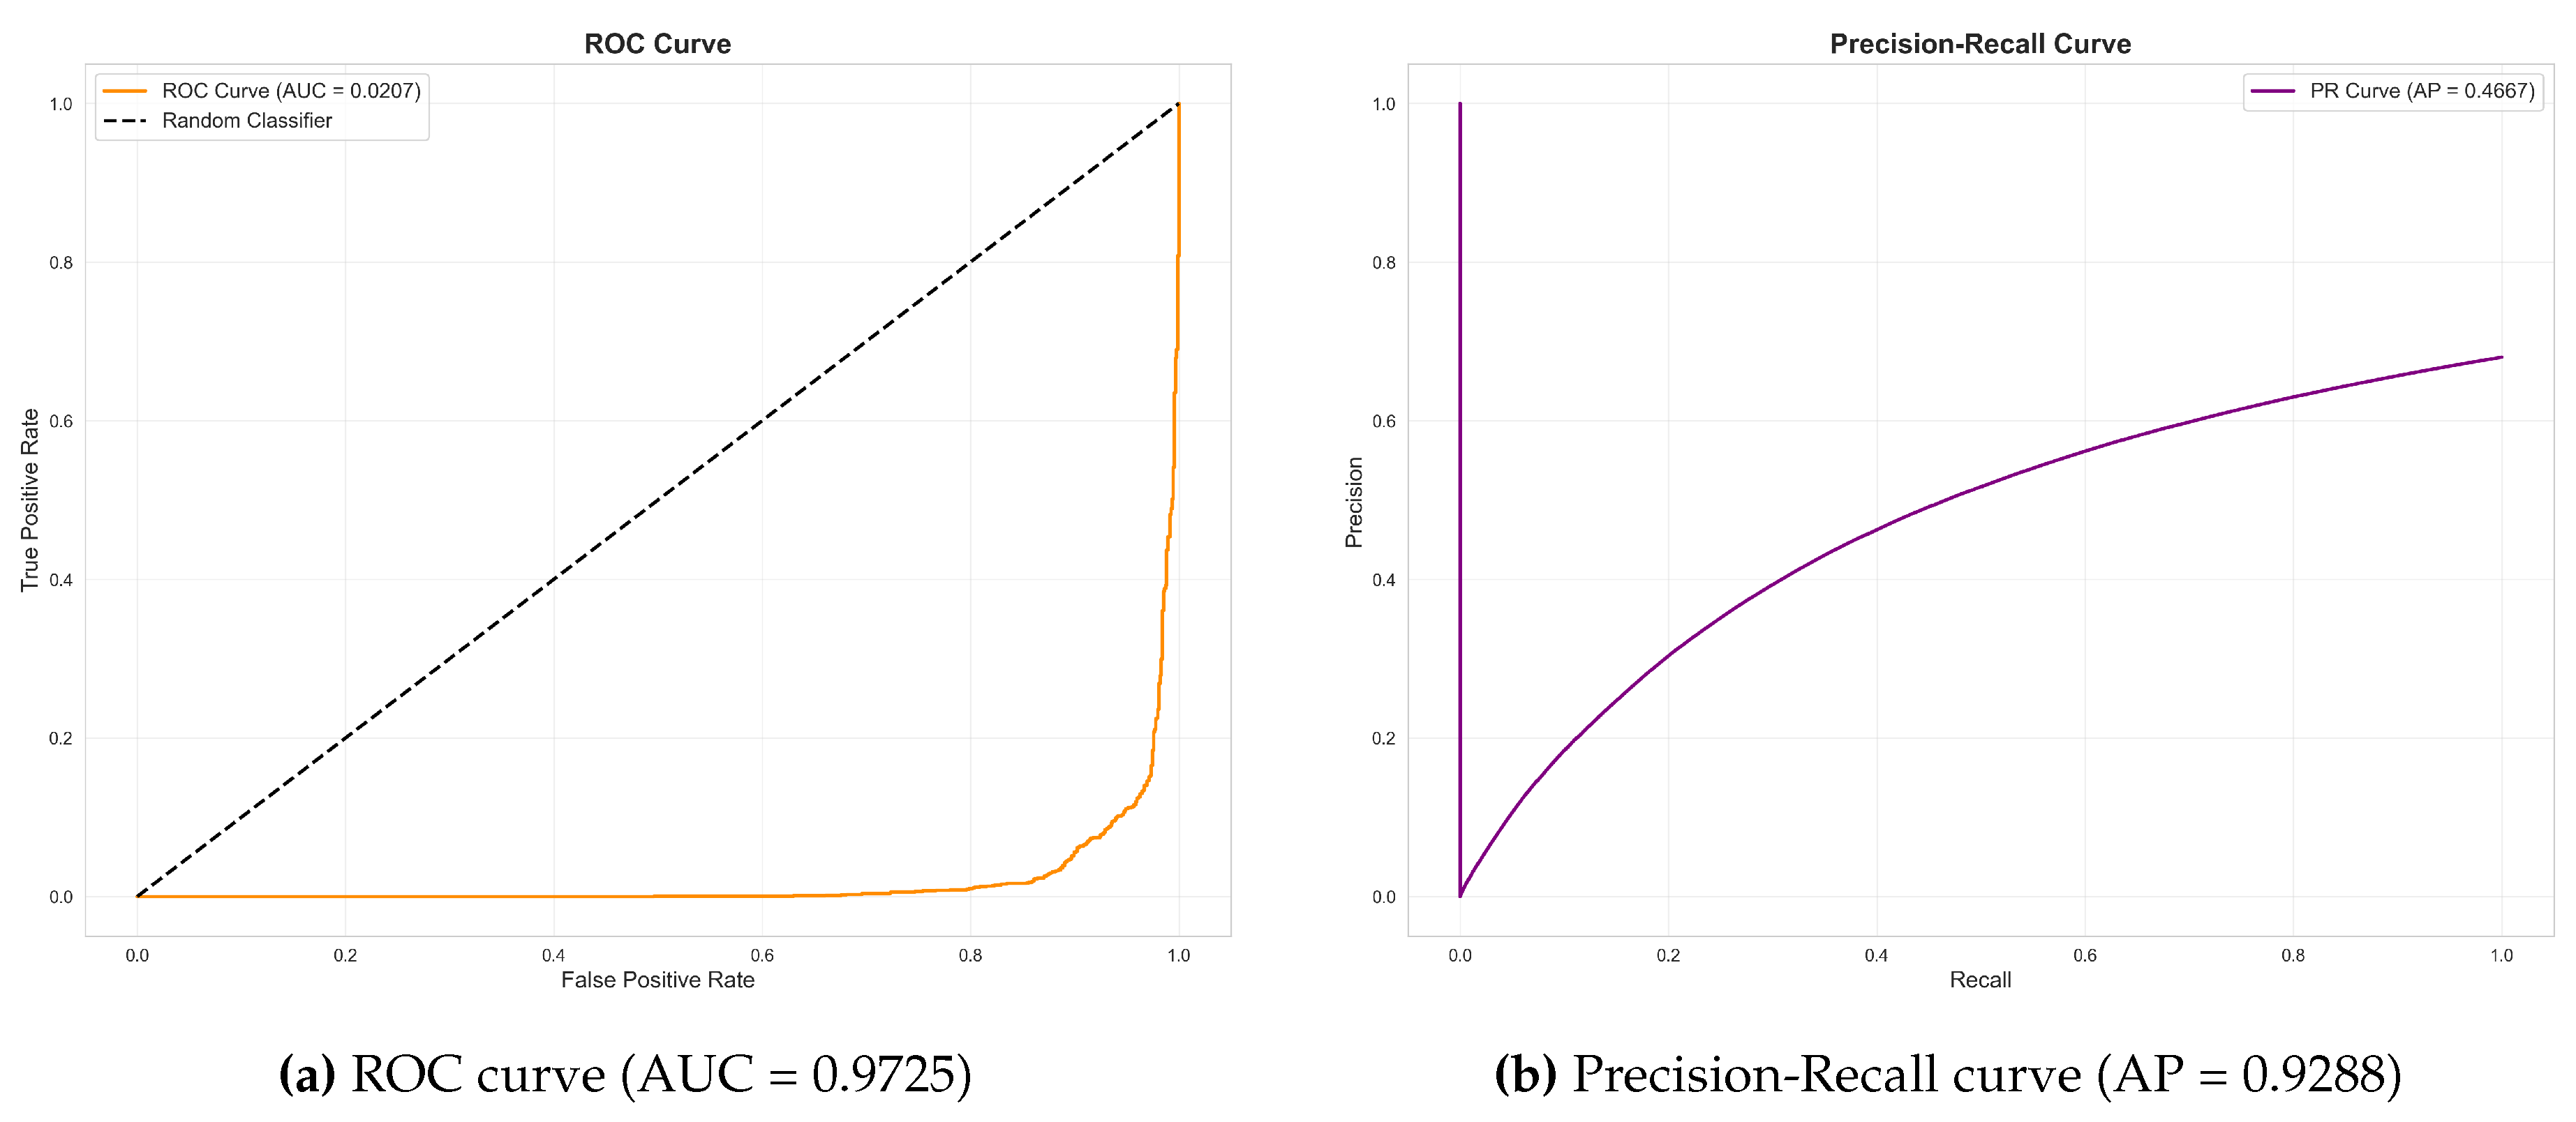
Figure 8.
Distribution of prediction scores by class. Snow leopard images (blue, n=916) predominantly receive scores above 0.9, while non-target images (red, n=1,745) are concentrated near 0.0. The clear bimodal separation indicates confident predictions, with overlap occurring primarily in the 0.9–1.0 range.
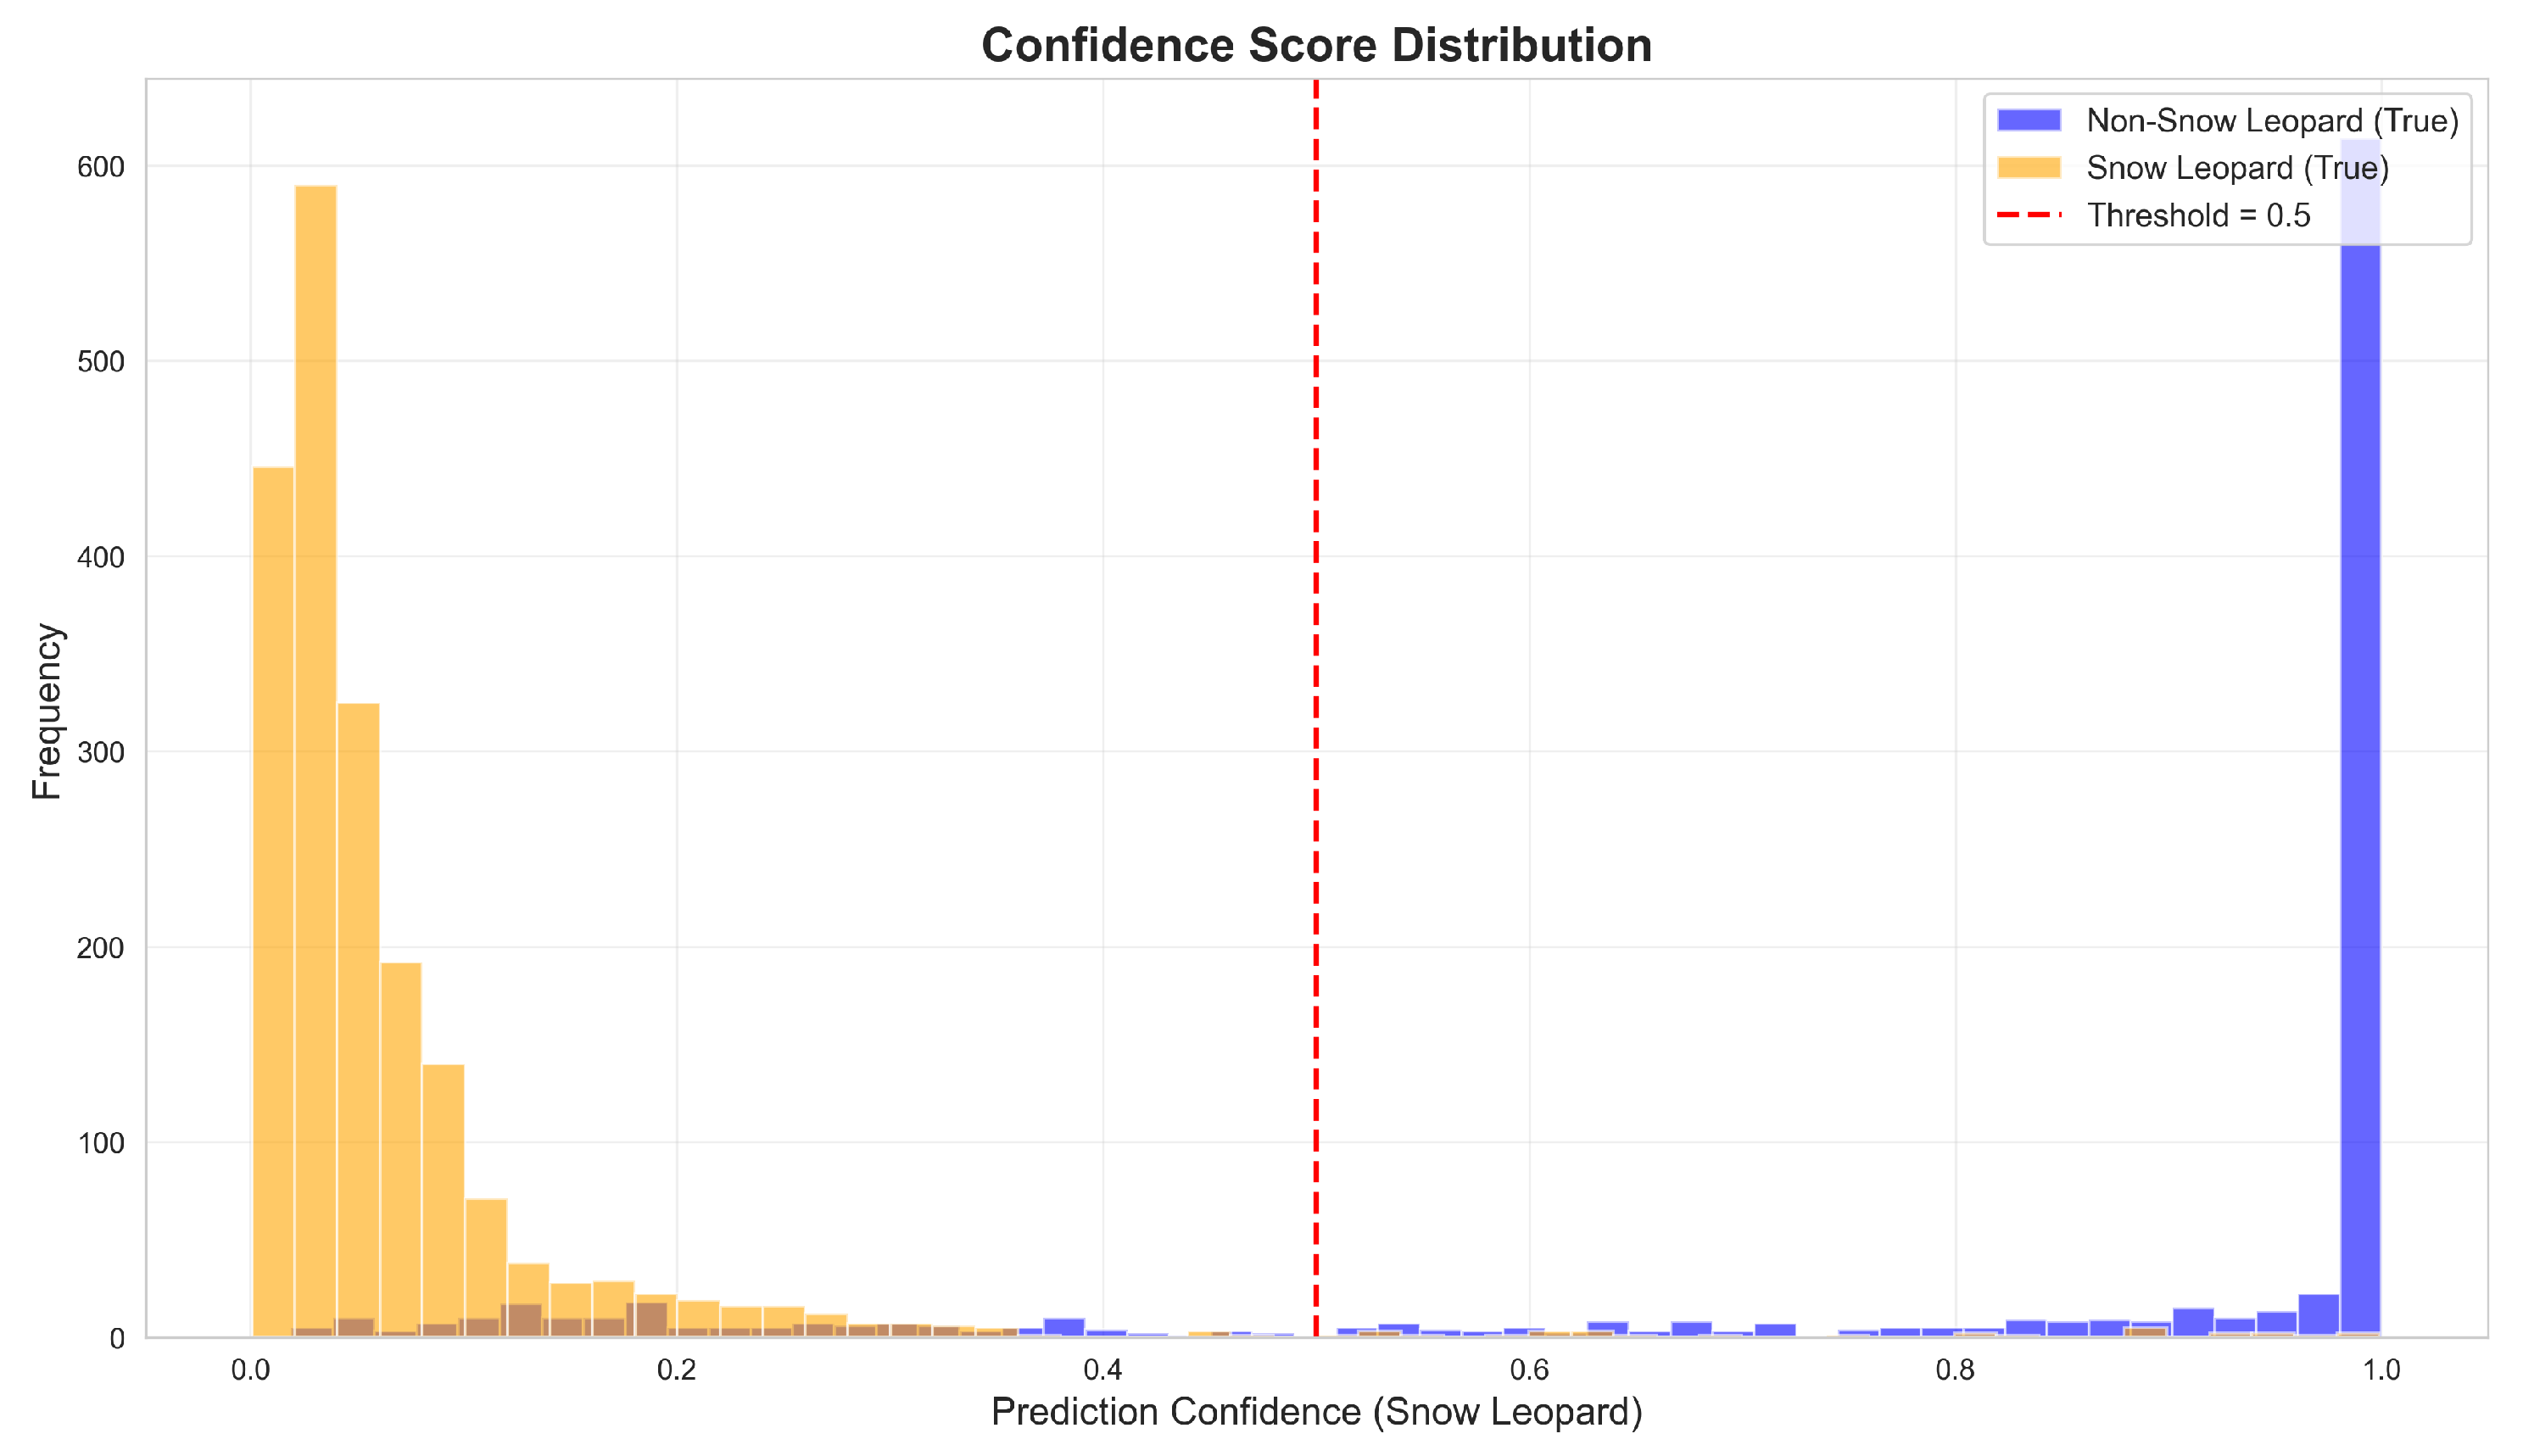
Figure 9.
Performance metrics as a function of decision threshold. Sensitivity (green) remains near 100% until threshold exceeds 0.95. Specificity (cyan) increases monotonically with threshold. The optimal F1 threshold (0.95) achieves improved balance between sensitivity and specificity while maintaining 99% detection rate.
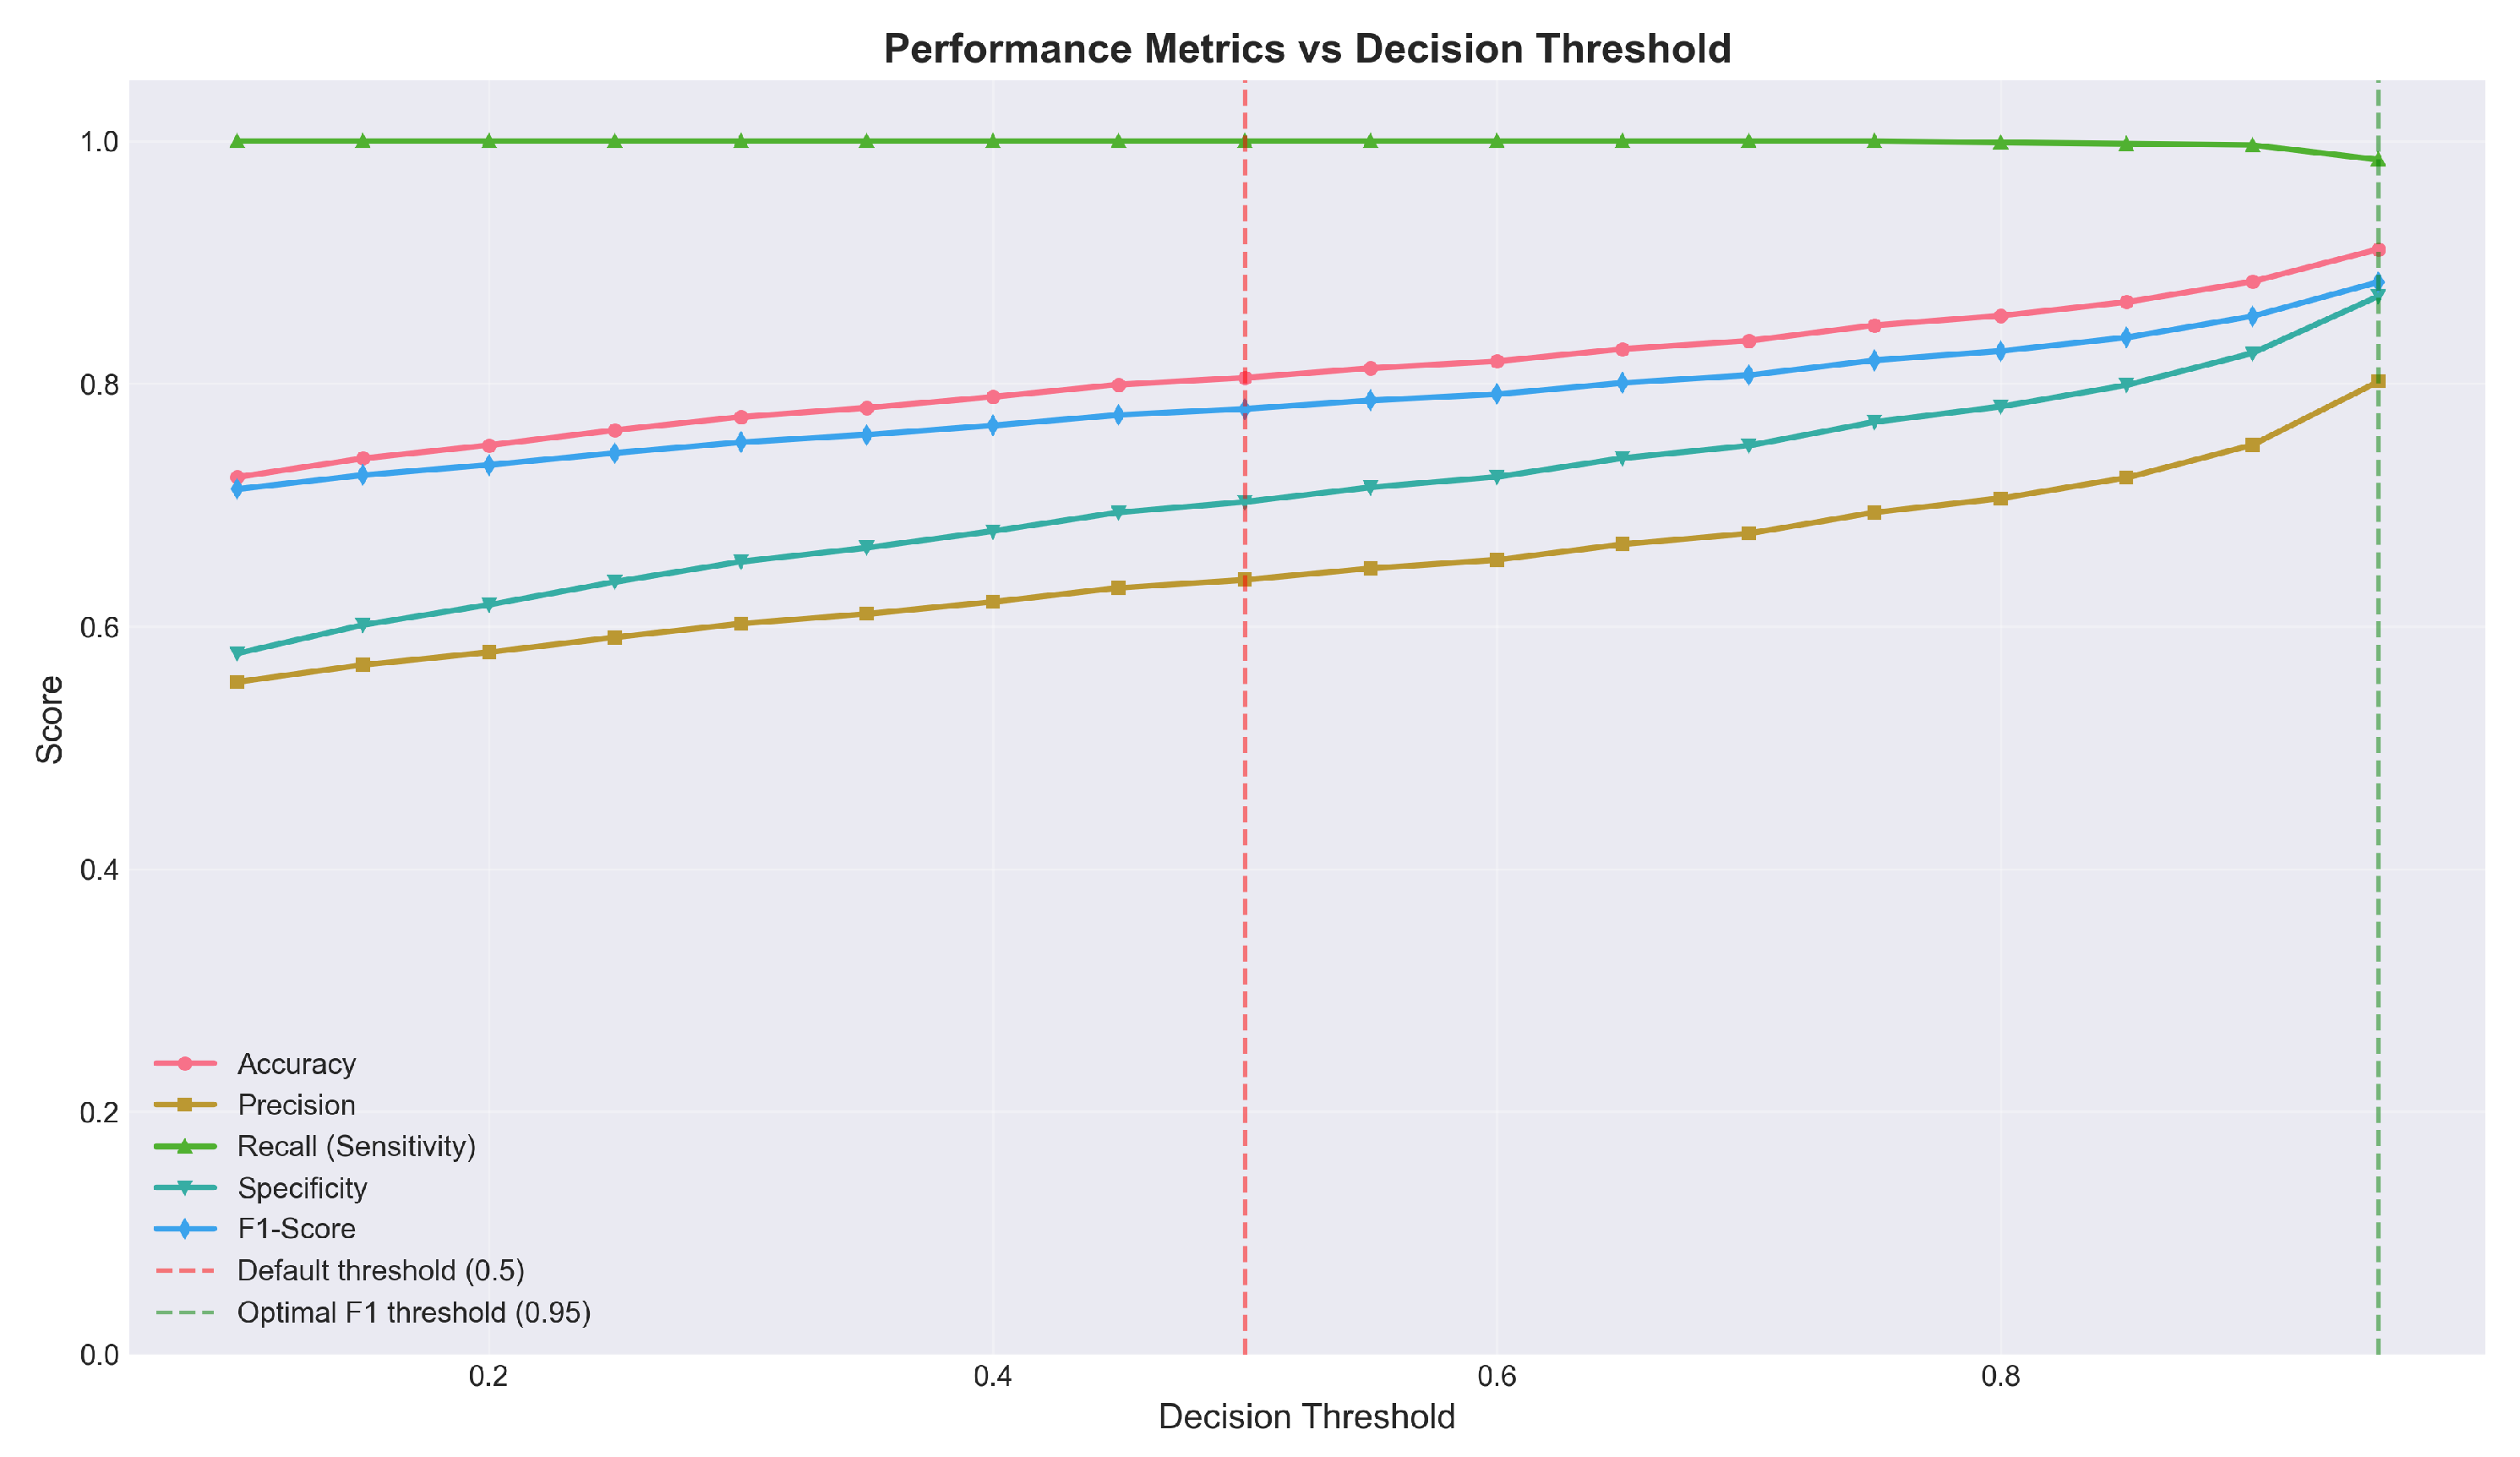

Table 1.
Dataset composition and class distribution
| Class | Count | Percentage |
|---|---|---|
| Snow Leopard Present | 916 | 34.4% |
| Snow Leopard Absent | 1,744 | 65.6% |
| Total | 2,660 | 100% |
Table 2.
Model architecture configuration
| Component | Configuration |
|---|---|
| Feature Extractor | MobileNetV2 (ImageNet pre-trained, frozen) |
| Attention Module | Squeeze-and-Excitation (reduction ratio: 16) |
| Global Pooling | Adaptive Average Pooling |
| Classifier | Fully Connected with Dropout (0.3) |
| Output Activation | Sigmoid |
| Total Parameters | 2,621,762 |
| Trainable Parameters | 363,010 (13.8%) |
| Frozen Parameters | 2,258,752 (86.2%) |
Table 3.
Training hyperparameters
| Hyperparameter | Value |
|---|---|
| Optimizer | Adam |
| Learning Rate | |
| Learning Rate Schedule | ReduceLROnPlateau (factor: 0.5, patience: 5) |
| Minimum Learning Rate | |
| Batch Size | 16 |
| Epochs | 50 |
| Early Stopping Patience | 15 epochs |
| L2 Regularization |
Table 4.
Data augmentation parameters
| Augmentation | Parameter |
|---|---|
| Rotation | ±30° |
| Width Shift | |
| Height Shift | |
| Shear | |
| Zoom | |
| Horizontal Flip | Yes |
| Brightness | 80%–120% |
Table 5.
Cross-validation results (5-fold stratified)
| Metric | Mean | Std | Min | Max |
|---|---|---|---|---|
| Accuracy | 76.4% | ±3.7% | 70.9% | 82.1% |
| Sensitivity | 99.9% | ±0.2% | 99.5% | 100% |
| Specificity | 64.0% | ±5.6% | 55.5% | 72.8% |
| Precision | 59.6% | ±3.8% | 54.3% | 65.8% |
| F1-Score | 74. 6% | ±3.0% | 70.4% | 79.4% |
| AUC-ROC | 93.95% | ±1.9% | 92.2% | 96.8% |
Table 6.
Aggregated confusion matrix values
| Predicted: No Leopard | Predicted: Leopard | |
|---|---|---|
| Actual: No Leopard | 1,117 (TN) | 627 (FP) |
| Actual: Leopard | 1 (FN) | 915 (TP) |
Table 7.
Performance at different decision thresholds
| Threshold | Sensitivity | Specificity | Accuracy | F1-Score |
|---|---|---|---|---|
| 0.50 (default) | 99.9% | 64.0% | 76.4% | 74. 6% |
| 0.70 | ∼99.5% | ∼75% | ∼84% | ∼82% |
| 0.90 | ∼99% | ∼86% | ∼90% | ∼87% |
| 0.95 (optimal) | ∼99% | ∼88% | ∼91% | ∼88% |
Disclaimer/Publisher’s Note: The statements, opinions and data contained in all publications are solely those of the individual author(s) and contributor(s) and not of MDPI and/or the editor(s). MDPI and/or the editor(s) disclaim responsibility for any injury to people or property resulting from any ideas, methods, instructions or products referred to in the content. |
© 2025 by the authors. Licensee MDPI, Basel, Switzerland. This article is an open access article distributed under the terms and conditions of the Creative Commons Attribution (CC BY) license (http://creativecommons.org/licenses/by/4.0/).
Copyright: This open access article is published under a Creative Commons CC BY 4.0 license, which permit the free download, distribution, and reuse, provided that the author and preprint are cited in any reuse.


