
Submitted:
28 November 2025
Posted:
01 December 2025
You are already at the latest version
Abstract
Background: 22q11.2 deletion syndrome (22q11.2DS), also known as Di-George/velocardiofacial syndrome is the most common chromosomal microdeletion and is frequently associated with conotruncal congenital heart defects (CHD). A novel protocol for 22q11.2 deletions detection using conventional PCR and agarose gel electrophoresis was developed, and seven primer pairs targeting six 22q11.2 genes (HIRA, TBX1, DGCR8, ZNF74, CRKL, MAPK1) plus the reference gene RPP30 were evaluated. Methods: DNA from eight CHD cases (four 22q11.2 deletions confirmed by FISH (P1–P3) or BOBs (P4), and four cases with unknown status (U1–U4)) and two controls was amplified un-der optimized PCR conditions. The PCR products were analyzed on 2.5% agarose gels to assess band presence, intensity, and expected size for primer validation and potential 22q11.2 deletions detection. Results: All seven primer pairs produced expected sizes bands in two normal controls, with no target-size bands in the no template control (NTC), indicating adequate amplification performance. Among deletion confirmed cases, concordant multi-locus loss was observed—most notably at TBX1, DGCR8 and ZNF74, with MAPK1 additionally reduced in P4 sample. In the unknown group, U1 and U3 showed normalized band-intensity ratios above the 0.6 cut-off at all loci, indicating no evidence of 22q11.2 deletions, whereas locus-specific partial loss at ZNF74 was detected in U2 and U4; none of the unknown samples exhibited the broad multi-gene loss pattern observed in the confirmed 22q11.2 deletion cases. Conclusions: This study has developed and val-idated a novel 22q11.2 deletions detection protocol using conventional PCR with agarose gel electrophoresis. The assay is rapid and inexpensive, suitable for basic molecular laboratories, while confirmation still relies on standard clinical genetic tests such as CMA, FISH or BOBs, particularly in resource-limited settings.
Keywords:
22q11.2 deletion syndrome
; agarose gel electrophoresis
; chromosome abnormality
; congenital heart defects (CHD)
; DiGeorge syndrome
; microdeletions
; polymerase chain reaction (PCR)
1. Introduction
22q11.2 deletion syndrome (22q11.2DS), also known as DiGeorge or velocardiofacial syndrome, is the most common chromosomal microdeletion, affecting about 1 in 4,000 live births and showing marked phenotypic heterogeneity[1]. Core manifestations include conotruncal congenital heart defects (CHD) i.e. tetralogy of Fallot (TOF), interrupted aortic arch type B (IAA-B), truncus arteriosus (TA), and outflow-tract septation defects, together with palatal anomalies, characteristic craniofacial features, hypocalcemia from parathyroid hypoplasia, and variable T-cell immunodeficiency from thymic hypoplasia[2,3]. The broad spectrum, incomplete penetrance, and variable expressivity are driven by gene-dosage effects across the 22q11.2 region, which disrupt multiple embryonic development programs[4].
The 22q11.2 region is partitioned by a series of low-copy repeats (LCR) designated LCR22A–LCR22H, which define recurrent non-allelic homologous recombination intervals. Deletions arise when recombination occurs between specific LCR pairs, generating characteristic A–D, A–B and more distal (e.g. D–E) microdeletions[5]. Recurrent deletions vary by interval: the typical A–D deletion spans ~3.0 Mb and removes about 106 genes, whereas the smaller A–B deletion (~1.5 Mb) encompasses roughly 30 genes; distal intervals such as D–E include around 20–25 genes but may still harbor key modifiers such as MAPK1 (mitogen-activated protein kinase 1), ERK2 (extracellular signal-regulated kinase 2)[6,7] . Converging human and experimental evidence supports a TBX1 (T-box transcription factor 1)-centered cardiac axis modulated by adjacent dosage-sensitive genes. TBX1 coordinates second-heart-field growth, pharyngeal segmentation, neural-crest migration, and outflow-tract patterning, therefore, deletion or mutation of TBX1 can drives conotruncal defects[8]. CRKL (CRK-like adaptor protein) integrates FGF (fibroblast growth factor)–RAS (Rat sarcoma)–ERK (extracellular signal-regulated kinase) signals, and together with MAPK1/ERK2, modifies outflow tract and aortic arch remodeling[9,10]. HIRA (HIRA histone chaperone) maintains enhancer accessibility, rendering TBX1-dependent programs vulnerable to haploinsufficiency[11]. Evidence also implicates DGCR8 (DiGeorge syndrome critical region gene 8), a core component of microRNA biogenesis, and ZNF74 (zinc finger protein 74), a dosage-sensitive transcriptional regulator, as modifiers of cardiac expressivity within the deletion context[6,12]. Taken together, these data provide the biological rationale for interval-aware, multi-locus screening focused on TBX1, CRKL, MAPK1, HIRA, DGCR8, and ZNF74, rather than single-gene tests when evaluating conotruncal and related fetal cardiac phenotypes[10].
Because 22q11.2 deletions map to recurrent LCR22 intervals (classically A–D or A–B, with nested/distal variants), assay performance depends on the affected size and genes involved within the deletion rather than employing a single probe target. Routine clinical detection of 22q11.2DS typically relies on fluorescence in situ hybridization (FISH), chromosomal microarray (CMA), multiplex ligation-dependent probe amplification (MLPA), or BACs-on-Beads (BOBs)[13,14]. FISH is robust with a single locus (commonly TUPLE1/HIRA), therefore, possibly missing atypical or distal deletions outside the probe site. Additionally, the sensitivity for those with low-level mosaicism is limited. FISH also requires cell preparation laboratory and confocal fluorescent microscopy[15,16]. CMA is breakpoint-agnostic and genome-wide, yet it is costly, has turnaround and infrastructure demands, and its resolution depends on the probe density—the analysis of small/nested losses close to the LCR may give ambiguous results[17]. MLPA is economical but the detection of the panel—dependent—loci which are not covered by the probe set (e.g. distal MAPK1) are not possible, and the performance drops with degraded or low-quantity DNA[18,19]. BOBs is a bead-based targeted assay that multiplexes bacterial artificial chromosome (BAC) probes for rapid screening on small prenatal samples; like MLPA, it is panel-dependent and cannot define the breakpoints, therefore, atypical or distal intervals outside the probe set will be missed[20,21]. These constraints limit scalability, particularly in low-resource settings and in non-invasive prenatal testing (NIPT)[22]. Although NIPT is widely used for common aneuploidies, microdeletion detection remains constrained by low cell-free fetal DNA (cffDNA) fractions, subtle copy-number shifts, GC/fragmentation bias, placental mosaicism, and insufficient probe/fragment coverage across 22q11. 2[23]. Accordingly, interval-aware, multi-locus strategies that tolerate limited DNA and degraded templates are desirable as front-end screens and as pragmatic bridges to definitive assays.
This study aimed to design a novel multi-locus primer panel for 22q11.2 deletions detection covering six biologically relevant genes within the commonly and variably deleted regions of 22q11.2: HIRA, TBX1, DGCR8, ZNF74, CRKL and MAPK1. These genes were carefully selected based on their critical roles in cardiac and neural crest developmental biology, as well as their genomic positions spanning both classical and atypical deletion hotspots from LCR22A to LCR22E[24,25,26,27]. Conventional PCR followed by agarose gel electrophoresis was employed to assess amplification efficiency, specificity, and compare the results with known affected and normal samples.
2. Materials and Methods
2.1. Sample Collection and DNA Extraction
A total of eight samples were included in this study, all from individuals diagnosed with CHD either prenatally or postnatally. The CHD samples were divided into two groups: (1) Confirmed 22q11.2 deletion group (n = 4): This group included three peripheral blood samples (2 mL each) collected from postnatal children aged 2 to 5 years, and one umbilical cord blood sample collected at birth. All four cases had previously been confirmed to carry a 22q11.2 deletion by FISH or BOBs analysis. (2) Unknown 22q11.2 status group (n = 4): This group consisted of prenatal samples collected from fetuses with CHD diagnosed by prenatal ultrasound or postmortem examination. It included one chorionic villus sample (~5 mg) and three amniotic fluid samples (2 mL each). At the time of sampling, these cases were undergoing parallel diagnostic testing, but the results were not yet available, allowing us to assess the feasibility of our method in a real-world clinical screening context (Table 1). In addition, two samples from healthy individuals served as the normal control group.
The diagnosis of CHD was confirmed by autopsy in cases of pregnancy termination. In ongoing pregnancies without postmortem confirmation, prenatal ultrasound findings were used for classification. For live-born infants, the diagnosis was established based on postnatal echocardiography in combination with computed tomographic angiography (CTA). This study was approved by the Ethics Committee of Chiang Mai University (OBG-2567-0545). Written informed consent was obtained from the pregnant individual for prenatal cases, and from a parent or legal guardian for child participants. Where pregnancy was terminated, authorization for postmortem examination and research use of de-identified fetal and placental tissue was obtained according to institutional policy.
Genomic DNA was extracted using GF-1 Blood DNA Extraction Kit, version 4.1 (Vivantis Technologies Sdn. Bhd., Subang Jaya, Malaysia) for peripheral and umbilical cord blood, and GF-1 Tissue DNA Extraction Kit, version 4.1 (Vivantis Technologies Sdn. Bhd., Subang Jaya, Malaysia) for amniotic fluid and chorionic villus samples, following the manufacturer’s protocols.
2.2. DNA Quantification and Quality Assessment
The concentration and purity of extracted DNA were measured with a NanoDrop spectrophotometer (Thermo Fisher Scientific, Waltham, MA, USA). Purity was assessed by the absorbance ratio at 260 nm and 280 nm (A260/280). DNA concentrations were used to normalize the template to 10 ng per PCR reaction, enabling semi-quantitative comparison of band intensities on agarose gels. All DNA samples were diluted to working concentrations as required and stored at −20 °C prior to PCR.
2.3. Primers Design
Primers were designed for six 22q11.2 targets: HIRA, TBX1, DGCR8, ZNF74, CRKL, and MAPK1. RPP30 (chromosome 10q23) served as the internal reference for normalization. Initial designs were generated in Primer Premier 5.0 (Premier Biosoft) using genomic sequences from the NCBI Reference Sequence Database (GRCh38/hg38). Amplicons were kept short (60–150 bp) to accommodate fragmented DNA in prenatal or partially degraded samples. Primer melting temperatures were harmonized to 60 ± 2 °C (ΔTm ≤ 2 °C), and all assays were run at a single annealing temperature of 60 °C.
Specificity was first assessed with NCBI Primer-BLAST to confirm unique mapping on GRCh38/hg38. To further evaluate sequence context, high-homology sequences were retrieved from NCBI and, together with the target regions, were imported into Geneious R9 (Biomatters Ltd.) for multiple-sequence alignment and visualization, allowing conserved/variable segments to be annotated and highly homologous regions to be avoided when placing primer sites. Potential primer–primer interactions were subsequently evaluated with AutoDimer v1.0 to minimize primer-dimer formation and non-specific amplification. All primers were synthesized by Integrated DNA Technologies (IDT, Coralville, IA, USA) and reconstituted according to the manufacturer’s instructions. Primer sequences and amplicon characteristics are summarized in Table 2.
2.4. PCR Amplification
PCR was performed in a 25 µL total volume with a fixed DNA input of 10 ng per well. A master mix was prepared at room temperature for all reactions (all components except template DNA) and aliquoted equally. The per-reaction composition was: 10× PCR buffer 2.5 µL (final 1×), dNTPs 0.50 µL (10 mM each stock; final 200 µM each), forward primer 0.20 µL (100 µM; final 0.8 µM), reverse primer 0.20 µL (100 µM; final 0.8 µM), Taq DNA polymerase 0.20 µL (5 U/µL; final 1 U), genomic DNA providing 10 ng (volume adjusted by NanoDrop concentration), with nuclease-free water added to reach 25 µL (including the template). No-template controls (NTC) received nuclease-free water in place of DNA at the same volume. Thermal cycling was as follows: 95 °C for 5 min; 35 cycles of 95 °C for 30 s, 60 °C for 45 s, and 72 °C for 45 s; final extension at 72 °C for 10 min. Amplicons were verified by agarose gel electrophoresis as described.
2.5. Agarose Gel Electrophoresis and Imaging
A 2.5% agarose gel was prepared by dissolving 1.25 g of agarose powder in 50 mL of 1× TBE buffer by heating, followed by the addition of 2 µL of ViSafe Red Gel Stain (10,000×; Vivantis Technologies, Cat. SD0103). The solution was poured into a gel tank with a comb and allowed to solidify at room temperature for 60 minutes. PCR products were mixed with DNA loading dye at a 1:5 (v/v) ratio (1 µL dye + 5 µL PCR product) and loaded into the wells, and 2 µL of DNA ladder (Vivantis Technologies, 100–3000 bp) was loaded on each side of the gel. Electrophoresis was performed at 100 V for 45 minutes in 1× TBE buffer. The gel was visualized using a Syngene InGenius gel documentation system (Synoptics Ltd., UK) equipped with a UV transilluminator and a high-resolution camera. Images were acquired and processed using GeneSnap (Synoptics Ltd., UK).
2.6. Gel Image Quantification and DNA Estimation
2.6.1. Band Densitometry
Gel images were analyzed by densitometry in Fiji (ImageJ), version 2.16.0/1.54p (Fiji contributors; based on ImageJ, National Institutes of Health, Bethesda, MD, USA; RRID: SCR_002285). Prior to measurement, a global background leveling/contrast adjustment was applied uniformly to each gel image to obtain a near-uniform background. For each lane, the target band was quantified as integrated density (area × mean gray value) using a standardized rectangular ROI manually drawn to encompass the full band with minimal margins. To reduce operator variability, each band was measured three times with newly drawn ROIs that followed the same size and placement rules, and the three values were averaged to obtain the per-band gray value. Background-corrected measurements using an adjacent blank ROI were piloted and did not materially change band rankings, so subsequent analyses used the globally leveled images without additional local background subtraction. These per-band values were then normalized to on-gel controls to allow comparison across gels.
2.6.2. Control-Based Normalization for Cross-Gel Comparison
To correct for inter-gel variability and enable cross-sample comparison, each gene’s grayscale intensity in a sample was normalized to the mean of the two control lanes (N1 and N2) for that gene:
3. Results
3.1. Clinical and Phenotypic Characteristics of Study Subjects
A total of 10 samples were analyzed, including 4 confirmed 22q11.2 deletion cases with CHD (P1–P4), 4 CHD fetuses with unconfirmed 22q11.2 status at the time of sampling (U1–U4), and 2 normal controls. These samples were used to validate the specificity of the newly designed primers and to preliminarily assess the ability of PCR plus agarose gel electrophoresis to distinguish between deletion and non-deletion cases, laying the groundwork for future dPCR-based NIPT detection. Detailed clinical and diagnostic features are summarized in Table 1.
A newly seven-assay panel was established, covering six loci within the 22q11.2 region (HIRA, TBX1, DGCR8, ZNF74, CRKL, MAPK1) with RPP30 (10q23) as the reference. Primers were designed against GRCh38/hg38 coordinates to yield short amplicons (≈79–128 bp) with harmonized melting temperatures, allowing use of a single 60 °C cycling protocol. The forward/reverse sequences, genomic coordinates (start to end), and expected product sizes are summarized in Table 2.
3.3. Primers Validation and Amplicon identification
3.3.1. Agarose Gel Results and Qualitative Assessment
PCR amplification was successfully achieved for all seven target genes (HIRA, TBX1, DGCR8, ZNF74, CRKL, MAPK1, and RPP30) using the newly designed primer sets (Table 2). A target-sized amplicon at the expected position was used as evidence of specific amplification, and NTC were blank, excluding contamination. RPP30 (~125 bp) served as external reference; visibly weak/absent target bands relative to N1/N2 on the same gel were recorded qualitatively and shown in Figure 1. These results confirm that all primer sets efficiently and specifically amplify their intended target regions and should be suitable for subsequent qPCR and dPCR assay.
3.3.2. Genomic Mapping of Amplicons Within 22q11.2
Amplicons were mapped along 22q11.21–q11.23 in a proximal–mid–distal arrangement: HIRA, TBX1, and DGCR8 within the proximal A–B interval; ZNF74 at the B–C boundary and CRKL within the C–D interval in the mid region; and MAPK1 within the distal D–E segment. Visually, band intensity was graded in four levels—absent, faint (weak), strong, and stronger. The band intensity pattern, when analyzed by gene, shown in Figure 2.
3.4. Semi-Quantitative Analysis of Target Gene Signal Intensities Across Sample Groups
Band intensities were measured in Fiji (ImageJ) on the gel images and reported as semi-quantitative values (Figure 3). Across HIRA, TBX1, DGCR8, ZNF74 (Figure 3 A–D), P1–P4 generally displayed lower signals. U1 showed higher values for multiple targets. MAPK1 (Figure 3F) showed a reduction in P4 compared with the other samples. The reference RPP30 (Figure 3G) was relatively stable across lanes, supporting broadly comparable DNA input and amplification conditions.
3.5. Detection of Suspected Gene Deletions Based on Normalized Intensities and Genomic Mapping
Normalized grayscale intensities were computed for each target gene relative to the mean of the two on-gel normal controls (N1 and N2). Bands were classified as absent when near-zero (recorded as 0 after background leveling) and as reduced when the control-normalized ratio was <0.60. A loss threshold of 0.60 was chosen a priori because a heterozygous deletion is expected to yield ~0.5 of control after normalization; selecting 0.60 provides a conservative buffer for gel-to-gel and densitometry variability. All control lanes were ≥0.60. As shown in the normalized heatmap (Figure 4), P1–P4 exhibited multi-locus decreases. Absent bands were observed for TBX1 (P1, P4), HIRA (P2), and ZNF74 (P1, P4). Reductions (detectable but <0.60) were seen for TBX1 (P2, P3), DGCR8 (P1, P2, P4), ZNF74 (P3, U2, U4), and MAPK1 (P4). In contrast, CRKL remained at or above control across samples, RPP30 was stable (supporting comparable loading/amplification), and U1 showed no dosage reduction at any locus.
4. Discussion
A novel set of six primer pairs targeting the 22q11.2 region (HIRA–MAPK1) was developed and pre-validated by conventional PCR. RPP30(10q23), located outside 22q11.2, was used as an out-of-region loading/process reference for normalization. Applied to the present cohort, this multi-locus PCR/gel approach yielded preliminary semi-quantitative patterns of relative signal intensity. Taken together, this multi-locus pattern favors proximal LCR22 A–B involvement with frequent B–C extension (driven by ZNF74) and occasional distal D–E involvement (MAPK1 in P4).
Conotruncal/outflow-tract (OFT) lesions that dominate this series (P1-P4) are most plausibly explained by a TBX1-centered, dosage-sensitive network that integrates second-heart-field (SHF) expansion with neural-crest (NCC) migration[28]. TBX1 sets SHF proliferation and pharyngeal-arch segmentation; insufficient dosage destabilizes OFT elongation/septation and arch remodeling[29]. CRKL transduces FGF–ERK inputs, and MAPK1/ERK2 acts distally to govern NCC/SHF proliferation and motility—alterations on this branch bias toward arch/branching anomalies and OFT malalignment[30]. Penetrance and tissue scope depend on the deleted interval. HIRA keeps enhancers in TBX1-regulated pathways open; when HIRA is reduced, those pathways become more vulnerable, increasing the likelihood and breadth of abnormalities; DGCR8 perturbs miRNA biogenesis that buffers cardiogenic signaling (predisposing to septation failure); and ZNF74, positioned near the LCR22 B–C boundary, is expressed in human neural-crest–derived cardiovascular structures (walls of the pulmonary artery and aorta, and the aortic valve) and in foregut endoderm epithelia; therefore, dosage change at this locus is best viewed as a modifier that tunes outflow-tract/arch and craniofacial expressivity rather than a solitary primary driver[31,32,33,34,35]. Mechanistically, a proximal A–B core with B–C extension and occasional distal D–E involvement best predicts the OFT-predominant, arch-variable spectrum seen in our cohort.
P3 had a prior FISH-confirmed 22q11.2 deletion (HIRA/TUPLE1). In our multilocus PCR, TBX1 and ZNF74 were reduced while DGCR8 (and the HIRA amplicon) were retained, a pattern most consistent with a boundary-proximal, interval-heterogeneous deletion in which breakpoints encompass the TBX1/ZNF74 amplicons but spare a primer-defined micro-segment at DGCR8/HIRA. Given the assays’ inherent scales—FISH uses locus-specific probes spanning broad genomic intervals, whereas PCR interrogates a narrowly defined amplicon—this difference readily explains a FISH-positive HIRA loss alongside a PCR-retained HIRA amplicon and does not contradict the established diagnosis[36]. For U2 and U4, BOBs™ (a BACs-on-Beads platform that samples loci with large-insert BAC clones covering broad intervals at discrete positions) reported no deletion, whereas our assay showed isolated reduction at ZNF74[22,37]. In U2, the clinical constellation—right aortic arch with a left-sided ductus (including suspected double aortic arch) and a small thymus—aligns strongly with boundary involvement at 22q11.2; despite the non-deletion call on BOBs™, a small, edge-located focal change near LCR22 B–C remains plausible, so we recommend 22q-targeted, higher-resolution confirmation (preferably MLPA or CMA, and, if available, locus-specific identifier fluorescence in situ hybridization [LSI-FISH]) to adjudicate the ZNF74 finding and finalize counseling. In U4, the phenotype (DORV with pulmonary atresia and overriding aorta, plus bilateral ventriculomegaly with a dangling choroid plexus) broadens the differential beyond 22q; with TBX1 preserved and BOBs™ non-deletion, the isolated ZNF74 reduction is best treated as a boundary/modifier signal or technical variability, and we do not prioritize additional 22q-specific confirmation. Instead, we proceed with comprehensive chromosomal microarray to investigate alternative genomic etiologies capable of explaining the combined cardiac and central nervous system findings, reserving 22q-focused confirmatory testing only if new concordant features emerge. Moreover, U1 underwent karyotyping only (no additional microdeletion testing); in our assay, all loci showed uniformly high semi-quantitative band intensities on gel analysis, supporting the absence of a 22q11.2 deletion. U3 exhibited a 45,X karyotype, consistent with Turner syndrome, a well-established cause of congenital anomalies[38], and considering the exceedingly low likelihood of concurrent Turner syndrome and 22q11.2 deletion[39], therefore, no further molecular testing was deemed necessary in this case.
These findings indicate that a uniform multi-locus “no-reduction” pattern has strong rule-out value for 22q11.2 deletions in this cohort, whereas TBX1 signal reduction identifies cases most likely to involve the proximal interval and to benefit from OFT/arch-focused counseling and perinatal planning. By contrast, isolated changes at ZNF74/HIRA/DGCR8 are best treated as boundary/modifier cues and only gain weight when the clinical presentation is concordant. In resource-limited settings, this multi-locus PCR/gel readout functions as a practical front-end triage tool: negative profiles de-prioritize 22q11.2 work-up, TBX1-involved profiles prompt interval-aware confirmation and targeted management, and isolated boundary-signals trigger case-by-case adjudication driven by clinical concordance rather than assay metrics.
5. Limitations and Prospective
Using a standardized gel documentation system, band intensity can be quantified efficiently and normalized to N1 and N2; when higher-precision quantitation is required, RT-PCR provides sensitive relative measurements and dPCR enables absolute copy-number estimation for orthogonal confirmation. Under these controls, grayscale variability should not materially affect calls. The current cohort is adequate for protocol validation and for proposing a provisional cut-off, with larger prospective series needed to refine diagnostic metrics across settings. However, several limitations should be acknowledged. First, the present study lacks validation against quantitative copy-number reference methods such as MLPA or CMA. Second, the small sample size limits the estimation of analytical accuracy and diagnostic sensitivity. Third, intra-and inter-run reproducibility testing has not yet been performed and will be essential for establishing assay robustness. Finally, no cff DNA or degraded-DNA model has been tested-an important prerequisite for translating this protocol to NIPT applications.
Future work will focus on bridging this gel-based phase to quantitative and digital platforms. Specifically, thresholds established here will be prospectively validating using qPCR and dPCR to determine analytical precision, linearity and absolute copy-number resolution. In parallel, cffDNA and degraded-DNA models will be developed to evaluate assay performance under low-template conditions representative of NIPT. Comparative studies will correlate gene-wise reduction patterns-particularly within the TBX1–CRKL–MAPK1 axis-with distinct congenital heart-defect subtypes, expanding understanding of genotype-phenotype relationships. Finally, the primer panel will be extended to include additional hotspots within distal and nested deletion interval (beyond LCR22E) to improve coverage of atypical variants.
Collectively, these ongoing efforts will transition the current multi-locus PCR-gel system from a quantitative screening tool into a validated, quantitative dPCR platform, forming the analytical backbone for future NIPT-compatible detection of 22q11.2 deletions.
6. Conclusions
A newly designed, low-cost, multi-locus PCR–gel workflow for 22q11.2 screening was developed and appraised using six regional targets with an external reference. The readout was shown to map interval involvement as an A–B–compatible core with B–C boundary effects and occasional distal extension, enabling clinically actionable stratification. Beyond serving as a cost-effective front-end screening tool, this work represents phase 1 of a stepwise assay development pipeline leading toward dPCR and ultimately NIPT application. The validated primers and interpretive framework established here form a robust foundation for subsequent quantitative and digital platforms capable of absolute copy-number estimation, high reproducibility, and compatibility with low-template or fragmented DNA such as cffDNA. In summary, owing to its accessibility and multi-gene coverage, the workflow is positioned as a front-end triage tool and as a bridge to definitive, higher-resolution assays in diverse and resource-limited settings.
Author Contributions
Conceptualization, Y.G., W.P. and K.T.; methodology, Y.G., W.S., P.S. and W.P.; investigation, Y.G., W.S., P.S. and K.T.; resources, K.T, F.T.; data curation, Y.G., W.S., P.S. and W.P.; writing—original draft preparation, Y.G.; writing—review and editing, Y.G., F.T, W.P. and K.T.; visualization, K.T.; supervision, F.T. and W.P; project administration, F.T.; funding acquisition, F.T. All authors have read and agreed to the published version of the manuscript. W.P. and K.T. contributed equally to this work and share corresponding authorship.
Funding
This research was funded by Chiang Mai University, Thailand. Grant number 048/2568.
Institutional Review Board Statement
The study was conducted in accordance with the Declaration of Helsinki and approved by the Ethics Committee of Chiang Mai University (OBG-2567-0545).
Informed Consent Statement
Informed consent was obtained from all subjects involved in the study.
Data Availability Statement
The data supporting the findings of this study are available from the corresponding author upon reasonable request and subject to approval by Chiang Mai University.
Acknowledgments
We would like to express our appreciation to all staff and fellows at Maternal Fetal Medicine Unit, Faculty of Medicine, Chiang Mai University, Thailand, for their assistance in patient follow up and data collection.
Conflicts of Interest
The authors declare no conflicts of interest.
References
- Devriendt, K.; Fryns, J. P.; Mortier, G.; van Thienen, M. N.; Keymolen, K. The annual incidence of DiGeorge/velocardiofacial syndrome. J Med Genet. 1998, 35, 789–790. [Google Scholar] [CrossRef]
- Szczawińska-Popłonyk, A.;Schwartzmann, E.;Chmara, Z.;Głukowska, A.;Krysa, T.;Majchrzycki, M.;Olejnicki, M.;Ostrowska, P.;Babik, J. Chromosome 22q11.2 Deletion Syndrome: A Comprehensive Review of Molecular Genetics in the Context of Multidisciplinary Clinical Approach. International Journal of Molecular Sciences. 2023, 24, 8317. [CrossRef]
- Putotto, C.;Pugnaloni, F.;Unolt, M.;Maiolo, S.;Trezzi, M.;Digilio, M. C.;Cirillo, A.;Limongelli, G.;Marino, B.;Calcagni, G.; et al. 22q11.2 Deletion Syndrome: Impact of Genetics in the Treatment of Conotruncal Heart Defects. Children-Basel. 2022, 9, 772. [CrossRef]
- Hacihamdioglu, B.; Hacihamdioglu, D.; Delil, K. 22q11 deletion syndrome: current perspective. Appl Clin Genet. 2015, 8, 123–132. [Google Scholar] [CrossRef]
- Vervoort, L.; Vermeesch, J. R. The 22q11.2 Low Copy Repeats. Genes (Basel). 2022, 13, 2101. [Google Scholar] [CrossRef] [PubMed]
- Dantas, A. G.;Nunes, B. C.;Nunes, N.;Galante, P.;Asprino, P. F.;Ota, V. K.;Melaragno, M. I. Next-generation sequencing profiling of miRNAs in individuals with 22q11.2 deletion syndrome revealed altered expression of miR-185-5p. Hum Genomics. 2024, 18, 64. [CrossRef]
- Mikhail, F. M.;Burnside, R. D.;Rush, B.;Ibrahim, J.;Godshalk, R.;Rutledge, S. L.;Robin, N. H.;Descartes, M. D.;Carroll, A. J. The recurrent distal 22q11.2 microdeletions are often de novo and do not represent a single clinical entity: a proposed categorization system. Genet Med. 2014, 16, 92-100. [CrossRef]
- Guijarro, C.; Kelly, R. G. On the involvement of the second heart field in congenital heart defects. C R Biol. 2024, 347, 9–18. [Google Scholar] [CrossRef] [PubMed]
- Geirsdottir, L.;David, E.;Keren-Shaul, H.;Weiner, A.;Bohlen, S. C.;Neuber, J.;Balic, A.;Giladi, A.;Sheban, F.;Dutertre, C. A.; et al. Cross-Species Single-Cell Analysis Reveals Divergence of the Primate Microglia Program. Cell. 2019, 179, 1609-1622 e1616. [CrossRef]
- Cillo, F.;Coppola, E.;Habetswallner, F.;Cecere, F.;Pignata, L.;Toriello, E.;De Rosa, A.;Grilli, L.;Ammendola, A.;Salerno, P.; et al. Understanding the Variability of 22q11.2 Deletion Syndrome: The Role of Epigenetic Factors. Genes (Basel). 2024, 15, 321. [CrossRef]
- Chen, C.;Sun, M. A.;Warzecha, C.;Bachu, M.;Dey, A.;Wu, T.;Adams, P. D.;Macfarlan, T.;Love, P.;Ozato, K. HIRA, a DiGeorge Syndrome Candidate Gene, Confers Proper Chromatin Accessibility on HSCs and Supports All Stages of Hematopoiesis. Cell Rep. 2020, 30, 2136-2149 e2134. 2136. [CrossRef]
- Motahari, Z.; Moody, S. A.; Maynard, T. M.; LaMantia, A. S. In the line-up: deleted genes associated with DiGeorge/22q11.2 deletion syndrome: are they all suspects? J Neurodev Disord. 2019, 11, 7. [Google Scholar] [CrossRef]
- Maran, S.;Faten, S. A.;Lim, S.-H. E.;Lai, K.-S.;Ibrahim, W. P. W.;Ankathil, R.;Gan, S. H.;Tan, H. L.;Ielapi, N. Screening of 22q11.2DS Using Multiplex Ligation-Dependent Probe Amplification as an Alternative Diagnostic Method. BioMed Research International. 2020, 2020, 6945730. 6945. [CrossRef]
- Blagowidow, N.; Nowakowska, B.; Schindewolf, E.; Grati, F. R.; Putotto, C.; Breckpot, J.; Swillen, A.; Crowley, T. B.; Loo, J. C.; Lairson, L. A. Prenatal screening and diagnostic considerations for 22q11. 2 microdeletions. Genes. 2023, 14, 160. [Google Scholar] [CrossRef]
- Cui, C. H.; Shu, W.; Li, P. N. Fluorescence In situ Hybridization: Cell-Based Genetic Diagnostic and Research Applications. Frontiers in Cell and Developmental Biology. 2016, 4, 89. [Google Scholar] [CrossRef]
- Veselinyová, D.; Mašlanková, J.; Kalinová, K.; Mičková, H.; Mareková, M.; Rabajdová, M. Selected in situ hybridization methods: principles and application. Molecules. 2021, 26, 3874. [Google Scholar] [CrossRef] [PubMed]
- Emanuel, B. S.; Saitta, S. C. From microscopes to microarrays: dissecting recurrent chromosomal rearrangements. Nat Rev Genet. 2007, 8, 869–883. [Google Scholar] [CrossRef]
- Berisha, S. Z.; Shetty, S.; Prior, T. W.; Mitchell, A. L. Cytogenetic and molecular diagnostic testing associated with prenatal and postnatal birth defects. Birth Defects Research. 2020, 112, 293–306. [Google Scholar] [CrossRef]
- Verhoeven, W.; Egger, J.; Brunner, H.; de Leeuw, N. A patient with a de novo distal 22q11.2 microdeletion and anxiety disorder. Am J Med Genet A. 2011, 155A, 392–397. [Google Scholar] [CrossRef] [PubMed]
- Tao, H.;Shi, J.;Wang, J.;Zhao, L.;Ding, J.;Yang, L. Rapid prenatal aneuploidy detection of BACs-on-Beads assay in 4961 cases of amniotic fluid samples. The Journal of Maternal-Fetal & Neonatal Medicine. 2021, 34, 4090-4096. [CrossRef]
- Zhuang, J. L.; Chen, C. N. A.; Jiang, Y. Y.; Luo, Q.; Zeng, S. H.; Lv, C. L.; Wang, Y. B.; Fu, W. Y. Application of the BACs-on-Beads assay for the prenatal diagnosis of chromosomal abnormalities in Quanzhou, China. Bmc Pregnancy and Childbirth. 2021, 21, 94. [Google Scholar] [CrossRef]
- Li, C. Y.;Zhang, J. F.;Li, J.;Qiao, G. Y.;Zhan, Y.;Xu, Y.;Yang, H. BACs-on-Beads Assay for the Prenatal Diagnosis of Microdeletion and Microduplication Syndromes. Molecular Diagnosis & Therapy. 2021, 25, 339-349. [CrossRef]
- Kucharik, M.; Gnip, A.; Hyblova, M.; Budis, J.; Strieskova, L.; Harsanyova, M.; Pös, O.; Kubiritova, Z.; Radvanszky, J.; Minarik, G.; et al. Non-invasive prenatal testing (NIPT) by low coverage genomic sequencing: Detection limits of screened chromosomal microdeletions. Plos One. 2020, 15, e0238245. [Google Scholar] [CrossRef]
- Bertini, V.;Cambi, F.;Legitimo, A.;Costagliola, G.;Consolini, R.;Valetto, A. 22q11.21 Deletions: A Review on the Interval Mediated by Low-Copy Repeats C and D. Genes. 2025, 16. [CrossRef]
- Zhao, Y. J.;Diacou, A.;Johnston, H. R.;Musfee, F. I.;McDonald-McGinn, D. M.;McGinn, D.;Crowley, T. B.;Repetto, G. M.;Swillen, A.;Breckpot, J.; et al. Complete Sequence of the 22q11.2 Allele in 1,053 Subjects with 22q11.2 Deletion Syndrome Reveals Modifiers of Conotruncal Heart Defects. American Journal of Human Genetics. 2020, 106, 26-40. [CrossRef]
- Burnside, R. D. 22q11.21 Deletion Syndromes: A Review of Proximal, Central, and Distal Deletions and Their Associated Features. Cytogenetic and Genome Research. 2015, 146, 89-99. [CrossRef]
- Nunes, N.; Nunes, B. C.; Zamariolli, M.; Soares, D. C. D.; dos Santos, L. C.; Dantas, A. G.; Meloni, V. A.; Belangero, S. I.; Gil-Da-Silva-Lopes, V. L.; Kim, C. A.; et al. Variants in Candidate Genes for Phenotype Heterogeneity in Patients with the 22q11.2 Deletion Syndrome. Genetics Research. 2024, 2024, 5549592. [Google Scholar] [CrossRef]
- De Bono, C.; Liu, Y.; Ferrena, A.; Valentine, A.; Zheng, D.; Morrow, B. E. Single-cell transcriptomics uncovers a non-autonomous Tbx1-dependent genetic program controlling cardiac neural crest cell development. Nature communications. 2023, 14, 1551. [Google Scholar] [CrossRef]
- Kodo, K.; Uchida, K.; Yamagishi, H. Genetic and Cellular Interaction During Cardiovascular Development Implicated in Congenital Heart Diseases. Frontiers in Cardiovascular Medicine. 2021, 8, 653244. [Google Scholar] [CrossRef]
- Newbern, J.; Zhong, J.; Wickramasinghe, S. R.; Li, X. Y.; Wu, Y. H.; Samuels, I.; Cherosky, N.; Karlo, J. C.; O’Loughlin, B.; Wikenheiser, J.; et al. Mouse and human phenotypes indicate a critical conserved role for ERK2 signaling in neural crest development. Proceedings of the National Academy of Sciences of the United States of America. 2008, 105, 17115–17120. [Google Scholar] [CrossRef]
- Jaber-Hijazi, F.; Arnold, R.; Swaminathan, K.; Gilroy, K.; Wenzel, A. T.; Lagnado, A.; Kirschner, K.; Robertson, N.; Reid, C.; Fullarton, N. Inactivation of histone chaperone HIRA unmasks a link between normal embryonic development of melanoblasts and maintenance of adult melanocyte stem cells. Aging Cell. 2025, e70070. [Google Scholar] [CrossRef]
- Zhao, K.; Mao, Y. K.; Li, Y. S.; Yang, C. X.; Wang, K.; Zhang, J. The roles and mechanisms of epigenetic regulation in pathological myocardial remodeling. Frontiers in Cardiovascular Medicine. 2022, 9, 952949. [Google Scholar] [CrossRef] [PubMed]
- Mannarino, S.;Calcaterra, V.;Puricelli, F.;Cecconi, G.;Chillemi, C.;Raso, I.;Cordaro, E.;Zuccotti, G. The Role of miRNA Expression in Congenital Heart Disease: Insights into the Mechanisms and Biomarker Potential. Children-Basel. 2025, 12, 611. [CrossRef]
- Racedo, S. E.; McDonald-McGinn, D. M.; Chung, J. H.; Goldmuntz, E.; Zackai, E.; Emanuel, B. S.; Zhou, B.; Funke, B.; Morrow, B. E. Mouse and Human CRKL Is Dosage Sensitive for Cardiac Outflow Tract Formation. American Journal of Human Genetics. 2015, 96, 235–244. [Google Scholar] [CrossRef] [PubMed]
- Ravassard, P.; Cote, F.; Grondin, B.; Bazinet, M.; Mallet, J.; Aubry, M. ZNF74, a gene deleted in DiGeorge syndrome, is expressed in human neural crest-derived tissues and foregut endoderm epithelia. Genomics. 1999, 62, 82–85. [Google Scholar] [CrossRef]
- Liu, G. Q.; Zhang, T. Single Copy Oligonucleotide Fluorescence In Situ Hybridization Probe Design Platforms: Development, Application and Evaluation. International Journal of Molecular Sciences. 2021, 22, 7124. [Google Scholar] [CrossRef]
- Sun, S.; Zhang, Z.; Zhao, J.; Lan, X. Extended application of BACs-on-Beads technique in prenatal diagnosis. Arch Med Sci. 2023, 19, 250–257. [Google Scholar] [CrossRef] [PubMed]
- Suntharalingham, J. P.; Ishida, M.; Cameron-Pimblett, A.; McGlacken-Byrne, S. M.; Buonocore, F.; Del Valle, I.; Madhan, G. K.; Brooks, T.; Conway, G. S.; Achermann, J. C. Analysis of genetic variability in Turner syndrome linked to long-term clinical features. Frontiers in Endocrinology. 2023, 14, 1227164. [Google Scholar] [CrossRef] [PubMed]
- Zalewska, E.; Obołończyk, Ł.; Gnacińska-Szymańska, M. E.; Sworczak, K. Coexistence of DiGeorge syndrome with Fahr syndrome, mosaic turner syndrome and psychiatric symptoms–a case report. Psychiatr Pol. 2021, 55, 397–404. [Google Scholar] [CrossRef] [PubMed]
Figure 1.
Gel electrophoresis of PCR products for six targets in the 22q11.2 region (HIRA, TBX1, DGCR8, ZNF74, CRKL, MAPK1), and the reference gene RPP30(10q23). DNA samples include patients with confirmed 22q11.2 deletions (P1–P4), unconfirmed deletion cases with fetal CHD (U1–U4), normal control subjects (N1–N2), and no-template control (NTC). Panel summaries (expected size, bp): (A) HIRA ~128—bands in P1, P3, P4, U1–U4, N1, N2; P2 absent. (B) TBX1 ~105—bands in U1–U4, N1, N2; P1 absent; P2–P4 weaker than controls. (C) DGCR8 ~79—bands in P3, U1–U4, N1, N2; P1, P2, P4 weaker. (D) ZNF74 ~102—bands in P2, P3, U1, U3; P1 and P4 absent; U2, U4 weaker. (E) CRKL ~115—bands in all samples. (F) MAPK1 ~85—bands in P1–P3, U1–U4, N1, N2; P4 weaker. (G) RPP30 ~125—stable across samples. All NTC were blanked. Band positions matched the designed product sizes by reference to the 100-bp ladder. Abbreviations: P, patients with confirmed 22q11.2 deletions; U, unknown 22q11.2 status cases with fetal CHD; N, normal controls; NTC, no-template control; L, DNA ladders.
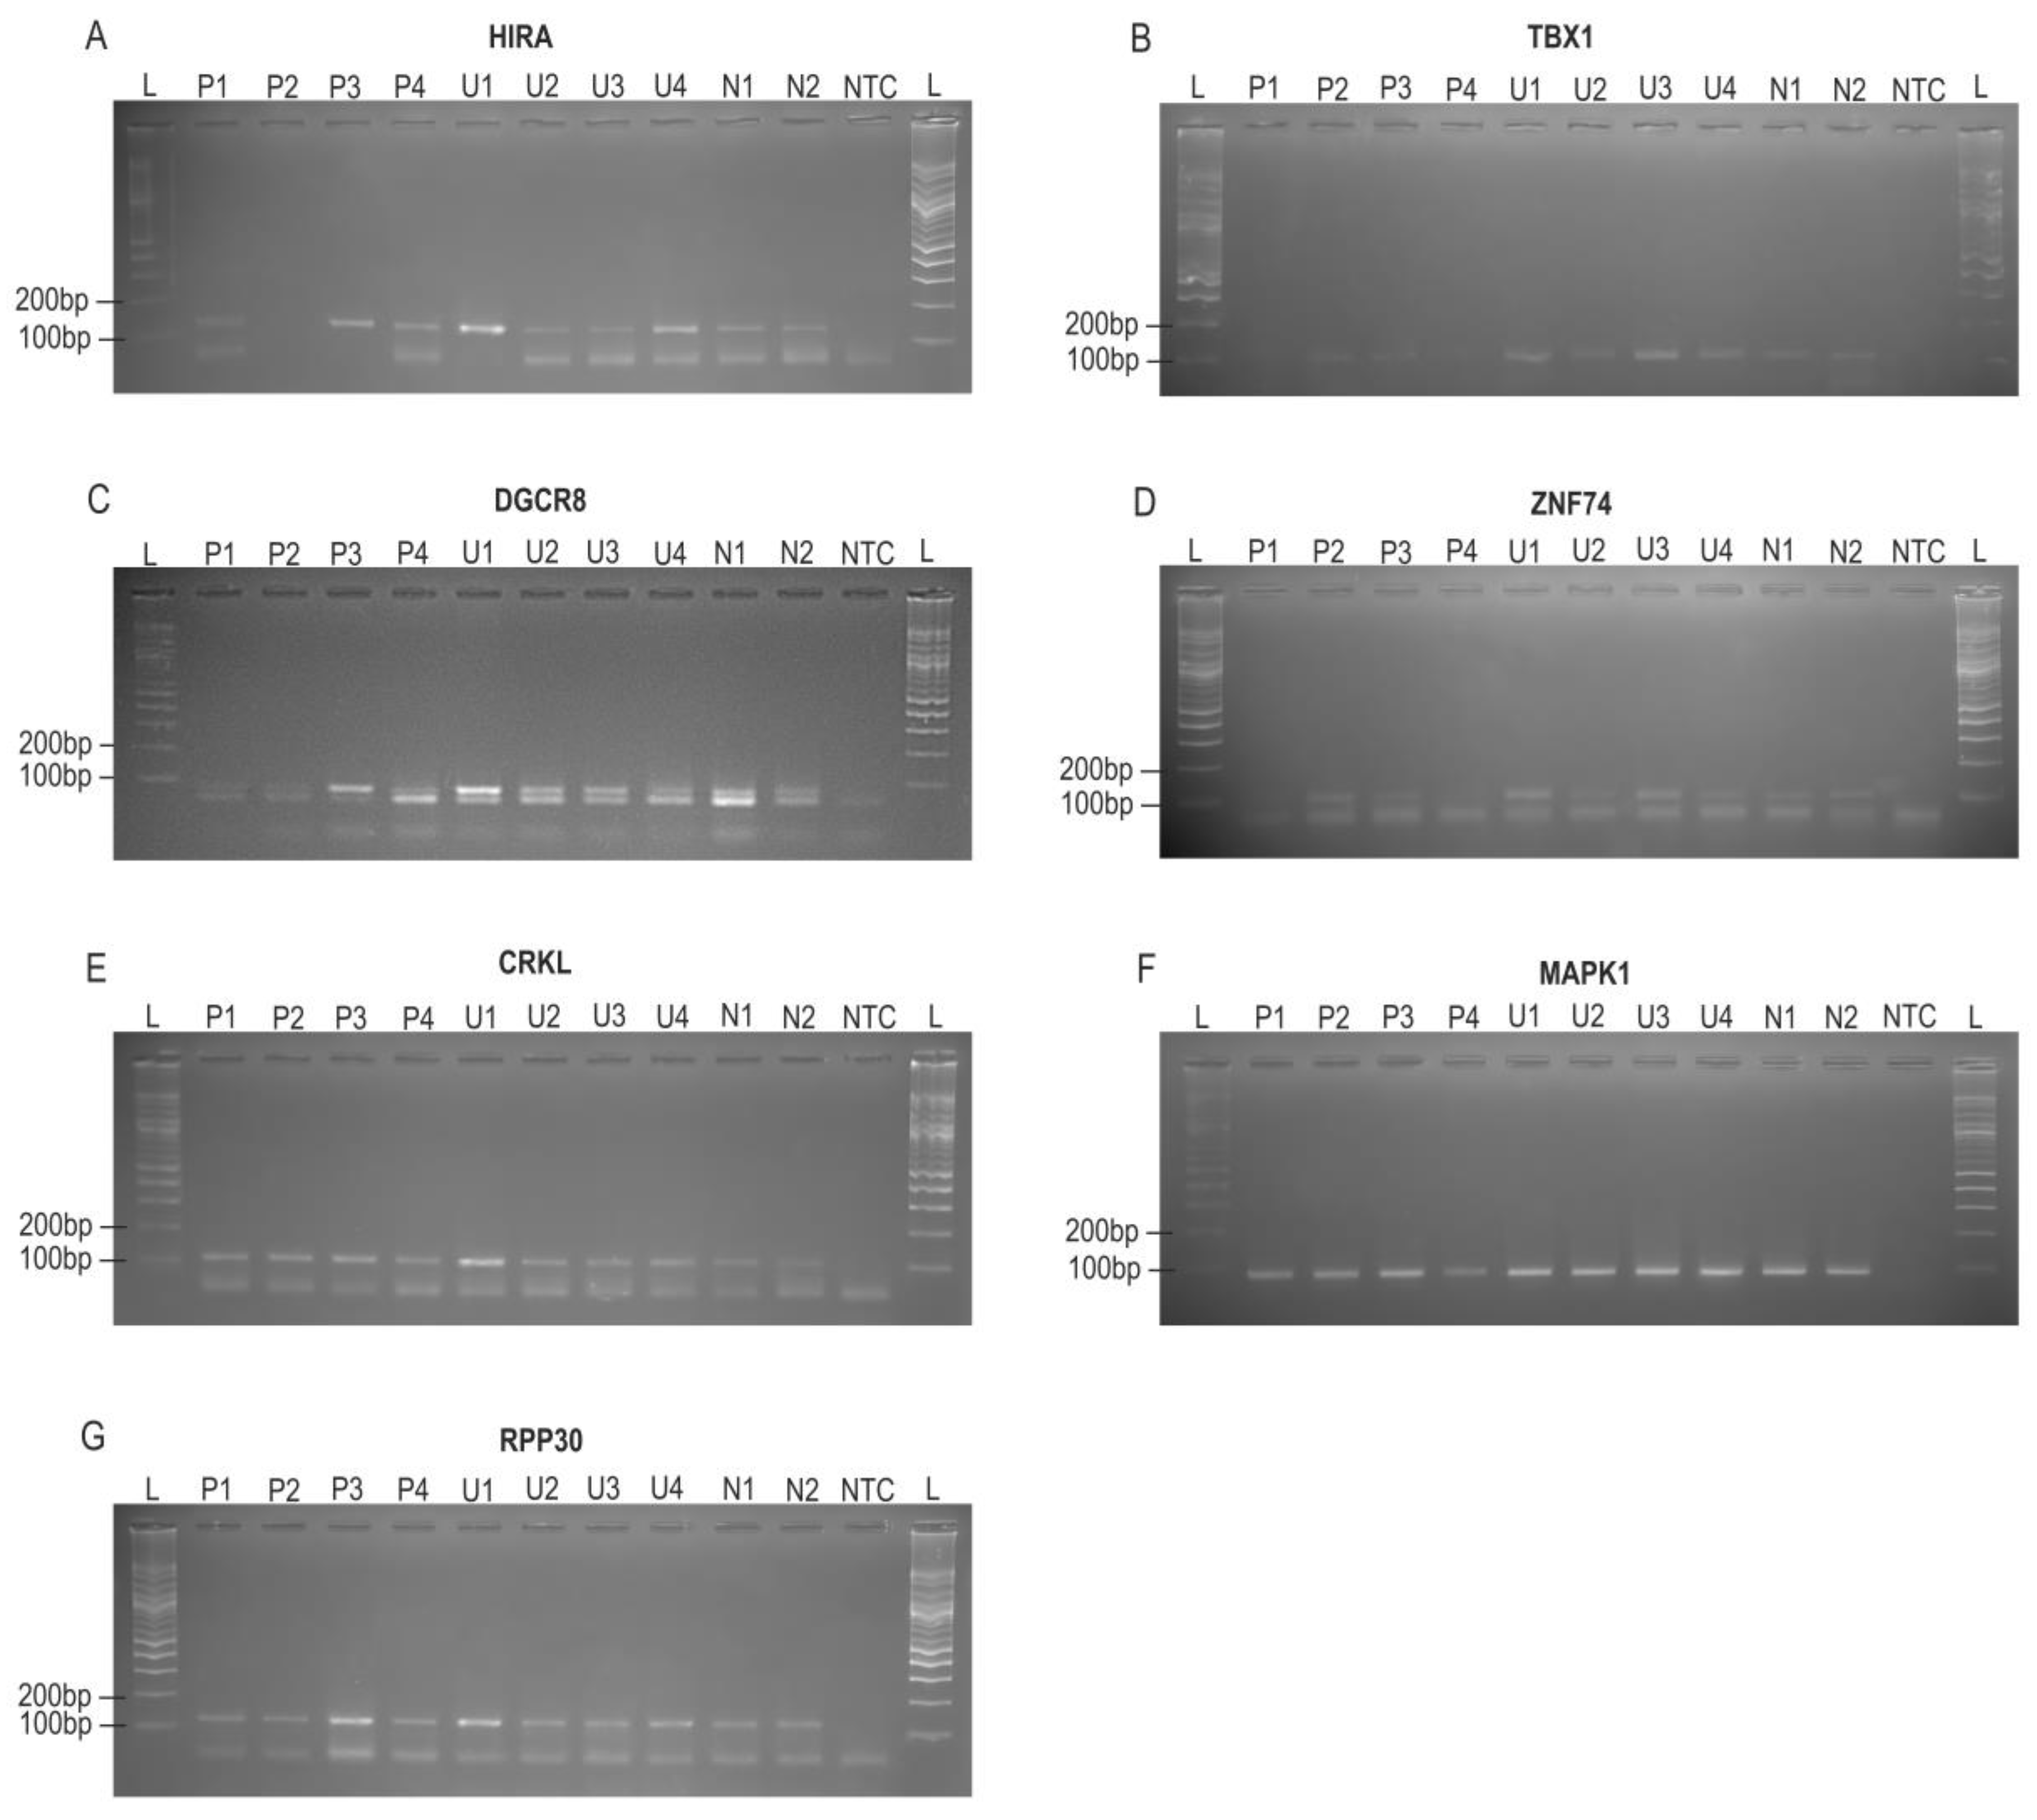
Figure 2.
Schematic of the relative positions of six loci in the 22q11.21–q11.23 region and sample-wise visual gel calls (HIRA–MAPK1). The top schematic (hg38) illustrates relative gene order (not to scale or position-aligned). The table summarizes visual band intensity for each sample at HIRA, TBX1, DGCR8, ZNF74, CRKL and MAPK1; columns follow the same left to right order as the schematic. Rows are grouped as P, patients with confirmed 22q11.2 deletions; U = unknown 22q11.2 status cases with fetal CHD; N, normal controls. Symbols denote gel-only visual calls: − no band; ± faint band (weak positive); + strong band; ++ stronger band (relative to “+”).
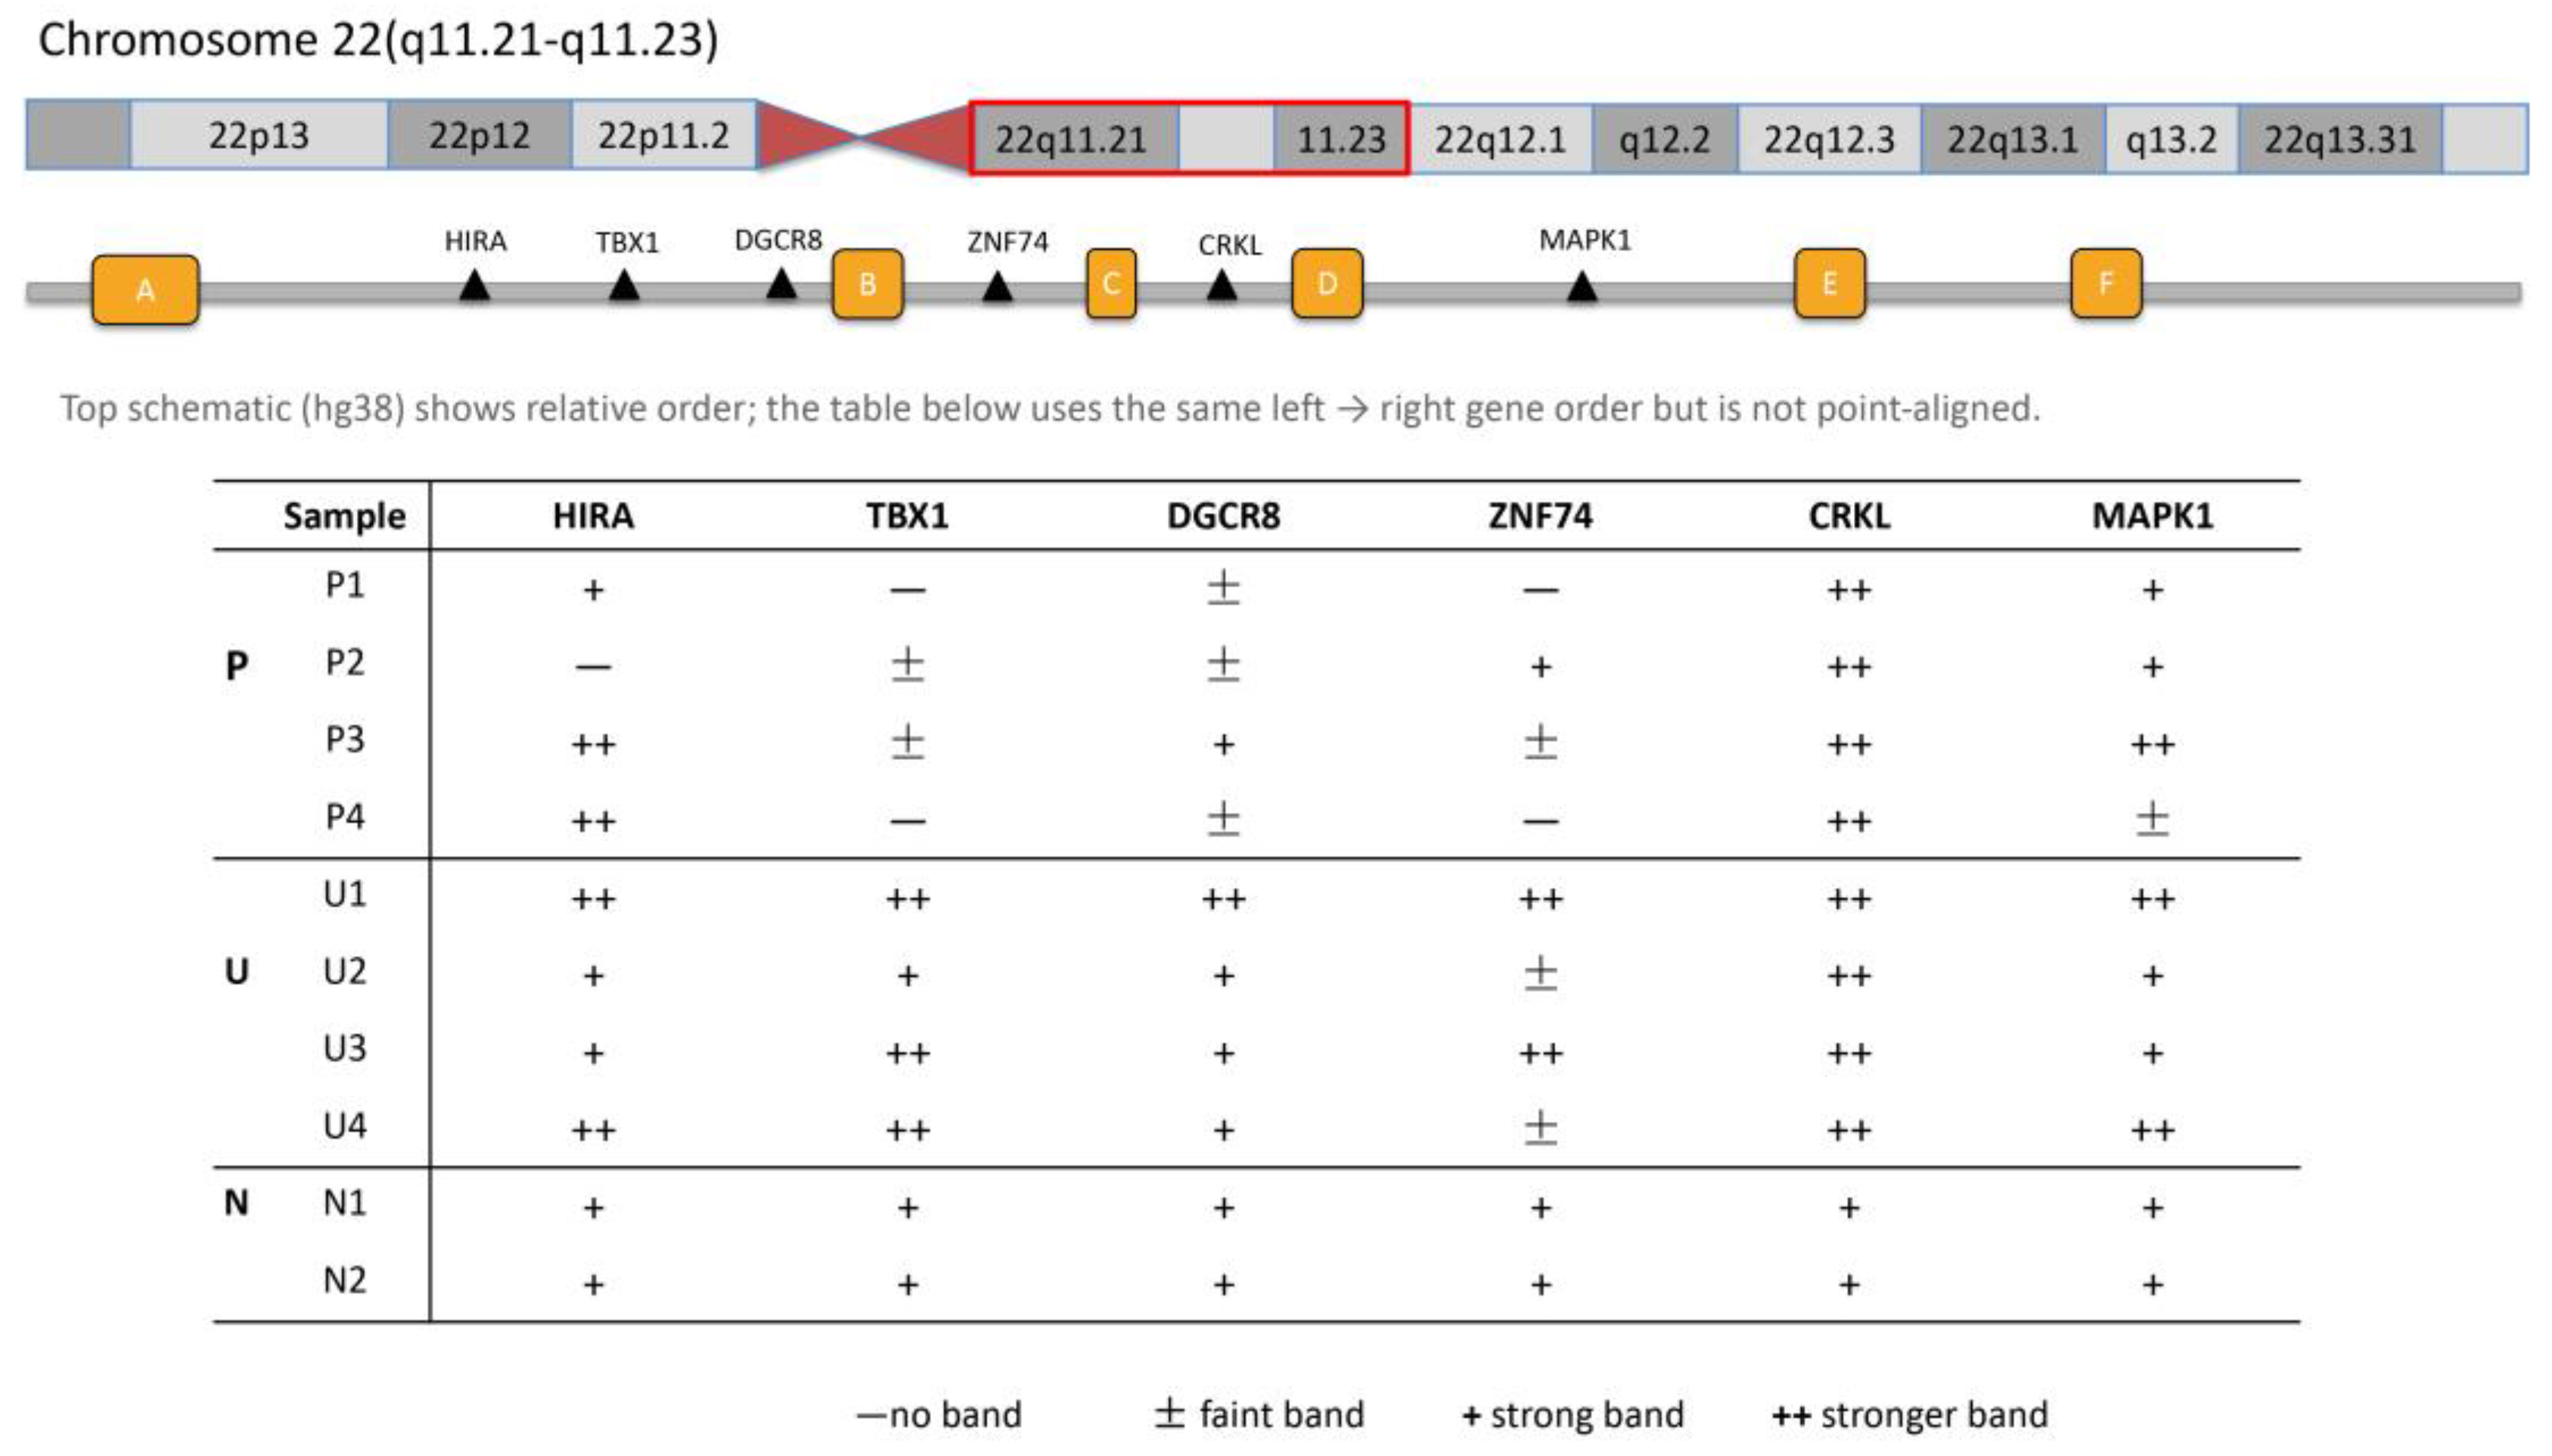
Figure 3.
Semi-quantitative densitometry of PCR bands across sample groups. Bars show within-gel integrated gray values (arbitrary units) quantified in Fiji/ImageJ (three ROI measurements averaged after global background leveling). Colors: pink, P1–P4 (patients with confirmed 22q11.2 deletions); blue, U1–U4 (unknown 22q11.2 status cases with fetal CHD); grey, N1–N2 (normal controls). Arrows indicate lanes with an absent band. Panel-wise summary (within-gel trends): (A) HIRA—P2 absent; U1 markedly increased. (B) TBX1—P1 and P4 absent; P2 and P3 decreased relative to controls. (C) DGCR8—P1, P2, and P4 decreased relative to controls. (D) ZNF74—P1 and P4 absent; P3 and U2 decreased relative to controls. (E) CRKL—all samples increased relative to controls. (F) MAPK1—P4 decreased relative to controls. (G) RPP30—no obvious decrease across samples.
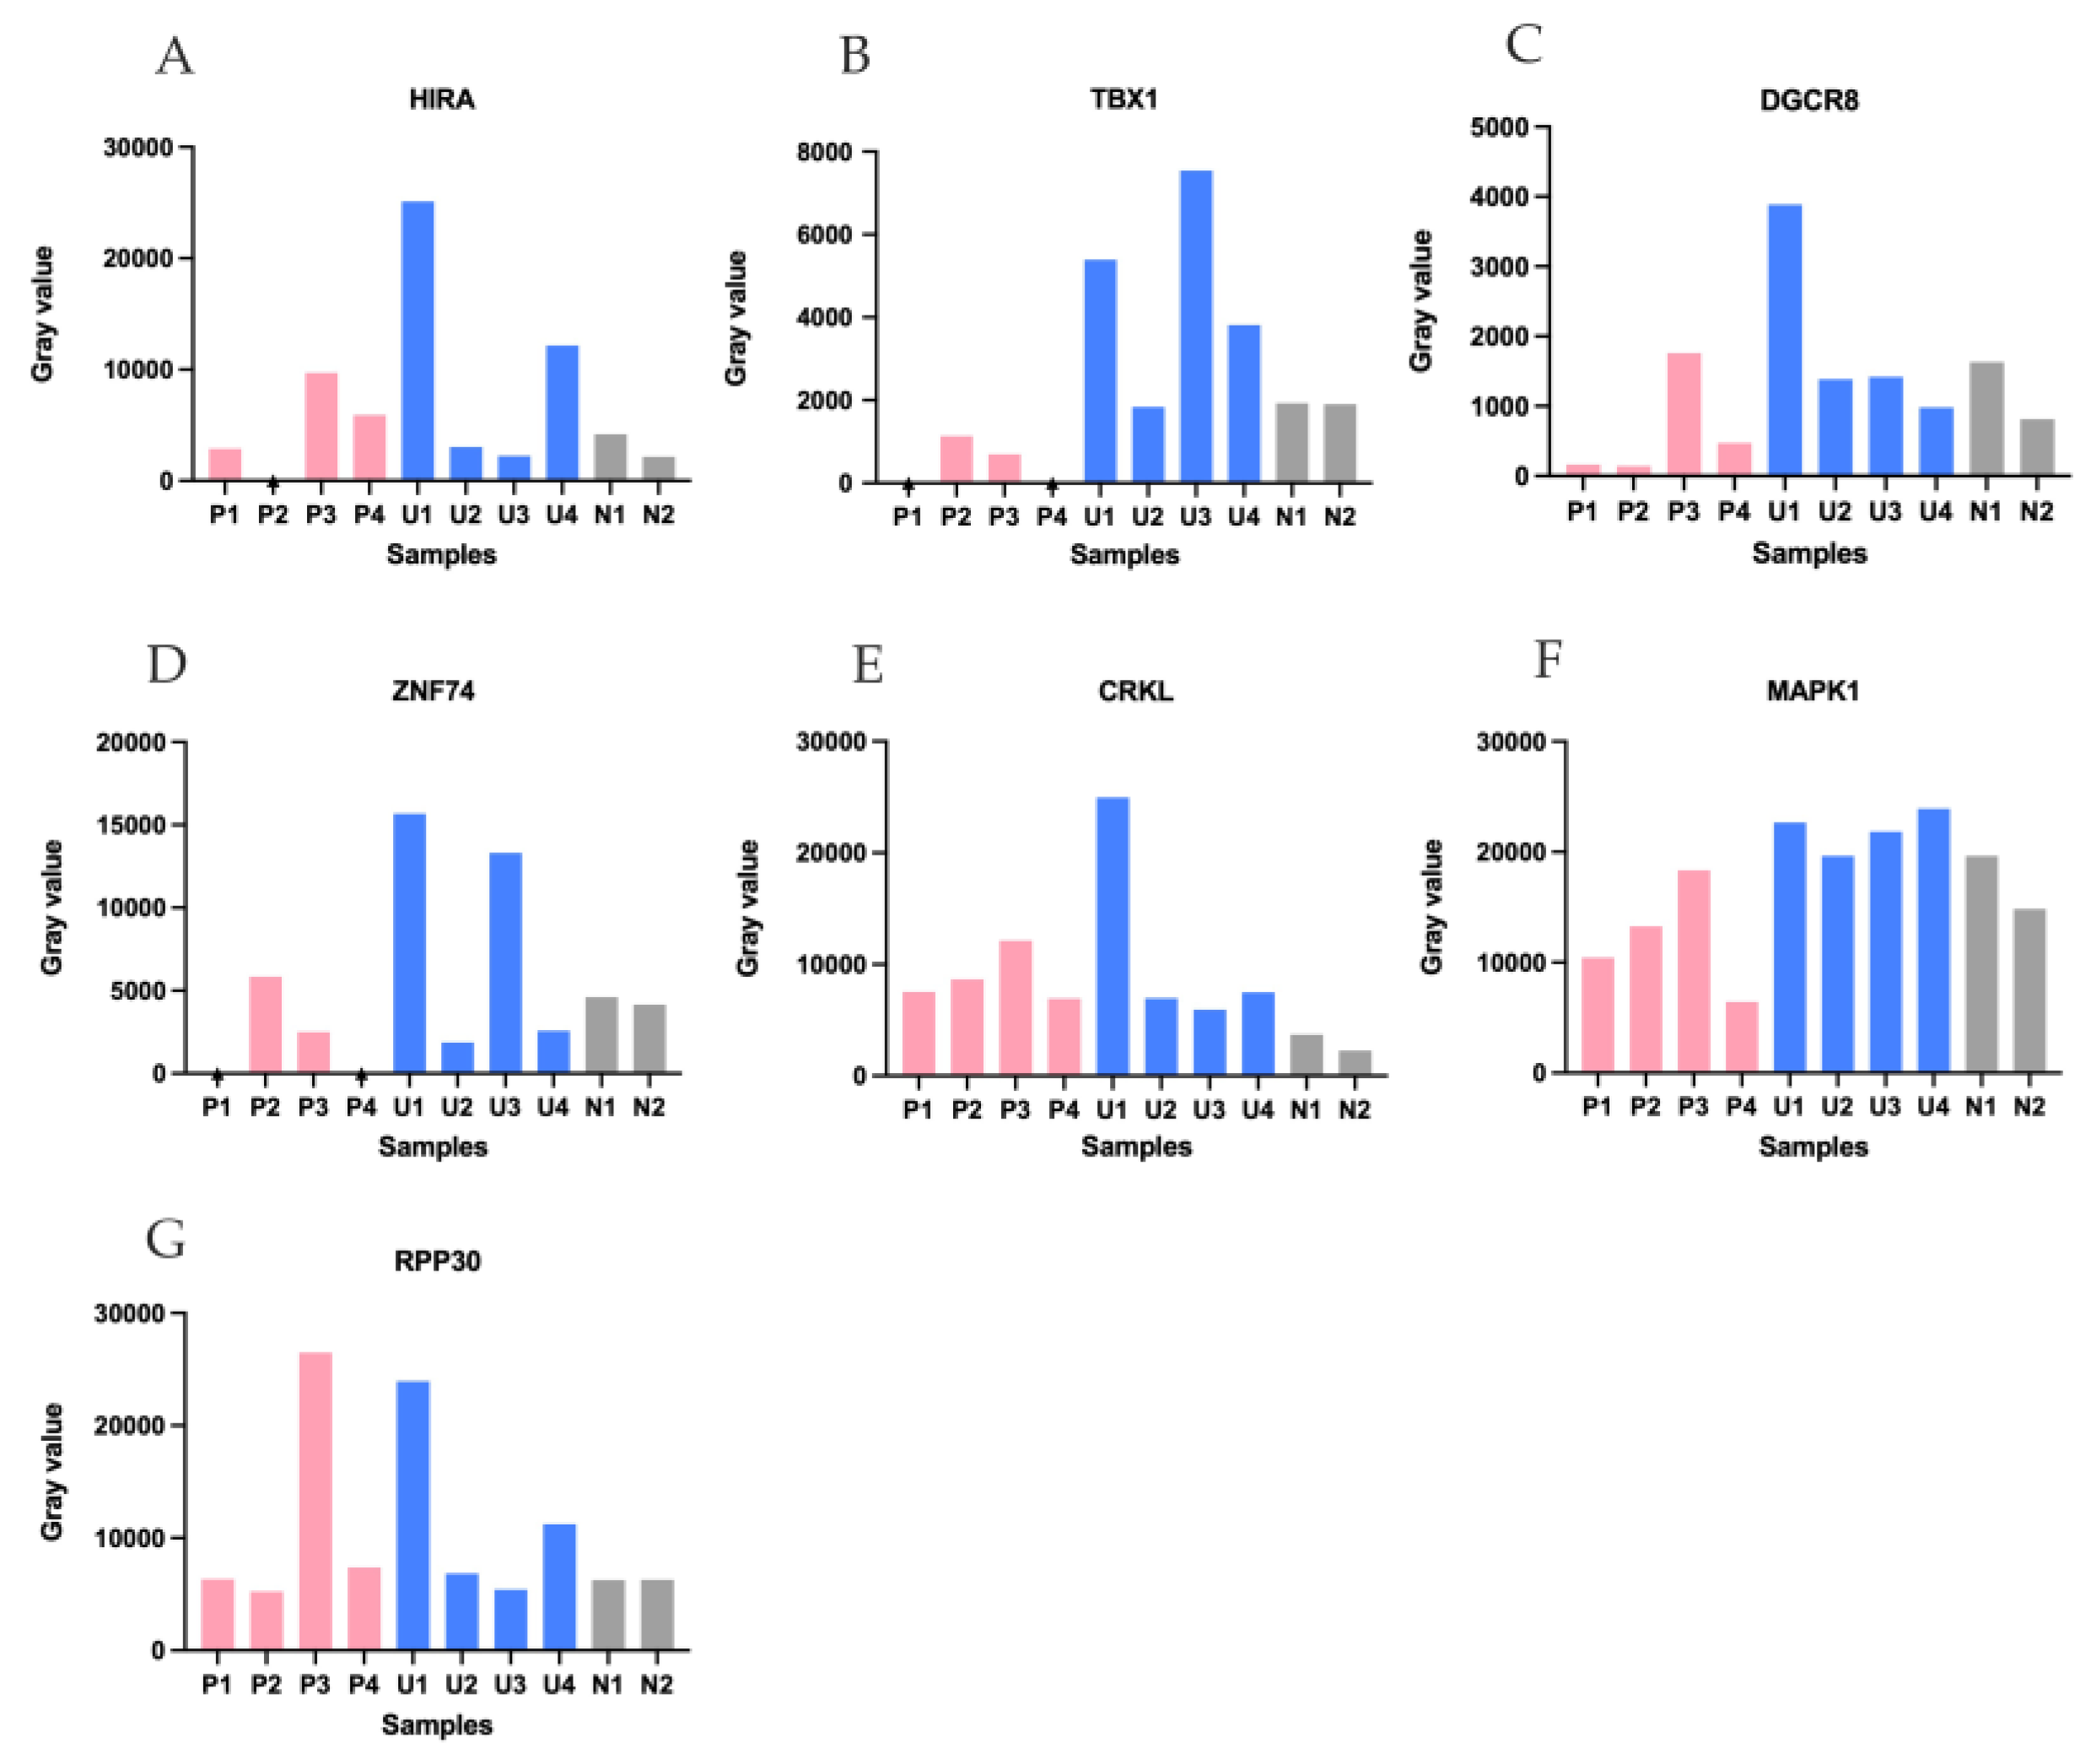
Figure 4.
Semi-quantitative heatmap of normalized PCR band intensities for 22q11.2 targets (HIRA–MAPK1); RPP30 (10q23) shown as an external reference. For each target, values were normalized to the mean of the two controls (N1, N2). The color scale (white to blue) indicates increasing band strength; numbers inside the cells are the normalized values. Interpretation rule: 0.00 = deletion (no detectable band); <0.60 = reduced signal. Red downward triangles mark cells <0.60. Deletions (0.00): P1 TBX1, ZNF74; P2 HIRA; P4 TBX1, ZNF74. Reductions (<0.60): P1 DGCR8; P2 TBX1, DGCR8; P3 TBX1, ZNF74; P4 DGCR8, MAPK1; U2 ZNF74; U4 ZNF74. RPP30 normal values alongside reduced 22q11.2 signals support a locus-specific reduction rather than a global PCR failure.
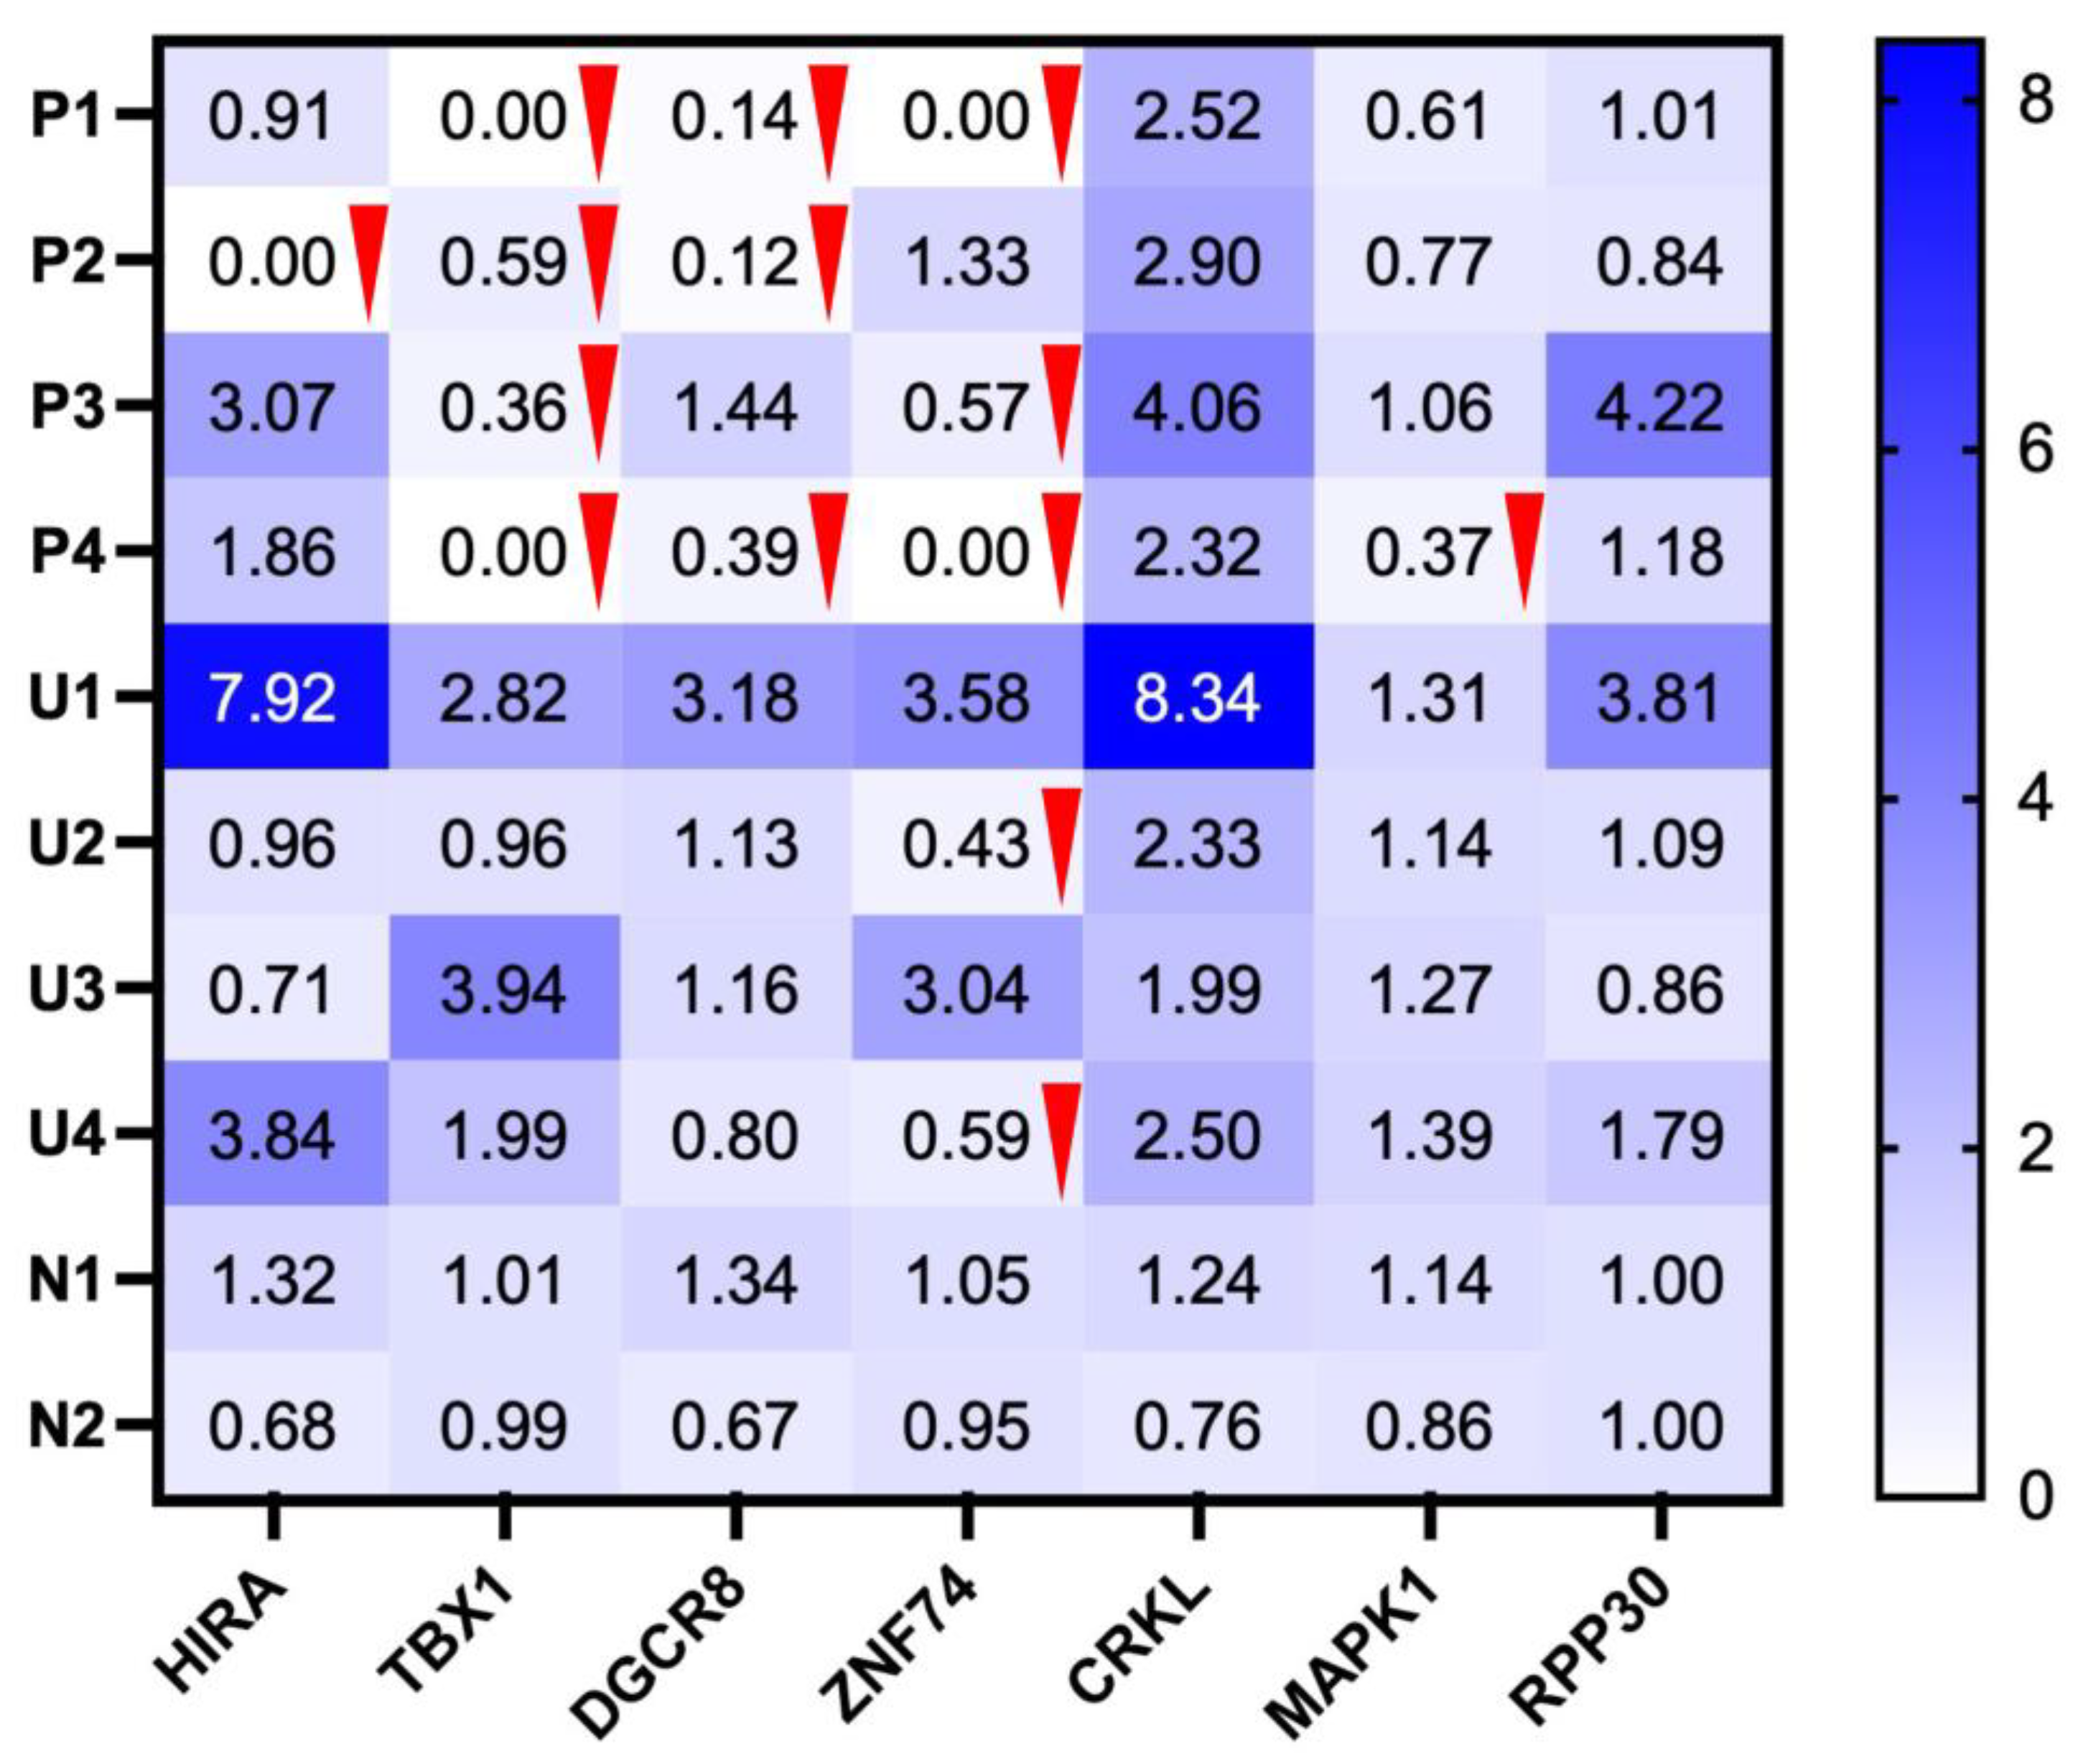

Table 1.
Clinical overview of samples used for 22q11.2 deletion validation.
| Patients | CHD | Other Phenotypes | Genotypes | Methods of Analysis Methods | Samples Types | Timing of Sample Collection |
|---|---|---|---|---|---|---|
| P1 | TOF with PA and MAPCA | Micrognathia, hooded eyelid, bulbous nose, high arch palate | 22q11.2 deletion |
Karyotyping; FISH |
Peripheral blood | 1 year and 8 months |
| P2 | TOF with PA and MAPCA | Unknown | 22q11.2 deletion |
Karyotyping; FISH |
Peripheral blood | 5 years old |
| P3 | TOF with PA and MAPCA | Unknown | 22q11.2 deletion |
Karyotyping; FISH |
Peripheral blood | 3 years old |
| P4 | TOF with PS, RAA, and abnormal origin of left subclavian artery |
Bilateral low-set ears, bulbous nose, smooth philtrum, micrognathia, incomplete cleft of the secondary palate | 22q11.2 deletion |
Karyotyping; BOBS; Autopsy |
Umbilical cord blood | 20+2 weeks of gestation; TOP |
| U1 | DORV with PA and subaortic VSD and RAA with mirror branching and bilateral SVC and SUA | Bilateral low-set ears, rocker-bottom feet | 46, XY | Karyotyping; Autopsy | Chorionic villi (placenta from a hysterectomy performed for placenta accreta) | 20+2 weeks of gestation; TOP |
| U2 | RAA + L-sided DA, suspected DAA | Small thymus | 46, XY; No deletions | Karyotyping; BOBS | Amniotic fluid (amniocentesis) | 20 weeks of gestation |
| U3 | Preductal coarctation of the aorta |
Hydrops fetalis with diffuse edema, CH, bilateral PE, ascites, and pericardial effusion, lung lobation defect, hypoplastic thymus, single palmar crease, SUA |
45,X | Karyotyping; Autopsy |
Amniotic fluid (amniocentesis) | 19 weeks of gestation; TOP |
| U4 | DORV with overriding aorta and VSD; PA from RV; levocardia |
Bilateral ventriculomegaly, dangling choroid plexus | 46, XX; No deletions | Karyotyping; BOBS | Amniotic fluid (amniocentesis) | 15 weeks |
Abbreviations: BOBS, BACs-on-Beads; CH, Cystic Hygroma; CHD, Congenital Heart Defects; DA, Ductus Arteriosus; DAA, Double Aortic Arch; DORV, Double Outlet Right Ventricle; FISH, Fluorescence In Situ Hybridization; MAPCA, Major Aortopulmonary Collateral Arteries; PA, Pulmonary Atresia; PE, Pleural Effusion; PS, Pulmonary Stenosis; RAA, Right Aortic Arch; RV, Right Ventricle; SUA, Single Umbilical Artery; SVC, Superior Vena Cava; TOF, Tetralogy of Fallot; TOP, Termination of Pregnancy; VSD, Ventricular Septal Defect.3.2. Primers Sequences.
Table 2.
Primer sequences and genomic coordinates for targets in the 22q11.2 region;RPP30(chr10q23) serves as the reference. (GRCh38/hg38, verified via UCSC BLAT).
Table 2.
Primer sequences and genomic coordinates for targets in the 22q11.2 region;RPP30(chr10q23) serves as the reference. (GRCh38/hg38, verified via UCSC BLAT).
| Region | Sequence Name | Sequence (5’-3’) | Location (chr:start–end,GRCh38) | Product Size (bp) |
|---|---|---|---|---|
| LCR22 A-B | HIRA-F | 5’-GCTTTGTCAGGCGTGTAGGAA-3’ | 19401072-19401092 | 128 |
| HIRA-R | 5’-CGATCTACTGATGCTGCCGTC-3 | 19400965-19400985 | ||
| TBX1-F | 5’-TGAAGAAGAACGCGAAGGTGG-3’ | 19761172-19761192 | 105 | |
| TBX1-R | 5’-CGGCCTTGGTGACGATCAT-3’ | 19761257-19761275 | ||
| DGCR8-F | 5’-ACTGACAATTTGGAGCTAGATGAAG-3’ | 20086579-20086603 | 79 | |
| DGCR8-R | 5’-CATCCACTCTGTCTCTCTGAACG-3’ | 20086635-20086657 | ||
| LCR22 B-C | ZNF74-F | 5’-TGGCCTCCTGCTTCTTTCTTC-3’ | 20395048-20395068 | 102 |
| ZNF74-R | 5’-TCAGACACTCCAATTCATGACGA-3’ | 20395127-20395149 | ||
| LCR22 C-D | CRKL-F | 5’-GCCTGAAGAACAGTGGTGGAG-3’ | 20933932-20933952 | 115 |
| CRKL-R | 5’-CCTATTTCCATGCTTTCCGTGTG-3’ | 20934024-20934046 | ||
| LCR22 D-E | MAPK1-F | 5’-AGGGTTCCTGACAGAATATGTGG-3’ | 21799056-21799078 | 85 |
| MAPK1-R | 5’-TGCAAACTTCATCCTTACCTTGG-3’ | 21798994-21799016 | ||
| Reference gene (Chr 10) |
RPP30-F | 5’-TCTGCGCGGACTTGTGGA-3’ | 90872037-90872054 | 125 |
| RPP30-R | 5’-GACCGAGACCCATCAGGAAATA-3’ | 90872140-90872161 |
Disclaimer/Publisher’s Note: The statements, opinions and data contained in all publications are solely those of the individual author(s) and contributor(s) and not of MDPI and/or the editor(s). MDPI and/or the editor(s) disclaim responsibility for any injury to people or property resulting from any ideas, methods, instructions or products referred to in the content. |
© 2025 by the authors. Licensee MDPI, Basel, Switzerland. This article is an open access article distributed under the terms and conditions of the Creative Commons Attribution (CC BY) license (http://creativecommons.org/licenses/by/4.0/).
Copyright: This open access article is published under a Creative Commons CC BY 4.0 license, which permit the free download, distribution, and reuse, provided that the author and preprint are cited in any reuse.


