Introduction
In the high-stakes world of the operating room (OR), precision reigns, and uniformity is the law. Staff wear identical scrubs, sterile gowns, facemasks, protective glasses, and hair covers.
While essential for sterility and patient safety, this uniformity transforms colleagues into an army of anonymous professionals.
Much like Tarantino’s colour-coded criminals, OR staff don’t choose their colours—they are assigned them [
1]. Mr Blue or Mrs Green vanish into their mandated OR gowns.
Socks, however, are where personality sneaks in.
In Dutch ORs, socks and clogs are the only permitted forms of personal expression. In the US (and on every medical drama), personalised scrub caps flourish—from cartoons to superheroes to embroidered nicknames. Across most of Europe, hospitals stick to standard-issue caps [
2].
To date, the literature contains only one anecdotal account of sock choices: age and colour among a dozen surgeons [
3].
This study explores whether socks can serve as markers of identity recognition and behavioural expression in the strictly standardised environment of the OR.
Inspired by criminal profiling frameworks, we applied a sock profiling approach to investigate whether sock choices reflect demographic traits, visual characteristics, and behavioural tendencies [
4].
Methods
This study is reported in accordance with the STROBE (Strengthening the Reporting of Observational Studies in Epidemiology) guidelines [
5].
Study Design
A multicentre cross-sectional survey
Setting
Data were collected from hospitals across the Netherlands during May 2025.
Recruitment and Participants
In each hospital, a designated “sock scout” — the local lead for study inclusion — affixed a study recruitment poster with a QR code in the OR complex and encouraged staff to participate.
Eligible participants included all OR personnel aged 18 years or older who agreed to provide demographic data and complete a short online survey.
Profiling
We adapted the six-step criminal behavioural profiling model by Douglas et al. to construct profiles of sock-related expression among operating room staff [
4].
●Demographics
We collected data on age, gender, professional role (doctors, nurses, medical students and support services), hospital type (academic/teaching, general, private), shoe size, and generational cohorts: Boomers (born 1946–1964), Generation X (1965–1980), Millennials (1981–1996), or Generation Z (1997–2012) [
6].
●Sock Characteristics
Respondents reported on the style and design of the socks they were wearing at the OR during the survey (sock age, height, colour, and sock style), as well as general usage patterns such as the number of socks owned (“drawer volume”) and the monthly frequency of wearing clean socks.
►Decision Process Model
Socks were classified using the SCALPEL-sock score (0 to 6 points) by the participants on the OR.
Simple Colour: boring, one colour 0
ALright: vibrant colour(s) or minimal patterns 2
Pristine: striped or checkered or dotted or creative patterns 4
ELite: exclusive/legendary or top-tier thematic designs 6
Higher scores denote socks showing greater visual flair and thematic creativity.
This novel scoring system shows strong face validity as a measure of sock-based self-expression. Its categories reflect commonly observed stylistic variations and align with the aim of exploring individuality in uniform OR environments [
7]. Dominant sock colour was categorised using the “Eleven Basic Colour Terms” [
8].
A multiple-choice question assessed attitudes towards socks: How would you describe the way your socks express you in the OR?
Functional—socks are just socks
Comfort—neutral professionalism
Expression—playful identity
Signature—a unique statement
For analysis, the first two responses were grouped as Functional and the latter two as Expressive.
Participants could choose one of three responses when confronted with an odd sock: save for reunion, discard, or mix and match.
Sock height was categorised into 4 levels: bare feet, no show, around ankle to mid-calf, and above
►Assessment/Statistical Analysis
All statistical analyses were performed using Stata v14.0. Descriptive statistics (means, SDs, medians, ranges, proportions) were calculated.
Group differences were assessed using Welch’s t-test or Mann–Whitney U test, depending on distribution.
Multiple-group comparisons used the Kruskal–Wallis test. When significant, post hoc pairwise comparisons were conducted manually using Mann–Whitney U tests, the Bonferroni correction was applied to adjust for multiple testing.
Categorical associations were tested using chi-squared tests. Spearman’s correlation assessed numerical associations. Logistic regression was used for binary outcomes, reporting odds ratios with 95% confidence intervals. A two-tailed p-value < 0.05 was considered significant unless stated otherwise.
►Sock Profile
We constructed archetypal profiles by combining demographic, sock, and behavioural data. These were not exact representations but stylised composites designed to illustrate recurring patterns.
►Investigation
Analyses focussed on variation by professional role, gender, and generation. We compared subgroups to explore differences in sock-related expression and behavioural variation.
►Apprehension
Profiles were identified through comparative analysis, highlighting both typical and atypical combinations—outliers included. While no arrests were made in the literal sense, sock profiling revealed distinct stylistic phenotypes within the sterile professional setting of the OR.
Ethical Considerations
The local ethics board in Zwolle confirmed no ethical approval was required.
Participants provided digital consent, all data were anonymised
Results
Study Participants
Of the 96 invited hospitals, 42 participated (response rate 43.8%, teaching/academic n=20, general n=19, private n=3), contributing 935 participants (
Table 1). The sample consisted of 31.9% males, 67.4% females, 25.2% doctors, 68.3% nurses, 2.8% medical student and 3.7% support staff. The top ten centres accounted for 60.5% of participants. The mean age was 42.2 years (SD±10.8), with male respondents being older than females (45.4 vs. 40.7 years, p < 0.05); the average shoe size was EU 40.6 (SD±2.7), UK 7. Participants belonged to four generational cohorts: Boomers (n=80), Gen X (n=304), Millennials (n=404) and Gen Z (n=141).
Sock Characteristics
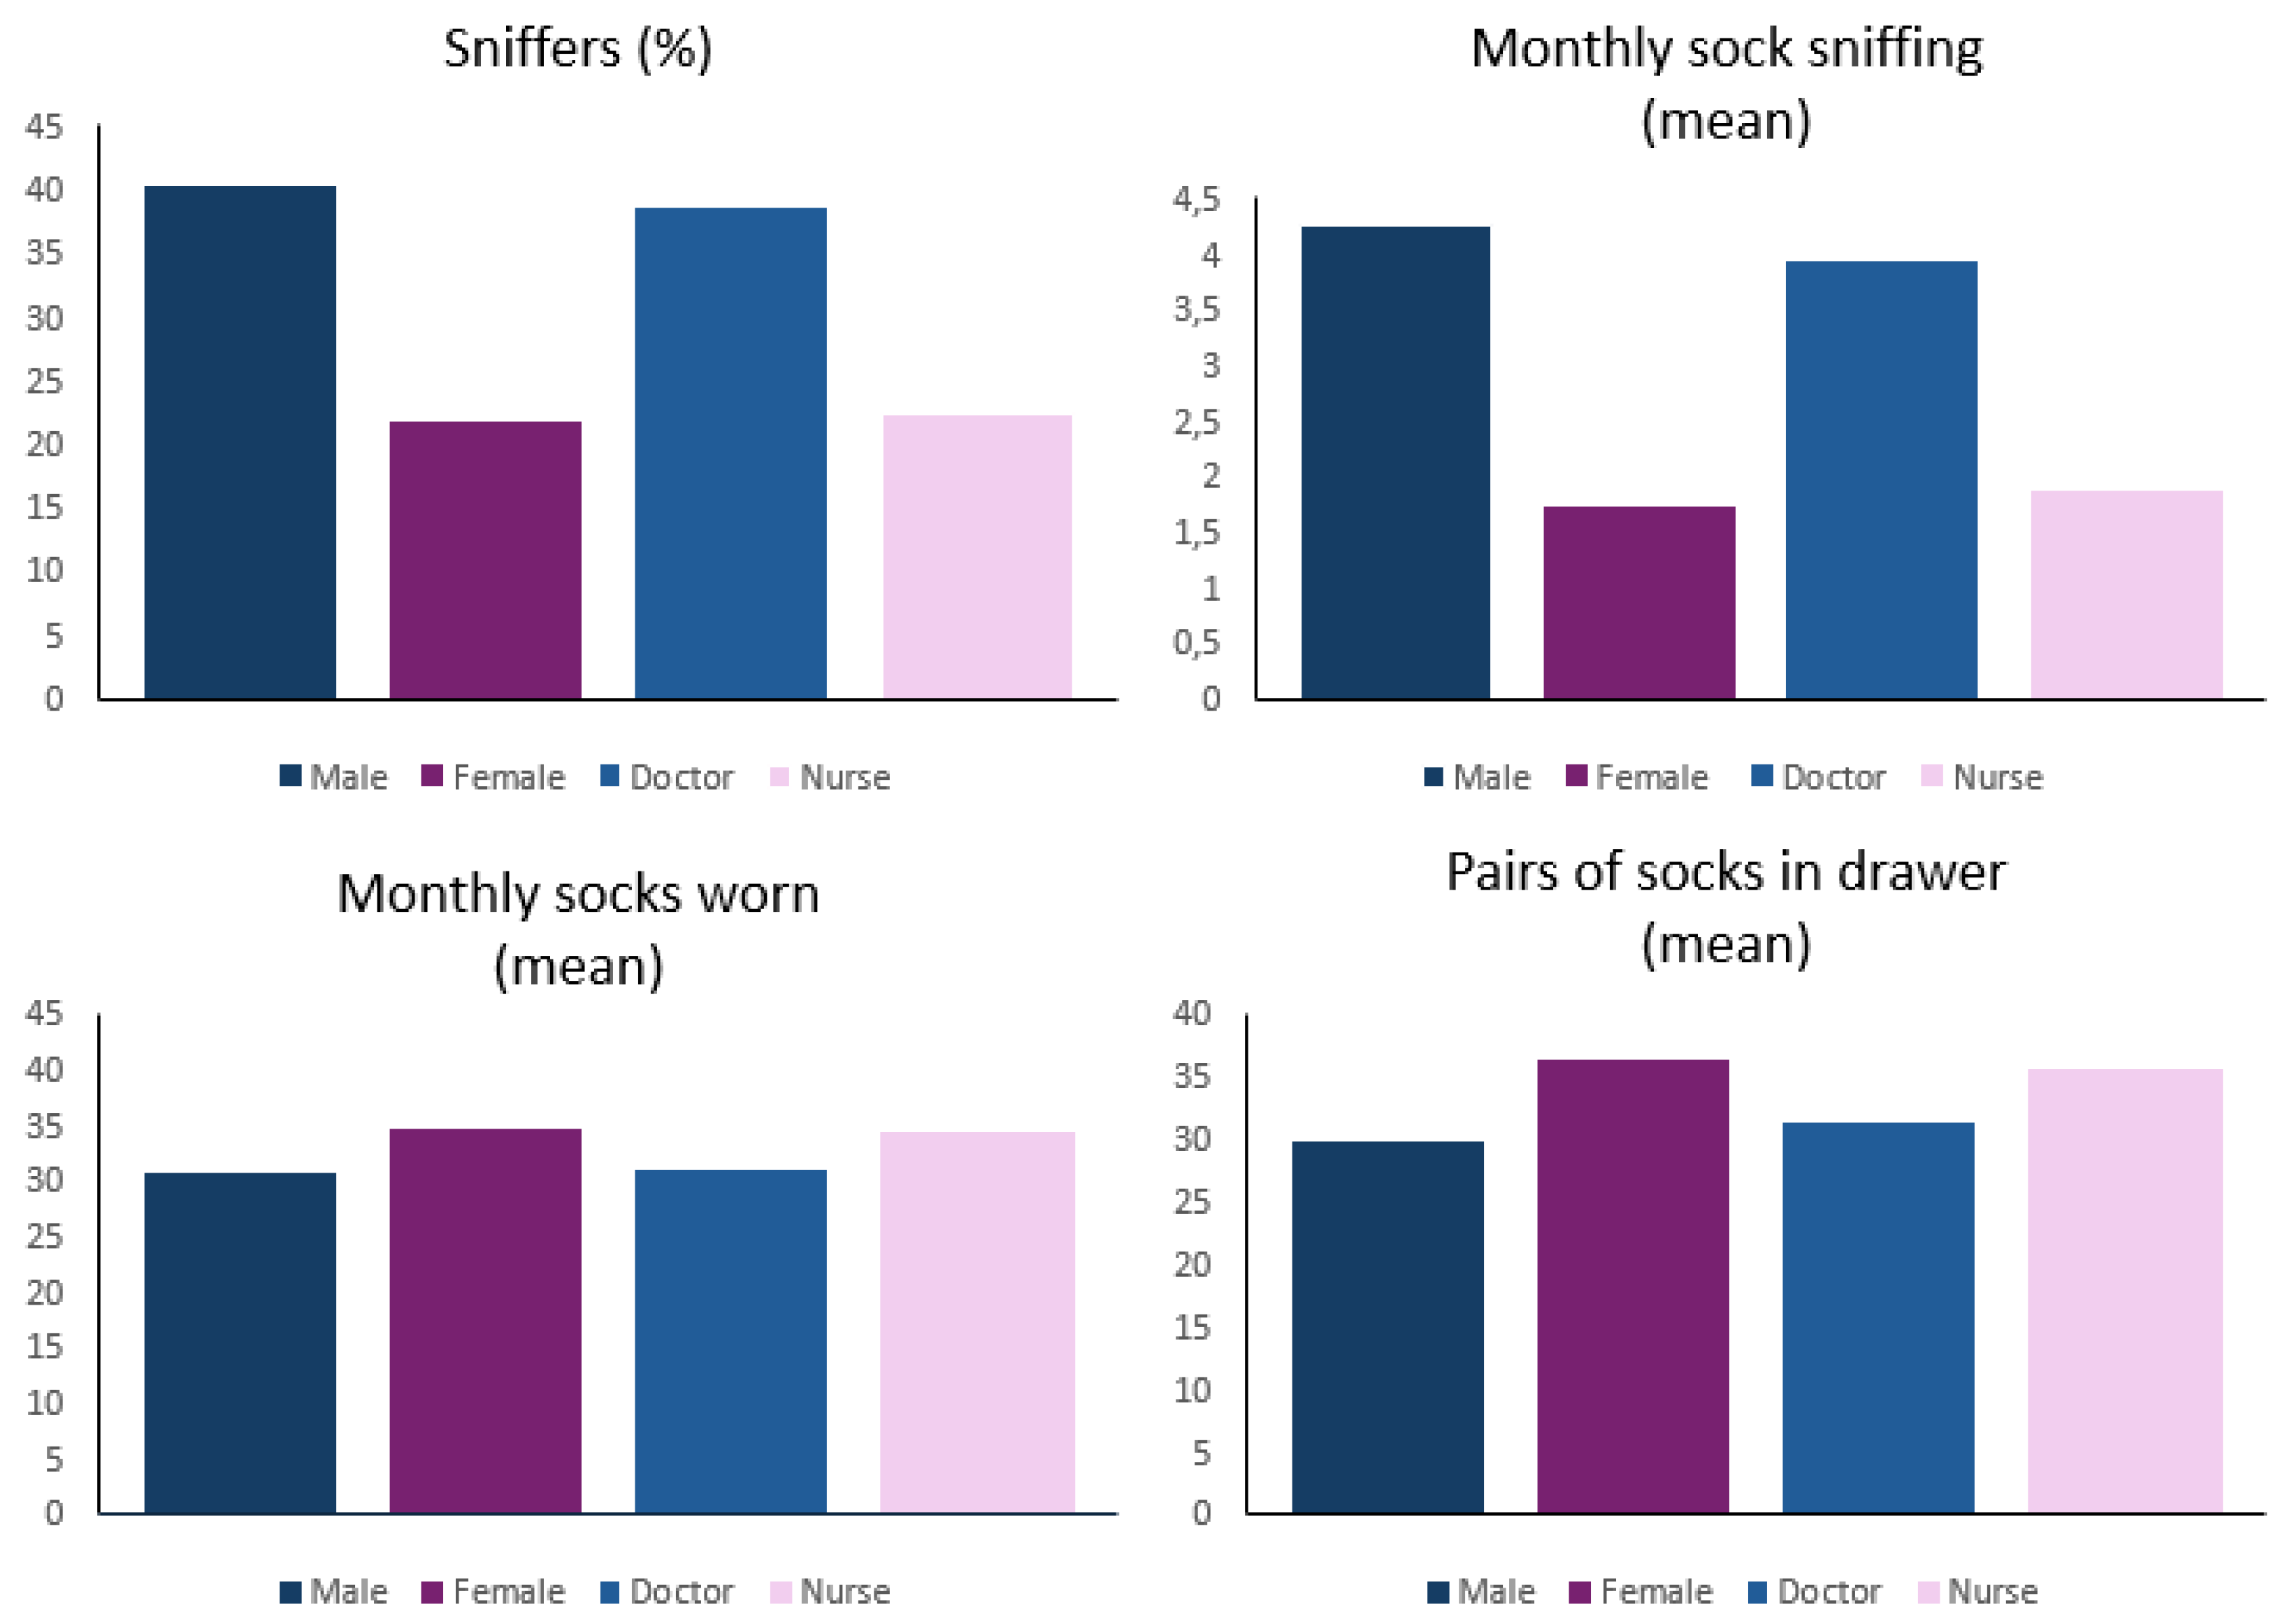
OR staff owned an average of 34.5 pairs of socks and wore 33.4 clean pairs per month. Socks younger than one year were most common among women and nurses (both 42.5%), compared to 30.3% of men and 28.8% of doctors. Boomers had the smallest proportion of wearing socks less than a year old (26.6%).
Bare feet in clogs were rare overall (3.0%) but more common among orthopaedic surgeons (13.0%) and male doctors (10.5%), and nearly absent among nurses (0.5%) —with zero reports among male nurses. Most participants wore ankle-to-mid-calf socks (77.7%).
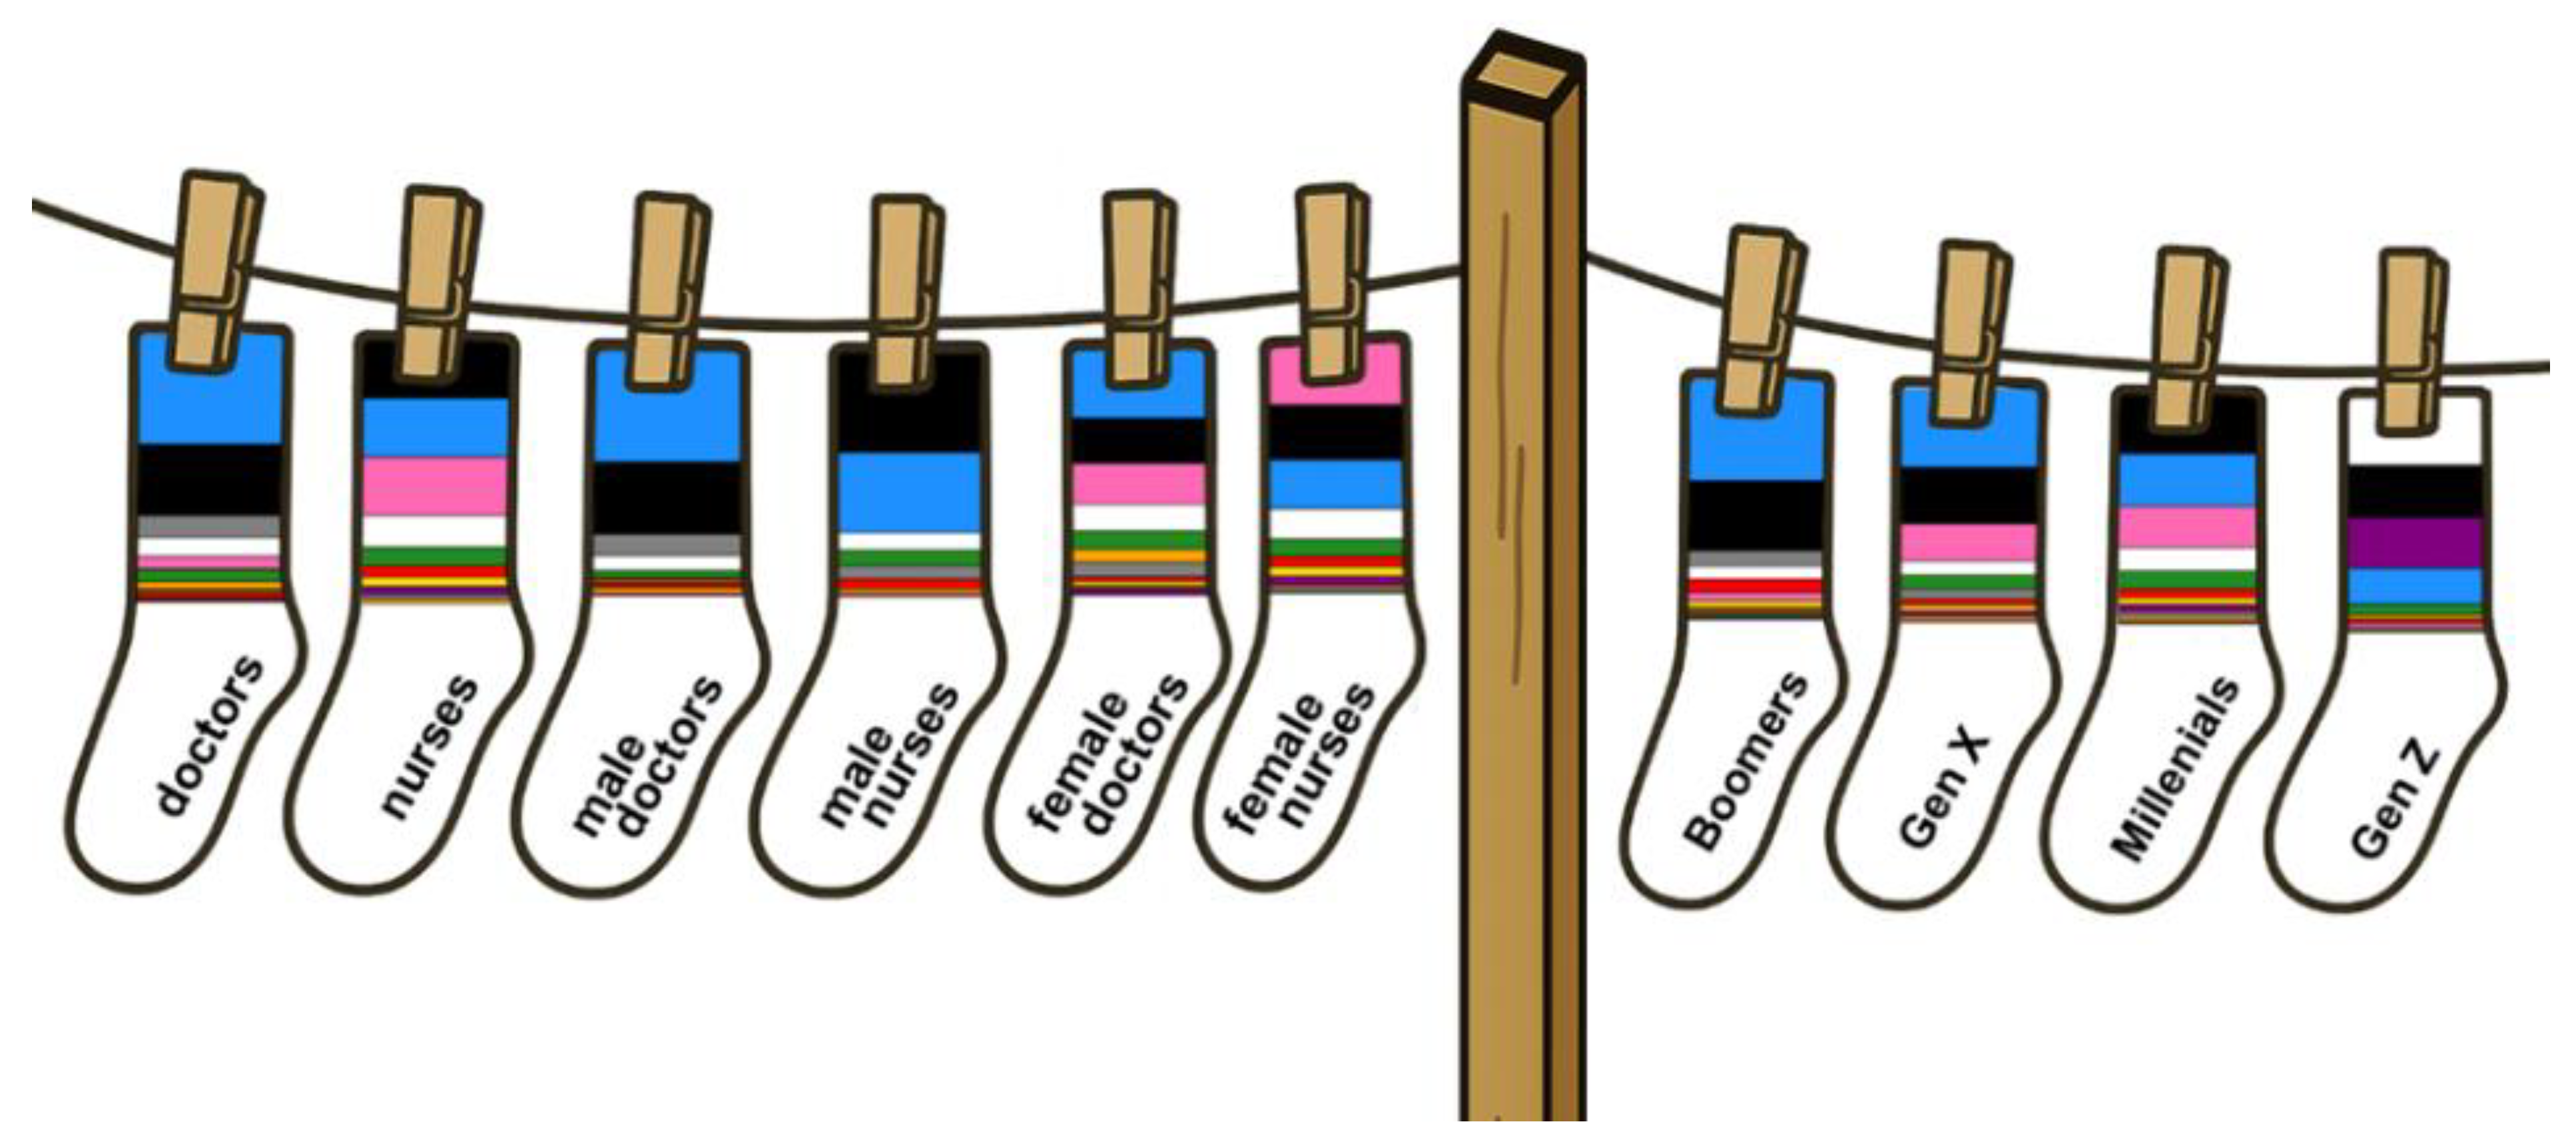
Blue (26.1%) and black (25.2%) socks dominated. Pink socks were popular among female staff (16.2%) and white among Gen Z (30.5%);
Figure 1. Orthopaedic surgeons distinctly preferred blue socks (46.0%).
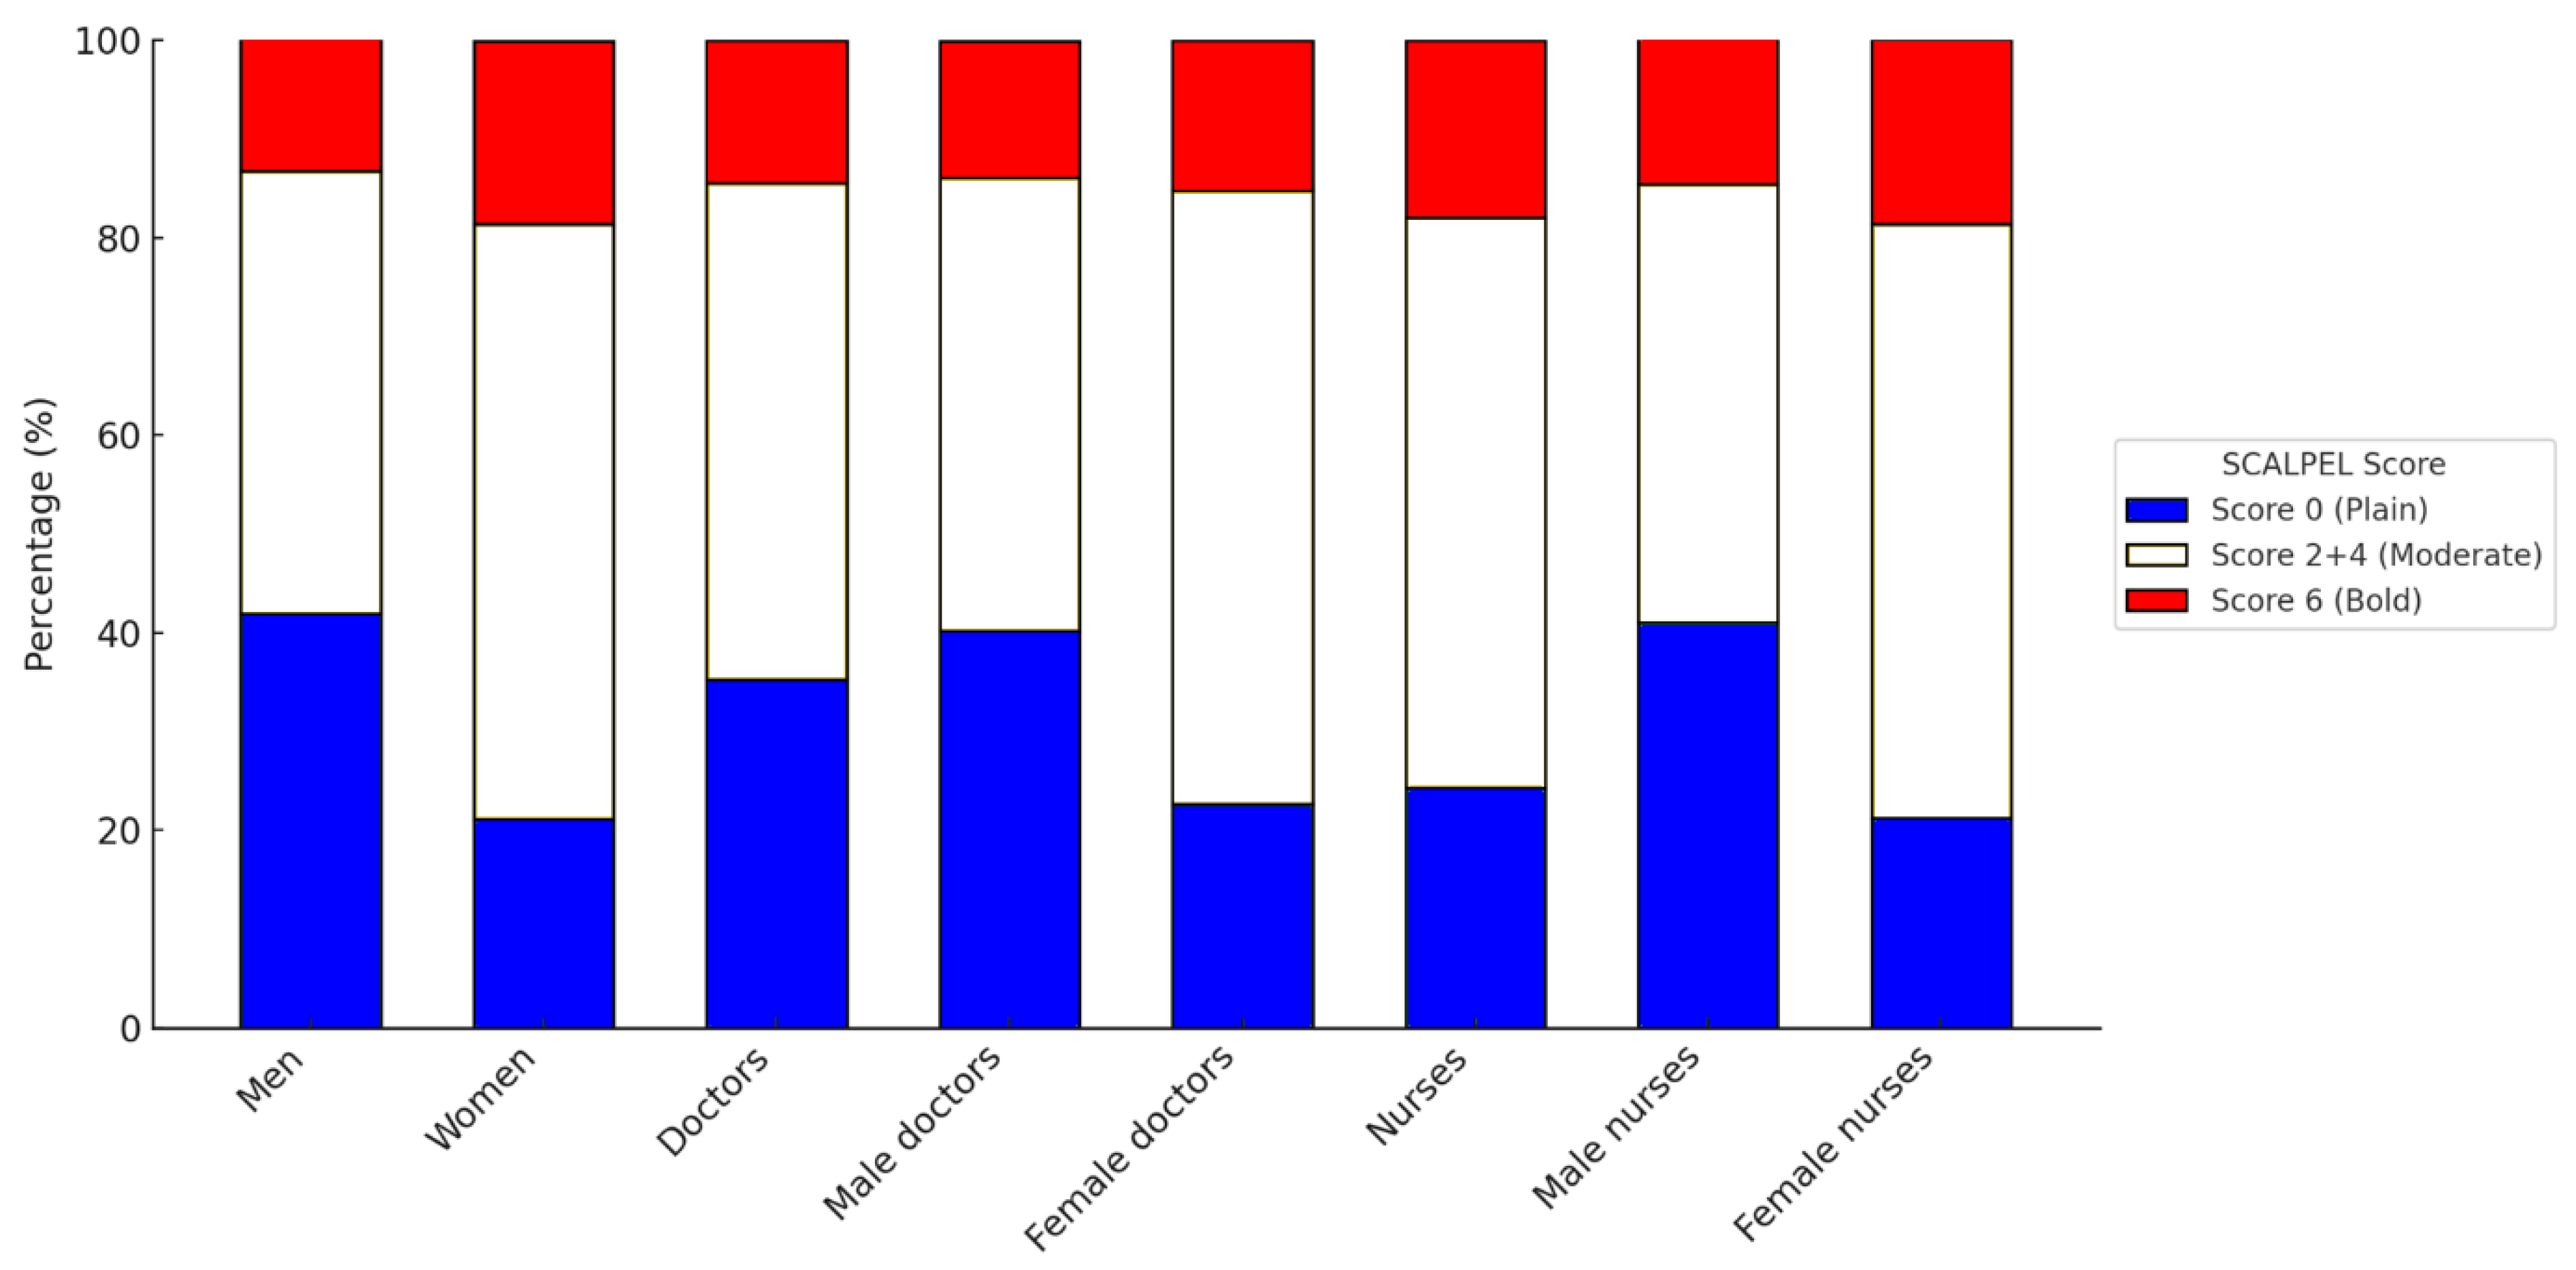
In terms of style the median SCALPEL-Sock Score was 4. Plain socks were more common among men (score 0, 41.9% vs. women 21.1%), while women wore a greater portion of bold and elite-rated socks (score 6, women 18.5% vs. men 13.9%) (
Figure 2). Nurses had significantly higher scores than doctors (p =0.01).
Orthopaedic Surgeons vs. Anaesthesiologists
Anaesthesiologists had more than four times the odds of adopting an expressive sock attitude than the practical orthopaedic surgeons (71.4% vs 38.1%, OR = 4.05, 95% CI: 1.75–9.39, p = 0.004). This effect was not reflected in a significant difference in SCALPEL-scores.
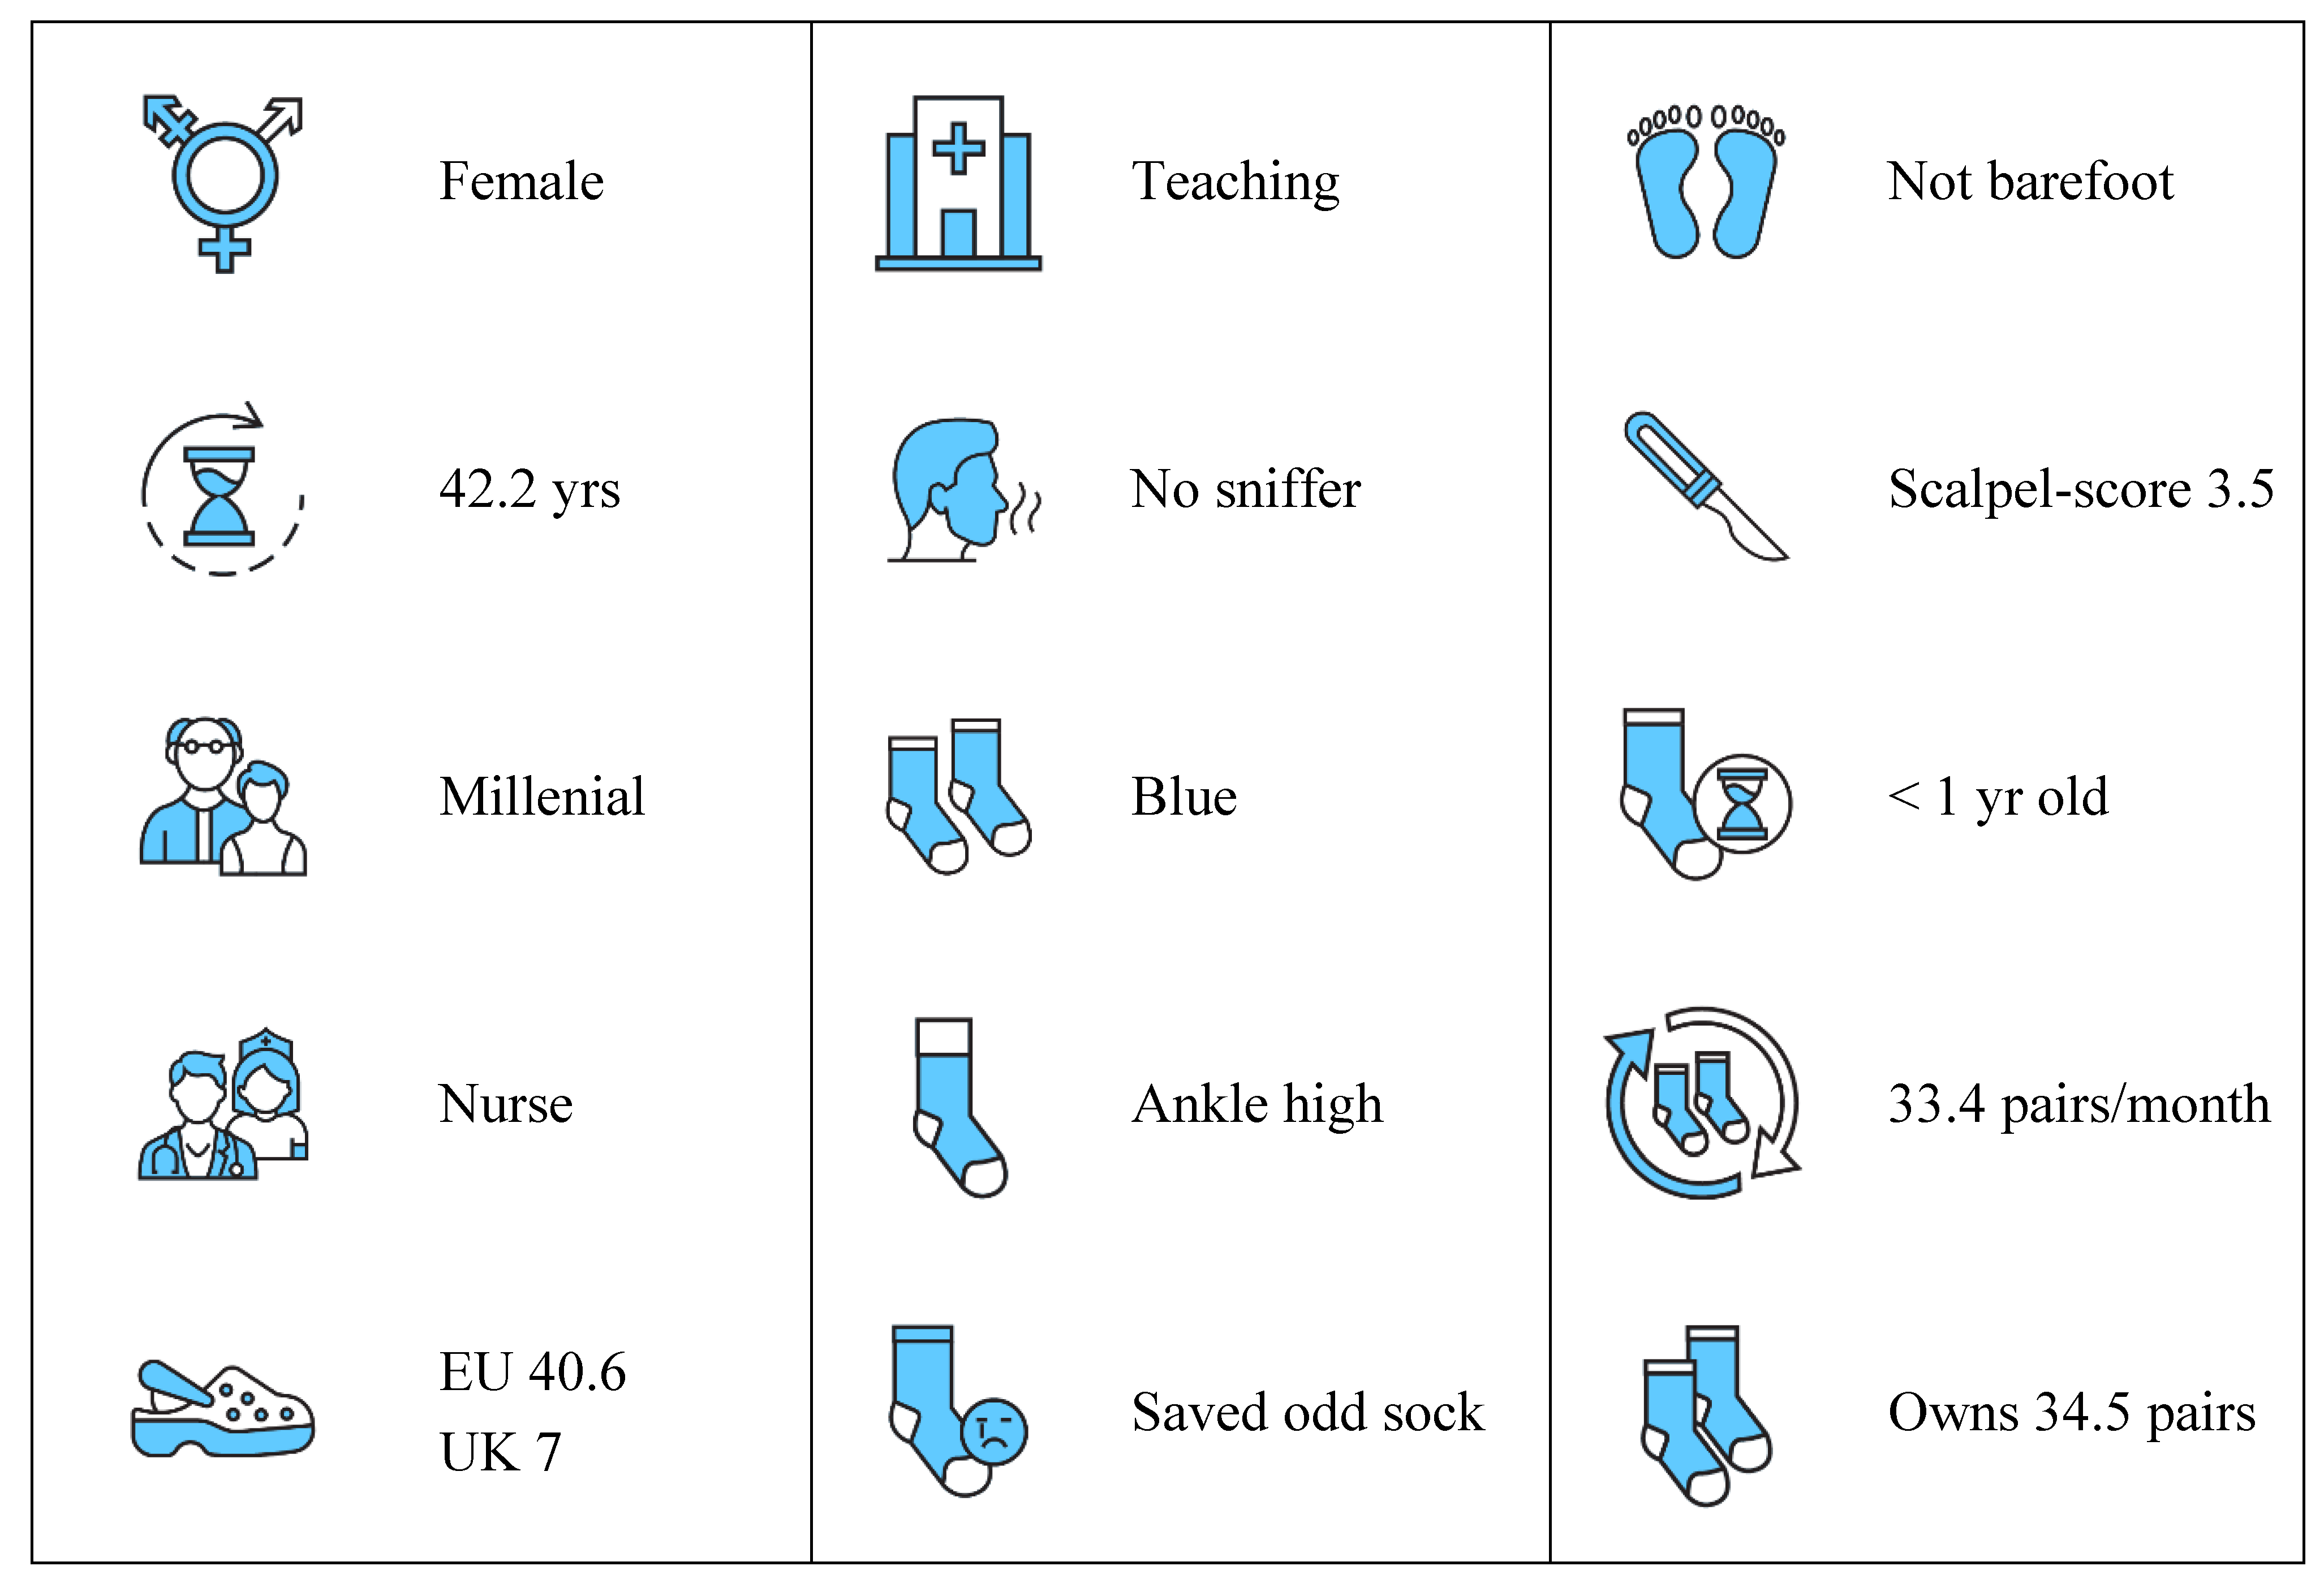
Meet the ORdinary
Blending “Operating Room” and “ordinary” — with a nod to the now-retired term “orderly” — this term profiles the archetypical staff member, based on mean values and modal responses: a 42-year-old millennial female working in a teaching hospital — wearing ankle-high, blue socks, less than a year old, size EU 40.6, freshly changed, never sniffed, owning a drawer stocked with 34.5 pairs, and faithful that odd socks will once again find their match (
Figure 4). She might be standing right behind you.
How ORdinary are you? (score yourself: Appendix A)
Discussion
Summary of Main Findings
Our study shows that socks in the operating room are more than mere footwear: they reflect age, gender, style, behaviour, professional role, and even olfactory habits. They remain a rare outlet for individual expression in an increasingly standardised environment.
Key Findings
Sock style ranged from dull conformity to exuberant flair. Both self-reports (theory) and SCALPEL scores (reality) revealed greater and consistent stylistic boldness among women and nurses. Generational differences emerged in philosophy, not in practice — suggesting that younger staff may aspire to individuality, but did not express this visibly.
Blue and black socks dominated, making up over half of all pairs. Female nurses were far bolder than female doctors, embracing pink, purple, and yellow. Male staff—doctors and nurses alike—seemed to prefer uniformity, with plain blue and black socks marking their expressive ceiling. Over 40% of male nurses wore only plain socks, nearly twice the rate of their female colleagues.
Going barefoot—particularly among male doctors— raises both eyebrows and questions. Whether this was rebellion, ventilation or poor laundry planning is anyone’s guess. Nurses remained almost universally socked, with male nurses upholding full compliance. For orthopaedic surgeons— often ankle-deep in irrigation fluids—going barefoot in clogs may simply be a survival strategy.
Doctors wore older socks than nurses—whether this reflects practical laziness or a blind spot in the morning routine remains uncertain. Boomers were least likely to wear newer socks. Perhaps they were unwilling to abandon socks whose elastic has surrendered, but not yet retired.
The odd sock — long a subject of scientific enquiry, and cultural reflection —was explicitly addressed [
9,
10]. We expected Boomers to discard and Gen Z to embrace more artistic mixing strategies. But sentiment triumphed: most participants defied the odds by saving the single sad sock in the hope of reunion.
Then there comes the important question of sock sniffing. Socks rank among the most frequently sniffed garments [
11], their smell originates from bacterial sweat metabolism, producing volatile compounds also found in cheese [
12,
13]
.
Men—especially male doctors—showed clear preference for post hoc olfactory inspection, sniffing more than twice as often as women. Women, meanwhile, simply wore more clean socks per month: swap, don’t sniff.
Presumably undertaken off-duty and behind closed doors, the unexpectedly high frequency of self-sniffing—up to 180 times per month—may seem eccentric, or simply Proustian: the evocative power of scent to unlock vivid personal memories [
14].
Sock-sniffing may seem ceremonial, misplaced, or tragically ineffective as a hygienic check.
Yet it may serve a pragmatic role. In multi-cycle use, it becomes an olfactory triage tool —provided the fine line between prudent reuse and overambitious stretching is not crossed.
Perhaps the practice deserves not disdain but a quiet nod of respect — a balance between practicality and social survival. Ultimately, the sniff may say more about the sniffer than the sock.
Strengths and Limitations
To our knowledge this is the first multicentre study to explore sock behaviour in the operating theatre—a topic long overlooked, despite being quite literally under our noses. The sample was substantial (n = 935), including hospitals from across all regions of the Netherlands, including teaching, general, and private institutions. A broad range of OR staff roles was included, reflecting the multidisciplinary nature of surgical teams.
Several limitations should be acknowledged. Participation was voluntary, with a modest hospital response rate (43.8%), raising the possibility of selection bias.
The dominance of orthopaedic surgeons, among doctors, likely reflects our recruitment method: all sock scouts were orthopaedic staff members.
Cultural and sartorial norms around socks may differ internationally, limiting generalisability beyond Dutch hospitals
No control group or primary endpoint was set, precluding causal inference. As with all self-reported data, there’s a risk of bias, particularly social desirability bias and recall error.
Given the exploratory nature of this study and the number of tests performed, results should be interpreted with caution. Multiple testing increases the risk of type 1 error. We encourage readers to focus on effect sizes and consistent patterns rather than isolated statistical significance.
Comparison with Other Studies
Only one anecdotal previous study touched on sock style in the OR, noting that a dozen senior surgeons preferred colourful or humorous styles [
3]. Our study is the first to systematically examine sock choices across all OR staff with close to a thousand participants.
Orthopaedic surgeons have been shown to outperform anaesthetists in grip strength, intelligence and resilience to emotional exhaustion [
15,
16]. In our study, only differences in gender, age, and shoe size emerged—insufficient to further threaten the already-bruised anaesthetic ego. A result likely to be quietly celebrated in anaesthesiology departments this Christmas.
Anaesthetists were, however, far more likely than orthopaedic surgeons to report that socks served as a form of personal expression—a unique statement. Yet paradoxically, their actual SCALPEL scores—the visual boldness of the socks they wore—were no higher. A theoretical commitment not matched in practice. Another soft blow, perhaps to be discussed over coffee in the anaesthesiology lounge, somewhere beneath the mistletoe—while their orthopaedic colleagues remain scrubbed in.
Meaning of the Study/Implications
Despite surgical protocols and professional restraint, socks remain an important avenue for individual expression in an otherwise highly standardised environment.
Precisely because everything else is regulated, socks stand out.
Our findings highlight how, beneath sterile routines, subtle forms of personal flair persist—quietly challenging the myth of total conformity in the operating room.
Conclusions
In the highly standardised environment of the operating room, socks emerged as a subtle marker of personal expression.
Our findings show that even in a setting defined by conformity, this small detail slips quietly beneath the radar — warming not just feet, but identity.
Author Contributions
CV conceived the study. CV and IC contributed to the design, data interpretation, and writing of the article. IC and ME conducted the statistical analysis. The corresponding author (CV) attests that all authors meet authorship criteria and that no others meeting the criteria have been omitted.
Funding
No funding was received for this work.
Data Availability Statement
Data are available from the corresponding author upon reasonable request.
Acknowledgments
We thank all operating room staff who participated in this study. Special thanks go to Lucien Keijser —champion recruiter with 100 participants— through whom we extend our gratitude to all orthopaedic ‘sock scouts’ who enthusiastically facilitated inclusions. We are grateful to our colleagues across Dutch operating rooms who, quite literally, revealed their true colours. We also thank Paul Brand for his meticulous proofreading—and for spotting things we could no longer see. The authors acknowledge the contribution of ChatGPT (OpenAI) in refining language, exploring stylistic alternatives, displaying an unexpected passion for socks and a near-surgical precision in phrasing. The human authors retained full editorial control, including the firm rejection of its co-authorship ambitions. Final credit goes to Hans in ‘t Veen — without his inspiration, this paper would never have escaped the theatre of our imagination.
Conflicts of Interest
None declared— though the authors acknowledge having informally assessed colleagues based on their choice of socks in the operating theatre. To their knowledge, no careers were harmed. The senior author is an orthopaedic foot and ankle surgeon, which may account for both his fixation on socks and the suspiciously high number of orthopaedic participants—raising reasonable concerns about selection bias and thematic tunnel vision. Transparency: CV affirms that the manuscript is an honest, accurate, and transparent account of the study being reported; that no important aspects have been omitted; and that there are no discrepancies from the study as originally planned.
References
- Tarantino, Q. Reservoir Dogs. 1992.
- NIPCM. National Infection Prevention and Control Manual: Personal Protective Equipment (PPE). Accessed Jul 20, 2025.
- Rehman S, Cameron A, Beech AN. A Christmas “Sock Market” Analysis. Advances in Oral and Maxillofacial Surgery 2025 -09-01;19:100520. [CrossRef]
- Douglas JE, Ressler RK, Burgess AW et al. Criminal Profiling from Crime Scene Analysis. Behavioral Sciences & the Law 1986 -10-01;4(4):401. [CrossRef]
- von Elm E, Altman DG, Egger M, et al. The Strengthening the Reporting of Observational Studies in Epidemiology (STROBE) statement: Guidelines for reporting observational studies. J Clin Epidemiol 2008 -04;61(4):344–349. [CrossRef]
- Dimock, M. Defining generations: Where Millennials end and Generation Z begins. 2019 -01-17.
- Mokkink LB, Terwee CB, Patrick DL, et al. The COSMIN checklist for assessing the methodological quality of studies on measurement properties of health status measurement instruments: An international Delphi study. Qual Life Res 2010 May 1;19(4):539ߝ549. [CrossRef]
- Merrifield, W.R. Brent Berlin and Paul Kay, Basic color terms: Their universality and evolution. Berkeley and Los Angeles: The University of California Press, 1969. Pp. xi + 178. Journal of Linguistics 1971/09;7(2):259–268. [CrossRef]
- Barraclough J, Barraclough E. The Story of The Sad Single Sock.: CreateSpace Independent Publishing Platform; 2017.
- Soldenhoff, A. “Where Do All the Socks Go? The Mystery of the Missing Pairs”. 2023 -02-28.
- Schwambergová D, Třebická Fialová J, Havlíček J. Olfactory self-inspection: Own body odour provides cues to one’s health and hygiene status. Physiology & Behavior 2024 -03-01;275:114449. [CrossRef]
- Kanda F, Yagi E, Fukuda M, et al. Elucidation of chemical compounds responsible for foot malodour. Br J Dermatol 1990 -06;122(6):771–776. [CrossRef]
- Santamarina-García G, Amores G, Hernández I, et al. Relationship between the dynamics of volatile aroma compounds and microbial succession during the ripening of raw ewe milk-derived Idiazabal cheese. Curr Res Food Sci 2022 -12-22;6:100425. [CrossRef]
- Chu S, Downes JJ. Proust nose best: Odors are better cues of autobiographical memory. Mem Cognit 2002 -06;30(4):511–518. [CrossRef]
- Subramanian P, Kantharuban S, Subramanian V, et al. Orthopaedic surgeons: As strong as an ox and almost twice as clever? Multicentre prospective comparative study. BMJ 2011 -12-15;343:d7506. [CrossRef]
- Reynolds J, Wiekrykas B, Ramsey FV, et al. Physician Burnout and Associated Factors: Orthopaedics vs Anesthesia. Advances in Research 2019: 1–9. 5 September. [CrossRef]
|
Disclaimer/Publisher’s Note: The statements, opinions and data contained in all publications are solely those of the individual author(s) and contributor(s) and not of MDPI and/or the editor(s). MDPI and/or the editor(s) disclaim responsibility for any injury to people or property resulting from any ideas, methods, instructions or products referred to in the content. |
© 2025 by the authors. Licensee MDPI, Basel, Switzerland. This article is an open access article distributed under the terms and conditions of the Creative Commons Attribution (CC BY) license (https://creativecommons.org/licenses/by/4.0/).