Submitted:
27 November 2025
Posted:
01 December 2025
You are already at the latest version
Abstract
This paper introduces a similarity index aimed at modeling psychological well-being through a set-theoretic formalization of self-ideal alignment. Inspired by Tversky’s feature-based model of similarity, the proposed index quantifies the degree of overlap and divergence between the current self-perception and the ideal self, each represented as a vector of signed attributes. The formulation extends traditional approaches in Personal Construct Psychology by incorporating directional and magnitude-based comparisons across constructs, and its mathematical properties can be expressed within a fuzzy similarity space that ensures boundedness and internal coherence. Unlike standard correlational methods commonly used in psychological assessment, this model provides an alternative framework that allows for asymmetric weighting of discrepancies and non-linear representations of similarity. Developed within the WimpGrid formalism—a graph-theoretical extension of constructivist assessment—the index offers potential applications in clinical modeling, idiographic measurement, and the mathematical analysis of dynamic self-concept systems. We discuss its relevance as a generalizable tool for quantitative psychology, and its potential for integration into computational models of personality and self-organization.
Keywords:
psychological well-being
; Personal Construct Psychology
; Weigthed Implication Grid (WimpGrid)
; feature-based model
; mathematical modeling
; quantitative psychology
MSC: 91E45; 91E10
1. Introduction
The quantification of human subjectivity remains one of the paramount challenges in psychological science. While psychometrics has developed sophisticated tools for measuring stable traits, modeling the dynamic and idiographic nature of psychological change requires a formal language capable of capturing the complex interplay of personal meanings. Traditional measurement paradigms often sacrifice individual specificity for nomothetic generalizability, creating a methodological gap in the study of personal transformation processes. This paper introduces a mathematically grounded framework to address this gap, proposing a index designed to quantify psychological well-being from a constructivist perspective. By integrating principles from Personal Construct Psychology (PCP) with feature-based models of similarity [1], we offer a formal, flexible, and interpretable metric that moves beyond mere description toward a structural understanding of self-ideal alignment. Within this framework, the comparisons between self and ideal evaluations are defined within a semantic similarity space, where local attribute similarities form the elementary units from which the global measure of self–ideal congruence is constructed.
1.1. Psychological Well-Being
Psychological well-being is a multifaceted construct that encompasses not only the absence of mental illness but also the presence of positive psychological functioning [2]. It is broadly conceptualized through two primary traditions: the hedonic approach, which defines well-being in terms of pleasure attainment and pain avoidance, and is often equated with subjective happiness [3]; and the eudaimonic approach, which focuses on meaning, self-realization, and the fulfillment of one’s potential [4]. Foundational models, such as Diener’s tripartite model of subjective well-being, integrate life satisfaction, the presence of positive affect, and the absence of negative affect [5]. Alternatively, Ryff’s multidimensional model of psychological well-being proposes six core dimensions of positive functioning: self-acceptance, positive relations with others, autonomy, environmental mastery, purpose in life, and personal growth [6].
The measurement of psychological well-being has traditionally relied on standardized self-report instruments. Scales such as the Satisfaction with Life Scale (SWLS) [5], the Rosenberg Self-Esteem Scale (RSE) [7], and the Positive and Negative Affect Schedule (PANAS) [8] have become staples in the field due to their high reliability and ease of administration. While these instruments provide invaluable data at a population level, they are not without limitations. They are susceptible to response biases, such as social desirability [9], and their aggregate scores offer limited insight into the underlying cognitive structure that gives rise to an individual’s sense of well-being [10]. These methods treat well-being as a latent variable inferred from item responses, rather than a dynamic property emerging from an organized system of personal beliefs and values.
The core limitation of these standardized instruments lies in their inherent nomothetic approach, which aims to establish general laws by comparing individuals on a set of universal dimensions [11]. By design, such methods impose a pre-defined structure of well-being, assuming that the same factors are equally relevant for all individuals. This methodological stance, while powerful for population-level analysis, necessarily sacrifices insight into the idiographic reality of the person; that is, the unique, subjective system of meanings from which their sense of well-being emerges. To truly understand the underlying cognitive structure, a shift in perspective is required: from a psychometrics focused on measuring traits to one capable of modeling personal systems. This necessitates an alternative paradigm that prioritizes the elicitation and formalization of individual meaning.
1.2. Personal Construct Psychology
Personal Construct Theory, developed by George A. Kelly, offers a compelling alternative to trait-based theories by positing that individuals act as personal scientists who interpret their world through a unique system of bipolar dimensions of meaning, known as personal constructs [12]. From this perspective, personality is not a collection of static traits but the dynamic, organized system through which a person anticipates events. Consequently, psychological well-being is not seen as the attainment of universal positives, but rather as an intrinsic property of the construct system’s functionality. It is intrinsically linked to the system’s capacity to make sense of experience and effectively guide action, which is often operationalized as the degree of alignment, or congruence, between an individual’s perception of their current self (Self-Now) and their aspirational self (Ideal-Self) [13,14,15]. A significant discrepancy between these two perceptions is thought to reflect psychological distress, a concept that resonates with other theoretical frameworks such as Higgins’ Self-Discrepancy Theory [16].
The primary tool for assessing this self-ideal alignment in PCP has been the Repertory Grid Technique [12]. This method elicits an individual’s personal constructs and maps them onto a matrix, from which a vector representing the Self-Now and another representing the Ideal-Self are derived. The congruence between these two vectors is traditionally quantified using correlation-based indices. However, these measures have been criticized for significant methodological weaknesses that limit their validity. As Mackay [17] and Bell [18] have argued, correlation coefficients are highly sensitive to the arbitrary assignment of construct poles. For instance, merely reversing the poles of a single construct (e.g., from "Shy-Outgoing" to "Outgoing-Shy") can dramatically change the correlation value from positive to negative, despite the underlying psychological meaning remaining identical. Furthermore, correlations assume a linear and symmetric relationship, which fails to capture the more complex, feature-based nature of human similarity judgments where, for example, the similarity of A to B may not be perceived as equal to the similarity of B to A.
These limitations highlight the need for a more sophisticated metric of self-ideal congruence. The vulnerabilities of correlational methods stem from their implicit foundation in geometric models of similarity, which assume that objects (in this case, the ’Self-Now’ and ’Ideal-Self’) can be represented as points in a coordinate space. Such models impose rigid metric axioms—like symmetry and the triangle inequality—that have been shown to be frequently violated in human similarity judgments [1]. For instance, the assumption of symmetry (i.e., the similarity of A to B is equal to the similarity of B to A) often fails to capture the nuances of psychological comparison.
This paper proposes that a feature-based approach, as pioneered by Tversky, provides a more psychologically plausible solution. This paradigm shift involves conceptualizing psychological objects not as abstract points, but as collections of features or attributes. This view, originally grounded in foundational work on prototype theory [19], has evolved into highly influential contemporary models, including exemplar theories [20] and grounded cognition frameworks [21]. By representing the Self-Now and Ideal-Self as sets of features—defined here as the poles of personal constructs—we can move beyond the constraints of linear associations and model well-being based on the shared and distinctive attributes between the two self-representations. This paradigm shift, however, requires a methodological tool capable of providing the necessary granular data, a role fulfilled by the Weighted Implication Grid (WimpGrid) interview [22]. Based on this approach, we introduce the Similarity Self/Ideal (SSI) index as a formal, feature-based measure that is theoretically coherent with PCP while directly addressing the shortcomings of its traditional metrics.
1.3. Feature-Based Approach to Modeling Psychological Well-Being
The present work introduces the SSI index, a measure of psychological well-being rooted in the feature-based modeling paradigm pioneered by Tversky’s contrast model [1]. Tversky posited that similarity judgments are not a simple function of distance in a psychological space but are better expressed as a feature-matching process based on common features () and distinctive features (, ). We adapt this powerful logic to the paradigm of PCP by conceptualizing the Self-Now and the Ideal-Self as the objects to be compared. Within this framework, the features are the poles of an individual’s personal constructs. An attribute is therefore considered common if the Self-Now and Ideal-Self align on the same pole of a construct, and distinctive otherwise.
To operationalize this feature-based model empirically, the quantitative data are elicited through the WimpGrid interview [22]. This semi-structured method provides a systematic way to capture an individual’s personal constructs and their self-perceptions on a normalized scale, yielding the precise data required for the formalization.
The primary objective of this paper is therefore to provide a complete mathematical formalization of the SSI index. This includes defining its core components based on set-theoretic principles, detailing the calculation of attribute magnitudes, and establishing its key mathematical properties. Finally, we will discuss the theoretical implications of the index and its potential applications in both clinical and research contexts, demonstrating its utility as a versatile tool for the quantitative analysis of self-concept.
2. Mathematical Foundations
This section provides a formal mathematical framework for the SSI index, a metric designed to quantify psychological well-being by assessing the alignment between an individual’s current and ideal self-perceptions. The framework is grounded in set-theoretic principles inspired by feature-based models of similarity [1]. Our objective is to construct a robust, flexible, and interpretable index that captures both qualitative and quantitative aspects of self-ideal congruence.
2.1. Formalization of the Similarity Self/Ideal Index
The construction of the SSI index begins with the algebraic representation of an individual’s self-perception within a normalized n-dimensional psychological space. This space is denoted as , where n represents the number of personal constructs. Each dimension corresponds to a single construct, and scores within this space are interpreted as follows: a value of indicates complete alignment with the left pole of the construct, a value of 1 indicates complete alignment with the right pole, and intermediate values represent varying degrees of association between the two poles. Within this formal space, we define the following vectors.
Definition 1
(Self-Now Vector). The individual’s current self-perception is represented as a vector , where each component corresponds to their score on construct i.
Definition 2
(Ideal-Self Vector). The individual’s aspirational self-perception is represented as a vector , where each component corresponds to their desired score on construct i.
Remark 1.
It is important to note that the vectors (Self-Now) and (Ideal-Self) are not abstract entities but are empirically derived from the score matrix generated during the WimpGrid interview. As illustrated in the example matrix in Figure 1, the components of correspond to the scores on the main diagonal (highlighted in blue), while the components of are taken from the Ideal-Self column (highlighted in green). For a comprehensive description of the full interview protocol, the reader is referred to the foundational paper on the WimpGrid methodology [22].
To apply a feature-based similarity model, we conceptualize the Self-Now and Ideal-Self as sets of attributes, where each attribute is characterized by its qualitative nature (sign) and its intensity (magnitude).
Definition 3
(Attribute Sets). From the vectors and , we define two sets of attributes, S and I, which correspond to the Self-Now and Ideal-Self, respectively.
Each attribute in these sets is a scalar component taken directly from the corresponding vector. Specifically, an attribute in the set S is the i-th component of the vector , and an attribute in the set I is the i-th component of the vector . For the purpose of our feature-based model, each of these attributes is analyzed in terms of two distinct properties:
- (i)
- The sign of the score, , which represents the qualitative nature of the attribute. It indicates the specific pole of the construct with which the individual identifies.
- (ii)
- The absolute value of the score, , which quantifies the intensity or salience of the attribute. It measures how strongly the individual endorses that particular pole.
This decomposition allows the model to differentiate between the nature of a self-perception and its subjective importance.
The relationship between these two sets is partitioned into three disjoint subsets: shared attributes (), attributes unique to the Self-Now (), and attributes unique to the Ideal-Self ().
Definition 4
(Set Relations). Given the attribute sets S and I, we define the following subsets:
- (i)
- The set of shared attributes, where both self and ideal align on the same pole:
- (ii)
- The set of attributes distinctive to the Self-Now (discrepancies):
- (iii)
- The set of attributes distinctive to the Ideal-Self (aspirations):
The structure of these subsets can be visually represented as overlapping regions between the Self-Now and Ideal-Self attribute sets. The Figure 2 illustrates how the total attribute space is partitioned into three disjoint subsets according to Definition 4.
To quantify the contribution of each subset to the overall similarity, we introduce the following magnitude functions.
Definition 5
(Magnitude of Shared Attributes). The magnitude of the set of shared attributes, , is quantified by the function:
where the function measures the local similarity between the self–perception and the ideal evaluation for construct i and is given by:
The function can be interpreted as a localsemantic similaritymeasure between the two evaluations on construct i. It defines a bounded mapping
where denotes maximal semantic agreement and represents minimal semantic proximity within the same evaluative pole. In this sense, g quantifies the degree to which the self-perception participates in the meaning implied by the ideal value . Thus, g constitutes the elementary building block of a semantic similarity space in which the SSI Index aggregates local similarity contributions into a global measure of self–ideal congruence.
The function is designed to quantify the intensity of congruence for each specific attribute pair within the set of shared attributes . It yields a maximum value of 1 when there is perfect alignment (). As the self-perception score deviates from the ideal score while remaining on the same evaluative pole, the function exhibits a quadratic decay. This behavior signifies that small deviations from the ideal result in a minor loss of similarity, whereas larger deviations are penalized more heavily.
This quadratic decay is illustrated in Figure 3. The plot displays the similarity value (y-axis) as a function of the self-perception (x-axis) for several fixed ideal values, . Each curve peaks at 1 where and smoothly decreases towards 0 as the distance increases.
To ensure that the function is properly scaled, the denominator in Equation 5 normalizes the squared deviation by the maximum possible deviation within that pole, which guarantees that the output of is always bounded within the interval . Finally, the function aggregates these individual similarity scores by summing them, thereby providing a total measure of the intensity of all shared attributes.
Definition 6
(Magnitude of Self-Now Discrepancies). The magnitude of the set of attributes distinctive to the Self-Now, , is measured by the sum of the absolute intensities of its elements:
This function aggregates the absolute intensities of attributes unique to the current self-perception, thus reflecting their collective magnitude as a source of self-ideal discrepancy.
Definition 7
(Magnitude of Aspirational Gaps). The magnitude of the set of attributes distinctive to the Ideal-Self, , is measured by the sum of the absolute intensities of its elements:
Analogously, this function represents the total intensity of attributes unique to the ideal self, quantifying the magnitude of desired changes not yet present in the current self-perception.
Definition 8
(Similarity Self/Ideal Index). The SSI index, which quantifies the alignment between the Self-Now (S) and the Ideal-Self (I), is defined as:
where are weighting coefficients that modulate the contributions of the distinctive attribute sets and , respectively.
The SSI index is constructed as a normalized ratio where the numerator, , represents the magnitude of shared features (similarity), while the denominator represents the total magnitude, including both shared features and the weighted distinctive features (dissimilarity). The parameters and function as the weights for this dissimilarity, corresponding to the subjective importance an individual places on their discrepancies and unfulfilled aspirations, respectively.
2.2. Properties of the SSI Index
Following the formal definition of the SSI index, a rigorous analysis of its mathematical properties is required to establish its structural integrity and theoretical coherence. This section undertakes such an analysis by formally proving the index’s key characteristics. We will demonstrate its boundedness within a closed interval, its predictable behavior at the boundary conditions of perfect congruence and complete mismatch, and its algebraic reduction to a canonical form. The establishment of these properties is a necessary step to confirm that the SSI functions as a well-defined mathematical object, suitable for modeling the complexities of psychological well-being.
Property 1
(Boundedness of the SSI Index). The SSI index is bounded within the closed interval .
Proof.
By their Definitions 5, 6, and 7, the magnitude functions , , and are sums of non-negative terms. Therefore, . The SSI index is defined as:
- (i)
- Lower Bound (): Since the numerator, , is non-negative and the denominator is a sum of non-negative terms (assuming ), the entire fraction must be non-negative.
- (ii)
- Upper Bound (): To prove the upper bound, we must show that the numerator is less than or equal to the denominator:
This inequality is satisfied because the terms and are both non-negative. Thus, adding them to in the denominator ensures that the denominator is always greater than or equal to the numerator. In any non-trivial case where the denominator is non-zero, it holds that . □
Property 2
(Boundary Conditions of the SSI Index). The SSI index exhibits specific behaviors at its boundaries, corresponding to perfect psychological congruence and complete incongruence.
- (i)
- Maximum Similarity: The index attains its maximum value of 1 if and only if the Self-Now and Ideal-Self vectors are congruent on all constructs, meaning for every construct i, .
- (ii)
- Complete Mismatch: The index attains its minimum value of 0 if and only if the set of shared attributes is empty ().
Proof.
We prove each boundary condition separately.
- (i)
-
Maximum Similarity: (⇒) Assume . This implies that the numerator and denominator of the SSI formula are equal, which requires that . Since and the magnitude functions are non-negative, this holds if and only if and . The condition for an attribute to be included in the disjoint sets is . For the magnitudes of these sets to be zero, it must be that for every i where , both and . This is equivalent to stating that there is no construct for which and have opposite signs. Thus, for all i, .(⇐) Assume that for every construct i, . This implies that for all i, the product . According to the definitions, the disjoint sets and only contain attributes where . Therefore, the only attributes that could possibly belong to these sets are those where (i.e., where and/or ). In such cases, the magnitudes and contributed to the sums and are zero. Consequently, and . The SSI formula simplifies to:(assuming , the non-trivial case). This establishes the biconditional relationship between and pole congruence.
- (ii)
-
Complete Mismatch: (⇒) Assume . Given that the denominator is non-negative, this equality requires the numerator to be zero: . The magnitude function is a sum of non-negative terms . The sum can only be zero if the set over which the sum is taken, , is empty.(⇐) Assume . From Definition 5, if the set of shared attributes is empty, its magnitude must be 0. Substituting this into the SSI formula yields:Provided that at least one attribute exists in either or (the non-trivial case), the denominator will be positive, and thus .This establishes the biconditional relationship between and .
□
Beyond these fundamental properties, the index’s structure can be simplified to reveal deeper insights into its behavior. By expressing the SSI function in a canonical form, we can isolate two key coefficients that describe the intrinsic structure of an individual’s self-system. To achieve this, we first define these structural coefficients.
Definition 9
(Structural Coefficients). The structural coefficients, and , are defined as the ratio of the magnitude of the distinctive attribute sets to the magnitude of the shared attribute set:
- (i)
- The Discrepancy Ratio (), which quantifies the magnitude of self-discrepancies relative to the magnitude of congruence:
- (ii)
- The Aspiration Ratio (), which quantifies the magnitude of unfulfilled aspirations relative to the magnitude of congruence:
Property 3
(Canonical Representation of the SSI Index). Assuming , any SSI function can be expressed in the following canonical form:
where and are the structural coefficients from Definition 9.
Proof.
The proof is derived by algebraic manipulation. Starting from the original definition of the SSI index (Definition 8), we divide both the numerator and the denominator by :
□
The significance of this canonical representation extends beyond mere algebraic simplification. It reveals that the SSI index is an instance of a hyperbolic function, a well-characterized family of functions from which several key behavioral properties can be directly derived. These are formally stated below.
Property 4
(Properties of the Canonical SSI Function). The canonical form of the SSI index, , defined on the domain , exhibits the following key properties:
- (i)
- Non-linearity and Monotonic Decrease: The function is non-linear and strictly decreasing with respect to both α and β. The first partial derivatives are non-zero and negative for all in the domain:
- (ii)
- Convexity: The function is convex over its domain. The second partial derivatives are non-negative, indicating that the rate of decrease is itself decreasing:
- (iii)
- Asymptotic Behavior: The function has a horizontal asymptote at . The limit of the function as either salience parameter tends to infinity is zero:
- (iv)
- Parametrized Sensitivity: The local sensitivity of the index is determined by the gradient vector, , whose magnitude depends directly on the structural coefficients and :where . The magnitude of the gradient, , is thus a direct function of the structural coefficients, confirming their role as shape parameters governing the steepness of the decay.
These formal properties are visually demonstrated in Figure 4, which plots the SSI function for three distinct structural profiles, each generated from a different pair of coefficients. The topology of each surface directly illustrates how these structural coefficients act as shape parameters, governing the index’s sensitivity. A resilient system (small values) generates an elevated, relatively flat surface (green), confirming its low sensitivity to the salience parameters, while a fragile system (large values) yields a surface with a steep, hyperbolic decay (red). This visualization confirms how the underlying structure of the self-system, captured by the coefficients, determines the dynamic behavior of the SSI function.
Example 1.
To illustrate the complete formalization, let us apply these concepts to the WimpGrid matrix shown in Figure 1. After normalizing the scores via the transformation , we extract the Self-Now and Ideal-Self vectors:
The magnitudes of the attribute sets are calculated as follows:
- (i)
- The magnitude of shared attributes, , for the construct ’Healthy’ () is:
- (ii)
- The magnitude of self-discrepancies, , for the poles ’Anxious’ and ’Lazy’ is:
- (iii)
- The magnitude of unfulfilled aspirations, , for the poles ’Calm’, ’Sporty’, and ’Hard Worker’ is:
From these magnitudes, we can now compute the structural coefficients for this individual using Definition 9:
Since both coefficients are greater than 1, this self-system would be classified as structurally fragile. Substituting these coefficients into the canonical form (Property 3) yields the specific SSI function for this individual:
The heatmap in Figure 5 is a direct visualization of this specific function, where the high value of explains the rapid decay along the vertical axis.
In summary, the formalization of the SSI index provides a comprehensive framework for analysis. By establishing its fundamental properties and deriving its canonical representation, we have shown that the index not only quantifies well-being but also reveals the underlying structural stability of the self-system through the coefficients and . This provides a rich, multi-layered tool for the mathematical modeling of self-concept.
2.3. Fuzzy Similarity Interpretation of the SSI Function
The formal properties established in the previous sections indicate that the local congruence function behaves as a well-formed similarity mapping on each construct. In this subsection, we formalize this observation by demonstrating that g can be equivalently understood as a normalized fuzzy membership function. This provides the formal basis for interpreting self–ideal congruence within a graded similarity space.
Proposition 1.
For each fixed ideal value , the local congruence function (Definition 5) is isomorphic to a fuzzy membership function , expressible in the quadratic canonical form:
where acts as an ideal-dependent normalization parameter, ensuring that similarity is correctly scaled relative to the maximum possible deviation at the evaluated pole.
This expression makes explicit that is a center-based similarity function with a unique maximum at [23], and exhibits a smooth, parabolic decay as increases. The normalization term ensures that the function is properly scaled to the interval on each construct.
We now state the formal properties that qualify as a normalized fuzzy similarity on the compact domain [23,24].
Property 5
(Fuzzy Similarity). Fix and define as in (19). Then:
- (i)
- Normalization: .
- (ii)
- Boundedness: for all .
- (iii)
- Reflexive maximum: if and only if .
- (iv)
- Monotonic decay: decreases strictly as increases.
- (v)
- Continuity: is a continuous and differentiable function.
Thus, constitutes a normalized fuzzy similarity function consistent with the standard axioms of similarity in fuzzy set theory [24].
Proof.
Let . Properties (i) and (ii) follow directly from the definition in (19). Property (iii) holds because the equality requires . Properties (iv) and (v) follow from the fact that, for fixed , is a quadratic polynomial in scaled by the positive constant , and is therefore strictly concave on the compact domain , with a unique global maximum at . □
At the system level, the SSI index aggregates local similarities across all constructs via the magnitude function :
The numerator of the SSI index therefore represents the total fuzzy similarity between the Self-Now and Ideal-Self across all constructs on which both share the same evaluative pole. The denominator incorporates both similarity and dissimilarity terms, weighted by and , yielding the normalized global similarity:
This structure identifies the SSI as a composite fuzzy similarity measure: a ratio between aggregated fuzzy similarities and the total weighted magnitude of similarity and dissimilarity.
Viewing the SSI index as an aggregation of local fuzzy similarities provides a precise mathematical basis for interpreting self–ideal congruence as a graded, non-metric relation. Unlike distance-based models, the SSI describes the degree to which the current self-participates in the meaning structure of the ideal self, consistent with constructivist notions of validation and reorganization. The fuzzy similarity space thus formalizes the graded nature of self–ideal alignment and offers a coherent foundation for analyzing the continuity of psychological change.
3. Discussion
3.1. Conceptual Framework of the Fuzzy Similarity Space
The fuzzy-similarity formulation of the SSI Index provides a formal context that connects its mathematical properties with the theoretical assumptions of constructivist psychology.
Within this framework, the self can be described as occupying a region of graded inclusion within an ideal configuration. The SSI therefore quantifies not only the magnitude of proximity, but also the degree of participation of the current self-configuration in the structure of meanings that defines the ideal system.
This formal context situates personal validation within a continuous topological space, allowing for the representation of transitions between validation, ambiguity, and reorganization. Accordingly, the fuzzy similarity space provides a mathematically coherent foundation for expressing the continuity of change postulated by constructivist models of personal meaning.
3.2. Applications
The formal structure of the SSI index gives rise to several theoretically grounded applications that extend beyond the mere quantification of psychological well-being. By conceptualizing well-being as an emergent property of a personal construct system, the SSI index serves not only as a measurement tool but also as an analytical framework for exploring the structural and dynamic properties of self-concept.
First, the SSI index offers a truly idiographic method for assessing well-being. Unlike standardized self-report scales, which compare an individual to a normative sample, the SSI is computed entirely from the individual’s own system of personal constructs. It measures the congruence between the person’s current self and their own aspirational self, using the dimensions of meaning they themselves have defined as relevant. This person-centered approach provides a psychologically richer and more contextually valid assessment, allowing clinicians and researchers to understand well-being as it is subjectively constructed, rather than as a deviation from a population mean.
Second, the SSI parameter space, when interpreted through the lens of the canonical form, serves as a direct diagnostic map of a system’s psychological flexibility. The structural coefficients, and , function as the direct determinants of this flexibility. A system with small structural coefficients (i.e., ) is inherently resilient. This indicates a strong foundation of self-ideal congruence () that provides a robust buffer against the psychological impact of discrepancies, resulting in an elevated and relatively flat surface.
Conversely, a system with large structural coefficients is structurally fragile. The SSI value for such a system is highly sensitive to the salience of its internal conflicts, resulting in a surface with a steep hyperbolic decay. This relationship is formally captured by the gradient of the SSI function, , whose magnitude, , represents the local steepness of the surface. The magnitude of this gradient is directly proportional to the structural coefficients and . Therefore, the structural coefficients are not merely descriptive ratios; they are the formal metric of a system’s fragility, as they directly govern the local sensitivity of the well-being function.
Third, this analysis of the SSI surface has direct clinical utility for case formulation and therapeutic planning. The topology of the surface provides strategic insights into the most effective points of intervention. For instance, if a client’s surface shows a particularly steep decay along the Discrepancy Salience () axis, it suggests that their well-being is highly vulnerable to a focus on their perceived flaws. This might indicate that a therapeutic approach centered on reducing or reframing these specific discrepancies could yield significant gains. Conversely, if the surface is more sensitive to the Aspiration Salience (), a goal-oriented or future-focused intervention that helps the client work towards their ideal self may be more impactful.
In cases where the system is globally fragile—represented by a low-lying surface that is highly sensitive to both parameters—directly confronting either discrepancies or unfulfilled aspirations might be counterproductive, potentially leading to distress. In such scenarios, the model suggests a different strategy: a strengths-based approach aimed at reinforcing and expanding the existing congruencies (). By focusing on what is already aligned and functioning well, the therapist can help bolster the system’s resilience. Mathematically, this would translate to lifting the entire SSI surface, making it more robust before addressing the more sensitive areas of conflict.
Furthermore, the SSI framework provides a powerful tool for the longitudinal tracking of therapeutic change, which often aims to enhance the system’s flexibility and resilience. As established in the canonical representation, the topology of the SSI surface is a direct function of the structural coefficients( and ). Since these coefficients are the normalized ratios of the underlying attribute magnitudes, any structural change in the individual’s system will manifest as a quantitative change in these coefficients. Consequently, therapeutic progress can be visualized not as a single score, but as a complete topological reconfiguration of the SSI surface over time, thus offering a dynamic map of the system’s evolving resilience.
This application allows us to move beyond tracking a single score and instead visualize the evolution of the system’s properties over time. For example, a successful therapeutic process could be identified by comparing the SSI surface at a pre-treatment stage with the surface at a post-treatment stage. A positive outcome would be represented by a transformation from a fragile topology (a steep, low-lying surface, highly sensitive to the salience parameters) to a resilient one (a flatter, more elevated surface). This change would visually represent a system that has resolved internal conflicts, thereby becoming more robust and less volatile in its sense of well-being. This transforms the SSI from a static snapshot into a dynamic map for visualizing and quantifying structural change in the self-concept over time.
In summary, the applications of the SSI index are manifold: it serves as an idiographic measure of well-being, its parameter space functions as a diagnostic tool for assessing psychological resilience, it informs clinical case formulation, and its framework allows for the dynamic modeling of change over time. These capabilities position the SSI as a versatile instrument for both clinical practice and advanced research in quantitative psychology.
3.3. Limitations and Future Research Directions
While the SSI index provides a robust and theoretically coherent framework for modeling psychological well-being, its introduction as a novel metric necessitates a thorough consideration of its current limitations and a clear roadmap for future empirical validation. The primary challenges lie in moving from initial psychometric validation to establishing its clinical utility and addressing conceptual refinements of the model itself.
The initial psychometric properties of the SSI index have been explored in a study employing a Multitrait-Multimethod design [25]. The results of this study are promising, indicating a strong test-retest reliability () and significant convergent validity when compared with established methods derived from the Repertory Grid and with standardized self-report instruments such as RSE [7] and SWLS [5]. However, this initial evidence, while foundational, is primarily centered on construct validity and is insufficient to establish the index’s full potential as a clinical or predictive tool.
A crucial next step is to extend the validation of the SSI index into applied settings. Future research should focus on its application in clinical case studies and controlled intervention trials. This would allow us to test key hypotheses, such as whether a transformation of the SSI surface from a fragile to a resilient topology correlates with positive therapeutic outcomes. Such studies are essential to determine if the SSI can function not only as a descriptive measure but also as a predictive indicator of psychological change and a tool for monitoring treatment efficacy.
Furthermore, to enhance the index’s utility beyond purely idiographic assessment, studies aimed at establishing population norms are required. Research with large and diverse samples would allow for the creation of reference distributions for different SSI surface topologies. This would enable clinicians and researchers to interpret an individual’s psychological resilience not only in its own terms but also in comparison to relevant demographic or clinical groups, bridging the gap between idiographic depth and nomothetic comparison.
A further conceptual limitation of the current SSI formulation is its assumption of uniform construct salience. The model, in its present form, treats all dimensions of meaning as equally important in their contribution to overall well-being. However, from the perspective of Personal Construct Psychology, construct systems are hierarchically organized, with some constructs being more central or superordinate than others [12,26]. For instance, a discrepancy in a core construct related to self-worth (e.g., ’Valued vs. Worthless’) is likely to have a far greater impact on an individual’s psychological distress than a discrepancy in a more peripheral construct (e.g., ’Punctual vs. Unpunctual’). This limitation opens another significant line for future development: the creation of a weighted SSI index. Instead of a simple summation, the magnitude functions could incorporate weights for each construct, such that more central constructs contribute more significantly to the final index. Crucially, the data required to derive these weights are already captured within the WimpGrid protocol. Centrality metrics, such as those derived from a graph-theoretic analysis of the construct network, provide a direct, idiographic measure of each construct’s structural importance. The Presence-Balance Space, for example, offers a formal method for quantifying the centrality and influence of each construct within the system [27]. Integrating such weights would allow the SSI index to more accurately reflect the nuanced and hierarchical nature of personal meaning systems, thereby increasing its psychological fidelity and clinical utility.
The most significant conceptual challenge remains the estimation of the Discrepancy Salience () and Aspiration Salience () parameters. These coefficients represent subjective, internal psychological states that are context-dependent and not directly observable. While the SSI surface provides a comprehensive map of how well-being behaves across all possible values of and , we currently lack a validated method for precisely locating an individual within this parameter space.
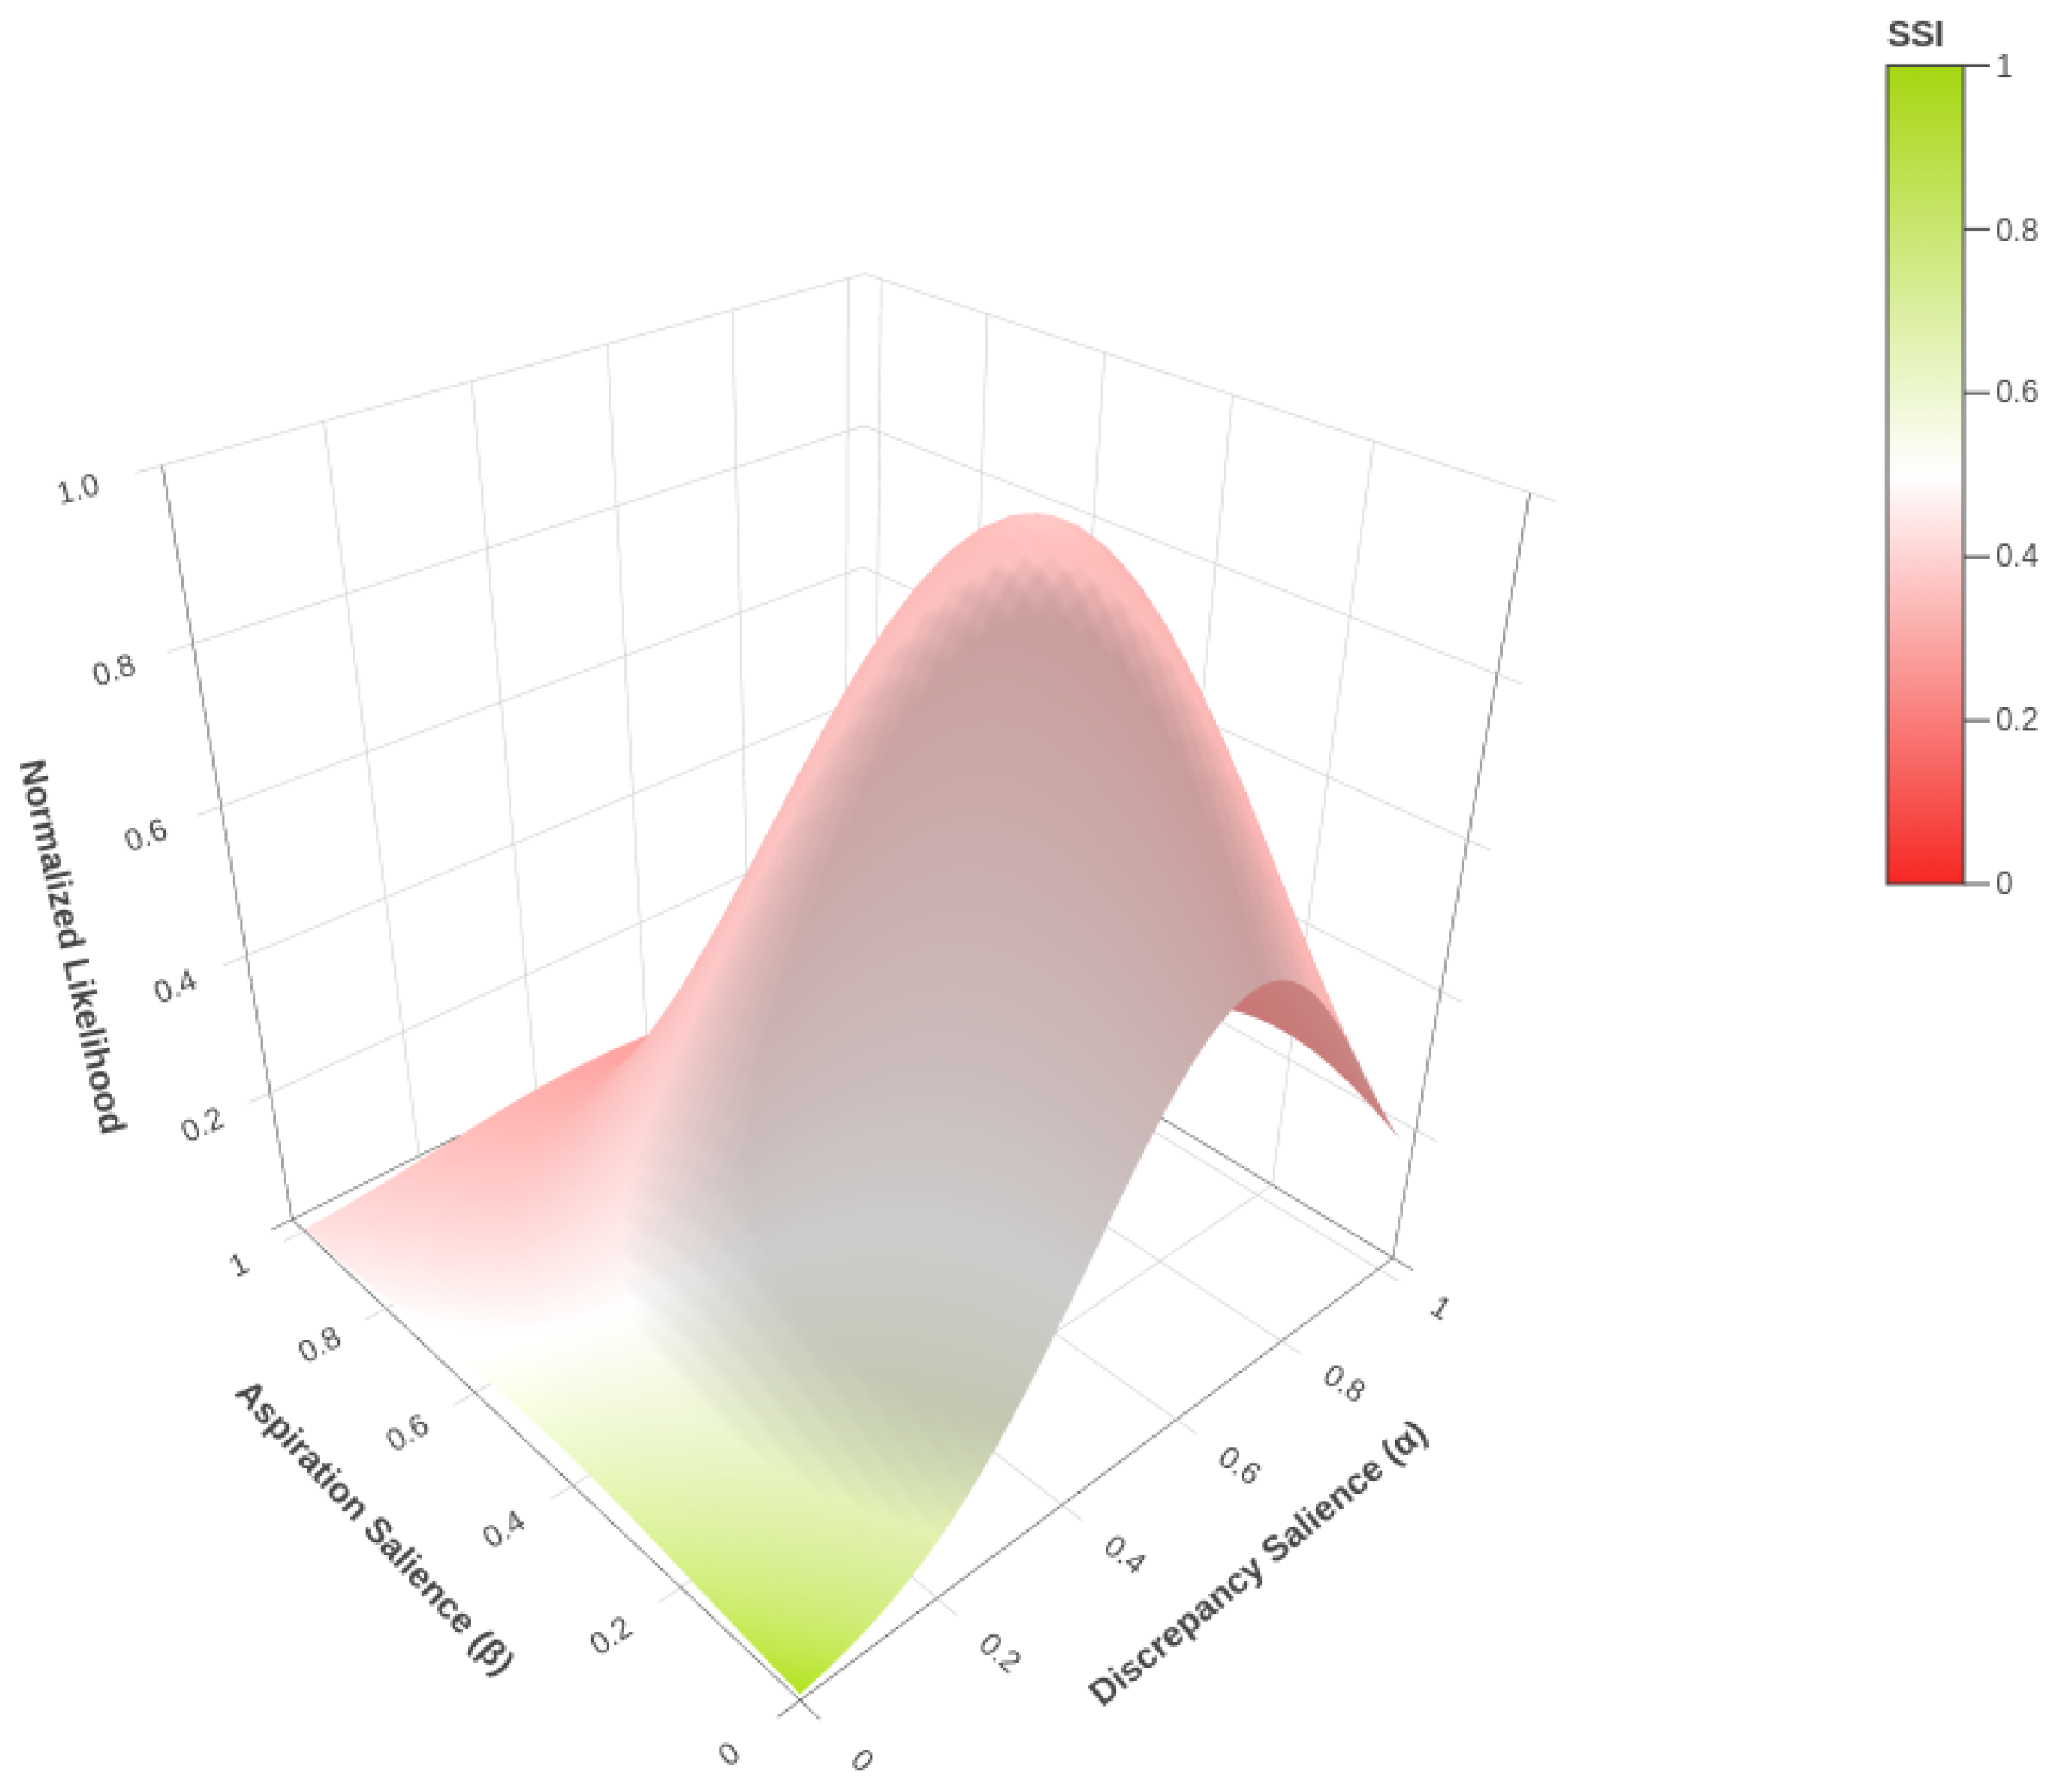
This challenge, however, points to the most promising avenue for future theoretical development: the creation of a probabilistic framework to model an individual’s salience profile. Instead of assuming fixed values for and , we can aim to estimate a bivariate probability density function, , over the salience plane. Such a function would represent the likelihood that an individual’s attentional focus resides in a particular region of the space. Figure 6 provides a simulated example of what such a probabilistic model would yield. The colored base represents the deterministic SSI heatmap, while the three-dimensional surface illustrates a Normalized Likelihood for a specific individual. The peak of this surface indicates the most probable profile for that person. By combining these two layers of information, we could infer not only the most likely SSI value for an individual but also the uncertainty surrounding that estimate. The next significant step in this research line would be to formalize this probability function and to determine the empirical data—whether from psychometric instruments, behavioral tasks, or WimpGrid interview patterns—required for its construction.
In conclusion, while the SSI index is established on a robust initial psychometric foundation, its full potential is yet to be realized. The future research path involves both empirical expansion and theoretical refinement. Empirically, it is necessary to move beyond initial construct validation through clinical studies and the establishment of population norms. Theoretically, the most promising avenues for development lie in refining the model to incorporate construct-specific weights and in formalizing a probabilistic framework for the estimation of the and parameters. Successfully addressing these challenges would not only solidify the SSI index but would also represent a substantial step forward in the mathematical modeling of subjectivity.
4. Conclusions
This paper has introduced the SSI index, a novel metric for quantifying psychological well-being grounded in a set-theoretic formalization inspired by Tversky’s feature-based model of similarity. By representing the Self-Now and Ideal-Self as sets of attributes, the SSI moves beyond the limitations of traditional correlation-based measures, offering a framework that accounts for asymmetries, non-linear similarity, and the subjective importance of different forms of self-discrepancy through the flexible salience parameters, and .
Within this formalization, the fuzzy similarity interpretation offers a compact link between the local congruence function and the global SSI index, showing that self–ideal alignment can be treated as a graded relation of inclusion in a similarity space consistent with constructivist notions of gradual validation.
While initial validation is promising, the full potential of the SSI index points toward several key avenues for future research. The immediate path involves extending its validation to clinical settings and establishing population norms to bridge its idiographic depth with nomothetic comparison. More advanced theoretical developments include refining the model to incorporate construct-specific weights, derived from centrality measures like the PB Space, and formalizing a probabilistic framework to estimate the latent salience parameters, thereby transforming the model from a deterministic map to a stochastic one.
In essence, the SSI index provides a rigorous and interpretable bridge between the subjective, idiographic nature of personal meaning and the demands of contemporary quantitative modeling. By offering a formal language to describe the structure of self-concept and its relationship to well-being, this work represents a significant step forward in the mathematical modeling of subjectivity, opening new possibilities for both theoretical research and clinical practice.
Author Contributions
Conceptualization, A.S., C.H.-M., L.A.S., and L.B.; methodology, A.S. and C.H.-M.; software, A.S.; validation, A.S., C.H.-M., L.A.S., and L.B.; formal analysis, A.S. and C.H.-M.; writing—original draft preparation, A.S. and C.H.-M.; writing—review and editing, A.S., C.H.-M., L.A.S., and L.B.; visualization, A.S. and C.H.-M.; supervision, L.A.S. and L.B.; project administration, L.A.S. and L.B. All authors have read and agreed to the published version of the manuscript.
Funding
This research received no external funding.
Data Availability Statement
The original data presented in the study are openly available in [Zenodo] at [https://doi.org/10.5281/zenodo.15095252].
Conflicts of Interest
The authors declare no conflicts of interest.
Abbreviations
The following abbreviations are used in this manuscript:
| SSI | Similarity Self/Ideal |
| PCP | Personal Construct Psychology |
| WimpGrid | Weighted Implication Grid |
References
- Tversky, A. Features of similarity. Psychological Review 1977, 84, 327–352. [Google Scholar] [CrossRef]
- Ryff, C.D. Happiness is everything, or is it? Explorations on the meaning of psychological well-being. Journal of Personality and Social Psychology 1989, 57, 1069–1081. [Google Scholar] [CrossRef]
- Kahneman, D.; Diener, E.; Schwarz, N. (Eds.) Well-being: The Foundations of Hedonic Psychology; Russell Sage Foundation: New York, NY, USA, 1999. [Google Scholar]
- Waterman, A.S. Two conceptions of happiness: Contrasts of personal expressiveness (eudaimonia) and hedonic enjoyment. Journal of Personality and Social Psychology 1993, 64, 678–691. [Google Scholar] [CrossRef]
- Diener, E.; Emmons, R.A.; Larsen, R.J.; Griffin, S. The Satisfaction With Life Scale. Journal of Personality Assessment 1985, 49, 71–75. [Google Scholar] [CrossRef] [PubMed]
- Ryff, C.D.; Keyes, C.L.M. The structure of psychological well-being revisited. Journal of Personality and Social Psychology 1995, 69, 719–727. [Google Scholar] [CrossRef] [PubMed]
- Rosenberg, M. Society and the Adolescent Self-Image; Princeton University Press: Princeton, NJ, USA, 1965. [Google Scholar]
- Watson, D.; Clark, L.A.; Tellegen, A. Development and validation of brief measures of positive and negative affect: The PANAS scales. Journal of Personality and Social Psychology 1988, 54, 1063–1070. [Google Scholar] [CrossRef] [PubMed]
- Crowne, D.P.; Marlowe, D. A new scale of social desirability independent of psychopathology. Journal of Consulting Psychology 1960, 24, 349–354. [Google Scholar] [CrossRef] [PubMed]
- Borsboom, D.; Cramer, A.O.J. Network analysis: An integrative approach to the structure of psychopathology. Annual Review of Clinical Psychology 2013, 9, 91–121. [Google Scholar] [CrossRef] [PubMed]
- Allport, G.W. Personality: A Psychological Interpretation; Henry Holt and Company: New York, NY, USA, 1937. [Google Scholar]
- Kelly, G.A. The Psychology of Personal Constructs; W. W. Norton: New York, NY, USA, 1955. [Google Scholar]
- Fransella, F.; Bell, R.; Bannister, D. A Manual for Repertory Grid Technique; John Wiley & Sons: Chichester, UK, 2004. [Google Scholar]
- Botella, L.; Feixas, G. Teoría de los Constructos Personales: Aplicaciones a la Práctica Psicológica; Laertes: Barcelona, Spain, 1998. [Google Scholar]
- Jones, R.E. Identification in terms of personal constructs: Reconciling a paradox in theory. Journal of Consulting Psychology 1961, 25, 276. [Google Scholar] [CrossRef] [PubMed]
- Higgins, E.T. Self-discrepancy: A theory relating self and affect. Psychological Review 1987, 94, 319–340. [Google Scholar] [CrossRef] [PubMed]
- Mackay, N. Identification, reflection, and correlation: Problems in the bases of repertory grid measures. International Journal of Personal Construct Psychology 1992, 5, 57–75. [Google Scholar] [CrossRef]
- Bell, R.C. A note on the correlation of elements in repertory grids: How to and why. Journal of Constructivist Psychology 2006, 19, 273–279. [Google Scholar] [CrossRef]
- Rosch, E. Cognitive representations of semantic categories. Journal of Experimental Psychology: General 1975, 104, 192–233. [Google Scholar] [CrossRef]
- Ashby, F.G.; Maddox, W.T. Human category learning. Annual Review of Psychology 2005, 56, 149–178. [Google Scholar] [CrossRef] [PubMed]
- Barsalou, L.W. Grounded Cognition. Annual Review of Psychology 2008, 59, 617–645. [Google Scholar] [CrossRef] [PubMed]
- Sanfeliciano, A.; Saúl, L.A.; Botella, L. Weighted Implication Grid: A graph-theoretical approach to modeling psychological change. Frontiers in Psychology 2025, 16. [Google Scholar] [CrossRef] [PubMed]
- Ruspini, E.H. Numerical methods for fuzzy clustering. Information Sciences 1970, 2, 319–350. [Google Scholar] [CrossRef]
- Zimmermann, H.J. Fuzzy Set Theory—and Its Applications, 4 ed.; Springer: Boston, MA, USA, 2001. [Google Scholar] [CrossRef]
- Sanfeliciano, A.; Saúl, L.A. Exploring the Personal Construction of Psychological Change via Graph Theory: Validation of the Weighted Implication Grid. Preprint avaible at SSRN. [CrossRef]
- Hinkle, D.N. The Change of Personal Constructs from the Viewpoint of a Theory of Construct Implications. PhD thesis, The Ohio State University, Columbus, OH, USA, 1965.
- Sanfeliciano, A.; Saúl, L.A.; Hurtado-Martínez, C.; Botella, L. PB Space: A Mathematical Framework for Modeling Presence and Implication Balance in Psychological Change Through Fuzzy Cognitive Maps. Axioms 2025, 14, 650. [Google Scholar] [CrossRef]
- Sanfeliciano, A.; Saúl, L.A. WimpTools: A Graph-Theoretical R Toolbox for Modeling Psychological Change. [Software], 2025. Version 1.0.0. [CrossRef]
Figure 1.
Example of a WimpGrid score matrix. The Self-Now vector () is derived from the blue diagonal cells, and the Ideal-Self vector () is derived from the green column.
Figure 1.
Example of a WimpGrid score matrix. The Self-Now vector () is derived from the blue diagonal cells, and the Ideal-Self vector () is derived from the green column.
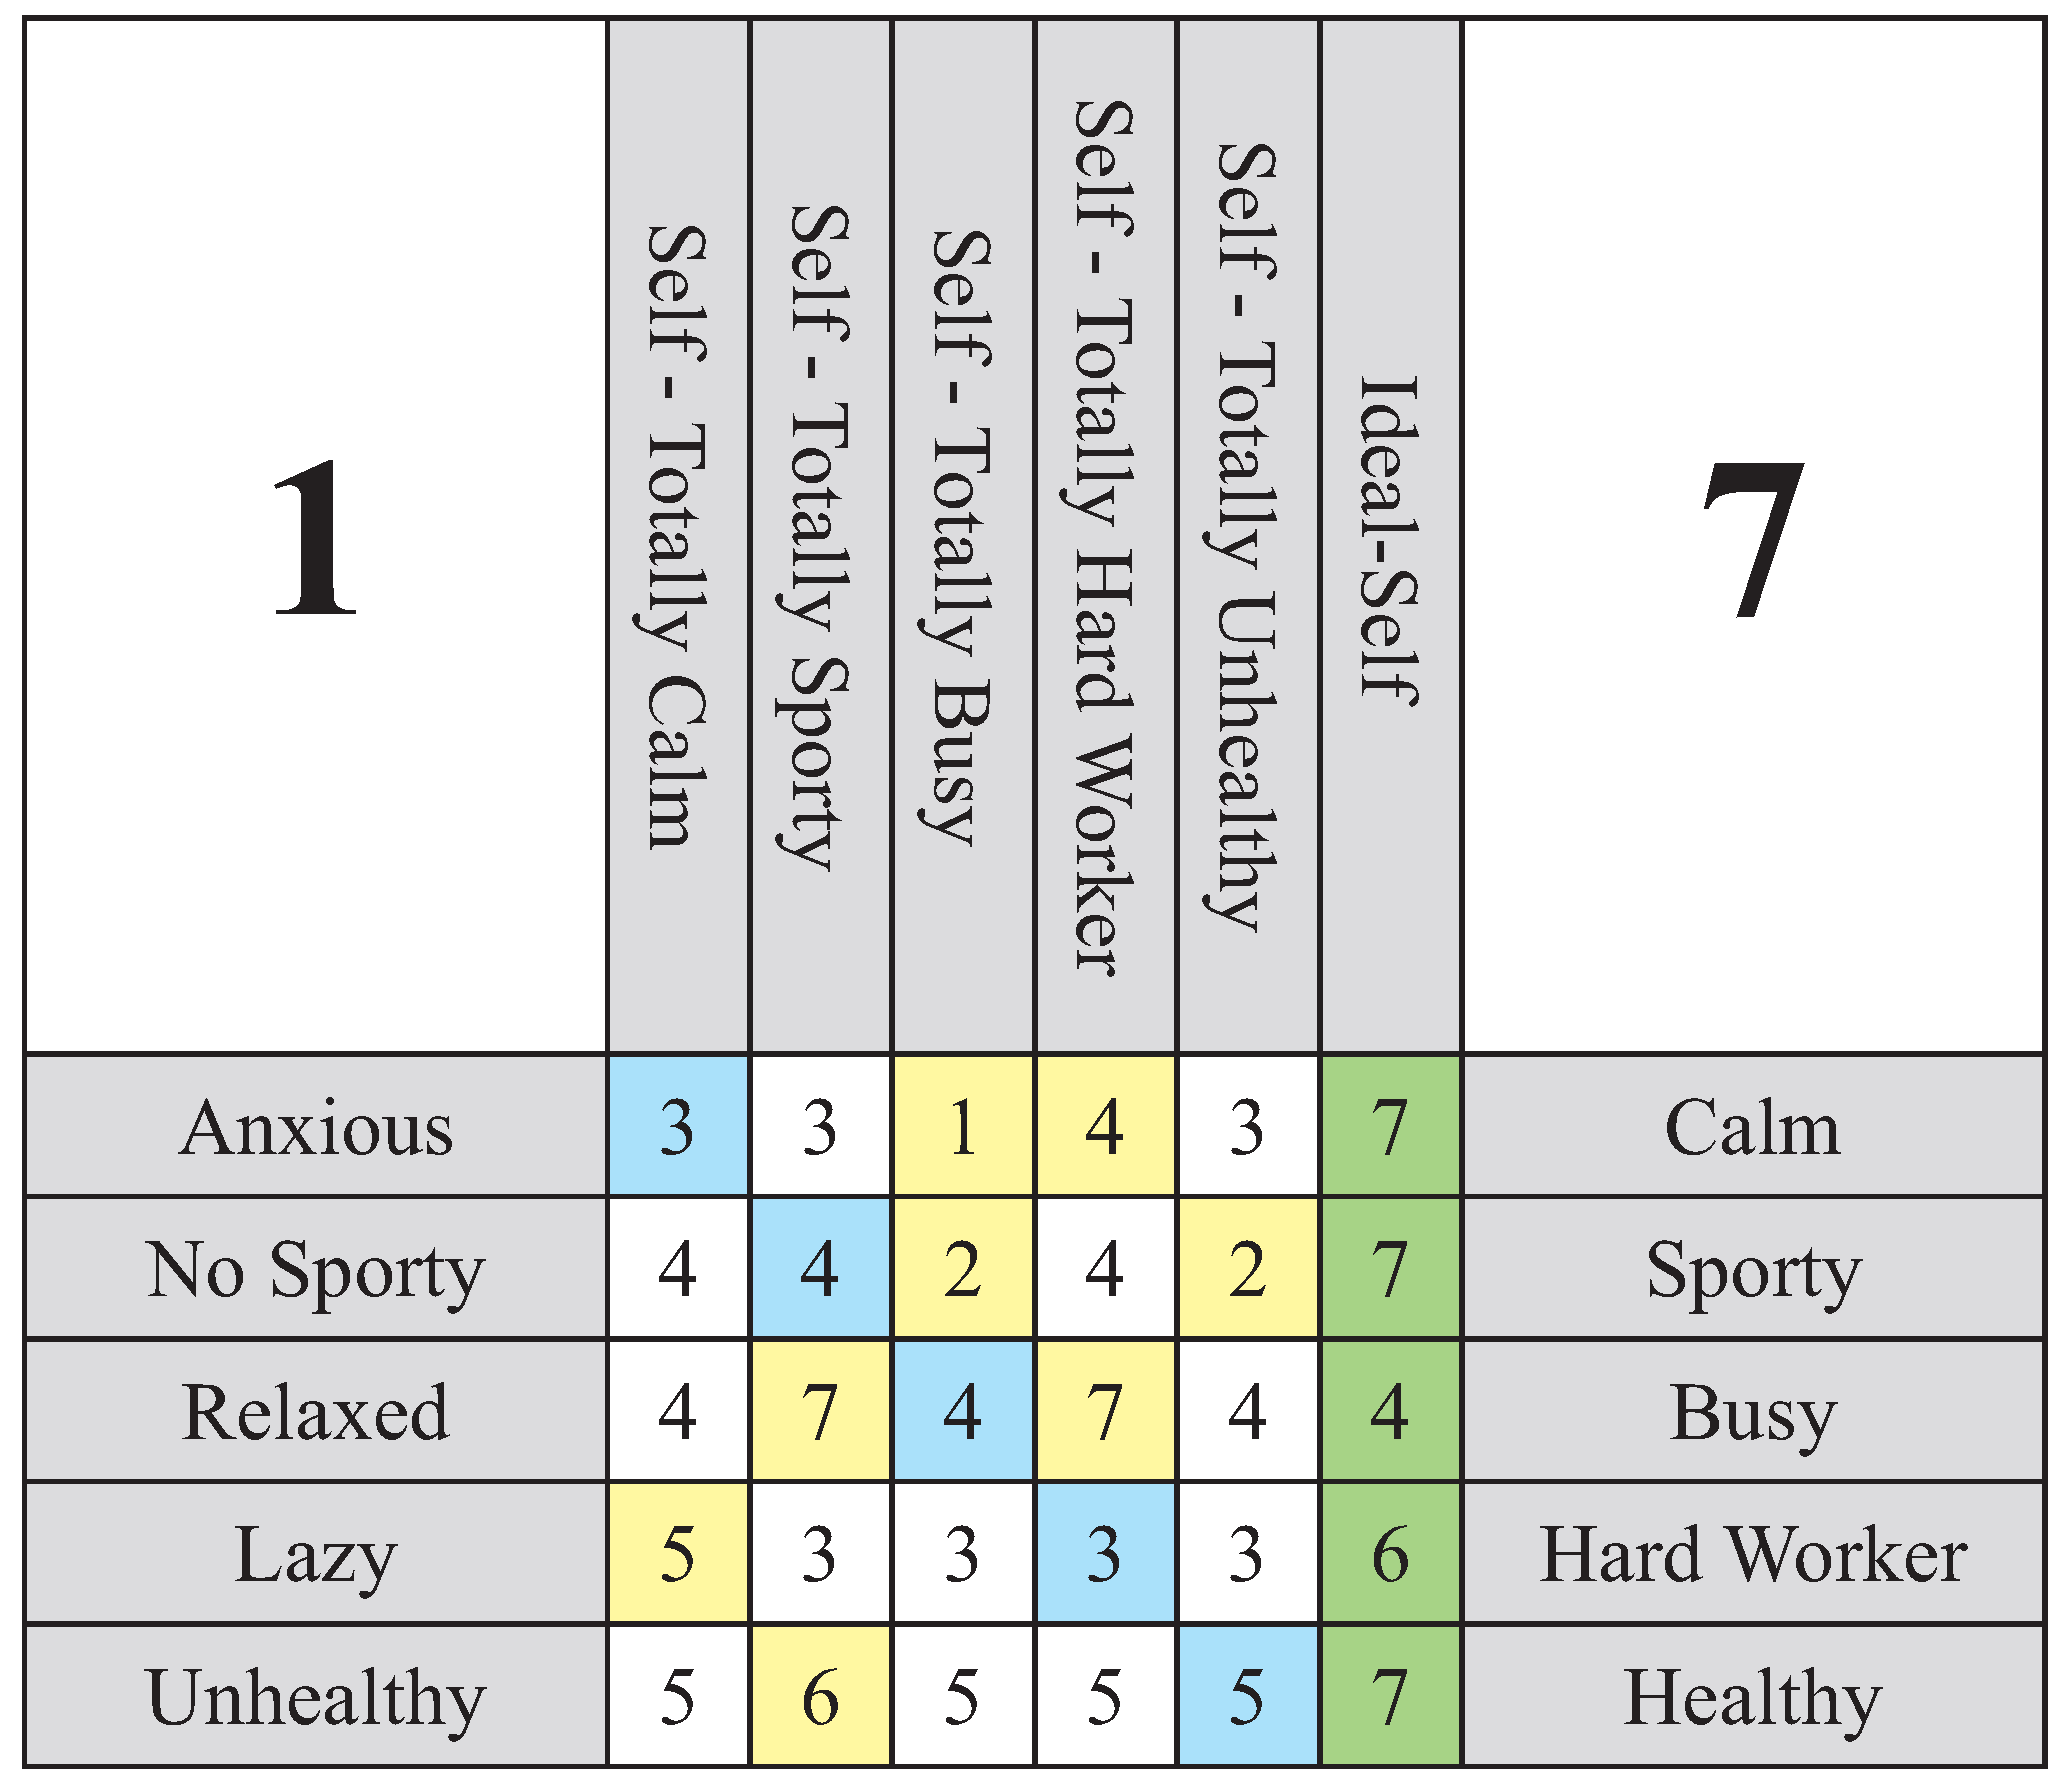
Figure 2.
Venn diagram illustrating the relationship between attribute sets S (Self-Now) and I (Ideal-Self), partitioned into shared attributes (), unique Self-Now attributes (), and unique Ideal-Self attributes ().
Figure 2.
Venn diagram illustrating the relationship between attribute sets S (Self-Now) and I (Ideal-Self), partitioned into shared attributes (), unique Self-Now attributes (), and unique Ideal-Self attributes ().
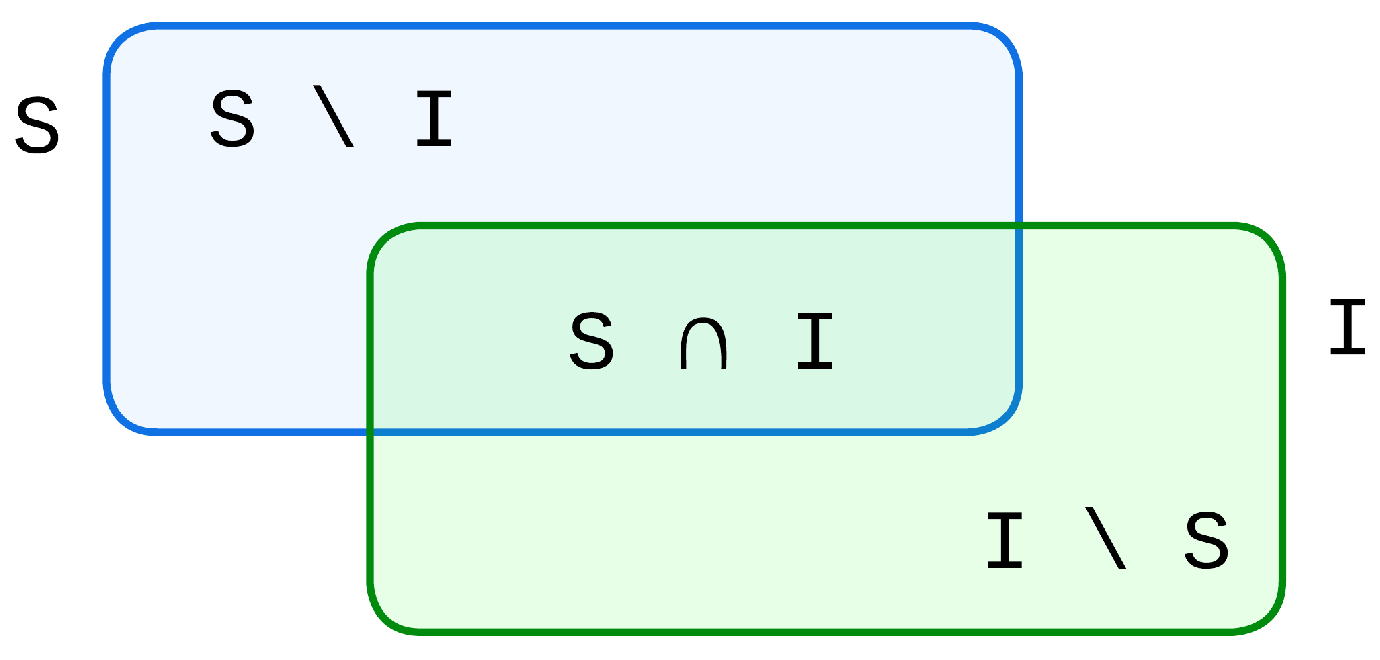
Figure 3.
Graphical representation of the function , illustrating its quadratic decay as self-perception deviates from the ideal within the same evaluative pole. Although never belongs to the set , it is shown in the figure to illustrate the function’s behavior near zero.
Figure 3.
Graphical representation of the function , illustrating its quadratic decay as self-perception deviates from the ideal within the same evaluative pole. Although never belongs to the set , it is shown in the figure to illustrate the function’s behavior near zero.
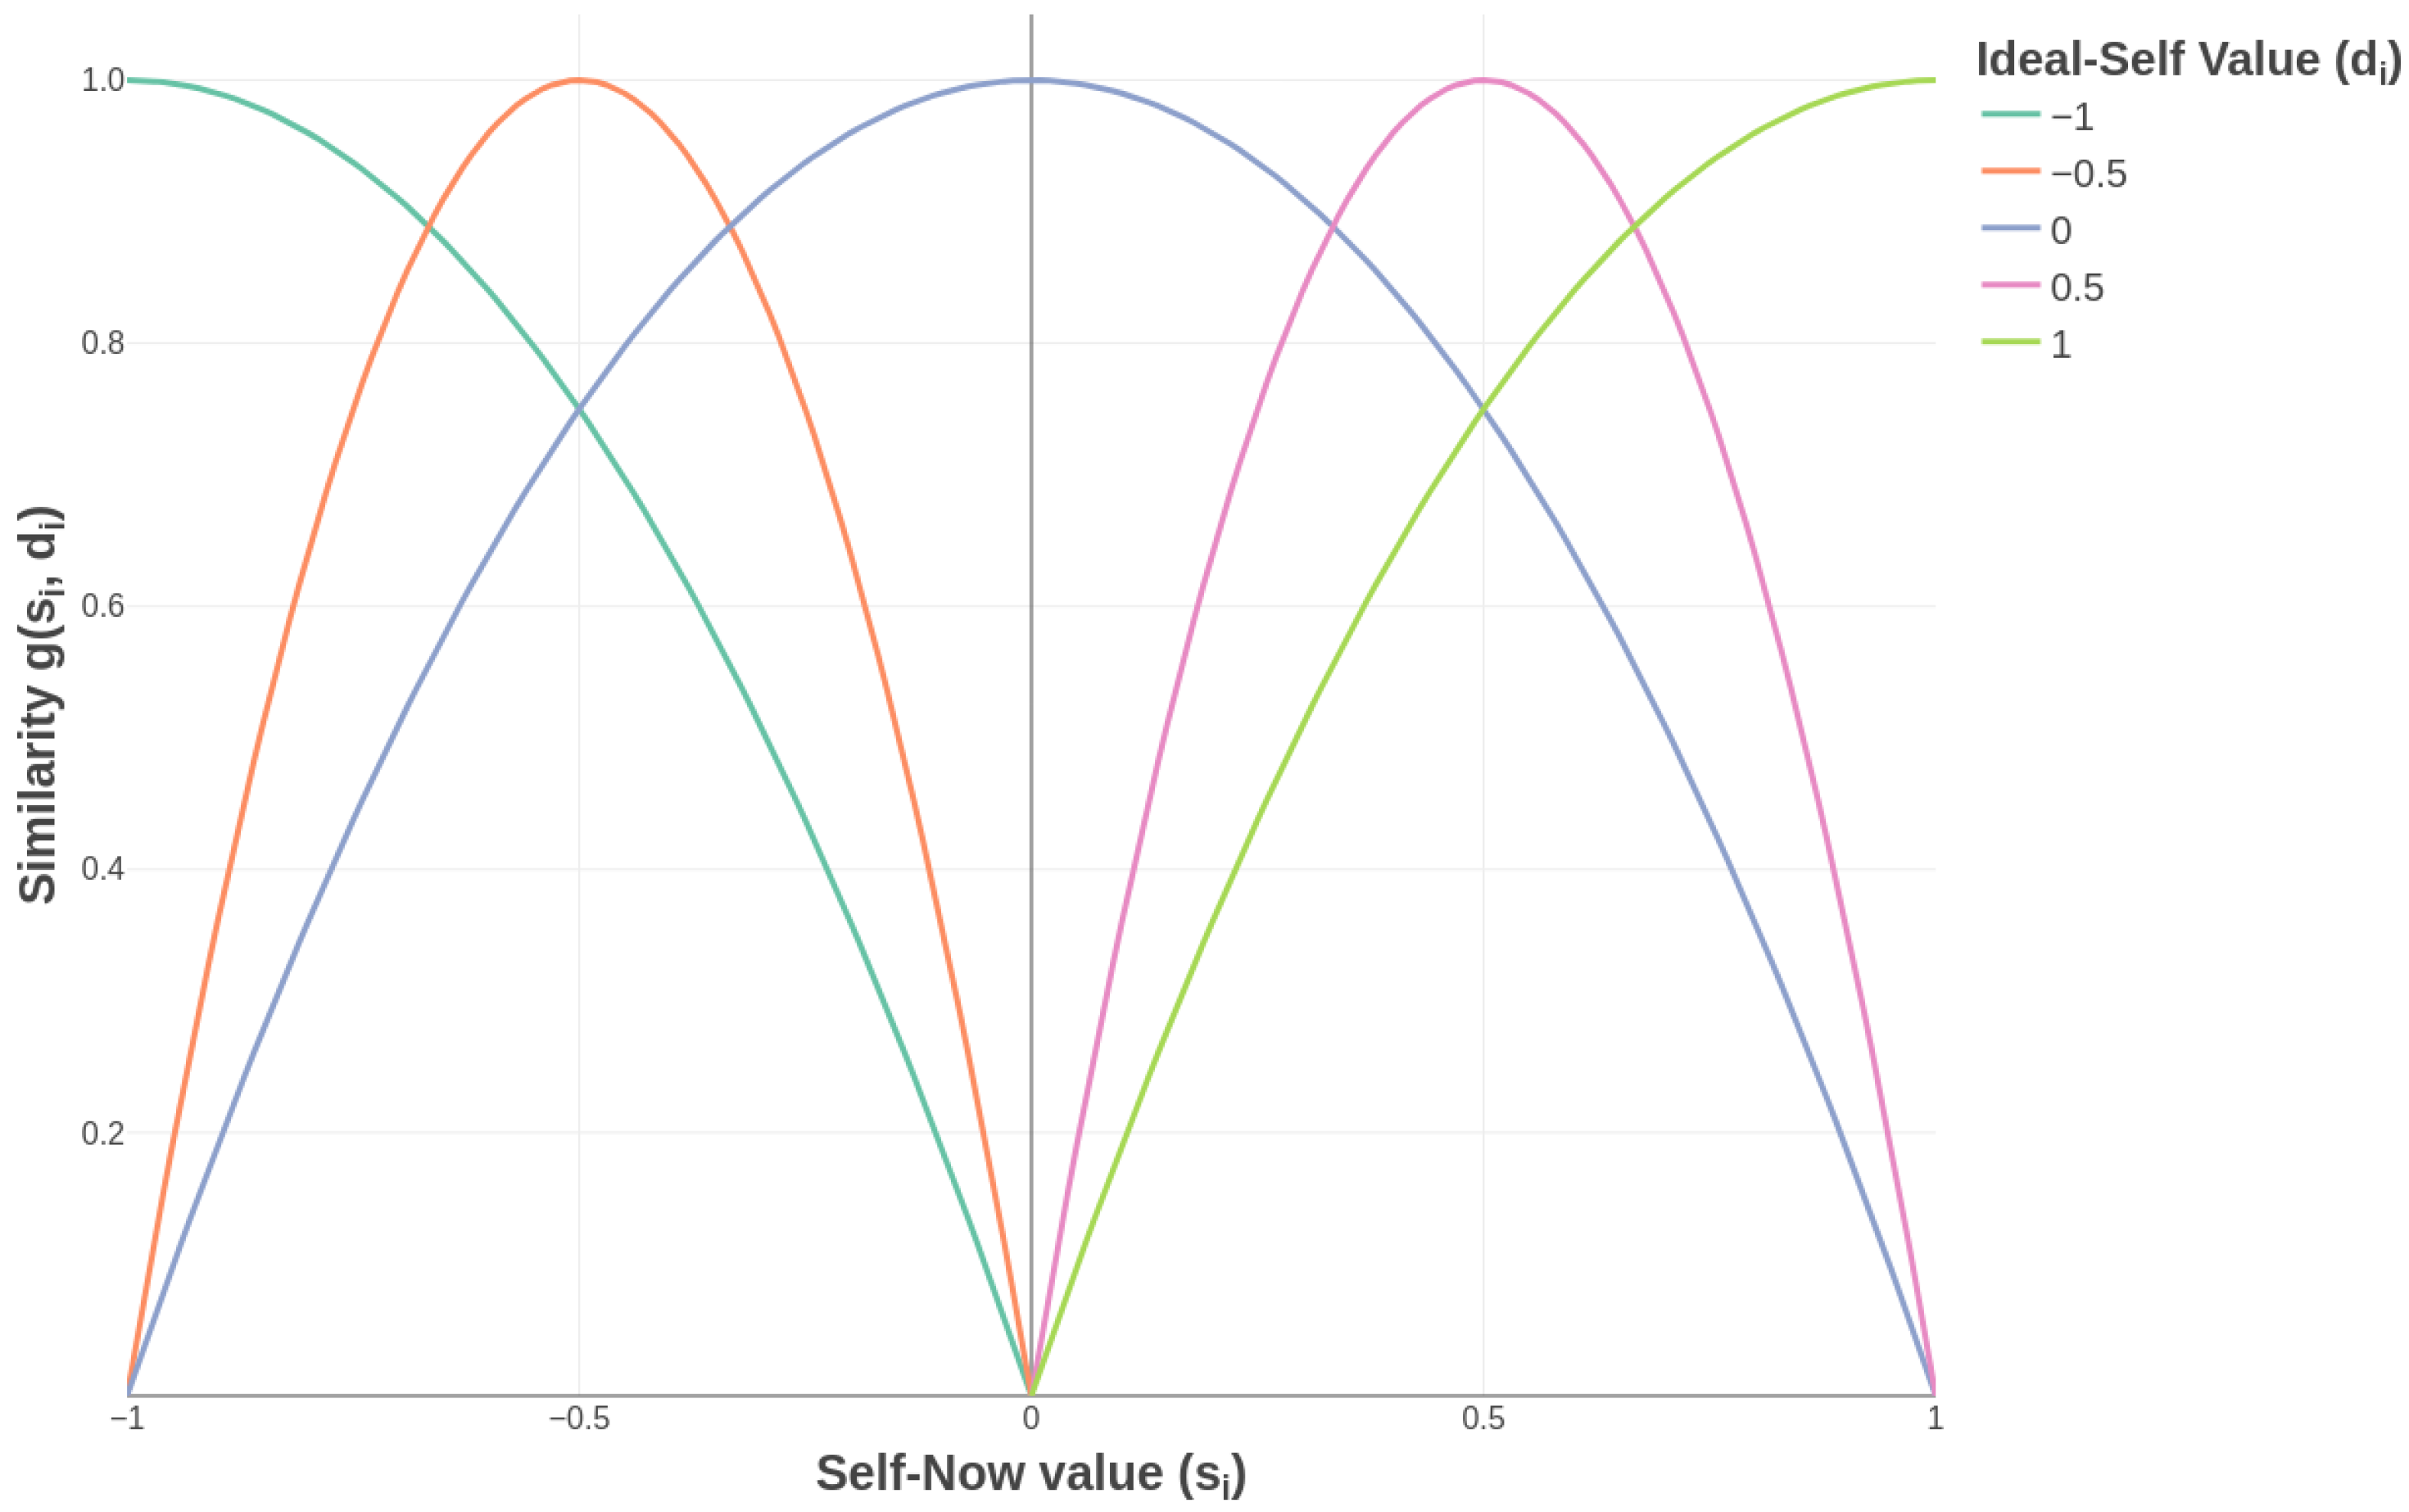
Figure 4.
Functional behavior of the SSI index for three distinct structural profiles, each corresponding to a different point in the typology space. The topology of each surface illustrates how the index’s sensitivity to the salience parameters depends on the system’s structural resilience or fragility.
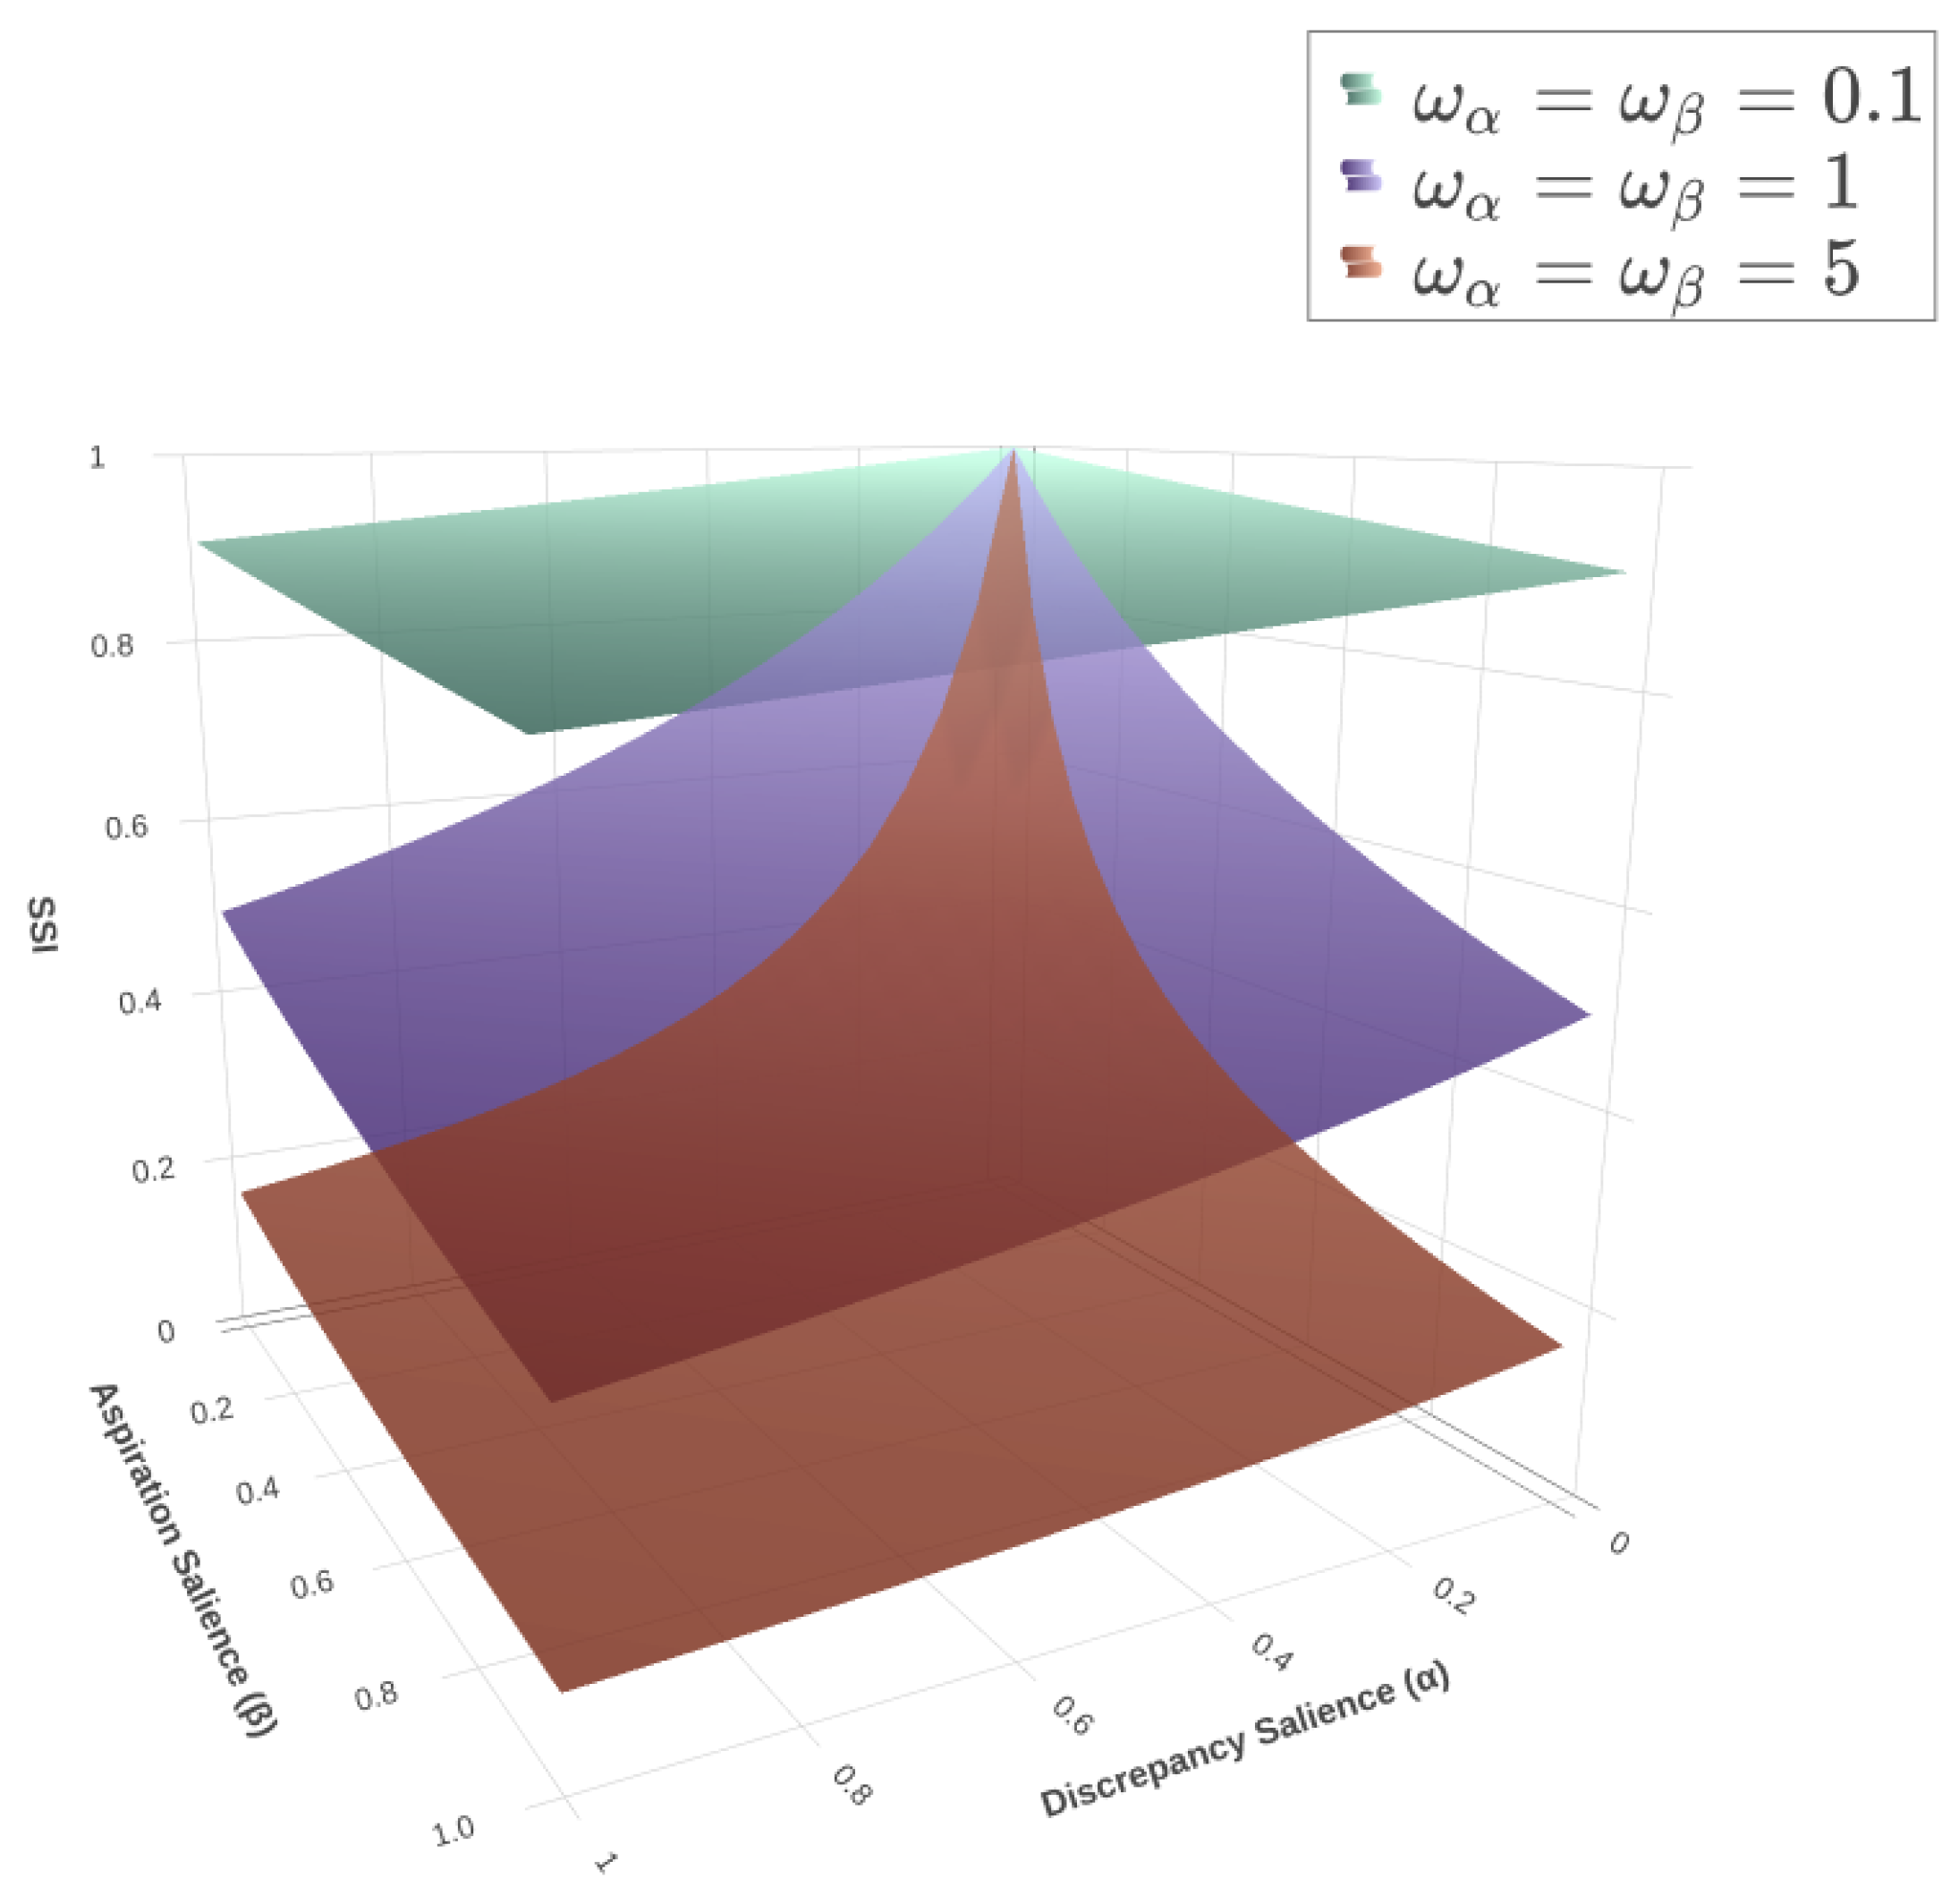
Figure 5.
Heatmap of the SSI index for the example case, visualizing the function from Equation 18. The dotted line indicates the subspace where , and the cross marks the point of equal weighting ().
Figure 5.
Heatmap of the SSI index for the example case, visualizing the function from Equation 18. The dotted line indicates the subspace where , and the cross marks the point of equal weighting ().
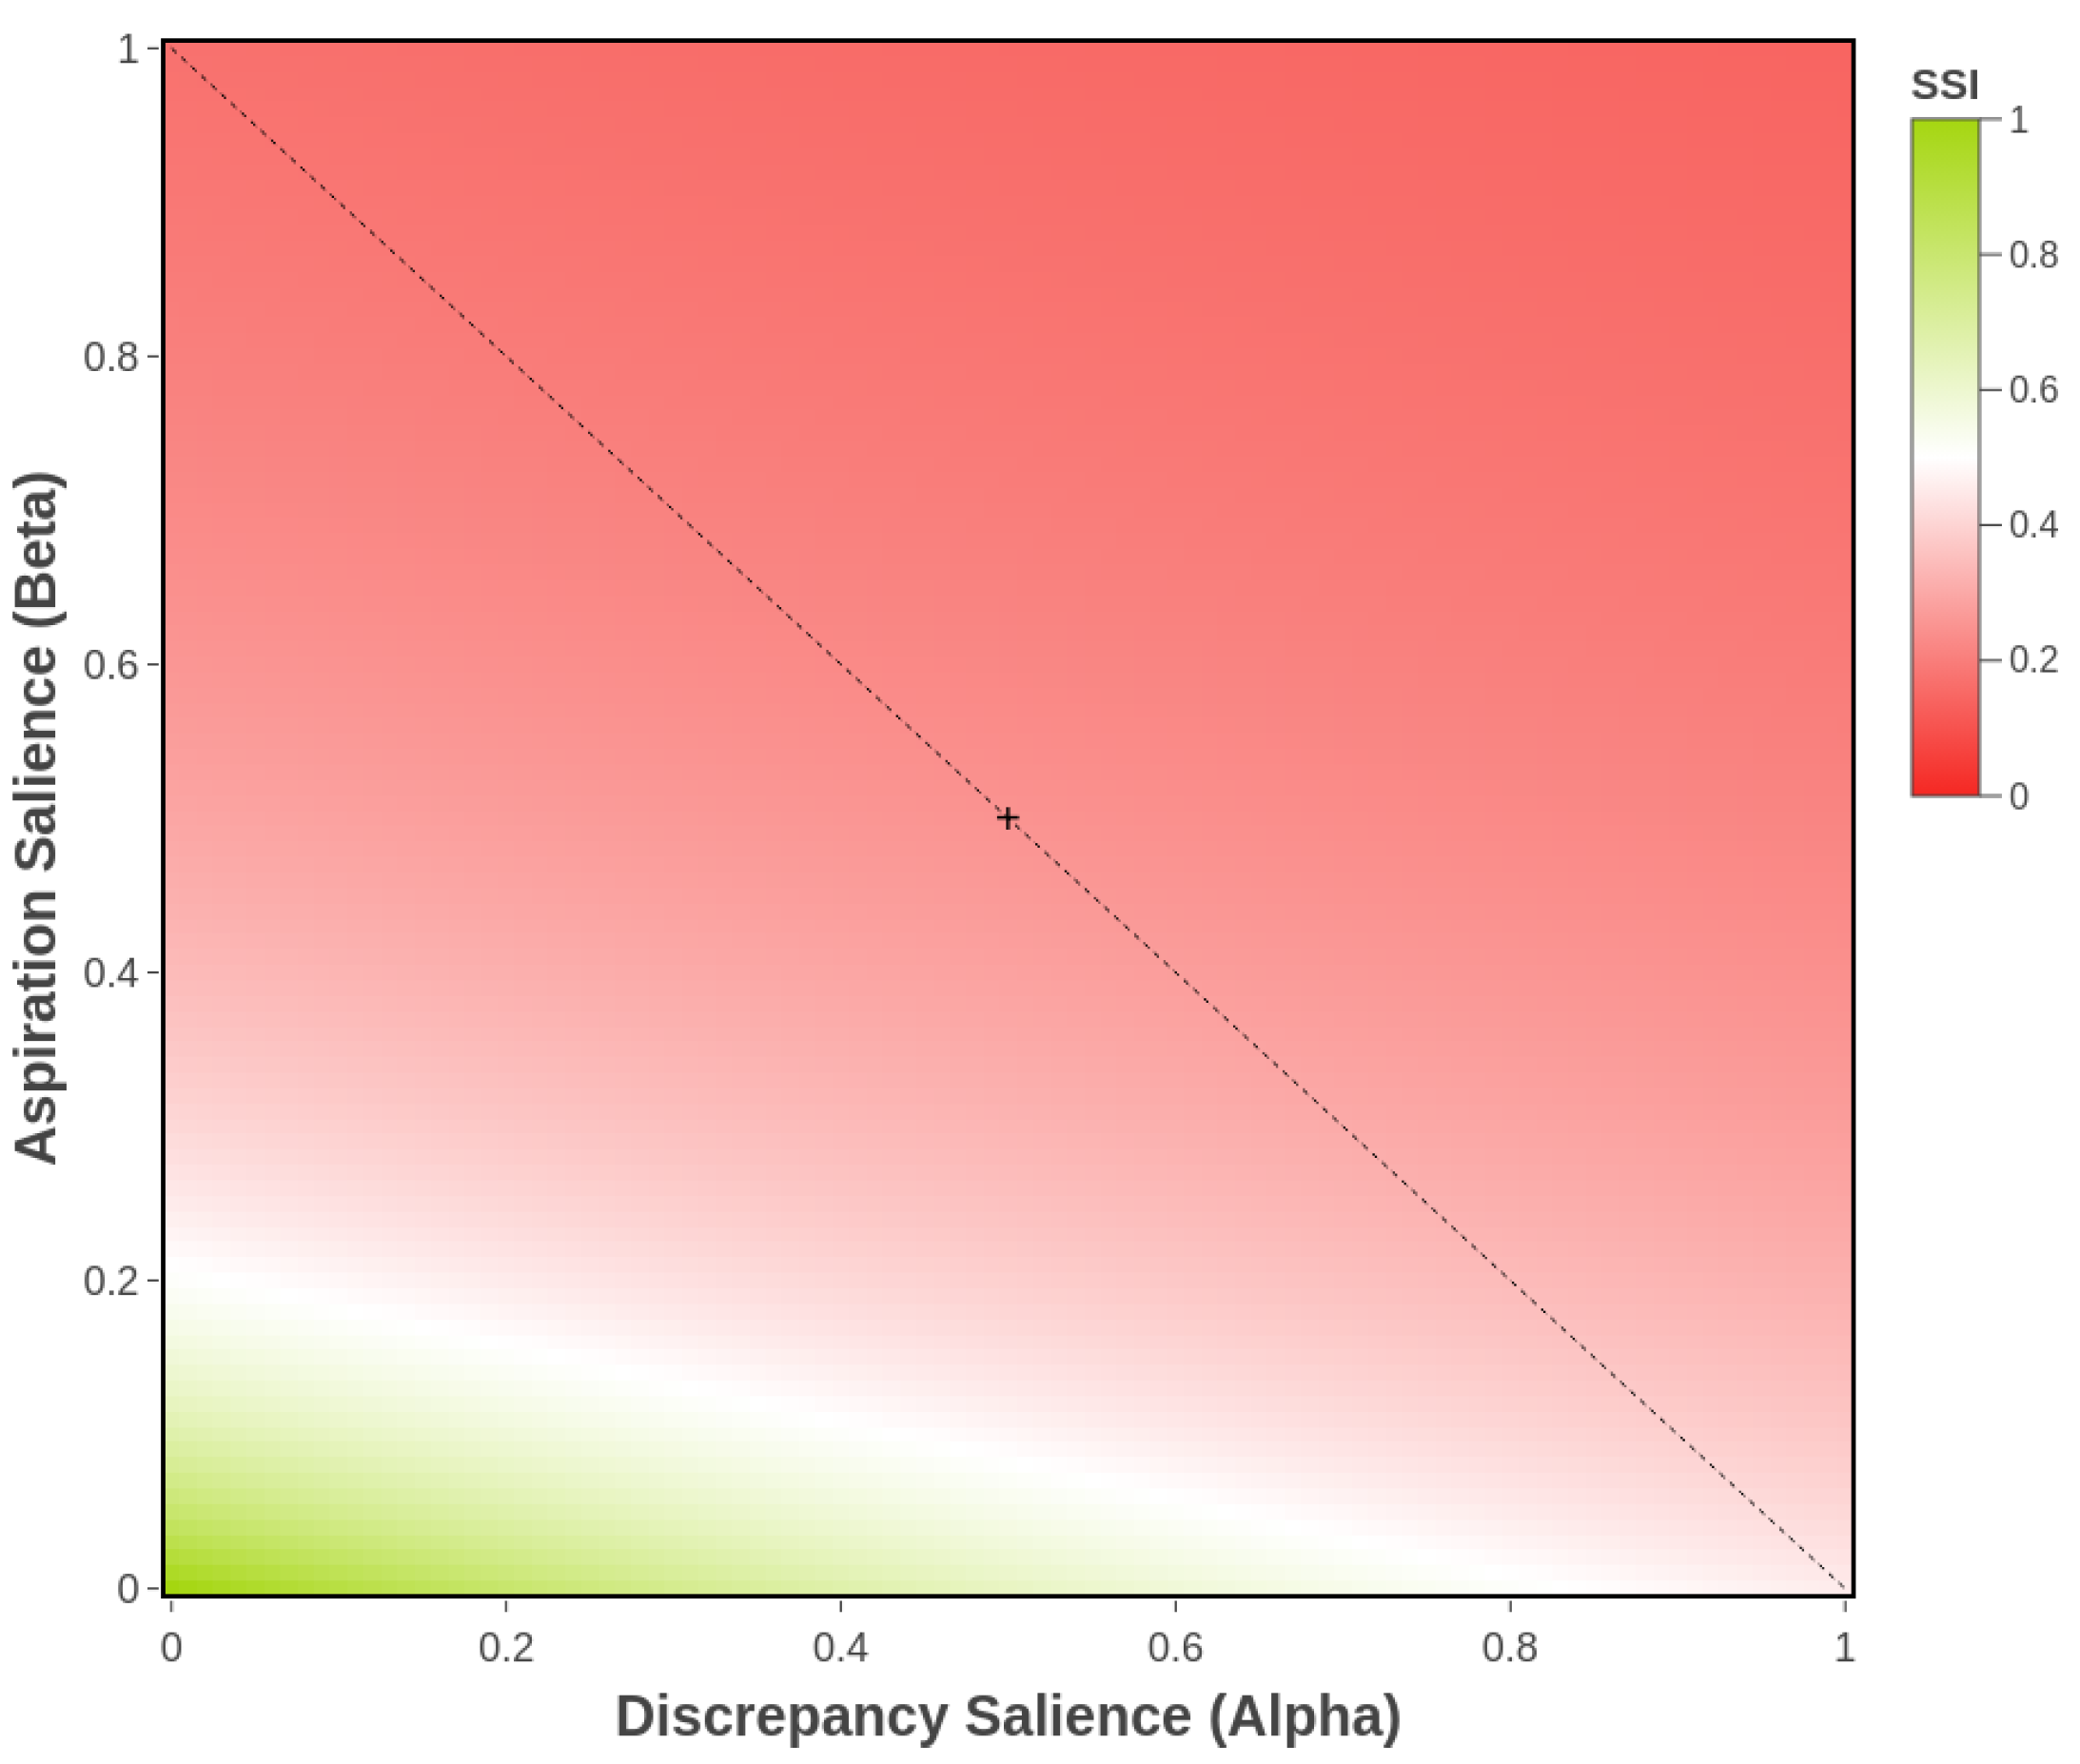
Figure 6.
Simulated example of a future research direction, illustrating a normalized likelihood surface overlaid on the SSI parameter space. The height of the surface at any point represents the probability of an individual’s salience profile, while the color of the surface at that point corresponds to the SSI value.
Disclaimer/Publisher’s Note: The statements, opinions and data contained in all publications are solely those of the individual author(s) and contributor(s) and not of MDPI and/or the editor(s). MDPI and/or the editor(s) disclaim responsibility for any injury to people or property resulting from any ideas, methods, instructions or products referred to in the content. |
© 2025 by the authors. Licensee MDPI, Basel, Switzerland. This article is an open access article distributed under the terms and conditions of the Creative Commons Attribution (CC BY) license (http://creativecommons.org/licenses/by/4.0/).
Copyright: This open access article is published under a Creative Commons CC BY 4.0 license, which permit the free download, distribution, and reuse, provided that the author and preprint are cited in any reuse.


