Submitted:
27 November 2025
Posted:
28 November 2025
You are already at the latest version
Abstract
Pathological USH2A mutations cause Usher Syndrome type II, characterized by progres-sive retinitis pigmentosa and hearing and balance impairment. This study aims to inves-tigate the cellular mechanisms underlying USH2A-related retinal degeneration using hu-man induced pluripotent stem cell (hiPSC)-derived retinal organoids. The introduction of a homozygous nonsense mutation in the USH2A hotspot exon-13 resulted in normal photoreceptor development, but loss of ciliary localization of usherin long form B and its interacting proteins, ADGRV1 and whirlin. Notably, single-cell RNA sequencing revealed unexpected significant changes in Müller glial cells (MGCs), with disruptions in the translation, innate immune response, and endolysosomal system. These findings suggest that, while photoreceptor cells are mildly affected by the exon-13 USH2A mutation, MGCs exhibit major dysfunction, potentially contributing to the disease progression and there-fore shedding light on potential alternative therapeutic targets.
Keywords:
USH2A
; retinal organoids
; Müller glial cells
; disrupted homeostasis
; innate immune system
; Usher Syndrome
1. Introduction
Mutations in the human USH2A gene account for most cases of Usher Syndrome type II (USH2), an autosomal recessive disorder characterized by progressive retinitis pigmentosa (RP) and associated hearing and balance impairment. The USH2A gene is one of the largest in the human genome, spanning 72 exons. Despite the diversity of pathogenic missense and nonsense mutations, deletions, duplications, alternative splicing and pseudo-exon inclusion variants across these exons, several mutational hotspots have been identified, with exon-13 containing two of the most common mutations found in patients [1].
According to the LOVD Database, the most frequent USH2A pathogenic mutation reported in almost 25% of USH2 patients is the c.2299delG, p.Glu767Serfs*21 [2,3,4], where a single base pair deletion disrupts the reading frame in the fifth laminin-type epidermal growth factor-like (EGF-Lam) domain, resulting in a premature stop codon and presumably the generation of a 786 aa truncated protein and/or nonsense-mediated mRNA decay (NMD). This variant was reported in patients from America, Africa, China, and Europe [5], reaching the highest frequency of 30.6% in Scandinavia [6] due to a homozygous USH2A European common ancestor [7,8]. The second most common variant is the missense mutation c.2276 G>T, p.Cys759Phe, with a frequency of 7.6%. Here, the replacement of a cysteine with a phenylalanine is thought to impair the function of usherin, the protein encoded by USH2A, via the disruption of a disulphide bond or the affected interactions with the extracellular matrix [9,10].
While the exact role in the retina remains unclear, usherin is thought to be involved in the regulation of protein transport between the inner and outer segments of photoreceptors cells [11]. After the first detection of usherin along the connecting cilium of murine photoreceptor cells [12], more animal models have been used, confirming the spatial localization of usherin to the periciliary membrane complex of macaque [13], zebrafish [14] and Syrian hamster [15] photoreceptors, where it interacts with other key proteins, both directly and indirectly.
Murine studies have shown that usherin interacts directly with adhesion G protein-coupled receptor V1 (ADGRV1, USH2C) and whirlin (WHRN, USH2D) proteins through its PDZ-binding domain, forming the USH2 complex. In fact, the knockout of whirlin long isoform in a murine model resulted in decreased usherin expression, and usherin and ADGRV1 mislocalization. Further proof of the interactions taking place in the USH2 complex, with whirlin acting as a scaffold protein, was provided by the adeno-associated viral vectors (AAV)-mediated rescue of Whrn, which led to renewed expression of whirlin, usherin, and USH2 complex localization to the periciliary membrane complex [16]. Additionally, other proteins like harmonin (USH1C) and SANS (USH1G) interact indirectly with usherin [17,18], potentially contributing to the pathophysiology of Usher syndrome.
These interactions are critical for maintaining the structure and function of photoreceptors [19,20,21,22], and disruptions to this network are believed to play a central role in the onset of retinal degeneration seen in USH2-related conditions [16].
Despite significant advances in unraveling the genetics behind USH2A-related retinal degeneration, clinical treatment options remain elusive, emphasizing the need for innovative models to study the underlying mechanisms of the disease and explore new potential therapeutic strategies. To this date, several challenges have limited the success of therapeutic approaches for USH2A-related retinal diseases. First of all, the large size of the gene exceeds the capacity of AAV viral vectors, prohibiting the delivery of non-mutant USH2A form B coding sequences. Alternative delivery techniques, such as dual/triple AAV systems, intein-mediated protein splicing, or lentiviral or adenoviral vectors, attempt to overcome this problem; although limitations regarding low efficiency and harmful immune responses result in safety concerns for clinical use [23]. In fact, many viral and non-viral delivery platforms activate the innate and adaptive immune system, leading to retinal inflammation or damage in an extremely delicate and highly compartmentalized structure, like the eye.
While the CRISPR/Cas9 technology allows the correction of pathogenic mutations [24], it has to face the poor editing efficiency in post-mitotic photoreceptor cells and the risk of off-target effects [25]. On the other hand, translational read-through drugs hold the potential of partially restoring functional protein synthesis, bypassing the premature stop codons caused by nonsense mutations, but with a limited applicability on only 20% of USH2A variants [26]. Similarly, an alternative therapeutic option is represented by the use of antisense oligonucleotides, e.g., QR-421a, which focus on correcting splicing defects to obtain a shortened but functional usherin [27]. While all these therapies are directly targeting USH2A, tackling the photoreceptor degeneration is also possible, delaying this process with neuroprotective factors and histone deacetylase inhibitors. However, this strategy cannot entirely prevent, or restore, the loss of photoreceptor cells.
Human induced pluripotent stem cells (hiPSCs) have emerged as a powerful tool for modeling human diseases in vitro [28]. In the absence of readily available patient-derived cell lines, CRISPR/Cas9 technology can be applied to generate hiPSCs carrying specific patient mutations in vitro, enabling the investigation of the pathogenic mechanisms of retinal diseases, like USH2 Syndrome. Such models make it possible not only to study the disease progression, but also to develop potential gene-based therapies or drug treatments. Retinal organoids represent a rapidly advancing application of hiPSCs technology. These three-dimensional in vitro structures recapitulate the layered architecture of the human retina, including rod and cone photoreceptors, and Müller glial cells, providing a more accurate representation of retinal development and disease mechanisms than traditional two-dimensional cell cultures. The differentiation of hiPSCs into retinal organoids allows the study of the impact of genetic mutations on retinal cell function in a more physiologically relevant context [29,30,31].
In this study, we describe the phenotype of differentiation day (DD) 225 retinal organoids bearing CRISPR/Cas9-engineered USH2A nonsense mutation in exon-13 compared with isogenic controls. Using immunohistochemical (IHC) analysis and single-cell RNA sequencing (scRNA-Seq) we observed loss of the usherin protein complex at the photoreceptor cilium, and disturbed homeostasis and activation of the innate immune system in the adjacent Müller glial cells. These models offer valuable insights into the cellular and molecular mechanisms underlying the USH2A disease, and can be used to test CRISPR/Cas9 homology independent targeted integration therapeutic strategies [32].
2. Results
2.1. Generation and Validation of hiPSCs Carrying Homozygous Nonsense Mutations in USH2A Exon-13 by CRISPR/Cas9
LUMC0004iCTRL10 [33], hereafter referred to as “ISO-CTRL”, was used as the parental cell line to generate hiPSC subclones carrying homozygous nonsense mutations in USH2A exon-13 by CRISPR/SpCas9 gene editing. The knock-out (KO) strategy was designed to target the exon-13 mutational hotspot by delivering a single-stranded oligodeoxynucleotide donor, containing a TAGT nucleotide sequence to disrupt the open reading frame (Figure S1A). This USH2A translation stop variant results in a truncated USH2A open reading frame c.2553_2554insTAGT, p.(Thr852*), with a similar structure and size as predicted in other patient mutations in exon-13 (Table 1).
Two examples are the USH2A c.2299del, p.(Glu767Serfs*21), affecting the EGF-Lam domain number 5, and the USH2A c.2599 C>T, p.(Gln867*), which results in a protein containing 6 complete EGF-Lam domains, but of a comparable length as the c.2553_2554insTAGT, p.(Thr852*) (Figure 1).
After a preliminary screening via restriction analysis, three independent USH2A 13KO subclones - labeled as 13KO E11, 13KO G8, and 13KO B7 - were selected (Table S1) and tested for the correct insertion of the stop codon through Sanger Sequencing (Figure S1B, Table S2). These hiPSC lines and their derived organoids will be referred to as “13KO” throughout the manuscript. Screening for recurrent genetic abnormalities in stem cells revealed no aberrant copy number variants (Figure S1C). All 3 subclones showed normal karyotypes and the short tandem repeats analysis confirmed their derivation from the same isogenic parental line (ISO-CTRL) (Figure S1D, E). When delivering SpCas9 and a targeting gRNA to hiPSCs, there is a small yet unneglectable risk that the editing will occur at undesired genomic locations [34]. For this reason, potential off-target effects were analyzed by sequencing the top 10 predicted sites (Figure S2, Table S2). While the first off-target region showed poor-quality sequencing reads in ISO-CTRL and 13KO, the other nine sites were successfully sequenced and confirmed to be free of unwanted gene editing events.
2.2. USH2A 13KO hiPSC-Derived Retinal Organoids Show Loss of Ciliary Localization of Usherin and Its Interacting Proteins
Following quality assessment, the three 13KO hiPSC subclones (13KO E11, 13KO G8, and 13KO B7) were differentiated into retinal organoids along with the ISO-CTRL until DD225, using a previously published protocol [35]. Upon light microscopy, no visible differences were observed in the 13KO retinal organoids when compared to their isogenic control. At DD225, all organoids displayed typical lamination and photoreceptor segment brush borders (Figure 2A). In order to analyze more thoroughly the effects of the USH2A KO, immunohistochemical analyses were performed.
Due to the reported usherin long form B localization to the photoreceptor connecting cilium, we first focused on a potential phenotype concerning photoreceptor cells. When stained with a homemade antibody against the usherin isoform B [36], 13KO organoids exhibited a loss of usherin ciliary localization compared to ISO-CTRL organoids (Figure 2B, E, H, K). Previous studies in animal models showed decreased expression and mislocalization of usherin as a result of Whrn knock-out [16], as well as mislocalization to the photoreceptor inner segments of a truncated usherin and its interactors, ADGRV1 and whirlin, when knocking-in the human c.2299delG USH2A variant [37]. Therefore, we were curious to investigate any potential effect of the USH2A 13KO on the localization of its directly interacting proteins in hiPSC-derived retinal organoids.
IHC analysis confirmed the loss of localization of ADGRV1 and whirlin at the photoreceptor cilial level (Figure 2C, D, F, G, I, J, L, M). However, when testing the presence of whirlin on a Western Blot, the protein was detected at similar levels in both the ISO-CTRL and in the 13KO retinal organoid lysates (Figure S3A-C), suggesting redistribution of whirlin throughout the photoreceptor cells.
We used ADP-ribosylation factor-like protein 13B (ARL13B) as a marker for the photoreceptor cilium axoneme, and we observed a statistically significant increase of the average ciliary length in two out of three 13KO subclones when compared to the ISO-CTRL, but not in the 13KO pool (Figure 2N).
The development of intact photoreceptor ciliary structures in the 13KO retinal organoids was further confirmed by transmission electron microscopy (TEM) analysis. The organoids differentiated from both the 13KO and the parental hiPSC lines showed inner-segment (IS)-like structures, characterized by the presence of mitochondria, a connecting cilium (CC), where usherin localizes in retinal organoids, with a clear basal body, and outer-segment (OS)-like structures, with photoreceptor disks at varying stages of maturation. Some 13KO organoids, like 13KO subclone B7, displayed poorly organized disks, while others exhibited a more structured arrangement (Figure 2O).
Some retinal diseases in mice are associated with disrupted trafficking of rhodopsin to the photoreceptor outer segments, and its subsequent retention in the cell bodies. In this study, we quantified the distribution of rhodopsin between the outer nuclear layer (ONL) and the photoreceptor segments (Figure 3A), and we observed no differences in the 13KO when compared to the parental line retinal organoids (Figure 3C).
Furthermore, we investigated whether the USH2A 13KO caused an alteration in the volume of the photoreceptor layer. The outer nuclear layer thickness was found to be not statistically significantly different in the 13KO compared to the control, except for the differentiations of subclone B7, which displayed a statistically significant decrease (Figure 3D). An effect was observed at the photoreceptor disk level of differentiations of the 13KO subclone G8 retinal organoids, which displayed a statistically significant lower intensity of the outer segment disk marker rod outer segment membrane protein 1 (ROM1), yet, not detected in the analysis of the 13KO pool (Figure 3B, E).
2.2. scRNA-Seq Analysis Reveals Activation of the Innate Immune Response and Disrupted Homeostasis in the USH2A 13KO Müller Glial Cells
Next, we used single-cell RNA sequencing (scRNA-Seq) to analyze the transcriptomic differences between the 13KO and ISO-CTRL organoids. Fourteen distinct clusters were identified based on their gene expression profiles, with all major retinal cell types, including photoreceptor cells (rods and cones), Müller glial cells (MGCs), ON and OFF bipolar cells, amacrine cells, and horizontal cells (Figure 4A).
Some clusters corresponded to more immature stages of development, specifically of photoreceptor cells (labeled as “Immature photoreceptors” and “Immature Cones”), and MGCs (including “Immature MGCs I”, “Immature MGCs II”, and “Very Immature MGCs”). Two rod photoreceptor cell subtypes, “Rods I” and “Rods II”, were identified. Upon further analysis, Rods I and Rods II seemed to have a highly similar profile, thus we decided to merge them into a single “Rods” cluster for downstream differential gene expression and pathway enrichment analyses.

A high degree of variability was observed in the cell-type composition of the retinal organoids across conditions. Despite immature photoreceptors and MGCs clusters being more prevalent in some organoids (Figure 4B), none of the processed samples could be considered outliers and they were all included in the downstream analysis. The enrichment in expression of a variable number of key cell-type specific genes displayed on a heatmap helped assigning the cluster identities (Figure 4C).
We performed a differential gene expression analysis to investigate any potential changes between the 13KO subclones and the isogenic control organoids. The expression of USH2A, ADGRV1 and WHRN was predominantly observed in photoreceptor cells and MGCs (Figure 5A, E, I).
Interestingly, the expression levels of USH2A (Figure 5B-D), ADGRV1 (Figure 5F-H), and WHRN (Figure 5J-L) were not statistically significantly different in the rods, cones, and MGCs of the 13KO lines when compared to the ISO-CTRL. No significant differential expression was found in some retinal cell types, such as amacrine cells or ON bipolar cells. Surprisingly, only three differentially expressed genes (DEGs) were detected in the cones of the 13KO subclone B7 (ASIC2, CC2D2A, ARHGAP35), whereas PSKH2 was differentially expressed exclusively in the subclone E11. Of these, CC2D2A was the only gene directly related to the cilia formation. However, the most substantial differences in gene expression were observed in the rods and MGCs clusters.
The DEGs detected in the rod photoreceptor cells were subjected to pathway enrichment analysis (based on Gene Ontology, KEGG and Reactome), which identified two main categories of affected biological processes. We labeled them as “Cellular response” and “Endolysosomal system”. The first group included terms involved in the activation of the interferon signaling and antigen presentation, whereas the second category included terms related to the endosome membrane and vacuolar pathway (Figure 6A).
To gain further insight into the specific genes involved, dot plots were used to visualize the differential expression of genes within each pathway category. Interestingly, the terms related to “Cellular response” and “Endolysosomal system” in the rods were associated with the same set of DEGs, namely B2M, HLA-C, HLA-A, HLA-B (Figure 6B).
A similar pathway enrichment analysis was performed on the MGCs. Unforeseen, a major and more complex phenotype was observed in this cluster, with the identification of four distinct groups of pathway terms. The most relevant pathway terms per each category occurring in at least two subclones were selected and displayed with the lowest detected adjusted p-value in a bar plot (Figure 7A).
The first one was a mixed group of terms related to “Translational response and Innate Immune system”. This included terms referring to translation initiation and elongation, nonsense mediated decay and viral infection responses triggering the activation of the innate immune system. The second category grouped together those terms related to other “Cellular response”, spanning from response to stress to response to stimuli. The third group was labeled as “Endolysosomal system”, including terms about vesicles and the endocytosis process, similarly to what observed in the rod photoreceptor cells. The fourth category was named “Protein folding and ubiquitination”, pointing to disturbances in protein quality control. Surprisingly, terms in the first three categories reached highly significant adjusted p-values, with peaks of 10-55, indicating an unexpected major phenotype in the MGCs caused by the USH2A 13KO mutation.
When looking into the genes associated with the terms indicative of a disrupted homeostasis, we identified thirteen genes being differentially expressed in the MGCs of all three 13KO subclones, compared to the ISO-CTRL (Figure 7B). Amongst these, CEBPD encodes for a transcription factor regulating the expression of genes involved in the immune and inflammatory responses, DYNC1I1 is involved in the motility of vesicles and organelles though microtubules, and MYO6 participates in the vesicular membrane trafficking and clathrin-mediated endocytosis.
The cluster enrichment of the transcripts related to these common 13 DEGs in the MGCs was depicted via UMAP plots (Figure 7C). This representation method was quite informative, indicating how somof the genes had a preferential expression in the MGCs cluster, like THY1, whereas others were more ubiquitously expressed, like SEC11C.
We decided to then expand our analysis, including also those genes that were differentially expressed in at least two out of three subclones and visualize them in separate dot plots organized per category (Figure 8).

The two MGC-associated DEGs that most caught our attention were IFITM2 (interferon induced transmembrane protein 2) and IFITM3 (interferon induced transmembrane protein 3), which turned out to be associated to terms related to both “Innate Immune system” and “Endolysosomal system” (Figure 8A, C). IFITM2 and IFITM3 are known to be involved in the anti-viral response mechanisms [38,39,40], suggesting the activation of the innate immune system upon the USH2A 13KO. When visualized on a UMAP, IFITM2 and IFITM3 turned out to be expressed almost exclusively in the MGCs (Figure S4A, B). Several other genes involved in the innate immune system were differentially expressed in the Müller glial cell cluster, i.e. ANO6, DYNC1I1, HSPA1A, COMT, FXYD1, TUBB4B, B2M, UBB, CEBPD (Figure 8A).
Knowing that IFITM2 and IFITM3 are interferon-stimulated genes, we wondered if there were any interferon-expressing cells in our retinal organoids. Therefore, we checked for the levels of IFNA1 (Interferon Alpha-1), IFNA2 (Interferon Alpha-2), IFNB1 (Interferon Beta-1), and IFNG (Interferon Gamma) in our scRNA-Seq dataset, but we found no detectable expression of these genes in the ISO-CTRL or 13KO retinal organoids.
2.3. Expression of USH2A Transcripts Encoding Usherin Isoform A and Usherin Isoform B in the Retinal Organoids
Once we assessed the genotypic impact of the USH2A 13KO on the retinal cell types, and specifically on the Müller glial cells, we investigated whether this was possibly due to the expression of a truncated mutant usherin in the photoreceptor cells or in the MGCs. To accurately distinguish the USH2A isoforms, the reference genome annotation was customized. All USH2A transcripts were removed, and only the transcripts encoding for the short isoform A and the long isoform B were reintroduced in our scRNA-Seq dataset, annotated as two independent gene features, namely “USH2A-short” and “USH2A-long”. This enabled us to perform an isoform-specific expression analysis in the Rods (Figure 9A, D), Cones (Figure 9B, E), and MGCs clusters (Figure 9C, F).
The violin plots showed that the USH2A-short transcript was expressed at a much lower level than the USH2A-long transcript across the analyzed clusters. Nonetheless, the USH2A-short transcript appeared to be enriched in the rod and cone photoreceptor cells, whereas its expression in the MGCs was almost negligible. These findings suggest that the genotypic effect observed on the MGCs homeostasis is likely driven by events or signals originating from the photoreceptor cells, where the short form A is mainly expressed.
2.4. The USH2A 13KO Müller Glial Cells Do Not Exhibit Morphological Changes
We proceeded to analyze any potential resulting phenotypic changes in the Müller glial cells. For instance, the presence of reactome terms like “response to stress” led us to expect high presence of Glial fibrillary acidic protein (GFAP) transcript and protein in the MGCs [41,42]. Surprisingly, we observed that only a few cells in the MGCs cluster showed presence of GFAP transcript, and the level of expression was relatively low (Figure S4C). The Western Blot and immunohistochemical analyses revealed no statistically significant differences in GFAP intensity in the 13KO organoids compared to the isogenic control line (Figure S3D-F, Figure S4D, F). Similarly, the staining against CD44, a marker for the apical processes of MGCs, revealed no significant changes (Figure S4E, G).
Altogether, these data show an unforeseen major genotypic effect on the MGCs caused by the USH2A 13KO mutation, which does not translate into morphological changes.
3. Discussion
In this study, we successfully generated by CRISPR/SpCas9 technology three hiPSC subclones carrying a homozygous nonsense mutation in USH2A exon-13 and differentiated them into retinal organoids for 225 days. The overall morphology of USH2A 13KO photoreceptor structures appeared largely unaffected. The outer nuclear layer (ONL) thickness and the distribution of rhodopsin, a key rod photoreceptor protein, between the ONL and the photoreceptor segments were preserved. Furthermore, only one 13KO subclone showed a significant difference in the intensity of the disk marker ROM1 when compared to the controls, although photoreceptor disks already showed varying stages of outer segment development in the TEM images.
Despite the average ciliary length being significantly increased in two 13KO subclones, this did not reach statistical significance in the comparison of the 13KO pool to the ISO-CTRL. Our data do not fully support the affected ciliogenesis detected in cells derived from non-syndromic RP and USH patients, where the fibroblasts carrying mutations in the USH2A gene developed a 1.5 fold longer cilium than in the controls [31]. However, the findings related to the ciliary length in our 13KO retinal organoids are in contrast with what previously investigated in mice, where the Ush2adelG/delG variant caused the early onset shortening of the photoreceptor cilium [37].
This study also observed that the long isoform B of usherin, along with its interacting proteins ADGRV1 and whirlin, were no longer detectable at the photoreceptor ciliary level in the USH2A 13KO retinal organoids, compared to the isogenic controls. Yet, the presence of their transcripts in our scRNA-Seq data, as well as the detection of whirlin via Western Blot, suggest that these proteins can still be produced, but might be mislocalized in the photoreceptors or trapped in the endoplasmic reticulum (ER) or Golgi apparatus. This is consistent with what was previously observed in a knock-in mouse expressing the common human disease-mutation, c.2299delG. In that model, usherin was truncated and glycosylated, and accumulated in the ER, causing cellular stress and disrupting the localization of ADGRV1 and whirlin at the periciliary membrane complex, which were trapped in vesicles in the inner segments [37].
The co-dependence of proteins within the USH2 complex had been already highlighted earlier in a knock-out murine model of Whrn, where usherin expression was decreased and its localization in the ciliary pocket compromised [16].
The impaired assembly and function of the usherin interactome in response to USH2A mutations was further investigated in hiPSC-derived retinal organoids. Whilst usherin and ADGRV1 were correctly detectable at the base of the connecting cilium in the isogenic controls, both proteins were mislocalized to the inner segments of organoids carrying USH2A variants responsible for either retinitis pigmentosa or USH2 [31]. The nonsense mediated decay (NMD)-related reactome terms in the MGCs suggest that the NMD might be affected to an extent that is no longer sufficient to clear the USH2A transcripts containing premature stop codons.
The anti-usherin antibody used in this analysis was raised against the C-terminal region of the protein, and therefore only able to detect the usherin long isoform B. We believe that a usherin mutant short form A (851 aa) or other protein might be secreted by the photoreceptor cells and endocytosed by the MGCs, triggering a cellular innate immune response, due to being recognized as a “foreign” or misfolded protein. This could explain the significant dysregulation of the endolysosomal system and the activation of the innate immune system in the MGCs of the USH2A 13KO organoids. This idea is further supported by the gene ontology terms indicative of protein misfolding, leading to the ubiquitination process. The entire cellular homeostasis in the MGCs of 13KO retinal organoids resulted compromised, spanning from translation to cellular response to stimuli.
The detection of the USH2A transcript encoding the short usherin isoform A primarily in rods, and to a lesser extent in cones, rather than in the Müller glial cells, suggests that the MGCs function as sensors of events occurring in the photoreceptor cells and respond by exhibiting signs of disrupted homeostasis. Differential expression of interferon-stimulated genes (IFITM2 and IFITM3) was observed, indicating an innate immune response, similarly observed upon viral infection. In fact, the release of type I and type II interferons induced by a pathogenic challenge upregulate IFITM3 expression, which inhibits the entry of viruses into the host cells. Localizing to the endosomal compartment, IFITM3 alters the rigidity and pH of cellular membranes, preventing the virus replication [39,43].
We infer that the usherin mutant short form A or other protein might be recognized as a pathogen, triggering the activation of those pathways normally taking place after infection by Influenza or SARS-CoV viruses.
Further studies need to investigate the molecular mechanisms behind the involvement of a cellular innate immune response in the USH2A 13KO retinal organoids.
Interestingly, the MGCs genotypic changes detected in our scRNA-Seq dataset were not reflected in a pronounced altered morphological phenotype. Despite the relevance of reactome terms indicating the activation of the MGCs response to stress, the intensity of GFAP, a marker of gliosis, was not statistically different in the 13KO subclones compared to the ISO-CTRL. Additionally, the apical villi of MGCs, as observed through CD44 staining and by TEM, were preserved in the mutant organoids, suggesting that there were no significant structural defects in the MGCs upon the KO of USH2A in exon-13.
This analysis provided a comprehensive overview of the molecular pathways most affected by the USH2A 13KO mutation. Although the photoreceptor cells showed some alterations in their expression profile, the most pronounced genetic changes occurred in the MGCs. Unexpectedly, these cells showed disruptions in several critical processes, including translation, immune response, and protein folding. The involvement of MGCs in the Usher 1C disease has been previously investigated [44,45,46], but the exact mechanisms of action remain unclear.
The short 851 aa usherin resulting from our KO design in USH2A exon-13 mimics the truncated usherin produced in several patients with mutations in exon-13, such as c.2299delG and c.2599 C>T (Table 1). Since those proteins share the same size range and functional domains, we can hypothesize that the phenotype observed in our 13KO retinal organoids faithfully recapitulate the phenotype of patients carrying other mutations in USH2A exon-13, shedding light on a better comprehension of the pathogenic mechanisms behind Usher Syndrome type II.
In conclusion, this study suggests that, while the photoreceptor cells in the retinal organoids showed a loss of shuttling of usherin complex proteins to the cilium, the rod and cone photoreceptors were not severely affected at the gene expression level by the introduction of a nonsense mutation in exon-13 of the USH2A gene, whereas the Müller glial cells were strongly impacted, possibly playing a significant role in the pathogenesis of USH2A-related retinal diseases. Further investigation is needed to better unravel the mechanisms underlying the activation of the innate immune system and its implications for retinal disease progression and retinal gene therapy.
4. Materials and Methods
4.1. CRISPR/Cas9-Mediated Genome Editing in hiPSCs
The SpCas9-gRNA targeting USH2A exon-13 (crRNA) was selected based on the predicted highest efficiency and lowest number of off-target sites according to the integrated DNA technology (IDT) software. A single-stranded oligodeoxynucleotide was designed to contain 4 extra nucleotides forming a premature stop codon and disrupting the reading frame after integration at the desired locus (Table S2). The correct insertion in the genome recreates the ScaI restriction site, useful for screening purposes. Both the crRNA and the ssODN were dissolved in the Nuclease-Free Duplex Buffer to 100 µM stock. The ssODN was further resuspended in Resuspension Buffer R to working concentration. The crRNA and the tracrRNA were mixed together and incubated at 95°C for 5 minutes, in the presence of the Nuclease-Free Duplex Buffer to obtain the gRNA duplex. Once cooled down to room temperature (RT), the gRNA was incubated for 20 minutes with SpCas9 Nuclease V3 in Resuspension Buffer R, to form the ribonucleoprotein (RNP) complex. hiPSCs were seeded on Matrigel-coated 6-well plates and passaged mechanically with Gentle Cell Dissociation reagent (GCDR), according to manufacturer’s instructions. When ready for genome editing, the culturing medium was substituted with 1 mL/per well of Accumax, to improve single-cell dissociation. Cells were incubated for 7 minutes at 37°C and collected in DMEM/F12. An aliquot of 3.6x10⁵ cells was centrifuged at 1100 rpm for 3 minutes and resuspended in 27 µL of buffer R. The delivery of 4 µL of the ssODN + 2 µL of the RNP complex to 18 µL of cell suspension was mediated by electroporation, using the Neon Transfection System with pulse conditions set to 1200V/30ms/1pulse. Thereafter, the sample was immediately transferred into a new 12-wells plate containing prewarmed medium. Cell handling after electroporation and colony screening technique are described in the Supplementary Methods. Materials can be found in Table S3.
4.2. Cell Culture and Retinal Organoids Differentiation
We previously described the male control line LUMC0004iCTRL10 [33], here labelled as ISO-CTRL and used as a parental cell line. Characterization of undifferentiated state and pluripotency is available under the hPSC registry name LUMCi029-B. Cryopreserved hiPSCs (passage number p3) were thawed at 37°C, resuspended in mTeSR plus + 0.1% Fasudil HCl, and seeded on Matrigel-coated 6-well plates. After three weeks (passage number p9), confluent hiPSCs were resuspended in mTeSR plus + 10 µM blebbistatin. One million cells were seeded in each agarose micro-mold placed in a 12-well plate and incubated overnight, as previously reported [35]. In short, medium was gradually transitioned to Neural Induction Medium 1 (NIM1). The newly formed embryoid bodies (EBs) were seeded on Matrigel-coated 6-wells plates in NIM1. Smoothened agonist (SAG) (100 nM) was added from DD10, and from DD16, the EBs were cultured in Neural Induction Medium 2 (NIM2) with SAG. Between DD21 and DD28, neuroepithelial structures were mechanically lifted and cultured on agarose-coated 48-well plates with NIM2. From DD35 to DD44, organoids were feeded with Retinal Lamination Medium 1 (RLM1) + 1 µM of retinoic acid, then RLM1 + 1 µM of retinoic acid + 10 µM of gamma secretase inhibitor IX (DAPT) until DD55. From DD56, organoids were cultured with RLM1 + 1 µM of retinoic acid until DD85, then switched to Retinal Lamination Medium 2 (RLM2) + 0.5 µM of retinoic acid. From DD120, RLM2 alone was used until collection. Medium composition and materials are detailed in the Supplementary Methods and Table S3.
4.3. Immunohistochemical Analysis
Retinal organoids at DD225 were fixed with 4% paraformaldehyde in PBS for 20 minutes at RT, rinsed with PBS for 1 minute, and subsequently incubated with 15% sucrose in PBS for 30 minutes and with 30% sucrose in PBS for at least 1 hour, until organoids sank to the bottom of the well. Thereafter, they were embedded in Tissue-Tek O.C.T. Compound, and sliced into 8 µm cryosections using the Leica CM1900 cryostat. Slides were stored at -20 °C until use. Immunohistochemical analysis was performed as previously described [29]. Three images were taken per single organoid with 40x and 100x magnification. Information related to the materials and antibodies used in this study are reported in Table S3 and Table S4. The detailed protocol can be consulted in the Supplementary Methods.
4.4. Quantification and Statistical Analysis
Quantification was performed using Fiji ImageJ. The outer nuclear layer (ONL) thickness was manually quantified from three independent regions in each image. For the ARL13 length quantification, the length of all photoreceptor cilia in the image was measured and then averaged per organoid. For the rhodopsin distribution between the ONL and the photoreceptor segments, two ROIs were drawn following the F-actin staining at the outer limiting membrane and the intensity for each ROI was measured and expressed as a fraction of the total intensity. For the GFAP and CD44 IHC quantification, intensity was measured per field of view. For the ROM1 quantification, intensity per field of view was measured and plotted with set cut-off value of 50.000.000. Graphs were generated using GraphPad Prism, where each datapoint corresponds to an individual organoid and results from the average of three independent images. Data are presented as mean per organoid ± standard error of the mean. Significance was calculated by one-way ANOVA followed by Dunnett’s multiple comparisons test, and indicated as p < 0.05 (*), p < 0.01 (**), p < 0.001 (***), and ns (not significant). At least three different batches of differentiation were analyzed to confirm the phenotype.
4.5. Single-Cell RNA Sequencing
Single-cell RNA sequencing data was generated using the Chromium 10x 3’UTR-sequencing. Number of organoids used: ISO-CTRL n = 4, 13KO E11 n = 4, 13KO G8 n = 3, 13KO B7 n = 3 from the same differentiation round. Once the organoids were dissociated into single cells using the Papain Dissociation kit, the suspensions were loaded onto the Chromium Single Cell system using the v3 chemistry. Subsequent steps were performed according to the manufacturer’s instructions. Cell Ranger (v7.1.0) pipeline (10X Genomics) was used to process raw sequencing output with the default human genome reference GRCh38. Filtered expression matrices were further processed with a Seurat-based workflow in R (v4.4.0). In the differential gene expression analysis, the Mann-Whitney U test was applied. Detailed downstream analysis is described in the Supplementary Methods.
Supplementary Materials
The following supporting information can be downloaded at the website of this paper posted on Preprints.org. Figures S1-S4; Tables S1-S4; Supplementary Methods.
Author Contributions
Conceptualization, R.V. and J.W.; methodology, R.V., X.L., A.McD., A.M., R.M., and I.M.; software, R.V., I.M., R.M., S.K., and H.M.; validation, R.V., I.M., R.M., A.M.; formal analysis, R.V.; investigation, R.V., X.L., A.McD., A.M., R.K.; resources, J.Y.; data curation, R.V., R.M., and I.M.; writing—original draft preparation, R.V.; writing—review and editing, R.V. and J.W.; visualization, R.V.; supervision, J.W.; project administration, J.W.; funding acquisition, J.W. All authors have read and agreed to the published version of the manuscript.
Funding
This research was funded by the Dutch Blindness Funds (Uitzicht 2021-11 to J.W.; Uitzicht 2023-05 to J.W.): Stichting UsherSyndroom, Stichting Oogfonds, Rotterdamse Stichting Blindenbelangen, Landelijke Stichting voor Blinden en Slechtzienden, Stichting Retina Nederland Fonds, and Stichting Blindenhulp.
Data Availability Statement
The data that support the findings of this study are available from the corresponding author upon reasonable request. scRNA-Seq data are openly available at the NCBI Gene Expression Omnibus database (GEO: GSE290344).
Acknowledgments
The authors would like to thank Carmen Gallego for guidance and scientific advice during the early stages of the project, and all the members of the Wijnholds lab, and specifically Charlotte Andriessen, for advice on experiments involving retinal organoids.
Conflicts of Interest
The authors declare no conflicts of interest. The funders had no role in the design of the study; in the collection, analyses, or interpretation of data; in the writing of the manuscript; or in the decision to publish the results.
Abbreviations
The following abbreviations are used in this manuscript:
| AAV | Adeno-associated viral vectors |
| DD | Differentiation day |
| DEG | Differentially expressed gene |
| MGCs | Müller glial cells |
| ONL | Outer nuclear layer |
| TEM | Transmission electron microscopy |
| UMAP | Uniform Manifold Approximation and Projection |
References
- Ordonez-Labastida, V.; Chacon-Camacho, O.F.; Lopez-Rodriguez, V.R.; Zenteno, J.C. USH2A mutational spectrum causing syndromic and non-syndromic retinal dystrophies in a large cohort of Mexican patients. Mol Vis 2023, 29, 31–38. [Google Scholar]
- Eudy, J.D.; Weston, M.D.; Yao, S.; Hoover, D.M.; Rehm, H.L.; Ma-Edmonds, M.; Yan, D.; Ahmad, I.; Cheng, J.J.; Ayuso, C.; et al. Mutation of a gene encoding a protein with extracellular matrix motifs in Usher syndrome type IIa. Science 1998, 280, 1753–1757. [Google Scholar] [CrossRef]
- Liu, X.Z.; Hope, C.; Liang, C.Y.; Zou, J.M.; Xu, L.R.; Cole, T.; Mueller, R.F.; Bundey, S.; Nance, W.; Steel, K.P.; et al. A mutation (2314delG) in the Usher syndrome type IIA gene: high prevalence and phenotypic variation. Am J Hum Genet 1999, 64, 1221–1225. [Google Scholar] [CrossRef]
- Weston, M.D.; Eudy, J.D.; Fujita, S.; Yao, S.; Usami, S.; Cremers, C.; Greenberg, J.; Ramesar, R.; Martini, A.; Moller, C.; et al. Genomic structure and identification of novel mutations in usherin, the gene responsible for Usher syndrome type IIa. Am J Hum Genet 2000, 66, 1199–1210. [Google Scholar] [CrossRef]
- Baux, D.; Blanchet, C.; Hamel, C.; Meunier, I.; Larrieu, L.; Faugere, V.; Vache, C.; Castorina, P.; Puech, B.; Bonneau, D.; et al. Enrichment of LOVD-USHbases with 152 USH2A genotypes defines an extensive mutational spectrum and highlights missense hotspots. Hum Mutat 2014, 35, 1179–1186. [Google Scholar] [CrossRef]
- Dreyer, B.; Brox, V.; Tranebjaerg, L.; Rosenberg, T.; Sadeghi, A.M.; Moller, C.; Nilssen, O. Spectrum of USH2A mutations in Scandinavian patients with Usher syndrome type II. Hum Mutat 2008, 29, 451. [Google Scholar] [CrossRef] [PubMed]
- Aller, E.; Larrieu, L.; Jaijo, T.; Baux, D.; Espinos, C.; Gonzalez-Candelas, F.; Najera, C.; Palau, F.; Claustres, M.; Roux, A.F.; et al. The USH2A c.2299delG mutation: dating its common origin in a Southern European population. Eur J Hum Genet 2010, 18, 788–793. [Google Scholar] [CrossRef] [PubMed]
- Dreyer, B.; Tranebjaerg, L.; Brox, V.; Rosenberg, T.; Moller, C.; Beneyto, M.; Weston, M.D.; Kimberling, W.J.; Cremers, C.W.; Liu, X.Z.; et al. A common ancestral origin of the frequent and widespread 2299delG USH2A mutation. Am J Hum Genet 2001, 69, 228–234. [Google Scholar] [CrossRef]
- Perez-Carro, R.; Blanco-Kelly, F.; Galbis-Martinez, L.; Garcia-Garcia, G.; Aller, E.; Garcia-Sandoval, B.; Minguez, P.; Corton, M.; Mahillo-Fernandez, I.; Martin-Merida, I.; et al. Unravelling the pathogenic role and genotype-phenotype correlation of the USH2A p.(Cys759Phe) variant among Spanish families. PLoS One 2018, 13, e0199048. [Google Scholar] [CrossRef] [PubMed]
- Rivolta, C.; Berson, E.L.; Dryja, T.P. Paternal uniparental heterodisomy with partial isodisomy of chromosome 1 in a patient with retinitis pigmentosa without hearing loss and a missense mutation in the Usher syndrome type II gene USH2A. Arch Ophthalmol 2002, 120, 1566–1571. [Google Scholar] [CrossRef]
- Han, S.; Wang, Q.; Cheng, M.; Hu, Y.; Liu, P.; Hou, W.; Liang, L. The effects of ush2a gene knockout on vesicle transport in photoreceptors. Gene 2024, 892, 147885. [Google Scholar] [CrossRef]
- Liu, X.; Bulgakov, O.V.; Darrow, K.N.; Pawlyk, B.; Adamian, M.; Liberman, M.C.; Li, T. Usherin is required for maintenance of retinal photoreceptors and normal development of cochlear hair cells. Proc Natl Acad Sci U S A 2007, 104, 4413–4418. [Google Scholar] [CrossRef] [PubMed]
- Sahly, I.; Dufour, E.; Schietroma, C.; Michel, V.; Bahloul, A.; Perfettini, I.; Pepermans, E.; Estivalet, A.; Carette, D.; Aghaie, A.; et al. Localization of Usher 1 proteins to the photoreceptor calyceal processes, which are absent from mice. J Cell Biol 2012, 199, 381–399. [Google Scholar] [CrossRef]
- Dona, M.; Slijkerman, R.; Lerner, K.; Broekman, S.; Wegner, J.; Howat, T.; Peters, T.; Hetterschijt, L.; Boon, N.; de Vrieze, E.; et al. Usherin defects lead to early-onset retinal dysfunction in zebrafish. Exp Eye Res 2018, 173, 148–159. [Google Scholar] [CrossRef]
- Zou, J.; Li, R.; Wang, Z.; Yang, J. Studies of the Periciliary Membrane Complex in the Syrian Hamster Photoreceptor. Adv Exp Med Biol 2019, 1185, 543–547. [Google Scholar] [CrossRef] [PubMed]
- Zou, J.; Luo, L.; Shen, Z.; Chiodo, V.A.; Ambati, B.K.; Hauswirth, W.W.; Yang, J. Whirlin replacement restores the formation of the USH2 protein complex in whirlin knockout photoreceptors. Invest Ophthalmol Vis Sci 2011, 52, 2343–2351. [Google Scholar] [CrossRef]
- Reiners, J.; van Wijk, E.; Marker, T.; Zimmermann, U.; Jurgens, K.; te Brinke, H.; Overlack, N.; Roepman, R.; Knipper, M.; Kremer, H.; et al. Scaffold protein harmonin (USH1C) provides molecular links between Usher syndrome type 1 and type 2. Hum Mol Genet 2005, 14, 3933–3943. [Google Scholar] [CrossRef] [PubMed]
- Sorusch, N.; Bauss, K.; Plutniok, J.; Samanta, A.; Knapp, B.; Nagel-Wolfrum, K.; Wolfrum, U. Characterization of the ternary Usher syndrome SANS/ush2a/whirlin protein complex. Hum Mol Genet 2017, 26, 1157–1172. [Google Scholar] [CrossRef]
- Knapp, B.; Roedig, J.; Roedig, H.; Krzysko, J.; Horn, N.; Guler, B.E.; Kusuluri, D.K.; Yildirim, A.; Boldt, K.; Ueffing, M.; et al. Affinity Proteomics Identifies Interaction Partners and Defines Novel Insights into the Function of the Adhesion GPCR VLGR1/ADGRV1. Molecules 2022, 27. [Google Scholar] [CrossRef]
- Linnert, J.; Knapp, B.; Guler, B.E.; Boldt, K.; Ueffing, M.; Wolfrum, U. Usher syndrome proteins ADGRV1 (USH2C) and CIB2 (USH1J) interact and share a common interactome containing TRiC/CCT-BBS chaperonins. Front Cell Dev Biol 2023, 11, 1199069. [Google Scholar] [CrossRef]
- Krzysko, J.; Maciag, F.; Mertens, A.; Guler, B.E.; Linnert, J.; Boldt, K.; Ueffing, M.; Nagel-Wolfrum, K.; Heine, M.; Wolfrum, U. The Adhesion GPCR VLGR1/ADGRV1 Regulates the Ca(2+) Homeostasis at Mitochondria-Associated ER Membranes. Cells 2022, 11. [Google Scholar] [CrossRef] [PubMed]
- Linnert, J.; Guler, B.E.; Krzysko, J.; Wolfrum, U. The adhesion G protein-coupled receptor VLGR1/ADGRV1 controls autophagy. Basic Clin Pharmacol Toxicol 2023, 133, 313–330. [Google Scholar] [CrossRef] [PubMed]
- Maddalena, A.; Tornabene, P.; Tiberi, P.; Minopoli, R.; Manfredi, A.; Mutarelli, M.; Rossi, S.; Simonelli, F.; Naggert, J.K.; Cacchiarelli, D.; et al. Triple Vectors Expand AAV Transfer Capacity in the Retina. Mol Ther 2018, 26, 524–541. [Google Scholar] [CrossRef] [PubMed]
- Sanjurjo-Soriano, C.; Erkilic, N.; Baux, D.; Mamaeva, D.; Hamel, C.P.; Meunier, I.; Roux, A.F.; Kalatzis, V. Genome Editing in Patient iPSCs Corrects the Most Prevalent USH2A Mutations and Reveals Intriguing Mutant mRNA Expression Profiles. Mol Ther Methods Clin Dev 2020, 17, 156–173. [Google Scholar] [CrossRef]
- Tachida, Y.; Manian, K.V.; Butcher, R.; Levy, J.M.; Pendse, N.; Hennessey, E.; Liu, D.R.; Pierce, E.A.; Liu, Q.; Comander, J. Systematic empirical evaluation of individual base editing targets: validating therapeutic targets in USH2A and comparison of methods. Mol Ther 2025. [Google Scholar] [CrossRef]
- Samanta, A.; Stingl, K.; Kohl, S.; Ries, J.; Linnert, J.; Nagel-Wolfrum, K. Ataluren for the Treatment of Usher Syndrome 2A Caused by Nonsense Mutations. Int J Mol Sci 2019, 20. [Google Scholar] [CrossRef]
- Dulla, K.; Slijkerman, R.; van Diepen, H.C.; Albert, S.; Dona, M.; Beumer, W.; Turunen, J.J.; Chan, H.L.; Schulkens, I.A.; Vorthoren, L.; et al. Antisense oligonucleotide-based treatment of retinitis pigmentosa caused by USH2A exon 13 mutations. Mol Ther 2021, 29, 2441–2455. [Google Scholar] [CrossRef]
- Liu, X.; Lillywhite, J.; Zhu, W.; Huang, Z.; Clark, A.M.; Gosstola, N.; Maguire, C.T.; Dykxhoorn, D.; Chen, Z.Y.; Yang, J. Generation and Genetic Correction of USH2A c.2299delG Mutation in Patient-Derived Induced Pluripotent Stem Cells. Genes (Basel) 2021, 12. [Google Scholar] [CrossRef]
- Boon, N.; Lu, X.; Andriessen, C.A.; Moustakas, I.; Buck, T.M.; Freund, C.; Arendzen, C.H.; Bohringer, S.; Mei, H.; Wijnholds, J. AAV-mediated gene augmentation therapy of CRB1 patient-derived retinal organoids restores the histological and transcriptional retinal phenotype. Stem Cell Reports 2023, 18, 1123–1137. [Google Scholar] [CrossRef]
- Buck, T.M.; Quinn, P.M.J.; Pellissier, L.P.; Mulder, A.A.; Jongejan, A.; Lu, X.; Boon, N.; Koot, D.; Almushattat, H.; Arendzen, C.H.; et al. CRB1 is required for recycling by RAB11A+ vesicles in human retinal organoids. Stem Cell Reports 2023, 18, 1793–1810. [Google Scholar] [CrossRef]
- Sanjurjo-Soriano, C.; Jimenez-Medina, C.; Erkilic, N.; Cappellino, L.; Lefevre, A.; Nagel-Wolfrum, K.; Wolfrum, U.; Van Wijk, E.; Roux, A.F.; Meunier, I.; et al. USH2A variants causing retinitis pigmentosa or Usher syndrome provoke differential retinal phenotypes in disease-specific organoids. HGG Adv 2023, 4, 100229. [Google Scholar] [CrossRef]
- Suzuki, K.; Tsunekawa, Y.; Hernandez-Benitez, R.; Wu, J.; Zhu, J.; Kim, E.J.; Hatanaka, F.; Yamamoto, M.; Araoka, T.; Li, Z.; et al. In vivo genome editing via CRISPR/Cas9 mediated homology-independent targeted integration. Nature 2016, 540, 144–149. [Google Scholar] [CrossRef]
- Quinn, P.M.; Buck, T.M.; Mulder, A.A.; Ohonin, C.; Alves, C.H.; Vos, R.M.; Bialecka, M.; van Herwaarden, T.; van Dijk, E.H.C.; Talib, M.; et al. Human iPSC-Derived Retinas Recapitulate the Fetal CRB1 CRB2 Complex Formation and Demonstrate that Photoreceptors and Muller Glia Are Targets of AAV5. Stem Cell Reports 2019, 12, 906–919. [Google Scholar] [CrossRef]
- Guo, C.; Ma, X.; Gao, F.; Guo, Y. Off-target effects in CRISPR/Cas9 gene editing. Front Bioeng Biotechnol 2023, 11, 1143157. [Google Scholar] [CrossRef]
- McDonald, A.; Gallego, C.; Andriessen, C.; Orlova, M.; Goncalves, M.; Wijnholds, J. Conventional and Tropism-Modified High-Capacity Adenoviral Vectors Exhibit Similar Transduction Profiles in Human iPSC-Derived Retinal Organoids. Int J Mol Sci 2025, 26. [Google Scholar] [CrossRef] [PubMed]
- Zou, J.; Mathur, P.D.; Zheng, T.; Wang, Y.; Almishaal, A.; Park, A.H.; Yang, J. Individual USH2 proteins make distinct contributions to the ankle link complex during development of the mouse cochlear stereociliary bundle. Hum Mol Genet 2015, 24, 6944–6957. [Google Scholar] [CrossRef] [PubMed]
- Tebbe, L.; Mwoyosvi, M.L.; Crane, R.; Makia, M.S.; Kakakhel, M.; Cosgrove, D.; Al-Ubaidi, M.R.; Naash, M.I. The usherin mutation c.2299delG leads to its mislocalization and disrupts interactions with whirlin and VLGR1. Nat Commun 2023, 14, 972. [Google Scholar] [CrossRef]
- Gomez-Herranz, M.; Taylor, J.; Sloan, R.D. IFITM proteins: Understanding their diverse roles in viral infection, cancer, and immunity. J Biol Chem 2023, 299, 102741. [Google Scholar] [CrossRef] [PubMed]
- Xie, Q.; Wang, L.; Liao, X.; Huang, B.; Luo, C.; Liao, G.; Yuan, L.; Liu, X.; Luo, H.; Shu, Y. Research Progress into the Biological Functions of IFITM3. Viruses 2024, 16. [Google Scholar] [CrossRef]
- Wang, J.; Luo, Y.; Katiyar, H.; Liang, C.; Liu, Q. The Antiviral Activity of Interferon-Induced Transmembrane Proteins and Virus Evasion Strategies. Viruses 2024, 16. [Google Scholar] [CrossRef]
- Navneet, S.; Wilson, K.; Rohrer, B. Muller Glial Cells in the Macula: Their Activation and Cell-Cell Interactions in Age-Related Macular Degeneration. Invest Ophthalmol Vis Sci 2024, 65, 42. [Google Scholar] [CrossRef] [PubMed]
- Kang, S.; Larbi, D.; Andrade, M.; Reardon, S.; Reh, T.A.; Wohl, S.G. A Comparative Analysis of Reactive Muller Glia Gene Expression After Light Damage and microRNA-Depleted Muller Glia-Focus on microRNAs. Front Cell Dev Biol 2020, 8, 620459. [Google Scholar] [CrossRef] [PubMed]
- Diamond, M.S.; Farzan, M. The broad-spectrum antiviral functions of IFIT and IFITM proteins. Nat Rev Immunol 2013, 13, 46–57. [Google Scholar] [CrossRef] [PubMed]
Figure 1.
Schematics of usherin domains in the natural occurring usherin isoforms compared to patient variants and USH2A 13KO. From top to bottom, depiction of the protein domains in the usherin long isoform B, the usherin short isoform A, and the usherin resulting from patient mutation c.2299del, c.2553_2554insTAGT (introduced in USH2A exon-13 by CRISPR/Cas9 in this study), and patient variant c.2599 C>T. Yellow stop sign indicates which EGF-Laminin domain is affected upon mutation.
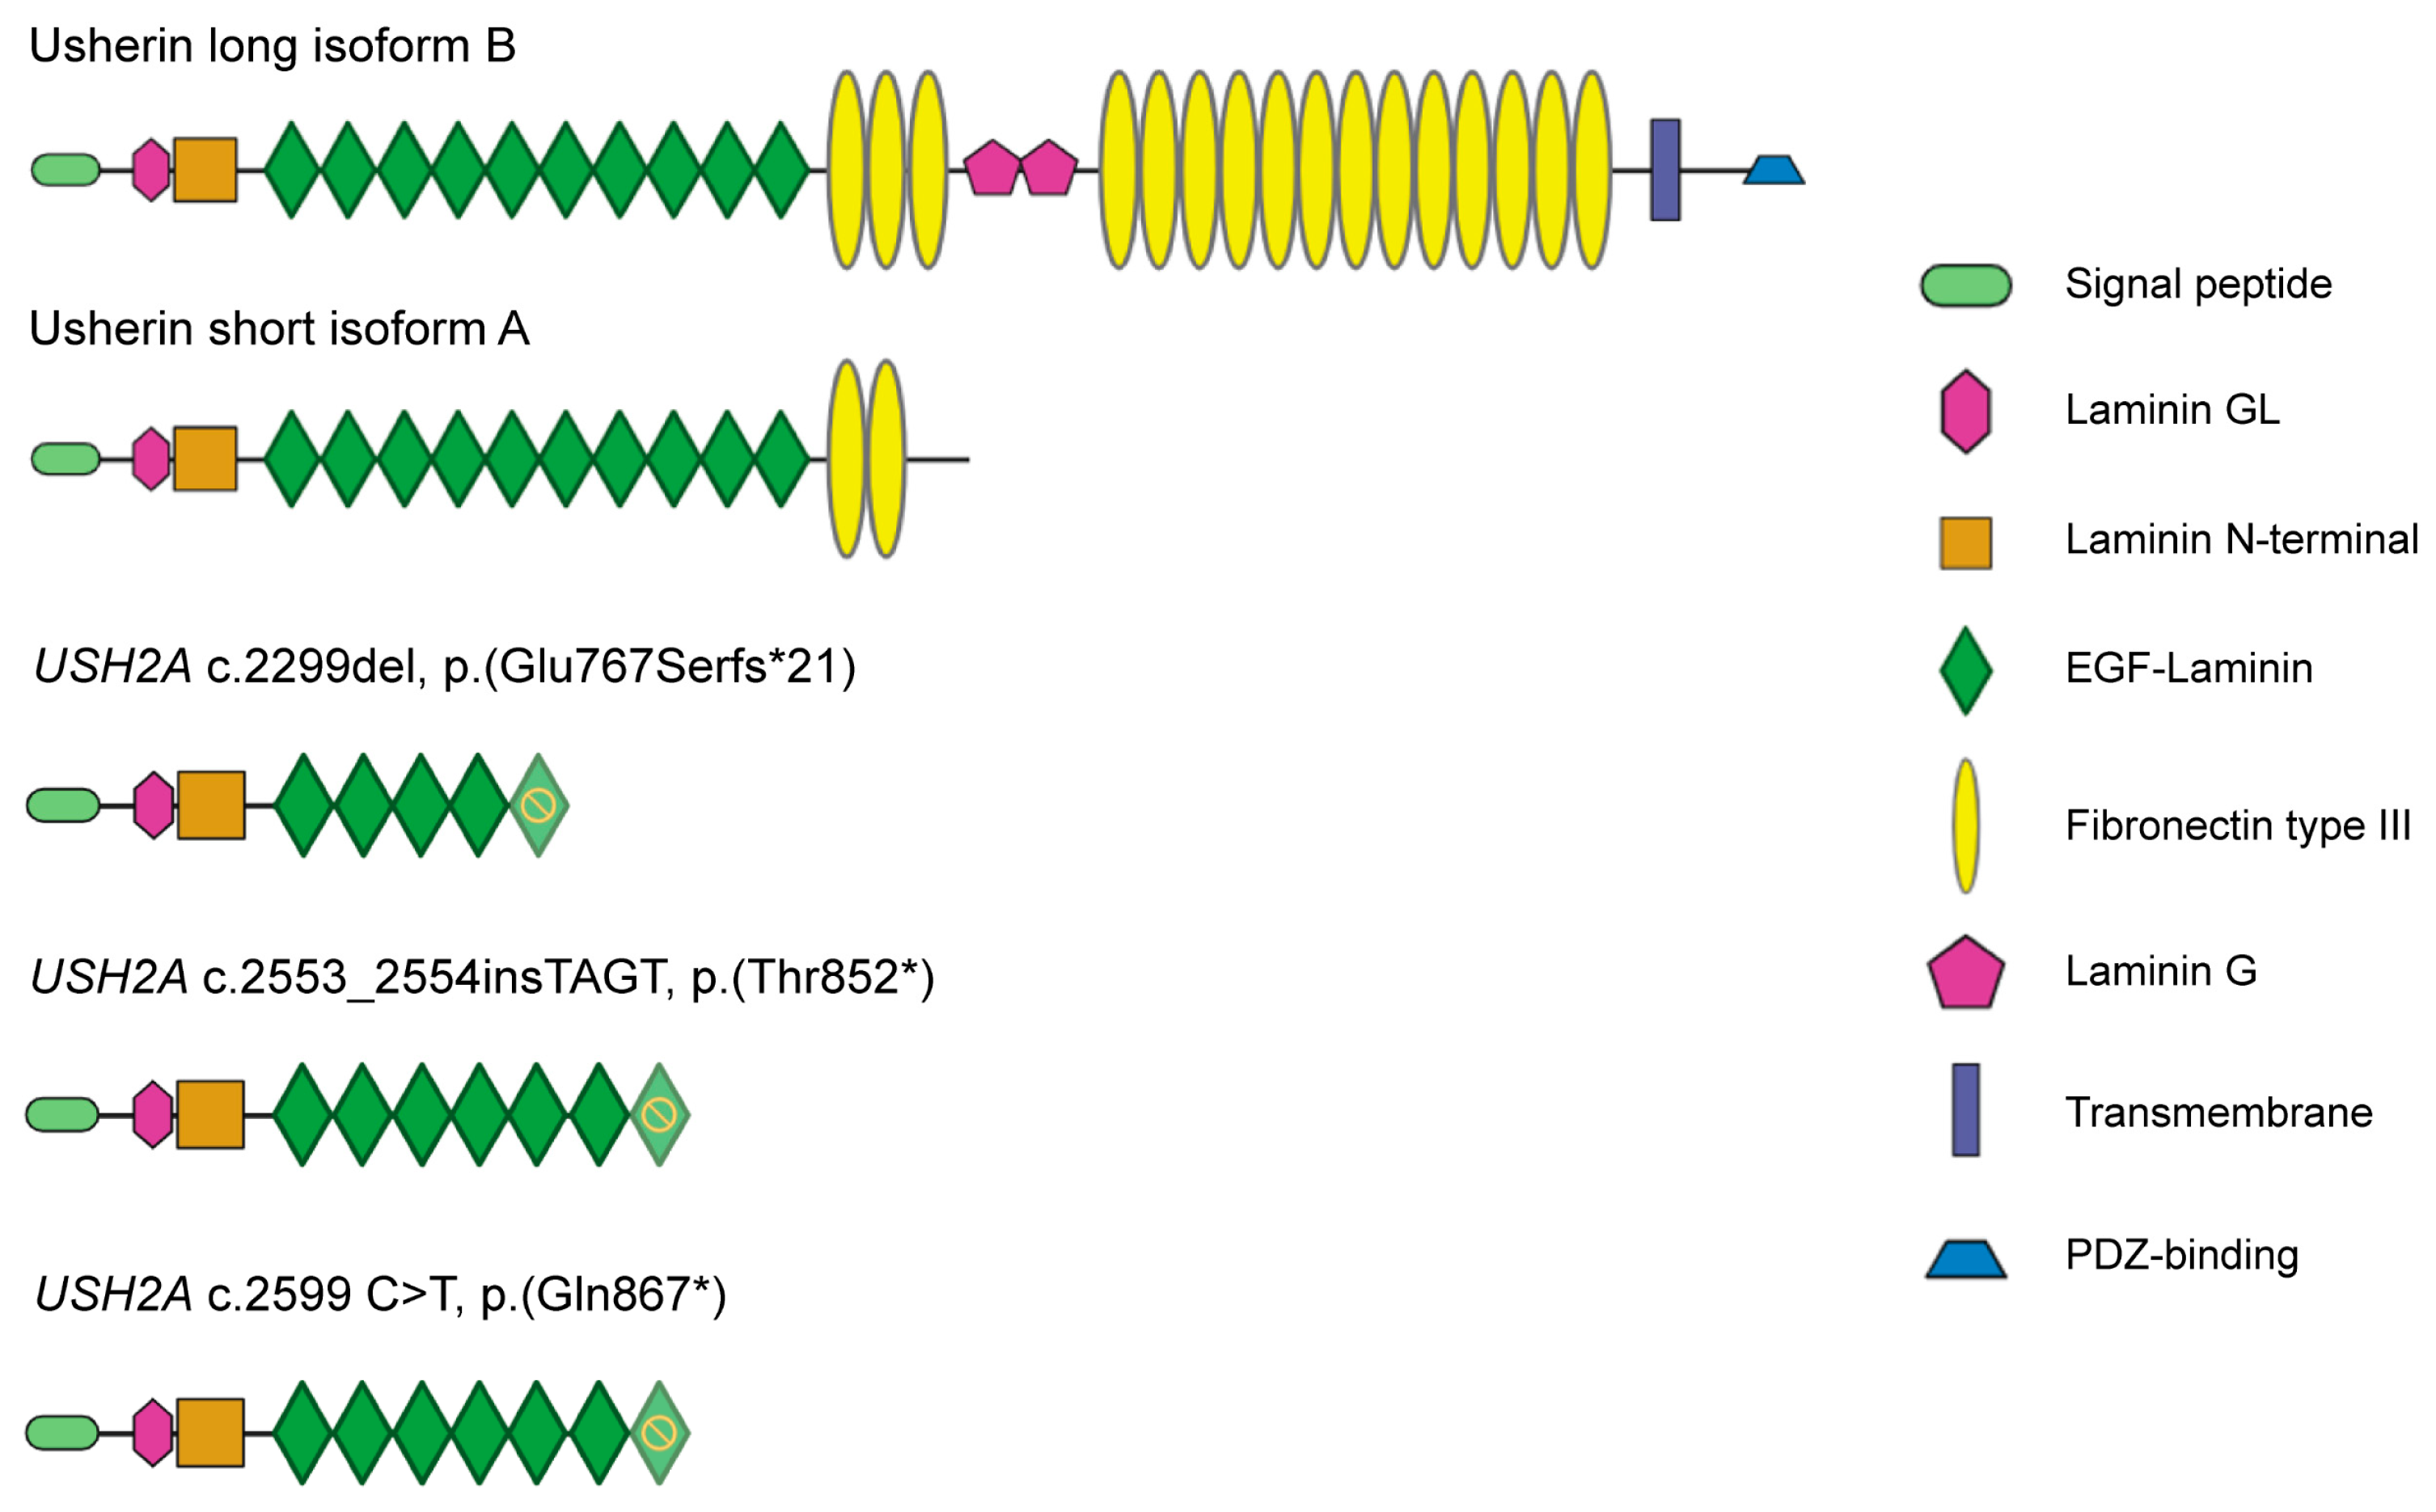
Figure 2.
USH2A 13KO mutation causes loss of photoreceptor ciliary localization of USH2 proteins in retinal organoids at DD225. (A) Representative brightfield images of ISO-CTRL, 13KO E11, 13KO G8, and 13KO B7 retinal organoids at DD225. Scale bars: 200 µm. (B-M) Representative immunohistochemical Z-stack images of ARL13B (purple) and usherin (B, E, H, K), ADGRV1 (C, F, I, L), and whirlin (D, G, J, M) (yellow) in ISO-CTRL and 13KO retinal organoids. Scale bars: left, 6 µm; right, 2 µm. (N) Quantitative analysis of ARL13B average length in ISO-CTRL and 13KO retinal organoids. Number of organoids used: ISO-CTRL n = 30, 13KO E11 n = 22, 13KO G8 n = 21, and 13KO B7 n = 13. Statistical analysis: p = 0.037, p = 0.004, p = 0.480, p = 0.067, from left to right. (O) Representative TEM images showing the presence of inner segment (IS)-like structures, basal body and connecting cilium (CC), and outer segment (OS)-like structures at the photoreceptor level in ISO-CTRL and 13KO retinal organoids. Arrows point to the disk membranes. Scale bars: 2 µm. Number of organoids used: ISO-CTRL n = 6, 13KO E11 n = 4, 13KO G8 n = 3, and 13KO B7 n = 3, from one differentiation.
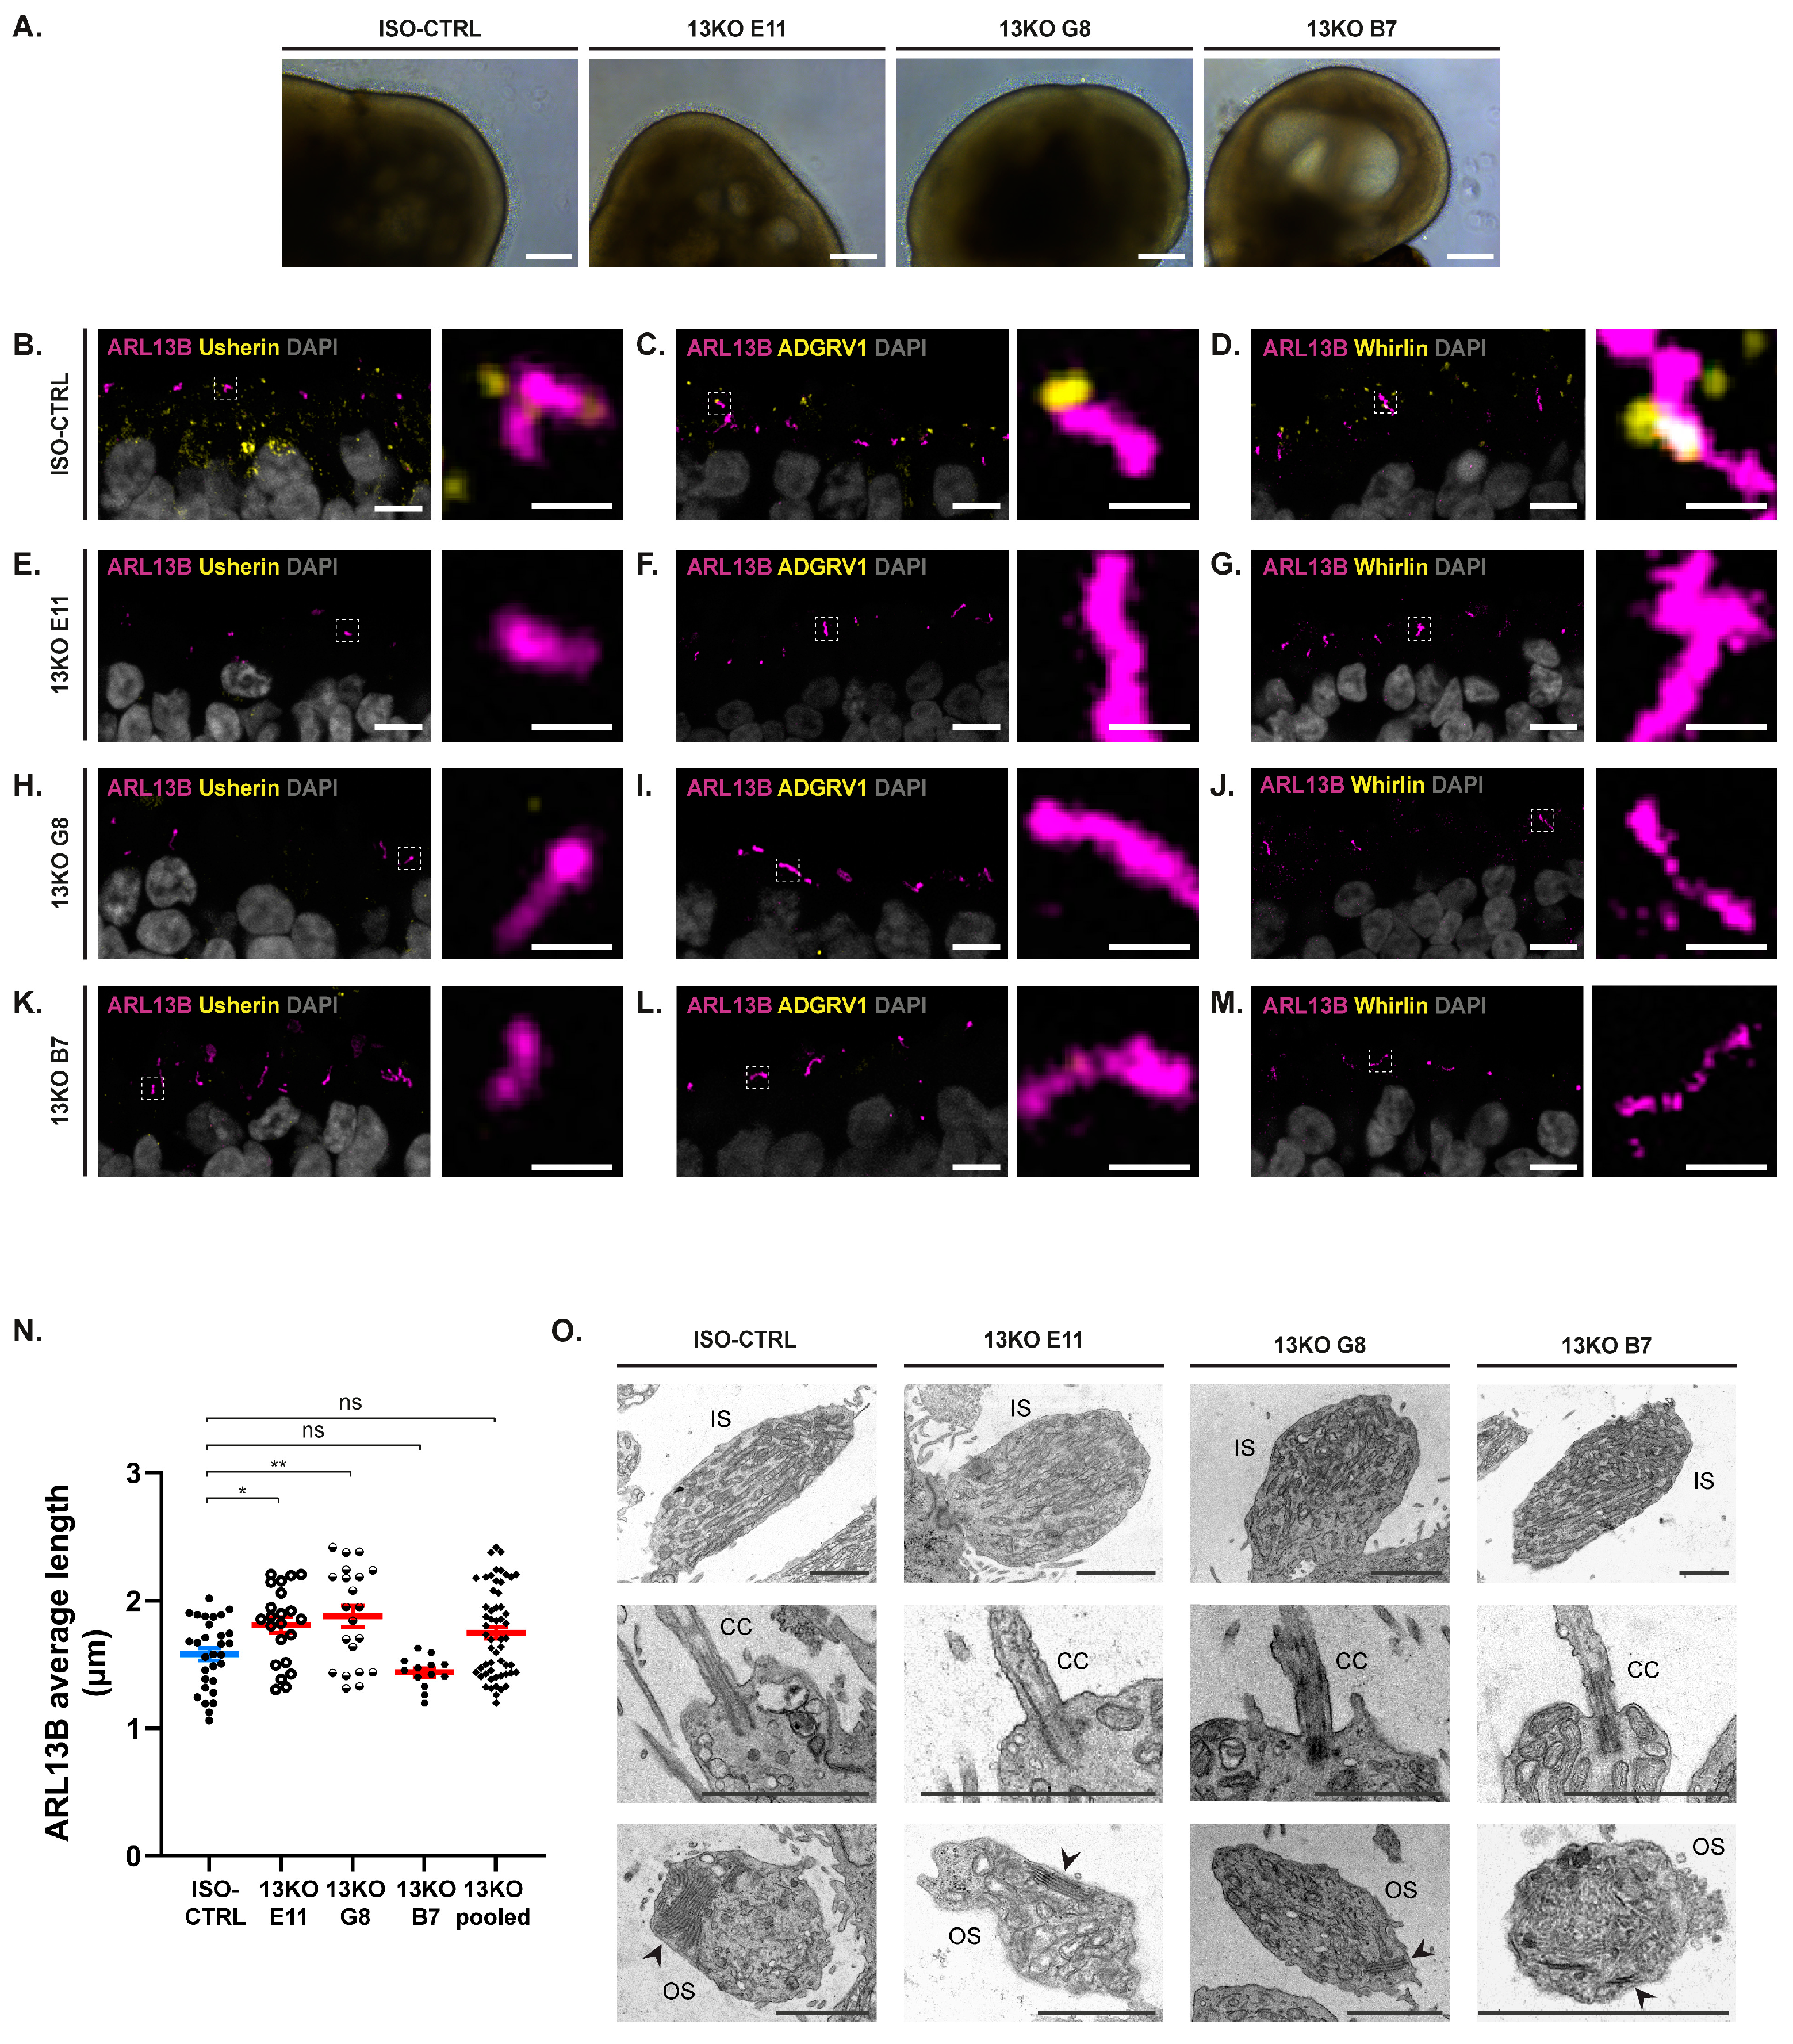
Figure 3.
Phenotypic analysis of the photoreceptor layer in retinal organoids upon USH2A loss at DD225. (A) Representative immunohistochemical images of Rhodopsin (purple) and F-actin (yellow) in ISO-CTRL, 13KO E11, 13KO G8, and 13KO B7 retinal organoids at DD225. (B) Representative immunohistochemical images of ROM1 (green) in ISO-CTRL, 13KO E11, 13KO G8, and 13KO B7 retinal organoids at DD225. (A, B) Scale bars: 50 µm. (C) Quantitative analysis of rhodopsin intensity distribution between the outer nuclear layer (ONL) and the photoreceptor segments (Seg) in ISO-CTRL and 13KO retinal organoids. Number of organoids used: ISO-CTRL n = 13, 13KO E11 n = 13, 13KO G8 n =8, and 13KO B7 n = 8. Statistical analysis: p = 0.688, p = 0.999, p = 0.212, p = 0.999, from left to right. (D) Quantitative analysis of the ONL thickness in ISO-CTRL and 13KO retinal organoids. Number of organoids used: ISO-CTRL n = 30, 13KO E11 n = 22, 13KO G8 n = 21, and 13KO B7 n = 13. Statistical analysis: p = 0.584, p = 0.650, p = 0.037, p = 0.838, from left to right. (E) Quantitative analysis of ROM1 intensity in ISO-CTRL and 13KO retinal organoids. Number of organoids used: ISO-CTRL n = 12, 13KO E11 n = 11, 13KO G8 n = 17, and 13KO B7 n = 8. Statistical analysis: p = 0.920, p = 0.0005, p = 0.207, p = 0.120, from left to right.
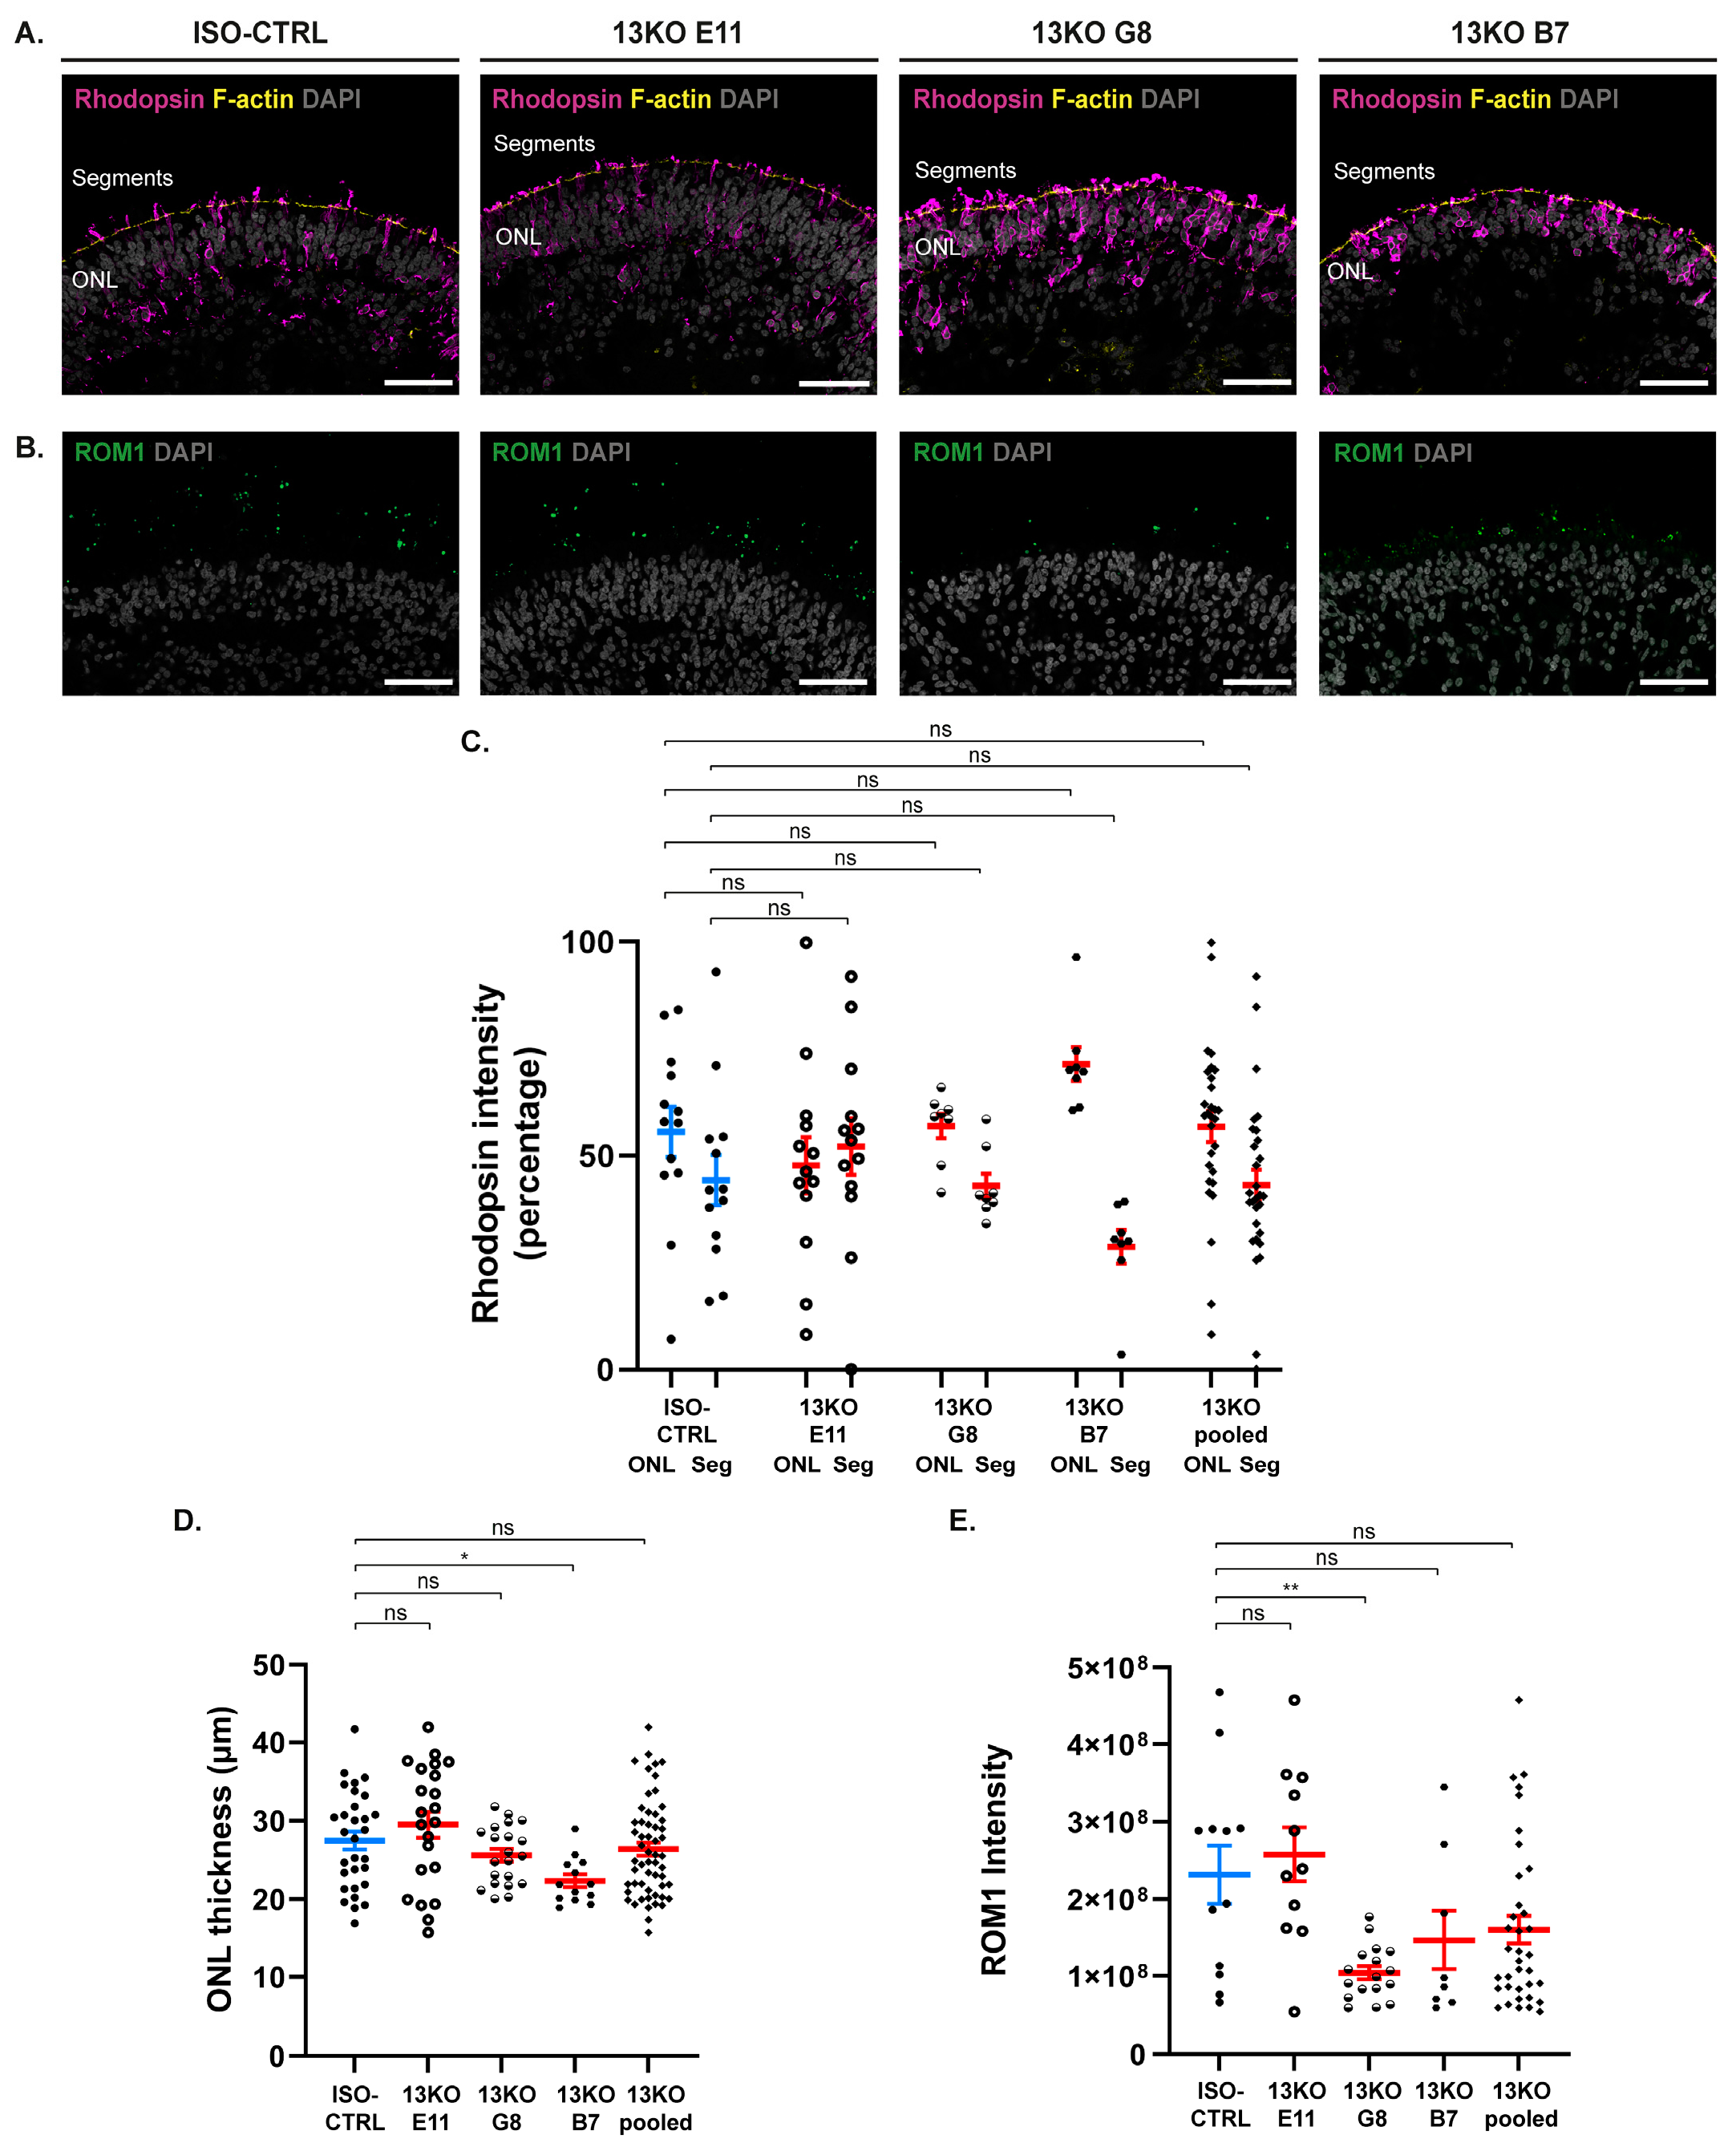
Figure 4.
scRNA-Seq analysis confirms the presence of all major retinal cell types in hiPSC-derived USH2A 13KO and isogenic control retinal organoids. (A) UMAP displaying 14 identified distinct cell clusters. (B) Table showing the percentage of each cell type across conditions. (C) Heatmap of top markers assigning cell cluster identities.
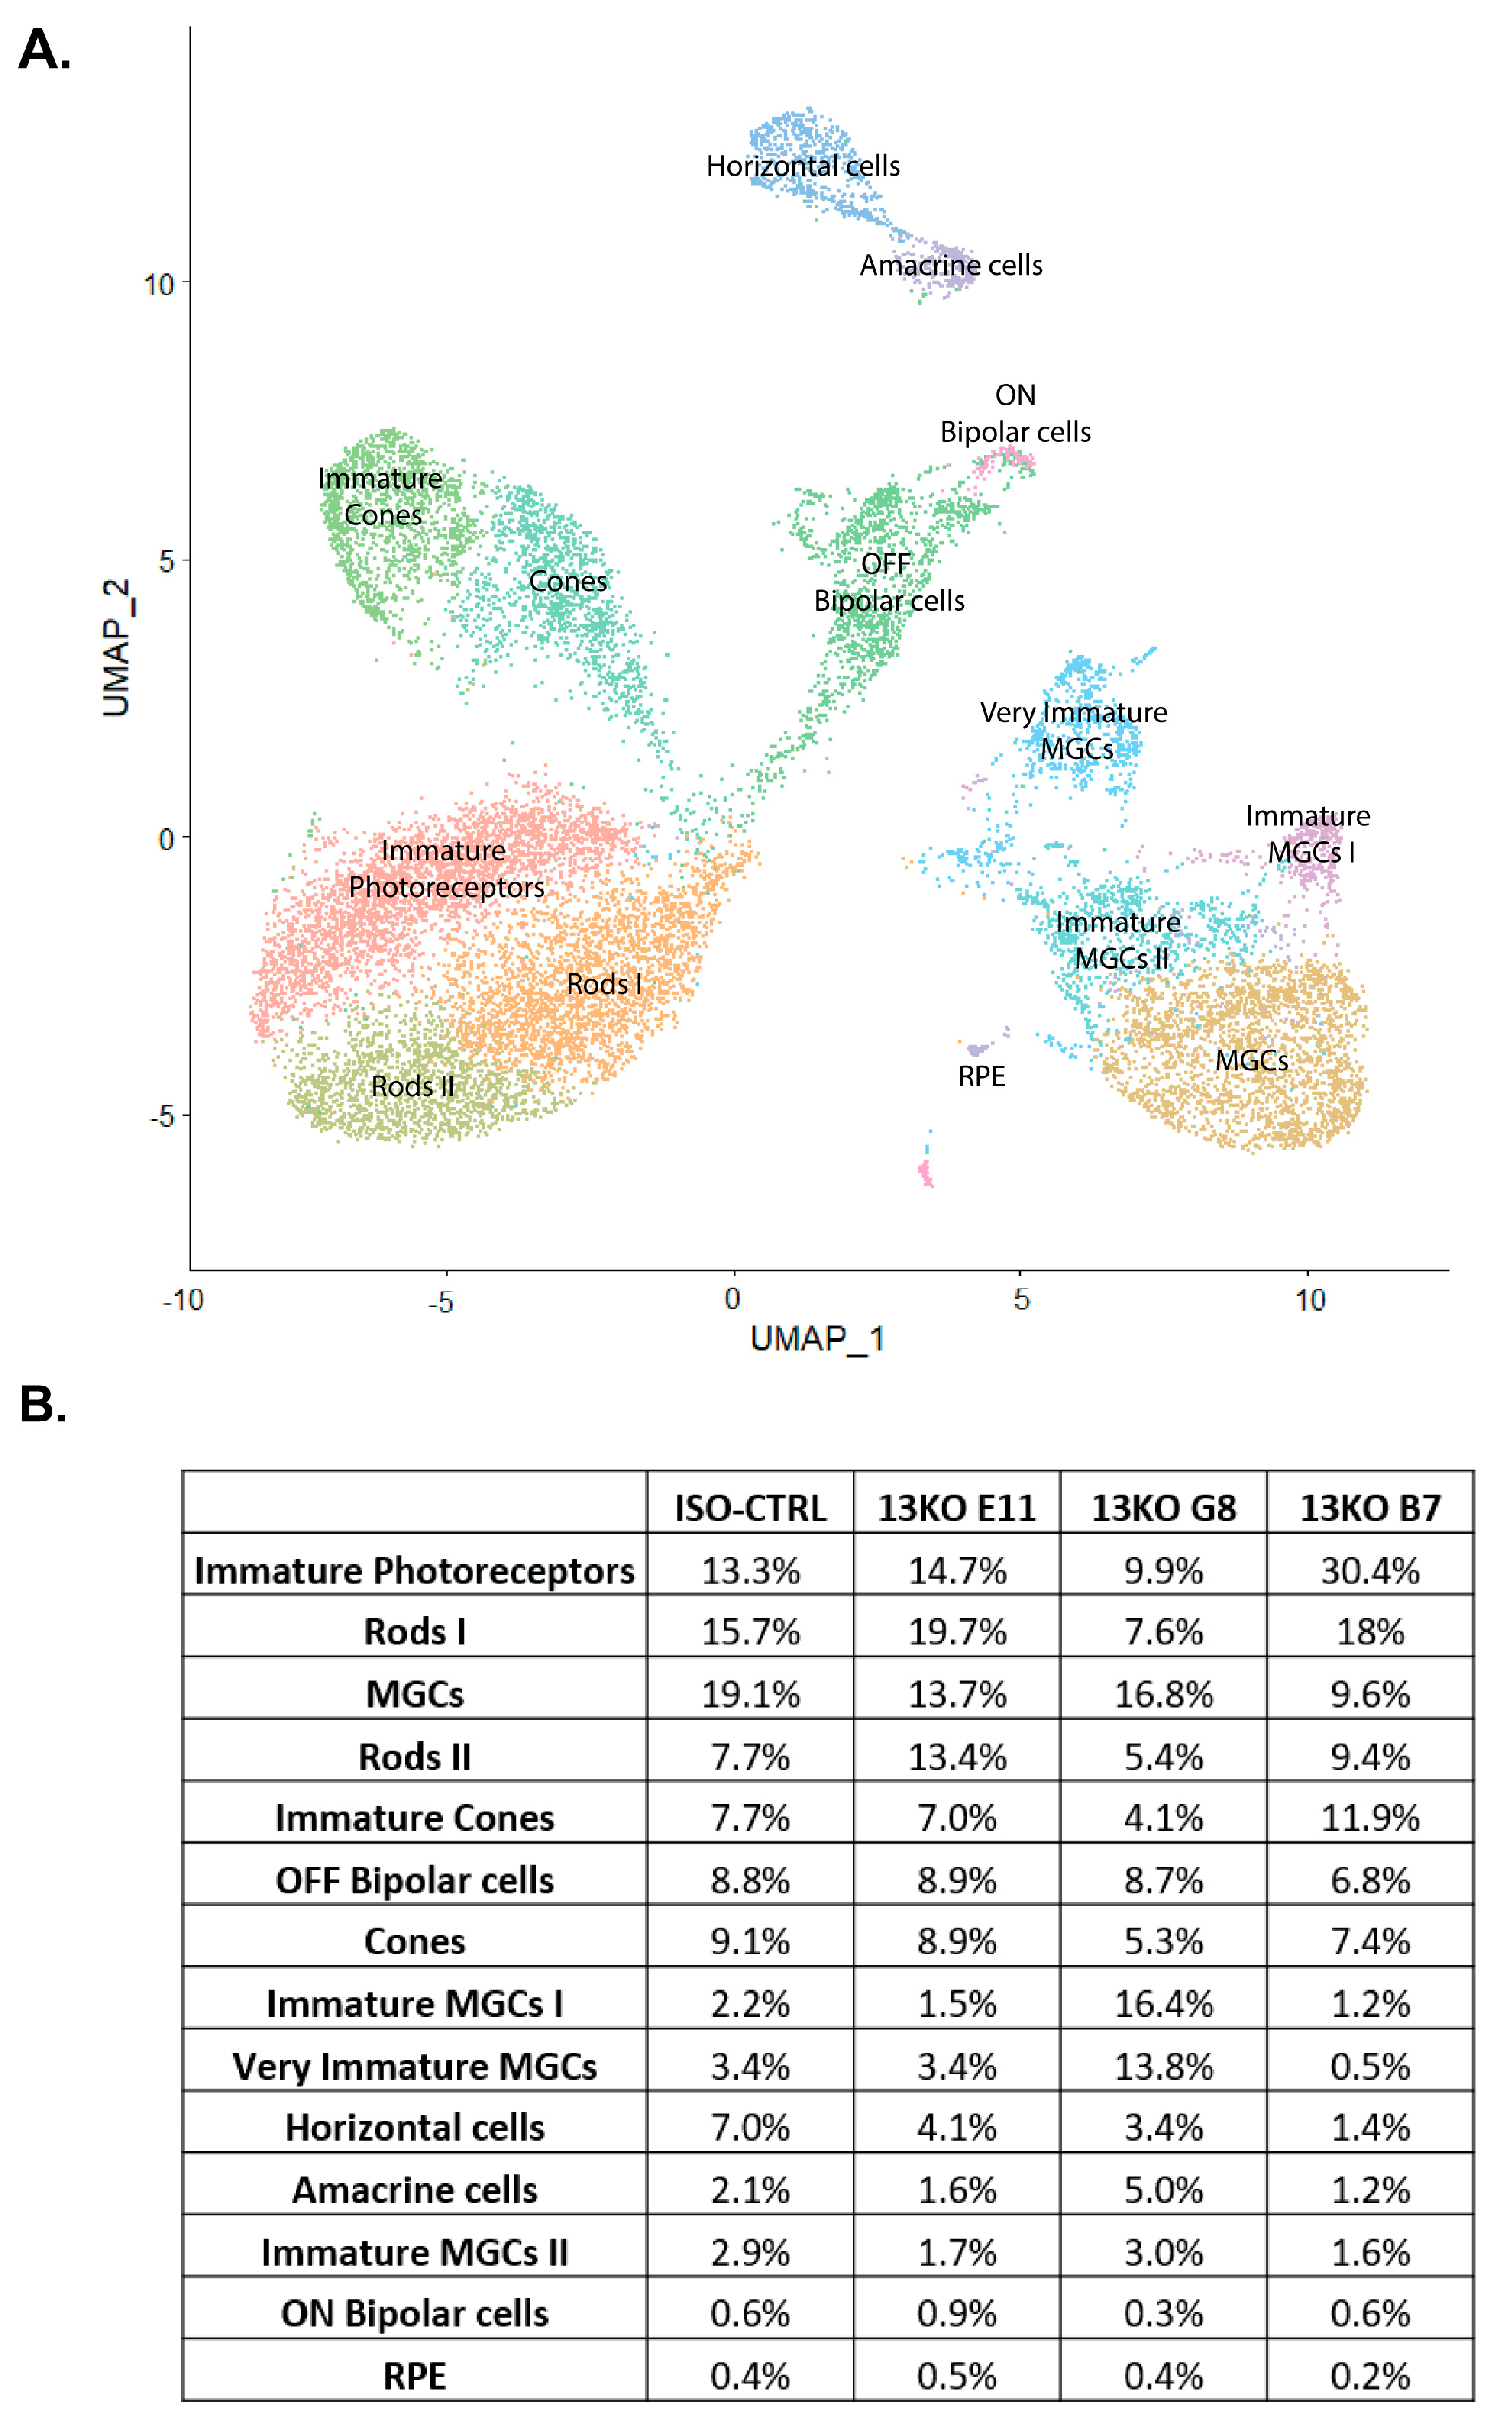
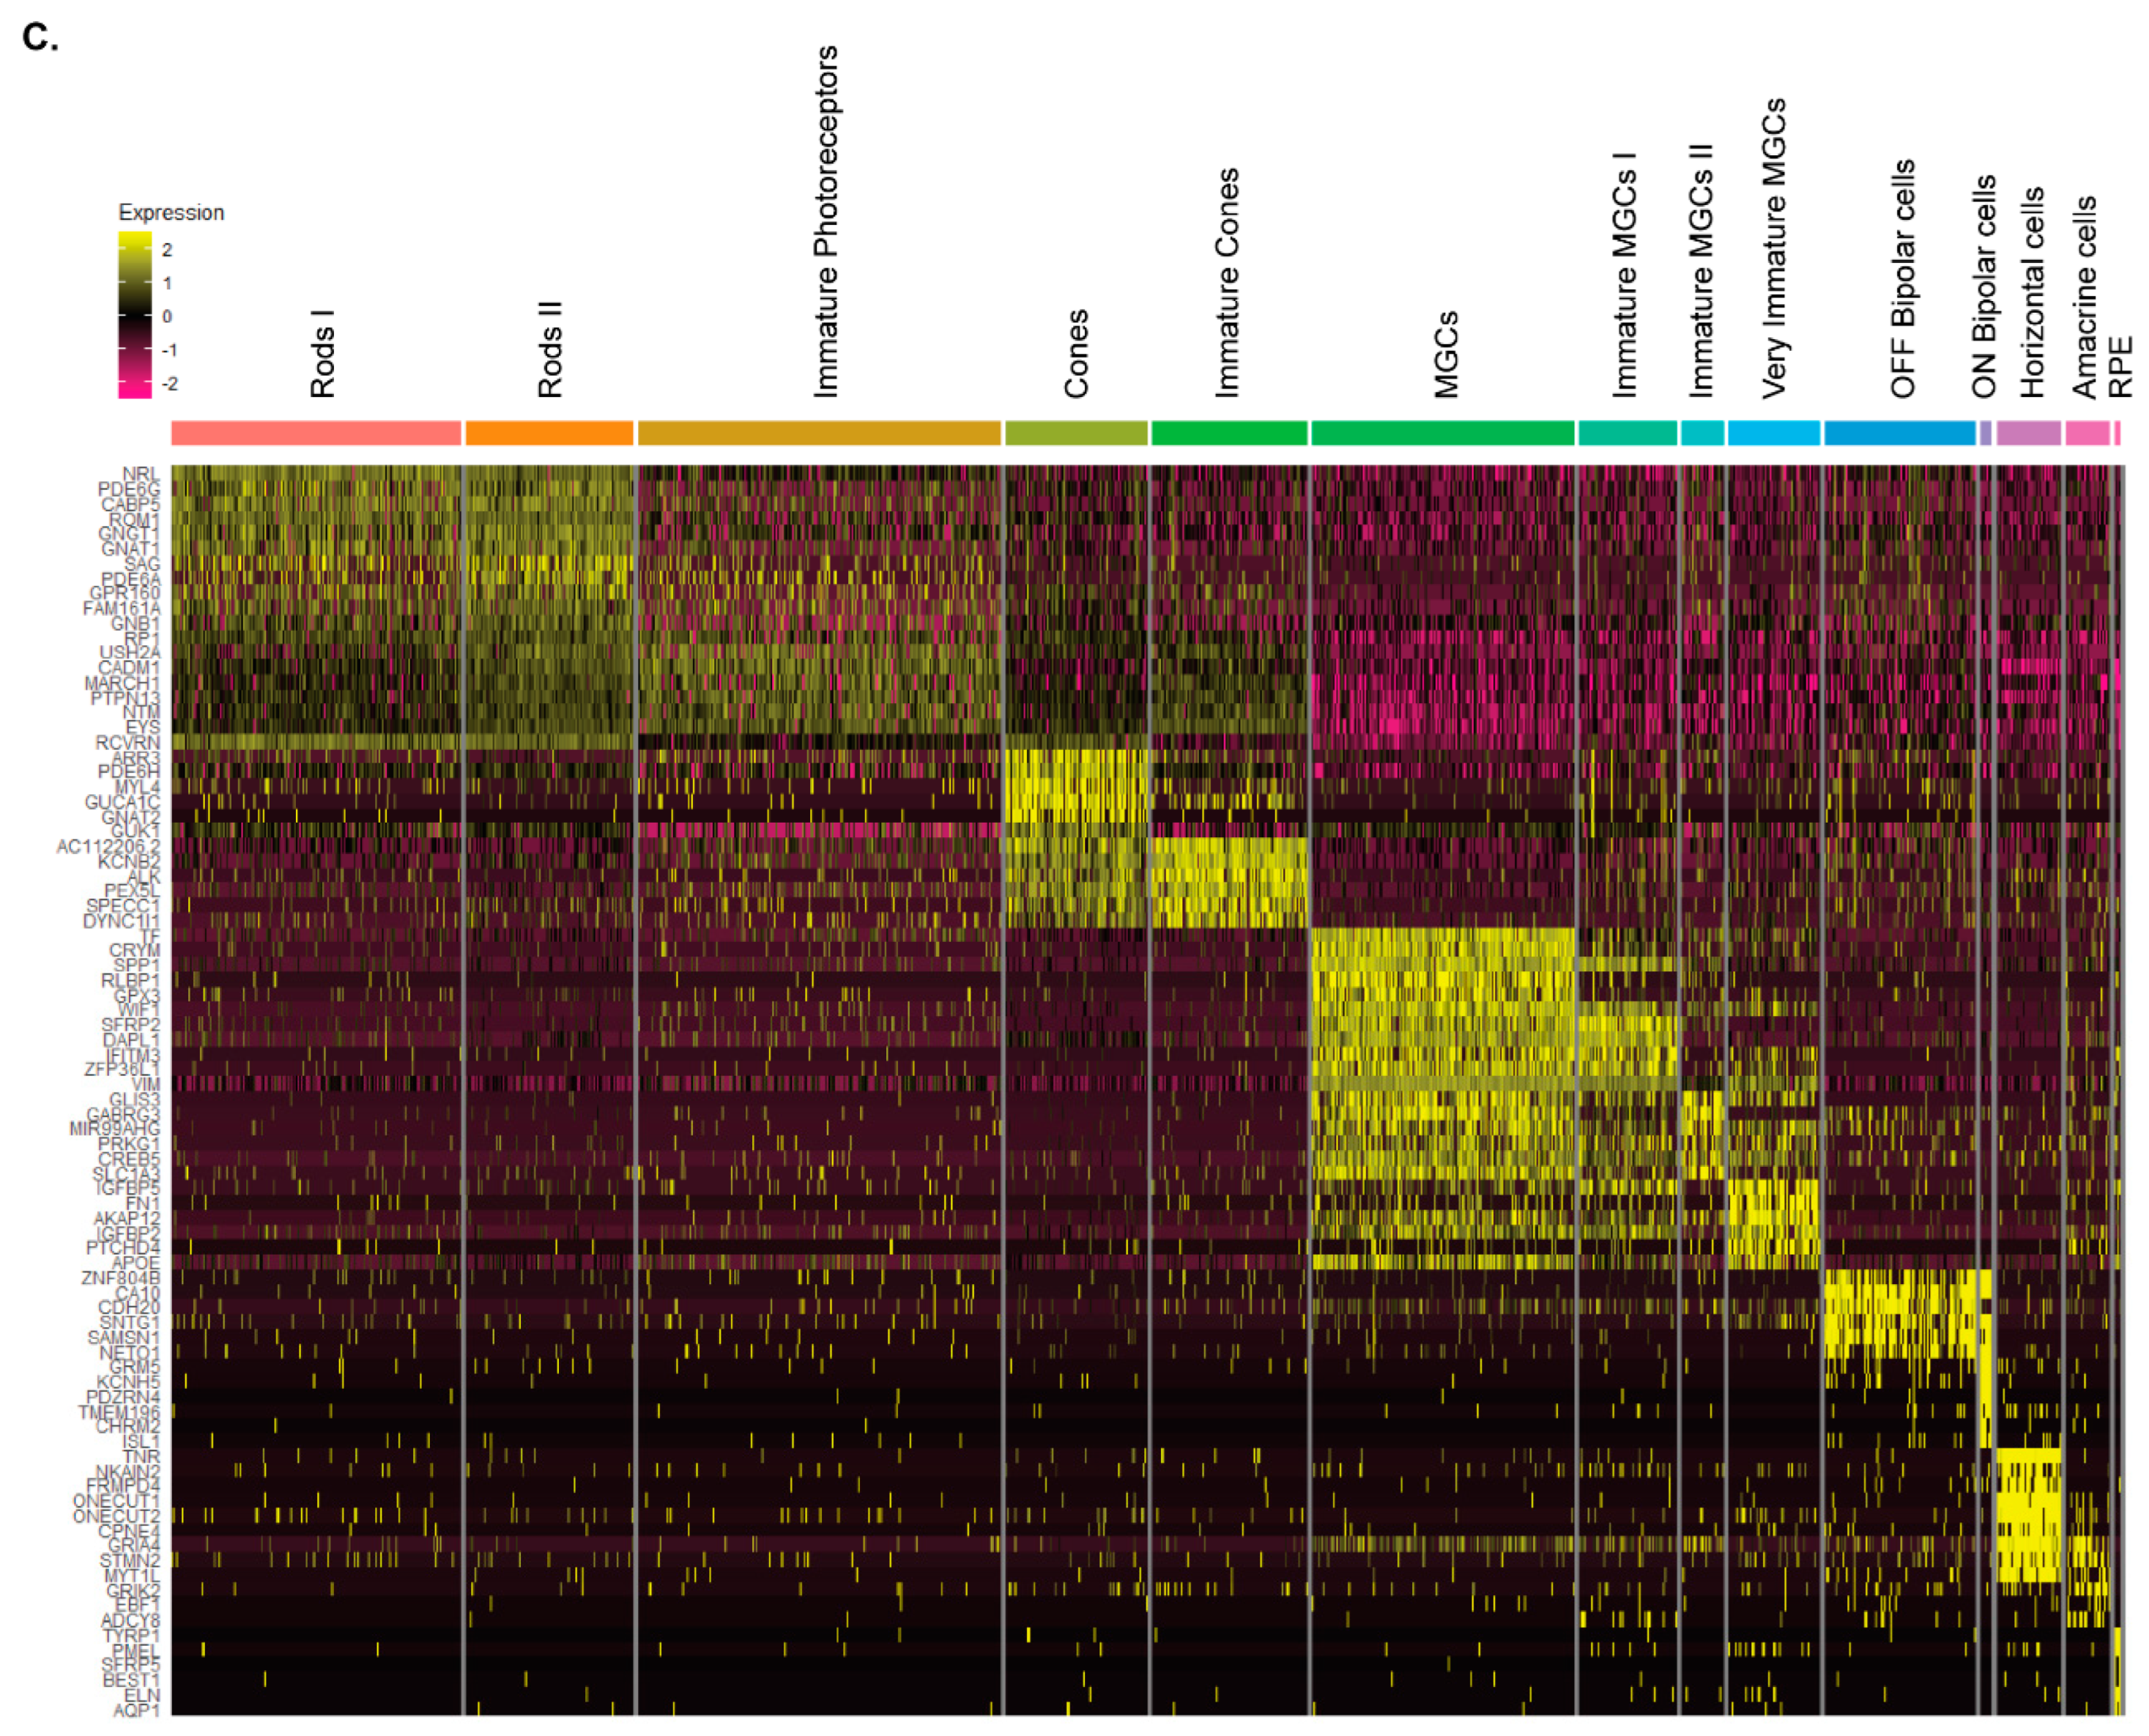
Figure 5.
Expression of USH2A, ADGRV1, and WHRN genes in photoreceptor and Müller glial cells. (A, E, I) UMAP plots showing expression of USH2A (A), ADGRV1 (E), and WHRN (I) across cell clusters in retinal organoids. (B, C, D) Violin plots comparing USH2A expression levels in the 13KO subclones to ISO-CTRL in Rods (A), Cones (C), and MGCs (D) (adjusted p-values = 1). (F, G, H) Violin plots comparing ADGRV1 expression levels in the 13KO subclones to ISO-CTRL in Rods (F), Cones (G), and MGCs (H) (adjusted p-values = 1). (J, K, L) Violin plots comparing WHRN expression levels in the 13KO subclones to ISO-CTRL in Rods (J), Cones (K), and MGCs (L) (adjusted p-values = 1). Number of organoids used: ISO-CTRL n = 4, 13KO E11 n = 4, 13KO G8 n = 3, and 13KO B7 n = 3, from the same differentiation round.
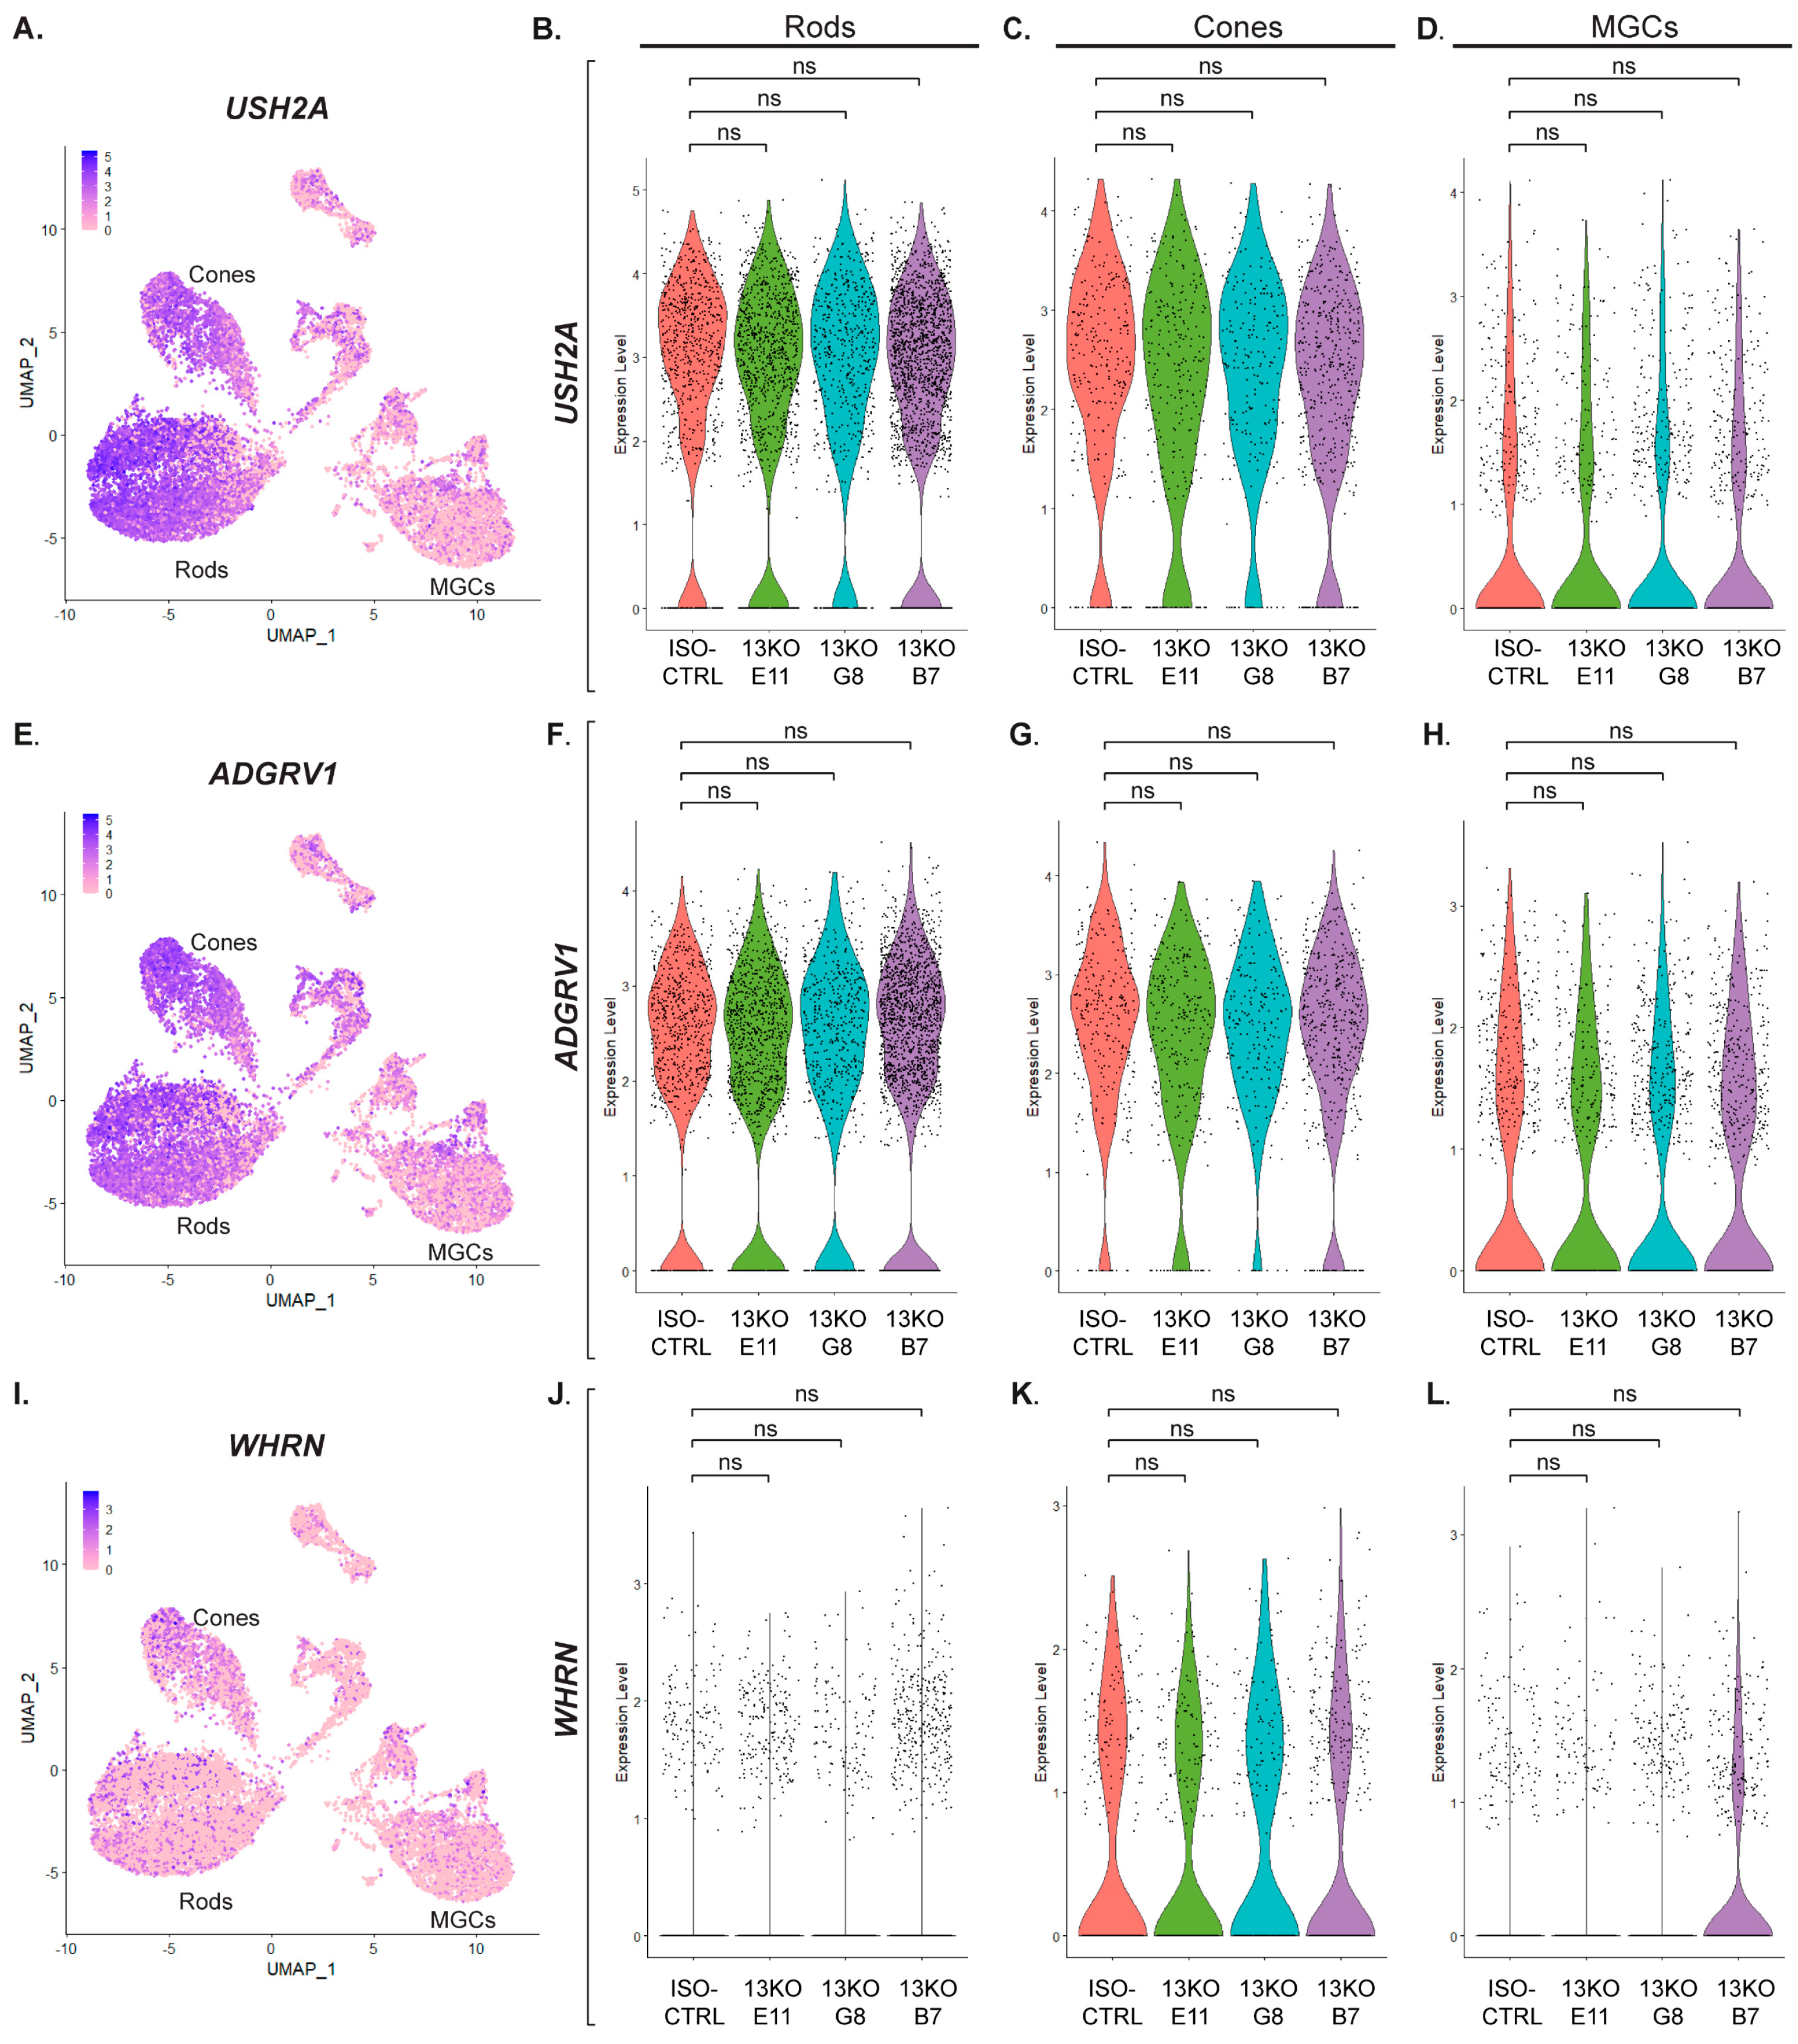
Figure 6.
scRNA-Seq analysis of DD225 USH2A 13KO retinal organoids shows disruptions in the endolysosomal system and cellular response in rod photoreceptors compared to isogenic controls. (A) Pathway enrichment analysis of differentially expressed genes (DEGs) in rods, with similar terms grouped into categories. (B) Statistically significant DEGs in at least two USH2A 13KO subclones in rods. Dashed boxes highlight genes that did not exhibit differential expression in a specific subclone compared to ISO-CTRL. Number of organoids used: ISO-CTRL n = 4, 13KO E11 n = 4, 13KO G8 n = 3, 13KO B7 n = 3 from the same differentiation round.
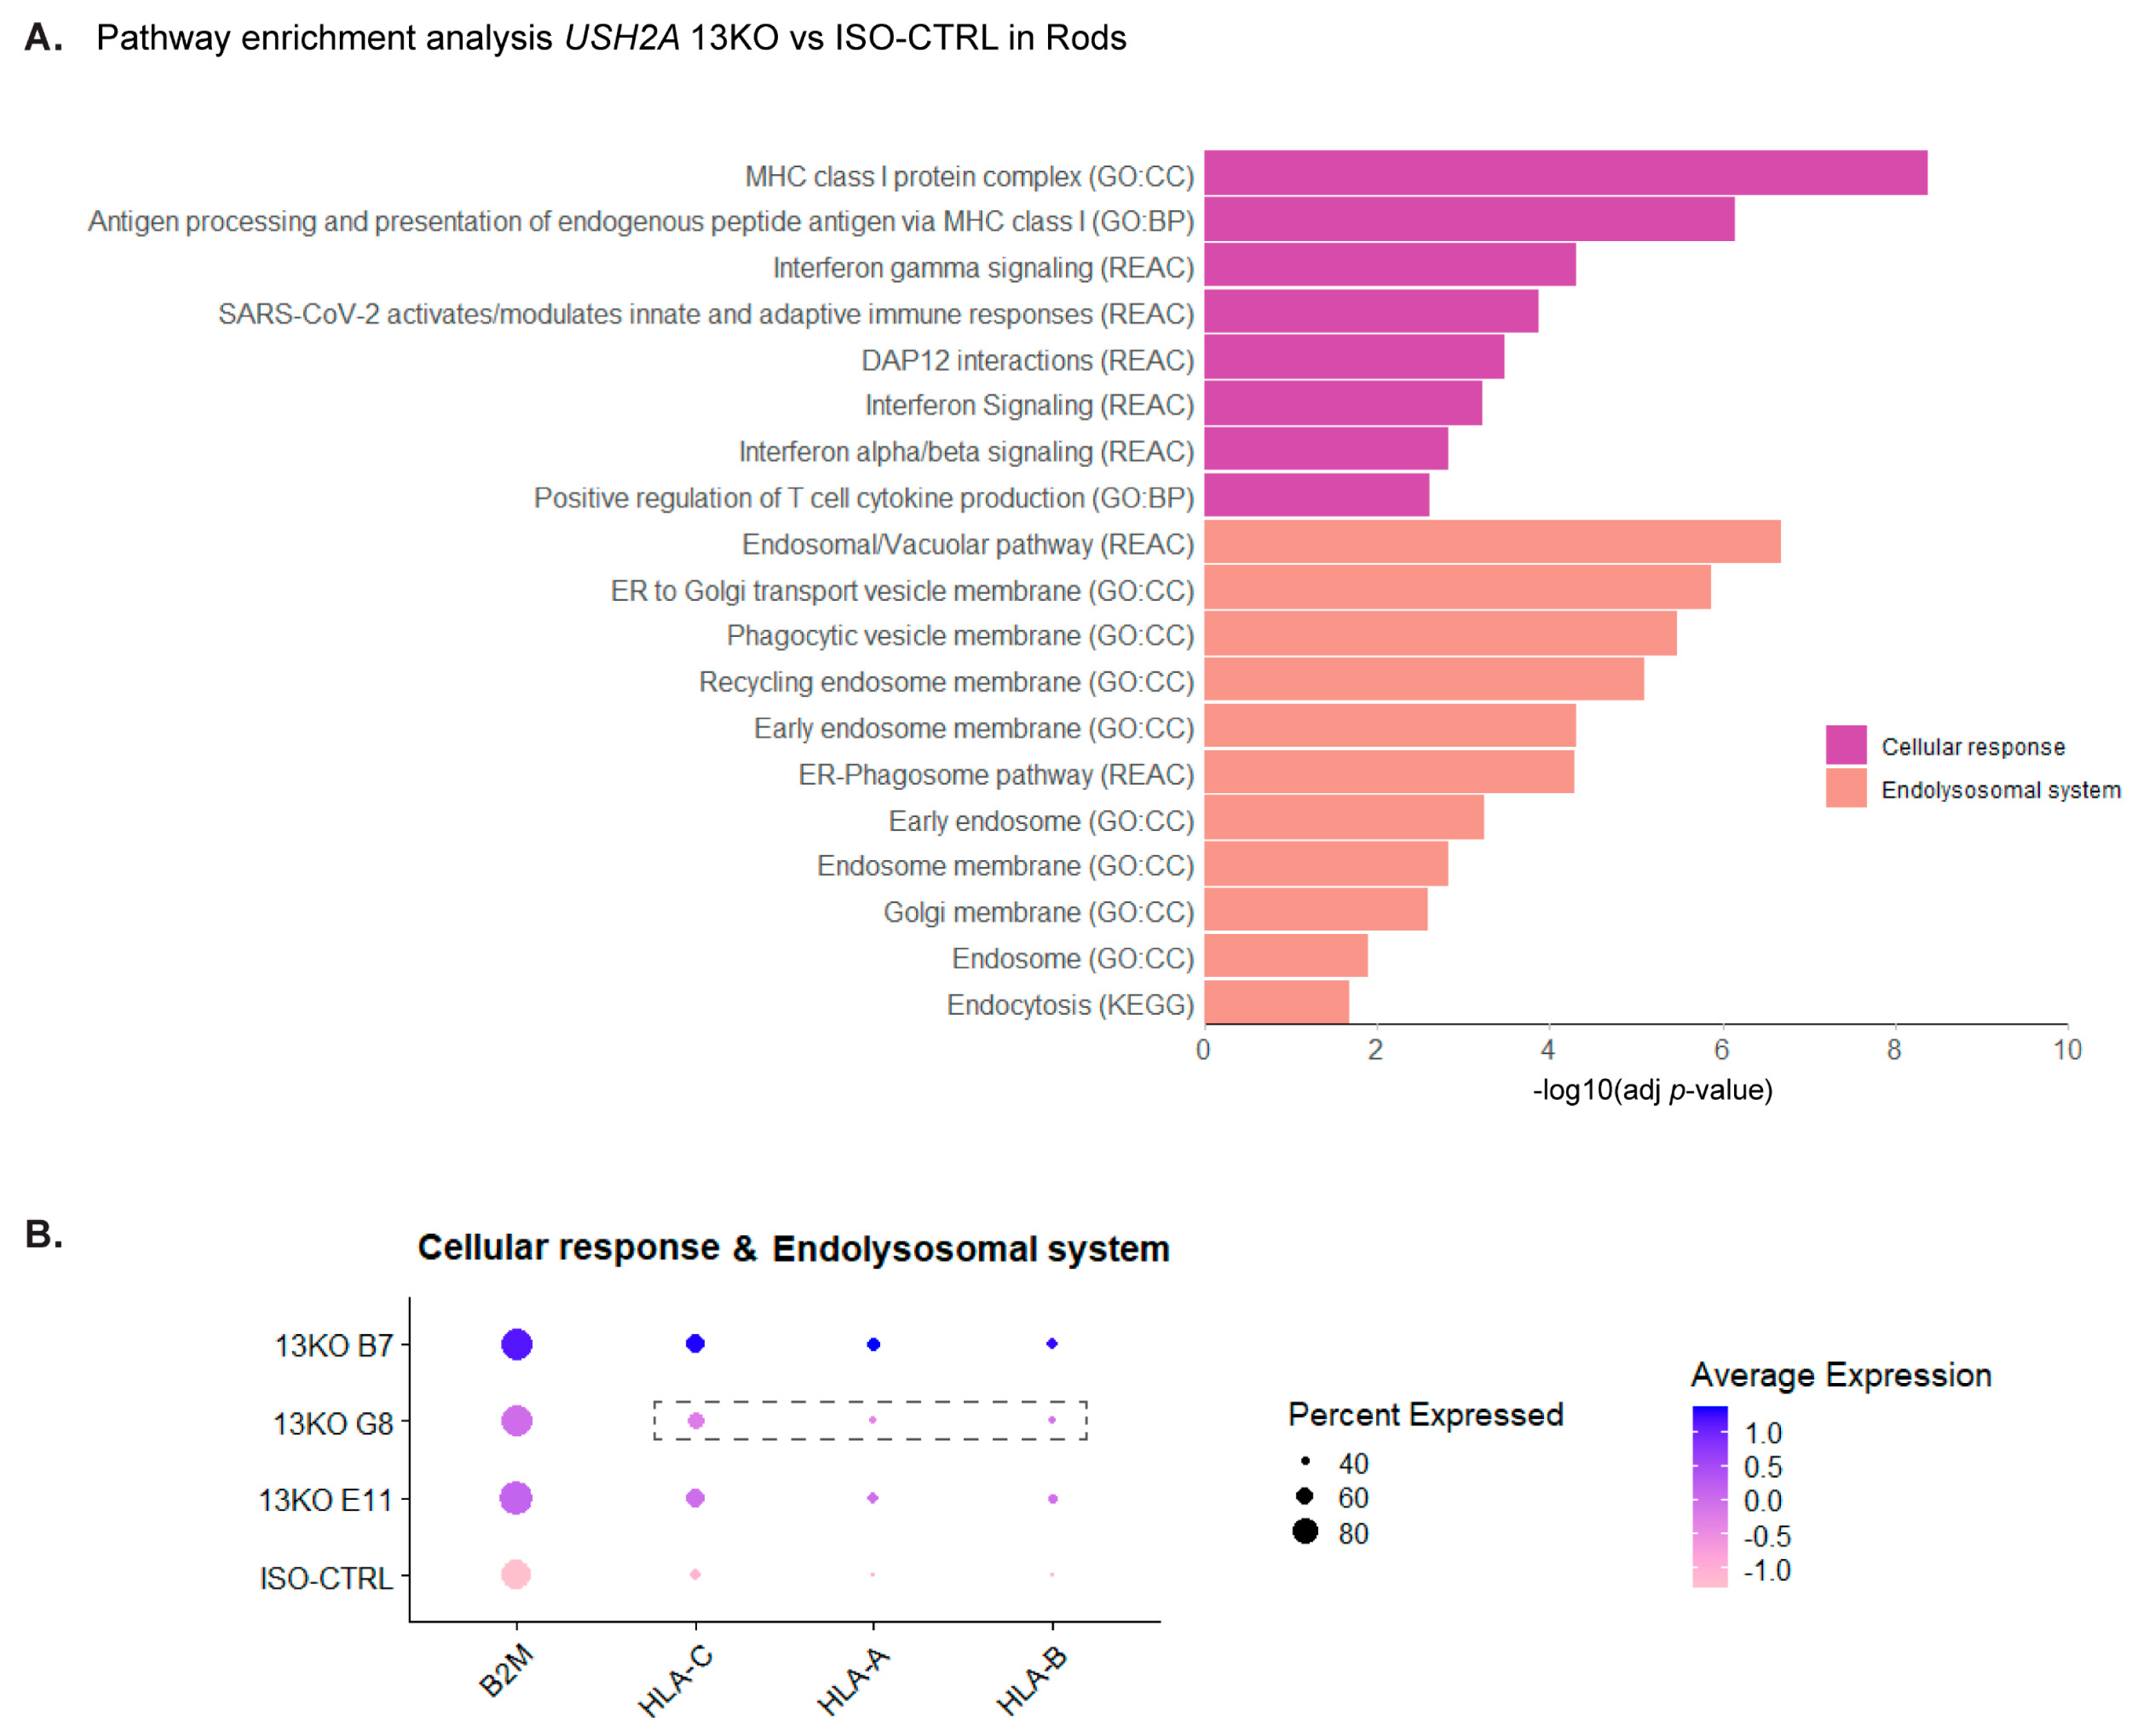
Figure 7.
Figure 7. scRNA-Seq analysis of DD225 USH2A 13KO retinal organoids shows major disruptions in the homeostasis of Müller glial cells compared to isogenic controls. (A) Pathway enrichment analysis of differentially expressed genes (DEGs) in MGCs, with similar terms grouped into categories. (B) Dot plot of the statistically significant DEGs found in the MGCs of all three USH2A 13KO subclones. Triangles indicate the genes involved in pathways related to the innate immune system. (C) UMAPs of the detected common 13 DEGs. Number of organoids used: ISO-CTRL n = 4, 13KO E11 n = 4, 13KO G8 n = 3, 13KO B7 n = 3 from the same differentiation round.
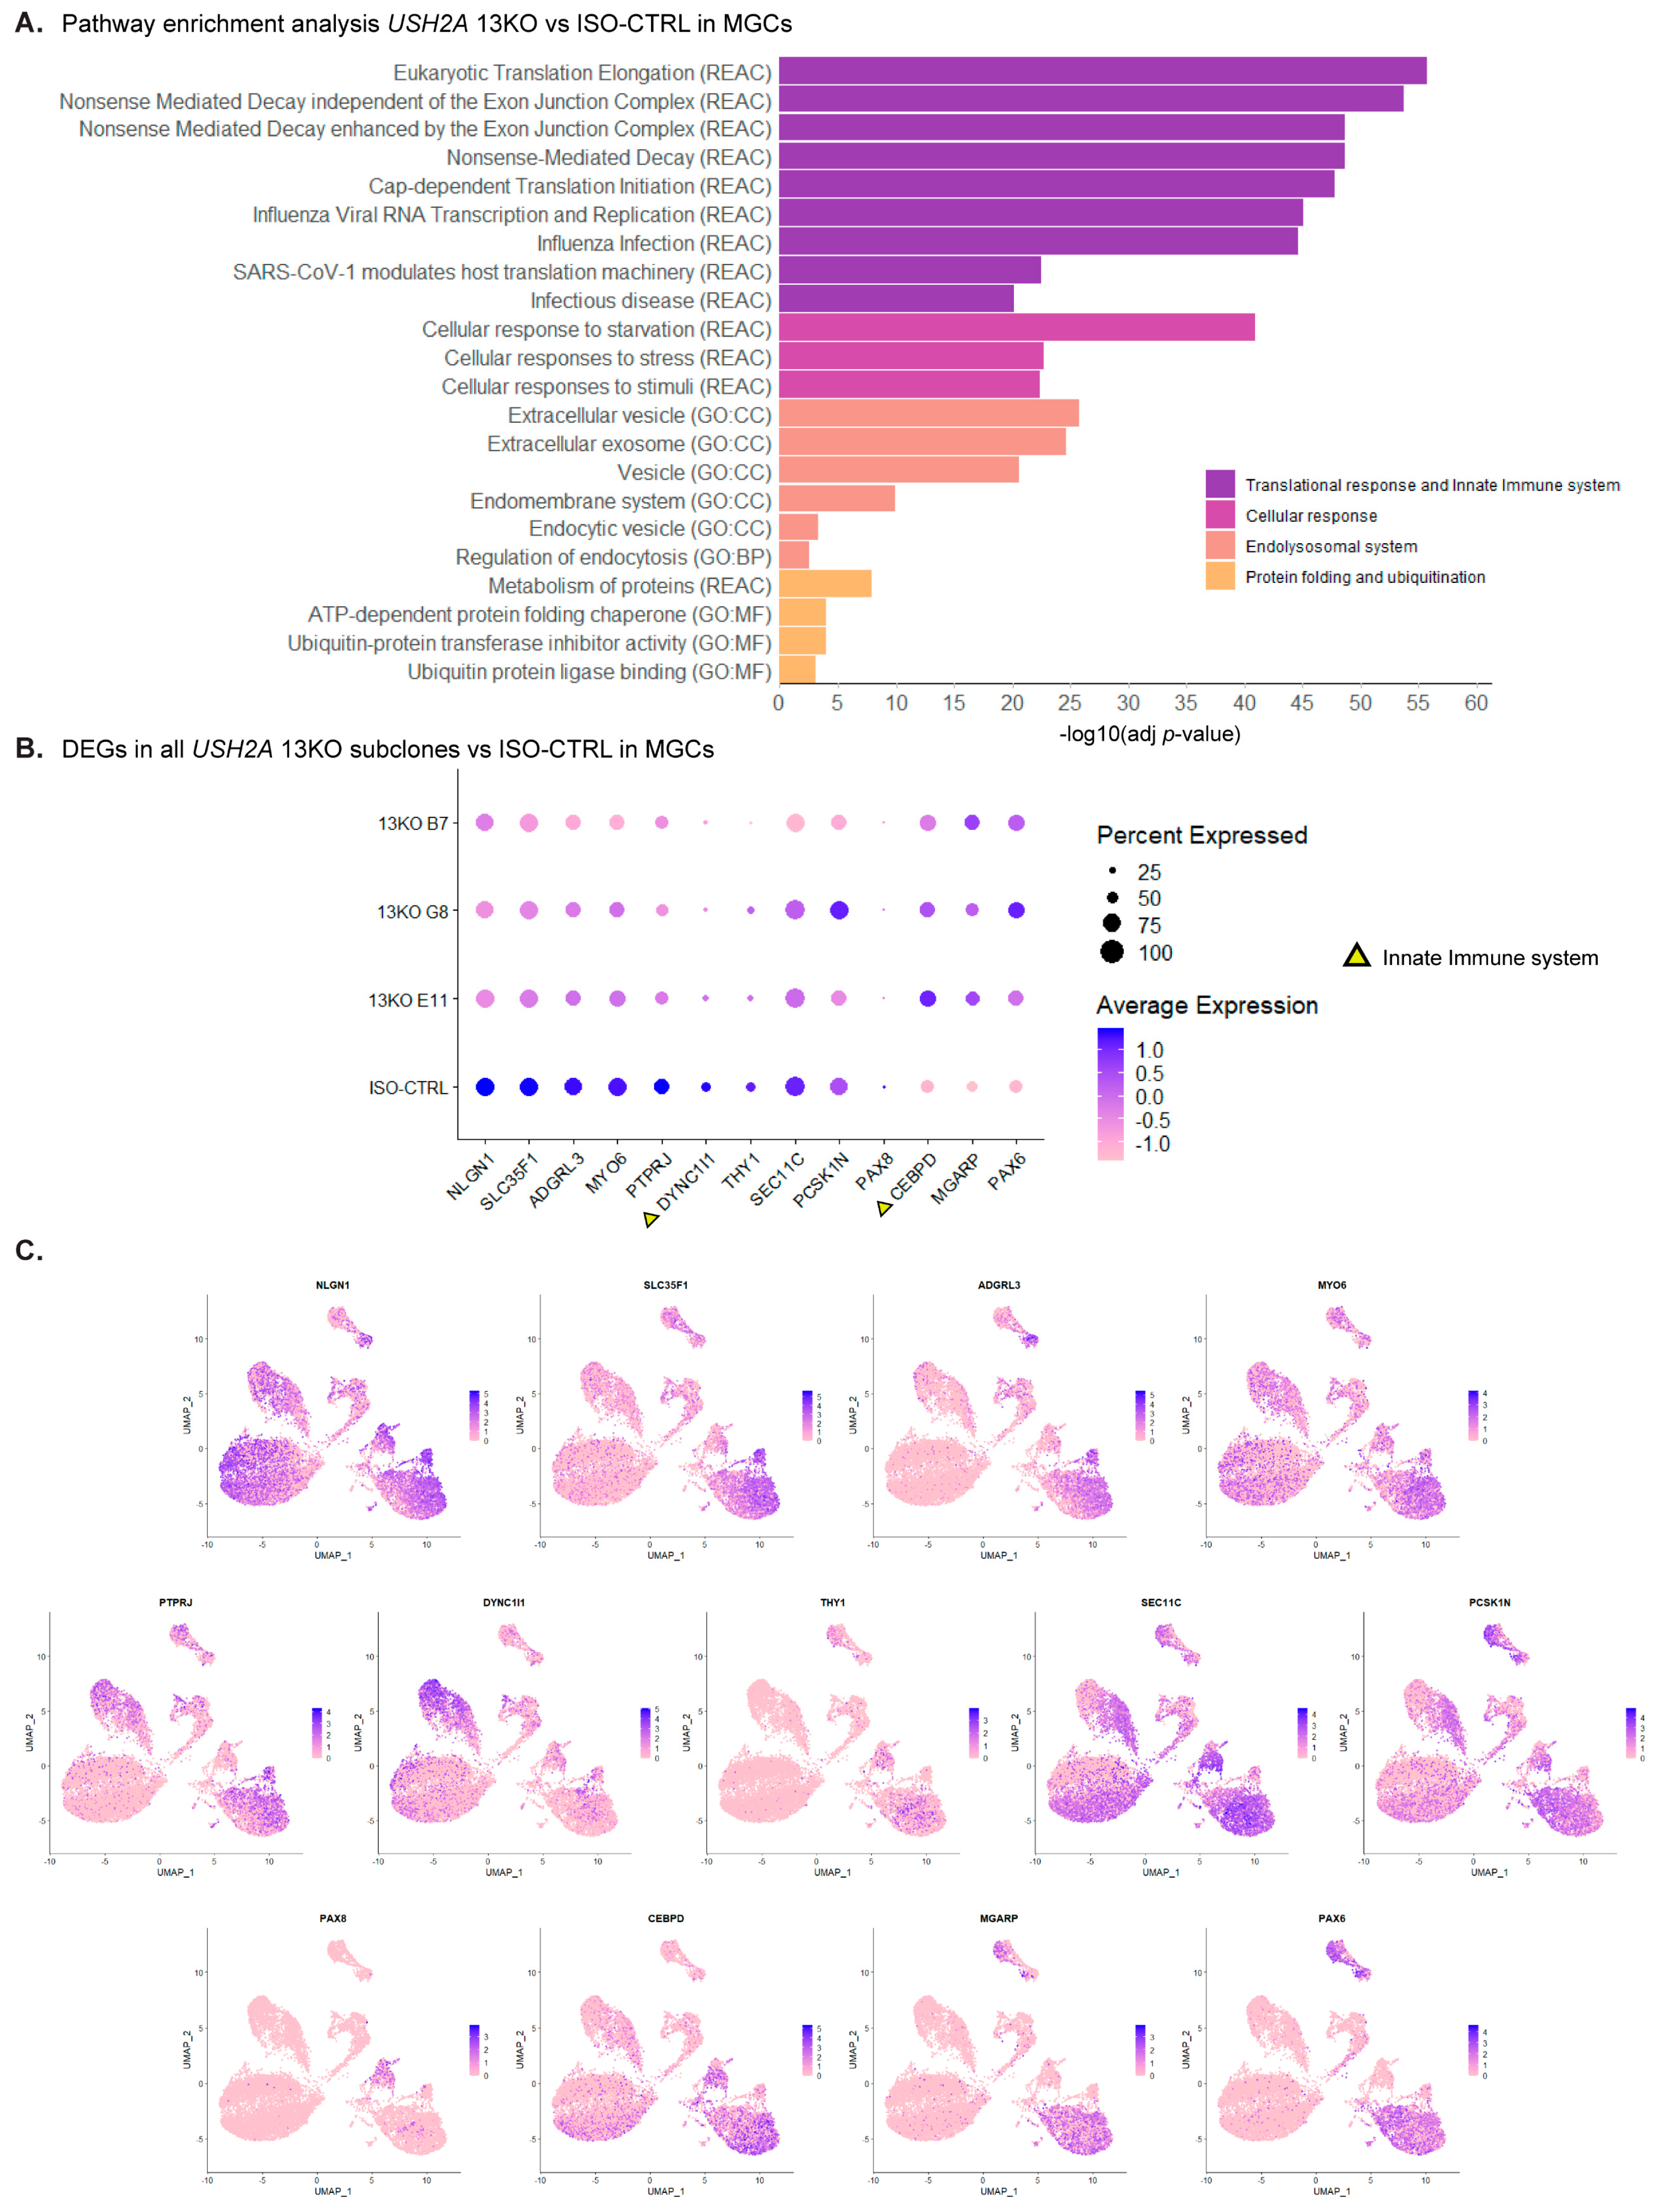
Figure 8.
Differential expression analysis of Müller glial cells compared to isogenic controls. (A, B, C, D) Statistically significant DEGs in at least two USH2A 13KO subclones involved in Translational response and Innate immune system (A), Cellular response (B), Endolysosomal system (C), and Protein folding and ubiquitination (D). Dashed boxes highlight genes that did not exhibit differential expression in a specific subclone compared to ISO-CTRL. Triangles indicate those genes that are exclusively involved in a single pathway within the macro-category. Number of organoids used: ISO-CTRL n = 4, 13KO E11 n = 4, 13KO G8 n = 3, 13KO B7 n = 3 from the same differentiation round.
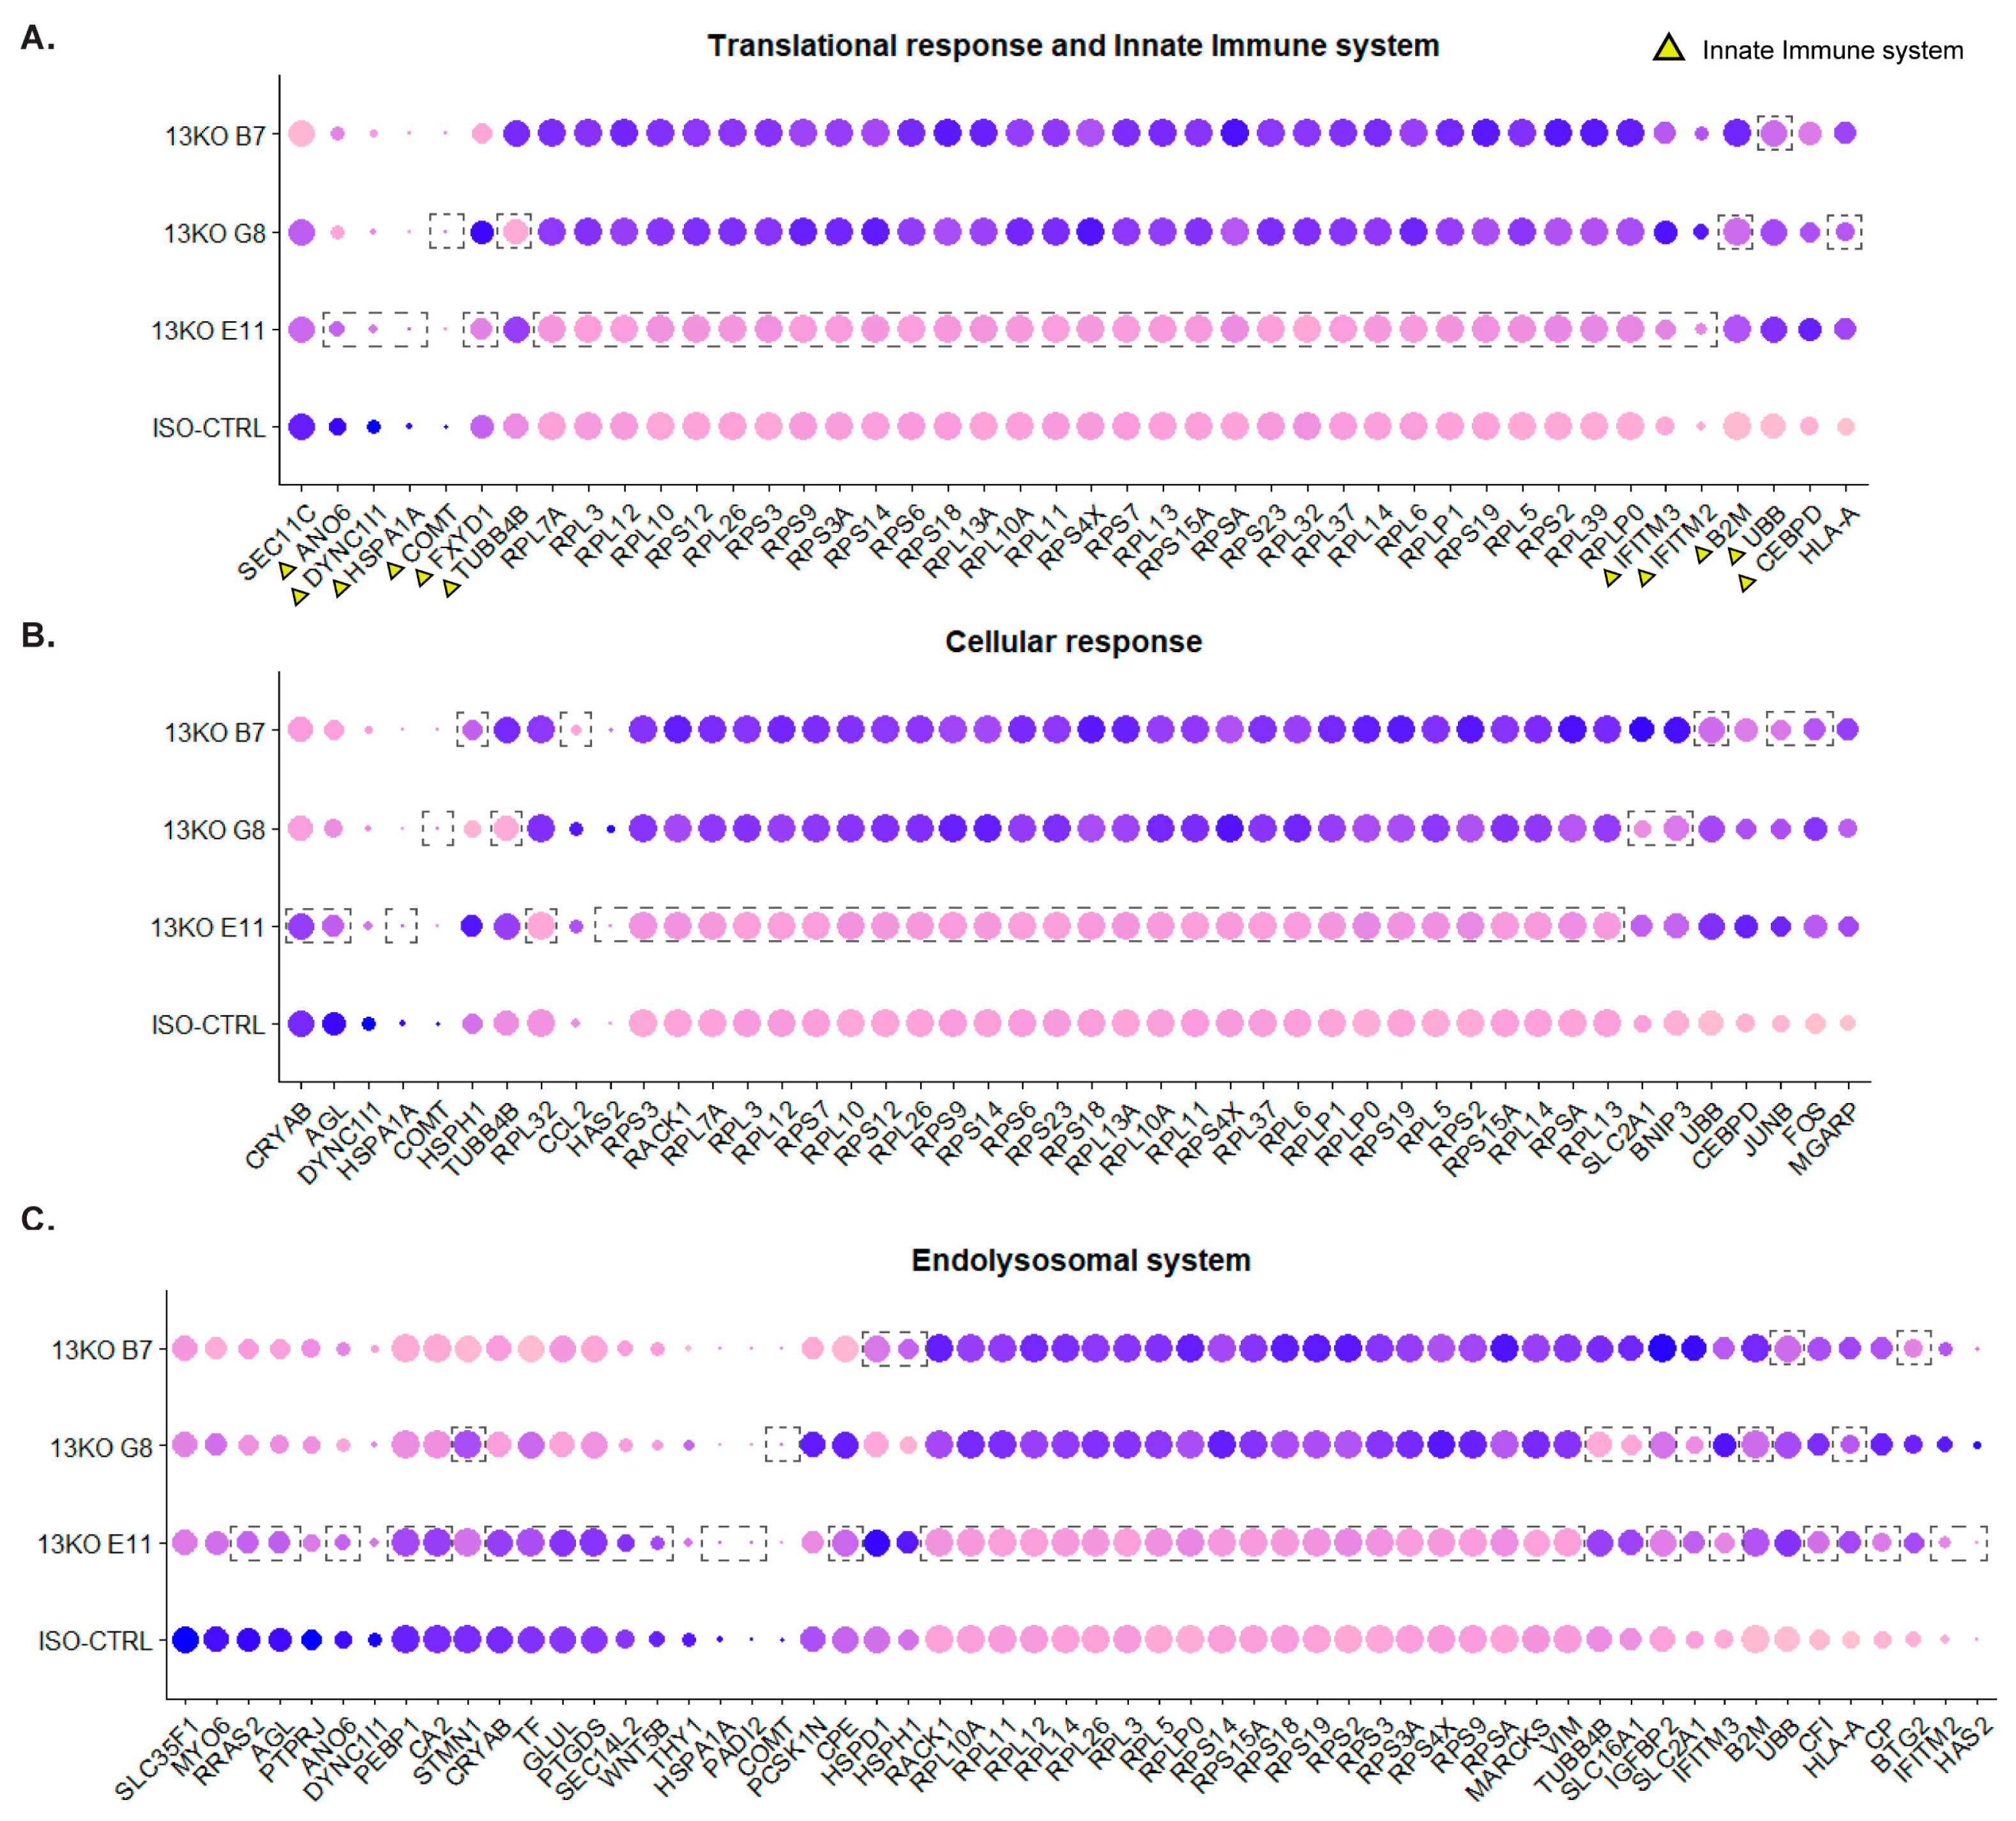
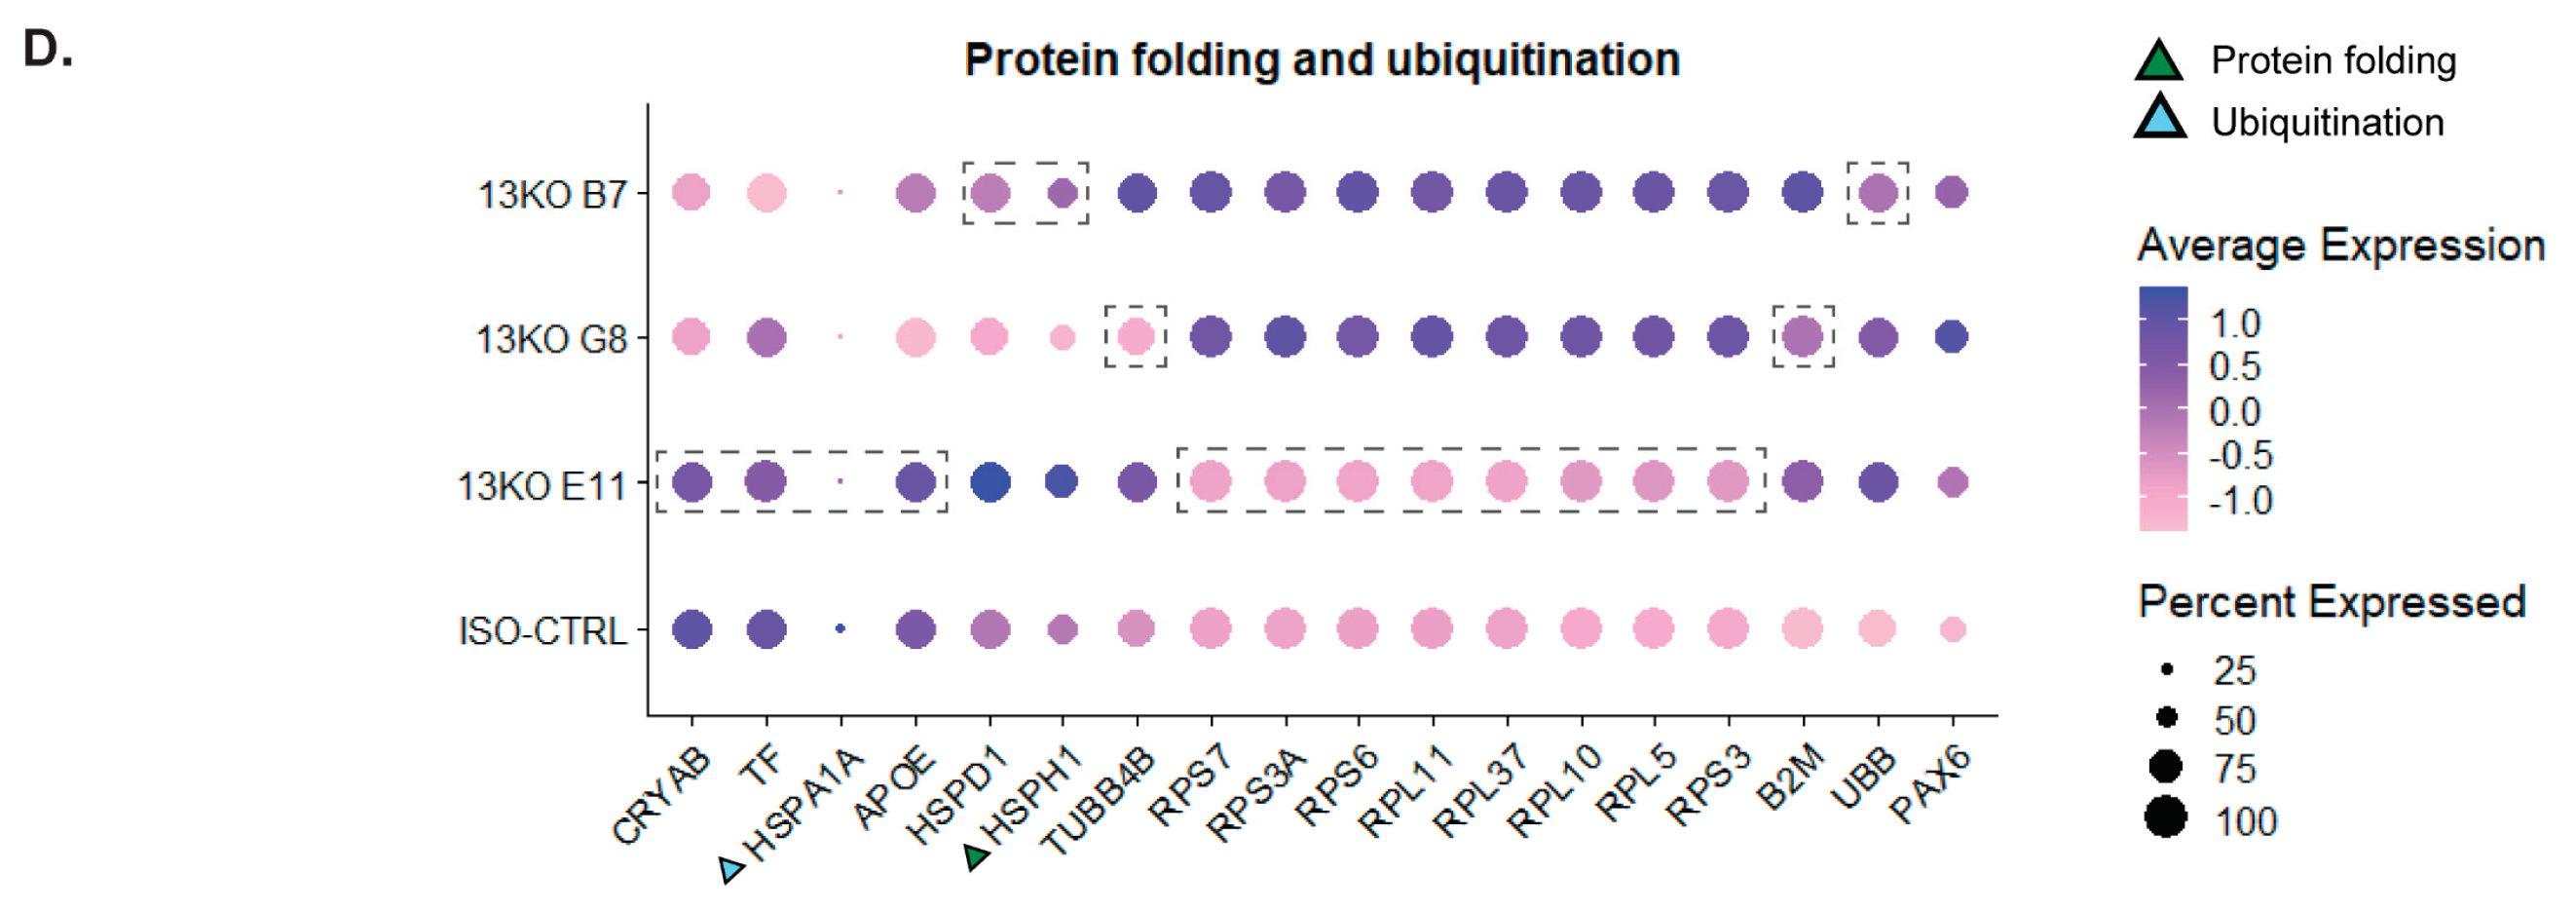
Figure 9.
Analysis of USH2A transcripts coding for the long and short usherin isoforms in photoreceptors and Müller glial cells of USH2A 13KO retinal organoids compared to isogenic controls. (A-F) Violin plots comparing the expression levels of USH2A coding for usherin long isoform B (A-C) and usherin short isoform A (D-F) in the 13Ksubclones to ISO-CTRL in Rods (A, D), Cones (B, E), and MGCs (C, F) (adjusted p-values = 1). Number of organoids used: ISO-CTRL n = 4, 13KO E11 n = 4, 13KO G8 n = 3, 13KO B7 n = 3 from the same differentiation round.
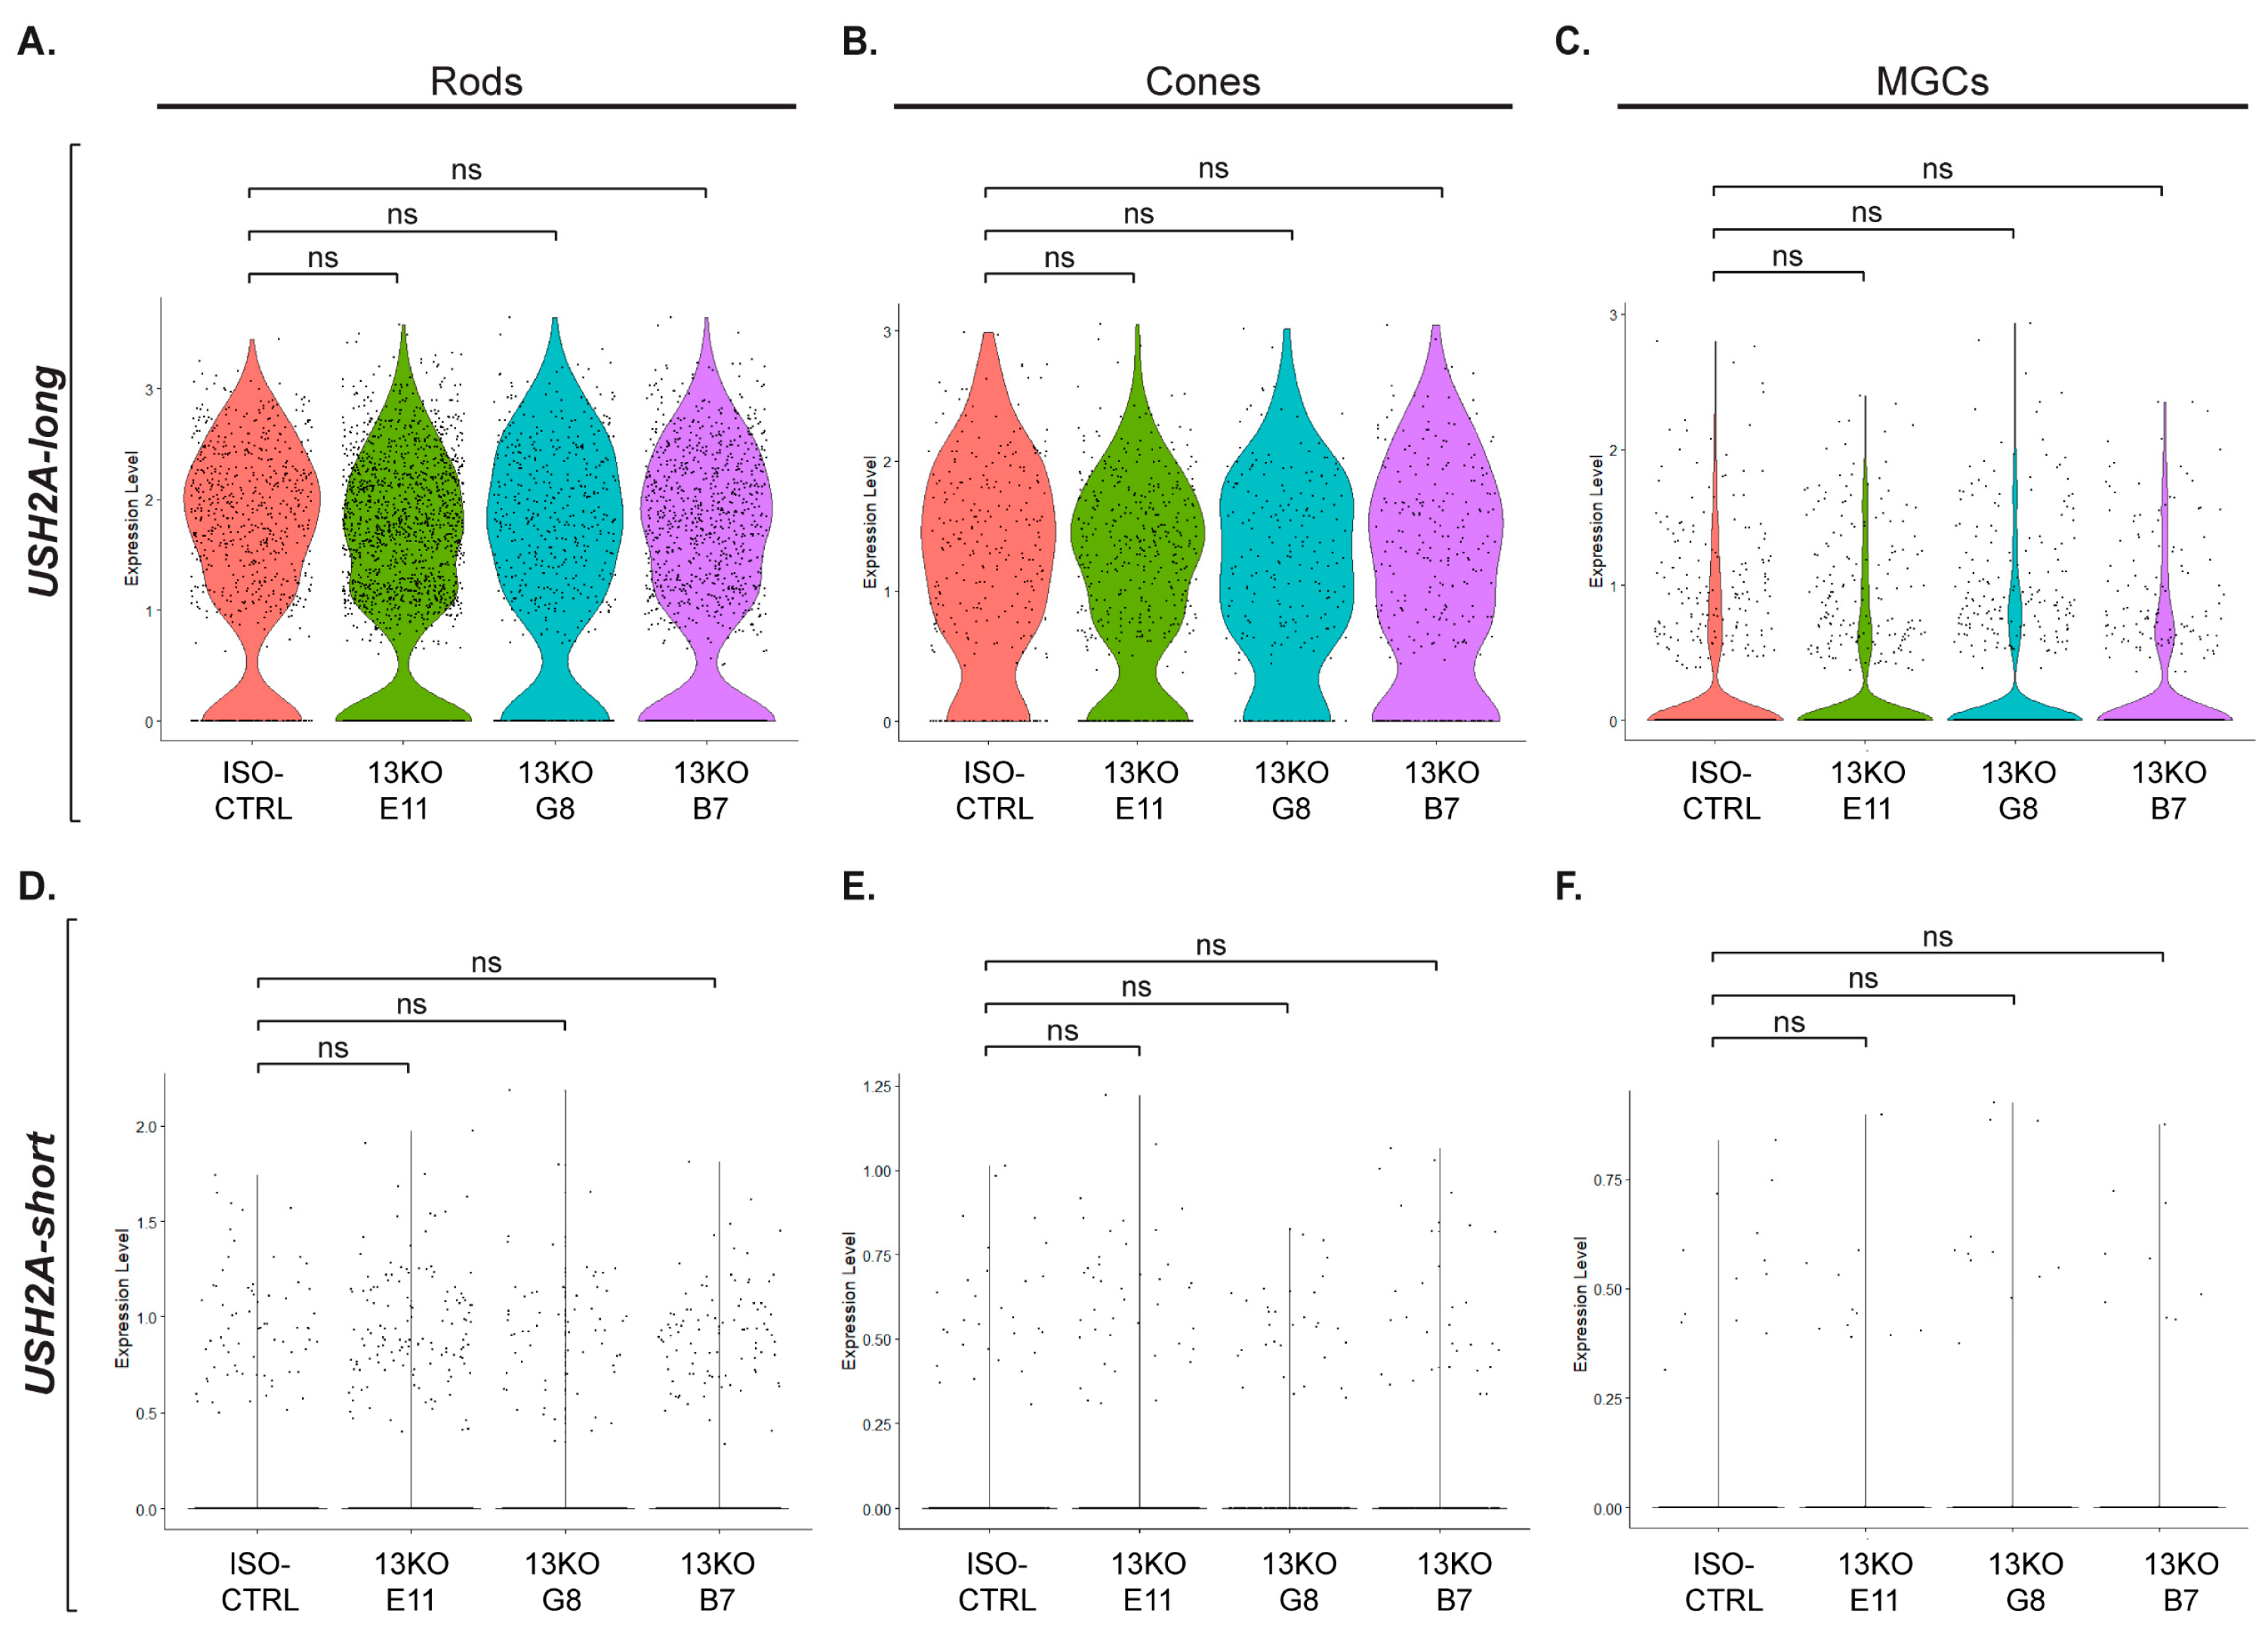

Table 1.
List of patient and 13KO USH2A mutations resulting in a similar truncated usherin protein structure.
Table 1.
List of patient and 13KO USH2A mutations resulting in a similar truncated usherin protein structure.
| USH2A mutation | Usherin change | Usherin size (aa) | Protein domain affected |
|---|---|---|---|
| c.2311 G>T | p.(Glu771Ter) | 770 | EGF-Lam like 5 |
| c.2299del | p.(Glu767Serfs*21) | 786 (766+20) | EGF-Lam like 5 |
| c.2310del | p.(Glu771Lysfs*17) | 786 (770+16) | EGF-Lam like 5 |
| c.2314delG | p.(Ala772Profs*16) | 786(771+15) | EGF-Lam like 5 |
| c.2344del | p.Glu782Lysfs*6) | 786 (781+5) | EGF-Lam like 5 |
| c.2391_2392del | p.(Cys797*) | 796 | EGF-Lam like 6 |
| c.2431 A>T | p.(Lys811*) | 810 | EGF-Lam like 6 |
| c.2431_2432_del | p.(Lys811Aspfs*11) | 820 (810+10) | EGF-Lam like 6 |
| c.2440 C>T | p.(Gln814*) | 813 | EGF-Lam like 6 |
| c.2512 C>T | p.(Glu838*) | 837 | EGF-Lam like 6 |
| c.2541 C>A | p.(Cys847*) | 846 | EGF-Lam like 7 |
| c.2553_2554insTAGT | p.(Thr852*) | 851 | EGF-Lam like 7 |
| c.2599 C>T | p.(Gln867*) | 866 | EGF-Lam like 7 |
| c.2610 C>A | p.(Cys870*) | 869 | EGF-Lam like 7 |
| C.2661 C>A | p.(Tyr887) | 886 | EGF-Lam like 7 |
The information related to the USH2A 13KO mutation generated in this study is reported in bold for reference. In case of frameshift mutations, the number of nucleotides differing from the original usherin sequence is explicated in brackets. The identity of the protein domain affected is determined following the NCBI annotation.
Disclaimer/Publisher’s Note: The statements, opinions and data contained in all publications are solely those of the individual author(s) and contributor(s) and not of MDPI and/or the editor(s). MDPI and/or the editor(s) disclaim responsibility for any injury to people or property resulting from any ideas, methods, instructions or products referred to in the content. |
© 2025 by the authors. Licensee MDPI, Basel, Switzerland. This article is an open access article distributed under the terms and conditions of the Creative Commons Attribution (CC BY) license (http://creativecommons.org/licenses/by/4.0/).
Copyright: This open access article is published under a Creative Commons CC BY 4.0 license, which permit the free download, distribution, and reuse, provided that the author and preprint are cited in any reuse.


