Submitted:
27 November 2025
Posted:
28 November 2025
You are already at the latest version
Abstract
Background: Attention-deficit/hyperactivity disorder (ADHD) and autism spectrum disorder (ASD) are among the most common neurodevelopmental disorders in childhood and are increasingly recognized as conditions shaped by social and structural determinants of health. However, nationally representative evidence quantifying how family socioeconomic position, insurance, food security, and neighborhood context relate to ADHD and ASD remains limited. Methods: This cross-sectional, population-based study used pooled data from the 2018–2023 National Survey of Children’s Health (NSCH) for children aged 3–17 years. Parent-reported, clinician-diagnosed current ADHD and ASD were the primary outcomes. Key exposures included federal poverty level–based household income, highest parental education, health insurance type, food insecurity, and caregiver-reported neighborhood safety. Analyses incorporated survey weights, strata, and primary sampling units. Weighted prevalence estimates, Rao–Scott χ² tests, and survey-weighted logistic regression models were used to estimate adjusted odds ratios (aORs) and 95% confidence intervals (CIs) for ADHD and ASD associated with social determinants. Results: The analytic sample comprised 205,480 children, representing approximately 73.1 million U.S. children. The weighted prevalence of current ADHD was 9.7% (95% CI 9.3–10.1), and ASD was 2.9% (95% CI 2.7–3.2); 1.1% had comorbid ADHD and ASD. Boys had a higher prevalence of ADHD (13.3% vs. 6.0%) and ASD (4.1% vs. 1.1%) than girls. Strong social gradients were evident. Compared with children in households at ≥400% of the federal poverty level (FPL), those below 100% FPL had 2.11 times higher odds of ADHD (95% CI 1.82–2.46) and 1.73 times higher odds of ASD (95% CI 1.32–2.28) after adjustment. Low parental education, public insurance, unsafe neighborhoods, and food insecurity independently predicted higher odds of both disorders. Hispanic children had lower adjusted odds of ASD than non-Hispanic White children despite similar contextual risk patterns. Conclusions: ADHD and ASD among U.S. children are patterned along socioeconomic and environmental lines. Income, parental education, food security, and neighborhood safety are powerful independent predictors of both prevalence and severity. Findings support integrating developmental screening with social risk assessment, strengthening neighborhood-level investments, and designing equity-focused early intervention strategies to reduce neurodevelopmental disparities.
Keywords:
ADHD
; ASD
; child development
; health disparities
; neurodevelopmental disorders
; neighborhood safety
; socioeconomic status
; social determinants of health
; survey data
; United States
1. Introduction
Neurodevelopmental disorders are a group of early-onset conditions that disrupt cognition, behavior, and social functioning, potentially limiting children’s daily activities and long-term potential. Among these conditions, attention-deficit/hyperactivity disorder (ADHD) and autism spectrum disorder (ASD) are particularly prominent because of their high prevalence and impact on attention, self-regulation, and social communication across home, school, and community settings [1,2]. ADHD is characterized by developmentally inappropriate patterns of inattention and/or hyperactivity–impulsivity, whereas ASD involves persistent social-communication difficulties and restricted or repetitive behaviors [3]. Both disorders commonly co-occur with learning difficulties, anxiety, depression, and disruptive behavior problems and account for a substantial share of years lived with disability among children worldwide [4]. Recent U.S. surveillance data indicate that roughly 9–10% of children aged 3–17 years have ever been diagnosed with ADHD and nearly 3% with ASD, with boys affected more often than girls [5,6].
Although genetic factors contribute to vulnerability for ADHD and ASD, there is growing recognition that these conditions are also shaped by social and structural determinants of health—the conditions under which children are born, grow, live, and learn [7,8]. Household income, parental education, health insurance coverage, neighborhood safety, food security, and exposure to discrimination can influence both children’s developmental risk and their access to timely diagnostic and treatment services [9,10]. A broad literature links socioeconomic disadvantage to greater ADHD symptom burden, higher prevalence of disruptive behaviors, and lower continuity of mental health care [11,12]. Children living in unsafe or resource-poor neighborhoods, experiencing housing instability, or facing food insecurity are more likely to show externalizing behaviors and stress-related difficulties that overlap with ADHD-like presentations and social-communication challenges [13,14]. At the same time, structural racism and unequal access to pediatric subspecialty care contribute to underdiagnosis and delayed identification of ASD among Black and Hispanic children and among families with fewer resources [15,16].
Despite these advances, significant gaps remain in the empirical evidence. Many prior studies on social determinants and neurodevelopmental conditions rely on regional or clinic-based samples, making it difficult to generalize findings to the U.S. child population. Others use single-year survey snapshots that may not capture cumulative or structural patterns. National surveillance systems such as the National Survey of Children’s Health (NSCH), the National Health Interview Survey (NHIS), and the Autism and Developmental Disabilities Monitoring (ADDM) Network provide valuable information on prevalence, yet relatively few analyses have leveraged multi-year NSCH data to examine social gradients in ADHD and ASD while fully accounting for the survey’s complex sampling design [5,17,18]. In addition, limited work has simultaneously modeled multiple social determinants—income, parental education, insurance type, neighborhood safety, and food insecurity—in relation to both ADHD and ASD within the same nationally representative framework. Little is known about how these determinants relate to co-occurring ADHD and ASD or to gradients in caregiver-reported severity once demographic and regional factors are taken into account [6,11,19,20].
This study addresses these gaps by using six years of nationally representative NSCH data (2018–2023) to examine how family income, parental education, insurance type, neighborhood safety, and food insecurity are associated with ADHD and ASD among U.S. children aged 3–17 years. The objectives were to: (1) describe the weighted prevalence of ADHD and ASD across key demographic and socioeconomic strata; (2) estimate adjusted associations between selected social determinants and the odds of ADHD and ASD; and (3) assess whether disparities persist after controlling for age, sex, race/ethnicity, family structure, region, and survey year. We hypothesized that children living in low-income households, with less-educated parents, public or no insurance, food insecurity, and residence in unsafe neighborhoods would have higher odds of ADHD and ASD than more advantaged peers, even after adjustment for demographic and geographic covariates.
2. Materials and Methods
2.1. Study Design
This study used a cross-sectional, population-based design. We analyzed pooled data from six consecutive cycles of the National Survey of Children’s Health (NSCH), combining survey years 2018–2023 to obtain stable estimates and sufficient power for subgroup analyses. The NSCH is designed to provide nationally representative information on the health and well-being of non-institutionalized U.S. children and is conducted annually by the U.S. Census Bureau under the direction of the Health Resources and Services Administration (HRSA) [5].
2.2. Data Sources
The primary data source was the NSCH public-use file for survey years 2018–2023. NSCH employs an address-based sampling frame to identify households with children, randomly selects one child per household, and administers a caregiver-reported questionnaire via web-based and mailed modes [5]. The survey includes detailed questions on physical and mental health, development, health care access, family characteristics, and neighborhood context.
To place the findings in context, we drew on published reports from two additional national surveillance systems: the National Health Interview Survey (NHIS) and the Autism and Developmental Disabilities Monitoring (ADDM) Network [6,18]. These complementary sources were used to compare overall prevalence patterns and confirm that estimates from the pooled NSCH cycles were consistent with other federal data systems.
2.3. Participants and Sample Selection
The analytic population consisted of children aged 3–17 years at the time of the survey. Children younger than three years were excluded because ADHD and ASD diagnoses are less reliably reported in this age group, and diagnostic criteria often require a more extended period of observation.
Across the 2018–2023 survey cycles, the NSCH included approximately 212,000 unweighted child respondents. We applied the following exclusion criteria:
- Missing data on current ADHD or ASD diagnosis;
- Missing age or age outside the 3–17-year range;
- Missing values on key social determinants of interest (household income category, parental education, neighborhood safety);
- Missing design variables or sampling weights needed for survey analysis.
After exclusions, the final analytic sample comprised 205,480 children. After applying survey weights, this sample represented approximately 73.1 million U.S. children aged 3–17 years.
2.4. Variables and Measures
2.4.1. Outcomes
The primary outcomes were current ADHD and current ASD, based on caregiver reports of clinician-diagnosed conditions. For ADHD, caregivers were asked whether a health care provider had ever told them that their child had attention-deficit/hyperactivity disorder or attention-deficit disorder, and whether the child currently had ADHD. For ASD, caregivers were asked whether their child had ever been diagnosed with autism, Asperger’s disorder, pervasive developmental disorder, or autism spectrum disorder, and whether the condition was current. Binary indicators were created for current ADHD and current ASD.
For descriptive purposes, we also constructed a three-category variable indicating ADHD only, ASD only, or comorbid ADHD and ASD. Among children with either diagnosis, caregivers rated severity as mild, moderate, or severe; this information was used in secondary analyses of symptom burden.
2.4.2. Predictors: Social Determinants of Health
Social determinants were selected a priori, guided by established frameworks on the social determinants of child health and prior research on neurodevelopmental inequities [7,8,9,10,19].
- Household income was categorized relative to the federal poverty level (FPL) as <100% FPL, 100%–199% FPL, 200%–399% FPL, and ≥400% FPL, based on survey-derived income and family size.
- Parental education was defined as the highest educational attainment of any parent or guardian in the household and grouped as less than high school, high school diploma or equivalent, some college, and bachelor’s degree or higher.
- Health insurance type at the time of the survey was coded as private, public (Medicaid or Children’s Health Insurance Program), or uninsured.
- Food insecurity was defined from caregiver responses indicating that the household sometimes or often could not afford enough food in the past 12 months.
- Neighborhood safety was based on the question asking how safe the caregiver considers the neighborhood for children to play outside, with response options “definitely safe,” “somewhat safe,” and “not at all safe.” For primary analyses, we retained this three-level measure; in regression models, “definitely safe” served as the reference category.
In additional models, we considered an index of neighborhood social cohesion and indicators of delayed health care due to cost or access barriers as exploratory social-context variables.
2.4.3. Covariates
Covariates were chosen based on prior epidemiologic studies of ADHD and ASD and to adjust for demographic and geographic differences in prevalence [5,6,11,20]. These included:
- Child age (continuous, in years);
- Sex (male, female);
- Race/ethnicity (non-Hispanic White, non-Hispanic Black, Hispanic, other, or multiracial);
- U.S. Census region (Northeast, Midwest, South, West);
- Family structure (two-parent household, single-parent household, other family arrangement);
- Survey year (2018, 2019, 2020, 2021, 2022, 2023).
These variables were included in multivariable models to reduce confounding and, as much as possible within a cross-sectional framework, isolate the associations between social determinants and neurodevelopmental outcomes.
2.5. Statistical Analyses
All analyses accounted for the NSCH's complex sampling design. Survey weights, strata, and primary sampling units (PSUs) provided in the public-use files were used to generate nationally representative estimates and correct standard errors for clustering and unequal selection probabilities [5].
We first calculated weighted frequencies, percentages, and 95% confidence intervals (CIs) to describe sample characteristics and to estimate the prevalence of ADHD and ASD overall and across levels of each social determinant. Group differences were assessed using Rao–Scott χ² tests for categorical variables and survey-adjusted t-tests for continuous variables.
To examine associations between social determinants and neurodevelopmental outcomes, we fit separate survey-weighted logistic regression models for current ADHD and current ASD. Each model included household income category, parental education, insurance type, neighborhood safety, and food insecurity, along with the covariates age, sex, race/ethnicity, region, family structure, and survey year. Results are presented as adjusted odds ratios (aORs) with 95% CIs. Income and education categories were treated as ordinal variables to test for linear trends in dose–response patterns.
We then used the fitted models to estimate predicted probabilities of ADHD and ASD across income categories, holding covariates at representative values. These marginal predictions were graphed to illustrate social gradients in disorder prevalence.
Sensitivity analyses were conducted to assess robustness. First, we repeated models after excluding children with comorbid ADHD and ASD to determine whether associations differed for single-diagnosis groups. Second, we estimated ordered logistic regression models for severity among children with ADHD or ASD to examine whether social determinants were associated with more severe caregiver-rated impairment. Third, we tested interaction terms between income and race/ethnicity and between insurance type and neighborhood safety to explore potential effect modification. Multicollinearity was assessed using variance inflation factors, and overall model fit was evaluated using Wald statistics and goodness-of-fit tests adapted for complex survey data [21]. All analyses were performed with survey procedures in standard statistical software capable of complex survey estimation.
2.6. Ethical Approval
The NSCH datasets used in this study are publicly available and fully de-identified. No direct contact with human participants occurred, and no identifiable private information was accessed. In accordance with U.S. federal regulations governing secondary analysis of existing, de-identified data (45 CFR §46.104[d][4]), the study met criteria for exemption from institutional review board review. All analyses were conducted in line with the ethical principles outlined in the Declaration of Helsinki.
3. Results
3.1. Descriptive Statistics
The pooled analytic sample included 205,480 children aged 3–17 years and represented approximately 73.1 million U.S. children when survey weights were applied. The mean age was 10.6 years (standard deviation 4.1); 51.2% of children were male and 48.8% were female.
By race/ethnicity, 50.8% of children were non-Hispanic White, 13.6% were non-Hispanic Black, 24.1% were Hispanic, and 11.5% were of another race or multiracial. Overall, 61% of children lived in two-parent households, 33% in single-parent households, and 6% in other family arrangements.
With respect to socioeconomic position, 19.7% of children lived in households with income <100% of the federal poverty level (FPL), 25.4% at 100%–199% FPL, 31.8% at 200%–399% FPL, and 23.1% at ≥400% FPL. Parental education was: <high school for 9.5%; high school diploma for 29.1%; some college for 27.6%; and bachelor’s degree or higher for 33.8%.
Regarding health insurance, 54.2% of children had private coverage, 38.5% had public insurance, and 7.3% were uninsured. Neighborhood safety was reported as definitely safe by 70.1% of caregivers, somewhat safe by 25.8%, and not safe by 4.1%. Food insecurity was reported in 10.8% of households (Table 1).
3.2. Main Outcomes: Prevalence of ADHD and ASD
The weighted prevalence of current ADHD was 9.7% (95% confidence interval [CI] 9.3–10.1), and the prevalence of current ASD was 2.9% (95% CI 2.7–3.2). Approximately 1.1% of children had comorbid ADHD and ASD.
Prevalence differed by sex. Among boys, 13.3% had ADHD and 4.1% had ASD; among girls, 6.0% had ADHD and 1.1% had ASD (p < 0.001 for both comparisons).
Across income categories, ADHD prevalence was 13.4% (95% CI 12.1–14.7) for children in households <100% FPL, 10.8% (95% CI 9.8–11.8) at 100%–199% FPL, 8.6% (95% CI 7.8–9.4) at 200%–399% FPL, and 6.2% (95% CI 5.6–6.8) at ≥400% FPL. ASD prevalence across the same income categories was 3.8% (95% CI 3.1–4.5), 3.2% (95% CI 2.6–3.8), 2.7% (95% CI 2.3–3.1), and 2.0% (95% CI 1.7–2.3), respectively.
By parental education, ADHD prevalence ranged from 14.6% (95% CI 12.8–16.4) among children whose parents had less than a high school education to 6.8% (95% CI 6.1–7.5) among those with parents holding a bachelor’s degree or higher. ASD prevalence across these education categories ranged from 3.9% (95% CI 3.1–4.7) to 2.1% (95% CI 1.8–2.4).
Children in neighborhoods reported as not safe had ADHD prevalence of 15.8% (95% CI 13.0–18.6) and ASD prevalence of 4.4% (95% CI 3.0–5.8), compared with 8.9% (95% CI 8.3–9.5) and 2.5% (95% CI 2.2–2.8), respectively, in neighborhoods reported as definitely safe. ADHD prevalence was 14.9% (95% CI 13.2–16.6) among children in food-insecure households versus 8.8% (95% CI 8.3–9.3) in food-secure households; ASD prevalence in these groups was 4.1% (95% CI 3.4–4.9) and 2.7% (95% CI 2.4–3.0), respectively.
ADHD prevalence was 8.1% (95% CI 7.5–8.7) among privately insured children, 13.2% (95% CI 12.0–14.4) among publicly insured children, and 10.5% (95% CI 8.4–12.6) among uninsured children. ASD prevalence in these groups was 2.4% (95% CI 2.1–2.7), 3.8% (95% CI 3.2–4.4), and 2.6% (95% CI 1.8–3.4), respectively (Table 2).
3.3. Regression Outcomes
In survey-weighted logistic regression models for ADHD that adjusted for age, sex, race/ethnicity, region, family structure, survey year, and all social determinants, household income, parental education, insurance type, neighborhood safety, food insecurity, and sex remained associated with the odds of current ADHD.
Compared with children in households at ≥400% FPL, adjusted odds ratios (aORs) for ADHD were 2.11 (95% CI 1.82–2.46) for children at <100% FPL, 1.69 (95% CI 1.46–1.95) for those at 100%–199% FPL, and 1.28 (95% CI 1.12–1.45) for those at 200%–399% FPL. Relative to children whose parents had a bachelor’s degree or higher, aORs were 1.83 (95% CI 1.52–2.20) for children whose parents had less than a high school education and 1.42 (95% CI 1.26–1.60) for those whose parents had a high school diploma.
Children with public insurance had an aOR of 1.37 (95% CI 1.20–1.55) for ADHD compared with those with private insurance. Residing in a neighborhood rated as not safe was associated with an aOR of 1.94 (95% CI 1.51–2.49) relative to living in a definitely safe neighborhood. Household food insecurity was associated with an aOR of 1.88 (95% CI 1.60–2.21) compared with food-secure households. Boys had an aOR of 2.39 (95% CI 2.12–2.68) compared with girls. Relative to non-Hispanic White children, non-Hispanic Black children had an aOR of 1.18 (95% CI 1.01–1.37) and Hispanic children had an aOR of 0.76 (95% CI 0.66–0.88) for ADHD (Table 3).
In adjusted models for ASD using the same covariates, aORs for children in households <100% FPL and 100%–199% FPL were 1.73 (95% CI 1.32–2.28) and 1.32 (95% CI 1.04–1.67), respectively, compared with children at ≥400% FPL. For children whose parents had less than a high school education, the aOR for ASD was 1.46 (95% CI 1.12–1.91), and for those whose parents had a high school diploma, the aOR was 1.28 (95% CI 1.01–1.63), relative to children whose parents had a bachelor’s degree or higher.
Children in neighborhoods rated as not safe had an aOR of 1.79 (95% CI 1.21–2.64) for ASD compared with those in definitely safe neighborhoods. Food insecurity was associated with an aOR of 1.61 (95% CI 1.18–2.19). Boys had an aOR of 3.84 (95% CI 3.13–4.72) relative to girls. Compared with non-Hispanic White children, non-Hispanic Black children had an aOR of 0.64 (95% CI 0.51–0.80), and Hispanic children had an aOR of 0.59 (95% CI 0.47–0.73) for ASD (Table 3).
3.4. Figures
Model-based predicted probabilities of ADHD and ASD across income categories showed decreasing estimated probabilities with increasing household income. For ADHD, predicted probabilities declined from 12.9% (95% CI 11.8–14.0) among children in households with <100% FPL to 6.5% (95% CI 5.9–7.1) among those in households with≥400% FPL. For ASD, predicted probabilities decreased from 3.6% (95% CI 2.9–4.3) to 2.1% (95% CI 1.8–2.4) across the same income range (Figure 1).
Forest plots of adjusted odds ratios by race/ethnicity summarize model estimates for ADHD and ASD. For ADHD, the plot displayed the reference level for non-Hispanic White children and the aORs and 95% CIs for non-Hispanic Black, Hispanic, and other or multiracial children. A similar plot summarized aORs and CIs for ASD by race/ethnicity (Figure 2).
3.5. Sensitivity Analyses
Sensitivity analyses excluding children with comorbid ADHD and ASD produced aORs for social determinants that were similar in direction and magnitude to the main models, and all primary associations remained statistically significant. Ordered logistic regression models for severity among children with ADHD or ASD indicated higher odds of moderate or severe caregiver-rated severity among children in households with income <200% FPL compared with those in households at ≥400% FPL.
Interaction models showed evidence of effect modification. The income gradient in ADHD and ASD was steeper among non-Hispanic White children than among some other racial/ethnic groups. The association between neighborhood safety and ADHD appeared stronger among publicly insured children than among those with private insurance.
Diagnostics from the survey-weighted models indicated no substantive multicollinearity, with variance inflation factors below conventional thresholds. Goodness-of-fit statistics and Wald tests did not suggest a lack of fit for the multivariable models.
4. Discussion
4.1. Summary of Key Findings
This study used six years of nationally representative data to examine how social and structural factors relate to ADHD and ASD among U.S. children. Several patterns were clear. First, both conditions are common in the child population, with ADHD affecting roughly one in ten children and ASD affecting a smaller but still substantial share. Second, social gradients were evident across multiple domains: children in lower-income households, in families with lower parental education, in food-insecure homes, and in neighborhoods perceived as unsafe had higher odds of ADHD and ASD than more advantaged peers. Third, these gradients persisted after adjustment for age, sex, race/ethnicity, region, and family structure. Finally, sex and race/ethnicity remained significant correlates, with boys more likely than girls to have either diagnosis, and racial/ethnic differences suggesting uneven diagnostic patterns.
4.2. Comparison with Existing Literature
The overall burden of ADHD and ASD observed in this study is consistent with recent national estimates derived from NSCH, NHIS, and the ADDM Network [5,6,18]. These systems have repeatedly documented that ADHD is among the most common childhood mental health diagnoses and that ASD prevalence has increased over time as awareness, screening, and diagnostic practices have evolved [1,2,16]. Our findings align with previous reports showing higher prevalence among boys than girls and support the broader literature describing ADHD and ASD as major contributors to childhood disability [3,4,11,12].
The social gradients identified here are also in keeping with a growing body of work linking socioeconomic disadvantage to neurodevelopmental outcomes. Prior studies have shown that children from low-income families are more likely to exhibit externalizing behaviors, attentional difficulties, and higher ADHD symptom burden, and are less likely to receive continuous, high-quality care [11,12,20]. Research on neighborhood conditions has documented that children living in areas characterized by violence, low cohesion, and limited resources experience elevated stress, difficulties with self-regulation, and poorer emotional outcomes [13,14,22]. The present analysis extends this literature by demonstrating similar patterns for both ADHD and ASD within a single nationally representative dataset, while simultaneously examining income, education, insurance, food security, and neighborhood safety.
The racial and ethnic patterns observed—higher odds of ADHD but lower odds of ASD among some minoritized groups compared with non-Hispanic White children—are consistent with prior reports of differential diagnostic patterns and service access [15,16,23,24]. Earlier studies have described underidentification of ASD among Black and Hispanic children, delays in diagnostic evaluation, and disparities in access to specialty services [15,16,24]. Our results, based on recent pooled NSCH data, reinforce concerns that diagnostic pathways and service systems may not be functioning equitably across racial and ethnic groups.
4.3. Interpretation of Mechanisms and Implications
Several mechanisms may underlie the associations between social determinants and neurodevelopmental disorders. Economic hardship, unstable employment, and housing insecurity may increase family stress, constrain caregiving resources, and limit access to stimulating, predictable environments that support attention and social development [7,8,9,10]. Food insecurity and material deprivation can contribute to chronic stress and inconsistent routines, which may exacerbate difficulties in regulation and behavior. Neighborhood environments that are perceived as unsafe may reduce opportunities for outdoor play, social interaction, and independent exploration, while heightening exposure to violence and threat. These conditions are consistent with models describing how early adversity and environmental unpredictability become “embedded” in neurodevelopment through effects on stress-response systems and brain circuits involved in executive function and social cognition [14,19].
At the same time, the social determinants examined here are also closely tied to patterns of health care access and use. Families with lower income or public insurance may face more barriers to early developmental screening, specialist referrals, and continuity of care [11,20,25]. Diagnostic practices may vary by practice setting and reimbursement environment, shaping when and how ADHD and ASD are labeled and documented. Structural racism, implicit bias, and differences in communication between families and professionals can contribute to both overdiagnosis and underdiagnosis in different groups, as well as to divergent treatment pathways [15,16,23]. The lower adjusted odds of ASD among Black and Hispanic children, even at similar levels of disadvantage, are consistent with these structural explanations rather than with actual differences in underlying risk.
The combined pattern of strong social gradients and persistent demographic differences suggests that ADHD and ASD should be understood not only as individual clinical conditions but also as outcomes influenced by the broader social and policy environment. Interventions that focus solely on individual behavior, without addressing family resources and neighborhood conditions, are unlikely to address these inequities fully.
4.4. Strengths and Limitations
This study has several strengths. It draws on a large, nationally representative sample of U.S. children across multiple survey years, thereby improving the precision of prevalence estimates and enabling a more detailed examination of social gradients. The analyses use appropriate survey methods, account for the complex sampling design, and include multiple indicators of socioeconomic position and neighborhood context. Examining ADHD and ASD within the same framework allows a direct comparison of how social determinants relate to each condition.
Limitations should also be considered. The cross-sectional design does not permit conclusions about causality or the timing of exposures and diagnoses. It is possible that caring for a child with ADHD or ASD affects parental employment, income, and stress, leading to bidirectional relationships between disorders and social conditions. All diagnoses and severity ratings are based on caregiver reports of clinician feedback, which may be influenced by recall, differences in access to evaluation, or cultural norms around labeling behavior. The survey does not include detailed information on clinical assessment procedures, symptom trajectories, or service histories. Unmeasured factors, such as prenatal exposures, parental mental health, or environmental toxins, may confound some associations. Finally, although NSCH is available in multiple languages, some groups may be underrepresented or may participate differently, which could influence estimates.
4.5. Policy Implications and Public Health Relevance
The findings have several implications for policy and practice. First, they support integrating developmental and behavioral screening with systematic assessment of social risks in pediatric and school-based settings. Identifying children who are both developmentally vulnerable and exposed to economic hardship, food insecurity, or unsafe neighborhoods may help target services more effectively. Second, the consistent associations between neighborhood safety and both ADHD and ASD point to the importance of community-level interventions that improve safety, cohesion, and access to supportive spaces for children and families [7,8,22].
Third, the racial and ethnic differences in diagnostic patterns underscore the need to examine referral pathways, screening practices, and clinician decision-making processes to ensure that children from all backgrounds have timely access to evaluation and evidence-based care [15,16,24]. This may include culturally responsive outreach, training to reduce implicit bias, and support for families navigating complex service systems. Fourth, because many of the social determinants identified here are shaped by policies outside the health sector—such as income support, housing, food assistance, and community development—efforts to reduce neurodevelopmental inequities will require coordination across health, education, and social service agencies.
From a public health perspective, ADHD and ASD should be viewed as key indicators of child development that reflect both individual differences and the distribution of social opportunity. Policies that reduce child poverty, expand access to stable, high-quality early childhood environments, and strengthen neighborhood conditions are likely to yield broad benefits for neurodevelopment, mental health, and educational attainment.
5. Conclusions
This study shows that ADHD and ASD in U.S. children are closely patterned by family and neighborhood conditions rather than being randomly distributed across the population. Using six years of nationally representative data, we found that children growing up in low-income households, with less-educated parents, in food-insecure homes, and in neighborhoods perceived as unsafe had higher odds of both ADHD and ASD, even after accounting for demographic and regional differences. These results highlight that neurodevelopmental disorders reflect not only individual vulnerability, but also the broader social environments in which children live.
The findings have several practical implications. Developmental and behavioral screening in pediatric and school settings should be paired with routine assessment of social risks, including poverty, food insecurity, and neighborhood safety. Health systems and schools can use this information to connect families with community resources, social services, and early intervention supports. Efforts to improve neighborhood safety and cohesion, reduce child poverty, and ensure stable insurance coverage are likely to benefit neurodevelopment alongside other health outcomes. Policies that deliberately link child mental health initiatives with social and economic supports may offer the most significant promise for reducing inequities in ADHD and ASD and improving developmental trajectories for children exposed to disadvantage.
Author Contributions
Conceptualization: C.O. C.I.; Methodology: C.O.; Formal Analysis: C.O.; Data Curation: C.O.; Writing—Original Draft Preparation: C.I., G.A.; Writing—Review & Editing: C.O., C.I.; Visualization: C.O. C.I., G.A.; Project Administration: C.I. G.A.; All authors have read and agreed to the published version of the manuscript.
Funding
This research received no external funding. Data collection for the National Survey of Children’s Health was supported by the Health Resources and Services Administration (HRSA) and the U.S. Census Bureau.
Institutional Review Board Statement
Ethical review and approval were waived for this study due to retrospective data. This study analyzed publicly available, de-identified survey data. It met the criteria for exemption from institutional review board review under 45 CFR §46.104(d)(4).
Informed Consent Statement
Patient consent was waived due to retrospective data. The original data collectors obtained informed consent in accordance with U.S. federal requirements. No identifiable information was accessed in this secondary analysis.
Data Availability Statement
National Survey of Children’s Health (NSCH) datasets are publicly available at: https://www.childhealthdata.org/dataset. Complementary surveillance datasets (NHIS, ADDM) are publicly available from the Centers for Disease Control and Prevention: https://www.cdc.gov
Acknowledgments
The authors thank the Health Resources and Services Administration and the U.S. Census Bureau for conducting and disseminating NSCH data, and the Centers for Disease Control and Prevention for maintaining complementary surveillance systems. The interpretations and conclusions expressed in this manuscript are those of the authors and do not necessarily represent the views of these agencies.
Conflicts of Interest
The authors declare no conflict of interest.
References
- American Psychiatric Association. Diagnostic and Statistical Manual of Mental Disorders. 5th ed. Arlington, VA: American Psychiatric Association; 2013.
- Thapar, A.; Cooper, M. Attention deficit hyperactivity disorder. Lancet. 2016, 387, 1240–50. [Google Scholar] [CrossRef] [PubMed]
- Lord, C.; Elsabbagh, M.; Baird, G.; Veenstra-VanderWeele, J. Autism spectrum disorder. Lancet. 2018, 392, 508–20. [Google Scholar] [CrossRef] [PubMed]
- Global Burden of Disease Pediatrics Collaboration. Global and national burden of diseases and injuries among children and adolescents. JAMA Pediatr. 2016, 170, 267–87. [Google Scholar] [CrossRef] [PubMed]
- Health Resources and Services Administration; Maternal and Child Health Bureau. National Survey of Children’s Health (NSCH) 2018–2023 Methodology Reports. Rockville, MD: HRSA; 2019–2024.
- Zablotsky, B.; Black, L.I.; Maenner, M.J.; et al. Prevalence and trends of developmental disability in U.S. children, 2009–2017. Pediatrics. 2019, 144, e20190811. [Google Scholar] [CrossRef]
- Braveman, P.; Gottlieb, L. The social determinants of health: It’s time to consider the causes of the causes. Public Health Rep. 2014, 129 (Suppl 2), 19–31. [Google Scholar] [CrossRef]
- Shonkoff, J.P.; Garner, A.S. The lifelong effects of early childhood adversity and toxic stress. Pediatrics. 2012, 129, e232–46. [Google Scholar] [CrossRef]
- Pascoe, J.M.; Wood, D.L.; Duffee, J.H.; Kuo, A. Mediators and adverse effects of child poverty in the U.S. Pediatrics. 2016, 137, e20160340. [Google Scholar] [CrossRef]
- McLaughlin, K.A.; Sheridan, M.A.; Nelson, C.A. Biological sensitivity to context. Dev Psychopathol. 2017, 29, 1771–9. [Google Scholar]
- Danielson, M.L.; Bitsko, R.H.; Ghandour, R.M.; et al. ADHD prevalence and diagnosis patterns in U.S. children. J Clin Child Adolesc Psychol. 2018, 47, 199–212. [Google Scholar] [CrossRef]
- Caye, A.; Swanson, J.M.; Thapar, A.; et al. Life outcomes of ADHD: A systematic review. World Psychiatry. 2016, 15, 195–208. [Google Scholar]
- Kingsbury, M.; Weeks, M.; MacKinnon, N.; et al. Neighborhood influences on childhood mental health. Psychol Med. 2015, 45, 2733–47. [Google Scholar]
- Jaffee, S.R.; Christian, C.W. The biological embedding of childhood adversity. Child Dev. 2014, 85, 189–204. [Google Scholar]
- Mandell, D.S.; Novak, M.M.; Zubritsky, C.D. Factors associated with the age of autism diagnosis among minority children. Pediatrics. 2005, 116, e148–55. [Google Scholar] [CrossRef]
- Liptak, G.S.; Benzoni, L.B.; Mruzek, D.W.; et al. Disparities in the diagnosis of autism in children from minority communities. Pediatrics. 2008, 122, e120–6. [Google Scholar]
- Bitsko, R.H.; Holbrook, J.R.; Ghandour, R.M.; et al. Epidemiology and impact of ASD and ADHD among U.S. children. J Dev Behav Pediatr. 2018, 39, 732–41. [Google Scholar]
- Maenner, M.J.; Shaw, K.A.; Bakian, A.V.; et al. Prevalence of autism spectrum disorder among children aged 8 years—ADDM Network, 11 Sites, United States, 2018. MMWR Surveill Summ. 2021, 70, 1–16. [Google Scholar] [CrossRef] [PubMed]
- Sheridan, M.A.; McLaughlin, K.A. Dimensions of childhood adversity and neural development. Curr Opin Pediatr. 2014, 26, 667–73. [Google Scholar]
- Visser, S.N.; Danielson, M.L.; Bitsko, R.H.; et al. Trends in ADHD diagnosis and treatment patterns. J Am Acad Child Adolesc Psychiatry. 2014, 53, 34–46. [Google Scholar] [CrossRef]
- Archer, K.J.; Lemeshow, S. Goodness-of-fit tests for logistic regression using survey design–adjusted procedures. Stata J. 2006, 6, 97–105. [Google Scholar] [CrossRef]
- Lambert, S.F.; Brown, T.L.; Phillips, C.M.; Ialongo, N.S. Neighborhood disadvantage and child mental health trajectories. Dev Psychol. 2004, 40, 635–49. [Google Scholar]
- Kalb, L.G.; Stuart, E.A.; Freedman, B.; Zablotsky, B. Race and ASD diagnosis timing in U.S. children. Intellect Dev Disabil. 2020, 58, 328–39. [Google Scholar]
- Durkin, M.S.; Maenner, M.J.; Baio, J.; et al. Autism and developmental disabilities among children by race/ethnicity. Am J Public Health. 2017, 107, 1818–26. [Google Scholar] [CrossRef]
- McDonnell, C.G.; Bradley, C.; Zuckerman, K.; et al. Barriers to early ASD diagnosis across pediatric populations. Acad Pediatr. 2019, 19, 909–17. [Google Scholar]
Figure 1.
Predicted probability of ADHD and ASD by household income level.
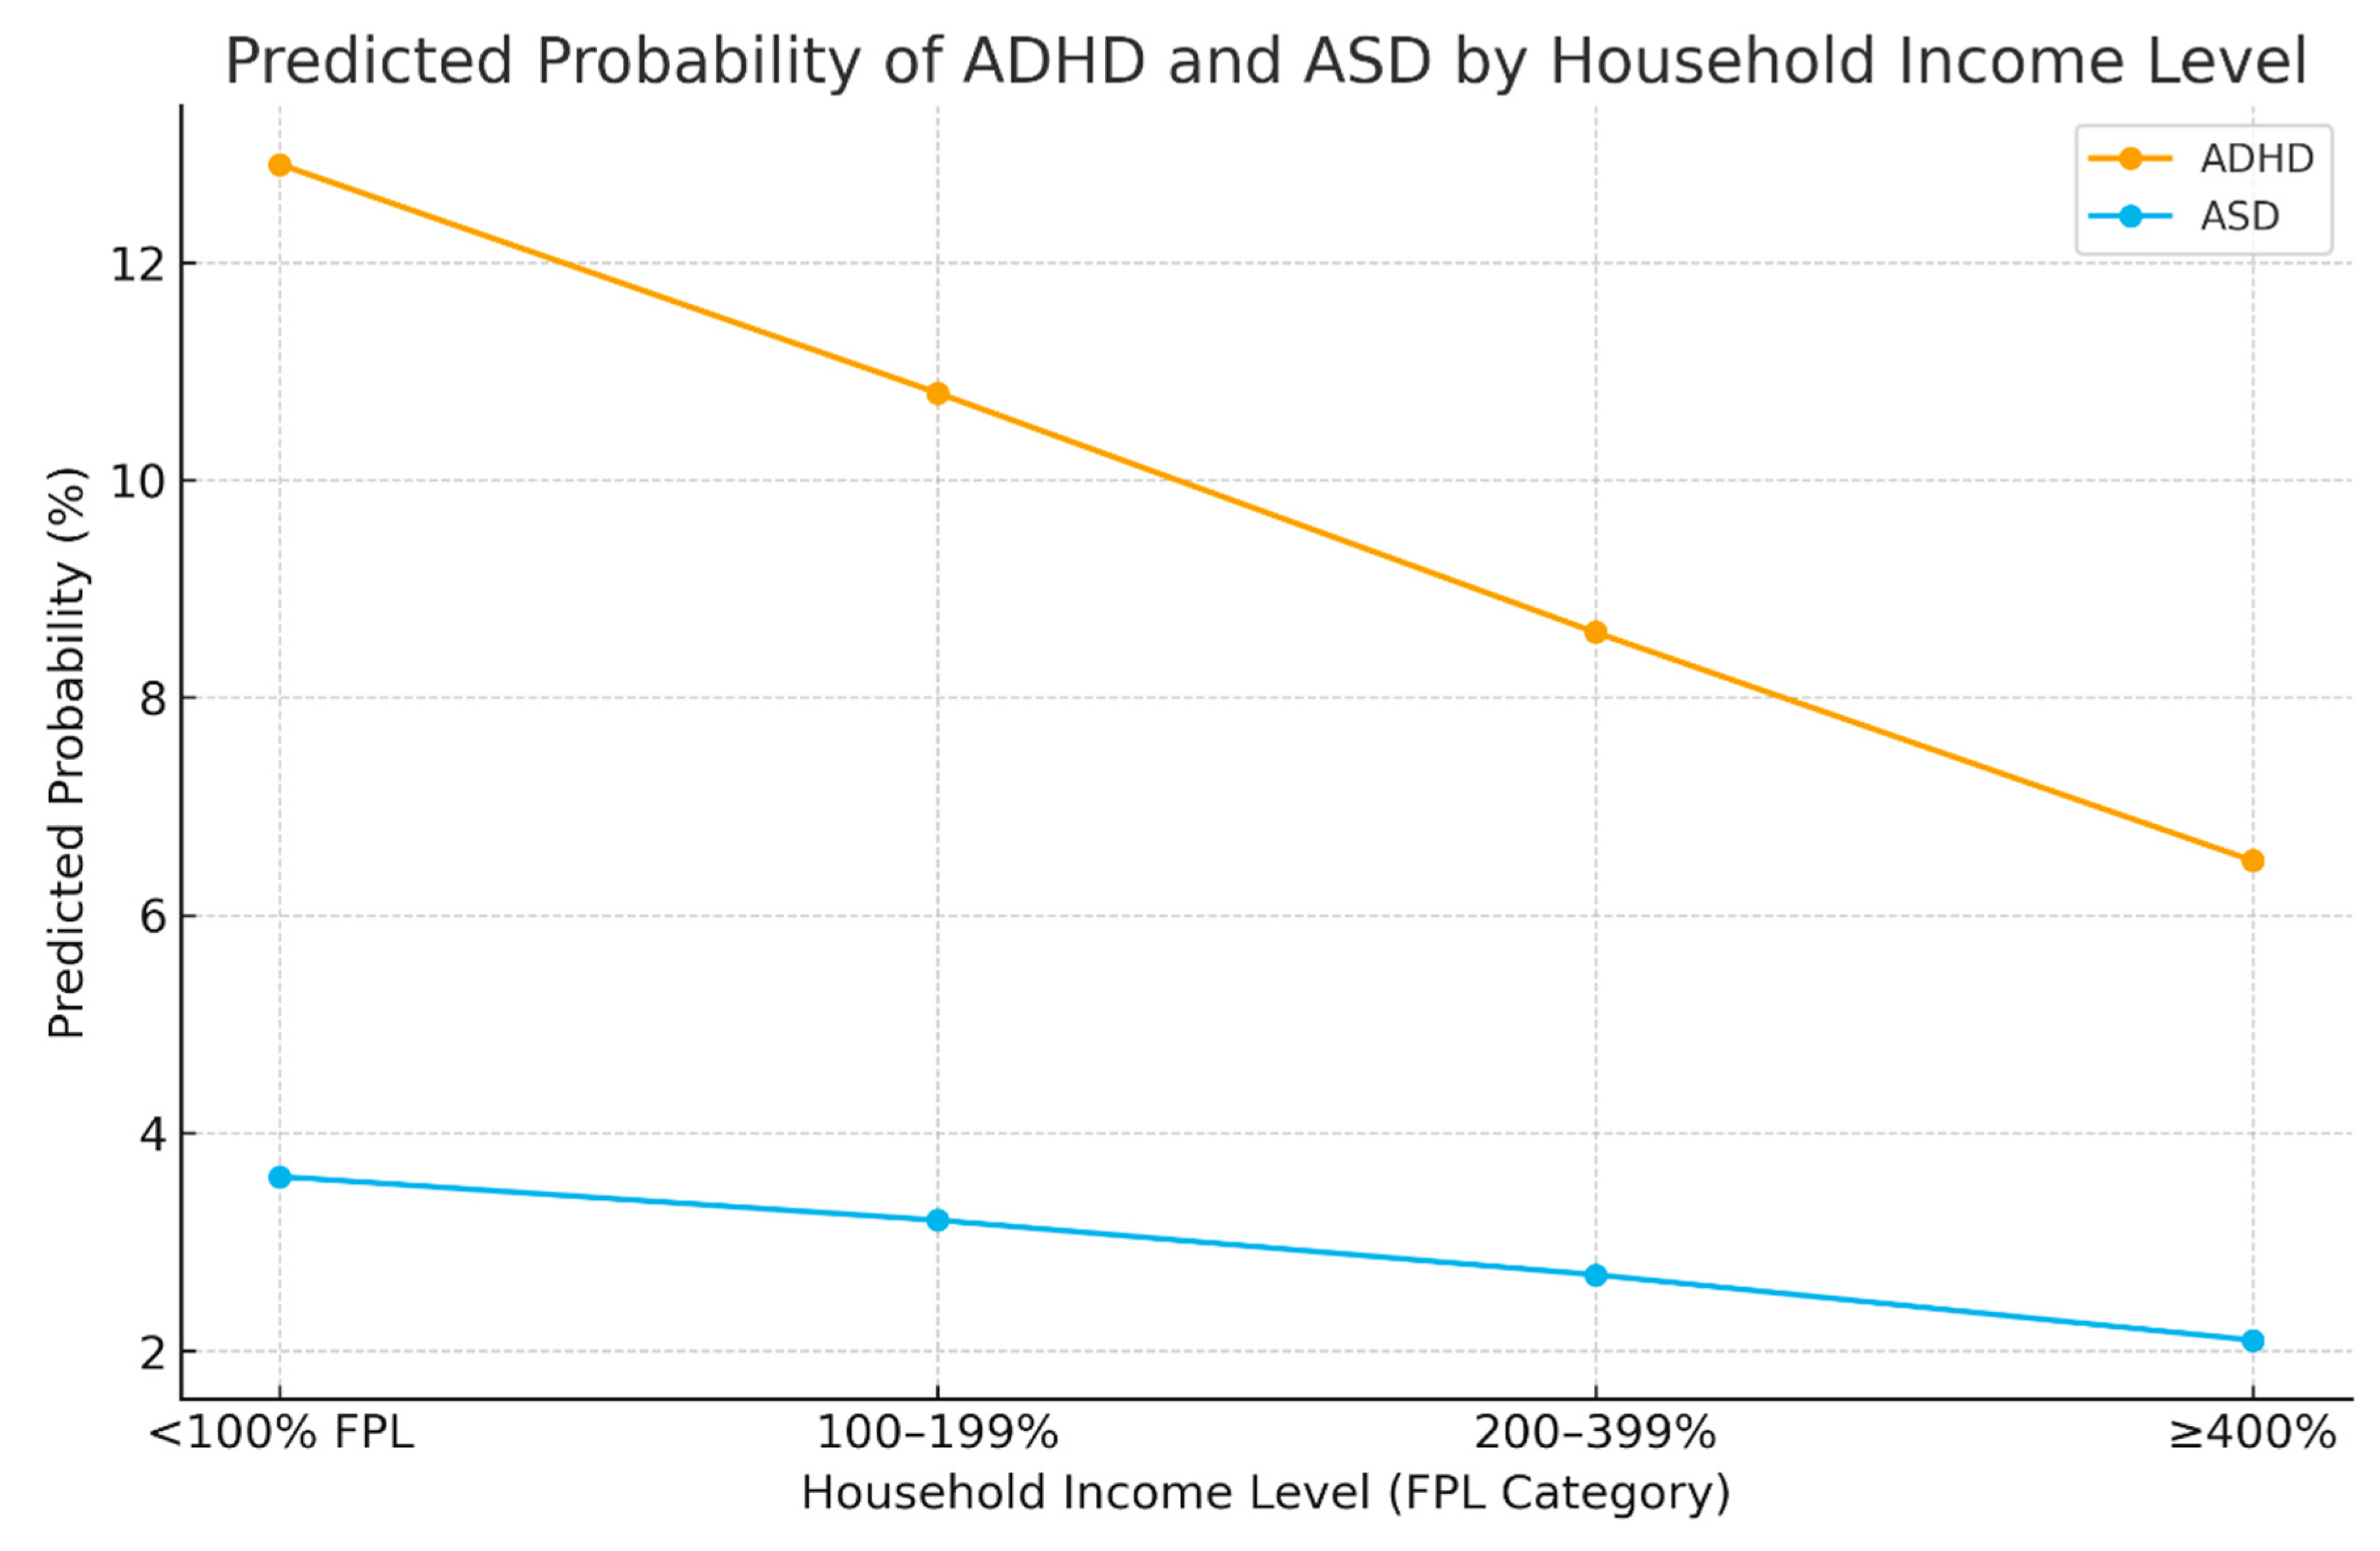
Figure 2.
Adjusted odds ratios (95% CI) for ADHD by race/ethnicity.
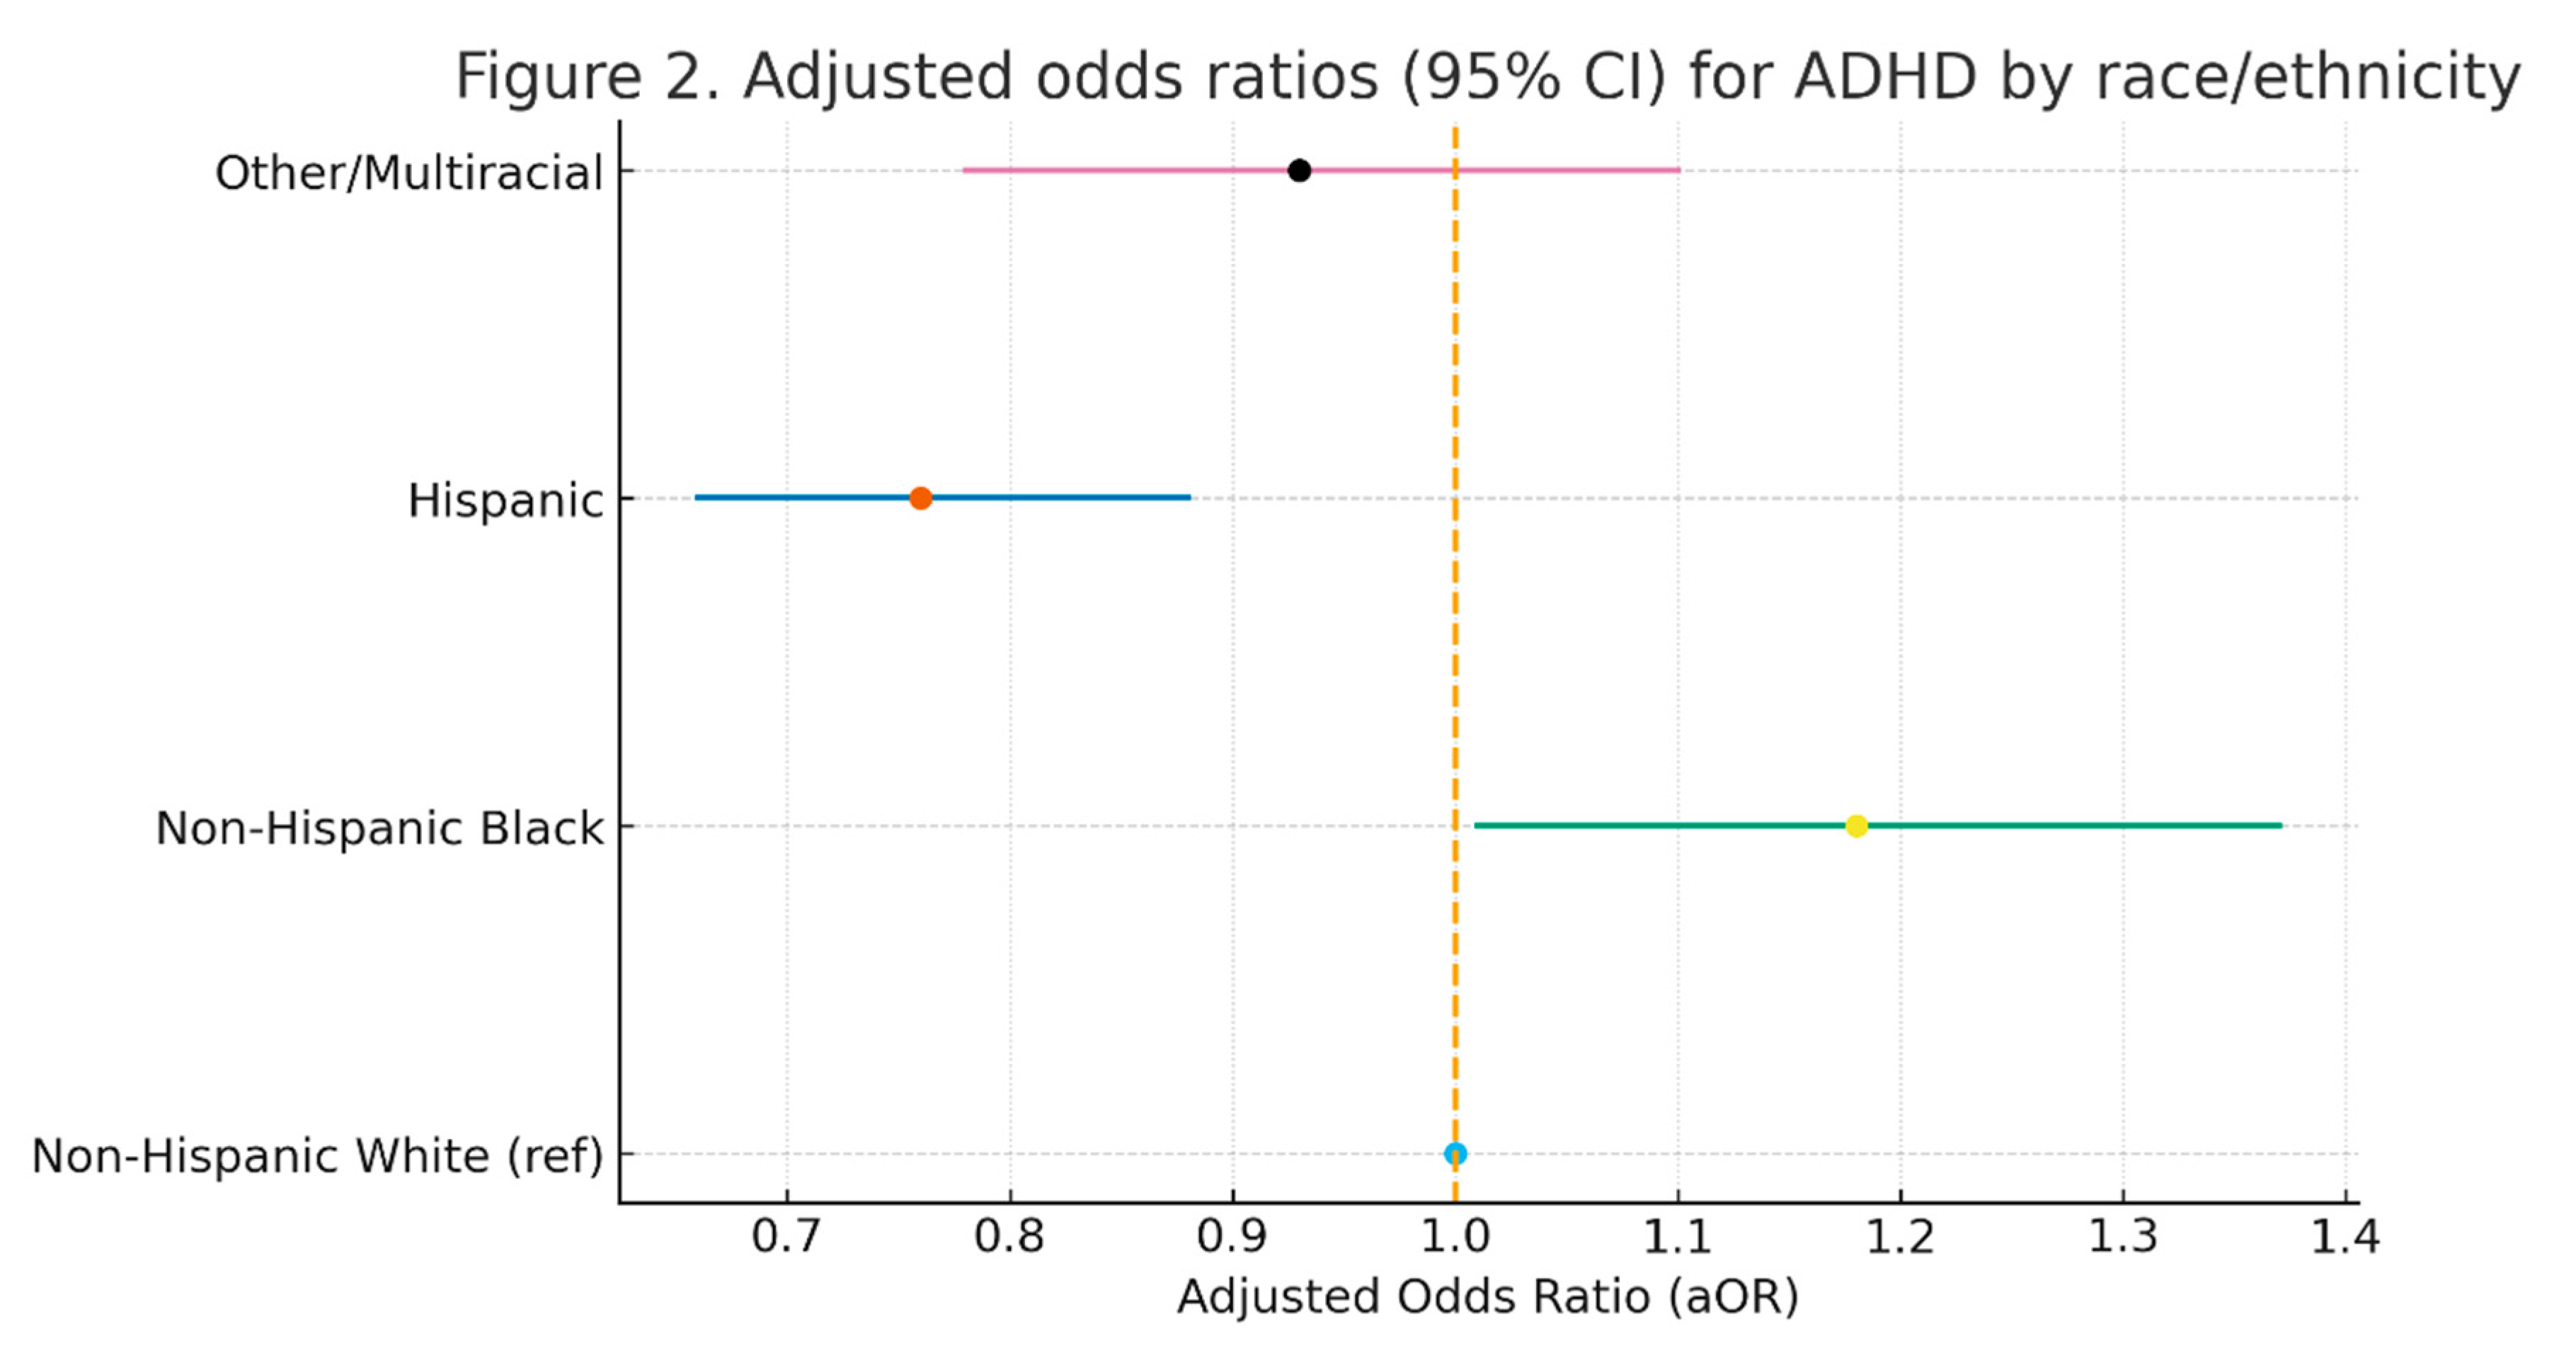

Table 1.
Weighted characteristics of U.S. children aged 3–17 years, NSCH 2018–2023.
| Characteristic | Category | Weighted % | 95% CI |
|---|---|---|---|
| Sex | Male | 51.2 | 50.4–52.0 |
| Female | 48.8 | 48.0–49.6 | |
| Race/Ethnicity | Non-Hispanic White | 50.8 | 49.6–52.0 |
| Non-Hispanic Black | 13.6 | 12.9–14.3 | |
| Hispanic | 24.1 | 23.1–25.1 | |
| Other/Multiracial | 11.5 | 10.8–12.2 | |
| Household Income (% FPL) | <100% FPL | 19.7 | 18.6–20.8 |
| 100–199% FPL | 25.4 | 24.2–26.6 | |
| 200–399% FPL | 31.8 | 30.4–33.2 | |
| ≥400% FPL | 23.1 | 22.0–24.3 | |
| Parental Education | <High school | 9.5 | 8.8–10.2 |
| High school diploma | 29.1 | 28.0–30.3 | |
| Some college | 27.6 | 26.4–28.8 | |
| Bachelor’s or higher | 33.8 | 32.4–35.2 | |
| Insurance Type | Private | 54.2 | 53.0–55.4 |
| Public | 38.5 | 37.2–39.8 | |
| Uninsured | 7.3 | 6.8–7.9 | |
| Neighborhood Safety | Definitely safe | 70.1 | 69.1–71.2 |
| Somewhat safe | 25.8 | 24.7–26.9 | |
| Not safe | 4.1 | 3.7–4.6 | |
| Food Insecurity | Yes | 10.8 | 10.1–11.6 |
| No | 89.2 | 88.4–90.0 |
Caption: Weighted demographic, socioeconomic, and neighborhood characteristics of the analytic sample (n = 205,480). All estimates incorporate NSCH complex survey weights.
Table 2.
Weighted prevalence (%) of ADHD and ASD by social determinants, NSCH 2018–2023.
| Determinant | Category | ADHD % (95% CI) | ASD % (95% CI) |
|---|---|---|---|
| Household Income (% FPL) | <100% FPL | 13.4 (12.1–14.7) | 3.8 (3.1–4.5) |
| 100–199% FPL | 10.8 (9.8–11.8) | 3.2 (2.6–3.8) | |
| 200–399% FPL | 8.6 (7.8–9.4) | 2.7 (2.3–3.1) | |
| ≥400% FPL | 6.2 (5.6–6.8) | 2.0 (1.7–2.3) | |
| Parental Education | <High school | 14.6 (12.8–16.4) | 3.9 (3.1–4.7) |
| High school diploma | 11.2 (10.1–12.3) | 3.3 (2.7–3.9) | |
| Some college | 9.0 (8.1–9.9) | 2.7 (2.3–3.1) | |
| Bachelor’s or higher | 6.8 (6.1–7.5) | 2.1 (1.8–2.4) | |
| Insurance Type | Private | 8.1 (7.5–8.7) | 2.4 (2.1–2.7) |
| Public | 13.2 (12.0–14.4) | 3.8 (3.2–4.4) | |
| Uninsured | 10.5 (8.4–12.6) | 2.6 (1.8–3.4) | |
| Neighborhood Safety | Definitely safe | 8.9 (8.3–9.5) | 2.5 (2.2–2.8) |
| Somewhat safe | 12.5 (11.3–13.7) | 3.4 (2.8–4.0) | |
| Not safe | 15.8 (13.0–18.6) | 4.4 (3.0–5.8) | |
| Food Insecurity | Yes | 14.9 (13.2–16.6) | 4.1 (3.4–4.9) |
| No | 8.8 (8.3–9.3) | 2.7 (2.4–3.0) |
Caption: Weighted prevalence of ADHD and ASD across socioeconomic and neighborhood determinants. All estimates incorporate NSCH complex survey weights.
Table 3.
Adjusted odds ratios (aORs) for ADHD and ASD by social determinants, NSCH 2018–2023.
| Determinant | Category | ADHD aOR (95% CI) | ASD aOR (95% CI) |
|---|---|---|---|
| Household Income (% FPL) | <100% FPL | 2.11 (1.82–2.46) | 1.73 (1.32–2.28) |
| 100–199% FPL | 1.69 (1.46–1.95) | 1.32 (1.04–1.67) | |
| 200–399% FPL | 1.28 (1.12–1.45) | 1.14 (0.92–1.40) | |
| ≥400% FPL (ref) | 1.00 | 1.00 | |
| Parental Education | <High school | 1.83 (1.52–2.20) | 1.46 (1.12–1.91) |
| High school diploma | 1.42 (1.26–1.60) | 1.28 (1.01–1.63) | |
| Some college | 1.21 (1.07–1.36) | 1.10 (0.88–1.37) | |
| Bachelor’s or higher (ref) | 1.00 | 1.00 | |
| Insurance Type | Public | 1.37 (1.20–1.55) | 1.21 (0.98–1.49) |
| Uninsured | 1.18 (0.95–1.47) | 1.05 (0.72–1.52) | |
| Private (ref) | 1.00 | 1.00 | |
| Neighborhood Safety | Somewhat safe | 1.31 (1.15–1.50) | 1.24 (0.97–1.59) |
| Not safe | 1.94 (1.51–2.49) | 1.79 (1.21–2.64) | |
| Definitely safe (ref) | 1.00 | 1.00 | |
| Food Insecurity | Yes | 1.88 (1.60–2.21) | 1.61 (1.18–2.19) |
| No (ref) | 1.00 | 1.00 | |
| Child Sex | Male | 2.39 (2.12–2.68) | 3.84 (3.13–4.72) |
| Female (ref) | 1.00 | 1.00 | |
| Race/Ethnicity | Non-Hispanic Black | 1.18 (1.01–1.37) | 0.64 (0.51–0.80) |
| Hispanic | 0.76 (0.66–0.88) | 0.59 (0.47–0.73) | |
| Other/Multiracial | 0.93 (0.78–1.10) | 0.82 (0.64–1.06) | |
| Non-Hispanic White (ref) | 1.00 | 1.00 |
Caption: Survey-weighted logistic regression assessing associations between social determinants and current ADHD or ASD, adjusted for age, sex, race/ethnicity, region, family structure, and survey year.
Disclaimer/Publisher’s Note: The statements, opinions and data contained in all publications are solely those of the individual author(s) and contributor(s) and not of MDPI and/or the editor(s). MDPI and/or the editor(s) disclaim responsibility for any injury to people or property resulting from any ideas, methods, instructions or products referred to in the content. |
© 2025 by the authors. Licensee MDPI, Basel, Switzerland. This article is an open access article distributed under the terms and conditions of the Creative Commons Attribution (CC BY) license (http://creativecommons.org/licenses/by/4.0/).
Copyright: This open access article is published under a Creative Commons CC BY 4.0 license, which permit the free download, distribution, and reuse, provided that the author and preprint are cited in any reuse.


