Submitted:
26 November 2025
Posted:
27 November 2025
You are already at the latest version
Abstract
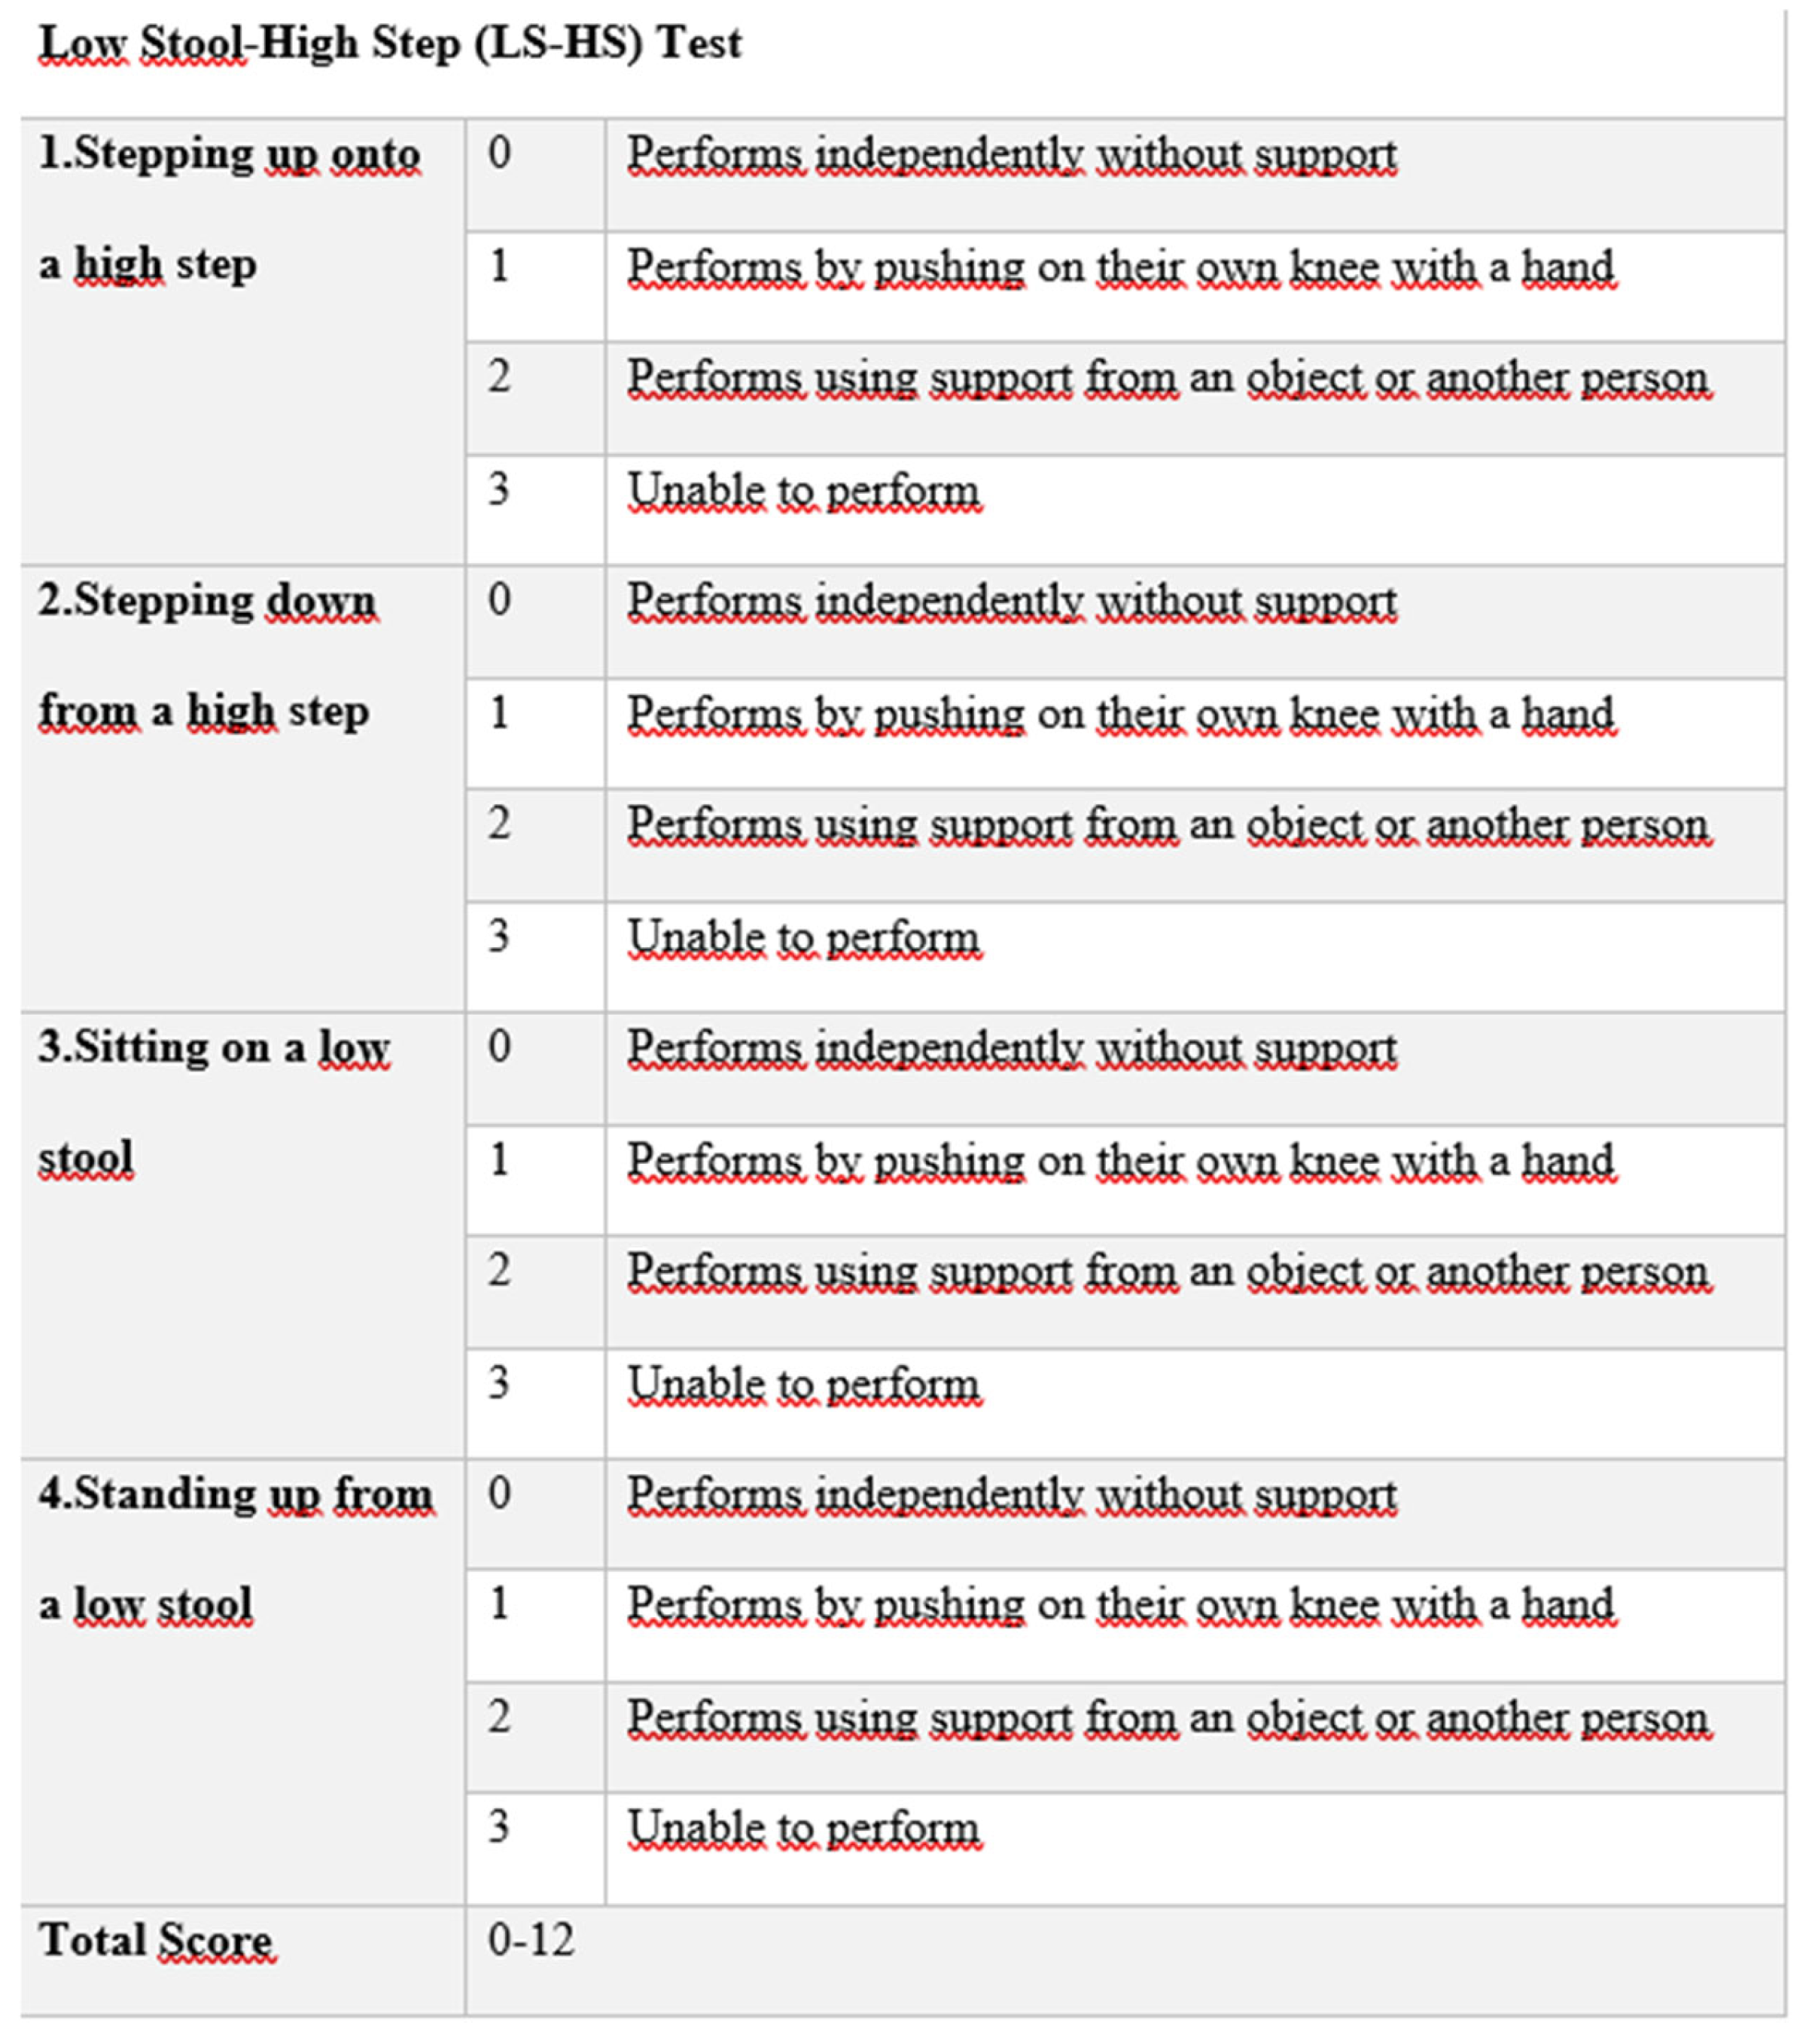
Objective: The study aimed to evaluate the validity and reliability of the newly developed Low Sit–High Step (LS-HS) Test designed to assess lower-extremity muscle strength in the diagnosis of sarcopenia. Design: The study included 205 participants divided into four groups (possible sarcopenia, sarcopenia, young control, and middle-to-older control). The LS-HS Test was compared across groups, and its ability to distinguish sarcopenia and possible sarcopenia was evaluated. Internal consistency, inter-rater and test–retest reliability, and diagnostic accuracy were assessed to determine the test’s validity and reliability. Results: LS-HS Test scores were higher in participants with possible sarcopenia and sarcopenia (p<0.05). Multinomial logistic regression analysis showed that LS-HS Test performance could predict both possible sarcopenia and sarcopenia (p<0.001). Internal consistency was excellent (Cronbach’s α = 0.938), while inter-rater and test–retest reliability were very high (ICC = 0.998), confirming its reproducibility. ROC analysis demonstrated high diagnostic accuracy in distinguishing both possible sarcopenia and sarcopenia (p<0.01, AUC=0.768, AUC=0.704). Conclusions: The LS-HS Test appears to be a valid, reliable, and practical tool for assessing lower-limb muscle strength and functional decline in the diagnosis of sarcopenia. Its simplicity and clinical applicability suggest that it may serve as a useful option for routine screening and evaluation.
Keywords:
1. Introduction
2. Materials and Methods
2.1. Design
2.2. Setting
2.3. Participants
Interventions
2.4. Measurements
2.5. Bias
2.6. Statistical Methods
2.7. Reliability Analysis
2.8. Ethics Statement
| Item No | Recommendation | |
| Title and abstract | 1-3 | (a) Indicate the study’s design with a commonly used term in the title or the abstract |
| (b) Provide in the abstract an informative and balanced summary of what was done and what was found | ||
| Introduction | ||
| Background/rationale | 4-5 | Explain the scientific background and rationale for the investigation being reported |
| Objectives | 5 | State specific objectives, including any prespecified hypotheses |
| Methods | ||
| Study design | 6 | Present key elements of study design early in the paper |
| Setting | 6 | Describe the setting, locations, and relevant dates, including periods of recruitment, exposure, follow-up, and data collection |
| Participants | 6 | (a) Cohort study—Give the eligibility criteria, and the sources and methods of selection of participants. Describe methods of follow-up Case-control study—Give the eligibility criteria, and the sources and methods of case ascertainment and control selection. Give the rationale for the choice of cases and controls Cross-sectional study—Give the eligibility criteria, and the sources and methods of selection of participants |
| (b) Cohort study—For matched studies, give matching criteria and number of exposed and unexposed Case-control study—For matched studies, give matching criteria and the number of controls per case | ||
| Variables | 6-8 | Clearly define all outcomes, exposures, predictors, potential confounders, and effect modifiers. Give diagnostic criteria, if applicable |
| Data sources/ measurement | 6-8 | For each variable of interest, give sources of data and details of methods of assessment (measurement). Describe comparability of assessment methods if there is more than one group |
| Bias | 9 | Describe any efforts to address potential sources of bias |
| Study size | 9 | Explain how the study size was arrived at |
| Quantitative variables | 9 | Explain how quantitative variables were handled in the analyses. If applicable, describe which groupings were chosen and why |
| Statistical methods | 9-10 | (a) Describe all statistical methods, including those used to control for confounding |
| (b) Describe any methods used to examine subgroups and interactions | ||
| (c) Explain how missing data were addressed | ||
| (d) Cohort study—If applicable, explain how loss to follow-up was addressed Case-control study—If applicable, explain how matching of cases and controls was addressed Cross-sectional study—If applicable, describe analytical methods taking account of sampling strategy | ||
| (e) Describe any sensitivity analyses | ||
| Results | ||
| Participants | 11 | (a) Report numbers of individuals at each stage of study—eg numbers potentially eligible, examined for eligibility, confirmed eligible, included in the study, completing follow-up, and analysed |
| (b) Give reasons for non-participation at each stage | ||
| (c) Consider use of a flow diagram | ||
| Descriptive data | 11 | (a) Give characteristics of study participants (eg demographic, clinical, social) and information on exposures and potential confounders |
| (b) Indicate number of participants with missing data for each variable of interest | ||
| (c) Cohort study—Summarise follow-up time (eg, average and total amount) | ||
| Outcome data | 11-13 | Cohort study—Report numbers of outcome events or summary measures over time |
| Case-control study—Report numbers in each exposure category, or summary measures of exposure | ||
| Cross-sectional study—Report numbers of outcome events or summary measures | ||
| Main results | 13-14 | (a) Give unadjusted estimates and, if applicable, confounder-adjusted estimates and their precision (eg, 95% confidence interval). Make clear which confounders were adjusted for and why they were included |
| (b) Report category boundaries when continuous variables were categorized | ||
| (c) If relevant, consider translating estimates of relative risk into absolute risk for a meaningful time period | ||
| Other analyses | 14 | Report other analyses done—eg analyses of subgroups and interactions, and sensitivity analyses |
| Discussion | ||
| Key results | 14 | Summarise key results with reference to study objectives |
| Limitations | 19 | Discuss limitations of the study, taking into account sources of potential bias or imprecision. Discuss both direction and magnitude of any potential bias |
| Interpretation | 15-19 | Give a cautious overall interpretation of results considering objectives, limitations, multiplicity of analyses, results from similar studies, and other relevant evidence |
| Generalisability | 19 | Discuss the generalisability (external validity) of the study results |
| Other information | ||
| Funding | 19 | Give the source of funding and the role of the funders for the present study and, if applicable, for the original study on which the present article is based |
| * Give information separately for cases and controls in case-control studies and, if applicable, for exposed and unexposed groups in cohort and cross-sectional studies. Note: An Explanation and Elaboration article discusses each checklist item and gives methodological background and published examples of transparent reporting. The STROBE checklist is best used in conjunction with this article (freely available on the Web sites of PLoS Medicine at http://www.plosmedicine.org/, Annals of Internal Medicine at http://www.annals.org/, and Epidemiology at http://www.epidem.com/). Information on the STROBE Initiative is available at www.strobe-statement.org. | ||
3. Results
3.1. Reliability Analysis
3.2. Validity Analysis

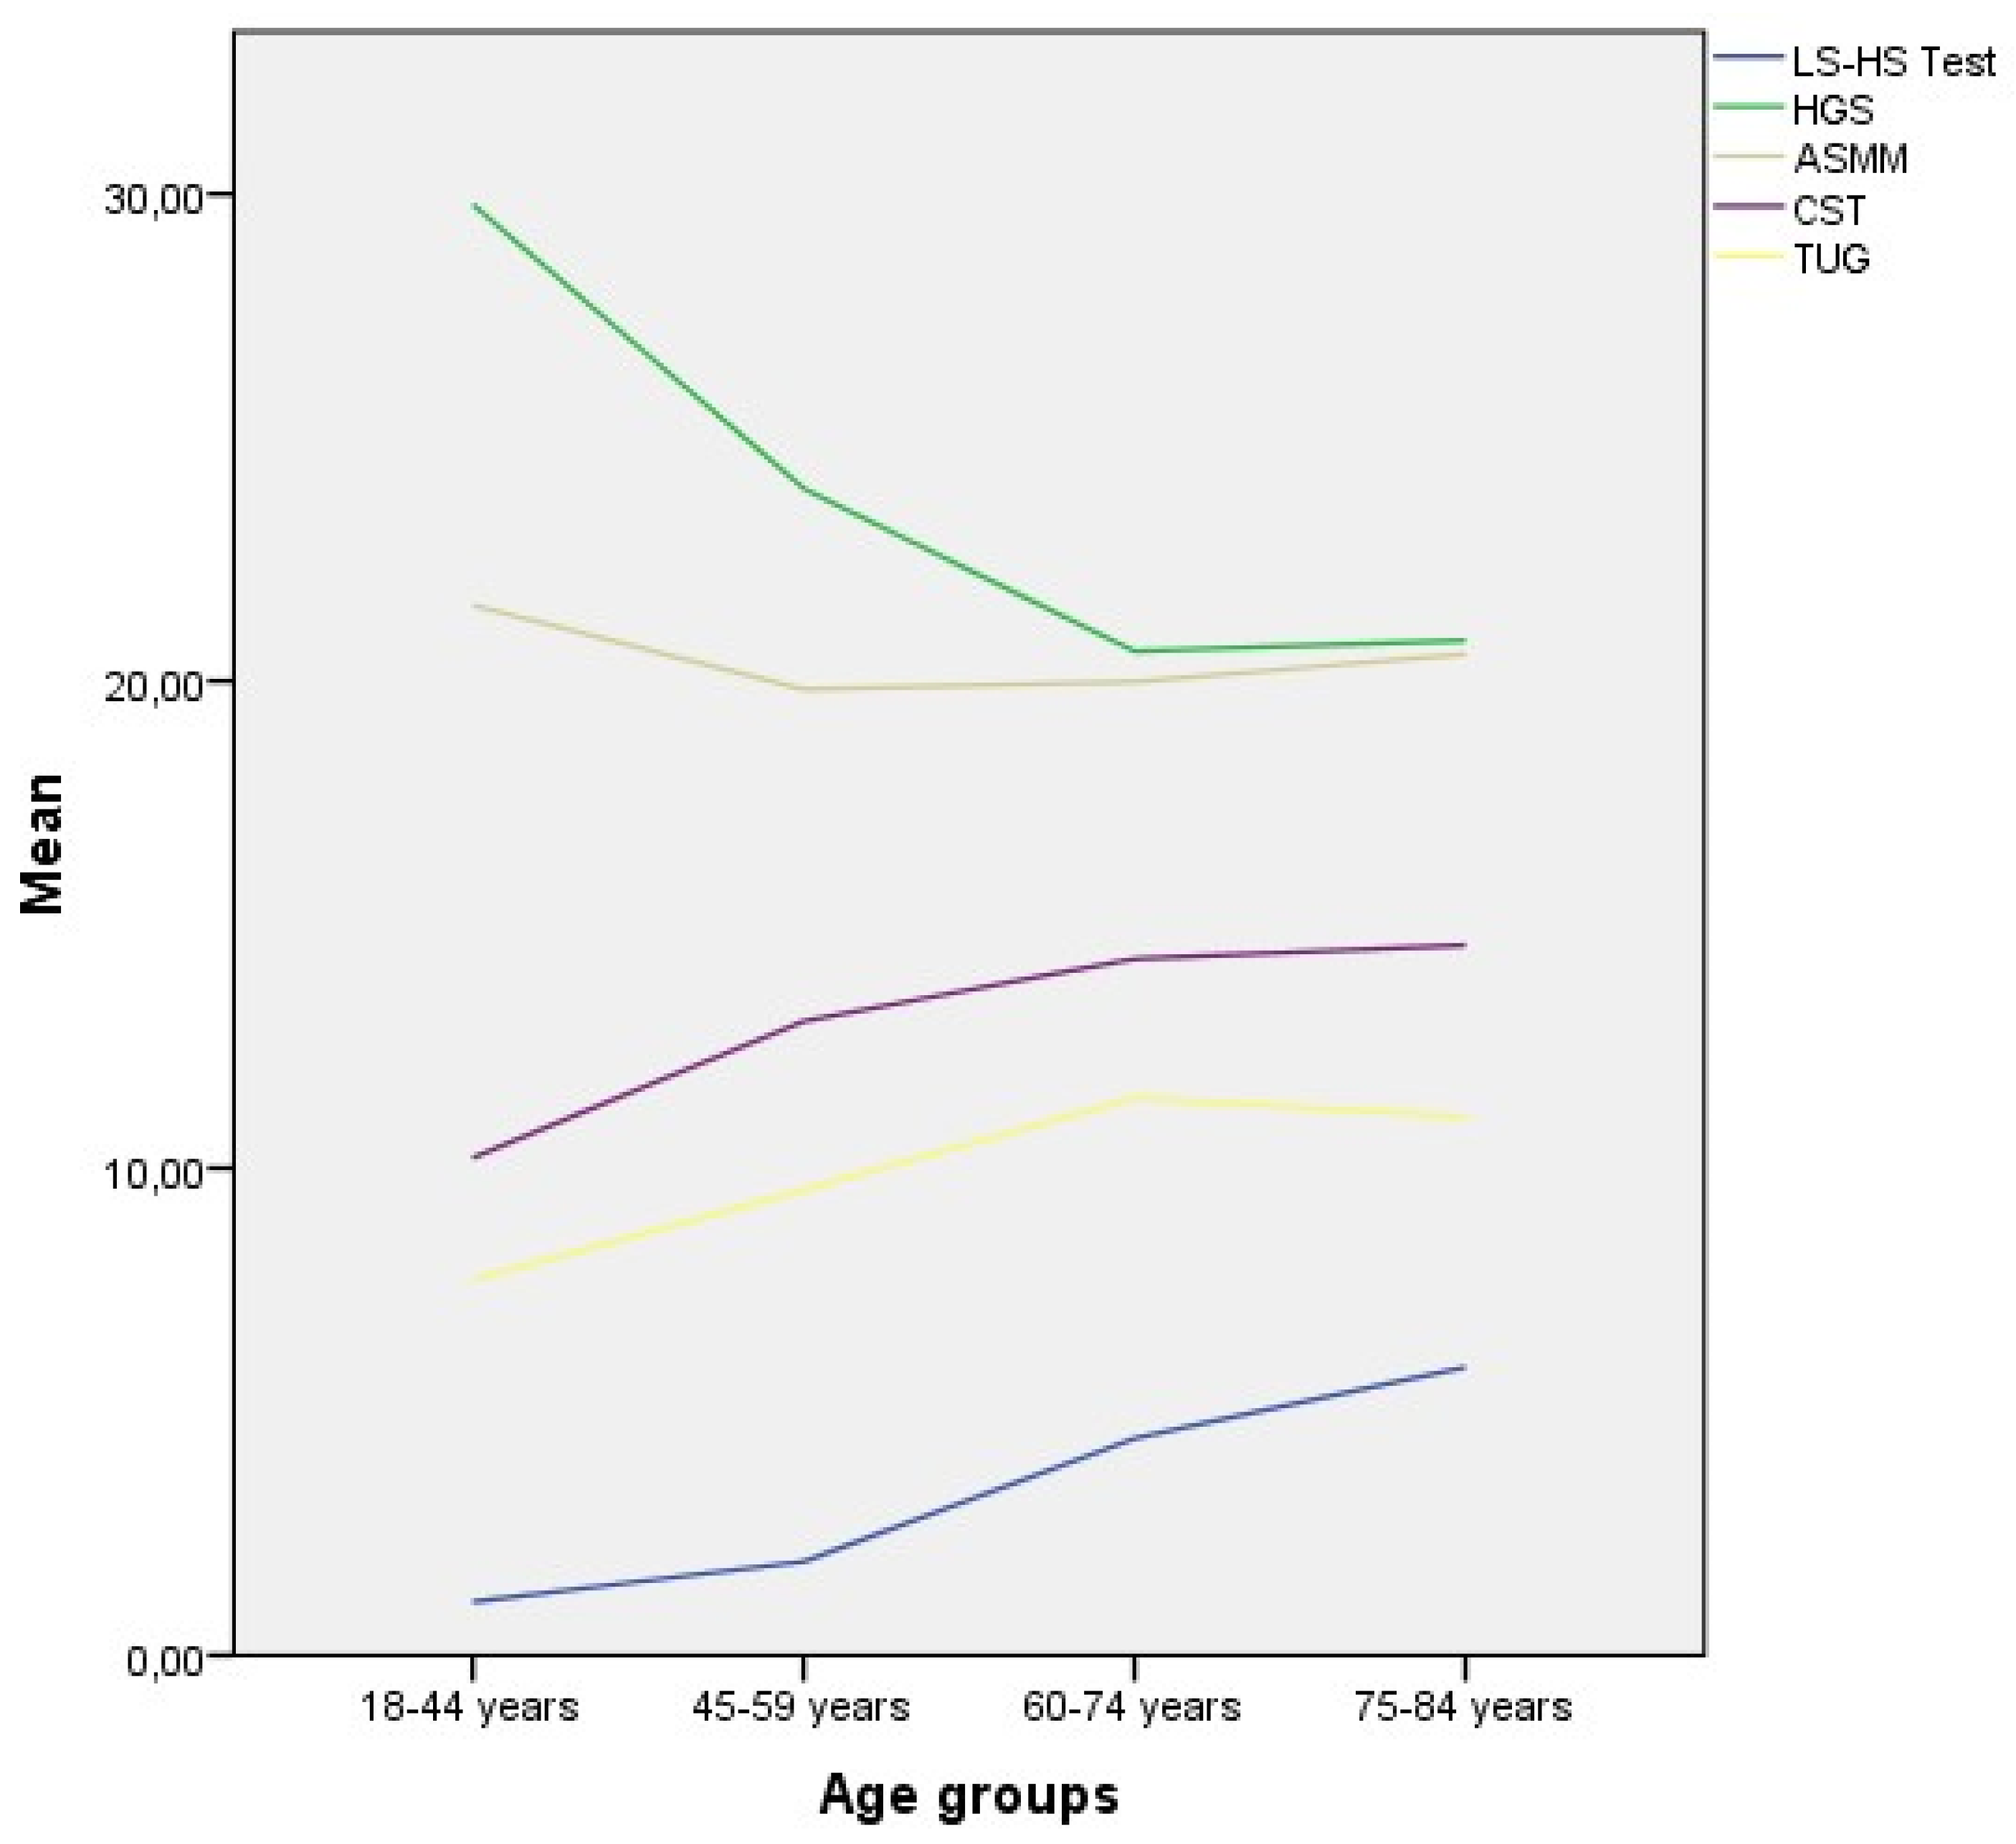
| Variables | Age | BMI | HGS | ASMM | Gait Speed | CST | TUG |
|---|---|---|---|---|---|---|---|
| LS-HS Test | r = 0.464** p < 0.001 |
r = 0.226** p < 0.001 |
r = −0.583** p < 0.001 |
r = −0.259** p < 0.001 |
r = −0.566** p < 0.001 |
r = 0.548** p < 0.001 |
r = 0.596** p < 0.001 |
| Age | — | r = 0.020 p = 0.774 |
r = −0.368** p < 0.001 |
r = −0.074 p = 0.294 |
r = −0.389** p < 0.001 |
r = 0.327** p < 0.001 |
r = 0.439** p < 0.001 |
| BMI | — | — | r = −0.001 p = 0.993 |
r = 0.316** p < 0.001 |
r = −0.150* p = 0.032 |
r = 0.080 p = 0.254 |
r = 0.094 p = 0.180 |
| HGS | — | — | — | r = 0.610** p < 0.001 |
r = 0.400** p < 0.001 |
r = −0.432** p < 0.001 |
r = −0.521** p < 0.001 |
| ASMM | — | — | — | — | r = 0.173* p = 0.013 |
r = −0.159* p = 0.023 |
r = −0.242** p < 0.001 |
| Gait Speed | — | — | — | — | — | r = −0.484** p < 0.001 |
r = −0.706** p < 0.001 |
| CST | — | — | — | — | — | — | r = 0.617** p < 0.001 |
| Estimate (B) | SE | β | t | p | 95% CI | Collinearity Statistics | |||
|---|---|---|---|---|---|---|---|---|---|
| Lower | Upper | Tolerance | VIF | ||||||
| Intercept | -5.977 | 1.621 | 0.001* | -9.173 | -2.781 | ||||
| Age | 0.042 | 0.014 | 0.164 | -3.688 | 0.004* | 0.014 | 0.070 | 0.780 | 1.282 |
| BMI | 0.145 | 0.041 | 0.176 | 2.945 | 0.001* | 0.065 | 0.225 | 0.993 | 1.007 |
| HGS | -0.095 | 0.023 | -0.235 | 3.581 | 0.001* | -0.141 | -.0049 | 0.728 | 1.374 |
| CST | 0.141 | 0.048 | 0.181 | -4.077 | 0.004* | 0.047 | 0.235 | 0.638 | 1.568 |
| TUG | 0.302 | 0.059 | 0.325 | 2.947 | 0.001* | 0.186 | 0.418 | 0.598 | 1.671 |
| Possible Sarcopenia | Sarcopenia | Severe Sarcopenia | |||||||
|---|---|---|---|---|---|---|---|---|---|
| Cut-off | Se | Sp | J | Se | Sp | J | Se | Sp | J |
| -1.0 | 1.00 | 0.00 | 0.00 | 1.00 | 0.00 | 0.00 | 1.00 | 0.00 | 0.00 |
| 0.5 | 0.84 | 0.49 | 0.33 | 0.79 | 0.43 | 0.22 | 0.88 | 0.43 | 0.31 |
| 1.5 | 0.82 | 0.59 | 0.41 | 0.79 | 0.51 | 0.31 | 0.88 | 0.51 | 0.39 |
| 2.5 | 0.77 | 0.72 | 0.49 | 0.79 | 0.64 | 0.43 | 0.88 | 0.63 | 0.51 |
| 3.5 | 0.68 | 0.79 | 0.44 | 0.67 | 0.68 | 0.35 | 0.77 | 0.68 | 0.44 |
| 4.5 | 0.61 | 0.85 | 0.45 | 0.67 | 0.77 | 0.44 | 0.77 | 0.77 | 0.53 |
| 5.5 | 0.59 | 0.87 | 0.46 | 0.66 | 0.80 | 0.42 | 0.77 | 0.79 | 0.56 |
| 6.5 | 0.41 | 0.89 | 0.30 | 0.38 | 0.83 | 0.20 | 0.41 | 0.82 | 0.24 |
| 7.5 | 0.36 | 0.89 | 0.25 | 0.33 | 0.85 | 0.18 | 0.35 | 0.84 | 0.19 |
| 8.5 | 0.21 | 0.94 | 0.15 | 0.21 | 0.91 | 0.12 | 0.24 | 0.91 | 0.15 |
| 9.5 | 0.20 | 0.95 | 0.14 | 0.17 | 0.92 | 0.08 | 0.18 | 0.92 | 0.09 |
| 11.0 | 0.09 | 0.99 | 0.08 | 0.04 | 0.97 | 0.01 | 0.00 | 0.97 | -0.03 |
| 13.0 | 0.00 | 1.00 | 0.00 | 0.00 | 1.00 | 0.00 | 0.00 | 1.00 | 0.00 |
|
Healthy (82) |
Possible sarcopenia (38) |
Sarcopenia (85) |
p | |
|---|---|---|---|---|
| Age | 51 (36-62) a |
58 (51-63) b |
64 (57-71) c |
0.001* |
| BMI | 26.32 (23.59-28.9) ac |
29.3 (26.5-33.33) b |
28.3 (25-31.24) ac |
0.001* |
| HGS | 28 (22-35) a |
23 (20-27) b |
18 (15-20) c |
0.001* |
| ASMM | 21.2 (17.5-24.3) ab |
20.1 (18.2-22.4) ab |
18.2 (16.5-20.3) c |
0.001* |
| Gait Speed | 0.94 (0.82-1.07) a |
0.8 (0.67-0.92) b |
0.68 (0.56-0.82) c |
0.001* |
| CST | 10 (8.33-12) a |
12.03 (10.73-13.98) b |
15.3 (12-18) c |
0.001* |
| TUG | 8 (6.84-9) ab |
8.39 (7.62-9.54) ab |
11.06 (9.4-14.28) c |
0.001* |
4. Discussion
Authors Contributions
Funding
Institutional Review Board Statement
Informed Consent Statement
Data Availability Statement
Conflicts of Interest
Abbreviations
| HGS | Hand Grip Strength |
| ASMM | Appendicular Skeletal Muscle Mass |
| CST | Chair Stand Test |
| TUG | Timed Up and Go Test |
| LS-HS Test | Low Stool-High Step Test |
References
- Kirk B, Cawthon PM, Arai H, et al. The conceptual definition of sarcopenia: Delphi consensus from the Global Leadership Initiative in Sarcopenia (GLIS). Age Ageing. 2024;53(3). [CrossRef]
- Cruz-Jentoft AJ, Bahat G, Bauer J, et al. Sarcopenia: revised European consensus on definition and diagnosis. Age Ageing. 2019;48(1):16–31. [CrossRef]
- Chen LK, Woo J, Assantachai P, et al. Asian Working Group for Sarcopenia: 2019 consensus update on sarcopenia diagnosis and treatment. J Am Med Dir Assoc. 2020;21(3):300–307.e2. [CrossRef]
- Samuel D, Rowe P. An investigation of the association between grip strength and hip and knee joint moments in older adults. Arch Gerontol Geriatr. 2011;54(2):357–360. [CrossRef]
- Xiao Q, Jiang J, Chen Y, et al. Innovative equipment for lower limb muscle strength measurement: design and application in sarcopenia screening. Clin Biomech (Bristol). 2025;122:106418. [CrossRef]
- Samuel D, Wilson K, Martin HJ, et al. Age-associated changes in hand grip and quadriceps muscle strength ratios in healthy adults. Aging Clin Exp Res. 2012;24(3):245–250 . [CrossRef]
- Bohannon RW. Dynamometer measurements of grip and knee extension strength: are they indicative of overall limb and trunk muscle strength? Percept Mot Skills. 2009;108(2):339–342. [CrossRef]
- Tatangelo T, Muollo V, Ghiotto L, et al. Exploring the association between handgrip, lower limb muscle strength, and physical function in older adults: a narrative review. Exp Gerontol. 2022;167:111902. [CrossRef]
- Nyberg LA, Hellenius ML, Kowalski J, et al. Repeatability and validity of a standardized maximal step-up test for leg function: a diagnostic accuracy study. BMC Musculoskelet Disord. 2011;12:191. [CrossRef]
- Cohen J. Statistical Power Analysis for the Behavioral Sciences. 2nd ed. Hillsdale, NJ: Lawrence Erlbaum Associates; 1998.
- von Elm E, Altman DG, Egger M, et al. The Strengthening the Reporting of Observational Studies in Epidemiology (STROBE) statement: guidelines for reporting observational studies. J Clin Epidemiol. 2008;61(4):344–349. [CrossRef]
- Coelho-Junior HJ, Alvarez-Bustos A, Landi F, et al. Why are we not exploring the potential of lower limb muscle power to identify people with sarcopenia? Ageing Res Rev. 2025;104:102662. [CrossRef]
- Coelho-Junior HJ, Calvani R, Picca A, et al. Are sit-to-stand and isometric handgrip tests comparable assessment tools to identify dynapenia in sarcopenic people? Arch Gerontol Geriatr. 2023;114:105059. [CrossRef]
- Lauretani F, Russo CR, Bandinelli S, et al. Age-associated changes in skeletal muscles and their effect on mobility: an operational diagnosis of sarcopenia. J Appl Physiol (1985). 2003;95(5):1851–1860. [CrossRef]
- Bhasin S, Travison TG, Manini TM, et al. Sarcopenia definition: the position statements of the Sarcopenia Definition and Outcomes Consortium. J Am Geriatr Soc. 2020;68(7):1410–1418. [CrossRef]
- Voulgaridou G, Tyrovolas S, Detopoulou P, et al. Diagnostic criteria and measurement techniques of sarcopenia: a critical evaluation of the up-to-date evidence. Nutrients. 2024;16(3). [CrossRef]
- Macaluso A, De Vito G. Muscle strength, power and adaptations to resistance training in older people. Eur J Appl Physiol. 2004;91(4):450–472. [CrossRef]
- Martien S, Delecluse C, Boen F, et al. Is knee extension strength a better predictor of functional performance than handgrip strength among older adults in three different settings? Arch Gerontol Geriatr. 2015;60(2):252–258. [CrossRef]
- Park TS, Shin MJ. Comprehensive assessment of lower limb function and muscle strength in sarcopenia: insights from the sit-to-stand test. Ann Geriatr Med Res. 2024;28(1):1–8. [CrossRef]
- Porto JM, Peres-Ueno MJ, de Matos Brunelli Braghin R, et al. Diagnostic accuracy of the five times stand-to-sit test for the screening of global muscle weakness in community-dwelling older women. Exp Gerontol. 2023;171:112027. [CrossRef]
- Yee XS, Ng YS, Allen JC, et al. Performance on sit-to-stand tests in relation to measures of functional fitness and sarcopenia diagnosis in community-dwelling older adults. Eur Rev Aging Phys Act. 2021;18(1):1. [CrossRef]
- Harris-Love MO, Benson K, Leasure E, et al. The influence of upper and lower extremity strength on performance-based sarcopenia assessment tests. J Funct Morphol Kinesiol. 2018;3(4). [CrossRef]
- Sayer AA, Cruz-Jentoft A. Sarcopenia definition, diagnosis and treatment: consensus is growing. Age Ageing. 2022;51(10). [CrossRef]
- Beaudart C, Zaaria M, Pasleau F, et al. Health outcomes of sarcopenia: a systematic review and meta-analysis. PLoS One. 2017;12(1):e0169548. [CrossRef]
|
n (%) 205 (100%) |
Mean (SD) | Median (Q1-Q3) | ||
| Age | 56.21 (14.00) | 59 (49-66) |
||
| Sex | Female | 151 (73.7%) | ||
| Male | 54 (26.3%) | |||
| BMI | 27.77 (4.34) | 27.60 (24,4-30,76) | ||
| HGS | 23.53 (8.83) | 22 (18-28) | ||
| ASMM | 20.28 (4.20) | 19.60 (17.2-22.6) | ||
| Gait Speed | 0.83 (0.26) | 0.80 (0.67-0.96) | ||
| CST | 13.09 (4.60) | 12.00 (10.00-15.35) | ||
| TUG | 10.07 (3.84) | 9.00 (7.69-11.04) | ||
| LS-HS Test | 3.05 (3.57) | 2 (0-6) | ||
| Sarcopenia | None | 149 (72.7%) | ||
| Possible sarcopenia | 33 (16.1%) | |||
| Sarcopenia | 7 (3.4%) | |||
| Severe Sarcopenia | 16 (7.8%) | |||
| Control Group 1 | Control Group 2 | Possible sarcopenia Group | Sarcopenia Group | p | ε² | ||
|
Median (Q1-Q3) |
Median (Q1-Q3) |
Median (Q1-Q3) |
Median (Q1-Q3) |
||||
| n | 27 | 122 | 33 | 23 | |||
| Age | 32 (25-35) a |
58 (50-65) bd |
66 (62-72) cd |
62 (57-73) bcd |
0.001* | 0.4185 | |
|
Sex n (%) |
Female | 18 (67%) | 91(75%) | 23(69.7%) | 19(.682%) | 0.538 | |
| Male | 9 (33%) | 31(25%) | 10 (30.3%) | 4 (17.4%) | |||
| BMI | 26.56 (23.38-29.3) abcd |
28.39 (25.22-30.9) abc |
28.3 (26.49-31.22) abc |
24.4 (23.05-26.22) ad |
0.001* | 0.0777 | |
| HGS | 28 (21-37) ab |
23 (20-30) ab |
15 (14-19) cd |
14 (11-15) cd |
0.001* | 0.4606 | |
| ASMM | 20.2 (17.5-23) abc |
20 (17.5-23) abc |
19.8 (18.2-22.7) abc |
14.8 (14.4-15) d |
0.001* | 0.2048 | |
| Gait Speed | 0.9 (0.87-1.14) a |
0.82 (0.68-1) bd |
0.67 (0.57-0.8) cd |
0.74 (0.53-0.89) bcd |
0.001* | 0.1573 | |
| CST | 9.61 (8-11.06) a |
11.91 (9.57-14) b |
15.82 (12.13-20.50) cd |
15 (12.26-19) cd |
0.001* | 0.2363 | |
| TUG | 7.96 (6.8-8.5) a |
8.72 (7.49-10.16) b |
11.03 (9.54-14.10) cd |
11.40 (9.76-19) cd |
0.001* | 0.2481 | |
| LS-HS Test | 0 (0-0) a |
1 (0-4) b |
6 (2-8) cd |
6 (3-8) cd |
0.001* | 0.2402 | |
| Predictor | B | SE | Wald | p | Exp(B) | 95% CI Lower | 95% CI Upper |
|---|---|---|---|---|---|---|---|
| Category=2 (Sarcopenia Group). Referans=0 (Healty Control) | |||||||
| İntercept | -5.19 | 2.319 | 5.009 | 0.025* | |||
| Age | 0.067 | 0.024 | 7.775 | 0.005** | 1.069 | 1.02 | 1.121 |
| BMI | -0.024 | 0.055 | 0.183 | 0.669 | 0.977 | 0.877 | 1.088 |
| LS-HS Test | 0.242 | 0.073 | 11.009 | 0.001** | 1.274 | 1.104 | 1.471 |
| Sex (1=Female) | -0.792 | 0.551 | 2.065 | 0.151 | 0.453 | 0.154 | 1.334 |
| Category=1 (Possible Sarcopenia Group). Referans=0 (ControlGroup) | |||||||
| Intercept | 1.03 | 2.388 | 0.186 | 0.666 | |||
| Age | 0.044 | 0.025 | 3.15 | 0.076 | 1.045 | 0.995 | 1.097 |
| BMI | -0.24 | 0.071 | 11.386 | 0.001** | 0.787 | 0.685 | 0.904 |
| LS-HS Test | 0.308 | 0.084 | 13.46 | 0.001** | 1.36 | 1.154 | 1.603 |
| Sex (1=Female) | -0.315 | 0.71 | 0.197 | 0.657 | 0.73 | 0.182 | 2.931 |
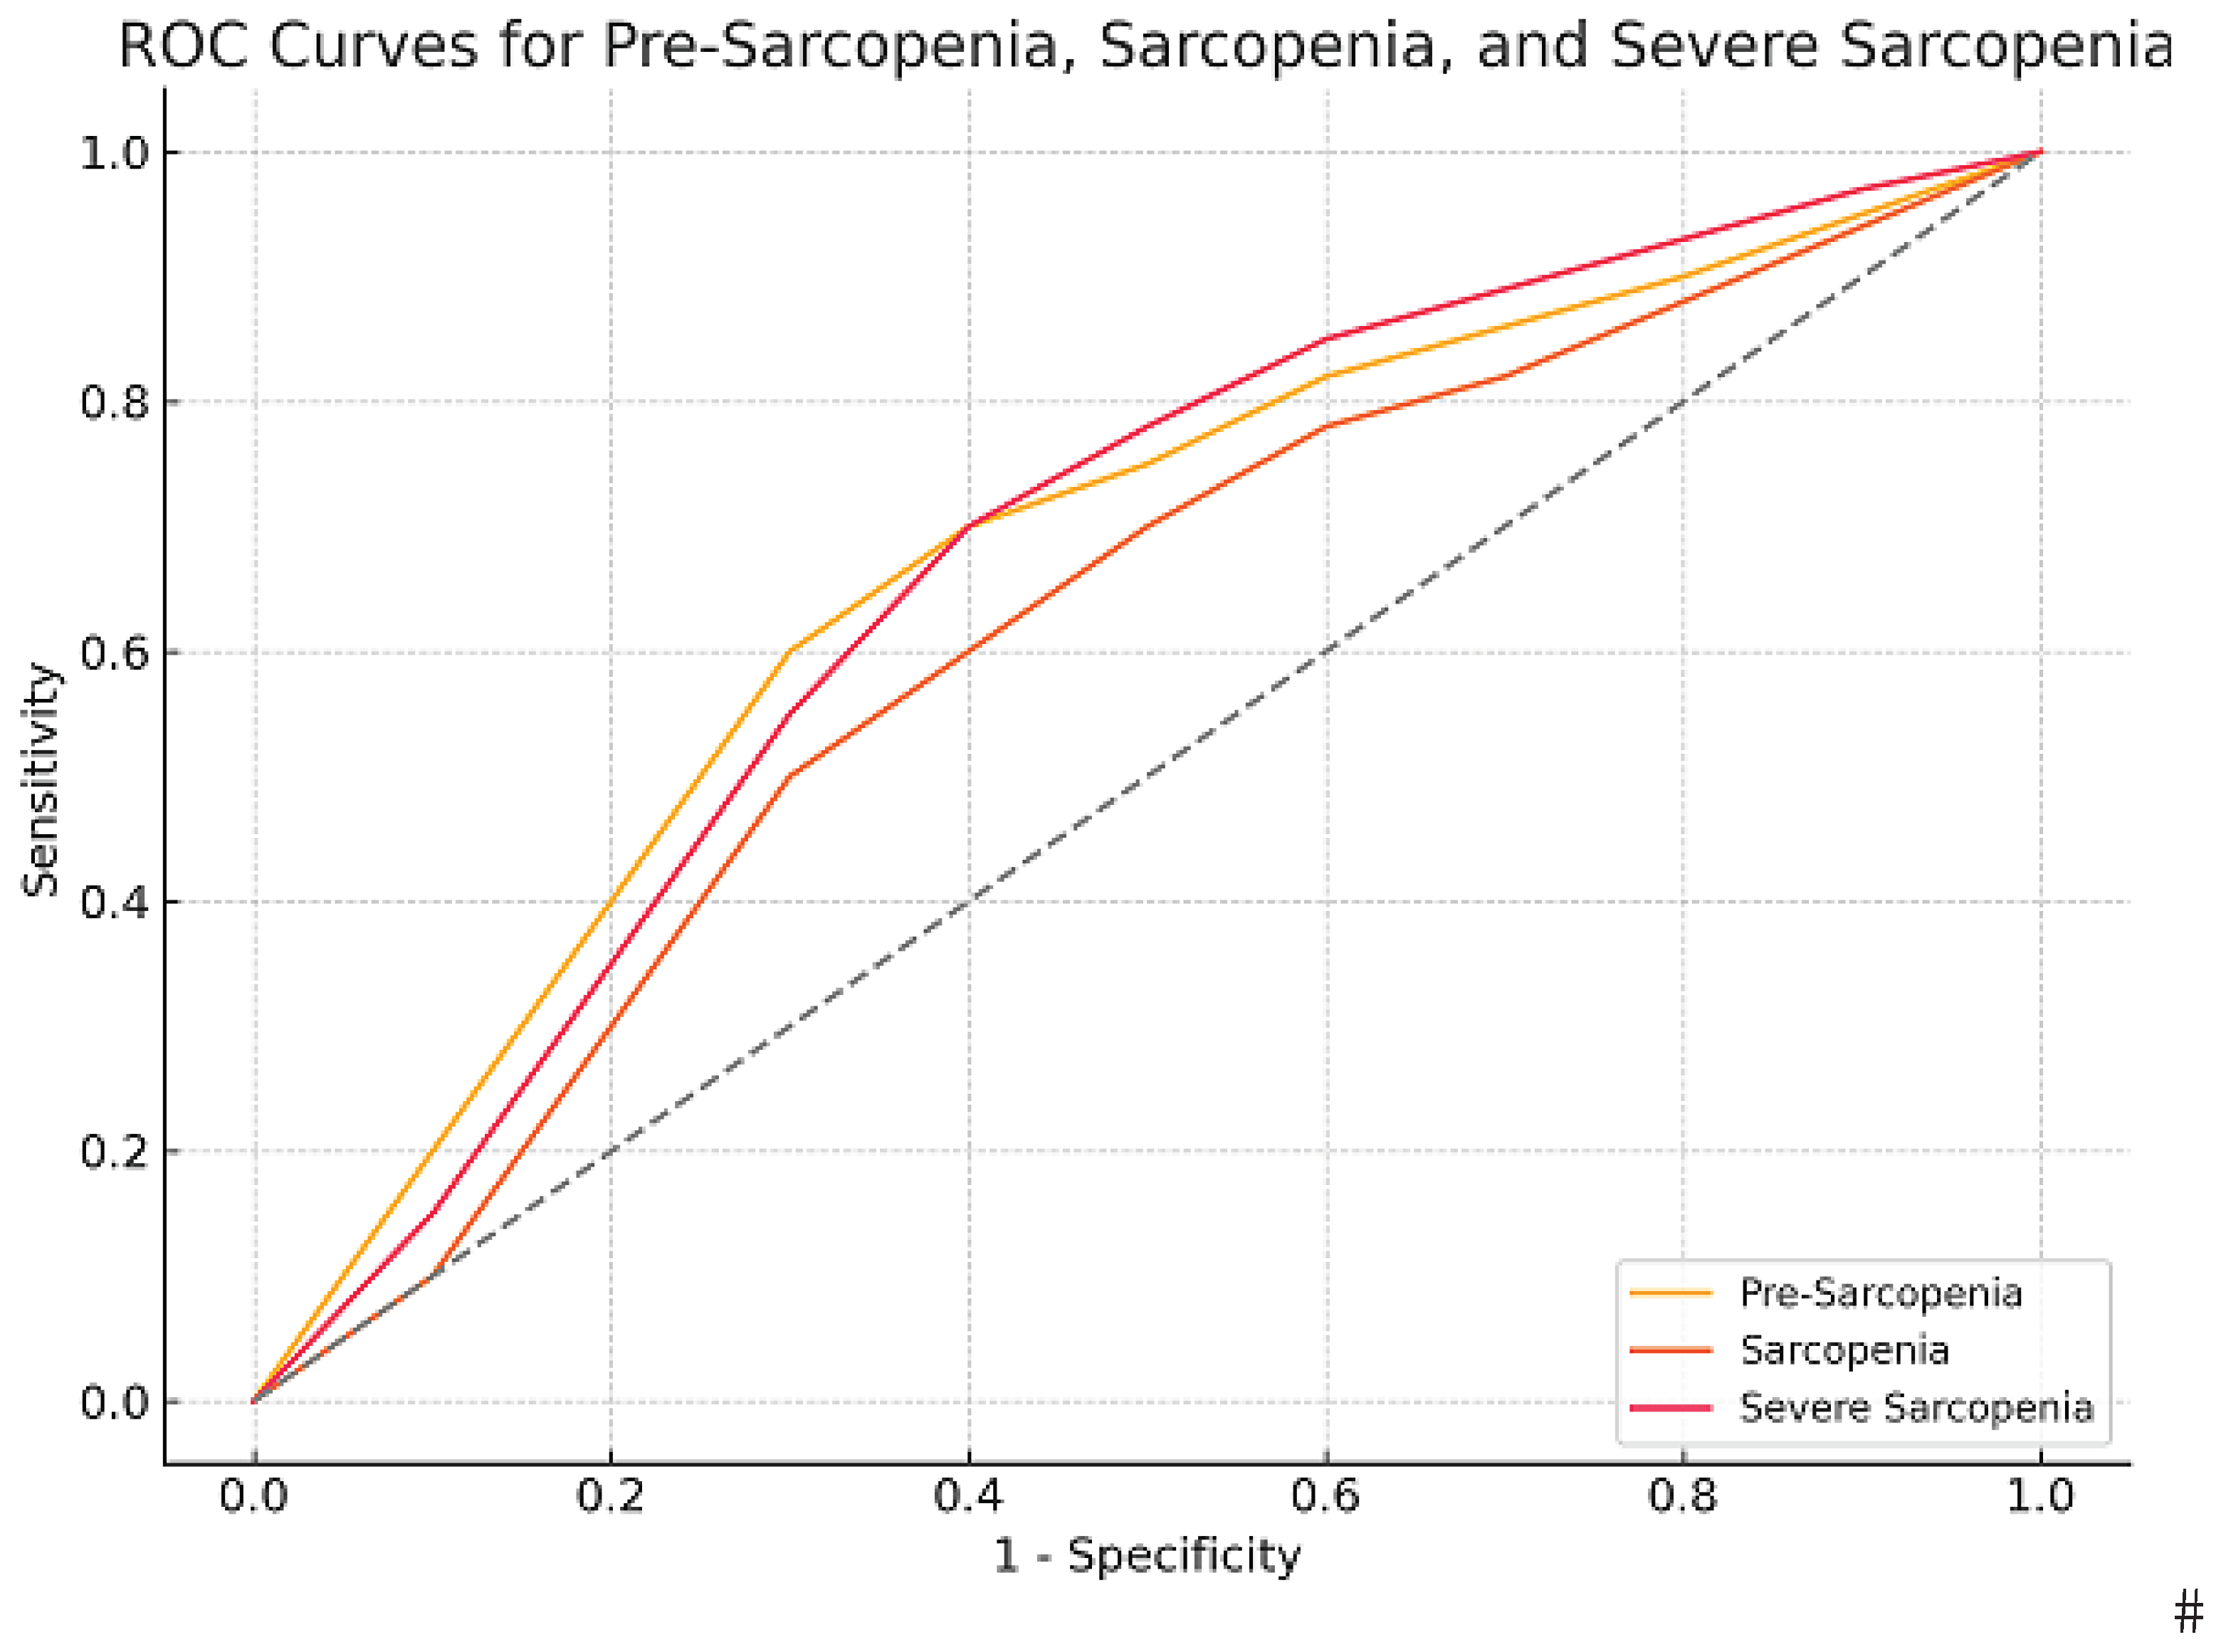
| AUC (SE) | p | 95%CI | Cut-Off | Sensiv. | Spesif. | J | |
|---|---|---|---|---|---|---|---|
| Possible Sarcopenia | 0.768 (0.039) | 0.001* | 0.691-0.844 | 0.5a | 0.839 | 0.490 | 0.329 |
| 2.5b | 0.768 | 0.718 | 0.486 | ||||
| Sarcopenia | 0.704 (0.059) | 0.001* | 0.589-0.820 | 2.5a | 0.792 | 0.635 | 0.427 |
| 4.5b | 0.667 | 0.773 | 0.440 | ||||
| Severe Sarcopenia | 0.759 (0.057) | 0.001* | 0.646-0.870 | 5.5ab | 0.765 | 0.793 | 0.558 |
Disclaimer/Publisher’s Note: The statements, opinions and data contained in all publications are solely those of the individual author(s) and contributor(s) and not of MDPI and/or the editor(s). MDPI and/or the editor(s) disclaim responsibility for any injury to people or property resulting from any ideas, methods, instructions or products referred to in the content. |
© 2025 by the authors. Licensee MDPI, Basel, Switzerland. This article is an open access article distributed under the terms and conditions of the Creative Commons Attribution (CC BY) license (http://creativecommons.org/licenses/by/4.0/).


