
Submitted:
26 November 2025
Posted:
27 November 2025
You are already at the latest version
Abstract
Eye-tracking provides valuable insights into visual perception and cognitive processes during the diagnostic interpretation of radiographic images. This study investigated eye movement patterns and pupil dynamics and their association with diagnostic performance among dental students who interpreted panoramic radiographs of mixed dentition. A total of 54 fifth-year dental students participated in this study, and their eye movements were recorded using a noninvasive eye-tracking system during free observation without time restrictions. Diagnostic performance was assessed based on the correct identification of the five radiographic findings, and eye movement metrics, blink behavior, and pupil area were analyzed. The eye movement patterns were classified into four groups: clockwise (R, 29.6%), counterclockwise (L, 44.4%), saccadic (S, 16.7%), and concentrated (C, 9.3%). Students with clockwise patterns demonstrated significantly higher diagnostic scores and more efficient scanning strategies than those in the other groups (p < 0.001). Linear mixed-effects modeling indicated that a reading time of up to 120 s improved performance, whereas a longer viewing time did not yield further benefits. These findings suggest that the diagnostic accuracy of dental radiography is supported by efficient global-to-local eye movement strategies, optimal allocation of cognitive resources, and controlled reading time.
Keywords:
eye-tracking
; pupillometry
; panoramic radiography
; mixed dentition
; visual search
; fixation
; saccades
; cognitive load
; dental students
; radiographic interpretation
1. Introduction
Research on visual processing has rapidly expanded across multiple domains, ranging from computer vision and deep learning to improving diagnostic imaging and surgical precision [1], using virtual and augmented reality in dental education [2], integrating vision and language [3], and investigating eye-tracking and attentional mechanisms [4].
In particular, eye tracking studies have provided valuable insights into human cognition and information processing. In cognitive psychology, eye-tracking has been used to examine how individuals perceive and process information, including the analysis of face-viewing patterns [5], the relationship between cognitive load and attention [6], learning processes such as the improvement of dyslexia through visual attention training [7], and associations between dyslexia and impaired visual attention [8].
In the dental field, we previously applied eye-tracking to investigate how undergraduate dental students process panoramic radiographs (PANs) of mixed dentition [9]. We demonstrated that eye movement patterns could be classified into three categories associated with diagnostic performance. High-performing students exhibited significantly larger pupil diameters, suggesting greater engagement in diagnostic tasks. However, pupil dilation is also known to reflect increased cognitive load [10]. In fact, Castner et al. [11] reported that dental students and radiology experts differ in their cognitive load during PAN interpretation, with experts showing smaller pupil diameters, and thus, lower cognitive demands. In our earlier study, the observed pupil dilation among high performers might have been influenced by the experimental design, which imposed a strict 1-min observation limit. This time constraint might have placed the undergraduate students under an unusually high cognitive load, potentially altering their pupillary responses.
Previous research by Gnanasekaran et al. allowed undergraduate dental students to freely observe PANs of mixed dentition without time restrictions, and reported their average viewing times [12]. However, their work did not address how pupil dynamics or the duration of observation influenced diagnostic performance. To date, no study has examined the relationship between eye-movement patterns, pupil responses, and diagnostic outcomes during free-viewing of mixed-dentition PANs.
This study aimed to examine whether visual perceptual patterns remained associated with diagnostic performance when time constraints were removed. To this end, dental students were allowed to observe the PAN for as long as they wished and the interpretation ended at their own discretion.
We hypothesized that high-performing students would demonstrate (1) a clockwise eye-movement pattern; (2) relatively longer reading times, associated with improved diagnostic accuracy; and (3) a lower cognitive load, reflected by more efficient pupillary responses.
Therefore, this study aimed to not only characterize eye movement patterns during the interpretation of a mixed-dentition PAN but also consider how such visual strategies could inform educational approaches. By linking specific gaze behaviors with diagnostic performance, these findings support the development of training methods that enhance visual literacy and clinical competence in dental education.
2. Materials and Methods
2.1. Participants
Fifty-four fifth-year dental students (41 males and 13 females) from the Nippon Dental University School of Life Dentistry at Niigata participated in this study. The purpose and procedures of the study were explained in advance and written informed consent was obtained from all participants. The study protocol was approved by the Ethics Committee of Nippon Dental University School of Life Dentistry at Niigata (approval no. ECNG-H-106). All participants had normal or corrected-to-normal vision (≥0.8, Landolt ring method with contact lenses permitted) and no conditions interfering with the experiment. We estimated the required sample size a priori for a 4-group one-way ANOVA (fixed effects; two-sided; α = 0.05; desired power = 0.80). The effect size (Cohen’s f = 0.85) was derived from our pilot data (group means and SDs) using the pooled within-group SD under equal allocation. The analysis indicated that at least five participants per group were required. Calculations were performed with G*Power (version 3.1.9.7).
2.2. Test Image
A PAN of a mixed dentition case (Hellman’s dental age IIIA, without congenital absence) was used as the test image. The radiograph revealed three specific findings: a maxillary inverted impacted supernumerary tooth, space maintainer, and restoration (Figure 1). Each participant was instructed to interpret the image and informed that it would be displayed until they indicated that their interpretation was complete. All participants completed radiology coursework and were undergoing clinical training at the time of the study.
2.3. Eye Movement Recording
The PAN was projected onto a screen (106 cm × 141 cm) using a liquid crystal projector (EMP-755, Seiko Epson Corporation, Nagano, Japan). The screen was positioned 200 cm from the participant, subtending a visual angle of approximately ±20° horizontally and ±15° vertically (Figure 2). Eye movements were recorded using a non-contact eye tracker (Free View T.K.K. 2920; Takei Scientific Instruments Co., Ltd., Niigata, Japan). This system tracks the gaze direction by capturing near-infrared reflections from the pupil and corneal Purkinje images, allowing conversion into gaze coordinates. Fixations were defined as gaze points with angular velocity <5°/s, and saccades as movements ≥5°/s. Eye movements were recorded continuously from image onset until participants voluntarily terminated their observation.
2.4. Assessment of Diagnostic Performance
After eye-tracking, the participants moved to a separate room and freely recorded their diagnostic findings in writing. Five items were extracted from the responses: (1) inverted maxillary impacted supernumerary tooth, (2) space maintainer, (3) restoration, (4) dental age (Hellman’s method), and (5) congenital defects. The number of correctly identified items was converted into a diagnostic score. The participants were then categorized into two groups: high performance (≥3) and low performance (<3). Diagnostic performance was analyzed according to sex, reading time, and eye-movement patterns. Reading time was classified into four categories: 0–60 s, 61–120 s, 121–180 s, and ≥181 s.
2.5. Eye-Tracking Metrics
Fixation count, total viewing time, mean saccadic velocity, fixation ratio, total fixation duration, and mean fixation duration were calculated. Fixations were defined as gaze maintained for ≥33 ms. With 1818 frames acquired per minute, total viewing time was calculated as the number of valid frames (excluding blink frames) multiplied by 33 ms. Mean saccadic velocity was calculated as total angular displacement divided by total viewing time. Fixation ratio was defined as the number of fixation frames divided by the total number of viewing frames. The total fixation duration was defined as the number of fixation frames multiplied by 33 ms, and the mean fixation duration was defined as the total fixation duration divided by the fixation count.
Blink analysis distinguished between spontaneous blinks (short duration, ≤330 ms, occurring periodically) and voluntary blinks (longer duration, non-periodic). Blink bursts were defined as clusters of consecutive blinks within a short interval.
Pupil area was analyzed as an index of cognitive load, attention, and mental state. Both the overall pupil area (excluding blink frames) and the fixation-related pupil area (excluding saccades, analyzed only during fixations) were calculated. Pupil size was measured in dot units and expressed as π·dot².
2.6. Classification of Eye Movement Patterns
Eye movement patterns were classified based on the gaze coordinates (x, y) sampled every 33 ms. Using three consecutive points, A = (Ax, Ay), B = (Bx, By), and C = (Cx, Cy), the cross-product was calculated as follows:
S = (Bx – Ax)(Cy – Ay) – (By – Ay)(Cx – Ax)
If S < 0, the movement is clockwise; if S > 0, it is counterclockwise; and if S = 0, it is linear. Directionality was determined using the COUNTIF function in Microsoft Excel 2019. The PAN was divided into four quadrants, with the image center as the origin. Gaze coordinates were classified into quadrants, and transitions between quadrants were used to further characterize the scan paths. Based on these criteria, eye movement patterns were classified as clockwise (R group), counterclockwise (L group), scattered with few fixations and frequent saccades (S group), and clustered around anatomical landmarks with minimal quadrant transitions (C group).
2.7. Saccadic Analysis
Because eye movements involve angular displacement, saccadic amplitude was measured in degrees. Saccades were defined as movements with velocity ≥30°/s. The total number of saccades was counted and normalized per minute to account for variations in reading time.
2.8. Ordinal Logistic Regression
Ordinal logistic regression analysis was conducted to evaluate predictors of diagnostic performance. The diagnostic score (ordinal scale) was the dependent variable, and physiological indices (eye movement, pupil, and blink measures) were included as continuous explanatory variables. The models were fitted using maximum likelihood estimation. The model fit was assessed using Akaike’s Information Criterion (AIC) and McFadden’s pseudo-R².
2.9. Statistical Analysis
Student’s t-tests were used to examine sex differences in diagnostic scores and eye-tracking measures. Chi-square tests were applied to compare interpretation outcomes across eye movement patterns, followed by residual analysis. The relationship between the diagnostic score and reading time was analyzed using a linear mixed-effects model (LMM) with the score as the dependent variable, reading time category as a fixed effect, and participant ID as a random intercept.
For comparisons of diagnostic scores and eye-tracking indices among eye movement patterns, one-way ANOVA followed by Tukey–Kramer post-hoc tests were used for normally distributed data with equal variance. For non-parametric data, Kruskal–Wallis tests followed by Steel–Dwass post-hoc comparisons were applied. All analyses were performed using Bell Curve for Excel (ver. 3.22).
LMM and ordinal logistic regression analyses were performed using Python software (ver. 3.12.7) using the statsmodels library with the models built using the OrderedModel class. A two-tailed significance level of p < 0.05 (two-tailed) was considered.
Group comparisons were conducted using one-way ANOVA. Welch’s ANOVA was applied when the assumption of homogeneity of variance was violated. For non-normally distributed variables, the Kruskal–Wallis test followed by post-hoc comparisons using the Dunn–Bonferroni method was performed. LMMs were used to analyze repeated measures across time bins. Effect sizes were reported as Cramer’s V for chi-square tests and partial eta-squared (η²) for ANOVAs, with thresholds interpreted according to conventional guidelines (small, moderate, large). Statistical significance for all analyses was set at p < 0.05.
3. Results
3.1. Eye Movement Patterns
The eye movement patterns were classified into four groups: clockwise (R; n = 16, 29.6%), counterclockwise (L; n = 24, 44.4%), scattered (S; n = 9, 16.7%), and clustered (C; n = 5, 9.3%). No significant sex differences were observed in the distribution of eye movement patterns (χ²(3) = 1.33, p = 0.72). Representative examples of each pattern are shown in Figure 2. High-performing participants in the R group exhibited clockwise scan paths more frequently (Figure 2a), which were characterized by fixations distributed across the entire radiograph and relatively few saccades. An example of the L group is shown in Figure 2b, whereas the S group demonstrated a pattern dominated by saccades with very few fixations (Figure 2c). In the C group, fixation was restricted to specific landmarks (Figure 2d). This indicates a significant association between the categorical variables.
3.2. Distribution of Scores by Eye Movement Pattern
No sex differences were observed in interpretation scores or eye-tracking measures. The overall mean score was 2.13 (SD = 1.11, median = 2.0); therefore, participants scoring ≥3 points were classified as the high-score group, and those scoring ≤2 points as the low-score group. The distribution of scores based on eye movement patterns is shown in Table 1. The chi-square test revealed a significant association between group and performance level (χ²(3) = 29.66, p < 0.001, Cramer’s V = 0.74). The adjusted standardized residuals indicated that the R group contained significantly more participants in the high-scoring category and fewer in the low-scoring category than expected, whereas the L group contained significantly more participants in the low-scoring category and fewer in the high-scoring category. No significant deviation from the expected frequencies was observed in the C and S groups.
3.3. PAN Interpretation Results by Eye Movement Patterns
The interpretation outcomes according to the patterns are summarized in Table 2. Chi-square tests indicated significant group differences in the detection of restorations, dental age, and congenital defects (all p < 0.001). Residual analysis further revealed that the R group achieved significantly higher detection rates for dental age and congenital defects than the other groups (both p < 0.001). The mean interpretation scores also differed significantly across groups (ANOVA revealed a significant main effect of group [ANOVA, p < 0.001], with post-hoc comparisons indicating group differences), with the R group scoring higher than the L, S, and C groups (all p < 0.001, Tukey–Kramer test). This indicates a significant association between the categorical variables.
3.4. Eye-Tracking Indices by Eye Movement Patterns
The eye tracking indices according to the patterns are presented in Table 3. The S group showed a significantly higher average saccadic velocity and shorter mean fixation duration than the other groups (p = 0.010 and p = 0.013, respectively; Kruskal–Wallis test). Significant differences were observed between the S and L groups in the number of fixations and total fixation duration (p = 0.013 and p = 0.026, respectively). Significant differences in blink measurements (blink count, voluntary blinks, and blink bursts) were found between the R and S groups (p = 0.043, p = 0.037, and p = 0.024, respectively). No significant differences in the pupil area were observed among the four groups (ANOVA, p > 0.05).
3.5. Saccadic Analysis
Table 4 presents the results of the saccadic analysis. The S group exhibited a significantly greater mean saccadic amplitude than the other groups (p = 0.008, Kruskal–Wallis test), whereas the C group showed the smallest amplitudes. The number of saccades per minute was significantly higher in the S group than in the C group (p < 0.001).
3.6. Ordinal Logistic Regression
To evaluate the primary hypothesis regarding the effect of pupil area on interpretation performance, ordinal logistic regression was conducted, excluding eye movement patterns as a factor. The predictors included total reading time, mean saccadic velocity, fixation duration, fixation count, pupil area, pupil area during fixation, voluntary blinking, and blink bursts. The model fit indices indicated an acceptable fit (AIC = 139.9; McFadden’s pseudo R² = 0.16). The significant predictors are summarized in Table 5.
The pupil area (coefficient (coef) = −0.625, SE = 0.218, z = −2.87, p = 0.004) and blink measures (voluntary blinks, coef = −0.313, p = 0.035; blink bursts, coef = −0.127, p = 0.003) were negatively associated with performance.
The pupil area during fixation was positively associated with performance (coef = 0.510, p = 0.014).
Total reading time was not a significant predictor (p = 0.310).
3.7. The Effect of Reading Time on Diagnostic Performance
Finally, the reading time was categorized into four bins and analyzed using a linear mixed model (Table 6). Interpretation scores increased significantly up to 120 s (0–60 s: mean = 1.9, p < 0.001; 61–120 s: mean = 2.44, p = 0.022) but did not significantly improve beyond 121 s (121–180 s: mean = 1.6, p = 0.463; ≥181 s: mean = 2.0, p = 0.900).
The results of the linear mixed model (LMM) analysis are presented with corresponding p-values for each time bin. Significant effects were observed in the 0–60 s (p < 0.001) and 61–120 s (p = 0.022) bins.
3.8. The Distribution of Reading Times Across Eye Movement Patterns
The distribution of reading times across eye movement patterns is presented in Table 7.
In the R group, the proportion of students with a reading time of 61–120 s was significantly higher than in the other groups, whereas the proportion with a reading time of 121–180 s was significantly lower than in other groups. In the L group, the proportion of students with a reading time of 121–180 s was significantly higher than in the other groups. No significant differences were observed in the distribution of reading times between groups S and C groups. A chi-square test of independence confirmed a significant association between eye movement pattern and reading time (χ²(9) = 23.05, p = 0.0061, Cramer’s V = 0.49), indicating a moderate effect size.
At the 61–120 s interval—which represented the mode in the R, L, and S groups—ANOVA revealed a significant main effect of group (p < 0.001). Post-hoc comparisons indicated that the R group achieved significantly higher reading scores (3.46 ± 0.66) compared with the L (1.62 ± 0.77) and S (1.80 ± 1.30) groups.
4. Discussion
In this study, even when participants were allowed to freely observe the PAN without time restrictions, eye movement patterns similar to those reported in our previous study were identified (R, 29.6%; L, 44.4%; S, 16.7%). The distribution of patterns was consistent with our earlier findings (R, 36.7%; L, 48.3%; S, 15%), suggesting a certain degree of stability in visual perceptual behavior, despite differences in reading time and participants. In addition, we identified a new localized eye movement pattern in which the gaze was concentrated around anatomical landmarks (C pattern: 9.3%). Saccade analysis revealed that the C group exhibited significantly fewer saccades with shorter amplitudes than the other groups, whereas the S group showed a significantly higher saccadic frequency and greater amplitude.
Pannasch et al. reported that under free-viewing conditions with a short observation period (6.5 s), eye movements typically shift from ambient (global exploration) to focal (detailed inspection) processing [13]. However, when viewing unfamiliar aerial photographs, they found that the difficulty of information processing led to a prolonged dominance of ambient exploration [14]. The S-pattern, characterized by sparse fixations and frequent large saccades, appears to reflect such a prolonged ambient/global search under increased task difficulty. The blink rate of the S group was significantly higher than that of the other groups, which aligned with the report by Stern et al. [15] that increased blinking reflects processing difficulties. Because mixed-dentition PANs show unerupted permanent tooth germs located beneath the primary teeth, students accustomed to adult PANs may have perceived them as less familiar, thereby maintaining global exploration for a longer period.
In contrast, pattern C was characterized by highly localized fixations and reduced saccadic frequency and amplitude from the outset, suggesting a local-first (focal) strategy rather than a typical ambient-to-focal transition. This detail-focused style is consistent with the literature on local processing bias in Autism Spectrum Disorder, including the weak central coherence account [16] and the enhanced perceptual functioning framework [17], although such a bias can also manifest as a cognitive style within nonclinical populations [18]. Consequently, the C pattern, where the gaze was narrowly directed toward landmarks, may represent a form of local search strategy in contrast to a global search, which involves scanning the entire visual field. This pattern could reflect a field-dependent or detail-oriented exploratory tendency, potentially associated with individual differences in visual search styles.
Analysis of reading time showed that R-group students were more likely to complete interpretation within 61–120 s and less likely to exceed 121 s, whereas L-group students tended to observe longer than 121 s. No significant differences were noted for the S or C groups. These findings indicate that the R-pattern may reflect an efficient visual strategy that enables rapid scanning of the field and timely focusing on diagnostically relevant regions, thereby contributing to superior performance.
Importantly, longer viewing time did not necessarily translate into higher diagnostic accuracy. Both ordinal logistic regression and LMM analyses demonstrated that observations beyond 121 s did not improve performance. This suggests that prolonged inspection, rather than enhanced diagnostic reasoning, may reflect an increased memory load in students who require more time to encode and report findings.
The pupillometric analyses supported these interpretations. High-performing students exhibited a smaller mean pupil size across the observation period but larger dilation during fixations on diagnostic findings. This pattern aligns with the concept of task-evoked pupillary responses [19,20], indicating the efficient allocation of cognitive resources while maintaining a low tonic load while engaging strongly at critical moments. Similar results have been reported in expert populations, who maintain stable baseline pupil size with marked phasic dilation during task-relevant events [11,21]. In contrast, low-performing students displayed persistently larger pupil sizes, suggesting a sustained cognitive load throughout the observation period. This interpretation is consistent with evidence that high memory demands and cognitive load elicit sustained pupil dilation, often associated with poorer task performance [22,23].
Taken together, these findings partially supported our initial hypotheses. High-performance students were more likely to adopt a clockwise scanning pattern, reflecting efficient visual exploration. Diagnostic accuracy was optimized when the observation was completed within 120 s, emphasizing that longer viewing does not guarantee better performance. Moreover, the effective modulation of the cognitive load, indexed by pupillary responses, has emerged as a critical factor influencing radiographic interpretation. These results underscore the interdependence of visual strategies, cognitive processing, and diagnostic performance, and offer novel implications for evidence-based educational approaches in dental radiology.
From an educational perspective, these findings suggest that training programs should be designed to cultivate efficient visual strategies, such as those demonstrated by the R group. Providing students with guided feedback on their eye-movement patterns during PAN interpretation may accelerate their transition from global to focal exploration and improve their diagnostic accuracy. These insights may inform the development of curricula aimed at enhancing visual literacy and clinical competence in dental education.
5. Limitations
This study had several limitations. First, although pupillary responses were interpreted as indicators of cognitive load, pupil size is also influenced by sympathetic activity, such as dilation and constriction, under autonomic stimulation. Because physiological indices of sympathetic arousal, such as the galvanic skin response (GSR) and heart rate variability (HRV), were not measured in this experiment, the contribution of autonomic factors cannot be excluded. Future studies should incorporate simultaneous recordings of GSR and HRV alongside eye tracking to better dissociate cognitive and autonomic influences on pupillary dynamics.
Second, individual differences in cognitive style were not assessed. Visual search strategies may be associated with field dependence or field independence, which were not evaluated in this study. Incorporating validated measures of cognitive style in future studies will help clarify how perceptual strategies interact with eye movement patterns, pupillary responses, and diagnostic accuracy.
6. Conclusions
The present study demonstrated that distinct eye movement patterns and pupillary dynamics are closely associated with the diagnostic performance of PAN interpretation. Efficient strategies, characterized by structured scan paths, timely completion within 120 s, and selective pupillary responses, were linked to superior accuracy, whereas prolonged observation and sustained pupil dilation reflected less effective cognitive processing. These results highlight that diagnostic success depends not only on visual exploration but also on the regulation of cognitive load.
From an educational perspective, eye tracking and pupillometry are promising tools for assessing students’ diagnostic strategies and delivering targeted feedback during radiology training. Identifying markers of efficient versus inefficient processing may guide the development of evidence-based interventions that foster expertise. Future integration of additional physiological measures, such as GSR and HRV, together with assessments of cognitive style could further refine our understanding of how perceptual and cognitive factors interact in clinical education.
Author Contributions
Conceptualization: S.T. and T.S.; methodology: S.T. and T.S.; investigation: S.T. and T.S.; formal analysis: S.T., Y.K., and A.O.; writing – original draft: S.T. and H.K.; writing – review and editing: S.T. and H.K.; supervision: S.T.; funding acquisition: S.T., H.K., Y.K., A.O. and T.S. All authors have read and agreed to the published version of the manuscript.
Funding
This research was supported by JSPS KAKENHI (Grant Numbers JP2646319, JP17K12065, JP22K10349, and JP25K13298).
Institutional Review Board Statement
The study was conducted in accordance with the Declaration of Helsinki, and approved by the Institutional Review Board (Ethics Committee) of Nippon Dental University School of Life Dentistry at Niigata on 3 July 2012 (protocol code ECNG-H-106).
Informed Consent Statement
Written informed consent was obtained from all subjects involved in the study.
Data Availability Statement
The original data generated in this study are available from the corresponding author upon reasonable request. Due to privacy and ethical restrictions, the data are not publicly available.
Acknowledgments
The authors are grateful to the participating students the School of Life Dentistry at Niigata, The Nippon Dental University. We also sincerely thank Editage (https://www.editage.jp/) for their assistance in editing and reviewing the English language of this manuscript. During the preparation of this manuscript, the authors used ChatGPT (OpenAI, GPT-5, 2025) to improve the clarity and readability of the English text. The authors have carefully reviewed and edited the output and take full responsibility for the final content of this publication.
Conflicts of Interest
The authors declare no conflicts of interest.
Abbreviations
The following abbreviations are used in this manuscript:
| PAN | Panoramic radiograph |
| AIC | Akaike’s information criterion |
| ANOVA | Analysis of variance |
| GSR | Galvanic skin response |
| HRV | Heart rate variability |
References
- Anteby, R.; Horesh, N.; Soffer, S.; Zager, Y.; Barash, Y.; Amiel, I.; Rosin, D.; Gutman, M.; Klang, E. Deep learning visual analysis in laparoscopic surgery: A systematic review and diagnostic test accuracy meta-analysis. Surg. Endosc. 2021, 35, 1521–1533. [Google Scholar] [CrossRef]
- Afrashtehfar, K.I.; Yang, J.W.; Al-Sammarraie, A.; Chen, H.; Saeed, M.H. Pre-clinical undergraduate students’ perspectives on the adoption of virtual and augmented reality to their dental learning experience: A one-group pre- and post-test design protocol. F1000Research 2021, 10, 473. [Google Scholar] [CrossRef]
- Abashidze, D.; Schmidt, A.; Trofimovich, P.; Mercier, J. Integration of visual context in early and late bilingual language processing: Evidence from eye-tracking. Front. Psychol. 2023, 14, 1113688. [Google Scholar] [CrossRef]
- Abbruzzese, L.; Magnani, N.; Robertson, I.H.; Mancuso, M. Age and gender differences in emotion recognition. Front. Psychol. 2019, 10, 2371. [Google Scholar] [CrossRef]
- Chung, C.; Choi, S.; Jeong, H.; Lee, J.; Lee, H. Attention mechanisms and emotion judgment for Korean and American emotional faces: An eye movement study. Front. Psychol. 2023, 14, 1235238. [Google Scholar] [CrossRef] [PubMed]
- Abeles, D.; Yuval-Greenberg, S. Just look away: Gaze aversions as an overt attentional disengagement mechanism. Cognition 2017, 168, 99–109. [Google Scholar] [CrossRef] [PubMed]
- Caldani, S.; Gerard, C.L.; Peyre, H.; Bucci, M.P. Visual attentional training improves reading capabilities in children with dyslexia: An eye tracker study during a reading task. Brain Sci. 2020, 10, 558. [Google Scholar] [CrossRef]
- Bucci, M.P. Visual training could be useful for improving reading capabilities in dyslexia. Appl. Neuropsychol. Child 2021, 10, 199–208. [Google Scholar] [CrossRef]
- Tanaka, S.; Karibe, H.; Kato, Y.; Komatsuzaki, A.; Sekimoto, T.; Shimomura-Kuroki, J. Evaluation of eye movement patterns during reading of mixed dentition panoramic radiographs in dental students. Pediatr. Dent. J. 2023, 33, 33–41. [Google Scholar] [CrossRef]
- Klingner, J.; Tversky, B.; Hanrahan, P. Effects of visual and verbal presentation on cognitive load in vigilance, memory, and arithmetic tasks. Psychophysiology 2011, 48, 323–332. [Google Scholar] [CrossRef]
- Castner, N.; Appel, T.; Eder, T.; Richter, J.; Scheiter, K.; Keutel, C.; Hüttig, F.; Duchowski, A.; Kasneci, E. Pupil diameter differentiates expertise in dental radiography visual search. PLoS ONE 2020, 15, e0223941. [Google Scholar] [CrossRef]
- Gnanasekaran, F.; Nirmal, L.; Ponraj, S.; Ranka, B.; Muthu, M.S.; Cho, V.-Y.; King, N.M.; Anthonappa, R. P. Visual interpretation of panoramic radiographs in dental students using eye-tracking technology. J. Dent. Educ. 2022, 86, 887–892. [Google Scholar] [CrossRef] [PubMed]
- Pannasch, S.; Helmert, J.R.; Roth, K.; Herbold, A.-K.; Walter, H. Visual fixation durations and saccade amplitudes: Shifting relationship in a variety of conditions. J. Eye Mov. Res. 2008, 2, 1–19. [Google Scholar] [CrossRef]
- Pannasch, S. Characteristics of ambient and focal processing during the visual exploration of dynamic stimuli. J. Vis. 2014, 14, 1208. [Google Scholar] [CrossRef]
- Stern, J.A.; Boyer, D.; Schroeder, D. Blink rate: a possible measure of fatigue. Hum. Factors. 1994, 36, 285–297. [Google Scholar] [CrossRef]
- Happé, F.; Frith, U. The weak coherence account: detail-focused cognitive style in autism spectrum disorders. J Autism Dev Disord. 2006, 36, 5–25. [Google Scholar] [CrossRef] [PubMed]
- Mottron, L.; Dawson, M.; Soulieres, I.; Hubert, B.; Burack, J. Enhanced perceptual functioning in autism: an update, and eight principles of autistic perception. J. Autism Dev. Disord. 2006, 36, 27–43. [Google Scholar] [CrossRef]
- Van der Hallen, R.; Evers, K.; Brewaeys, K.; Van den Noortgate, W.; Wagemans, J. Global processing takes time: A meta-analysis on local–global visual processing in ASD. Psychol. Bull. 2015, 141, 549–573. [Google Scholar] [CrossRef] [PubMed]
- Kahneman, D.; Beatty, J. Pupil Diameter and Load on Memory. Science 1966, 154, 1583–1585. [Google Scholar] [CrossRef]
- Beatty, J. Task-evoked pupillary responses, processing load, and the structure of processing resources. Psychol. Bull. 1982, 91, 276–292. [Google Scholar] [CrossRef]
- Brunyé, T.T.; Eddy, M.D.; Mercan, E.; Allison, K.H.; Weaver, D.L.; Elmore, J. G. Pupil diameter changes reflect difficulty and diagnostic accuracy in pathologists. BMC Med. Inform. Decis. Mak. 2016, 16, 77. [Google Scholar] [CrossRef] [PubMed]
- Mitre-Hernandez, H.; Sanchez-Rodriguez, J.; Nava-Muñoz, S.; Lara-Alvarez, C. Classifying the difficulty levels of working memory tasks by using pupillary response. PeerJ 2022, 10, e12864. [Google Scholar] [CrossRef] [PubMed]
- Chen, H.C.; Kao, C.H.; Wang, T.H.; Lai, Y.T. Evaluation of children’s cognitive load in processing and storage of their spatial working memory. Front. Psychol. 2022, 13, 918048. [Google Scholar] [CrossRef] [PubMed]
Figure 1.
Test image.
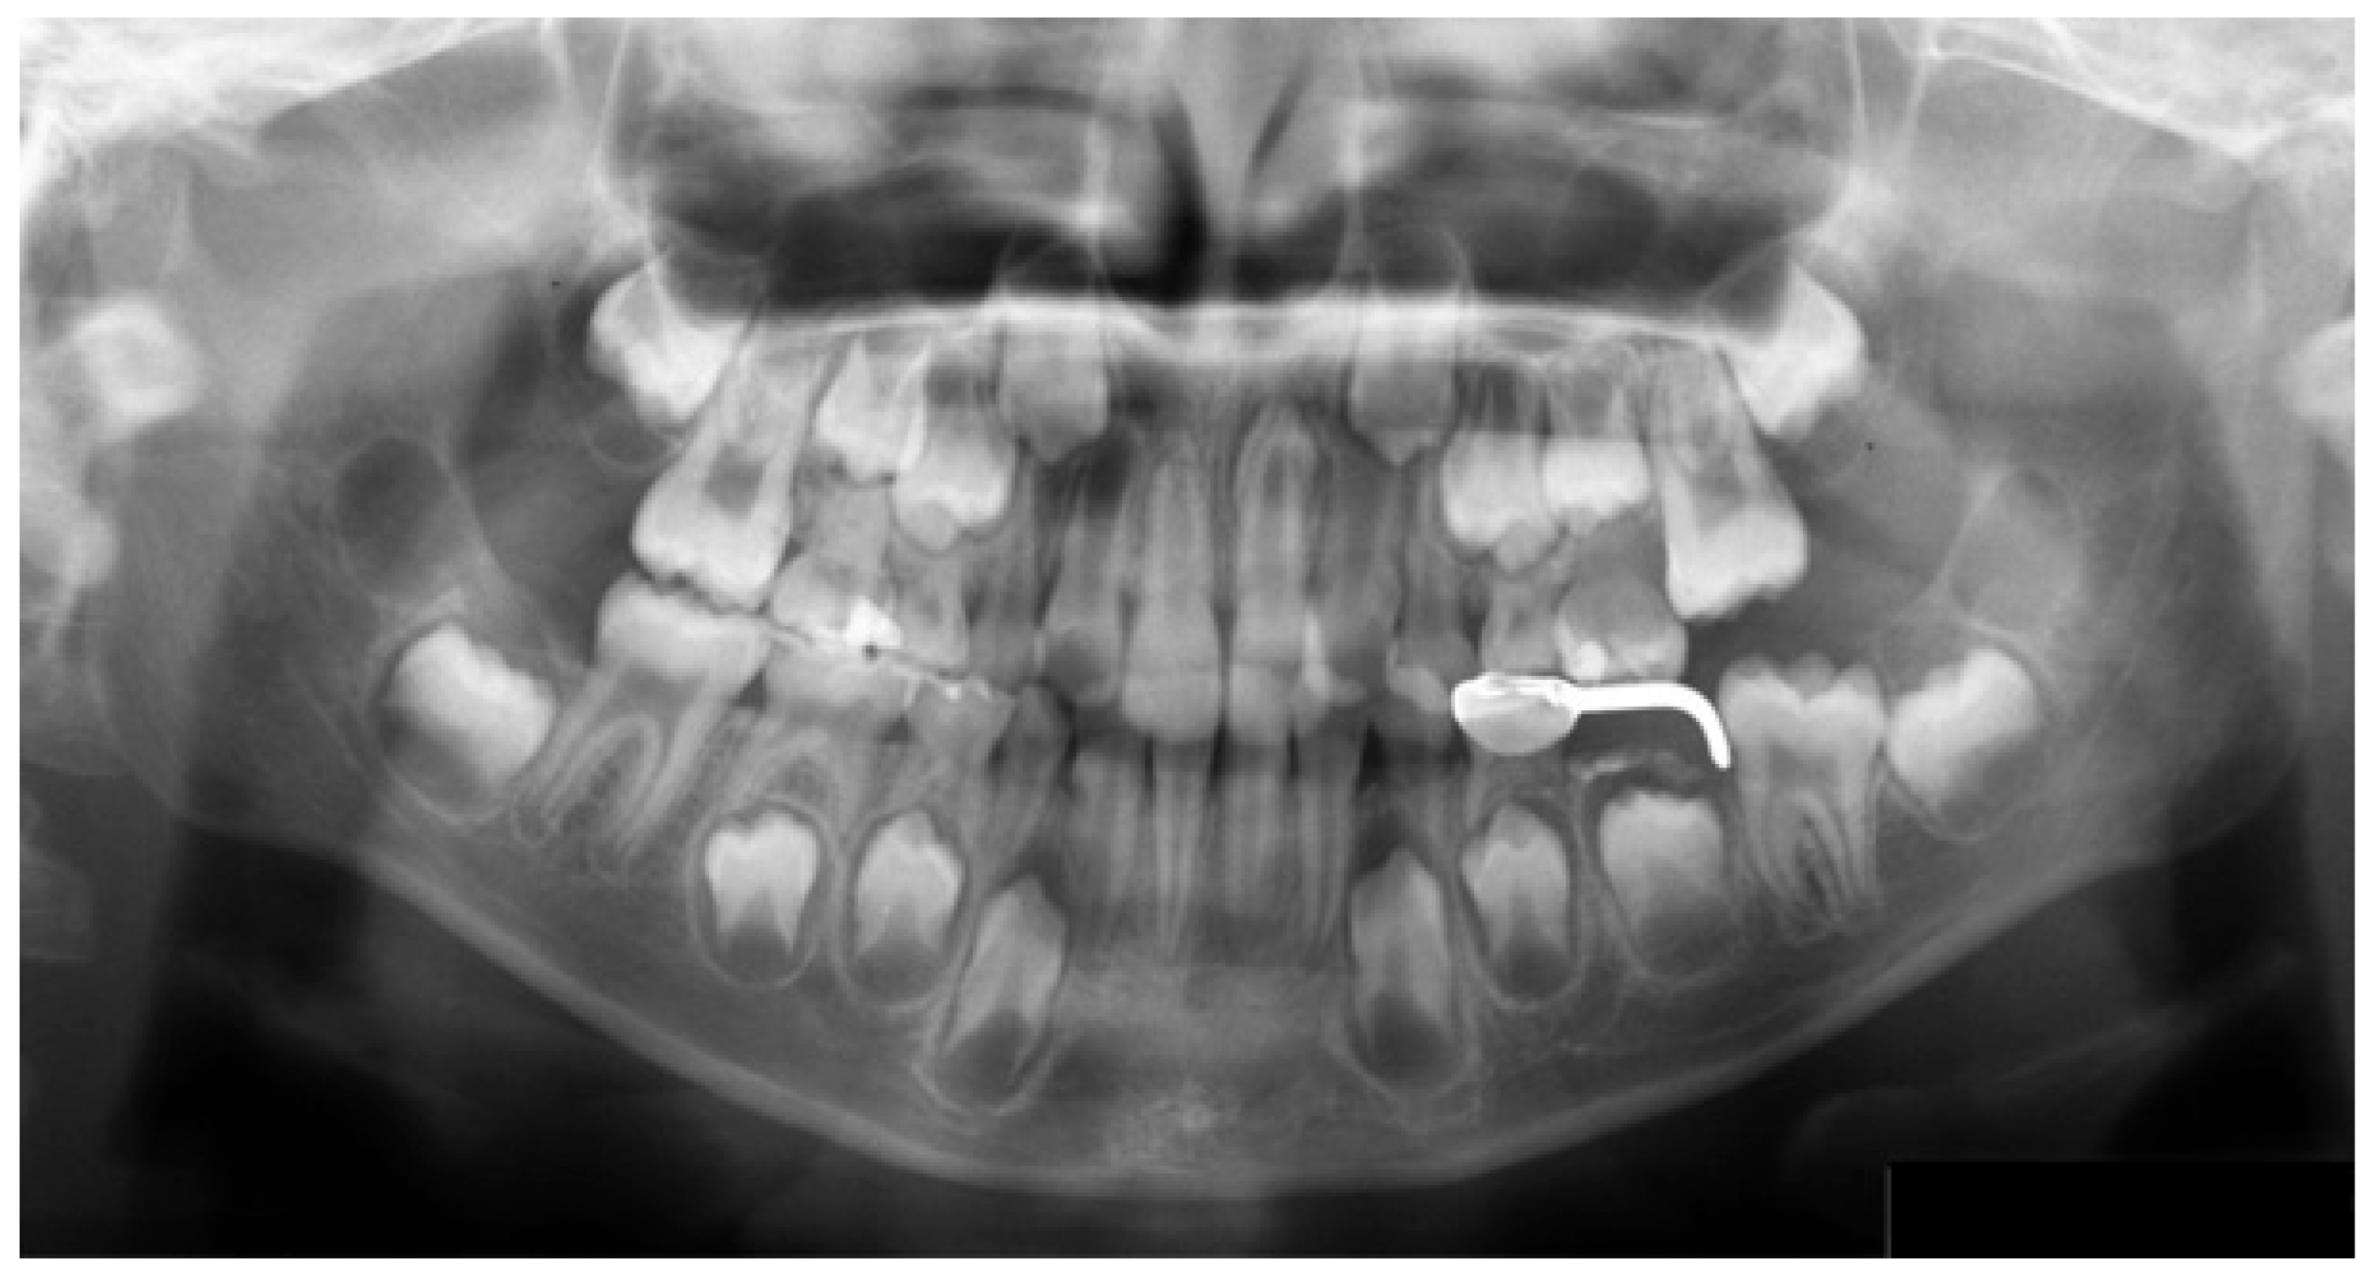
Figure 2.
(a) R Group. (b) L Group. (c) S Group. (d) C Group.
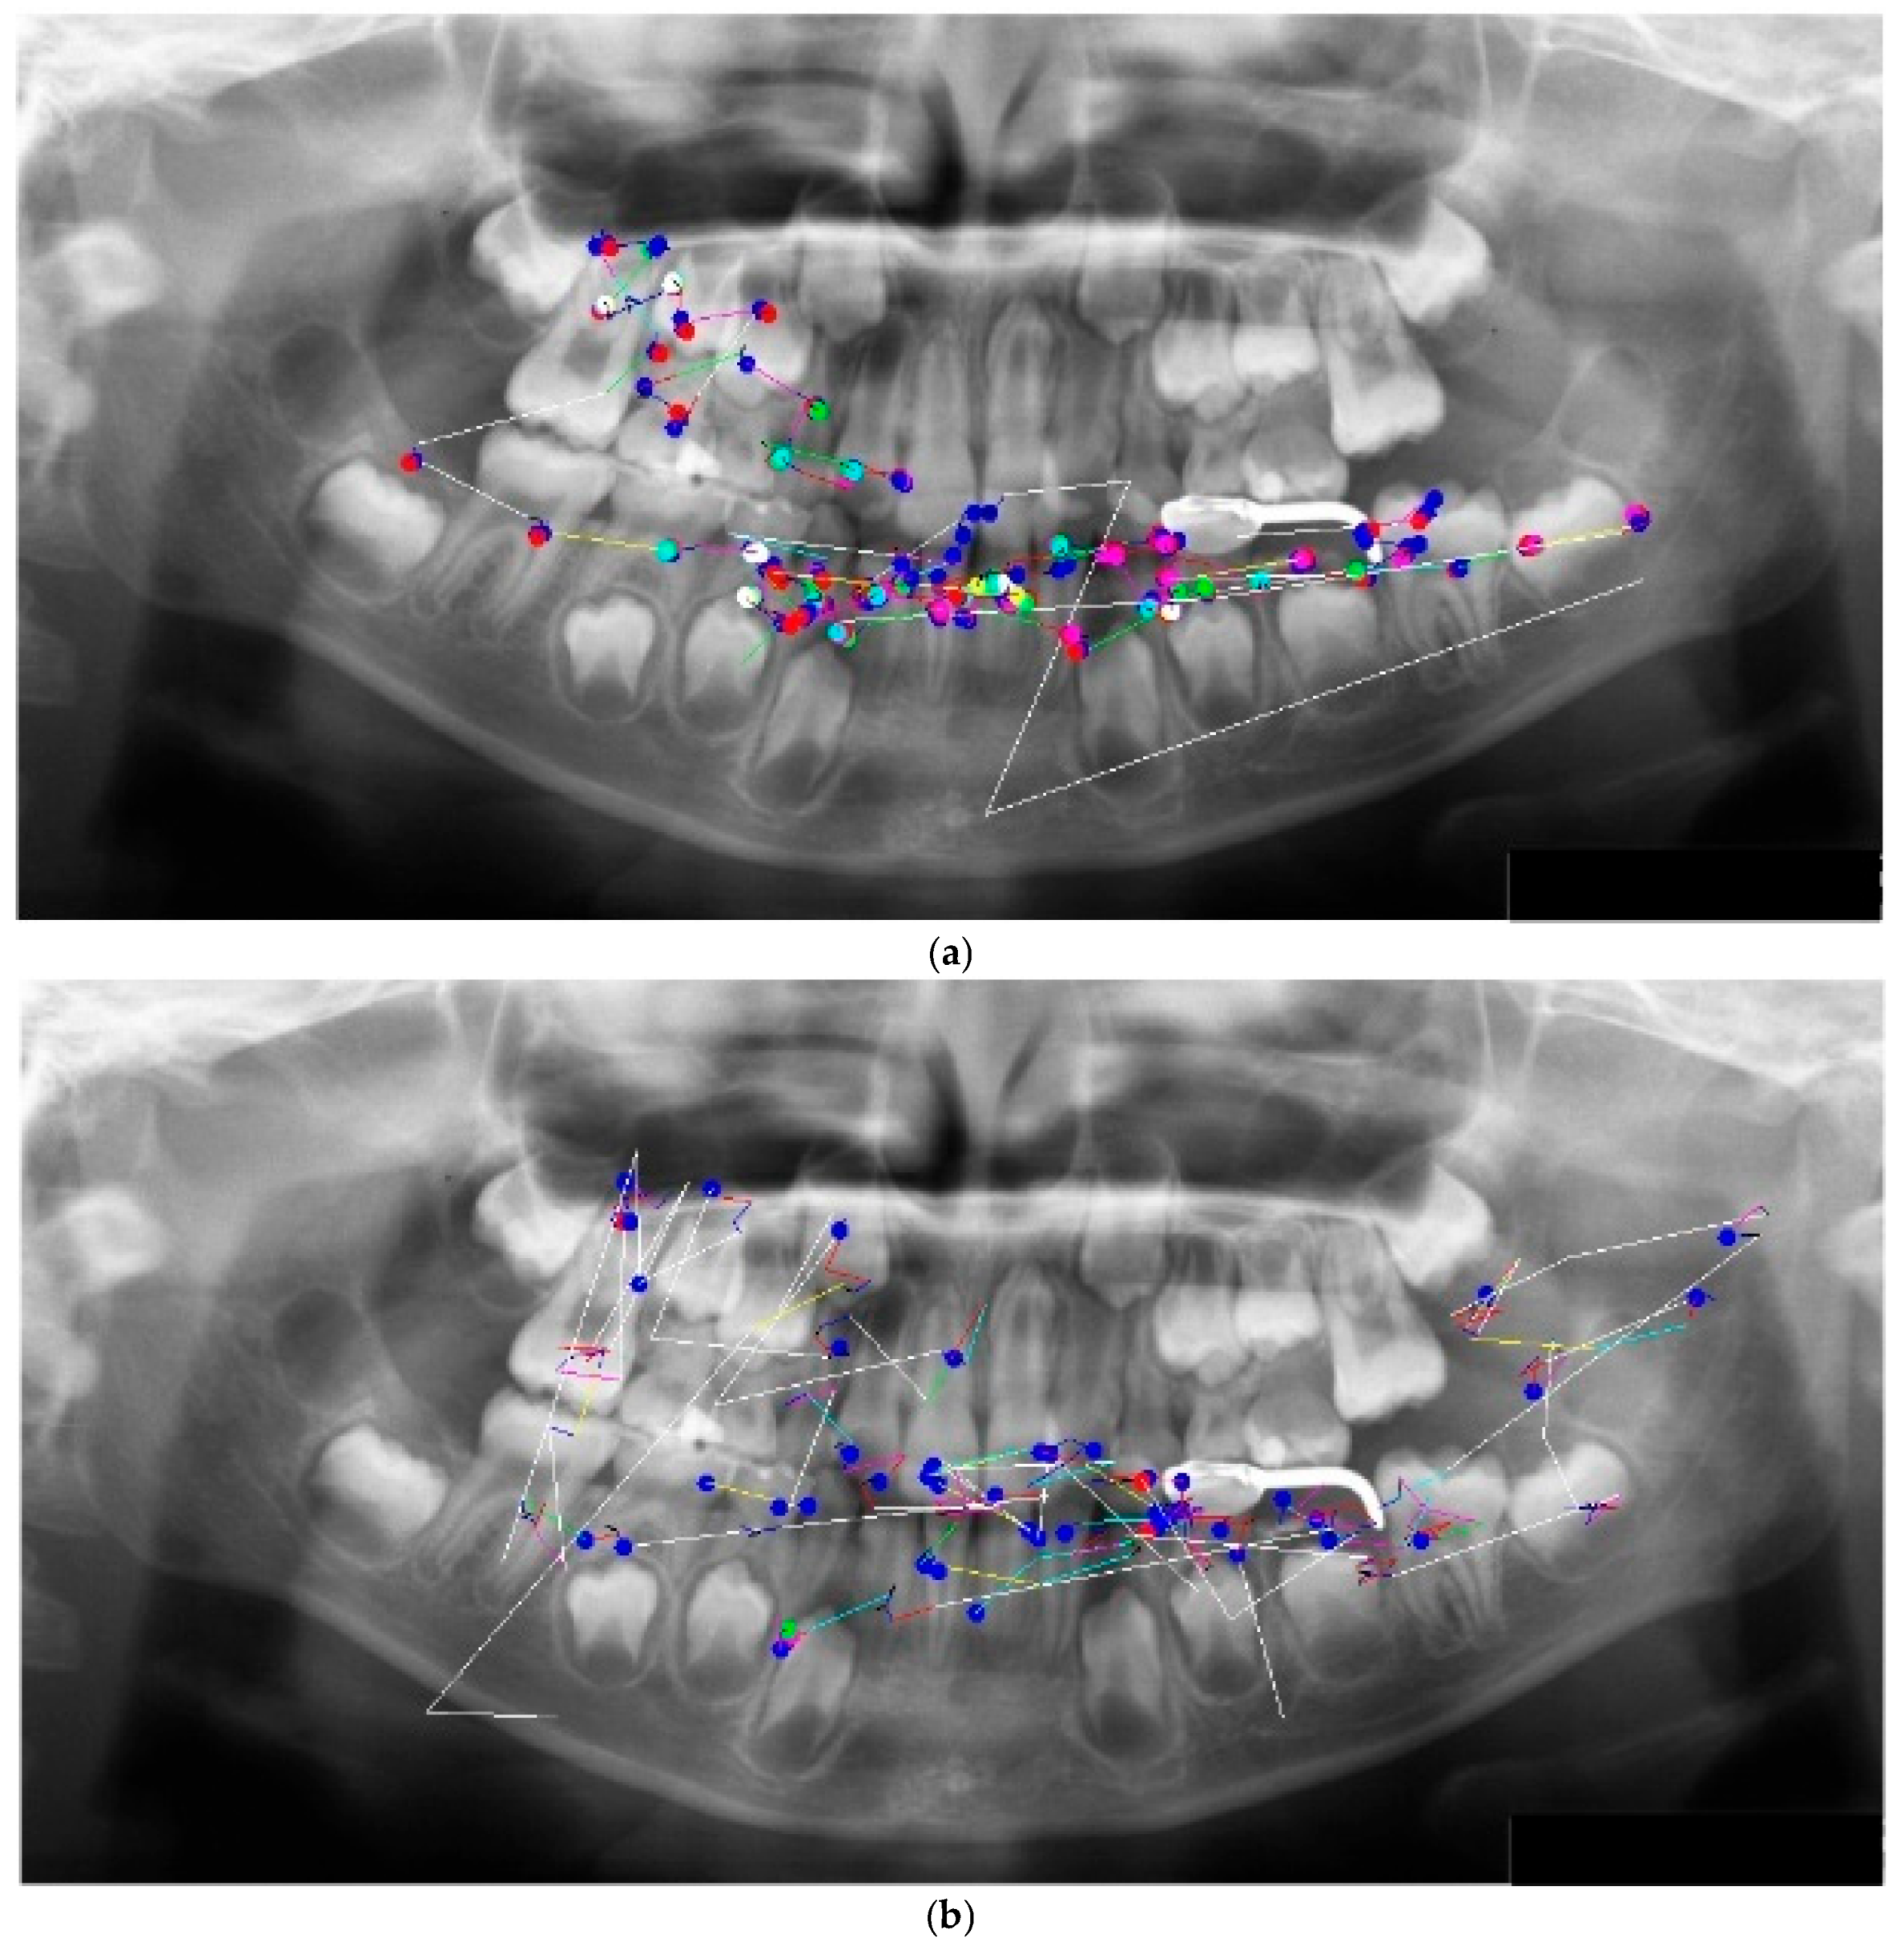
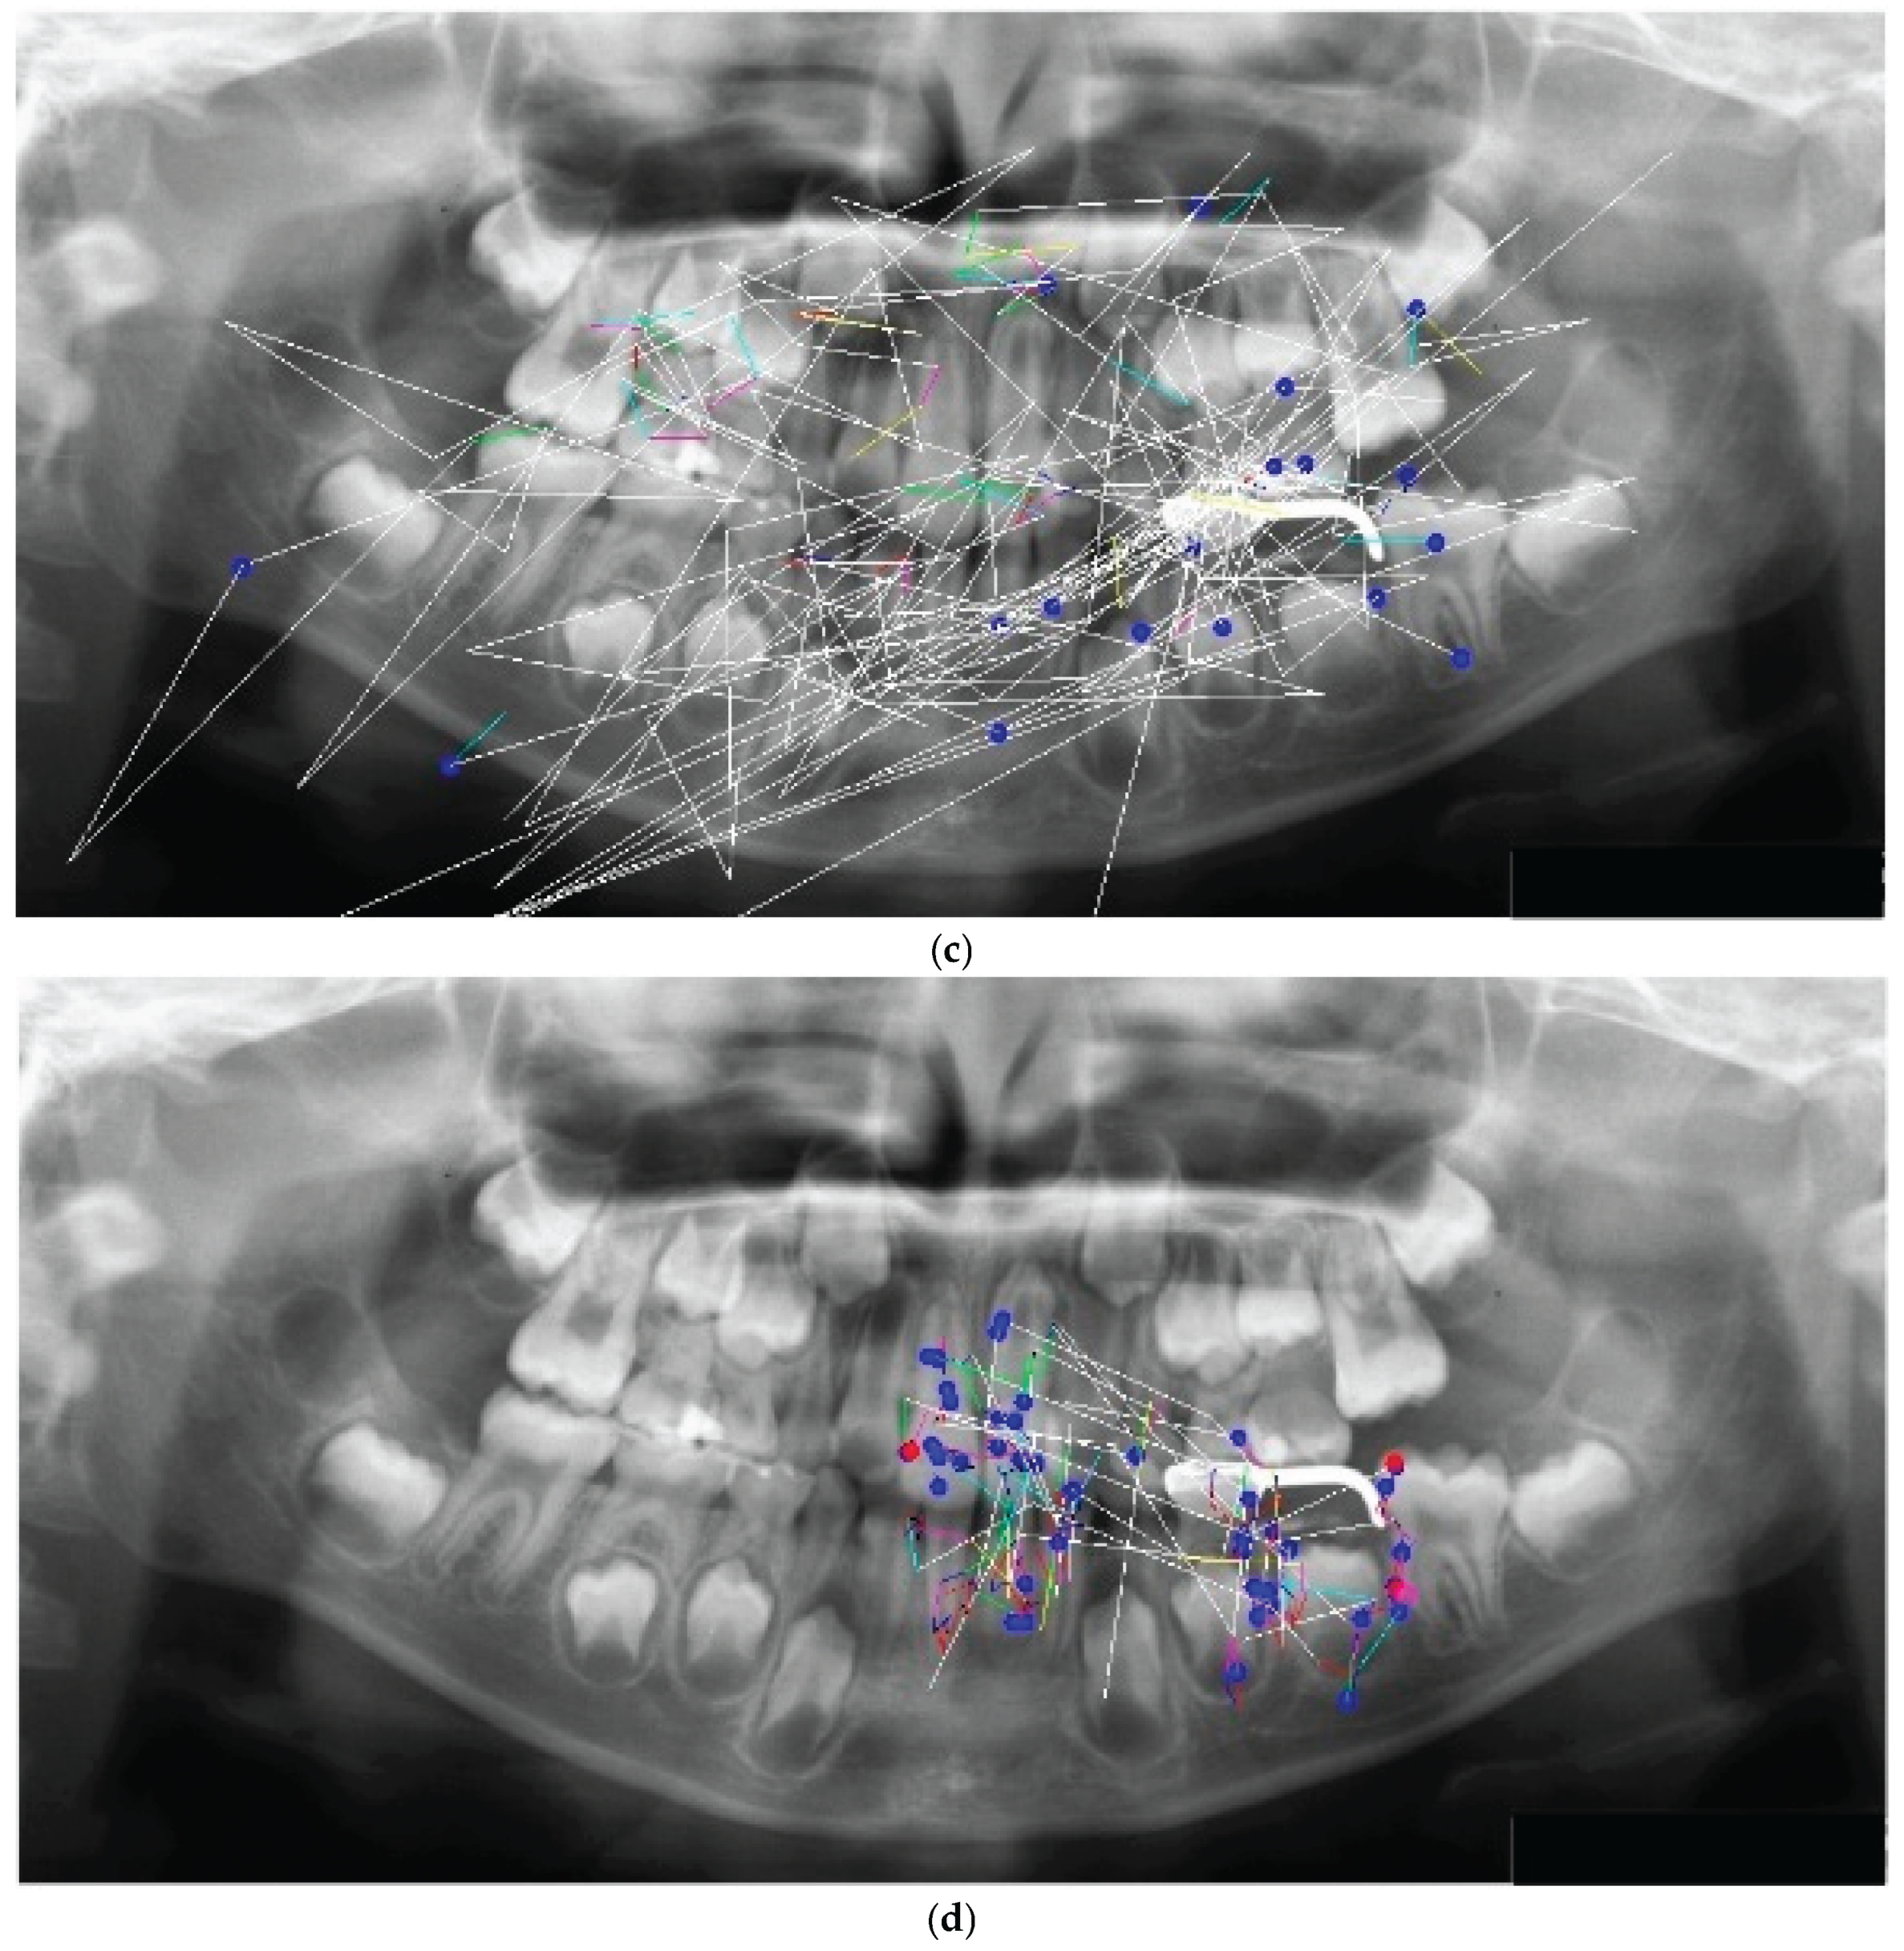

Table 1.
Distribution of scores by eye movement pattern.
| R (n=16) | L (n=24) | S (n=9) | C (n=5) | |
| High performance (%) | 15 (93.8)** | 5 (20.8) | 1 (11.1) | 0 (0.0) |
| Low performance (%) | 1 (6.2) | 19 (79.2)** | 8 (88.9) | 5 (100.0) |
**p < 0.001 (chi-square test) R: clockwise (right rotation), L: counterclockwise (left rotation), S: mainly saccades, C: restricted eye movement.
Table 2.
Test image interpretation results by eye movement pattern.
| R (n=16) | L (n=24) | S (n=9) | C (n=5) | p* | |||||||||||||
|---|---|---|---|---|---|---|---|---|---|---|---|---|---|---|---|---|---|
| Correct (%) |
Incorrect (%) |
Correct (%) |
Incorrect (%) |
Correct (%) |
Incorrect (%) |
Correct (%) |
Incorrect (%) |
||||||||||
| Supernumerary teeth | 3 | (18.8) | 13 | (81.2) | 2 | (8.3) | 22 | (91.7) | 1 | (11.1) | 8 | (88.9) | 0 | (0.0) | 5 | (100.0) | 0.62 |
| Space maintainer | 16 | (100.0) | 0 | (0.0) | 23 | (95.8) | 1 | (4.2) | 9 | (100.0) | 0 | (0.0) | 5 | (100.0) | 0 | (0.0) | 0.74 |
| Restoration | 12 | (75.0) | 4 | (25.0) | 5 | (20.8) | 19 | (79.2) | 1 | (11.1) | 8 | (88.9) | 0 | 0.0 | 5 | (100.0) | <0.001 |
| Dental age | 15 | (93.8) | 1 | (6.2) | 8 | (33.3) | 16 | (66.7) | 2 | (22.2) | 7 | (77.8) | 2 | (40.0) | 3 | (60.0) | <0.001 |
| Congenital defect | 10 | (62.5) | 6 | (37.5) | 2 | (8.3) | 22 | (91.7) | 0 | (0.0) | 9 | (100.0) | 0 | (0.0) | 5 | (100.0) | <0.001 |
| Interpretation score (points)† | Mean (SD) | Mean (SD) | Mean (SD) | Mean (SD) | |||||||||||||
| 3.50 (0.63) a | 1.67 (0.76) b | 1.44 (0.73) b | 1.40 (0.55) b | <0.001 | |||||||||||||
R: clockwise (right rotation), L: counterclockwise (left rotation), S: mainly saccades, C: restricted visual scanning, SD: standard deviation *Chi-square test. †One-way analysis of variance and Tukey–Kramer post-hoc test. Superscript letters indicate differences among the four groups within each row. Group means with different superscript letters are significantly different according to the post-hoc comparison. Reading scores were significantly different between the R group and the L, S, and C groups.
Table 3.
Eye movement measures among the four groups.
| R (n=16) | L (n=24) | S (n=9) | C (n=5) | ||||||
|---|---|---|---|---|---|---|---|---|---|
| mean | SD | mean | SD | Mean | SD | mean | SD | p | |
| Total reading time (s) | 85.3 | (28.5) | 109.8 | (48.4) | 78.6 | (51.6) | 90.9 | (64.4) | 0.231 |
| Average gaze velocity (deg/s)* | 50.6 | (56.3)a | 45.3 | (26.4)a | 89.7 | (28.9)b | 24.4 | (7.9)a | 0.010 |
| Mean fixation duration (ms)* | 50.2 | (13.2)a | 50.3 | (15.5)a | 33.8 | (0.6)b | 53.9 | (15.6)a | 0.013 |
| Number of fixations (n)* | 299.4 | (148.6)ab | 416.3 | (305.4)a | 94.8 | (62.0)b | 397.2 | (345.0)ab | 0.013 |
| Total fixation duration (s)* | 16.4 | (10.9)ab | 23.3 | (20.5)a | 3.2 | (2.2)b | 25.5 | (28.0)ab | 0.026 |
| Pupil area (πdot²) | 46.9 | (8.6) | 51.5 | (9.2) | 49 | (11.9) | 54.4 | (14.2) | 0.381 |
| Pupil area during fixation (πdot²) | 47.1 | (8.4) | 51.2 | (9.0) | 50.2 | (12.1) | 53.1 | (15.7) | 0.549 |
| Spontaneous blink (times)* | 66.8 | (45.7)a | 92.7 | (59.7)ab | 119.2 | (75.4)b | 41.6 | (33.4)ab | 0.043 |
| Voluntary blink (times)† | 1.4 | (1.7)a | 1.9 | (2.4)ab | 5.1 | (5.6)b | 2.2 | (3.5)ab | 0.021 |
| Rapid serial blink (times)* | 8.8 | (8.7)a | 14.4 | (11.0)a | 21.7 | (16.8)b | 5.6 | (4.7)a | 0.024 |
R: clockwise (right rotation); L: counterclockwise (left rotation); S: mainly saccades; C: restricted gaze pattern; SD: standard deviation. * Variables analyzed with ANOVA (Welch’s or standard as appropriate). Spontaneous blink was analyzed with standard ANOVA; all other variables were analyzed with Welch’s ANOVA. † Variable analyzed with the Kruskal–Wallis test followed by post-hoc comparisons (Dunnett). Superscript letters indicate group differences within each row. Values sharing the same superscript letter denote no significant differences, whereas values with different superscript letters indicate significant differences according to the post-hoc test.
Table 4.
Saccade analysis by eye movement pattern.
| R (n=16) | L (n=24) | S (n=9) | C (n=5) | p | |||||
|---|---|---|---|---|---|---|---|---|---|
| Mean | (SD) | Mean | (SD) | Mean | (SD) | Mean | (SD) | ||
| Total amplitude (deg) | 4290.6 | (3224) | 5115.9 | (3486) | 5889.7 | (3801) | 2069.2 | (1474) | 0.198 |
| Average saccade amplitude (deg)* | 2.4 | (2.6)a | 2.3 | (1.7)a | 5.2 | (3.7)b | 1.1 | (0.5)a | 0.008 |
| Number of Saccades (n/min)* | 396.6 | (193.3)a | 345.9 | (209.1)a | 784.0 | (330.9)b | 288.4 | (132.1)a | <0.001 |
R: clockwise (right rotation), L: counterclockwise (left rotation), S: mainly saccades, C: restricted visual scanning, SD: standard deviation *Average saccade amplitude: Welch’s ANOVA; Number of saccades: standard ANOVA. Superscript letters indicate differences among the four groups in each row. Values with the same superscript letter indicate no significant differences in group means, whereas values with different superscript letters indicate significant differences in group means, according to the post-hoc comparison.
Table 5.
Ordinal logistic regression analysis of eye movement and pupillary measures.
| Variable | Coefficient (coef) | Standard Error (SE) | z | p | 95% CI | |
| [0.025] | [0.975] | |||||
| Total observation time (ms) | 0.0124 | 0.012 | 1.015 | 0.31 | -0.012 | 0.036 |
| Average amplitude (deg) | 0.0202 | 0.012 | 1.759 | 0.079 | -0.002 | 0.043 |
| Mean fixation duration (ms) | 0.0102 | 0.027 | 0.376 | 0.707 | -0.043 | 0.063 |
| Fixation count (number) | -0.00002 | 0.002 | -0.009 | 0.993 | -0.004 | 0.004 |
| Pupil area(πdot2) | -0.6252 | 0.218 | -2.872 | 0.004 | -1.052 | -0.199 |
| Fixation pupil area(πdot2) | 0.5103 | 0.208 | 2.45 | 0.014 | 0.102 | 0.918 |
| voluntary blink (times) | -0.3127 | 0.148 | -2.107 | 0.035 | -0.604 | -0.022 |
| Rapid serial blink (times) | -0.1266 | 0.043 | -2.952 | 0.003 | -0.211 | -0.043 |
Results of the ordinal logistic regression analysis of eye movement and pupillary measures. The table presents regression coefficients (coef), standard errors (SE), z-values, and corresponding p-values with 95% confidence intervals (CI). Significant predictors of the outcome variable included pupil area (p = 0.004), fixation pupil area (p = 0.014), voluntary blink (p = 0.035), and rapid serial blink (p = 0.003).
Table 6.
Mean (±SD) of outcome across time bins and LMM results.
| Time bin (s) | Mean | SD | p | Mean | SD | p |
|---|---|---|---|---|---|---|
| 0–60 | 1.90 | 0.88 | <0.001 | 1.90 | 0.88 | <0.001 |
| 61–120 | 2.44 | 1.24 | 0.022 | 2.44 | 1.24 | 0.022 |
| 121–180 | 1.60 | 0.70 | 0.463 | 1.60 | 0.70 | 0.463 |
| 181+ | 2.00 | 1.41 | 0.900 | 2.00 | 1.41 | 0.900 |
Mean values and standard deviations (SD) of the outcome variable across time bins (0–60 s, 61–120 s, 121–180 s, and ≥181 s).
Table 7.
Distribution of reading times across eye movement patterns.
| Time | R | L | S | C |
|---|---|---|---|---|
| 0-60 s | 3 | 2 | 3 | 2 |
| 61-120 s | 13* | 13 | 4 | 1 |
| 121-180 s | 0* | 8* | 0 | 2 |
| 181+ s | 0 | 1 | 1 | 0 |
*p < 0.01 (chi-square test) R: clockwise (right rotation), L: counterclockwise (left rotation), S: mainly saccades, C: restricted eye movement.
Disclaimer/Publisher’s Note: The statements, opinions and data contained in all publications are solely those of the individual author(s) and contributor(s) and not of MDPI and/or the editor(s). MDPI and/or the editor(s) disclaim responsibility for any injury to people or property resulting from any ideas, methods, instructions or products referred to in the content. |
© 2025 by the authors. Licensee MDPI, Basel, Switzerland. This article is an open access article distributed under the terms and conditions of the Creative Commons Attribution (CC BY) license (http://creativecommons.org/licenses/by/4.0/).
Copyright: This open access article is published under a Creative Commons CC BY 4.0 license, which permit the free download, distribution, and reuse, provided that the author and preprint are cited in any reuse.


