Submitted:
25 November 2025
Posted:
27 November 2025
You are already at the latest version
Abstract
Advances in computed tomography (CT) technology have made it possible to perform non-invasive imaging with detailed characterization and quantification of the myocardium.
Cardiac CT (CCT) has emerged as a technique useful for providing deeper insights into cardiovascular diseases, as a valuable alternative when cardiac magnetic resonance imaging or echocardiography are contraindicated, technically unfeasible, inconclusive, or non-diagnostic. Cardiac tissue characterization by the advances in CT technology lead to differentiate myocardial tissue types with high resolution. CCT allows the assessment of tissue properties such as myocardial perfusion, fibrosis and fat infiltration, which are critical in diagnosing ischemic heart disease, microvascular obstruction, heart failure, cardiomyopathies, and other cardiac conditions 1. Thin surgical complications and prosthesis studies are possible through high resolution scanners, allowing to detect HALT, pannus, thrombosis, endocarditis, abscesses and other characterizations. The use of contrast agents, along with advanced imaging techniques such as photon-counting CT, allows for high-resolution imaging of tissue heterogeneity, making it a valuable tool for non-invasive evaluation. Dual-energy computed tomography (DECT) has emerged as a transformative tool in the non-invasive assessment of cardiac tissue, enabling a more precise characterization of myocardial structures and pathologies. Employing two distinct energy levels, it provide unique advantages in tissue differentiation through the energy-dependent attenuation of various tissues, allowing for better delineation of tissue properties such as fat, fibrosis, calcification, and water content, improving also quantitative imaging and iodine mapping.
Furthermore, new methodologies like CT-based tissue characterization models and artificial intelligence algorithms are enhancing the accuracy of differentiating normal and pathological cardiac tissues. The integration of cardiac CT with other imaging modalities, such as cardiac magnetic resonance (CMR), is also highlighted as a promising approach for comprehensive cardiac tissue assessment in several clinical settings.
[*] Aim and scope of the Special Issue:
This paper reviews the current techniques for cardiac tissue characterization using CT, explores the role of texture analysis, and discusses the challenges in achieving precise tissue differentiation, outlining the current applications and future perspective of cardiac CT in myocardial tissue characterization.
Keywords:
cardiac CT
; tissue characterization
; advances technologies
; cardiac imaging
Manuscript
Cardiac magnetic resonance (CMR) represents the gold standard tool for the assessment of cardiac volumes and function and for tissue characterization [1,2]. The presence and extent of late gadolinum enhancement (LGE) after gadolinium-based contrast agent administration can distinguish ischemic and non-ischemic fibrosis, providing additional diagnostic and prognostic information [3,4]. Based upon specific LGE patterns some of the non- ischaemic cardiomyopathies can be further differentiated.
Previously, tissue characterization was performed through T1-T2 weighted images and late enhancement images. In the last decade, quantitative assessment of native T1 (pre-contrast longitudinal relaxation time), post-contrast T1 and T2 (transversal relaxation time) by a pixel-wise color-coded mapping has contributed to add knowledge insight with positive influence of diagnostic accuracy and prognosis assessment of cardiomyopathies [4,5]. Through the pre- and post-contrast T1 mapping, along with the knowledge of blood hematocrit, a direct measure of the extracellular volume (ECV) is obtained, representing a quantification of the relative expansion of the cardiac extracellular matrix [6]. Estimation of the ECV requires measurement of myocardial and blood T1 before and after administration of contrast agents as well as the patient’s haematocrit value according to the formula:
This approach allows for the estimation of the extent of the interstitial space, defined as the myocardial space remaining after exclusion of the intracellular and intravascular compartments. Variations in ECV generally reflect alterations in the interstitial volume fraction, serving as a surrogate marker of interstitial remodelling and fibrosis. Consequently, its application has proven highly valuable in elucidating the pathophysiology of various myocardial diseases.
However, CMR can be can be affected by motion artefacts (breathold incompetence or inefficient gating), device artefact or contraindication, and low spatial resolution (acquisition thickness mean 6-8 mm, possible 4mm with worse Signal-To-Noise Ratio, SNR). It also may be not feasible in patients with severe claustrophobia and some devices.
Cardiac computed tomography (CCT) has emerged as a technique useful for providing deeper insights into cardiovascular diseases, as a valuable alternative when cardiac magnetic resonance imaging or echocardiography are contraindicated, technically unfeasible, inconclusive, or non-diagnostic. Cardiac tissue characterization by the advances in CT technology lead to differentiate myocardial tissue types with high resolution. CCT allows the assessment of tissue properties such as myocardial perfusion, fibrosis and fat infiltration, which are critical in diagnosing ischemic heart disease, microvascular obstruction, heart failure, cardiomyopathies, and other cardiac conditions [1].
Late Iodine Enhancement in CT Scan
Cardiac CT enables the use of Late Iodine Enhancement (LIE) imaging for the evaluation of focal of diffuse replacement fibrosis, contextually at coronary CT evaluation, pre-procedural CT planning or perfusion CT studies [7,8]. Recent studies highlight the high accuracy of both late enhancement imaging and ECV quantification with CT when compared to cardiac MRI [1,9]. CT imaging is faster and more widely available, other than more useful in the setting of just indicated CT scan for other reason.
Since both gadolinium and iodinated contrast media share similar pharmacokinetic properties [10], the approach of late gadolinium enhancement can be translated also to cardiac CT. An issue remains the lower contrast-to-noise (CNR) in comparison to CMR. To resolve, a lower voltage dose could be an option for single energy but suboptimal for lower spatial and temporal resolution. Dual–energy computed tomography (DECT) instead allow the reconstruction of monoenergetic images at lower energy levels and with direct quantification of iodine concentration through two-material decomposition technique, obtaining a iodine map. Late enhancement can be detected as hyperintensity of signal on both energy methods and as higher iodine concentration at dual-energy method (Figure 1).
For late enhancement and ECV, an extensive multitude of protocols of contrast injection and acquisition timing are reported in literature, with 50-to-100 mL of contrast (or weight-dependent volumes of 1.4–1.8 mL/kg of contrast media, especially in obese patients) and 3-to-12 minutes of delay for acquisition [11,12]. For LIE, our group suggest an amount of the minimum contrast injection of 100 mL of iodine contrast, with temporal delay of 15 minutes from the first injection, for higher signal to-noise ratio and accurate image quality of late enhancement on tissues studied by DECT. Focal late enhancement can be detected easier with higher delay, for the increasing differences between normal myocardium and fibrosis. Instead, for ECV evaluation a lower delay is usefull for higher attenuation value at higher concentration of iodine, both in blood and myocardium.
A meta-analysis [13] of fourteen studies (526 patients and 5758 myocardial segments) assessed the diagnostic accuracy of LIE in CCT using CMR-LGE the gold reference standard. In this setting, LIE demonstrates excellent diagnostic accuracy (per-patient sensitivity and specificity of 0.96 and 0.95; per-segment values of 0.86 and 0.98, respectively) and strong diagnostic performance for confirming and excluding LGE at the patient level (positive likelihood ratio +LR of 20.97, negative likelihood ratio −LR of 0.04). At the segment level, the +LR was 55.08 and the −LR 0.14, implying a low residual false-negative probability (approximately 4%) given a 24% pretest likelihood of LGE [13]. Subgroup analysis revealed that DECT improved diagnostic performance in respect to single-energy CT, especially for segment-level sensitivity (0.93 vs. 0.83), owing to better contrast-to-noise ratio and spectral image reconstruction. These findings, together with photon-counting CT advancements, suggest room for further improvement.
While LGE-CMR remains the gold standard for non-invasive myocardial characterization, CT-LIE represents a valid alternative, particularly when CMR is unavailable, infeasible, or contraindicated. It allows simultaneous evaluation of coronary arteries and myocardium, offering a comprehensive assessment, especially in CT coronary angiography or emergency settings (e.g., acute chest pain with mild troponin elevation). CT-LIE is also valuable in patients with non-MRI-compatible devices or poor CMR image quality, and it’s emerging for arrhythmia mapping, arrhythmia ablation or stereotactic radioablation plannings.
Cardiac CT ECV
The contrast volume administered for ECV evaluation in CT is usually at least 1.5 mL/kg, greater than that required for coronary imaging. In literature 50-to-100 mL of contrast or weight-dependent volumes of 1.4–1.8 mL/kg of contrast media, especially in obese patients, are suggested. A comprehensive overview of CT and contrast-media protocols for late iodine enhancement is just available in other sources [12].
Iodinated contrast demonstrates behaviour comparable to gadolinium, tending to accumulate in myocardial regions with an expanded extracellular space, such as those affected by diffuse fibrosis or amyloid infiltration.
CT-derived ECV (using single-energy or dual-energy delayed CT scans) demonstrated excellent correlation with CMR-derived ECV as reference standard (mean difference of less than 1%9) with known correlation to histologic fibrosis findings in front of only a small increase in radiation dose [9,16]. A metanalysis of 383 patients demonstrated an excellent correlation between CT-derived and CMR-derived ECV (0.90 [95%CI:0.86-0.95]), with higher correlation for dual-energy CT DECT in comparison with single-energy [17].
Indeed, ECV was in literature calculated both with single energy or dual-energy CT scanners.
The single-energy CT protocol per ECV consists of three steps. A basal CT scan (first step) to obtain baseline pre-contrast blood and myocardial attenuation in Hounsfield units (HU), then the contrast administration and a delay (second step) leading the contrast to distribute into the blood. A repeat scan (third step) remeasures both blood and myocardial attenuation. The ratio of the change in blood and myocardial attenuation (DHU) represents the contrast agent partition coefficient. If the blood volume of distribution is substituted in “1 - venous haematocrit” (obtained prior to imaging), the myocardial extracellular volume, ECV-CT can be obtained reflecting the myocardial interstitium, as the formula:
ECV-CT (single-energy)= ¼ (1 - Hematocrit) x (Delta HU tissue/Delta HU blood).
It’s suggested to draw polygonal wide ROI to include the greatest area of myocardial septum but avoiding the endocardial edge and therefore partial voluming, and a wide ROI for the blood pool away from papillary muscles (Figure 2).
Single-energy timing was studied from different studies and in literature varies from 3, 5, 7 and 10 minutes [11]. At 5 minutes scan, the SNR was significantly higher and the ECV-CT was strongly correlated with ECV-CMR rather than 15 minute scans. No bias was detected at 5 minutes post contrast, unlike a slight bias at 15 minutes maybe related to the loss in signal due to overall lower iodine concentrations 15. Contrary, other evidences report the timing had no impact on the degree of bias relative to CMR, making the shorter 5-minute time interval much more clinically executable [17].
Despite its advantages, single-energy CT for ECV measurement has limitations, including a low SNR and the need for higher contrast doses. Dual-energy CT can address some of these issues by reducing contrast requirements and utilizing varying tube potentials 18.
Dual-energy is superior in comparison to single energy method both for late enhancement and ECV calculation, for a less susceptibility to the mis-registration scans caused by motion artifacts, breath-hold issues, manual ROIs or cardiac phases (Figure 3). With this method, the quantification of ECV can be performed directly on iodine maps obtained on late enhancement scan, without the necessity of a non contrast scan, in a simple way, through the equation:
ECV-CT (dual-energy)= (1 - Hematocrit) x (Iodine tissue/Iodine blood).
The software for the visualization and automatic quantification of ECV is available on many CT workstations and it provides an American Heart Association 17-segment polar map, with the capability of percentage detection point by point and per-segment with ROIs (Figure 3). No agreement about the most accurate software has been reached yet.
Dual-energy timing is suggested in literature from 5 to 12 minutes from contrast injection, with prospective (80-90 Kv) or restrospective (140-150 Kv) ECG-triggering acquisitions12. Recent evidence has shown 3-min delay as improving normal myocardium ECV quantification or diffuse expansion of interstizium, related to higher myocardium contrast compared to late enhancement scans. A 5-min delay for late acquisition may instead enhance the scar visualization, allowing robust ECV-CT quantification even with lower tissue contrast of the myocardium [12].
ECV quantification with a dual-source photon-counting detector CT has been reported at 5 min acquired at 120 kV, showing a high correlation with single-energy-based ECV measurements [25].
Small amount of contrast media may not be sufficient for ECV calculation due to the low contrast-to-noise ratio of late enhancement scans, mainly depending on the timing of the late enhancement scan and the given total amount of contrast. The amount and strategy of contrast administration for CT protocols including a late enhancement acquisition varying between studies, referring on late enhancement study [12].
Late enhancement imaging demonstrated improved diagnostic performance when higher volume of contrast media was administered, as an adequate contrast-to-noise ratio represents a critical prerequisite for precise ECV quantification. Evidence from current literature indicates that either fixed contrast volumes of 50–100 mL or weight-adjusted doses ranging from 1.4 to 1.8 mL/kg are generally sufficient to ensure image quality appropriate for reliable ECV assessment [12]. Our suggestion of 100 ml of contrast dose can be useful, feasible and effective for ECV calculation too, leading the late possibile to acquire also LIE in one single scan.
Dual-energy CT techniques offer enhanced image quality, reduced artifacts, and lower levels of radiation.
The radiation dose in literate is assessed as 1.98 ± 0.16 mSv for the late enhancement scan assessed with a single-energy approach [19] and a dose ranging from 1.89 mSv to 4.8 mSv with dual-energy CT [20]. The novel Photon-counting computed tomography (PCCT) scanner allowed for a low effective radiation dose achieved as 2.07 mSv ± 0.16 mSv [21].
PCCT is a newly introduced CT detector technology. PCCT detectors, composed of semiconductor detector materials, direct detection of photons, enabling them to be counted (i.e., photon counting) and to be separated into their specific energy levels, while eliminating noise at the electronic level. PCCT double spatial resolution, reduce electronic noise and artifacts, decrease the X-ray dose and amount of contrast media, and allow simultaneous multi-energy acquisition to characterize myocardial tissue and/or atherosclerotic coronary plaques, with quantitative capabilities to estimate contrast media concentrations [22,23].
Extracellular volume quantification with PCCT required iodine map images, as for dual-energy scanners. The American Heart Association 17-segment polar map leas the calculation of ECV in myocardial layers: subendocardial (radial percent percentage ranges 10 to 50%), midmyocardial (inner 25% to outer 25%) and epicardial (50% to outer 10%) [24].
The calculation of ECV using iodine maps obtained from late iodine enhancement cardiac PCCT images is both feasible and accurate even at low radiation doses.
ECV in Aortic Stenosis and TAVI
CCT has the potential to become the first line modality for the identification of cardiac amyloidosis in patients with aortic stenosis, just directed to CT scan for aortic anatomy study and undergoing transcatheter aortic valve replacement (TAVI) planning.
Beyond its potential to stratify risk in patients with aortic stenosis (AS) in terms of functional status and post-treatment recovery, ECV-CT may hold particular relevance in AS owing to the concomitant presence of transthyretin amyloidosis cardiomyopathy (ATTR-CM) in approximately 10% of cases, a condition characterized by substantial elevations in ECV [25]. ECV-CT was demonstrated to be reliably associated to amyloid, as the measured ECV-CT tracks the degree of infiltration [26]. ECV-CT was also revealed higher in amyloid patients with cardiac involvement than aortic stenosis and higher in ATTR rather than AL amyloidosis as for ECV in CMR [15].
An high diagnostic performance was shown by assessing left ventricle (LV) and left atrial Global Longitudinal Strain, relative apical longitudinal strain, and LV mass index, with the potential role of ECV still to be demonstrated [27].
Furthermore, ECV-CT showed prognostic predictive value in the setting of patients undergoing TAVI or surgical valve replacement. ECV measured at TAVI planning CCT scan predicts the composite endpoint (heart failure hospitalization or death) in high-risk severe AS patients [28].
In the setting of low-flow low-gradient aortic valve stenosis who underwent TAVI, despite no cardiac amyloidosis was excluded, an increase value of ECV was associated with increase incidence in death plus heart failure hospitalization [29] or an higher risk of adverse clinical outcomes after TAVI, as a useful non-invasive prognostic marker [29].
Quantification of ECV-CT correlated also with severe aortic stenosis functional status, markers of left ventricular decompensation (NYHA functional class, left atrial volume, staging classification of aortic stenosis and lower LVEF), and predicted the 12-months composite adverse clinical outcomes [30].
Implementation of this novel technique might aid in the risk stratification process before aortic valve interventions, in particular in the setting of suspect amyloidosis. Nevertheless, the overall population of the available studies was low, and larger prospective investigations are required to further assess the accuracy as well as the diagnostic and prognostic value of CT-derived ECV.
ECV in Cardiomyopathies, Inflammation and Cardiotoxicity
Cardiac CT allows for the evaluation of anatomical or functional cardiac abnormalities that could suspect cardiomyopathies.
Recently, Lee et al. [14] demonstrated that mean ECV-CT values for patients with hypertrophic cardiomyopathy (HCM) were significantly higher than in healthy subjects on dual-energy or delayed phase CCT. CCT proves also high performance in the study of HCM, based on anatomical characteristics (asymmetric LV hypertrophy, cripts, elongation of anterior mitral leaflet, apical aneurysm, apical or mid-ventricular obstructions), LV systolic function on functional analysis, extent of myocardial fibrosis with late iodine enhancement LIE and ECV measurement [31,32].
Left ventricular non compaction (LVNC) can be also studied by trabeculations identification and CMR criteria extended to CT, other than LV systolic dysfunction and LV thrombus. In CT, the ratio of non compacted to compact (NC:C) myocardium superior or equal to 2.3 in diastolic phase was demonstrated to be feasible and effective in the diagnosis of LVNC, with 88% sensitivity and 97% specificity 33.
Evaluation of ECV on left ventricle myocardium by CT was also demonstrated to be useful for predicting MACE in patients with Dilated Cardiomyopathy, with a cut-off of 32.26%, although in a small cohort of 70 patients [34].
In the setting of acute chest pain and elevated cardiac biomarkers, cardiac CT may facilitate the differentiation of myocarditis and acute coronary syndrome by the characteristic midwall or subepicardial delayed enhancement and the absence of significant ischemic heart disease [35]. Sia C.H. et al. [36] demonstrated higher value of CT-derived perivascular adipose tissue and epicardial adipose tissue attenuations in post-myocardial infarction patients (205 pts) compared with stable ischemic patients (205 pts), advising a threshold of −70 HU as a potential cut-off value for identifying inflamed epicardial tissue.
Furthermore, increased RCA peri-coronary adipose tissue (PCAT) attenuation only was associated with the presence of myocardial ischemia as assessed by FFR-CT (cut-off, + 0.75, good correlation to invasive FFR), with no significance between ischemia and PCAT volume, epicardial adipose tissue (EAT) or paracardial adipose tissue (PAT) [37].
Basal CT scan and post-contrast scan also allow to detect fat infiltration, for the detection of suspected arrhythmogenic cardiomyopathy (AC), fatty metaplasia in ischemic heart disease or septal lipomatosis [31]. Cardiac CT with the aid of functional study plays also a critical role in identifying key structural abnormalities, such as right ventricular dilation, systolic dysfunction, and focal bulging.
Hong et al. [7] reported the novel use of dual-energy CT to characterize myocardial tissue changes in an animal model of doxorubicin induced cardiotoxicity [38]. Interestingly, unlike on CMR and histologic examination, the ECV-CT fraction did not further increase from 12 to 16 weeks from treatment.
A small pilot study proposes an automatic algorithm based on native CCT images to identify and quantify myocardial fibrosis, showing high correlations with CMR parameters and offering a faster and more cost-effective alternative for cardiotoxicity diagnosis in HER2-positive breast cancer patients [39]. Incorporating ECV measurements into LV ejection fraction (LVEF) assessment may also aid in detecting myocardial tissue injury beyond the diagnostic window captured by troponin levels. The clinical utility of this additional computed tomographic imaging modality, as well as its potential integration into current imaging protocols for oncologic patients, remains to be established. ECV quantification could potentially be performed concurrently with imaging studies acquired for cancer staging, or in the future, alongside LVEF surveillance using CT, which is not currently implemented. The future of dual-energy technique in cardio-oncology will depend on its ability to detect myocardial injury from potentially cardiotoxic agents early before clinically manifested changes [40].
CT Performance in Prosthesis and Post-Surgical Complications
Thin surgical complications and prosthesis studies are possible through high resolution scanners, allowing to detect Hypo-Attenuated Leaflet Thickening (HALT), pannus, thrombosis, endocarditis, abscesses, pseudoaneurysm and other characterizations or post-surgical complications [41].
LV pseudoaneurysm, resulting from rupture of the LV free wall and contained by an overlying adherent pericardium or scar tissue, can be accurely studied with multimodality imaging, but better analyzed by CT tissue characterization with higher spatial resolution [41].
The accurate CCT evaluation of prosthetic heart valves helps to differentiate thrombosis from pannus formation in a multimodality imaging study with echocardiography (Figure 4). At CT, thrombus typically showing attenuation values below 30 HU, while pannus above 100 HU.
HALT (Hypo-Attenuated Leaflet Thickening) is a CCT finding typically observed in transcatheter bioprosthetic valves, either surgical or transcatheter (TAVI/TAVR). HALT CT characteristics consists in presence of focal or diffuse hypoattenuated thickening of one or multiple leaflets, commonly at the base or free edge of the leaflets and visible both during systole and diastole. Attenuation of the thickening (HU) is mainly < 90 HU, often between 30 and 60 HU, consistent with thrombotic material. HALT may be associated with reduced leaflet excursion, termed HAM (Hypo-Attenuation affecting Motion).
The use of contrast agents, along with advanced imaging techniques such as photon-counting CT, allows for high-resolution imaging of tissue heterogeneity, making it a valuable tool for non-invasive evaluation. Dual-energy computed tomography has emerged as a transformative tool in the non-invasive assessment of cardiac tissue, enabling a more precise characterization of myocardial structures and pathologies. Employing two distinct energy levels, it provide unique advantages in tissue differentiation through the energy-dependent attenuation of various tissues, allowing for better delineation of tissue properties such as fat, fibrosis, calcification, and water content, improving also quantitative imaging and iodine mapping.
Furthermore, new methodologies like CT-based tissue characterization models and artificial intelligence algorithms are enhancing the accuracy of differentiating normal and pathological cardiac tissues. The integration of cardiac CT with other imaging modalities, such as cardiac magnetic resonance, is also highlighted as a promising approach for comprehensive cardiac tissue assessment in several clinical settings.
Conclusions
Cardiac CT has become a valuable alternative imaging modality for myocardial tissue characterization and functional assessment, offering high availability, robustness and rapid acquisition. Thanks to recent advances such as photon-counting detector technology, enhanced soft-tissue contrast and dual-energy capabilities, may be used as a surrogate of CMR when cardiac MRI is contraindicated, unfeasible, not available or non-diagnostic.
The data in literature support late iodine contrast as a promising technique for myocardial tissue characterization, showing excellent agreement with LGE-CMR. Larger, prospective, and more diverse studies are warranted to confirm these findings and to define the clinical role of CCT in this context.
Recent developments in ECV quantification and strain analysis show strong potential to become key components of CCT, pending standardization of scan protocols, contrast administration, and post-processing methods. Emerging techniques such as radiomics, texture analysis, and machine learning further expand the CT diagnostic capabilities, enabling improved detection of fibrosis, infarction, edema, and fatty infiltration.
Overall, these innovations may substantially advance CT-based myocardial characterization, improving diagnostic precision, therapeutic planning, and prognosis data.
References
- Andreini, D.; Conte, E.; Mushtaq, S.; Pontone, G.; Guglielmo, M.; Baggiano, A.; Annoni, A.; Mancini, M.E.; Formenti, A.; Nicoli, F.; et al. Rationale and design of the EPLURIBUS Study (Evidence for a comPrehensive evaLUation of left ventRicle dysfnctIon By a whole-heart coverage cardiac compUted tomography Scanner). J. Cardiovasc. Med. 2020, 21, 812–819. [CrossRef]
- de Carvalho, F.P.; Azevedo, C.F. Comprehensive Assessment of Endomyocardial Fibrosis with Cardiac MRI: Morphology, Function, and Tissue Characterization. RadioGraphics 2020, 40, 336–353. [CrossRef]
- Mahrholdt, H.; Wagner, A.; Judd, R.M.; Sechtem, U.; Kim, R.J. Delayed enhancement cardiovascular magnetic resonance assessment of non-ischaemic cardiomyopathies. Eur. Hear. J. 2005, 26, 1461–1474. [CrossRef]
- Ferrari, V. The EACVI Textbook of Cardiovascular Magnetic Resonance; Oxford University Press (OUP): Oxford, Oxfordshire, United Kingdom, 2018; ISBN.
- Baggiano, A.; Del Torto, A.; Guglielmo, M.; Muscogiuri, G.; Fusini, L.; Babbaro, M.; Collevecchio, A.; Mollace, R.; Scafuri, S.; Mushtaq, S.; et al. Role of CMR Mapping Techniques in Cardiac Hypertrophic Phenotype. Diagnostics 2020, 10, 770. [CrossRef]
- Haaf, P.; Garg, P.; Messroghli, D.R.; Broadbent, D.A.; Greenwood, J.P.; Plein, S. Cardiac T1 Mapping and Extracellular Volume (ECV) in clinical practice: a comprehensive review. J. Cardiovasc. Magn. Reson. 2016, 18, 89–12. [CrossRef]
- Mushtaq, S.; Conte, E.; Pontone, G.; Baggiano, A.; Annoni, A.; Formenti, A.; Mancini, M.E.; Guglielmo, M.; Muscogiuri, G.; Tanzilli, A.; et al. State-of-the-art-myocardial perfusion stress testing: Static CT perfusion. J. Cardiovasc. Comput. Tomogr. 2020, 14, 294–302. [CrossRef]
- Conte, E.; Sonck, J.; Mushtaq, S.; Collet, C.; Mizukami, T.; Barbato, E.; Tanzilli, A.; Nicoli, F.; De Bruyne, B.; Andreini, D. FFRCT and CT perfusion: A review on the evaluation of functional impact of coronary artery stenosis by cardiac CT. Int. J. Cardiol. 2020, 300, 289–296. [CrossRef]
- Han, D.; Lin, A.; Kuronuma, K.; Gransar, H.; Dey, D.; Friedman, J.D.; Berman, D.S.; Tamarappoo, B.K. Cardiac Computed Tomography for Quantification of Myocardial Extracellular Volume Fraction. JACC: Cardiovasc. Imaging 2023, 16, 1306–1317. [CrossRef]
- Gerber, B.L.; Belge, B.; Legros, G.J.; Lim, P.; Poncelet, A.; Pasquet, A.; Gisellu, G.; Coche, E.; Vanoverschelde, J.-L.J. Characterization of Acute and Chronic Myocardial Infarcts by Multidetector Computed Tomography. Circulation 2006, 113, 823–833. [CrossRef]
- Lisi, C.; Moser, L.J.; Mergen, V.; Klambauer, K.; Uçar, E.; Eberhard, M.; Alkadhi, H. Advanced myocardial characterization and function with cardiac CT. Int. J. Cardiovasc. Imaging 2024, 1–16. [CrossRef]
- Cundari, G.; Galea, N.; Mergen, V.; Alkadhi, H.; Eberhard, M. Myocardial extracellular volume quantification with computed tomography—current status and future outlook. Insights into Imaging 2023, 14, 1–13. [CrossRef]
- Gatti, M.; De Filippo, O.; Curà, G.C.; Dusi, V.; Di Vita, U.; Gallone, G.; Morena, A.; Palmisano, A.; Pasinato, E.; Solano, A.; et al. Diagnostic accuracy of late iodine enhancement on cardiac CT for myocardial tissue characterization: a systematic review and meta-analysis. Eur. Radiol. 2024, 35, 3054–3067. [CrossRef]
- Lee, H.-J.; Im, D.J.; Youn, J.-C.; Chang, S.; Suh, Y.J.; Hong, Y.J.; Kim, Y.J.; Hur, J.; Choi, B.W. Myocardial Extracellular Volume Fraction with Dual-Energy Equilibrium Contrast-enhanced Cardiac CT in Nonischemic Cardiomyopathy: A Prospective Comparison with Cardiac MR Imaging. Radiology 2016, 280, 49–57. [CrossRef]
- Treibel, T.A.; Bandula, S.; Fontana, M.; White, S.K.; Gilbertson, J.A.; Herrey, A.S.; Gillmore, J.D.; Punwani, S.; Hawkins, P.N.; Taylor, S.A.; et al. Extracellular volume quantification by dynamic equilibrium cardiac computed tomography in cardiac amyloidosis. J. Cardiovasc. Comput. Tomogr. 2015, 9, 585–592. [CrossRef]
- Steve Bandula 1, Steven K White, Andrew S Flett, David Lawrence, Francesca Pugliese, Michael T Ashworth, Shonit Punwani, Stuart A Taylor JCM. Measurement of myocardial extracellular volume fraction by using equilibrium contrast-enhanced CT: validation against histologic findings. Radiol 2013 Nov;269(2)396-403. [CrossRef]
- Weir-McCall, J.R.; Alabed, S. Myocardial Tissue Characterization With CT-Derived Extracellular Volume. JACC: Cardiovasc. Imaging 2023, 16, 1318–1320. [CrossRef]
- Ghostine, S.; Caussin, C.; Habis, M.; Habib, Y.; Clément, C.; Sigal-Cinqualbre, A.; Angel, C.-Y.; Lancelin, B.; Capderou, A.; Paul, J.-F. Non-invasive diagnosis of ischaemic heart failure using 64-slice computed tomography. Eur. Hear. J. 2008, 29, 2133–2140. [CrossRef]
- Nacif MS, Kawel N LJ et al. Interstitial myocardial fibrosis assessed as extracellular volume fraction with low-radiation-dose cardiac CT. Radiology 264:876–883. [CrossRef]
- Dubourg B, Dacher J-N DE et al. Single-source dual energy CT to assess myocardial extracellular volume fraction in aortic stenosis before transcatheter aortic valve implantation (TAVI). Diagn Interv Imaging 102:561–570. [CrossRef]
- Heuser, A.; Plovie, E.R.; Ellinor, P.T.; Grossmann, K.S.; Shin, J.T.; Wichter, T.; Basson, C.T.; Lerman, B.B.; Sasse-Klaassen, S.; Thierfelder, L.; et al. Mutant Desmocollin-2 Causes Arrhythmogenic Right Ventricular Cardiomyopathy. Am. J. Hum. Genet. 2006, 79, 1081–1088. [CrossRef]
- Sandfort, V.; Persson, M.; Pourmorteza, A.; Noël, P.B.; Fleischmann, D.; Willemink, M.J. Spectral photon-counting CT in cardiovascular imaging. J. Cardiovasc. Comput. Tomogr. 2021, 15, 218–225. [CrossRef]
- Cademartiri, F.; Meloni, A.; Pistoia, L.; Degiorgi, G.; Clemente, A.; De Gori, C.; Positano, V.; Celi, S.; Berti, S.; Emdin, M.; et al. Dual-Source Photon-Counting Computed Tomography—Part I: Clinical Overview of Cardiac CT and Coronary CT Angiography Applications. J. Clin. Med. 2023, 12, 3627. [CrossRef]
- Gkizas, C.; Longere, B.; Sliwicka, O.; Musso, A.R.; Lemesle, G.; Croisille, C.; Haidar, M.; Pontana, F. Photon-counting CT-derived extracellular volume in acute myocarditis: Comparison with cardiac MRI. Diagn. Interv. Imaging 2025, 106, 255–263. [CrossRef]
- Gräni, C. Advancements in CT Tissue Characterization: Myocardial Insights in Aortic Stenosis and Amyloidosis. Circ. Cardiovasc. Imaging 2024, 17, e016898. [CrossRef]
- Scully, P.R.; Patel, K.P.; Saberwal, B.; Klotz, E.; Augusto, J.B.; Thornton, G.D.; Hughes, R.K.; Manisty, C.; Lloyd, G.; Newton, J.D.; et al. Identifying Cardiac Amyloid in Aortic Stenosis. JACC: Cardiovasc. Imaging 2020, 13, 2177–2189. [CrossRef]
- Bernhard, B.; Leib, Z.; Dobner, S.; Demirel, C.; Caobelli, F.; Rominger, A.; Schütze, J.; Grogg, H.; Alwan, L.; Spano, G.; et al. Routine 4D Cardiac CT to Identify Concomitant Transthyretin Amyloid Cardiomyopathy in Older Adults with Severe Aortic Stenosis. Radiology 2023, 309, e230425. [CrossRef]
- Vignale, D.; Palmisano, A.; Gnasso, C.; Margonato, D.; Romagnolo, D.; Barbieri, S.; Ingallina, G.; Stella, S.; Ancona, M.B.; Montorfano, M.; et al. Extracellular volume fraction (ECV) derived from pre-operative computed tomography predicts prognosis in patients undergoing transcatheter aortic valve implantation (TAVI). Eur. Hear. J. - Cardiovasc. Imaging 2023, 24, 887–896. [CrossRef]
- Tamarappoo, B.; Han, D.; Tyler, J.; Chakravarty, T.; Otaki, Y.; Miller, R.; Eisenberg, E.; Singh, S.; Shiota, T.; Siegel, R.; et al. Prognostic Value of Computed Tomography–Derived Extracellular Volume in TAVR Patients With Low-Flow Low-Gradient Aortic Stenosis. JACC: Cardiovasc. Imaging 2020, 13, 2591–2601. [CrossRef]
- Hammer, Y.; Talmor-Barkan, Y.; Abelow, A.; Orvin, K.; Aviv, Y.; Bar, N.; Levi, A.; Landes, U.; Shafir, G.; Barsheshet, A.; et al. Myocardial extracellular volume quantification by computed tomography predicts outcomes in patients with severe aortic stenosis. PLOS ONE 2021, 16, e0248306. [CrossRef]
- Ko, S.M.; Hwang, S.H.; Lee, H.-J. Role of Cardiac Computed Tomography in the Diagnosis of Left Ventricular Myocardial Diseases. J. Cardiovasc. Imaging 2019, 27, 73–92. [CrossRef]
- Ibrahim, R.; Abdelnabi, M.; Pathangey, G.; Farina, J.; Lester, S.J.; Ayoub, C.; Alsidawi, S.; Tamarappoo, B.K.; Jokerst, C.; Arsanjani, R. Utility of Cardiac CT for Cardiomyopathy Phenotyping. Tomography 2025, 11, 39. [CrossRef]
- Sidhu, M.S.; Uthamalingam, S.; Ahmed, W.; Engel, L.-C.; Vorasettakarnkij, Y.; Lee, A.M.; Hoffmann, U.; Brady, T.; Abbara, S.; Ghoshhajra, B.B.M. Defining Left Ventricular Noncompaction Using Cardiac Computed Tomography. J. Thorac. Imaging 2014, 29, 60–66. [CrossRef]
- Yashima, S.; Takaoka, H.; Iwahana, T.; Nishikawa, Y.; Ota, J.; Aoki, S.; Kinoshita, M.; Takahashi, M.; Sasaki, H.; Suzuki-Eguchi, N.; et al. Evaluation of extracellular volume by computed tomography is useful for prediction of prognosis in dilated cardiomyopathy. Hear. Vessel. 2022, 38, 185–194. [CrossRef]
- Bouleti, C.; Baudry, G.; Iung, B.; Arangalage, D.; Abtan, J.; Ducrocq, G.; Steg, P.-G.; Vahanian, A.; Henry-Feugeas, M.-C.; Pasi, N.; et al. Usefulness of Late Iodine Enhancement on Spectral CT in Acute Myocarditis. JACC: Cardiovasc. Imaging 2017, 10, 826–827. [CrossRef]
- Wang, X.; Leng, S.; Adamson, P.D.; E Greer, C.; Huang, W.; Lee, H.K.; Loong, Y.T.; Raffiee, N.A.S.; Sia, C.H.; Tan, S.Y.; et al. Characterizing cardiac adipose tissue in post-acute myocardial infarction patients via CT imaging: a comparative cross-sectional study. Eur. Hear. J. - Cardiovasc. Imaging 2025, 26, 733–740. [CrossRef]
- Duncker, H.; Achenbach, S.; Moshage, M.; Dey, D.; Bittner, D.O.; Ammon, F.; Marwan, M.; Goeller, M.M. Computed Tomography-derived Characterization of Pericoronary, Epicardial, and Paracardial Adipose Tissue and Its Association With Myocardial Ischemia as Assessed by Computed Fractional Flow Reserve. J. Thorac. Imaging 2021, 38, 46–53. [CrossRef]
- Hong YJ, Kim TK, Hong D et al. Myocardial characterization using dual-energy CT in doxorubicin-induced DCM: comparison with CMR T1-mapping and histology in a rabbit. J Am Coll Cardiol Img 2016;9836–45.
- Gonciar, D.; Berciu, A.-G.; Dulf, E.-H.; Orzan, R.I.; Mocan, T.; Danku, A.E.; Lorenzovici, N.; Agoston-Coldea, L. Computer-Assisted Algorithm for Quantification of Fibrosis by Native Cardiac CT: A Pilot Study. J. Clin. Med. 2024, 13, 4807. [CrossRef]
- Klem, I. Expanding CT Application to Myocardial Tissue Characterization ∗. JACC: Cardiovasc. Imaging 2016, 9, 846–848. [CrossRef]
- Flavia, N.; Elona, C.; Rocco, M.; Margherita, L.; Erika, B. A Multimodality Imaging Evaluation of a Huge Postsurgical Cardiac Pseudoaneurysm. JACC: Case Rep. 2025, 30, 104816. [CrossRef]
Figure 1.
Late Iodine enhancement polar map, dual-energy (Somatom Force, Siemens Healthcare). This case show a case of transmural Late Iodine Enhancement LIE (red arrowst in mid-to-basal portion of inferior and infero-lateral walls (panel d), with inferior fat metaplasia (blue arrows), in patient with ischemic heart disease (previous ST-elevation myocardial infarction and subsequent stenting on the tree vessels). Panel a shows 3D- heart view and angio-CT appearance of fat metaplasia, as confirmed in basal scans (panel b). Panel c shows LIE in the monoenergetic map (40 kV), where LIE can be better visualized as hyperintensity of signal, surrounding fat metaplasia. Panel d shows LIE in the polar map calculating the quantity of Iodine density in percentage (ROI in short axis view, at right), for the quantitative evaluation by the Heart PBV toll (Siemens).
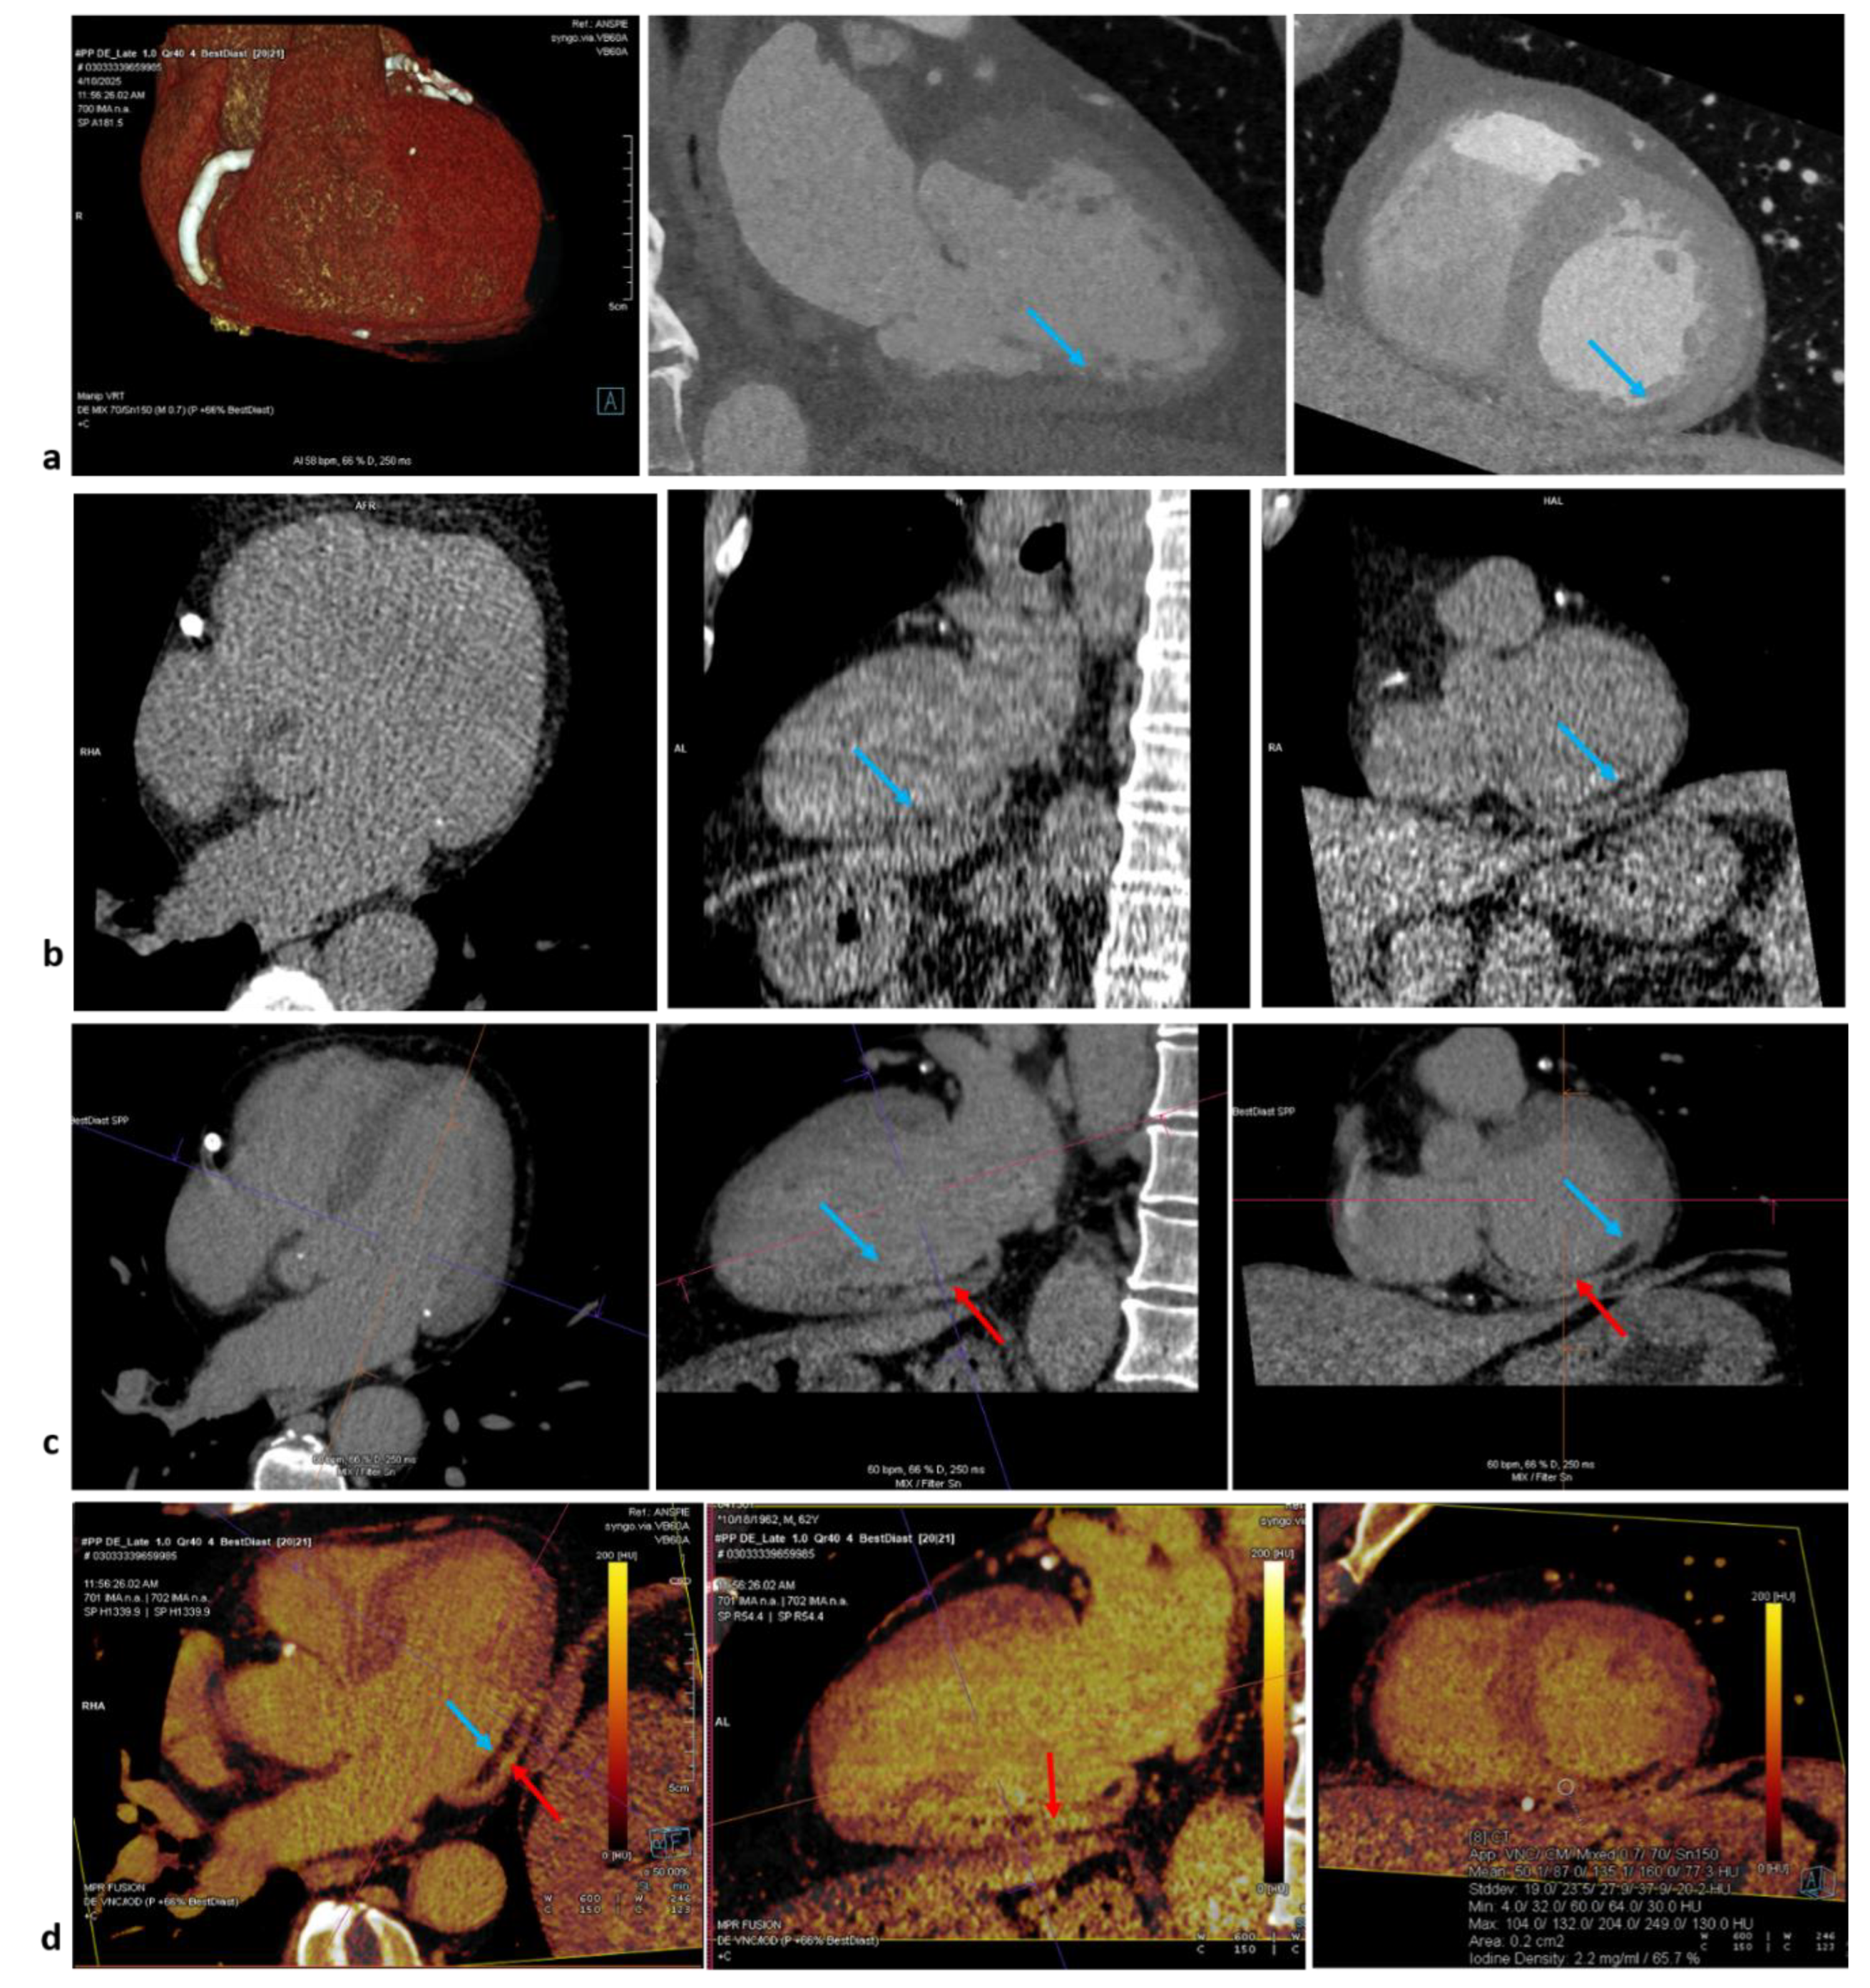
Figure 2.
Single-energy ECV-CT. Pre-contrast scan (left) and post-contrast scan (right) lead to derive ROIs into the blood pool and the myocardium, for the calculation of ECV-CT by dedicated equation.
Figure 2.
Single-energy ECV-CT. Pre-contrast scan (left) and post-contrast scan (right) lead to derive ROIs into the blood pool and the myocardium, for the calculation of ECV-CT by dedicated equation.
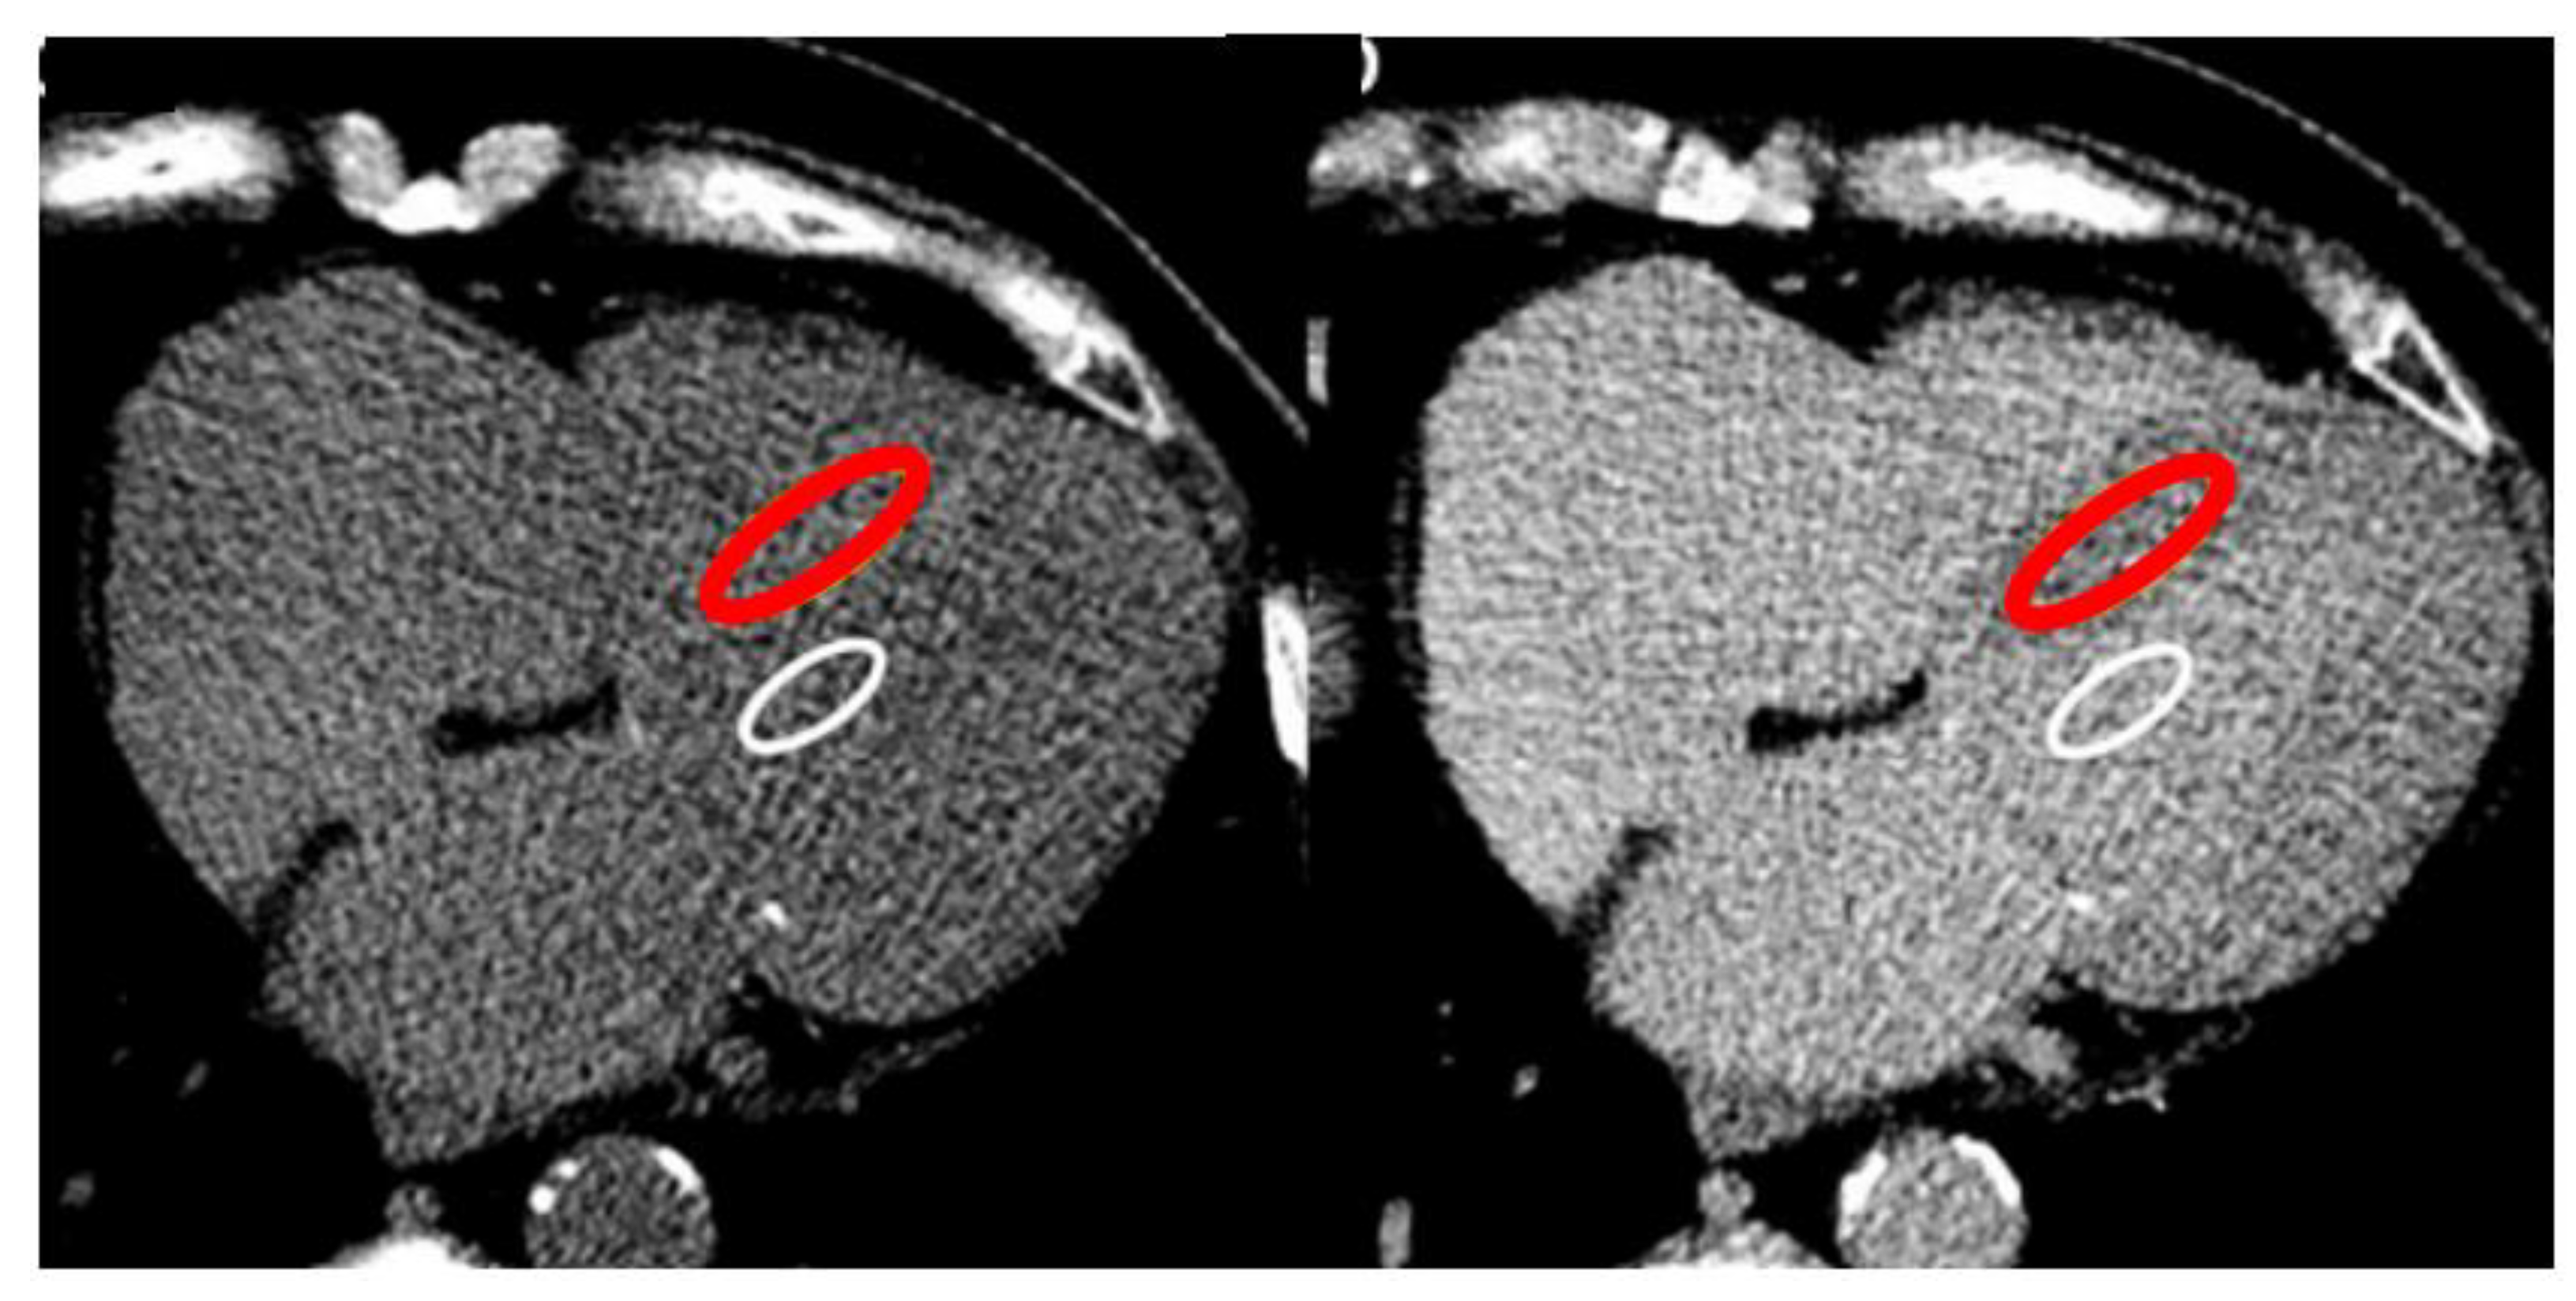
Figure 3.
Dual-energy ECV-CT. Iodine map derived from late enhancement scan (left and middle) lead to calculate CT-ECV map (showed at right) by computed equation.
Figure 3.
Dual-energy ECV-CT. Iodine map derived from late enhancement scan (left and middle) lead to calculate CT-ECV map (showed at right) by computed equation.
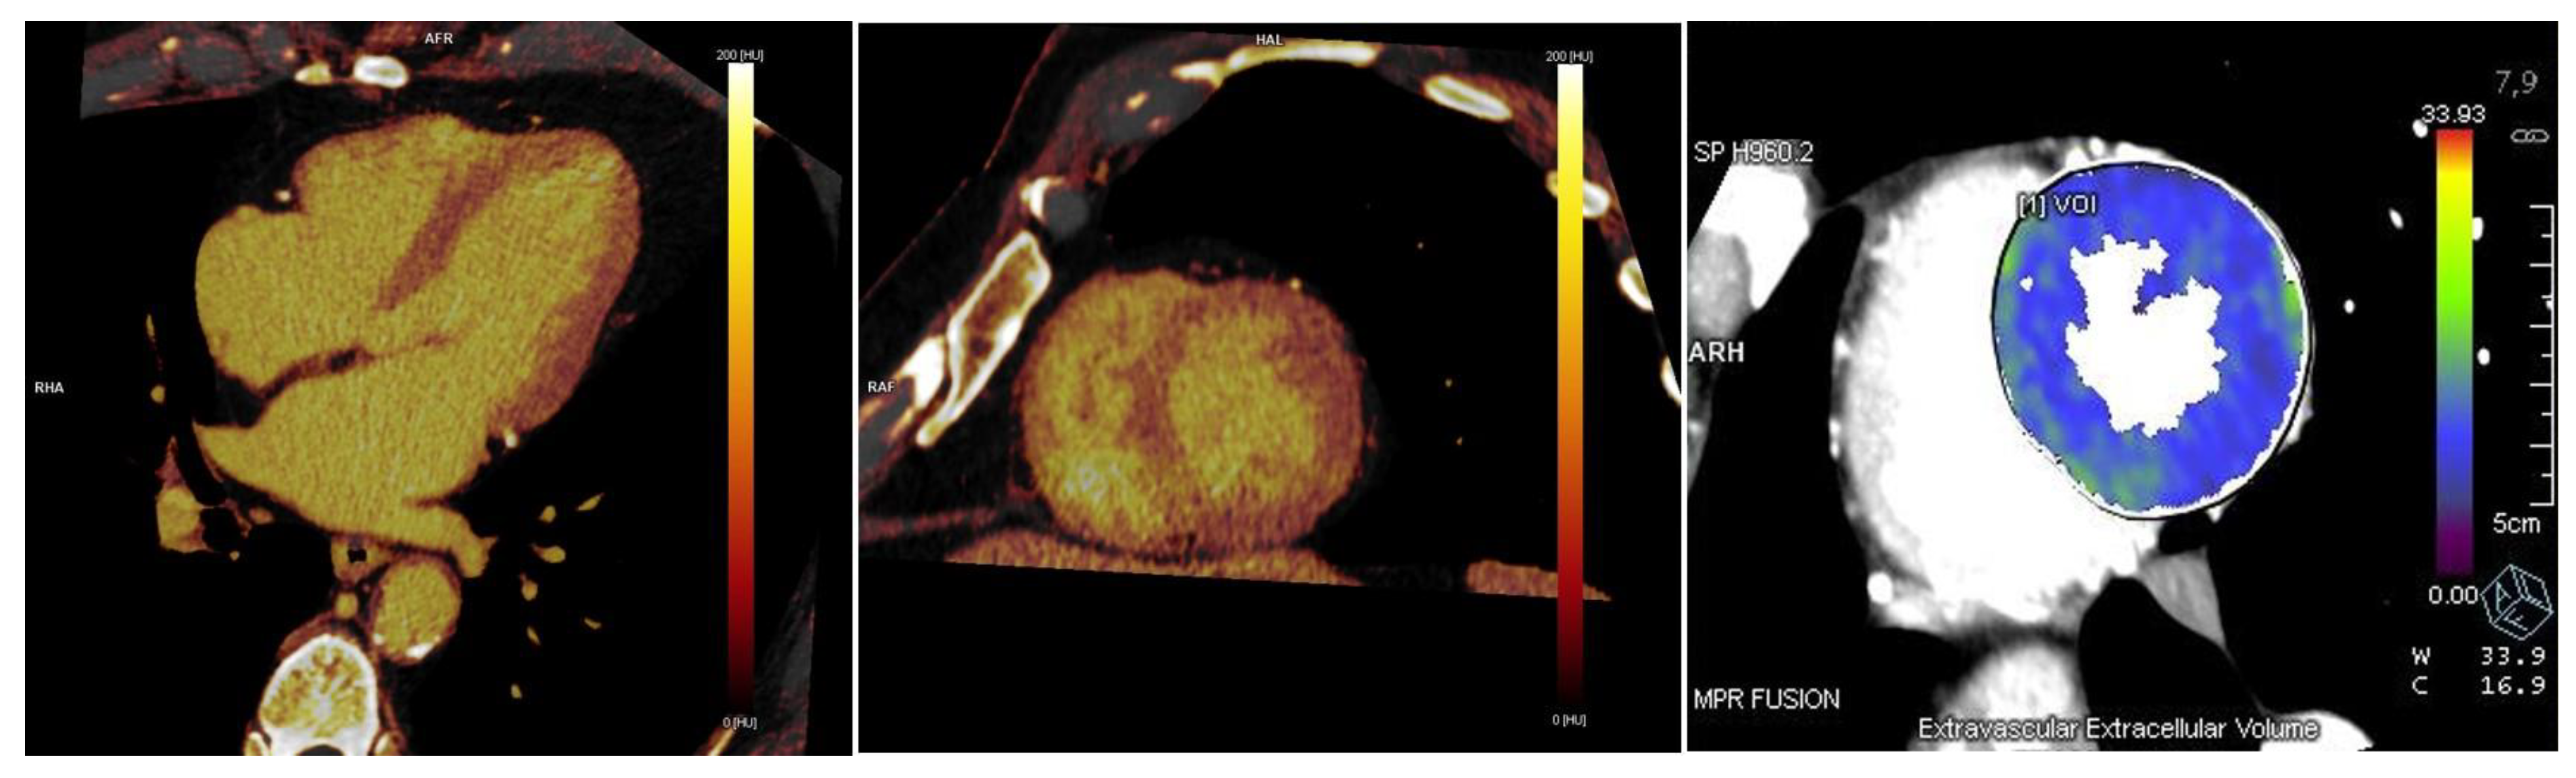
Figure 4.
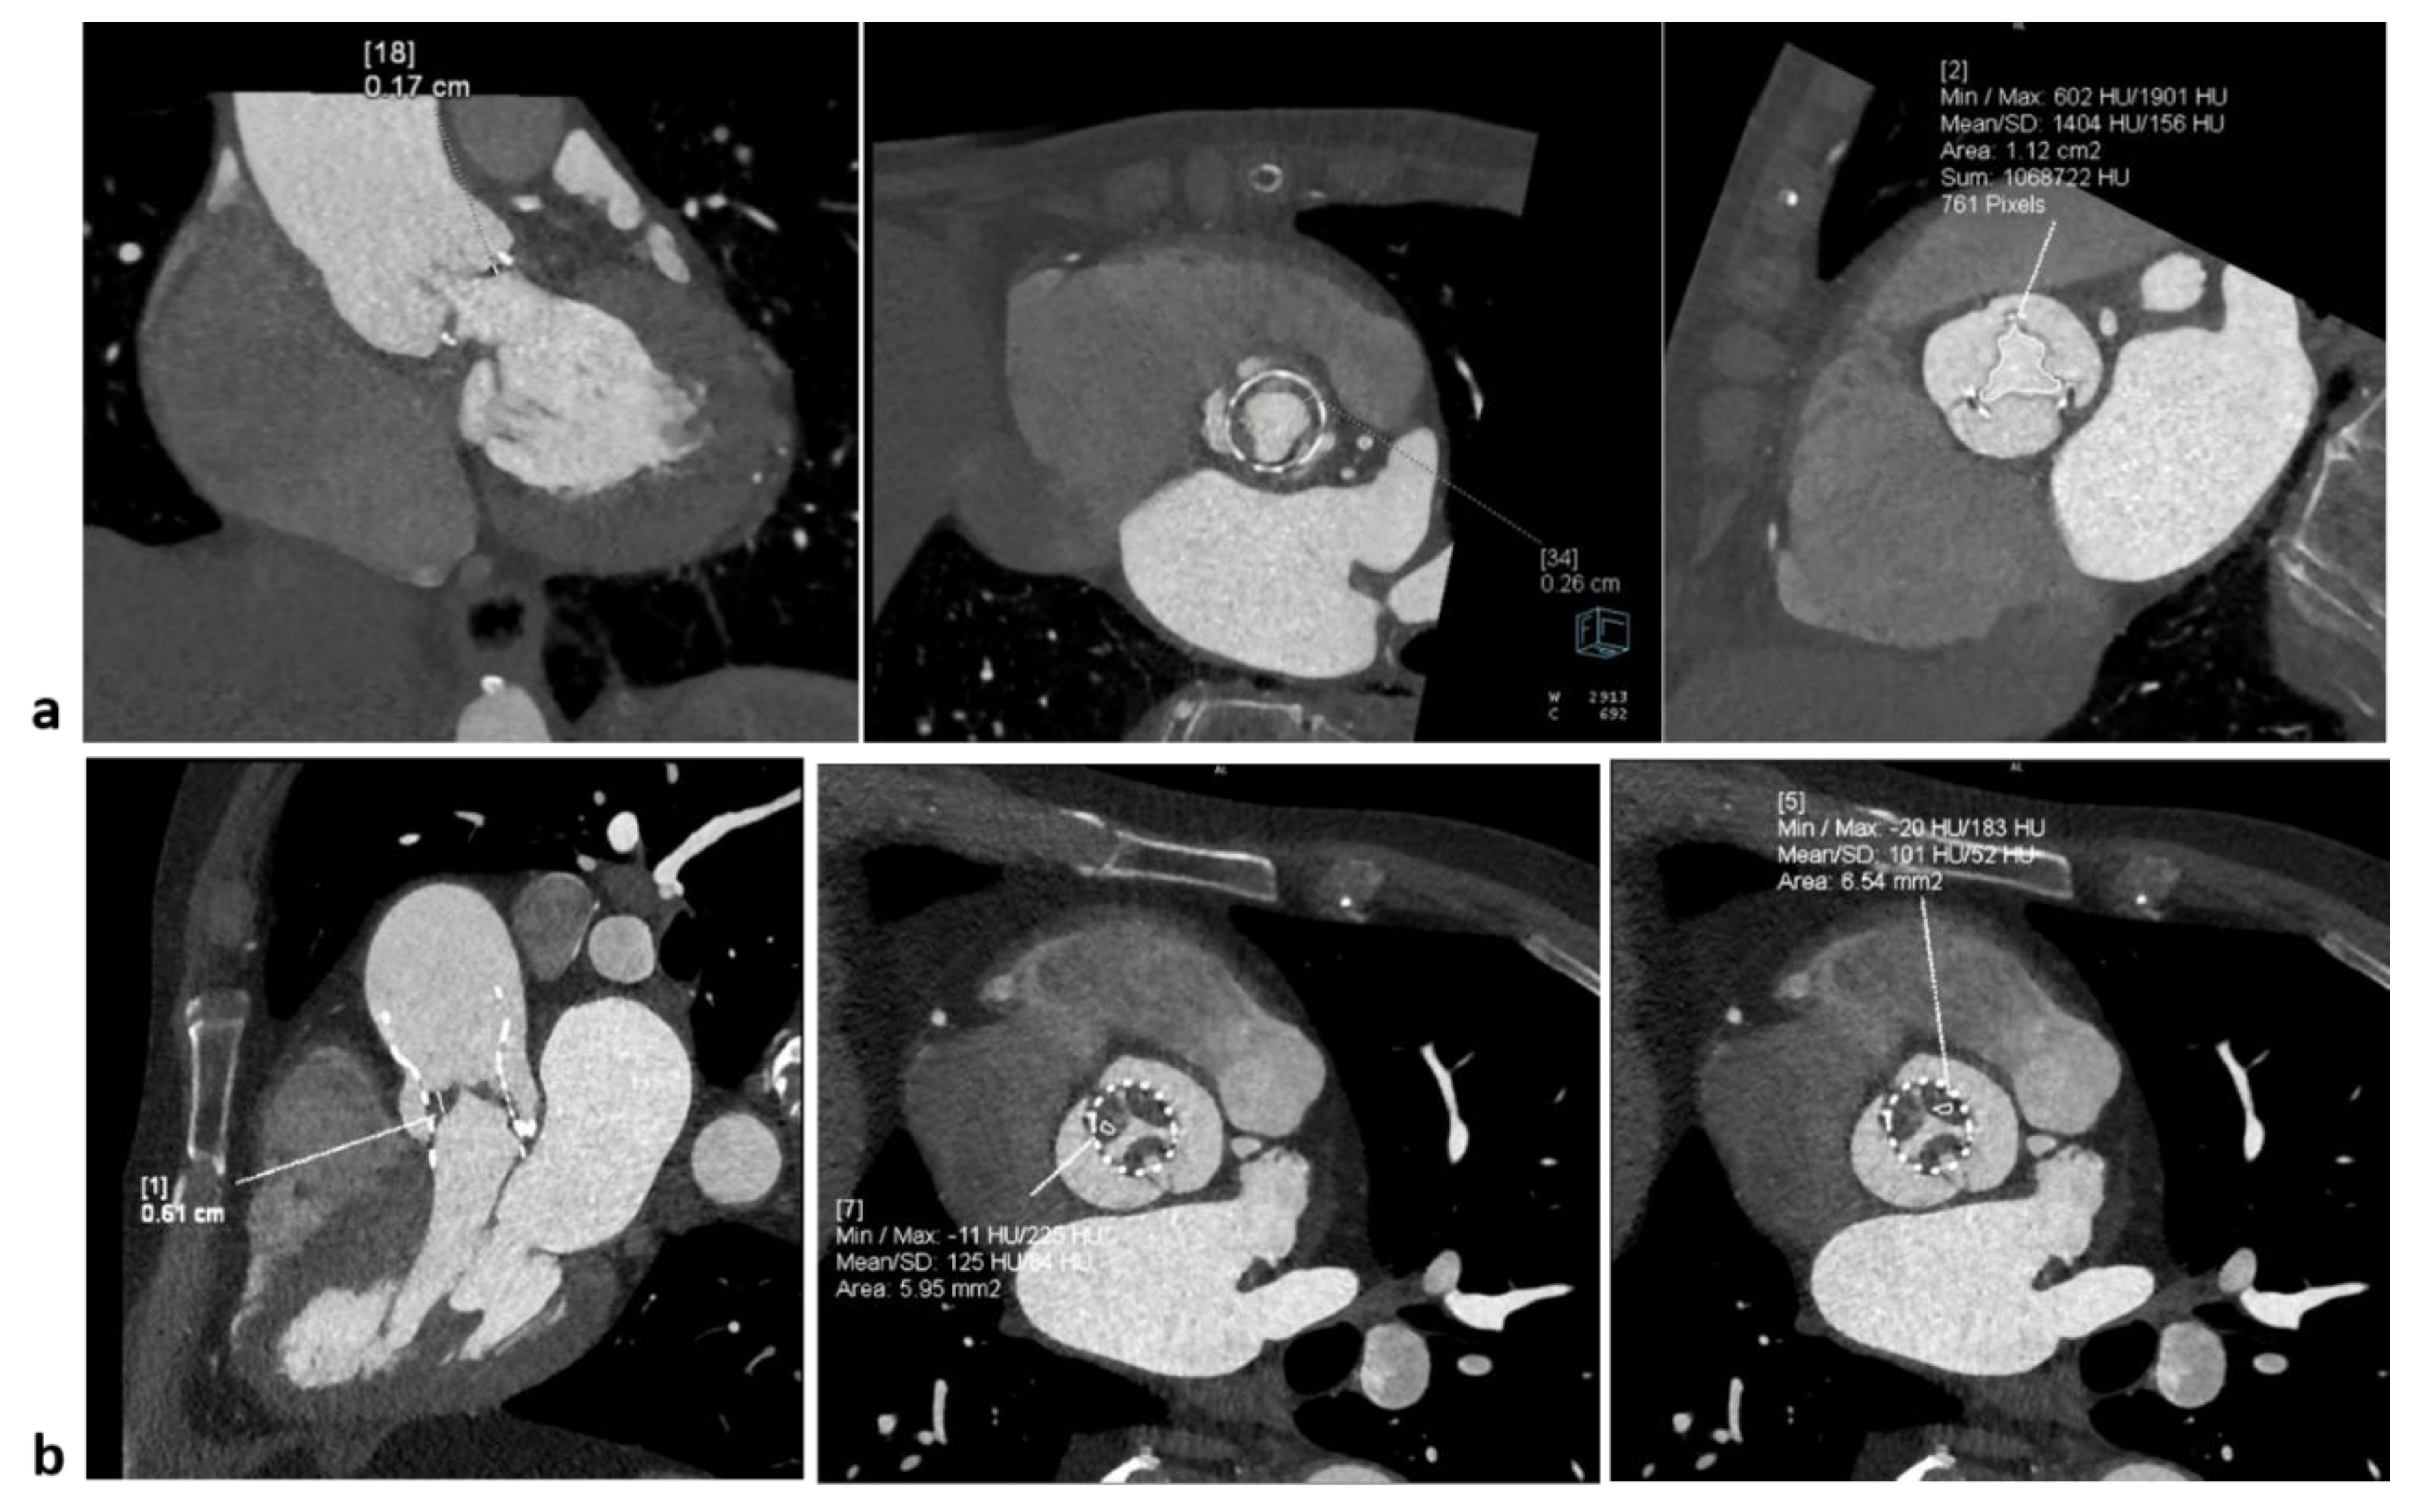
CT application in study of valve degenerations. Panel a shows biological prosthesis degeneration (Trifecta 23, implanted in 2015), with thickening of the cusps in particular in the periannular regions, as suspected at echocardiography study which revealed severe aortic valve regurgitation. The patients, symptomatic for dyspnoea, was treated with TAVI valve-in-valve replacement, after CT anatomical pre-procedural study. Panel b shows asymptomatic HALT in a TAVI patient (implanted in 2021, CT in 2023) with thickening of all the leaflet (mean 5 mm) partially viewable at venous scans and tissue with HU 100-to-125 as for mainly fibrotic tissue with suspected superimposed thrombus, in agreement with high echocardiographics gradients with paravalvular leak. The patient was treated with warfarin, with efficacy reduction of gradients and normal follow-up at 2025.
Figure 4.
CT application in study of valve degenerations. Panel a shows biological prosthesis degeneration (Trifecta 23, implanted in 2015), with thickening of the cusps in particular in the periannular regions, as suspected at echocardiography study which revealed severe aortic valve regurgitation. The patients, symptomatic for dyspnoea, was treated with TAVI valve-in-valve replacement, after CT anatomical pre-procedural study. Panel b shows asymptomatic HALT in a TAVI patient (implanted in 2021, CT in 2023) with thickening of all the leaflet (mean 5 mm) partially viewable at venous scans and tissue with HU 100-to-125 as for mainly fibrotic tissue with suspected superimposed thrombus, in agreement with high echocardiographics gradients with paravalvular leak. The patient was treated with warfarin, with efficacy reduction of gradients and normal follow-up at 2025.
Disclaimer/Publisher’s Note: The statements, opinions and data contained in all publications are solely those of the individual author(s) and contributor(s) and not of MDPI and/or the editor(s). MDPI and/or the editor(s) disclaim responsibility for any injury to people or property resulting from any ideas, methods, instructions or products referred to in the content. |
© 2025 by the authors. Licensee MDPI, Basel, Switzerland. This article is an open access article distributed under the terms and conditions of the Creative Commons Attribution (CC BY) license (http://creativecommons.org/licenses/by/4.0/).
Copyright: This open access article is published under a Creative Commons CC BY 4.0 license, which permit the free download, distribution, and reuse, provided that the author and preprint are cited in any reuse.


