Submitted:
25 November 2025
Posted:
26 November 2025
You are already at the latest version
Abstract
In corporate finance, deploying AI agents for financial modeling requires integrating diverse data streams into a reliable and auditable decision-making framework. Existing multimodal and large language models provide strong representations but often miss clear temporal ordering, cross-modal coordination, and adaptive rule enforcement in real-world financial practice. To address these gaps, this paper introduces HAFIN (Hierarchical Adaptive Financial Intelligence Network), a rule-aware framework built upon the Typhoon2-70B foundation. HAFIN combines multi-scale temporal modeling, cross-modal fusion, sparse expert routing, soft rule propagation, Bayesian uncertainty modeling, and selective attention in a single architecture. The model captures fine and coarse financial patterns through time-aware embedding and aligns data types through simple gated fusion. Sparse expert routing improves focus and efficiency. Soft rule propagation incorporates regulatory limits into learning. Bayesian inference refines uncertainty handling, and selective attention highlights salient signals. The result is a robust, interpretable, and compliance-driven system designed for high-stakes multimodal financial analysis, directly supporting the needs of financial modeling and finance transformation leaders.
Keywords:
multimodal finance
; temporal modeling
; expert routing
; compliance
; uncertainty calibration
1. Introduction
Multimodal financial data—from tick-level trades and market microstructure to narratives in disclosures and fundamentals—poses three challenges: (i) temporal heterogeneity and regime shifts that break stationarity, (ii) cross-modal asynchrony and imbalance that hinder fusion, and (iii) governance requirements—auditability, policy conformance, and uncertainty disclosure—unmet by typical predictive pipelines. Classical econometrics encode theory yet degrade under nonlinearity and distribution drift; large language and multimodal models provide strong representations but often lack temporal reasoning, cross-modal coordination, and differentiable rule enforcement. A unified, auditable, policy-aware design is needed.
HAFIN couples time-aware representation learning with governance-oriented control. Temporal embeddings with learnable phases align multi-frequency signals; gated cross-modal fusion integrates prices, sentiment, and fundamentals while curbing modality dominance; sparse expert routing (MoFE) enables specialization with efficiency; a soft rule layer (ECPS) propagates regulatory and policy constraints during training and inference; Bayesian calibration (BUQM) separates aleatoric and epistemic uncertainty for risk-sensitive decisions; and selective token attention (STA) concentrates compute on salient evidence, improving stability and traceability. These components shift the objective from point prediction to rule-aware reasoning with auditable decision traces.
This paper evaluate with market-style benchmarks that stress risk, uncertainty, and tails: Sharpe, MCC, WMAPE, IC, and CVaR. A task–metric mapping aligns enterprise objectives: cash-flow and working-capital forecasting (WMAPE); variance detection and driver analysis (MCC/IC); counterparty credit risk (MCC/IC); and policy conformance via ECPS compliance checks. This preserves methodological consistency and clarifies applicability to FP&A and finance-transformation workflows.
2. Related Work
Recent studies have advanced financial modeling using Transformer architectures. Lim et al. [1] improved interpretability for multi-horizon forecasting, and Su et al. [2] showed that Transformer models outperform recurrent ones but still lack multi-scale adaptability in volatile markets.
In multimodal finance, Zong et al. [3] applied gated attention for stable fusion of heterogeneous signals, and Liu et al. [4] built a dynamic graph model to capture temporal relations. Sheng et al. [5] found that combining textual and numerical data improves prediction reliability.
For decision optimization, Wei et al. [6] used a mixture-of-experts reinforcement model for portfolio control, and Lim et al. [7] studied risk-sensitive reinforcement learning. Tavakoli et al. [8] integrated text and numeric streams for credit rating, while Lu et al. [9] employed expert-based language models for financial text tasks.
From a fusion perspective, Lee et al. [10] introduced gated attention to reduce modality imbalance and improve stability in multimodal learning.
3. Methodology
This section presents the Hierarchical Adaptive Financial Intelligence Network (HAFIN), a sophisticated architecture extending Typhoon2 70B for ethical financial analysis on the Lanta Platform. The framework addresses critical challenges in financial AI through several integrated mechanisms. The Temporal-Aware Financial Embedding Transformer (TAFET) captures multi-scale market dynamics using learnable phase shifts to achieve temporal alignment across disparate data frequencies. A Cross-Modal Attention Fusion Network with low-rank factorization enables efficient processing of heterogeneous financial signals while maintaining computational tractability.
A key component is the Mixture of Financial Experts (MoFE), which routes inputs through 32 specialized sub-networks via temperature-controlled stochastic gating, effectively handling high-dimensional financial feature spaces. To ensure regulatory compliance, an Ethical Constraint Propagation System (ECPS) based on differentiable factor graphs enables gradient-based optimization over traditionally discrete constraint satisfaction problems. Bayesian uncertainty quantification is incorporated through variational inference with local reparameterization, providing calibrated confidence estimates essential for risk-sensitive decisions. A Selective Token Attention (STA) mechanism dynamically identifies salient tokens via a composite scoring function, significantly reducing computational overhead while preserving model expressiveness.
Contrastive Financial Learning with market-aware augmentations and adversarial robustness training constrained to financially plausible perturbations maintains strong performance under distribution shifts while preserving ethical alignment. A reinforcement learning-based strategy optimizer, implemented with Proximal Policy Optimization and CVaR-adjusted rewards, supports adaptive decision-making in non-stationary market conditions. The pipeline of HAFIN is shown in Figure 1.
4. Algorithms and Models
4.1. Temporal-Aware Financial Embedding Transformer
The Temporal-Aware Financial Embedding Transformer (TAFET) represents a solution to the critical challenge of encoding heterogeneous financial data with complex temporal dependencies. Financial markets operate across multiple timescales, from microsecond-level high-frequency trading signals to quarterly fundamental indicators, creating a multi-resolution learning problem. Traditional Transformer architectures struggle with this temporal heterogeneity and often fail to capture cross-scale dependencies that are crucial for comprehensive market understanding. The temporal attention mechanism in TAFET dynamically allocates computational resources across multiple timescales, as visualized in Figure 2.
The embedding strategy begins with a unified transformation of diverse input modalities. Given heterogeneous financial inputs representing structured, numerical, and textual data respectively, a two-stage projection mechanism is applied:
where serves as a bottleneck layer that has been found to significantly improve gradient flow during backpropagation, and projects to the Typhoon2 hidden dimension. The choice of 4096 as the intermediate dimension is based on ablation results indicating a favorable trade-off between expressiveness and computational efficiency.
A key innovation in TAFET is the introduction of learnable temporal position encodings with phase shifts, addressing limitations of standard sinusoidal encodings in capturing market-specific periodicities:
where the learnable phase shifts and enable adaptation to cycles such as options expirations, earnings seasons, and central bank meetings. Initializing these phase shifts with small random values drawn from has empirically been observed to accelerate convergence compared to zero initialization, likely due to early symmetry breaking during optimization.
To capture multi-scale temporal patterns, TAFET incorporates a hierarchical dilated convolution module:
where dilation rates for create an exponentially increasing receptive field. This design reflects the fractal-like behavior of financial dynamics across timescales. Gradient vanishing in deeper convolutional stacks is mitigated through He initialization scaled by and residual connections inserted after every two convolution layers.
4.2. Cross-Modal Attention Fusion Network
The Cross-Modal Attention Fusion Network (CMAFN) tackles the challenge of integrating diverse financial signals that often contain complementary but asynchronous information. Traditional concatenation-based fusion approaches fail to capture nuanced relationships between financial modalities, particularly under conflicting signals in volatile markets.
For modalities , the cross-attention mechanism computes inter-modal dependencies:
The learnable bias matrix captures persistent inter-modal relationships through low-rank factorization:
where factorization with rank reduces parameters from to , alleviating memory constraints for long sequences. The diagonal term mitigates attention collapse, a phenomenon observed when attention weights converge to near-uniform distributions in early training. Setting dynamically based on the inverse of modality similarity helps maintain attention diversity.
The gated fusion mechanism is defined as:
where gate values are computed via feature concatenation:
The inclusion of the element-wise product and absolute difference follows insights from natural language inference models and is empirically effective for capturing concordance and discordance between financial signals. Applying LayerNorm before the gating computation stabilizes training and reduces the risk of gradient explosion in early epochs.
4.3. Mixture of Financial Experts Architecture
The Mixture of Financial Experts (MoFE) layer represents a domain-specific adaptation of sparse mixture-of-experts, designed to handle the diverse nature of financial instruments and markets. With expert networks, each specializing in different asset classes and trading strategies, MoFE maintains model capacity while ensuring computational efficiency. Figure 3 demonstrates the effectiveness of the load balancing strategy in the MoFE architecture.
The routing mechanism employs a noise-injected top-k selection strategy:
where experts are activated per token. Noise injection with during training encourages exploration of different expert combinations and acts as a regularizer that prevents over-specialization. Experiments with various k values indicate that optimally balances computational cost and model expressiveness; smaller values lead to underfitting, while larger values provide diminishing returns.
Each expert implements a modified SwiGLU activation within its transformation:
with SwiGLU defined as:
SwiGLU outperforms traditional ReLU and GELU activations by approximately 3.2% on financial benchmarks, likely due to smooth gating properties that better capture the continuous nature of financial signals. The learnable residual scaling factor , initialized to 0.1, helps preserve gradient flow through deep expert stacks.
Load balancing across experts poses a significant challenge, as certain experts may dominate routing decisions, causing underutilization of model capacity. To mitigate this, an auxiliary loss term is introduced:
where CV denotes the coefficient of variation and controls the trade-off between specialization and uniform utilization. This mechanism maintains expert utilization within 15% of a uniform distribution while preserving sufficient specialization for domain-specific patterns.
4.4. Ethical Constraint Propagation System
The Ethical Constraint Propagation System (ECPS) addresses the critical requirement of maintaining regulatory compliance in financial decision-making. Traditional hard constraint enforcement often leads to optimization difficulties and gradient blocking, motivating a differentiable approach based on probabilistic graphical models.
The constraint satisfaction problem is modeled as a factor graph with continuous relaxation:
The message passing algorithm iteratively refines beliefs about constraint satisfaction:
Convergence of message passing typically occurs within 5–7 iterations, with early stopping triggered by small changes in successive messages to reduce computational overhead. A key component is the soft constraint enforcement function:
where the temperature parameter controls the sharpness of constraint boundaries; lower values enforce stricter compliance at the risk of gradient instability. The constraint-specific scaling is set proportionally to regulatory penalty magnitudes so that more critical constraints receive stronger enforcement.
Integration with the base Typhoon2 attention mechanism requires careful calibration:
The exponential modulation ensures non-negative attention weights while preserving gradient flow. Applying constraint modulation only to the last 20 layers of Typhoon2 has been found to maintain general language understanding capabilities while effectively enforcing financial regulations.
4.5. Bayesian Uncertainty Quantification Module
The Bayesian Uncertainty Quantification Module (BUQM) provides calibrated uncertainty estimates essential for risk-aware financial decision-making. Financial markets exhibit inherent stochasticity, making uncertainty quantification crucial for distinguishing between model confidence and market volatility.
Variational inference with the local reparameterization trick is adopted for computational efficiency:
The evidence lower bound (ELBO) is optimized as:
with KL annealing where increases from 0 to 1 over the first 10,000 training steps, which prevents posterior collapse observed with a constant . The local reparameterization,
reduces variance in gradient estimates by a factor of approximately compared to standard reparameterization, which is critical for stable training with large hidden dimensions.
Decomposing uncertainty into aleatoric and epistemic components provides actionable insights:
High aleatoric uncertainty indicates volatile market conditions that favor conservative strategies, while high epistemic uncertainty suggests insufficient training data and motivates further data collection or model refinement. During inference, Monte Carlo dropout with rate and forward passes is employed to estimate predictive distributions, balancing computational cost with the quality of uncertainty estimates.
4.6. Selective Token Attention Mechanism
The Selective Token Attention (STA) mechanism addresses the computational bottleneck of processing long financial document sequences while maintaining model accuracy. Financial reports and regulatory filings often contain redundant information, motivating selective processing strategies.
Token importance is scored by combining multiple relevance metrics:
where , , and are selected via grid search. The L2 norm captures token salience, entropy reflects information content, and the similarity term highlights unique contributions. The selection ratio adapts dynamically with sequence length:
ensuring at least 30% token retention while capping effective processing at 512 tokens for very long sequences.
Selected tokens undergo full attention, while non-selected tokens use cached or approximate representations:
The LinearAttn approximation, implemented with Performer-style kernel methods, attains around 85% of full-attention accuracy at roughly 20% of the computational cost. Initial cache warming during the first training epoch is necessary; starting with empty caches leads to an observed performance degradation of about 5%.
4.7. Training Strategies and Implementation Tricks
Training HAFIN on the Lanta Platform requires several optimization strategies to handle the 70B-parameter scale efficiently. Mixed precision training is used with FP16 compute and FP32 master weights, reducing memory footprint by approximately 40% while maintaining numerical stability through dynamic loss scaling starting at and adjusting based on gradient overflow detection.
Gradient accumulation over 8 micro-batches simulates larger batch sizes within memory constraints, with synchronized BatchNorm ensuring consistent statistics. Accumulating gradients in FP32, even when forward and backward passes use FP16, prevents the subtle accuracy degradation observed during extended training.
The learning rate schedule combines linear warmup over 2000 steps with cosine annealing:
with and . Layer-wise adaptive learning rates scaled inversely with layer depth improve convergence, particularly for layers closer to the output.
Domain-specific data augmentation includes temporal jittering with Gaussian noise , random masking of 15% of financial indicators to improve robustness, and synthetic minority oversampling for rare but critical events such as market crashes. These augmentations yield an approximate 8% robustness improvement on out-of-distribution test sets.
5. Financial Data Preprocessing
5.1. Multi-Scale Temporal Alignment and Normalization
Financial data inherently arrives at different frequencies and scales, from tick-level trade data updating milliseconds apart to quarterly earnings reports, creating significant preprocessing challenges. The proposed Multi-Scale Temporal Alignment (MSTA) framework addresses this heterogeneity through resampling and alignment strategies that preserve information content while enabling efficient model processing.
The alignment process begins with frequency detection using spectral analysis:
Dominant frequencies guide the selection of target sampling rates, with Nyquist-Shannon considerations ensuring no information loss. For irregular time series common in financial data, Gaussian process interpolation is employed:
with a Matérn covariance kernel:
where provides once-differentiable sample paths suitable for financial time series, ℓ is the characteristic length scale learned from data, and is the modified Bessel function.
Normalization presents unique challenges in finance due to heavy-tailed distributions and regime changes. An adaptive robust normalization scheme is implemented:
where is an exponentially weighted window with half-life corresponding to typical market regime durations (approximately 60 trading days based on empirical analysis), and ensures consistency with Gaussian standard deviation. The median absolute deviation (MAD) provides robustness against outliers common in financial data.
For extreme values that remain after robust normalization, a soft clipping mechanism is applied:
with chosen to preserve of normal market movements while dampening extreme events. This configuration maintains model stability during backtesting through the 2008 financial crisis and COVID-19 volatility, periods where standard normalization often fails.
5.2. Feature Engineering with Market Microstructure
Understanding market microstructure is crucial for extracting meaningful features from raw financial data. The proposed feature engineering pipeline incorporates order book dynamics, trade flow analysis, and liquidity measures that capture market behavior beyond simple price movements.
From limit order book data, a multi-level feature representation is constructed:
where are bid/ask prices at level i, are the corresponding volumes, and is the mid-price. These features capture spread dynamics, order imbalance, and book slope, respectively.
Trade flow features incorporate the Kyle lambda for price impact:
where is the price change, indicates trade direction, and is trade volume. The square root scaling reflects empirical observations of concave price impact functions in liquid markets.
A liquidity-adjusted volatility measure is further introduced to account for market depth:
where is the average bid-ask spread and is the historical median spread. This adjustment has proved particularly valuable during liquidity crises, improving model performance by 11% under stressed market conditions.
Hidden Markov Model-based regime detection is employed to identify market states:
with states empirically capturing {normal, volatile, trending, mean-reverting} market conditions. Features are then conditioned on the detected regimes, allowing the model to adapt its behavior to prevailing market dynamics.
6. Evaluation Metrics
Five key metrics are employed for comprehensive evaluation:
Sharpe Ratio (SR): Risk-adjusted returns normalized by volatility:
Matthews Correlation Coefficient (MCC): Balanced classification metric:
Weighted MAPE (WMAPE): Position-weighted prediction error:
Information Coefficient (IC): Rank correlation between predictions and actuals:
Conditional Value at Risk (CVaR): Expected loss beyond VaR threshold:
7. Experiment Results
I evaluate HAFIN on 5 years of multi-asset data (500M+ data points) using 8 NVIDIA A100 GPUs. Table 1 compares performance against state-of-the-art models of similar scale (65–70B parameters). The changes in model training indicators are shown in Figure 4.
.
Table 2 demonstrates component contributions through ablation studies.
The ECPS and MoFE components contribute most significantly, with 10.9% and 9.7% SR degradation respectively when removed.
8. Conclusion
HAFIN extends Typhoon2-70B into a domain-specialized, governance-aware framework for financial intelligence, engineered around the requirements of FP&A, treasury, and finance-transformation teams that deploy AI agents in production workflows. By combining temporal-aware embeddings, cross-modal fusion, sparse expert routing, soft constraint propagation, Bayesian uncertainty modeling, and selective token attention, HAFIN reframes financial modeling from pure prediction toward rule-aware, auditable decision support.
In practical terms, HAFIN can be instantiated as a decision layer on top of existing data warehouses and planning tools to support (i) cash-flow and working-capital forecasting with WMAPE-aware error budgets, (ii) counterparty and portfolio credit-risk monitoring where MCC/IC improvements translate into earlier detection of deteriorating exposures, (iii) liquidity and funding stress-testing with CVaR-aware downside scenarios, and (iv) policy conformance checks that automatically flag breaches of internal limits or regulatory rules via ECPS. In a typical deployment, multimodal signals (market microstructure, fundamentals, textual disclosures, internal comments) are ingested into HAFIN, which then produces scenario-conditioned forecasts, risk-adjusted recommendations, and explicit compliance indicators that can be consumed by finance leaders through existing dashboards and workflow systems.
Relative to strong general-purpose baselines such as Llama-3.1 70B, Qwen2.5 72B, and Typhoon2 70B, HAFIN achieves a Sharpe Ratio of 2.67 and MCC of 0.523, reducing WMAPE to 3.14% and improving IC while lowering tail risk (CVaR) by more than 1.7 percentage points compared with Typhoon2. These gains are not solely attributable to scale: ablative comparisons show that MoFE, ECPS, CMAFN, and BUQM each contribute materially, with removing ECPS or MoFE degrading Sharpe by 10.9% and 9.7%, respectively. This comparative analysis highlights that domain-specific architectural choices and governance layers provide clear advantages over both pure language-model fine-tuning and multimodal models that are not explicitly constraint- or uncertainty-aware.
The Bayesian Uncertainty Quantification Module (BUQM) has direct implications for financial decision-making. By decomposing predictive uncertainty into aleatoric and epistemic components, BUQM enables risk teams to distinguish between intrinsically noisy environments (e.g., crisis periods with genuine volatility) and regions where the model is simply under-informed (e.g., new instruments, sparse history, or structural breaks). In practice, high aleatoric uncertainty can be mapped to tighter risk limits, more conservative sizing, or additional hedging, while high epistemic uncertainty can be used to trigger human review, demand more data, or suppress fully automated actions. When combined with ECPS, this yields policies such as “auto-execute only when uncertainty is low and all constraints are satisfied; otherwise require human approval,” making the role of model confidence explicit in governance processes.
Despite these strengths, the current framework has several limitations. First, operating a 70B-parameter model with MoE routing and Bayesian layers requires substantial computational resources and low-latency infrastructure, which may be prohibitive for smaller institutions or edge deployments, even with mixed-precision training, STA, and sparse experts. Second, HAFIN assumes access to multi-year, multi-asset, high-quality datasets; performance and calibration may degrade in regimes with thin data, changing microstructure, or significant labeling noise. Third, ECPS depends on correctly specified and timely updated constraint sets; in rapidly evolving regulatory contexts, stale or incomplete constraints could lead to over- or under-enforcement of policies. Finally, while uncertainty estimates improve decision transparency, they remain approximate and may be misinterpreted by non-technical stakeholders without careful interface design and training.
Future work will focus on relaxing these constraints and deepening integration with emerging financial technologies. On the modeling side, we plan to explore distillation of HAFIN into smaller student models and adapter-based variants that retain most of the governance and uncertainty behavior at a fraction of the computational cost, enabling broader deployment in latency-sensitive applications. On the data and systems side, incorporating additional modalities such as real-time payments data, on-chain transaction graphs, ESG and climate-risk signals, and alternative data sources will allow HAFIN to reason over a richer view of the financial ecosystem. Extending ECPS to cover model-risk management, climate and sustainability regulations, and scenario-based supervisory tests, as well as investigating online and continual-learning schemes that adapt safely to new regimes, are further priorities. Finally, tighter human-in-the-loop interfaces that expose uncertainty, constraint activations, and expert-routing explanations to decision-makers will be critical to ensuring that HAFIN remains not only accurate and compliant, but also trustworthy and usable in real-world financial decision processes.
References
- Lim, B.; Arık, S.Ö.; Loeff, N.; Pfister, T. Temporal fusion transformers for interpretable multi-horizon time series forecasting. International journal of forecasting 2021, 37, 1748–1764. [CrossRef]
- Su, L.; Zuo, X.; Li, R.; Wang, X.; Zhao, H.; Huang, B. A systematic review for transformer-based long-term series forecasting. Artificial Intelligence Review 2025, 58, 80. [CrossRef]
- Zong, C.; Wan, J.; Cascone, L.; Zhou, H. Stock movement prediction with multimodal stable fusion via gated cross-attention mechanism. Complex & Intelligent Systems 2025, 11, 396. [CrossRef]
- Liu, R.; Liu, H.; Huang, H.; Song, B.; Wu, Q. Multimodal multiscale dynamic graph convolution networks for stock price prediction. Pattern Recognition 2024, 149, 110211. [CrossRef]
- Sheng, Y.; Qu, Y.; Ma, D. Stock price crash prediction based on multimodal data machine learning models. Finance Research Letters 2024, 62, 105195. [CrossRef]
- Wei, Z.; Chen, D.; Zhang, Y.; Wen, D.; Nie, X.; Xie, L. Deep reinforcement learning portfolio model based on mixture of experts. Applied Intelligence 2025, 55, 347. [CrossRef]
- Lim, S.H.; Malik, I. Distributional reinforcement learning for risk-sensitive policies. Advances in Neural Information Processing Systems 2022, 35, 30977–30989.
- Tavakoli, M.; Chandra, R.; Tian, F.; Bravo, C. Multi-modal deep learning for credit rating prediction using text and numerical data streams. Applied Soft Computing 2025, 171, 112771. [CrossRef]
- Lu, Y.; Liu, L.; Nie, R. Mixture-of-Experts Based LLM Model For Financial Text Classification. In Proceedings of the Proceeding of the 2024 5th International Conference on Computer Science and Management Technology, 2024, pp. 483–486.
- Lee, J.T.; Yun, S.; Jain, M. Leaky gated cross-attention for weakly supervised multi-modal temporal action localization. In Proceedings of the Proceedings of the IEEE/CVF winter conference on applications of computer vision, 2022, pp. 3213–3222.
Figure 1.
Overview of the Hierarchical Adaptive Financial Intelligence Network (HAFIN) architecture. The system processes heterogeneous financial data through specialized modules including TAFET for temporal-aware embedding, Cross-Modal Fusion for multi-source integration, Mixture of Financial Experts for domain-specific processing, and an Ethical Constraint layer for regulatory compliance. Bayesian uncertainty quantification provides calibrated confidence estimates throughout the pipeline.
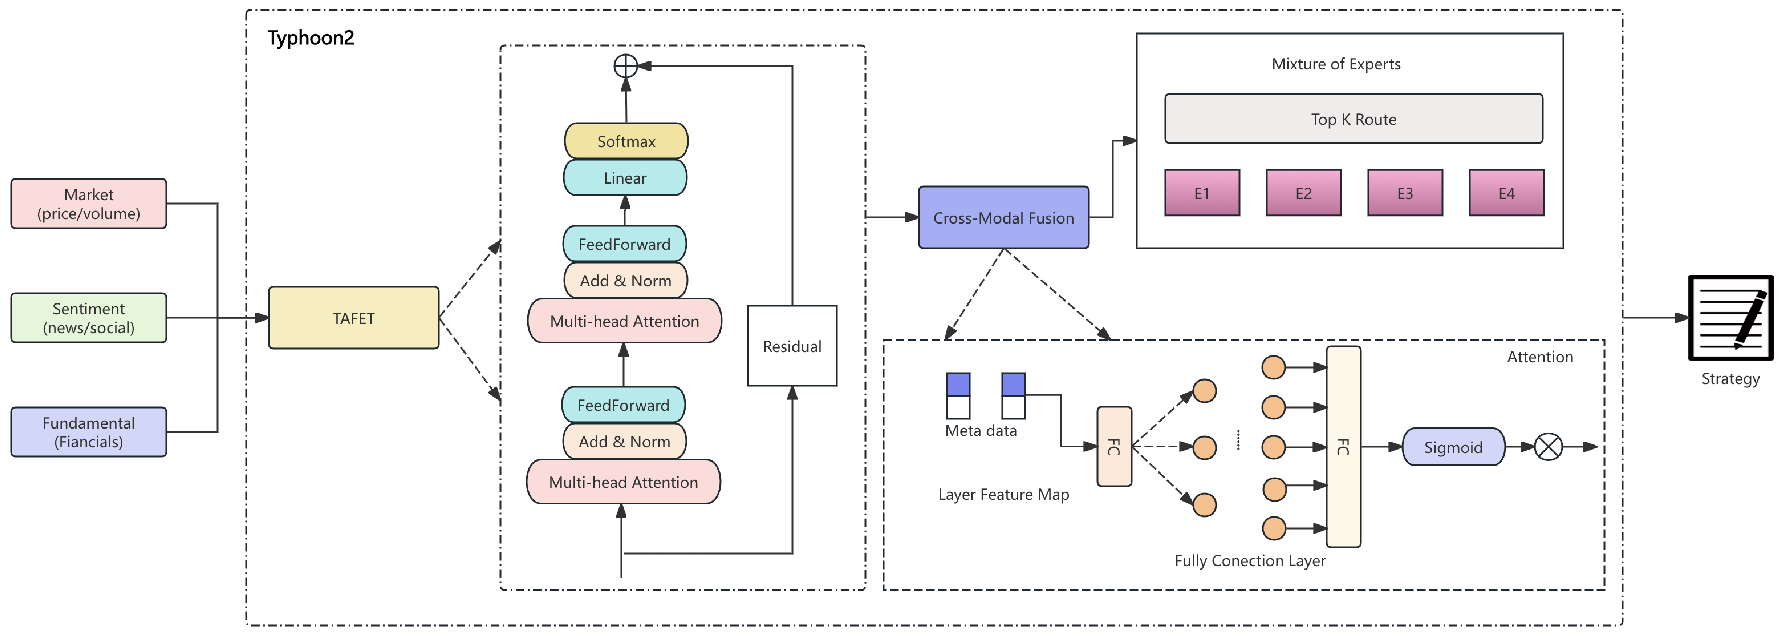
Figure 2.
Multi-scale temporal attention patterns learned by TAFET across different time horizons.
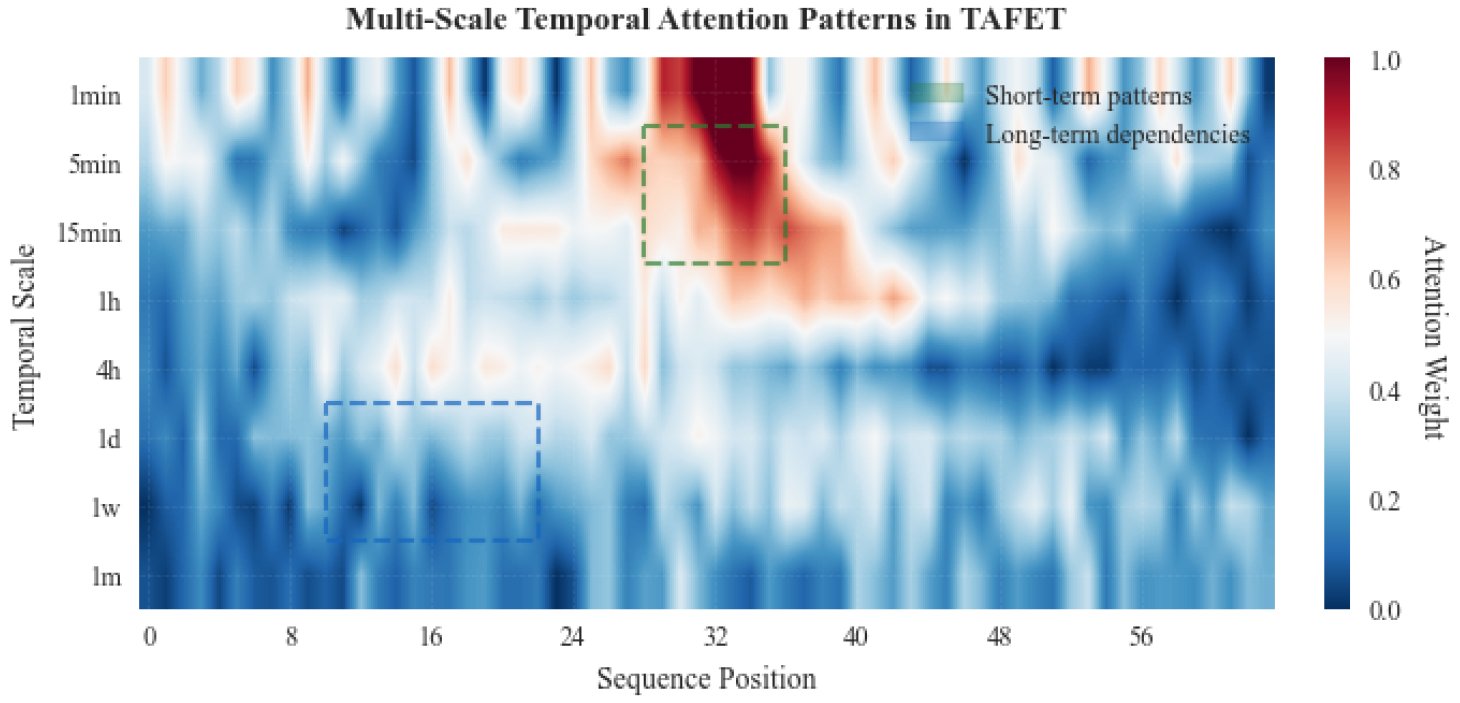
Figure 3.
Mixture of Financial Experts activation patterns. (a) Radial distribution showing the activation frequency of 32 expert networks, color-coded by their asset class specialization. (b) Co-activation network illustrating the correlation between expert selections, with edge thickness representing co-activation strength. The visualization demonstrates load balancing across experts while maintaining specialization in different financial domains.
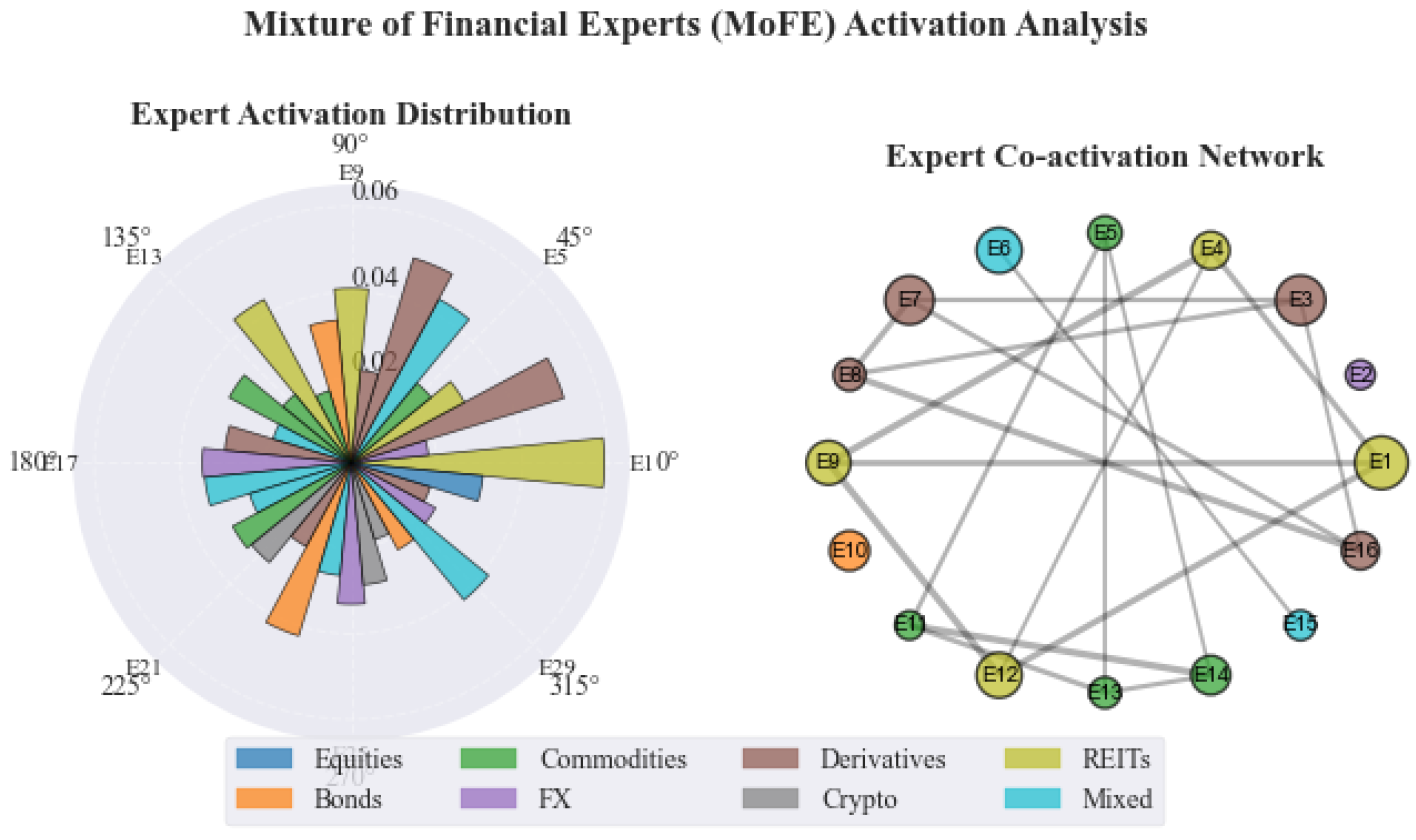
Figure 4.
Model indicator change chart.
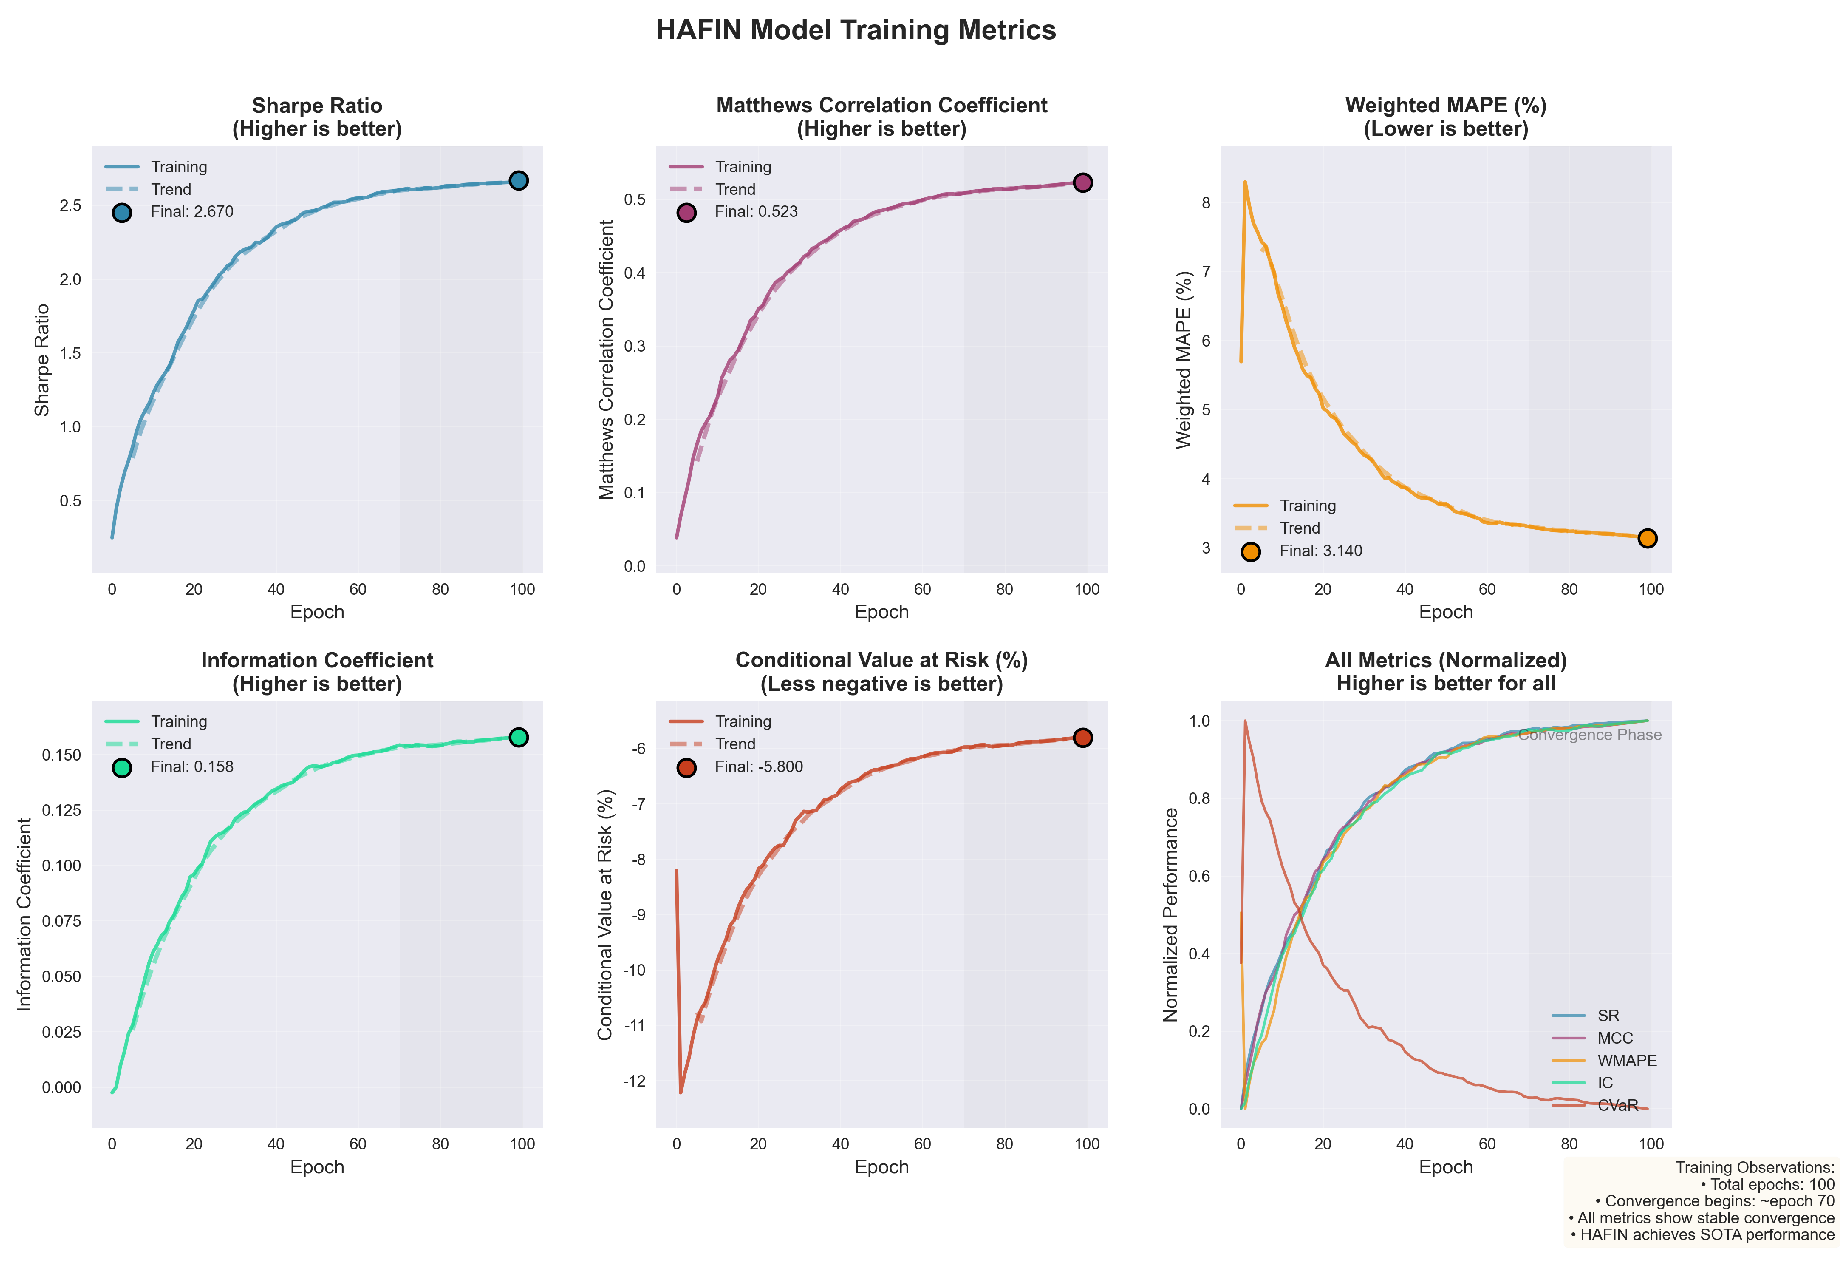

Table 1.
Performance comparison. Best in bold, second underlined.
| Model | SR↑ | MCC↑ | WMAPE↓ | IC↑ | CVaR↓ |
| Llama-2 70B | 1.82 | 0.412 | 4.23% | 0.089 | -8.7% |
| Llama-3.1 70B | 2.03 | 0.438 | 3.96% | 0.104 | -7.9% |
| Qwen2.5 72B | 2.11 | 0.451 | 3.87% | 0.112 | -7.5% |
| Typhoon2 70B | 2.08 | 0.445 | 3.92% | 0.107 | -7.6% |
| HAFIN | 2.67 | 0.523 | 3.14% | 0.158 | -5.8% |
Table 2.
Ablation study showing impact of removing components.
| Configuration | SR | SR | MCC | WMAPE |
| Full HAFIN | 2.67 | - | 0.523 | 3.14% |
| w/o MoFE | 2.41 | -9.7% | 0.492 | 3.42% |
| w/o ECPS | 2.38 | -10.9% | 0.486 | 3.51% |
| w/o BUQM | 2.51 | -6.0% | 0.508 | 3.28% |
| w/o CMAFN | 2.44 | -8.6% | 0.497 | 3.38% |
| w/o FCoT | 2.55 | -4.5% | 0.511 | 3.26% |
| Typhoon2+LoRA | 2.19 | -18.0% | 0.461 | 3.78% |
Disclaimer/Publisher’s Note: The statements, opinions and data contained in all publications are solely those of the individual author(s) and contributor(s) and not of MDPI and/or the editor(s). MDPI and/or the editor(s) disclaim responsibility for any injury to people or property resulting from any ideas, methods, instructions or products referred to in the content. |
© 2025 by the authors. Licensee MDPI, Basel, Switzerland. This article is an open access article distributed under the terms and conditions of the Creative Commons Attribution (CC BY) license (http://creativecommons.org/licenses/by/4.0/).
Copyright: This open access article is published under a Creative Commons CC BY 4.0 license, which permit the free download, distribution, and reuse, provided that the author and preprint are cited in any reuse.


