
Submitted:
25 November 2025
Posted:
26 November 2025
You are already at the latest version
Preprints on COVID-19 and SARS-CoV-2
Abstract
Background: Pulmonary impairments have been identified as some of the most complex and debilitating post-acute sequelae of SARS-CoV-2 infection (PASC) or long COVID. This study identified and characterised the specific forms of pulmonary impairments detected using pulmonary function tests (PFT), chest X-rays (CXR), and CT scans in patients with long COVID symptoms.
Methods: We conducted a single-centre retrospective study to evaluate 60 patients with long COVID who underwent pulmonary function tests (PFTs), chest X-rays (CXRs), and computed tomography (CT) scans. Pulmonary function in long COVID patients was assessed using defined thresholds for key test parameters, enabling categorisation into normal, restrictive, obstructive, and mixed lung-function patterns. We applied exact binomial (Clopper–Pearson) 95% confidence intervals to calculate the proportions of patients falling below the defined thresholds. We also assessed the relationship among spirometric indices, lung volumes, and diffusion capacity (DLCO) using scatter plots with corresponding linear regression. The findings from the CXRs and CT scans were categorised, and their prevalence was calculated.
Results: A total of 60 patients with long COVID symptoms (mean age 60 ± 13 years; 57% female) were evaluated. The cohort was ethnically diverse and predominantly non-smokers, with a mean BMI of 32.4 ± 6.3 kg/m². Pulmonary function testing revealed that most patients had preserved spirometry, with mean FEV1 and FVC above 90% predicted. However, a significant proportion exhibited reductions in lung volumes, with total lung capacity (TLC) decreasing in 35%, and diffusion capacity (TLCO) decreasing in 75%. Lung function pattern analysis showed 88% of patients had normal function, while 12% displayed a restrictive pattern; no obstructive or mixed patterns were observed. Radiographic assessment revealed that 58% of chest X-rays were normal, whereas CT scans showed ground-glass opacities in 65% and fibrotic changes in 55% of patients, along with findings such as atelectasis, air trapping, and bronchial wall thickening.
Conclusion
This study reveals that long COVID is marked by preserved spirometry yet significant alveolar gas exchange impairment, with frequent diffusion deficits, fibrotic changes, and ground-glass opacities indicating persistent parenchymal and microvascular injury. These findings highlight the need for ongoing research and multidisciplinary management to address the enduring impact of chronic pulmonary dysfunction.
Keywords:
long COVID
; pulmonary function
; diffusion impairment
; fibrotic changes
; ground-glass opacities
; restrictive pattern
; chest CT scan
; alveolar gas exchange
1. Introduction
Pulmonary impairments have been identified as some of the most complex and debilitating post-acute sequelae of SARS-CoV-2 infection (PASC) or long COVID. The incidence of long COVID is significant; findings suggest that 10% to 70% of those who have recovered from COVID-19 continue to suffer from new or existing symptoms [1,2,3]. The disease presents a broad spectrum of incapacitating symptoms, affecting several bodily systems, which include the respiratory, cardiovascular, neurological, gastrointestinal, and musculoskeletal systems [4,5,6]. The intricate nature of long COVID is evident in its association with more than 200 symptoms, requiring more investigation into its effects on the human body [7,8,9].
Survivors of severe COVID-19, especially those who suffered from acute respiratory distress syndrome (ARDS), often develop long-term pulmonary complications such as pulmonary fibrosis, which arises from the excessive accumulation of extracellular matrix in the lung interstitium [10,11]. The mechanical stress imposed by invasive ventilation during ICU stays further exacerbates lung injury, contributing to the development of chronic pulmonary conditions [12,13]. This aligns with observations that patients recovering from ARDS frequently exhibit impaired lung function, which can persist for months or even years post-infection [14]. Continued dyspnoea and fatigue are concerning, particularly in patients who initially had abnormal lung function [15].
Moreover, a significant percentage of patients experiencing long COVID have demonstrated a low diffusing capacity of the lungs for carbon monoxide (DLCO) alongside normal chest scans, possibly stemming from pulmonary endothelial dysfunction and microthrombosis [16]. Individuals with COVID-19 experience improvements in lung function over time, with significant recovery in DLCO and other measures of pulmonary function observed between three and seventeen months following infection [17,18].
Computed tomography scans (CT scans) of COVID-19 survivors reveal persistent inflammation in up to 71% of cases two to three months after hospital discharge [19]. A systematic review showed that patients with long COVID frequently exhibit interstitial fibrosis, pleural abnormalities, and airway changes, which can be classified into distinct imaging categories [20]. Three to six months after infection, a significant number of patients continued to exhibit abnormal CT imaging findings [18]. The lasting effects of COVID-19 on the respiratory system can be substantial, often manifesting as impaired lung function and persistent symptoms such as dyspnoea and fatigue.
Despite the growing number of studies on long COVID, a critical gap remains in our understanding of its long-term respiratory consequences, the mechanisms underlying these impairments, and the most effective strategies for assessing and managing them. Also, studies have highlighted the persistence of breathlessness, reduced exercise capacity, and abnormal pulmonary function in individuals who have ostensibly recovered from the acute infection. However, heterogeneity in patient populations, inconsistencies in diagnostic criteria, and variations in follow-up periods have led to a fragmented evidence base. This has hindered the development of robust clinical guidelines, leaving clinicians uncertain when treating affected individuals. There is a growing body of literature on long COVID, but studies focusing on pulmonary impairments that use a combination of PFTs, CXRs, and CT scans are limited. Understanding the prevalence and nature of these impairments is essential for monitoring and managing patient care.
This study identified and characterised the specific forms of pulmonary impairments detected using pulmonary function tests (PFT), chest X-rays (CXR), and CT scans in patients with long COVID symptoms. These multimodal approaches (PFTs, CXRs, and CT scans) helped to identify specific patterns and severities of impairments that might be missed if only one diagnostic method were used.
2. Materials and Methods
2.1. Research Design
This was a single-centre, retrospective study of patients managed for long COVID symptoms between April 2021 and December 2023 at a University Hospital in London. The inclusion criteria included adult patients (≥ 18 years old) who were managed for long COVID and underwent PFTs with/without CXR and CT scans. The study excluded all other long COVID patients without PFTs. The consultant physicians confirmed the diagnosis of long COVID and recommended PFT, CXR, and CT scans based on the patient's clinical condition. The study was confined to the use of existing, de-identified data.
2.2. Data Source and Management
The data source was the electronic patient record (EPR). We collected patients' demographic information, spirometry: % Predictive Value for Forced Expiratory Volume in 1 Second (FEV1), Forced Vital Capacity (FVC), Vital Capacity (VC), Forced Expiratory Volume in 1 second/Forced Vital Capacity ratio(FEV/VC), Peak Expiratory Flow(PEF), Maximal Mid-Expiratory Flow (MMEF75/25), lung Volume: Total Lung Capacity (TLC), expiratory Reserve Volume (ERV), residual volume (RV), RV/TLC, diffusion Capacity: % Predictive Value for Diffusing Capacity of the Lungs for Carbon Monoxide—Single Breath (TLCO_SB), VA(alveolar volume) single Breath and Imaging: Chest X-ray and CT scan findings. Data were extracted and managed using Castor Electronic Data Capture (EDC).
2.3. Study Outcomes
The primary outcome was to identify and characterise the specific forms of pulmonary impairments in patients with long COVID symptoms using PFT. The secondary outcomes were to identify and characterise specific forms of pulmonary impairments in patients with long COVID symptoms using CXR and CT scans.
2.4. Ethical Approval
The Health Research Authority (HRA) in England and Health and Care Research Wales (HCRW) granted ethical approval for the research study under the Research Ethics Committee reference number 23/HRA/1637.
2.5. Statistical Analysis
The data was analysed using R version 4.3.3. Multiple imputation by chained equations (MICE) was employed to address missing data in this study. Five imputed datasets were generated using the predictive mean matching (PMM) method, with 50 iterations and a seed value of 500 to ensure reproducibility.
Descriptive statistics were used to summarise the dataset's key characteristics. Continuous variables were summarised using their mean and standard deviation, while categorical variables were presented with their counts and percentages. The resulting descriptive statistics facilitated a deeper understanding of the patient population and set the stage for further statistical analyses.
The thresholds for pulmonary function test (PFT) parameters were defined to identify reduced values. Specifically, thresholds were set at 80% for Forced Expiratory Volume in 1 Second (FEV1), Forced Vital Capacity (FVC), Total Lung Capacity (TLC), Diffusing Capacity of the Lungs for Carbon Monoxide—Single Breath (TLCO_SB), and Vital Capacity (VC), and at 75% for the ratio of Forced Expiratory Volume in 1 Second to Vital Capacity (FEV/VC) [21]. Using these thresholds, the percentage of patients was calculated for values below each threshold. These percentages represented the proportion of patients whose lung function parameters were below the defined thresholds.
Patients were classified into lung-function pattern categories (Normal, Restrictive, Obstructive, Combined) using pre-specified spirometric and gas transfer thresholds. Restrictive pattern was defined as FVC < 80% predicted and TLC < 80% predicted with TLCO (DLCO single-breath) < 80% predicted and a preserved FEV1 (≥ 65% predicted) and FEV1/FVC ratio ≥ 70%. An obstructive pattern was defined as FEV1 < 80% predicted and FEV1/FVC < 70% with preserved lung volumes (TLC ≥ 80% predicted or FVC ≥ 80% predicted) and TLCO < 80% predicted [21]. A combined pattern was defined as the presence of obstructive physiology (FEV1 < 80% and FEV1/FVC < 70%) in conjunction with reduced lung volumes (either FVC < 80% or TLC < 80%). Cases that did not meet any of these criteria were labelled "normal". The classification algorithm required non-missing values for the component tests used in each rule; rows with missing component values were not assigned to a category unless the remaining criteria could be evaluated. The precedence of assignment was Restrictive first, then Obstructive, Combined, and finally Normal, to avoid overlapping assignments.
Counts for each pattern were obtained from the labelled data and converted to proportions. Percentages were calculated as (count / N) × 100, where N is the total number of patients with available pattern classification (N = 60). Exact binomial (Clopper–Pearson) 95% confidence intervals for the proportions were calculated because some cell counts were small; the Clopper–Pearson method provides exact coverage for proportions in small samples and is preferable to normal approximations when observed events are few. Exact confidence intervals and binomial tests were computed in R using the base function binom. test. All analyses and plots were produced in R using the dplyr and ggplot2 packages. Sensitivity analyses were performed to assess the impact of alternative FEV1/FVC cut-offs (for example, 70% versus 75%) and to evaluate the effect of removing the TLCO requirement from the obstructive definition.
The clinical characteristics of long COVID, chest X-ray (CXR) and computed tomography (CT) scan findings were systematically evaluated. The radiological and tomographical observations were categorised into key groups that reflected common patterns, such as ground-glass opacities, fibrosis, or airway changes. For each category, both the number and percentage of patients exhibiting these features were calculated, providing insight into the frequency with which each type of abnormality occurred in the study population. This approach enabled a comprehensive visual and quantitative assessment of lung involvement, complementing pulmonary function tests and clarifying the range and severity of respiratory manifestations associated with long COVID.
The findings were reported in accordance with the standards outlined in the Strengthening the Reporting of Observational Studies in Epidemiology (STROBE) guidelines.
3. Results
3.1. Characteristics of the Study Participants
A total of 60 patients with long COVID symptoms were included in the study. The mean age of the patients was 60 ± 13 years (Table 1); 57% female and 43% male. The mean BMI was 32.4 ± 6.3 kg/m2. Forty per cent were White, 27% Asian, 20% Black and 13% were of any other ethnicity. Most patients (67%) were non-smokers, 30% were ex-smokers, and 3.3% currently smoke. 35% of patients were on different medications.
The spirometry means measures - FEV1 was 92% (±21%), FVC was 94% (±23%), and VC was 92% (±22%), the ratio of FEV1 to VC (FEV/VC) was 102% (±14%), PEF was 100% (23%), MMEF75/25 was 93% (±44%) of the predicted values. The lung volume means – TLC was 86% (±18%), the ERV was 95% (±52%), the RV was 83% (±25%), and the ratio of RV to TLC (RV/TLC) was 98% (±19%) of the predicted values. The diffusion capacity means – TLCO SB was 83% (±92%), and the VA Single Breath was 77% (±17%) of the predicted values.
3.2. Pulmonary Function Test
Table 2 shows a decrease in FEV1 among 30% of patients. FVC abnormalities were observed in 25% of patients (p<0.001). Among the patients, a reduction in the FEV/VC ratio was observed in 3.33%. TLC was significantly decreased (p < 0.001) in 35% of the patient population. TLCO showed the most significant decrease, affecting 75% of patients, while VC decreased by 25%.
3.3. Lung Function Patterns
Figure 1.0 shows that most individuals with long COVID had "normal" lung function, while a small minority had a restrictive pattern. 53 out of 60 patients were labelled Normal, which is 88.33% (95% Clopper–Pearson confidence interval 77.43% to 95.18%). Seven out of 60 patients were labelled Restrictive, which is 11.67% (95% Clopper–Pearson confidence interval 4.82% to 22.57%). There were no cases labelled Obstructive or combined/mixed patterns.
Figure 2 displays the relationships between various spirometric measurements using five scatter plots with corresponding linear regression lines. Plot (a) shows the relationship between PEF (% Predicted) and FVC (% Predicted). The data points were distributed around a positively sloped regression line, suggesting a positive correlation between PEF and FVC (i.e., as FVC increases, PEF tends to increase as well). Plot (b) illustrates the relationship between FEV1 (% Predicted) and FVC (% Predicted). The scatter plot showed a positive correlation, with data points clustered around an upward-sloping regression line, suggesting that higher FVC values between FVC (% Predicted) and TLC (% Predicted). The data points were scattered around a positively sloped regression line, suggesting a positive correlation between FVC and TLC, indicating that FVC also tends to increase as TLC increases. Plot (d) shows the relationship between RV (% Predicted) and TLC (% Predicted). The scatter plot indicated a positive correlation, with data points distributed around an upward-sloping regression line, suggesting that higher TLC values are associated with higher RV values. Plot (e) depicts the relationship between the RV/TLC Ratio (% Predicted) and TLC (% Predicted). The data points were scattered around a negatively sloped regression line, indicating a negative correlation between the RV/TLC Ratio and TLC, with the RV/TLC ratio decreasing as TLC increases.
3.4. Radiographic and Tomographic Findings
CXR findings (Figure 3a and 3b) showed that 58.3% of patients had clear lung fields, while 11.7% had interstitial changes, atelectasis (8.3%), fibrotic changes (6.7%), opacities/infiltrates (5.0%), and other changes (3.3%).
Tomographic findings (Figure 4) revealed that only 22.5% had no significant CT findings. Most (65%) patients' CT scans showed ground-glass opacities (GGOs), with 30% showing widespread involvement, 20% localised, and 15% residual. Fibrotic changes were observed in 55% of cases, including interstitial changes (25%), localised fibrosis (17.5%), and diffuse fibrosis (12.5%). In addition, 32.5% of patients displayed atelectasis and air trapping, including 15% with patchy atelectasis, 10% with curvilinear atelectasis, and 7.5% with mosaic attenuation. Nodules and nodularity were found in 12.5% of cases (7.5% perilymphatic and 5.0% pulmonary). Bronchial wall thickening was observed in 10%, pleural effusions in 5%, and post-infective changes in 7.5% of the patients.
4. Discussion
The present study characterised the chronic pulmonary phenotype in a cohort of patients experiencing long COVID, or Post-Acute Sequelae of SARS-CoV-2 Infection (PASC). The core findings reveal a critical dissociation: preserved bulk airflow mechanics coexist with profound impairment in alveolar gas exchange, suggesting that persistent parenchymal and microvascular damage is the dominant pathological signature in this patient group. The most significant physiological abnormality observed was the severely reduced diffusing capacity for carbon monoxide (), found in of the cohort. This high prevalence is consistent with the higher range of reported rates in post-COVID survivors [22], and identifies severe diffusion impairment as the key physiological feature. In stark contrast, mean spirometry values were largely normal ( at predicted, at predicted), and only of patients exhibited a decreased ratio, effectively minimising generalised, clinically significant obstructive disease as the primary cause of chronic respiratory morbidity[23]. This dissociation emphasises that , which assesses the functional integrity of the alveolar-capillary unit, is an essential biomarker for identifying significant underlying parenchymal and microvascular injury in PASC patients, where routine spirometry may provide false reassurance [24].
While diffusion impairment was dominant, intrinsic restrictive lung disease was also observed, with of patients showing reduced Total Lung Capacity () and meeting the criteria for a formal restrictive ventilatory pattern. This finding aligns with the pulmonary sequelae reported following previous coronavirus epidemics (SARS-CoV-1 and MERS), where decreases in (5.2– of cases) and (15.5– of cases) were documented months to years after acute infection [25]. The co-occurrence of reduced and severe reduction establishes a "diffusion-impaired restriction" phenotype in a subset of the cohort, often linked to severe acute infection courses [26]. Furthermore, while lung function parameters improved in longitudinal studies, especially in those with severe disease [27], the persistence of deficits in this chronic-phase cohort suggests stable or potentially irreversible damage.
The functional abnormalities observed are strongly correlated with persistent structural damage identified on Computed Tomography () scans, where only of patients had no significant findings. The most frequent abnormality was persistent ground-glass opacities (), observed in of patients. While can reflect residual inflammation or an Organising Pneumonia () pattern that may resolve [28], their high prevalence in the chronic phase, combined with the presence of fibrotic changes in of patients, confirms a high burden of Post-COVID Interstitial Lung Disease (PC-ILD). Fibrotic changes, including interstitial, localised, and diffuse fibrosis, represent irreversible architectural distortion [29] and are associated with advanced age and disease severity [30]. The reduction in shows explicitly a high specificity (approximately ) for predicting these fibrotic-like changes on scans.
The high prevalence of fibrotic changes () versus formal restriction () may be partly reconciled by the concurrent finding of air trapping in of cases. Air trapping is a radiographic marker of Small Airway Dysfunction () [22]. leads to non-uniform gas distribution and hyperinflation, which results in increased Residual Volume () [31]. This increased can artificially elevate the measured , potentially masking volume loss due to parenchymal scarring [32]. The presence of , often undetected by routine spirometry [31], is a significant contributor to dyspnea and reduction via ventilation-perfusion () mismatch. Sensitive techniques like impulse oscillometry (IOS) or multiple breath washout () are needed to objectively quantify [33].
Mechanistically, the severe reduction in primarily points to injury of the alveolar-capillary membrane or the pulmonary capillary volume () [27]. Post-COVID pathology is known to involve diffuse endothelial injury and persistent pulmonary microthrombosis, driven by factors such as ongoing excessive Neutrophil Extracellular Trap () formation [34]. The reduction in effective drastically reduces . While the absence of the transfer coefficient ( or ) is a limitation, its inclusion in future analyses is crucial, as a reduced with a preserved suggests reduced alveolar volume or perfusion defects, which may be reversible, whereas reduced alongside a reduced is highly suggestive of irreversible fibrosis [30]. Based on the fibrosis rate, a portion of this cohort likely exhibits the latter, irreversible pattern[34].
The demographic profile of the cohort—average age 60 years and high mean Body Mass Index () of —is relevant. Obesity is an independent risk factor for severe acute COVID-19 and subsequent development [35], and may worsen outcomes due to its pro-inflammatory and pro-thrombotic state [36]. Moreover, obesity independently imposes an extrinsic restrictive mechanical load, which can contribute to reduced and [37], thereby confounding the distinction between intrinsic fibrotic restriction and extrinsic mechanical restriction. The older average age is also consistent with established findings linking increased age to more persistent structural changes, including and fibrotic changes, up to two years post-infection.[37] Furthermore, the ethnic diversity (20% Black) necessitates awareness of documented health disparities, as non-Hispanic Black patients have been associated with a statistically significant lower % predicted compared to White and Hispanic patients in post-COVID cohorts, potentially compounded by lower access to essential care like pulmonary rehabilitation [38].
These findings translate into clear clinical recommendations. Comprehensive pulmonary function testing, including and , must be mandatory for symptomatic patients. Given the high rate of structural abnormalities, imaging is strongly indicated for patients with persistent or worsening respiratory symptoms lasting for more than 3 months.[39,40,41]. The presence of (suggestive of organising pneumonia) and fibrotic changes mandates careful therapeutic consideration. Also, Pulmonary Rehabilitation () remains a crucial cornerstone, providing functional gains in and exercise capacity, especially valuable for this older, high-BMI cohort with persistent functional limitations.
The limitations of this study include the lack of pre-COVID data and detailed longitudinal follow-up, which prevents definitive assessment of progression or the exclusion of pre-existing conditions. The absence of a carbon monoxide transfer coefficient and data restricts the precise mechanistic characterisation of the DLCO deficit, and reliance on conventional spirometry may underestimate the true prevalence of . Without baseline or pre-COVID pulmonary assessments, it is difficult to determine the extent to which observed impairments are directly attributable to SARS-CoV-2 infection or represent pre-existing conditions. Although a comprehensive set of pulmonary function tests and imaging studies was performed, the study did not include advanced techniques such as hyperpolarised gas MRI or impulse oscillometry, which may offer greater sensitivity in detecting small airway disease.
5. Conclusions
In conclusion, this study demonstrates that long COVID is characterised by a striking dissociation between preserved spirometric measures and severe impairment in alveolar gas exchange, with a high prevalence of diffusion deficits and persistent radiological abnormalities. The dominance of reduced TLCO and the frequency of fibrotic and ground-glass changes on CT scans highlight ongoing parenchymal and microvascular injury as central features of post-acute sequelae. Notably, intrinsic restrictive patterns and small airway dysfunction contribute further to the complex pulmonary phenotype observed. The demographic profile, older age, elevated BMI, and ethnic diversity reflect known risk factors for both acute severity and chronicity of symptoms. These findings highlight the necessity of comprehensive pulmonary function testing and routine CT imaging in symptomatic long COVID patients, alongside targeted therapeutic interventions such as pulmonary rehabilitation. Limitations, including the lack of pre-COVID baseline data and advanced small airway assessment, warrant further longitudinal research to clarify the trajectory and reversibility of these sequelae. Continuous surveillance and multidisciplinary management remain essential to address the significant and potentially enduring burden of chronic pulmonary dysfunction in this population.
Author Contribution: LPD developed the study protocol, conducted the study, analysed the data, and drafted the manuscript. YR identified the patients, reviewed the study protocol, and supervised data collection. FIFA and JEA provided oversight and reviewed the study protocol and the manuscript. RK oversaw the study, reviewed the protocol and manuscript, and provided overall supervision.
Funding
This research was funded by Croydon Health Services NHS Trust and Kingston University London. The APC was funded by Kingston University London.
Institutional Review Board Statement
The Health Research Authority (HRA), England, and Health and Care Research Wales (HCRW) approved the study with REC reference 23/HRA/1637.
Informed Consent Statement
Not applicable. The study was retrospective in nature.
Data Availability Statement
Data will be made available on request.
Acknowledgments
We acknowledged the Croydon Health Services NHS Trust London and the Research Office Team at the Croydon University Hospital, London.
Conflicts of Interest
The authors declare no conflicts of interest. The funders had no role in the design of the study; in the collection, analyses, or interpretation of data; in the writing of the manuscript; or in the decision to publish the results”.
Abbreviations
The following abbreviations are used in this manuscript:
| 6MWT | Six-Minute Walk Test |
| ARDS | Acute Respiratory Distress Syndrome |
| BMI | Body Mass Index |
| COVID-19 | Coronavirus Disease 2019 |
| CXR | Chest X-Ray |
| CT | Computed Tomography |
| DLCO | Diffusing Capacity of the Lungs for Carbon Monoxide |
| FVC | Forced Vital Capacity |
| FEV₁ | Forced Expiratory Volume in One Second |
| FRC | Functional Residual Capacity |
| GOLD | Global Initiative for Chronic Obstructive Lung Disease |
| HRCT | High-Resolution Computed Tomography |
| ICU | Intensive Care Unit |
| ILD | Interstitial Lung Disease |
| LC | Long COVID |
| LTOT | Long-Term Oxygen Therapy |
| MRI | Magnetic Resonance Imaging |
| mMRC | Modified Medical Research Council Dyspnea Scale |
| PFT | Pulmonary Function Test |
| RV | Residual Volume |
| SARS-CoV-2 | Severe Acute Respiratory Syndrome Coronavirus 2 |
| TLC | Total Lung Capacity |
| V/Q | Ventilation/Perfusion |
| VATS | Video-Assisted Thoracoscopic Surgery |
| WHO | World Health Organisation |
| Xe-MRI | Xenon-129 Magnetic Resonance Imaging |
References
- Yong, S. Long COVID or Post-COVID-19 Syndrome: Putative Pathophysiology, Risk Factors, and Treatments. Infect. Dis. 2021, 53, 737–754. [Google Scholar] [CrossRef]
- Giuliano, M.; Tiple, D.; Agostoni, P.; et al. Italian Good Practice Recommendations on Management of Persons with Long-COVID. Front. Public Health 2023, 11, 1122141. [Google Scholar] [CrossRef]
- Torres, G. Exercise Is the Most Important Medicine for COVID-19. Curr. Sports Med. Rep. 2023, 22, 284–289. [Google Scholar] [CrossRef]
- Dahal, A.; Pohl, G.; Laxmi, R.; et al. Long COVID-19 Effects (Chronic COVID-19 Syndrome) in Nepalese Cohort Recovered from SARS-CoV-2 Infection. J. Curr. Med. Res. Opin. 2023, 6, 1884–1893. [Google Scholar] [CrossRef]
- Sideratou, C. Persisting Shadows: Unravelling the Impact of Long COVID-19 on Respiratory, Cardiovascular, and Nervous Systems. Infect. Dis. Rep. 2023, 15, 806–830. [Google Scholar] [CrossRef]
- Somalwar, S. Long COVID and Perimenopause. J. S. Asian Feder. Obstet. Gynaecol. 2024, 16, 174–176. [Google Scholar] [CrossRef]
- Michalski, J.E.; Kurche, J.S.; Schwartz, D.A.; et al. From ARDS to Pulmonary Fibrosis: The Next Phase of the COVID-19 Pandemic? Transl. Res. 2022, 241, 13–24. [Google Scholar] [CrossRef] [PubMed]
- Zheng, Z.; Peng, F.; Zhou, Y.; et al. Pulmonary Fibrosis: A Short- or Long-Term Sequela of Severe COVID-19? Chin. Med. J. Pulm. Crit. Care Med. 2023, 1, 77–83. [Google Scholar] [CrossRef] [PubMed]
- Hajjar, L.A.; Costa, I.B.S.; Rizk, S.I.; et al. Intensive Care Management of Patients with COVID-19: A Practical Approach. Ann. Intensive Care 2021, 11, 36. [Google Scholar] [CrossRef] [PubMed]
- Myall, K.; Mukherjee, B.; West, A.; et al. How COVID-19 Interacts with Interstitial Lung Disease. Breathe (Sheff.) 2022, 18, 210158. [Google Scholar] [CrossRef]
- Mart, M.F.; Ware, L.B. The Long-Lasting Effects of the Acute Respiratory Distress Syndrome. Expert Rev. Respir. Med. 2020, 14, 577–586. [Google Scholar] [CrossRef]
- Huijts, T.; Witvliet, M.; Balaj, M.; et al. Assessing the Long-Term Health Impact of COVID-19: The Importance of Using Self-Reported Health Measures. Scand. J. Public Health 2023, 51, 645–647. [Google Scholar] [CrossRef]
- Karmakar, S.; Rungta, R.; Singh, K.; et al. Post-COVID-19 Pulmonary Fibrosis: Report of Two Cases. EMJ Respir. 2021. [CrossRef]
- Sweis, J. From Acute Infection to Prolonged Health Consequences: Understanding Health Disparities and Economic Implications in Long COVID Worldwide. Int. J. Environ. Res. Public Health 2024, 21, 325. [Google Scholar] [CrossRef] [PubMed]
- Wheibe, E. The Multisystem Effects of Long COVID Syndrome and Potential Benefits of Massage Therapy in Long COVID Care. Int. J. Ther. Massage Bodywork Res. Educ. Pract. 2024, 17, 19–42. [Google Scholar] [CrossRef] [PubMed]
- Yong, S.; Liu, S. Proposed Subtypes of Post-COVID-19 Syndrome (or Long-COVID) and Their Respective Potential Therapies. Rev. Med. Virol. 2021, 32. [Google Scholar] [CrossRef]
- Zhao, Y.; Shang, Y.; Song, W.; et al. Follow-Up Study of the Pulmonary Function and Related Physiological Characteristics of COVID-19 Survivors Three Months After Recovery. EClinicalMedicine 2020, 25, 100463. [Google Scholar] [CrossRef]
- Biswas, S. Pulmonary Features of Long COVID-19: Where Are We Now? J. Clin. Oncol. Rep. 2023, 2, 1–5. [Google Scholar] [CrossRef]
- Montani, D.; Savale, L.; Noël, N.; et al. Post-Acute COVID-19 Syndrome. Eur. Respir. Rev. 2022, 31, 210185. [Google Scholar] [CrossRef]
- Gerayeli, F.; Park, H.Y.; Milne, S.; et al. Single-Cell Sequencing Reveals Cellular Landscape Alterations in the Airway Mucosa of Patients with Pulmonary Long COVID. Eur. Respir. J. 2024, 64, 2301947. [Google Scholar] [CrossRef]
- Ponce, M.C.; Sankari, A.; Sharma, S. Pulmonary Function Tests. In StatPearls [Internet]; StatPearls Publishing: Treasure Island, FL, USA, 2025. [Google Scholar]
- Funke-Chambour, M.; Bridevaux, P.-O.; Clarenbach, C.F.; et al. Swiss Recommendations for the Follow-Up and Treatment of Pulmonary Long COVID. Respiration 2021, 100, 826–841. [Google Scholar] [CrossRef]
- Suppini, N.; Fira-Mladinescu, O.; Traila, D.; et al. Longitudinal Analysis of Pulmonary Function Impairment One Year Post-COVID-19: A Single-Center Study. J. Pers. Med. 2023, 13, 1190. [Google Scholar] [CrossRef] [PubMed]
- Aritonang, M.E.; Pandia, P.; Pradana, A.; et al. Factors Associated with Small Airway Obstruction in COVID-19 Survivors: A Cross-Sectional Study Among Health-Care Providers. Narra J. 2023, 3, e437. [Google Scholar] [CrossRef] [PubMed]
- Teles, G.B.D.S.; Fonseca, E.K.U.N.; Capobianco, J.; et al. Correlation Between Chest Computed Tomography Findings and Pulmonary Function Test Results in the Post-Recovery Phase of COVID-19. Einstein (São Paulo) 2023, 21, eAO0288. [Google Scholar] [CrossRef]
- Alrajhi, N.N. Post-COVID-19 Pulmonary Fibrosis: An Ongoing Concern. Ann. Thorac. Med. 2023, 18, 173–181. [Google Scholar] [CrossRef] [PubMed]
- [Entry removed — "Vxccc" appears to be an invalid placeholder].
- Thomas, M.; Price, O.J.; Hull, J.H. Pulmonary Function and COVID-19. Curr. Opin. Physiol. 2021, 21, 29–35. [Google Scholar] [CrossRef]
- Laveneziana, P.; Straus, C.; Meiners, S. How and to What Extent Immunological Responses to SARS-CoV-2 Shape Pulmonary Function in COVID-19 Patients. Front. Physiol. 2021, 12, 628288. [Google Scholar] [CrossRef]
- Vontetsianos, A.; Chynkiamis, N.; Anagnostopoulou, C.; et al. Small Airways Dysfunction and Lung Hyperinflation in Long COVID-19 Patients as Potential Mechanisms of Persistent Dyspnoea. Adv. Respir. Med. 2024, 92, 329–337. [Google Scholar] [CrossRef]
- Cimmino, G.; D'Elia, S.; Morello, M.; et al. Cardio-Pulmonary Features of Long COVID: From Molecular and Histopathological Characteristics to Clinical Implications. Int. J. Mol. Sci. 2025, 26, 7668. [Google Scholar] [CrossRef]
- Balkissoon, R. Journal Club: The Intersection of Racial/Ethnic Disparities in Coronavirus Disease 2019 and COPD. Chronic Obstr. Pulm. Dis. 2021, 8, 292–302. [Google Scholar] [CrossRef]
- Poerio, A.; Carlicchi, E.; Lotrecchiano, L.; et al. Evolution of COVID-19 Pulmonary Fibrosis-Like Residual Changes over Time: Longitudinal Chest CT up to 9 Months After Disease Onset. SN Compr. Clin. Med. 2022, 4, 57. [Google Scholar] [CrossRef]
- Liu, W.; Feng, Q.; Yuan, X.; et al. Diagnostic Value of Lung Function Tests in Long COVID: Analysis of Positive Bronchial Provocation Test Outcomes. Front. Med. 2025, 11, 1512658. [Google Scholar] [CrossRef]
- Bretas, D.C.; Leite, A.S.; Mancuzo, E.V.; et al. Lung Function Six Months After Severe COVID-19: Does Time, in Fact, Heal All Wounds? Braz. J. Infect. Dis. 2022, 26, 102352. [Google Scholar] [CrossRef]
- Salvi, S.S.; Ghorpade, D.; Dhoori, S.; et al. Role of Antifibrotic Drugs in the Management of Post-COVID-19 Interstitial Lung Disease: A Review of Literature and Expert Working Group Report. Lung India 2022, 39, 177–186. [Google Scholar] [CrossRef]
- Durak, G.; Akin, K.; Cetin, O.; et al. Radiologic and Clinical Correlates of Long-Term Post-COVID-19 Pulmonary Sequelae. J. Clin. Med. 2025, 14, 4874. [Google Scholar] [CrossRef] [PubMed]
- Treasa, S. Post-COVID Pulmonary Fibrosis: Pathophysiological Mechanisms, Diagnostic Tools, and Emerging Therapies. J. Pulmonol. Respir. Res. 2025, 9, 009–013. [Google Scholar] [CrossRef]
- Suppini, N.; Fira-Mladinescu, O.; Traila, D.; et al. Longitudinal Analysis of Pulmonary Function Impairment One Year Post-COVID-19: A Single-Centre Study. J. Pers. Med. 2023, 13, 1190. [Google Scholar] [CrossRef] [PubMed]
- Patton, M.; Benson, D.; Robison, S.; et al. Characteristics and Determinants of Pulmonary Long COVID. JCI Insight 2024, 9. [Google Scholar] [CrossRef] [PubMed]
- Yoon, S.; Kanne, J.; Ashizawa, K.; et al. Best Practice: International Multisociety Consensus Statement for Post-COVID-19 Residual Abnormalities on Chest CT Scans. Radiology 2025, 316. [Google Scholar] [CrossRef]
Figure 1.
Proportion of patients with normal and restrictive lung-function patterns (N = 60). Percentages are shown with exact (Clopper–Pearson) 95% confidence intervals.
Figure 1.
Proportion of patients with normal and restrictive lung-function patterns (N = 60). Percentages are shown with exact (Clopper–Pearson) 95% confidence intervals.
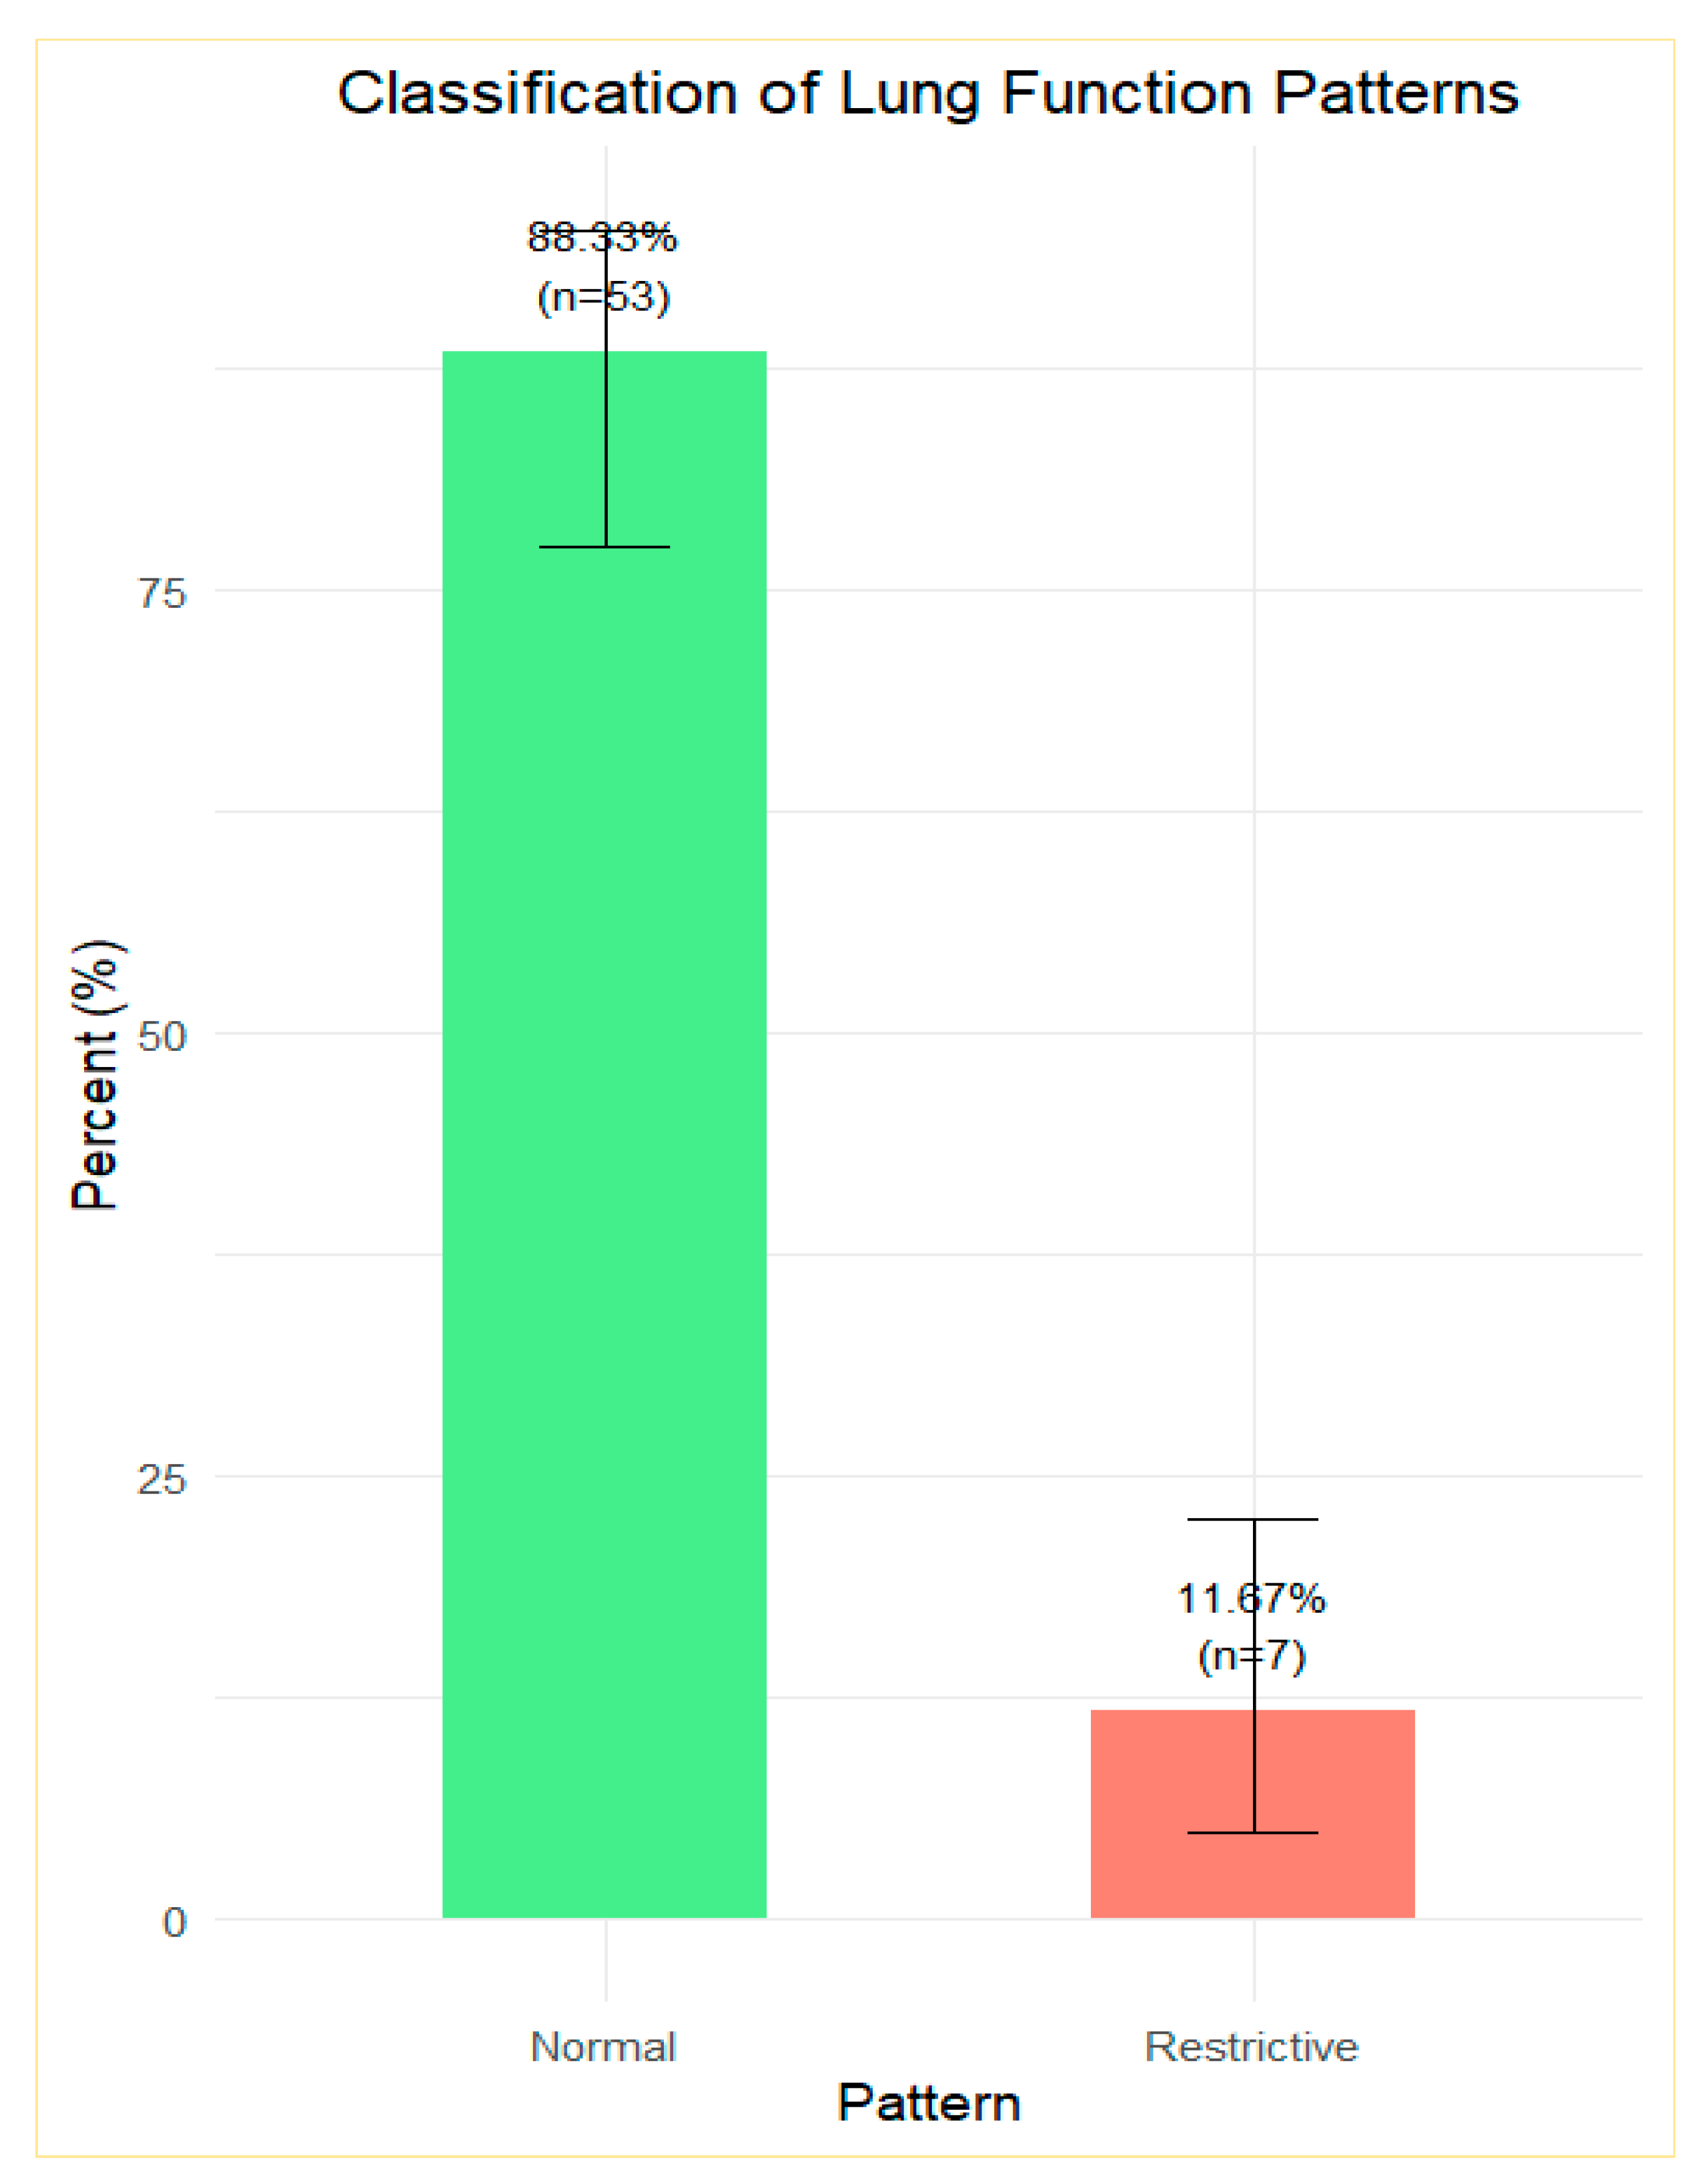
Figure 2.
a) spirometric flow diagram showing a relationship between PEF and FVC; (b) spirogram flow curves illustrate the relationship between FEV1 and FVC; (c) the relationship between FVC and TLC; (d) the relationship between RV and TLC; (e) the relationship between RV/TLC ratio and TLC.
Figure 2.
a) spirometric flow diagram showing a relationship between PEF and FVC; (b) spirogram flow curves illustrate the relationship between FEV1 and FVC; (c) the relationship between FVC and TLC; (d) the relationship between RV and TLC; (e) the relationship between RV/TLC ratio and TLC.
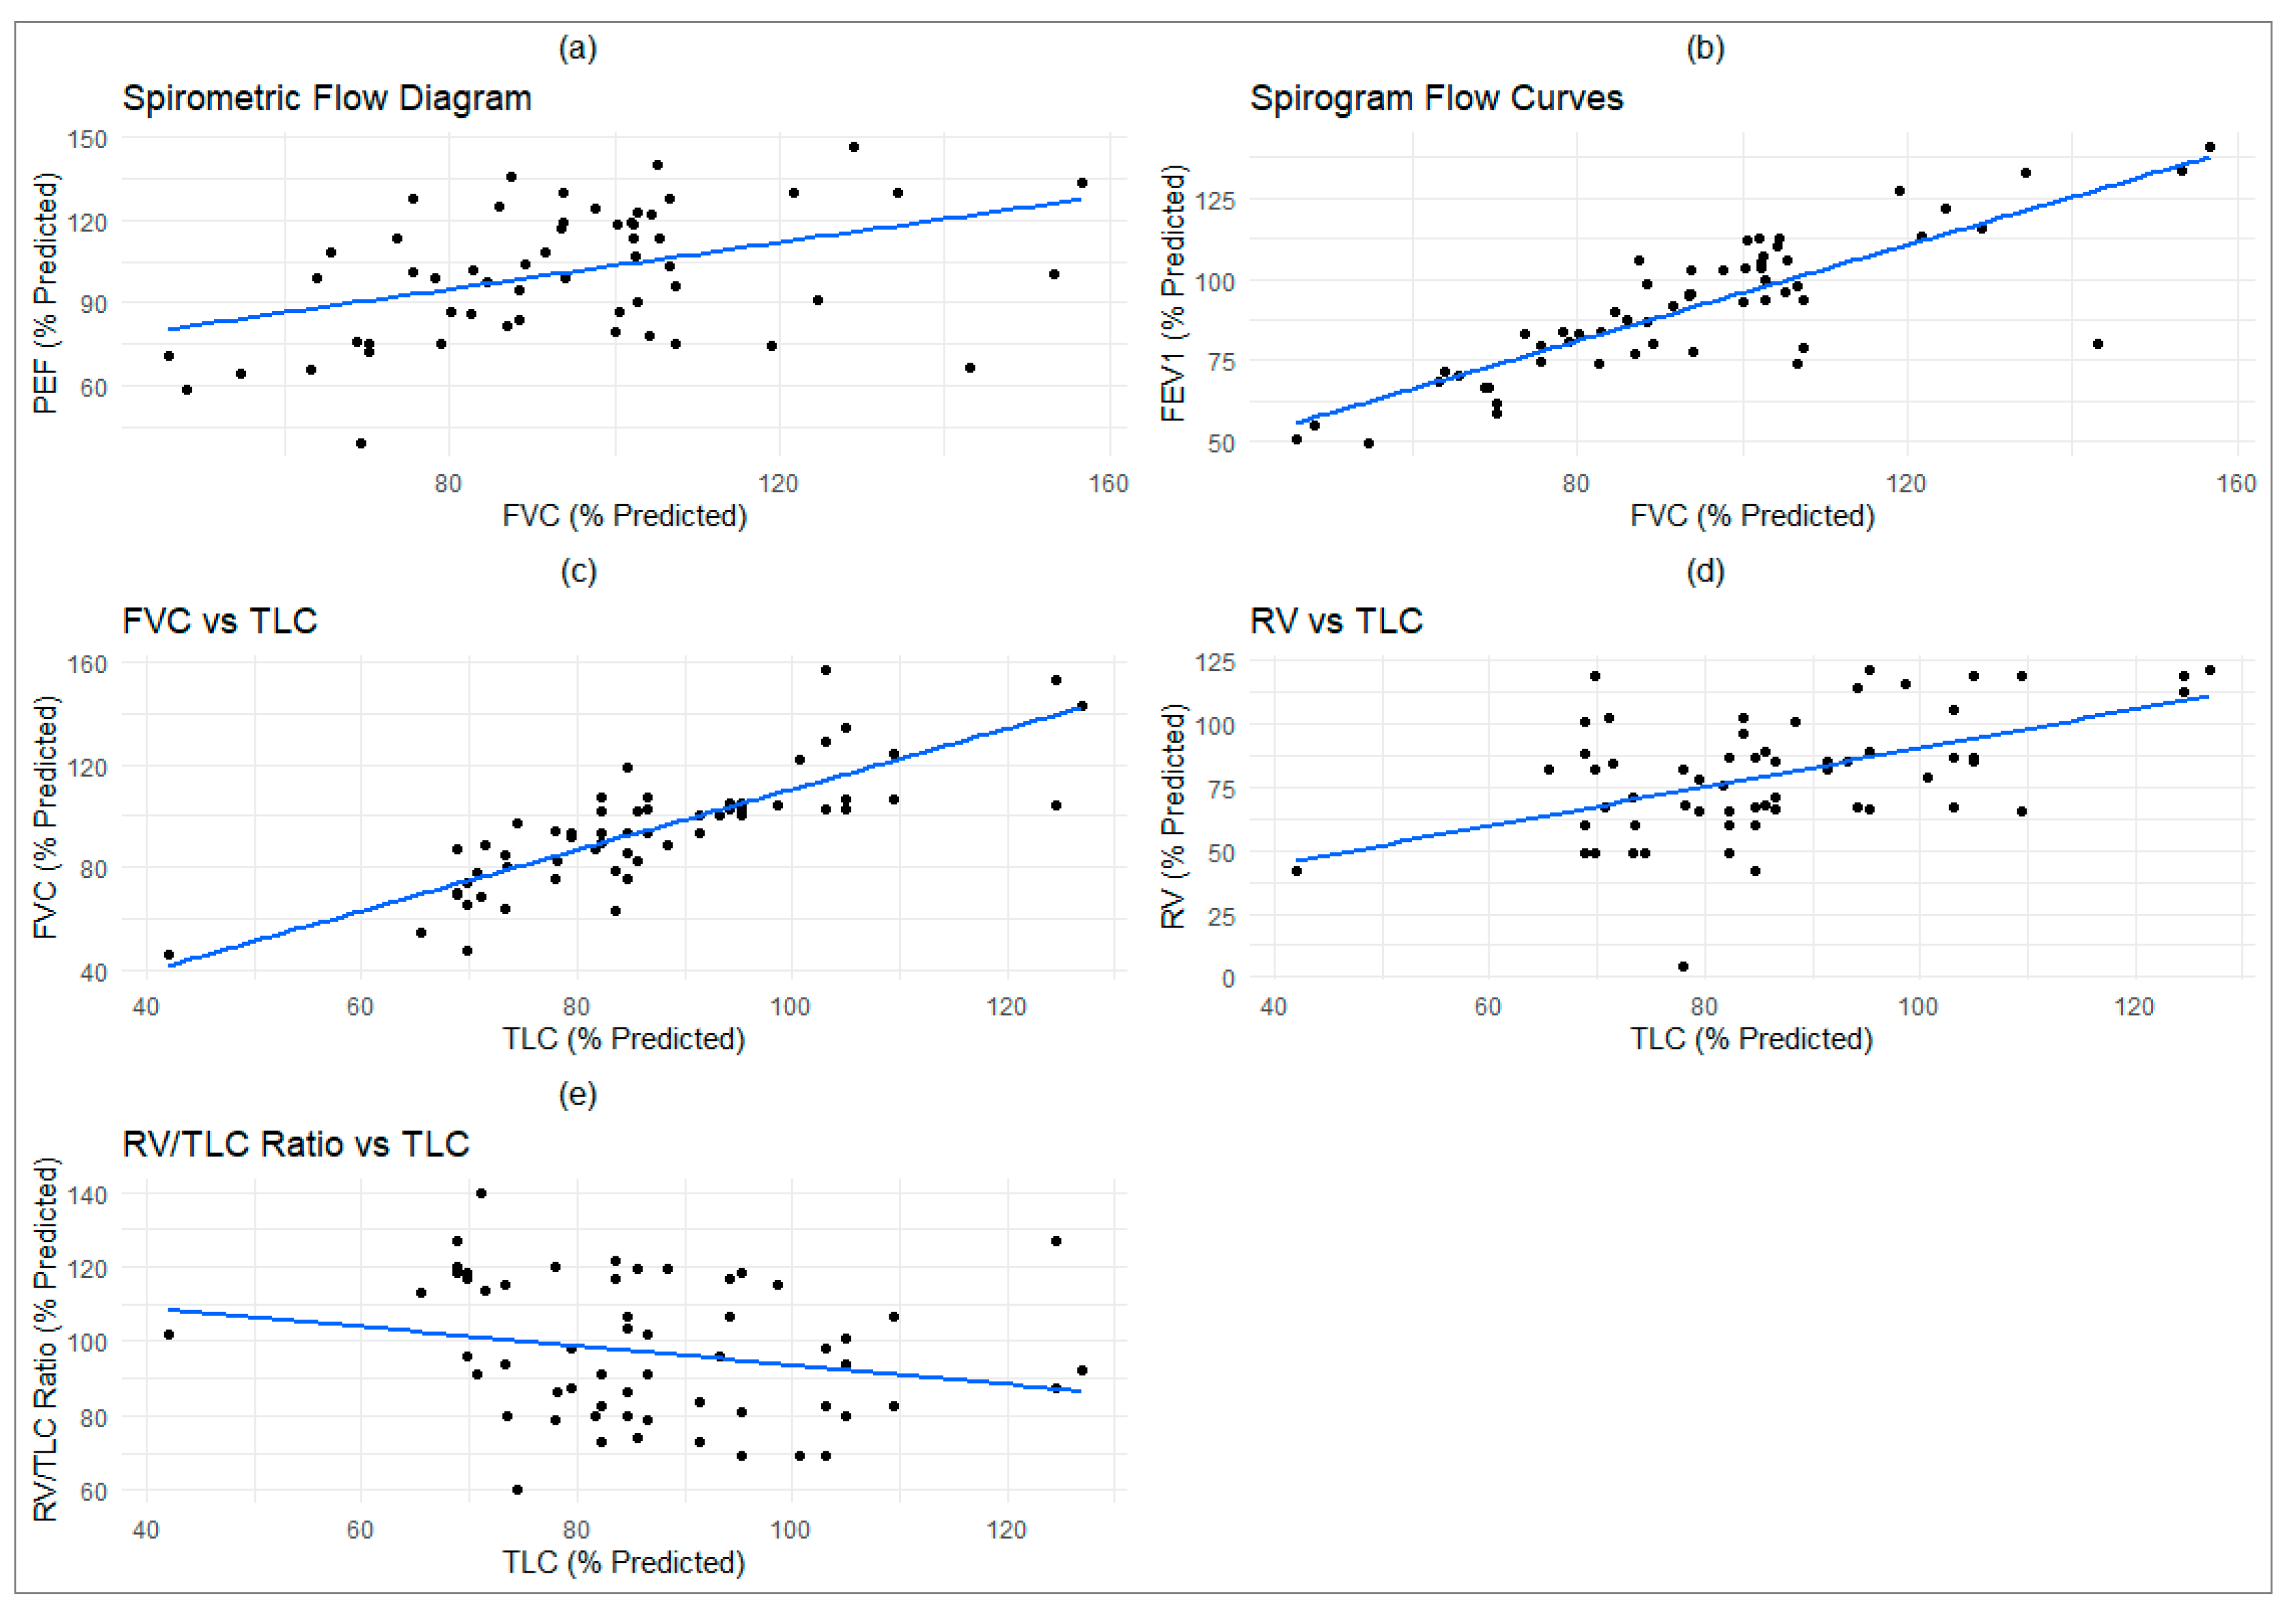
Figure 3.
Chest X-ray of Long COVID Patients showing pulmonary abnormalities.
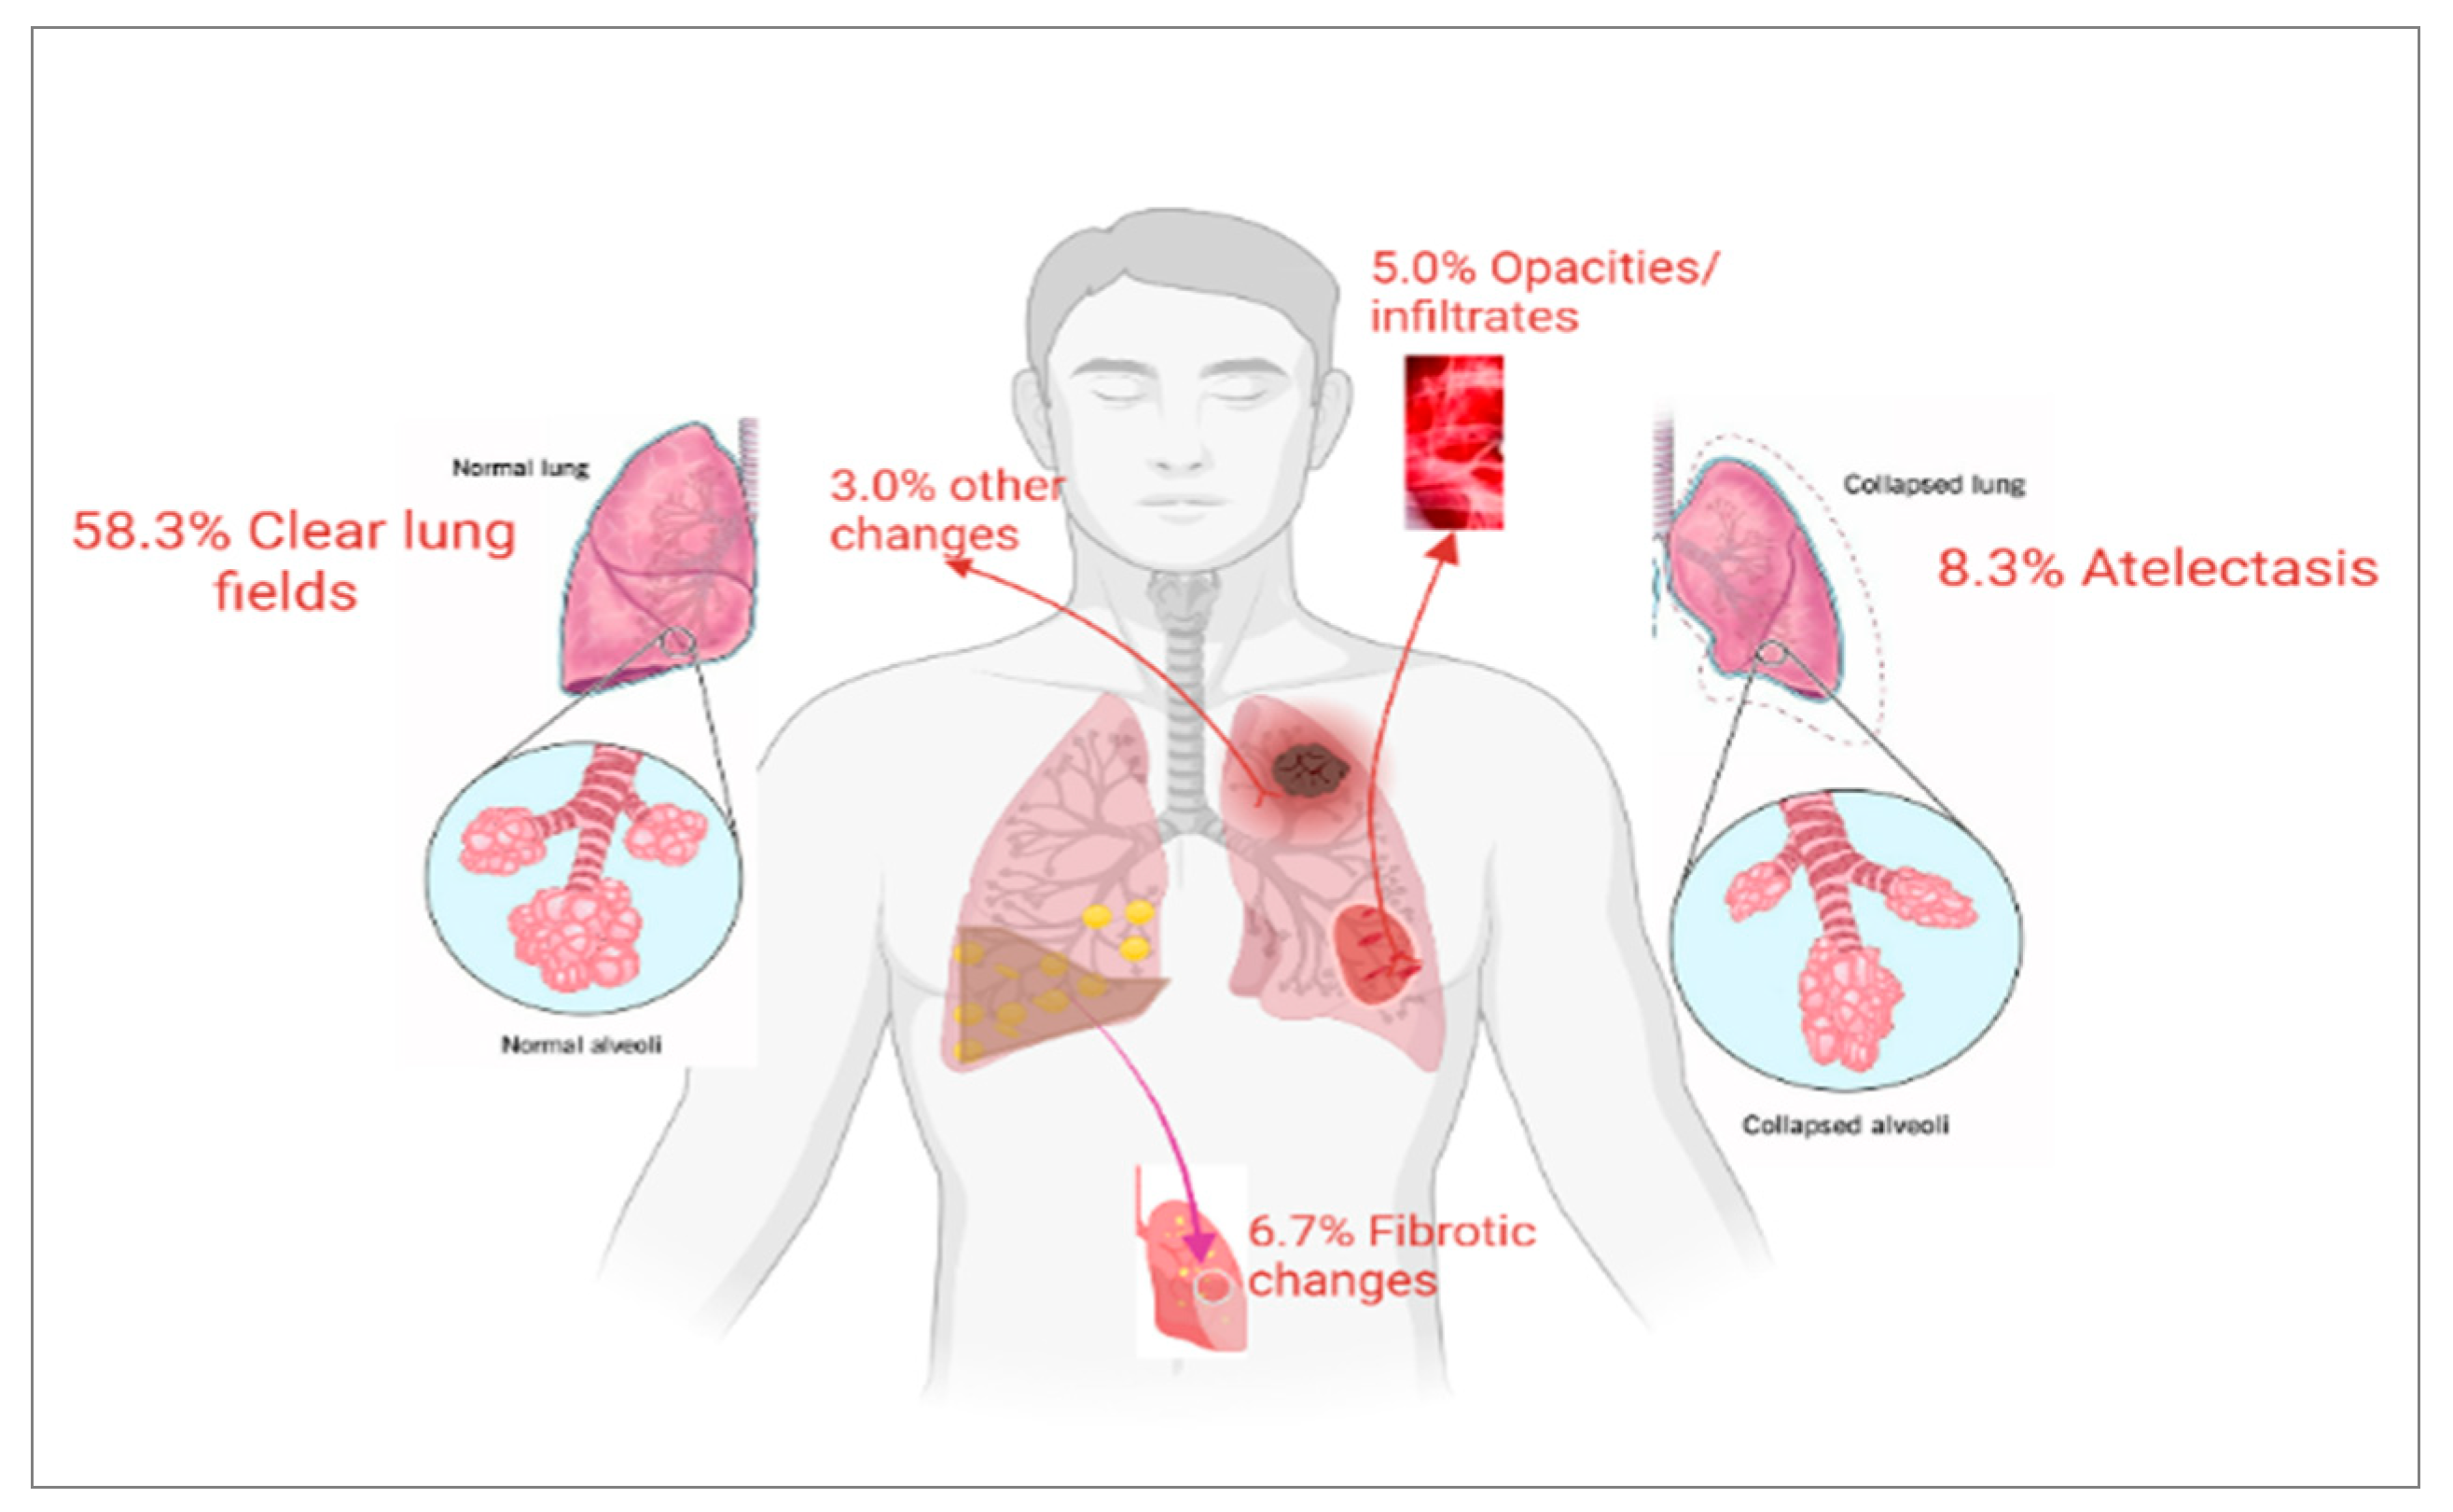
Figure 4.
Chest CT Scan Findings in Long COVID Patients. GGOs were seen in most CT scans: 30% widespread, 20% localised, 15% residual. Fibrosis occurred in 55% of cases: interstitial (25%), localised (17.5%), and diffuse (12.5%).
Figure 4.
Chest CT Scan Findings in Long COVID Patients. GGOs were seen in most CT scans: 30% widespread, 20% localised, 15% residual. Fibrosis occurred in 55% of cases: interstitial (25%), localised (17.5%), and diffuse (12.5%).
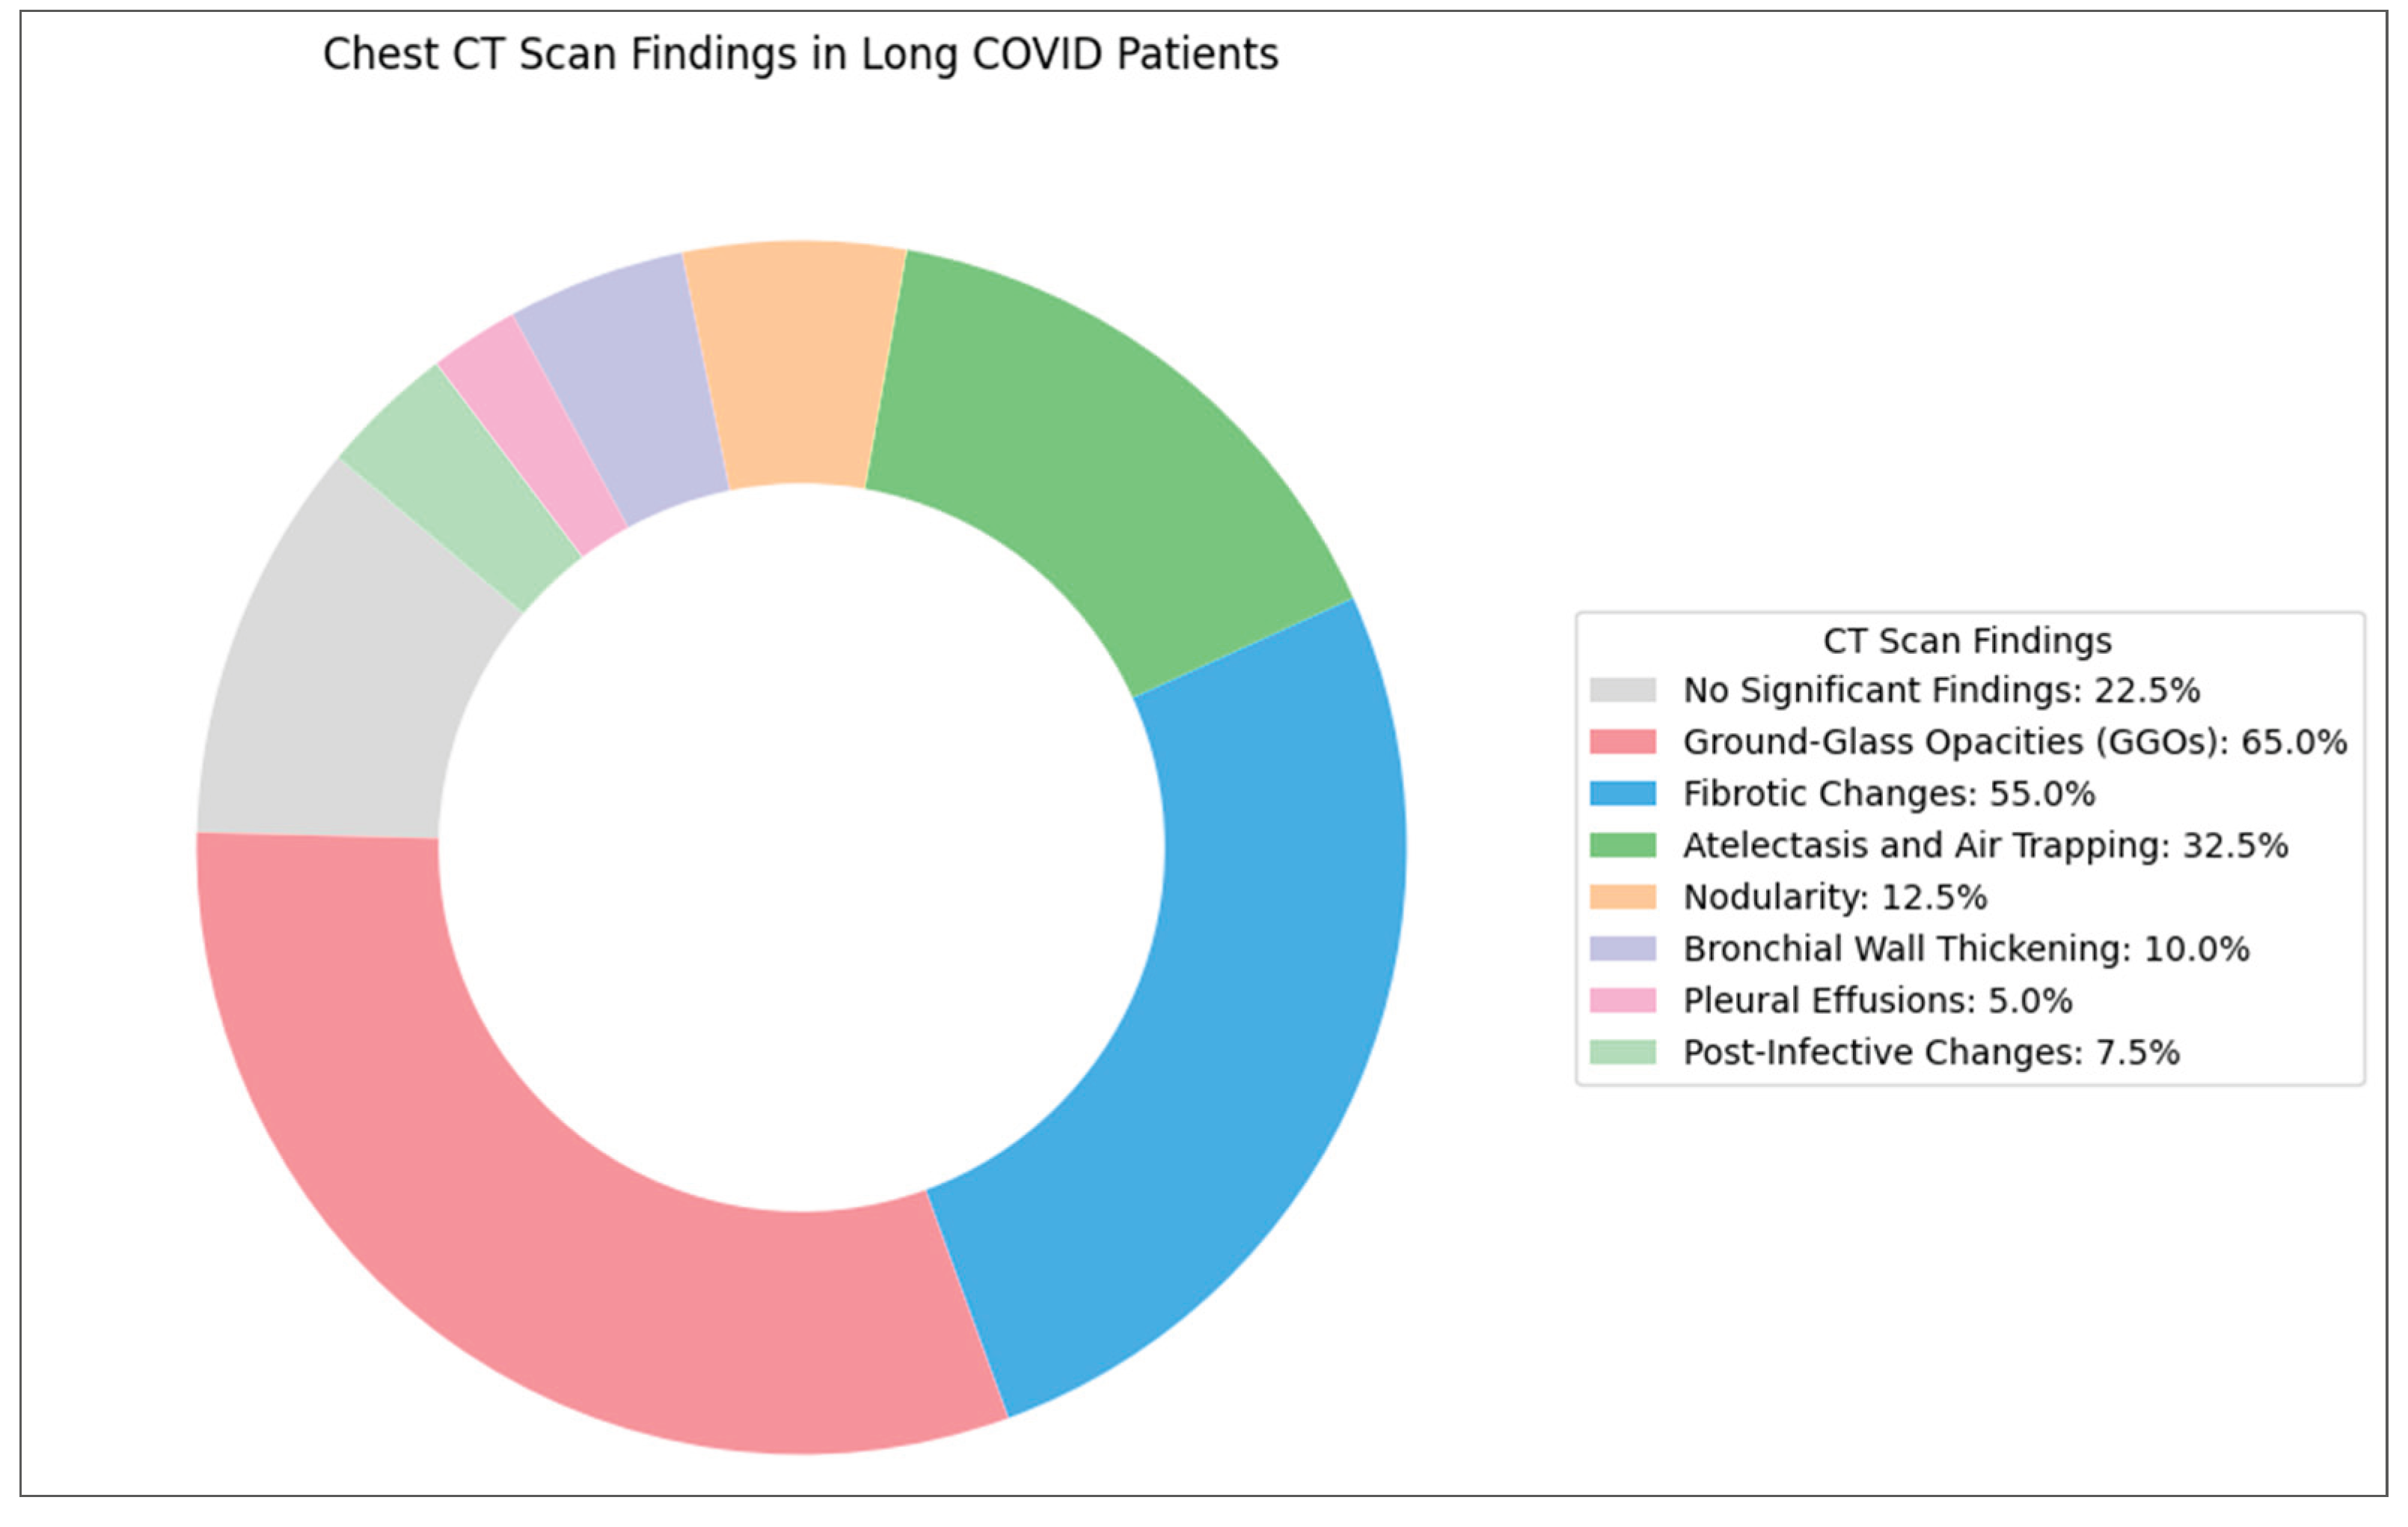

Table 1.
Characteristics of the study of long COVID patients.
| Variables | N= 60 |
|---|---|
| Age(years)1 | 60(13) |
| Gender2 | |
| Female | 34 (57%) |
| Male | 26 (43%) |
| BMI (kg/m2)1 | 32.4 (6.3) |
| Ethnicity2 | |
| White | 24 (40%) |
| Black | 12 (20%) |
| Asian | 16 (27%) |
| Any other ethnic | 8 (13%) |
| Smoking status2 | |
| Non-smoker | 40 (67%) |
| Ex-smoker | 18 (30%) |
| Smoker | 2 (3.3%) |
| Patient on medications2 | 21(35%) |
| PFT | |
| Spirometry1 | |
| FEV1 | 92 (21) |
| FVC | 94 (23) |
| VC | 92 (22) |
| FEV/VC | 102 (14) |
| PEF | 100 (23) |
| MMEF75/25 | 93 (44) |
| Lung volume1 | |
| TLC | 86 (18) |
| ERV | 95 (52) |
| RV | 83 (25) |
| RV/TLC | 98 (19) |
| Diffusion capacity1 | |
| TLCO SB | 83 (92) |
| VA Single Breath | 77 (17) |
|
1 Mean (SD); 2 n (%) |
|
Note: Values are presented as: 1 = Mean (Standard Deviation); 2 = Number (Percentage). Spirometry, lung volumes, and diffusion capacity results are expressed as percentages of predicted values.
Table 2.
Percentage of Patients with Reduced Pulmonary Function Parameters.
| Parameter | Percentage of Patients | p-value* |
|---|---|---|
| FEV1 | 30.00 | 0.00 |
| FVC | 25.00 | 0.00 |
| FEV/VC | 3.33 | 0.00 |
| TLC | 35.00 | 0.00 |
| TLCO | 75.00 | 0.00 |
| VC | 25.00 | 0.00 |
*Fisher's exact test.
Disclaimer/Publisher’s Note: The statements, opinions and data contained in all publications are solely those of the individual author(s) and contributor(s) and not of MDPI and/or the editor(s). MDPI and/or the editor(s) disclaim responsibility for any injury to people or property resulting from any ideas, methods, instructions or products referred to in the content. |
© 2025 by the authors. Licensee MDPI, Basel, Switzerland. This article is an open access article distributed under the terms and conditions of the Creative Commons Attribution (CC BY) license (http://creativecommons.org/licenses/by/4.0/).
Copyright: This open access article is published under a Creative Commons CC BY 4.0 license, which permit the free download, distribution, and reuse, provided that the author and preprint are cited in any reuse.


