
Submitted:
25 November 2025
Posted:
26 November 2025
You are already at the latest version
Abstract
While product returns pose challenges for retailers, prior research suggests that high-quality return services can turn these experiences into opportunities to strengthen customer loyalty and encourage repeat purchases. However, existing studies have largely treated returns as a uniform phenomenon, focusing on their overall impact on repurchase behavior while overlooking the distinct effects of different return types. This study addresses this gap by categorizing returns based on customer attributions of blame—specifically, self-attributed, seller-attributed, and intermediary-attributed returns—and examining how these attributions influence future purchasing behavior. The findings reveal significant variations in consumer responses depending on the perceived cause of the return. Customers who attribute a return to their own mistakes (self-attributed) demonstrate a notable increase in future repurchases. In contrast, returns attributed to seller-related issues (seller-attributed) significantly reduce repurchasing behavior. Meanwhile, returns with ambiguous attributions involving intermediaries (intermediary-attributed) do not have a statistically significant impact on future purchases. By addressing the overlooked role of return attributions, this study advances the understanding of return service recovery and provides actionable insights for businesses seeking to optimize return policies, enhance customer retention, and allocate resources more effectively.
Keywords:
consumer returns
; return reasons
; attribution theory
; service recovery paradox
; empirical research
1. Introduction
Product returns present a substantial challenge for participants on both ends of the online marketplace spectrum (Cui et al. 2021). For online retailers, returns account for approximately 30% of purchases (Los Angeles Times 2021), cost over $100 billion annually (Shulman et al. 2009), and lead to an average profit loss of 3.8% per company (MIT Sloan Management Review 2010). From the consumer’s standpoint, returns signify product failures, leading to diminished satisfaction and a subsequent decline in future purchases (Walsh and Brylla 2017).
Despite the drawbacks of product returns, recent research highlights a fascinating opportunity: a return event can transform into a chance to strengthen consumer relationships (Ertekin 2018). This phenomenon, known as the Service Recovery Paradox (SRP), suggests that effectively addressing a failure—such as a return event—can leave customers more satisfied than if the failure had never occurred (Hart et al. 1990). Moreover, this increased consumer satisfaction often translates into a higher likelihood of repurchasing from the same retailer. Solid empirical support for this concept is found in various studies (Griffis et al. 2012; Venkatesan and Kumar 2004; Petersen and Kumar 2009). A recent Narvar survey underscores this point, with 95% of online shoppers expressing a willingness to return to retailers that offer positive return experiences (MarTech 2017).
Amidst ongoing advancements and revelations about the positive impact of returns, a notable research gap persists. Traditionally, returns have been treated as homogeneous, with little attention given to categorizing them or exploring the distinct effects of different return types. This poses a challenge for retailers, who must discern diverse return scenarios and formulate specific, effective responses. This paper is driven by two primary objectives. First, we aim to devise a method for categorizing returns based on consumers’ reasons for returning products. Second, we seek to provide insights into the specific approaches required to handle different types of returns. On a broader scale, our study is motivated by the absence of the consumer perspective in research on managing returns. Existing literature predominantly focuses on the retailer’s perspective during a return event, addressing aspects such as the quality of return service and the speed of return processing to mitigate negative effects. However, the consumer’s perspective or voice on returns is frequently overlooked. This paper delves into how consumers’ stated attributions for returns shape their future responses. Our goal is to provide consumer-driven insights to optimize return operations.
We collected data on customer return reasons, including sizing issues, preference mismatches, and quality concerns. These reasons were then classified based on whether the attribution lay with the customer, the retailer, or intermediaries. Using logistic regression analysis, we examined the impact of return attributions on future purchases. Our findings reveal distinct patterns: self-attributed returns increase the likelihood of repurchase, retailer-attributed returns decrease it, and intermediary-attributed returns have no significant effect.
This research holds both academic and managerial significance. First, as an exploratory study, it addresses a critical gap in understanding the reasons for product returns. Return reason data has received limited attention in the literature, largely due to challenges with accessibility and reliability. Like other customer information, this data is sensitive and must be safeguarded to protect both customers and retailers from potential harm. Furthermore, analyzing return reason data presents additional challenges related to reliability: returns often result from multiple factors, reason lists vary among retailers, and consumer selections may be subjective or inconsistent. We obtained return reason data from our retail partners and assessed its reliability using the Inter-Rater Reliability (IRR) method. Notably, this study is the first to employ IRR to validate return reason data, offering a valuable methodological contribution to future research in this domain.
Additionally, this research contributes to the application of service failure recovery in the context of consumer returns. The SRP concept highlights that "a successful recovery can transform angry, frustrated customers into loyal ones, sometimes generating even more goodwill than if everything had gone smoothly" (Hart et al. 1990). Consumers’ overall satisfaction is shaped by their initial dissatisfaction from a failure and their satisfaction with the recovery process. When satisfaction from recovery outweighs dissatisfaction from failure, it often leads to higher overall satisfaction (McCollough and Bharadwaj 1992). While recent research has focused on the recovery phase—such as expediting processing and reducing consumer effort in the return process (Mollenkopf et al. 2007; Griffis et al. 2012; Ertekin 2018)—the failure phase has been largely overlooked. This includes understanding consumer attributions or dissatisfaction related to product failures, such as returns. This study aims to bridge this gap, providing valuable insights for retailers to enhance their return recovery strategies.
The remainder of this paper is organized as follows. The next section summarizes the relevant literature and subsequently presents the applied theory and the research hypotheses. The research method is then presented, followed by the data analyses and a detailed discussion of the findings. Finally, the expected contributions and limitations of the current research are discussed.
2. Literature Review
2.1. Service Recovery Paradox Based on Disconfirmation Theory
SRP suggests that consumers who experience a product or service failure but receive an effective recovery may develop more favorable behavioral intentions toward the provider than if they had encountered no failure at all. Consequently, research has shown that a strong service recovery strategy is significantly related to increased customer satisfaction and a higher likelihood of positive word-of-mouth (Luong et al. 2021). Originally conceptualized by McCollough and Bharadwaj (1992), SRP has been widely applied in marketing research to examine consumer responses to service failure recovery events (Griffis et al. 2012).
Two theoretical frameworks underpin the SRP. The first is commitment-trust theory, developed by Morgan and Hunt (1994). This theory posits that trust is established when one party perceives their exchange partner as reliable and honest. Trust is reinforced through past interactions, including conflict resolution efforts (Holmes 1991). Effective service recovery, by demonstrating fairness and responsiveness, strengthens consumer trust, fostering confidence in the company’s integrity and commitment to addressing mistakes (Magnini et al. 2007). Since trust plays a crucial role in customer retention (Qureshi et al. 2009), a well-executed service recovery can ultimately enhance future purchasing behavior.
The second foundational theory, the disconfirmation paradigm, provides a widely accepted explanation for the emergence of SRP. McCollough et al. (2000) developed an advanced disconfirmation model to analyze consumer reactions to service recovery following a product failure. According to this model, overall customer satisfaction is shaped not only by initial disconfirmation—the gap between expectations and actual product performance—but also by disconfirmation during the recovery process, in which consumers compare their expectations with their actual recovery experience. When recovery performance exceeds expectations, it results in positive disconfirmation, increasing satisfaction. SRP occurs when a consumer’s satisfaction with the recovery service is strong enough to outweigh their initial dissatisfaction with the product failure.
In the context of our research, the commitment-trust theory has limited relevance. Given the frequent nature of product returns and the prevalence of lenient return policies, customers often perceive efficient return management as a standard expectation rather than an extraordinary corrective effort capable of significantly altering their trust in a retailer. Instead, we adopt the disconfirmation paradigm to explain how SRP can occur in the context of return failures. To deepen our understanding of return service recovery, we adapt the McCollough et al. (2000) disconfirmation model (see Figure 1). This framework consists of two key disconfirmation pathways. The first pathway represents consumers’ initial satisfaction assessment, shaped by whether product performance meets expectations. If the product underperforms, negative disconfirmation leads to dissatisfaction, often prompting a return (McCollough et al. 2000). The second pathway reflects the recovery process, where a well-handled return experience results in positive disconfirmation and enhanced satisfaction. Aligned with SRP principles, if a consumer’s satisfaction with the return service surpasses their initial dissatisfaction with the product failure, it fosters an overall positive perception of the retailer. This, in turn, increases the likelihood of repeated purchases, signifying a successful SRP.
2.2. SRP in the Consumer Return Context
A product return can be perceived as a failure, as it indicates that the product did not meet consumer expectations. In response, return services represent a retailer’s effort to rectify these failures. Research has demonstrated the presence of the SRP in the context of product returns, where a positive return experience can not only enhance consumer satisfaction but also drive future purchases (e.g., Reinartz and Kumar 2003; Petersen and Kumar 2009; Griffis et al. 2012).
To the best of our knowledge, Reinartz and Kumar (2003) and Venkatesan and Kumar (2004) were among the first to establish a positive relationship between returns and customer lifetime value. Challenging the conventional assumption that higher return rates lead to dissatisfaction and diminished customer value, they found that product return behavior can actually strengthen long-term customer relationships. Building upon these findings, Petersen and Kumar (2009) confirmed that product return behavior positively influences future buying behavior, albeit with a threshold effect: customers who return a moderate number of products exhibit the highest future purchase rates. Griffis et al. (2012) provided a more granular analysis, examining how return experiences shape purchasing patterns post-return. Their findings indicated that customers with return experiences tend to repurchase more frequently, in larger quantities, and at higher values compared to those who have never returned a product with a retailer.
As illustrated in Figure 1, two primary strategies can enhance the likelihood of successful service recovery: (1) minimizing initial dissatisfaction associated with returns or (2) improving satisfaction with the return service. Initial research predominantly focused on the latter—optimizing return services to increase overall consumer satisfaction and foster future purchases. Mollenkopf et al. (2007), drawing from a survey of 464 customers, investigated how firms’ return management systems impact customer loyalty. Their findings revealed a positive relationship between service recovery quality (e.g., efficient return management, compensation, availability of support channels, and ease of website navigation) and both return satisfaction and loyalty intentions. Conversely, higher customer effort in processing a return negatively affected these outcomes. Griffis et al. (2012) further demonstrated that expedited return processing increases repurchase frequency and volume. More recently, Ertekin (2018) found that positive in-store return experiences contribute to higher future purchase rates.
Table 1 summarizes the key studies on return service recovery discussed above. Previous research consistently demonstrates that returns have a significant positive impact on subsequent consumer purchases, providing robust evidence for the success of SRP within the consumer returns domain. Consistent with the literature to establish the effects of return experience on repurchase in general, we propose a baseline hypothesis:
Hypothesis 0 (H0).
A return is positively associated with the likelihood of consumer future purchase.
With regard to how to achieve successful SRP, several factors related to return services—such as website user-friendliness, service recovery quality, customer effort, return processing speed, and in-store return experiences—have been identified as key drivers of SRP success from the retailer’s perspective. However, the effectiveness of recovery services hinges on firms’ understanding of the reasons for customer dissatisfaction and the extent to which this dissatisfaction influences consumer behavior. In practice, many firms fail to retain dissatisfied customers because they lack insight into the underlying causes of dissatisfaction and miss opportunities to address them through recovery efforts (Rebecca Yen et al. 2004). Despite the significance of SRP, there is a notable gap in the literature regarding its examination from the consumer’s perspective. This study seeks to bridge this gap by investigating how the initial level of consumer dissatisfaction, shaped by their attributions of returns, influences their future responses.
2.3. Attribution Theory in SRP
Attribution theory, a foundational framework within the SRP paradigm (Swanson and Hsu 2011), posits that when customers experience a service failure, they engage in causal reasoning to determine its cause (Weiner 2000). The perceived cause of a product failure plays a crucial role in shaping consumer responses, as individuals naturally seek explanations, particularly in the face of negative experiences (Rozin and Royzman 2001; Anderson et al. 2009).
Weiner (1985) identified three key attribution dimensions that influence how consumers interpret service failures: locus, stability, and controllability. Locus refers to who is perceived as responsible for the failure, stability reflects whether the failure is likely to recur, and controllability concerns whether the responsible party could have prevented or mitigated the failure. Empirical research has shown that these attribution dimensions significantly shape consumer behavior, influencing complaint intentions, return decisions, word-of-mouth (WOM) communication, redress preferences, and emotional responses such as anger toward firms (Folkes 1984; Folkes et al. 1987).
Among these dimensions, locus of attribution has been particularly prominent in service failure research (Bitner 1990; Cranage and Mattila 2006; Folkes 1984; Folkes et al. 1987). Locus refers to the extent to which consumers perceive the cause of a failure as internal (their own responsibility) or external (the firm’s responsibility) (Weiner 1985). In the SRP context, this distinction is critical, as it directly affects consumer emotions and expectations regarding recovery. However, causal attributions often involve uncertainty, a phenomenon known as attributional ambiguity (Major and Crocker 1993; Jacquart and Antonakis 2015; Kanitz and Anzengruber 2019). Ambiguity is particularly prevalent in complex situations where multiple factors contribute to an outcome, such as the involvement of intermediaries like manufacturers or third-party logistics providers (Lee and Cranage 2017).
Further, different attributions lead to varying levels of dissatisfaction and expectations for service recovery. When consumers attribute a product failure to their own actions, their subsequent decision-making is significantly influenced by self-perception and emotions. For instance, if a poor outcome results from insufficient consideration (e.g., “I accidentally ordered the wrong item”), consumers may experience guilt. Conversely, if the failure stems from an inability to assess quality accurately (e.g., “I bought a subpar product”), they may feel embarrassment or frustration. Despite these negative emotions, self-attributions do not typically provoke anger toward the retailer, as consumers perceive themselves as responsible for the failure. Because self-attributed failures are associated with lower dissatisfaction and minimal expectations for service recovery, retailers can effectively mitigate negative emotions through a good return process, potentially increasing future purchases. Thus, we propose:
Hypothesis 1 (H1).
A self-attributed product return is positively associated with the likelihood of future consumer purchases.
In contrast, returns attributed to the seller tend to be perceived as more severe than self-attributed returns (Rummelhagen and Benkenstein 2017). This heightened severity is driven by two key factors. First, seller-related failures elicit stronger negative emotions, particularly anger, directed at the firm responsible for the failure (Weiner 1980). Second, responsibility for resolving the issue is expected to rest with the party at fault (Folkes 1988). Consumers who attribute the failure to the company expect substantial recovery efforts, such as refunds, replacements, or apologies, compared to self-attributed failures (Harris et al. 2006). The combination of increased negative emotions and elevated recovery expectations presents significant challenges for effective service recovery. When firms fail to meet these expectations, consumer dissatisfaction intensifies, potentially leading to decreased repurchases. Therefore, we propose:
Hypothesis 2 (H2).
A seller-attributed product return is negatively associated with the likelihood of future consumer purchases.
While product failures can be attributed either internally to the consumer or externally to the retailer (Weiner 1985), there are instances where no clear attribution can be made—this phenomenon is known as "attribution ambiguity". Attribution ambiguity is particularly prevalent when an intermediary—an entity acting as a middleman—is involved (Kracht and Wang 2010). In the hospitality industry, for example, intermediaries such as travel agencies, wedding planners, and convention organizers facilitate transactions between customers and suppliers, including hotels, airlines, and car rental services. Similarly, in the context of consumer product returns, third-party logistics providers (e.g., UPS or USPS) function as intermediaries, handling the delivery of purchased products from retailers to consumers. In complex return situations involving intermediaries, pinpointing responsibility becomes particularly challenging. Despite the absence of a clear party to blame, consumers still attempt to assign responsibility—often directing their dissatisfaction toward the most visibly involved party, such as the shipping company that damaged their purchase, rather than the retailer (Lee and Cranage 2017). When consumers attribute a return to an intermediary, their dissatisfaction with the retailer may be moderate and more easily mitigated compared to direct retailer-related failures. As a result, intermediary-attributed returns may not significantly damage consumer trust and could even lead to positive repurchase intentions if the retailer effectively manages the recovery process. Therefore, we propose:
Hypothesis 3 (H3).
An intermediary-attributed product return is positively associated with the likelihood of future consumer purchases.
3. Method
3.1. Data and Sample
We collected data from an online apparel retailer specializing in a limited product range, including pants, tops, sweaters, shorts, skirts, coats, and jackets, with pants accounting for over 70% of the inventory. The retailer enforces a lenient return policy, making it a suitable research context for studying SRP. Customers benefit from free return shipping, meaning they incur no costs when returning products. Additionally, refunds are processed efficiently, with 75% of returned orders receiving a full refund within approximately 20 days. However, the company imposes moderate shipping fees for initial deliveries, typically $7 or $8, with a free shipping threshold of $125. This non-refundable fee may serve as an implicit restocking charge aimed at discouraging returns (Hess et al. 1996). Given the retailer’s high average unit price ($100) and the prevalence of bracketing behavior—where customers order multiple sizes or colors with the intent to return those that do not fit—75% of orders qualify for free shipping, effectively offsetting the impact of the implicit restocking fee for most returns.
The dataset spans from June 2016 to March 2019 and includes detailed information on items, SKU specifics, order value, order size, and shipping costs, as well as data on returns and promotions (discounts and coupons). The initial dataset comprises 28,628 orders (54,101 items), of which approximately 25% (7,506 orders, 11,841 items) involve returns or exchanges. To ensure data relevance, orders with subtotals below $20 (1,223 orders) were excluded due to the retailer’s higher pricing (average unit price of $100). Additionally, to focus solely on returns, exchange items (approximately 836) were removed from the dataset. After aggregating data across order, order item, return, and return item datasets at the order level, the final sample consists of 26,159 orders, regardless of return status.
3.2. Reliability Check
We classify return attributions based on consumers’ stated reasons for returns. The raw data includes various return reason codes and accompanying customer comments. These codes capture different return motivations: sizing issues, such as "TB" (Too Big) and "TS" (Too Small); product dislike, indicated by "DNL" (such as Do Not Like the color or style); and product quality concerns, represented by "NAP" (Not As Pictured), "QTY" (Quality), and "DM" (Damaged Items), which reflect discrepancies between the received item and its depiction, general dissatisfaction with quality, and product damage, respectively. Less frequently cited reasons include "OWI" (Ordered Wrong Item) and "RWI" (Received Wrong Item). Beyond these predefined codes, customer comments, such as "Larger than the size I bought this spring" or "Did not like the fabric," provide additional context for return decisions. Table 2 summarizes the return reason codes, their frequencies, and explanations.
The reliability of return reason data is a critical concern for researchers, necessitating a formal reliability assessment. However, existing literature provides limited guidance on appropriate testing methods. Given the availability of both return reason codes and accompanying customer comments, we conducted an inter-rater reliability (IRR) analysis to assess data consistency. IRR measures the extent to which different raters consistently categorize the same variable, ensuring the validity of the data (McHugh 2012).
For this analysis, we randomly selected 500 returns from the sample. Assuming that customer comments accurately reflect the true reasons for returns, we used the return reason codes provided by consumers as the reference. Two independent raters were randomly assigned to categorize each return into a reason code based on the corresponding customer comment. We then evaluated the reliability of the return reason data by comparing the raters’ classifications with the original consumer-provided codes. To quantify the agreement between the two, we employed Cohen’s kappa, a widely used metric for measuring inter-rater reliability (IRR) in nominal data (Cohen, 1960). Cohen’s kappa accounts for chance agreement, with values ranging from -1 (complete disagreement) to +1 (perfect agreement), and 0 indicating agreement expected by chance. Following McHugh (2012), a kappa score of 0.40 or higher is considered acceptable. Our analysis yielded kappa scores of 0.40 for rater 1’s ratings (vs. the customer-provided reason code) and 0.53 for rater 2’s ratings (vs. the customer-provided reason code), both meeting or exceeding the 0.40 threshold. These results indicate satisfactory agreement between the raters and the consumers, confirming the reliability of the return reason codes for further analysis.
3.3 Variables
3.3.1. Dependent Variable
Our primary dependent variable, the RepurchaseDummy, is a binary indicator representing the likelihood of a consumer making future purchases from the retailer. Specifically, a repurchase is defined as a second order following the first, a third order following the second, and so forth. Due to data limitations, we cannot determine the exact date of the next purchase for a consumer’s final recorded order. To approximate repurchase timing, we consider the latest order date in the dataset as the repurchase date. Consumers may place repurchases within 30, 60, or 90 days (see Figure 2). To ensure relevance, we set a 60-day threshold, which is approximately one month after customers complete their returns and receive refunds (typically around 20 days post-purchase). Repurchases occurring within 60 days are coded as 1, while those beyond 60 days are coded as 0. Orders placed within the last 60 days of the dataset are always assigned a value of 1, as their repurchase date is assumed to be the dataset’s latest recorded date. To prevent potential biases and inaccuracies in future analyses, we exclude all orders placed in the final 60 days of the dataset.
Return Dummy. To assess the overall impact of returns on repurchase behavior (H0), we introduce ReturnDummy, a binary variable indicating whether a consumer returns one or more products in an order. If a return occurs, the dummy variable is set to 1; otherwise, it is set to 0.
Self-, Seller-, or Intermediary-Attributed Returns. To examine the distinct effects of different return types on consumer repurchase behavior (H1, H2, and H3), we classify returns based on their attributed reasons and construct three corresponding dummy variables: Self-Attributed Returns, Seller-Attributed Returns, and Intermediary-Attributed Returns.
This classification follows the failure recovery framework proposed by Kelley et al. (1993), which categorizes service failures into three broad types: (1) failures related to the service delivery system or product, such as packaging errors, out-of-stock items, product defects, and website malfunctions; (2) failures associated with customer needs and requests, including ordering errors and size mismatches; and (3) failures caused by unprompted and unsolicited actions of company employees.
Following this framework, we first classify returns stemming from product failures beyond the retailer’s direct control as intermediary-attributed returns. These cases typically involve external factors, such as manufacturers or logistics providers, leading to product defects or delivery issues. Examples include damaged items during shipping (DM), product quality concerns (QTY), and discrepancies between website descriptions and received products (NAP). IntermediaryAttributedReturns is coded as 1 if a return falls into one of these categories and 0 otherwise.
Second, returns that are more likely the result of consumer-driven factors, such as ordering errors or misjudgments in size selection, are categorized as self-attributed returns. These typically occur when customers mistakenly order the wrong item (OWI) or purchase multiple sizes with the intent of returning those that do not fit (TB or TS). Since these returns originate from consumer decisions, they are classified as self-attributed. SelfAttributedReturns is coded as 1 if a return belongs to one of these categories and 0 otherwise.
Third, seller-attributed returns include cases where the retailer is directly responsible for a return, such as delivering the wrong item (RWI). While Kelley et al. (1993) primarily associate this category with failures caused by direct employee interactions (Group 3), this framework is less applicable in our online retail context, where such interactions are minimal. However, certain returns reflect customer dissatisfaction with the retailer’s product design or assortment. For example, when customers return items due to dissatisfaction with color, style, or fit (DNL), they often express disappointment with the retailer’s ability to offer desirable products. As these returns are driven by dissatisfaction with the retailer’s offerings, they are also classified as seller-attributed returns. The SellerAttributedReturns variable is coded as 1 for returns falling into either of these categories (DNL or RWI) and 0 otherwise.
3.3.2. Control Variables
To address order characteristics, we incorporate several key variables. We control for the total dollar value of a transaction (OrderValue) and the number of items purchased (OrderSize) to account for the impact of order size. Additionally, we include controls for factors that may influence future purchases, such as the discount provided to the customer (OrderDiscount) and the shipping and handling fees associated with order delivery (ShippingPrice).
We also account for customer-related control variables, including the number of previous orders placed by the customer (CustomerPreviousOrders), which captures the strength of the buyer-seller relationship—a well-established determinant of future purchasing behavior (Barnes 1994; O’Brien and Jones 1995; Bejou and Palmer 1998). Additionally, to address the significant endogenous issue introduced by "bracketing" practices, we include CustomerPreviousBracketingOrders in our model.
Finally, we incorporate indicator variables for product category to capture variations in consumer repurchase behavior across different product categories, such as pants, shirts, tops, and shorts. Additionally, we include variables indicating whether a transaction occurred during the holiday season (Month) or on a weekend (Weekday) to account for potential seasonal and temporal effects on purchasing behavior.
3.4. Descriptive Statistics
Table 3 presents the summary statistics for all variables included in the analysis. Of the 26,159 orders, approximately 30% are consumer repurchases. Additionally, around 26% of all orders involve returns. Among these, self-attributed returns account for approximately 16% of total orders. Seller-attributed returns make up 52%, while product quality returns involving third parties represent 4%. The average transaction value is approximately $268.32, with an average basket size of two items. Shipping and handling fees average $1.20 (nearly free) and range from $0 to $30. Domestic customers may qualify for free shipping if they meet the retailer’s threshold, whereas international customers may incur shipping fees of up to $30. The average discount applied to an order is $6.71, with a maximum recorded discount of $418.40. On average, customers have placed approximately two previous orders, with a maximum of 48, indicating that while some customers exhibit sporadic purchasing behavior, others maintain a strong long-term purchase history and engage in frequent transactions. Notably, 25% of prior purchases (equating to an average of 0.5 orders per customer) are classified as bracketing orders, suggesting that customers frequently purchase multiple units of the same SKU with the explicit intention of trying on products before making a final selection.
3.5. Regression Analysis
3.5.1. Empirical Model
We analyze the impact of returns on consumer repurchases using a logistic regression model. The probability of repurchase is modeled by expressing the log-odds of repurchase as a linear combination of return dummies and other control variables. To account for unobserved heterogeneity, we include fixed effects for month, weekday, and product category in the model. Specifically, to evaluate the overall effect of returns on consumer repurchases, we formulated the following equation:
To evaluate how consumer attributions for returns affect subsequent repurchases, we incorporated the three types of returns—Self-, Seller-, and Intermediary-Attributed Returns—into the empirical model:
3.5.2. Result and Discussion
Effect of Consumer Return on Repurchase (H0)
We initially examined the overall impact of returns on consumer repurchase. To test this hypothesis, we conducted regression analyses, examining the impact of returns on repurchase while controlling for order value, order size, discount, shipping price, customer previous orders, customer bracketing history, product category, month, and weekday fixed effects. Table 4 presents the regression coefficients and their levels of significance. The results indicate that, with other variables held constant, the odds of a returned order are 10% higher than the odds for a non-returned order (calculated as EXP(0.091)). This suggests that returns significantly enhance the likelihood of consumer repurchase. This finding provides additional support for the existence of SRP in the consumer return domain, indicating that returns, when accompanied by good return service, serve as additional touchpoints that can increase consumer satisfaction and future purchases. In other words, H0 is supported.
Additionally, the control variables show significant effects. Specifically, a larger order amount increases the likelihood of consumer repurchase, suggesting that customers who make larger purchases are more inclined to buy again in the future. In contrast, order size alone does not significantly impact consumer repurchase. This could be due to the limited variance in order size, with the average number of items per order being around two. Another possible explanation is that the effect of order size is already captured by the order amount. Shipping costs negatively impact consumer repurchase, possibly because some consumers perceive shipping fees as a drawback—either as an inconvenience or, worse, as an unfair source of profit for the retailer. Thus, the "price" charged for shipping may reduce future consumer demand (Schindler et al. 2005). Moreover, order discounts do not significantly influence consumer repurchase, possibly because discounts attract deal-seekers who prioritize price over brand loyalty. These consumers may not repurchase unless another discount is offered, leading to weak long-term effects on repurchase behavior.
Effect of Consumer Attributions on Repurchase (H1, H2, H3)
Building on our initial analysis, we further examined the impact of different return types—categorized by consumer attributions—on subsequent repurchase behavior. To test this hypothesis, we conducted regression analyses, assessing the influence of self-attributed returns, seller-attributed returns, and intermediary-attributed returns on repurchase likelihood. Our model controlled for key factors, including order value, order size, discounts, shipping costs, prior purchase history, bracketing behavior, product category, month, and weekday fixed effects. The regression results, presented in Table 5, report the estimated coefficients and their statistical significance.
Consistent with our earlier findings (H0), the regression results indicate that higher order amounts positively influence repurchase likelihood, while order size has no significant effect. Additionally, higher shipping costs negatively impact repurchase behavior, whereas order discounts show no significant effect. Turning to the core hypotheses, we find that self-attributed sizing returns significantly increase the probability of repurchase compared to scenarios where a return did not occur (supporting H1). Conversely, seller-attributed returns significantly decrease repurchase likelihood (supporting H2). However, intermediary-attributed returns do not exhibit a significant effect on consumer repurchase, indicating that H3 is not supported. A possible explanation is that consumers may be less inclined to blame themselves or the retailer when a return is attributed to a third party. This attribution likely leads to moderate dissatisfaction—neither strong enough to deter future purchases nor weak enough to enhance future purchases—resulting in a neutral effect on repurchase behavior.
3.5.3. Robustness Checks
To validate our empirical results, we replace the repurchase dummy with repurchase amount and repurchase size as the outcome variables. We reexamine the impact of different return types (or attributions) on consumer repurchase behavior. Our analysis yields consistent findings: self-attributed sizing returns significantly increase repurchase amount and size compared to cases where no return occurred (supporting H1). In contrast, seller-attributed returns significantly decrease repurchase amount and size (supporting H2). However, intermediary-attributed returns do not have a significant effect on repurchase amount or size, indicating that H3 is not supported. These robustness check results (Table 6 and Table 7) align with our original findings for Hypotheses 1, 2, and 3.
4. Managerial Implications and Limitations
While product returns are often perceived as a financial burden for retailers and a source of inconvenience for consumers, they also present opportunities for strengthening customer relationships. Existing research has primarily examined returns from the retailer’s perspective, focusing on operational efficiency and service recovery. However, the consumer’s viewpoint—especially how they attribute return causes and its implications for future purchasing behavior—has been largely overlooked. Addressing this gap, our study investigates how consumers’ attributions for returns influence repurchase decisions.
The findings of this research highlight that the effect of returns on repurchase behavior varies significantly depending on whether consumers attribute a return to themselves, the retailer, or an intermediary. When consumers perceive the return as self-attributed, such as ordering the wrong items or being unable to find the right size, they are more likely to repurchase from the same retailer, indicating a positive effect of returns in these cases. In contrast, when the return is attributed to the retailer due to factors such as incorrect product design (e.g., style) that does not meet customers’ preferences, repurchase likelihood decreases. Meanwhile, when the return involves an intermediary, such as a third-party logistics provider, repurchase behavior does not exhibit a significant change, suggesting that consumers do not hold the retailer accountable in such situations. A robustness check using repurchase amount and repurchase size confirms these results, reinforcing the validity of our findings.
A deeper understanding of return attributions allows businesses to refine their return management strategies and enhance customer retention. Given the positive impact of self-attributed returns on repurchase behavior, retailers should prioritize improving the return process for these cases. Sizing-related returns, in particular, occur frequently and can be effectively managed through seamless return policies and high-quality customer service, ensuring that consumers continue purchasing from the retailer. On the other hand, returns attributed to retailers due to unmet expectations in style, color, or product design present a more significant challenge. Consumers who return products for these reasons are less likely to remain engaged with the retailer, even if the return service is well-executed. To mitigate these negative effects, retailers should focus on proactive consumer recovery strategies, such as personalized incentives and targeted promotions, which may help restore trust and encourage continued engagement. Drawing inspiration from successful practices, such as Delta offering free Sky Miles for significant delays caused by staff-related errors, retailers could implement tailored discounts or loyalty incentives for consumers who experience retailer-caused returns. By proactively addressing these negative experiences, retailers can reinforce a positive post-return relationship, fostering continued engagement and long-term customer loyalty.
In addition to refining return management, these findings also have significant implications for customer value assessment and resource allocation. Customer value is traditionally defined as the profit streams a customer generates throughout their lifecycle (Chang et al. 2015), and previous research has incorporated return behavior into customer value evaluations (Reinartz and Kumar 2003; Petersen and Kumar 2009) However, existing approaches do not differentiate among return types, potentially leading to misinterpretations of consumer worth. This study offers a more nuanced perspective, demonstrating that consumers who frequently return products due to their own errors may still represent valuable customers, as their likelihood of repurchasing remains high. In contrast, consumers with repeated seller-attributed returns tend to exhibit lower repurchase likelihood, making them a less profitable segment. By incorporating return attributions into customer value assessments, retailers can refine their marketing strategies and design targeted interventions that address the distinct behaviors and needs of different consumer segments.
Despite its contributions, this study has certain limitations that should be addressed in future research. The findings are based on data from the apparel industry, where returns frequently occur due to fit and style issues, and their applicability may vary across other retail sectors. Future research should extend this analysis to industries such as electronics, home goods, or subscription-based services, where return motivations and consumer responses may differ. Additionally, while this study examines how return attributions shape dissatisfaction and whether a good return service can mitigate its effects to encourage repurchase, it does not directly measure the intensity of consumer dissatisfaction across different return types. Exploring the psychological responses associated with various return attributions—such as frustration or anger—could offer deeper insights into how returns influence consumer-brand relationships.
References
- Barnes JG (1994) Close to the customer: But is it really a relationship? J Mark Manag 10:561–570. [CrossRef]
- Bejou D, Palmer A (1998) Service failure and loyalty: An exploratory empirical study of airline customers. J Serv Mark 12:7–22. [CrossRef]
- Bitner MJ (1990) Evaluating service encounters: The effects of physical surroundings and employee responses. J Mark 54:69–82.
- Chang HH, Tsai YC, Wong KH, Wang JW, Cho FJ (2015) The effects of response strategies and severity of failure on consumer attribution with regard to negative word-of-mouth. Decis Support Syst 71:48–61. [CrossRef]
- Cohen J (1960) A coefficient of agreement for nominal scales. Educ Psychol Meas 20:37–46. [CrossRef]
- Cranage DA, Mattila AS (2006) Service recovery and pre-emptive strategies for service failure: Both lead to customer satisfaction and loyalty, but for different reasons. J Hosp Leis Mark 13:161–181. [CrossRef]
- Cui H, Rajagopalan S, Ward AR (2021) Impact of task-level worker specialization, workload, and product personalization on consumer returns. Manuf Serv Oper Manag 23:346–366. [CrossRef]
- Ertekin N (2018) Immediate and long-term benefits of in-store return experience. Prod Oper Manag 27:121–142. [CrossRef]
- Folkes VS (1984) Consumer reactions to product failure: An attributional approach. J Consum Res 10:398–409. [CrossRef]
- Folkes VS (1988) Recent attribution research in consumer behavior: A review and new directions. J Consum Res 14:548–565. [CrossRef]
- Folkes VS, Koletsky S, Graham JL (1987) A field study of causal inferences and consumer reaction: The view from the airport. J Consum Res 13:534–539. [CrossRef]
- Griffis SE, Rao S, Goldsby TJ, Niranjan TT (2012) The customer consequences of returns in online retailing: An empirical analysis. J Oper Manag 30:282–294. [CrossRef]
- Harris KE, Mohr LA, Bernhardt KL (2006) Online service failure, consumer attributions and expectations. J Serv Mark 20:453–458. [CrossRef]
- Hart CW, Heskett JL, Sasser WE Jr (1990) The profitable art of service recovery. Harv Bus Rev 68:148–156.
- Hess JD, Chu W, Gerstner E (1996) Controlling product returns in direct marketing. Mark Lett 7:307–317. [CrossRef]
- Holmes JG (1991) Trust and the appraisal process in close relationships. Adv Pers Relat 2:57–104.
- Jacquart P, Antonakis J (2015) When does charisma matter for top-level leaders? Effect of attributional ambiguity. Acad Manage J 58:1051–1074.
- Kanitz R, Anzengruber J (2019) Can’t see the forest for the trees: Attributional ambiguity and attitudes toward change. Acad Manage Proc 2019:12398. [CrossRef]
- Kelley SW, Hoffman KD, Davis MA (1993) A typology of retail failures and recoveries. J Retail 69:429–452. [CrossRef]
- Kracht J, Wang Y (2010) Examining the tourism distribution channel: Evolution and transformation. Int J Contemp Hosp Manag 22:736–757.
- Lee BY, Cranage DA (2017) Service failure of intermediary service: Impact of ambiguous locus of control. J Travel Tour Mark 34:515–530. [CrossRef]
- Los Angeles Times (2021) Op-Ed: We send back 30% of what we buy online. How our return culture alters the supply chain. https://www.latimes.com/opinion/story/2021-11-23/return-culture-supply-chain-logistics. Accessed 14 Feb 2025.
- Luong DB, Wu KW, Vo THG (2021) Difficulty is a possibility: Turning service recovery into e-WOM. J Serv Mark 35:1000–1012. [CrossRef]
- Magnini VP, Ford JB, Markowski EP, Honeycutt ED (2007) The service recovery paradox: Justifiable theory or smoldering myth? J Serv Mark 21:213–225. [CrossRef]
- Major B, Crocker J (1993) Social stigma: The consequences of attributional ambiguity. Affect Cognit Stereotyp:345–370.
- MarTech (2025) 95% of online shoppers say a positive return experience drives loyalty. https://martech.org/e-commerce-report-95-online-shoppers-say-positive-return-experience-drives-loyalty/. Accessed 14 Feb 2025.
- McCollough MA, Bharadwaj SG (1992) The recovery paradox: An examination of consumer satisfaction in relation to disconfirmation, service quality, and attribution based theories. Mark Theory Appl 119:3.
- McCollough MA, Berry LL, Yadav MS (2000) An empirical investigation of customer satisfaction after service failure and recovery. J Serv Res 3:121–137. [CrossRef]
- McHugh ML (2012) Interrater reliability: The kappa statistic. Biochem Med 22:276–282.
- MIT Sloan (2025) Can product returns make you money? https://sloanreview.mit.edu/article/can-product-returns-make-you-money/. Accessed 14 Feb 2025.
- Mollenkopf DA, Rabinovich E, Laseter TM, Boyer KK (2007) Managing internet product returns: A focus on effective service operations. Decis Sci 38:215–250. [CrossRef]
- Mollenkopf D, Russo I, Frankel R (2007) The returns management process in supply chain strategy. Int J Phys Distrib Logist Manag 37:568–592. [CrossRef]
- Morgan RM, Hunt SD (1994) The commitment-trust theory of relationship marketing. J Mark 58:20–38.
- O’Brien L, Jones C (1995) Do rewards really create loyalty? Long Range Plan 28:130–130.
- Petersen JA, Kumar V (2009) Are product returns a necessary evil? Antecedents and consequences. J Mark 73:35–51.
- Qureshi I, Fang Y, Ramsey E, McCole P, Ibbotson P, Compeau D (2009) Understanding online customer repurchasing intention and the mediating role of trust – an empirical investigation in two developed countries. Eur J Inf Syst 18:205–222. [CrossRef]
- Yen HR, Gwinner KP, Su W (2004) The impact of customer participation and service expectation on locus attributions following service failure. Int J Serv Ind Manag 15:7–26.
- Reinartz WJ, Kumar V (2003) The impact of customer relationship characteristics on profitable lifetime duration. J Mark 67:77–99.
- Rozin P, Royzman EB (2001) Negativity bias, negativity dominance, and contagion. Pers Soc Psychol Rev 5:296–320. [CrossRef]
- Rummelhagen K, Benkenstein M (2017) Whose fault is it? An empirical study on the impact of responsibility attribution for customer misbehavior. Eur J Mark 51:1856–1875.
- Schindler RM, Morrin M, Bechwati NN (2005) Shipping charges and shipping-charge skepticism: Implications for direct marketers’ pricing formats. J Interact Mark 19:41–53.
- Shulman JD, Coughlan AT, Savaskan RC (2009) Optimal restocking fees and information provision in an integrated demand-supply model of product returns. Manuf Serv Oper Manag 11:577–594. [CrossRef]
- Swanson SR, Hsu MK (2011) The effect of recovery locus attributions and service failure severity on word-of-mouth and repurchase behaviors in the hospitality industry. J Hosp Tour Res 35:511–529.
- Venkatesan R, Kumar V (2004) A customer lifetime value framework for customer selection and resource allocation strategy. J Mark 68:106–125. [CrossRef]
- Walsh G, Brylla D (2017) Do product returns hurt relational outcomes? Some evidence from online retailing. Electron Mark 27:329–339. [CrossRef]
- Weiner B (1980) A cognitive (attribution)-emotion-action model of motivated behavior: An analysis of judgments of help-giving. J Pers Soc Psychol 39:186–206.
- Weiner B (1985) An attributional theory of achievement motivation and emotion. Psychol Rev 92:548–573.
- Weiner B (2000) Attributional thoughts about consumer behavior. J Consum Res 27:382–387.
Figure 1.
Modified Return Service Recovery Paradox Based on Disconfirmation Theory.
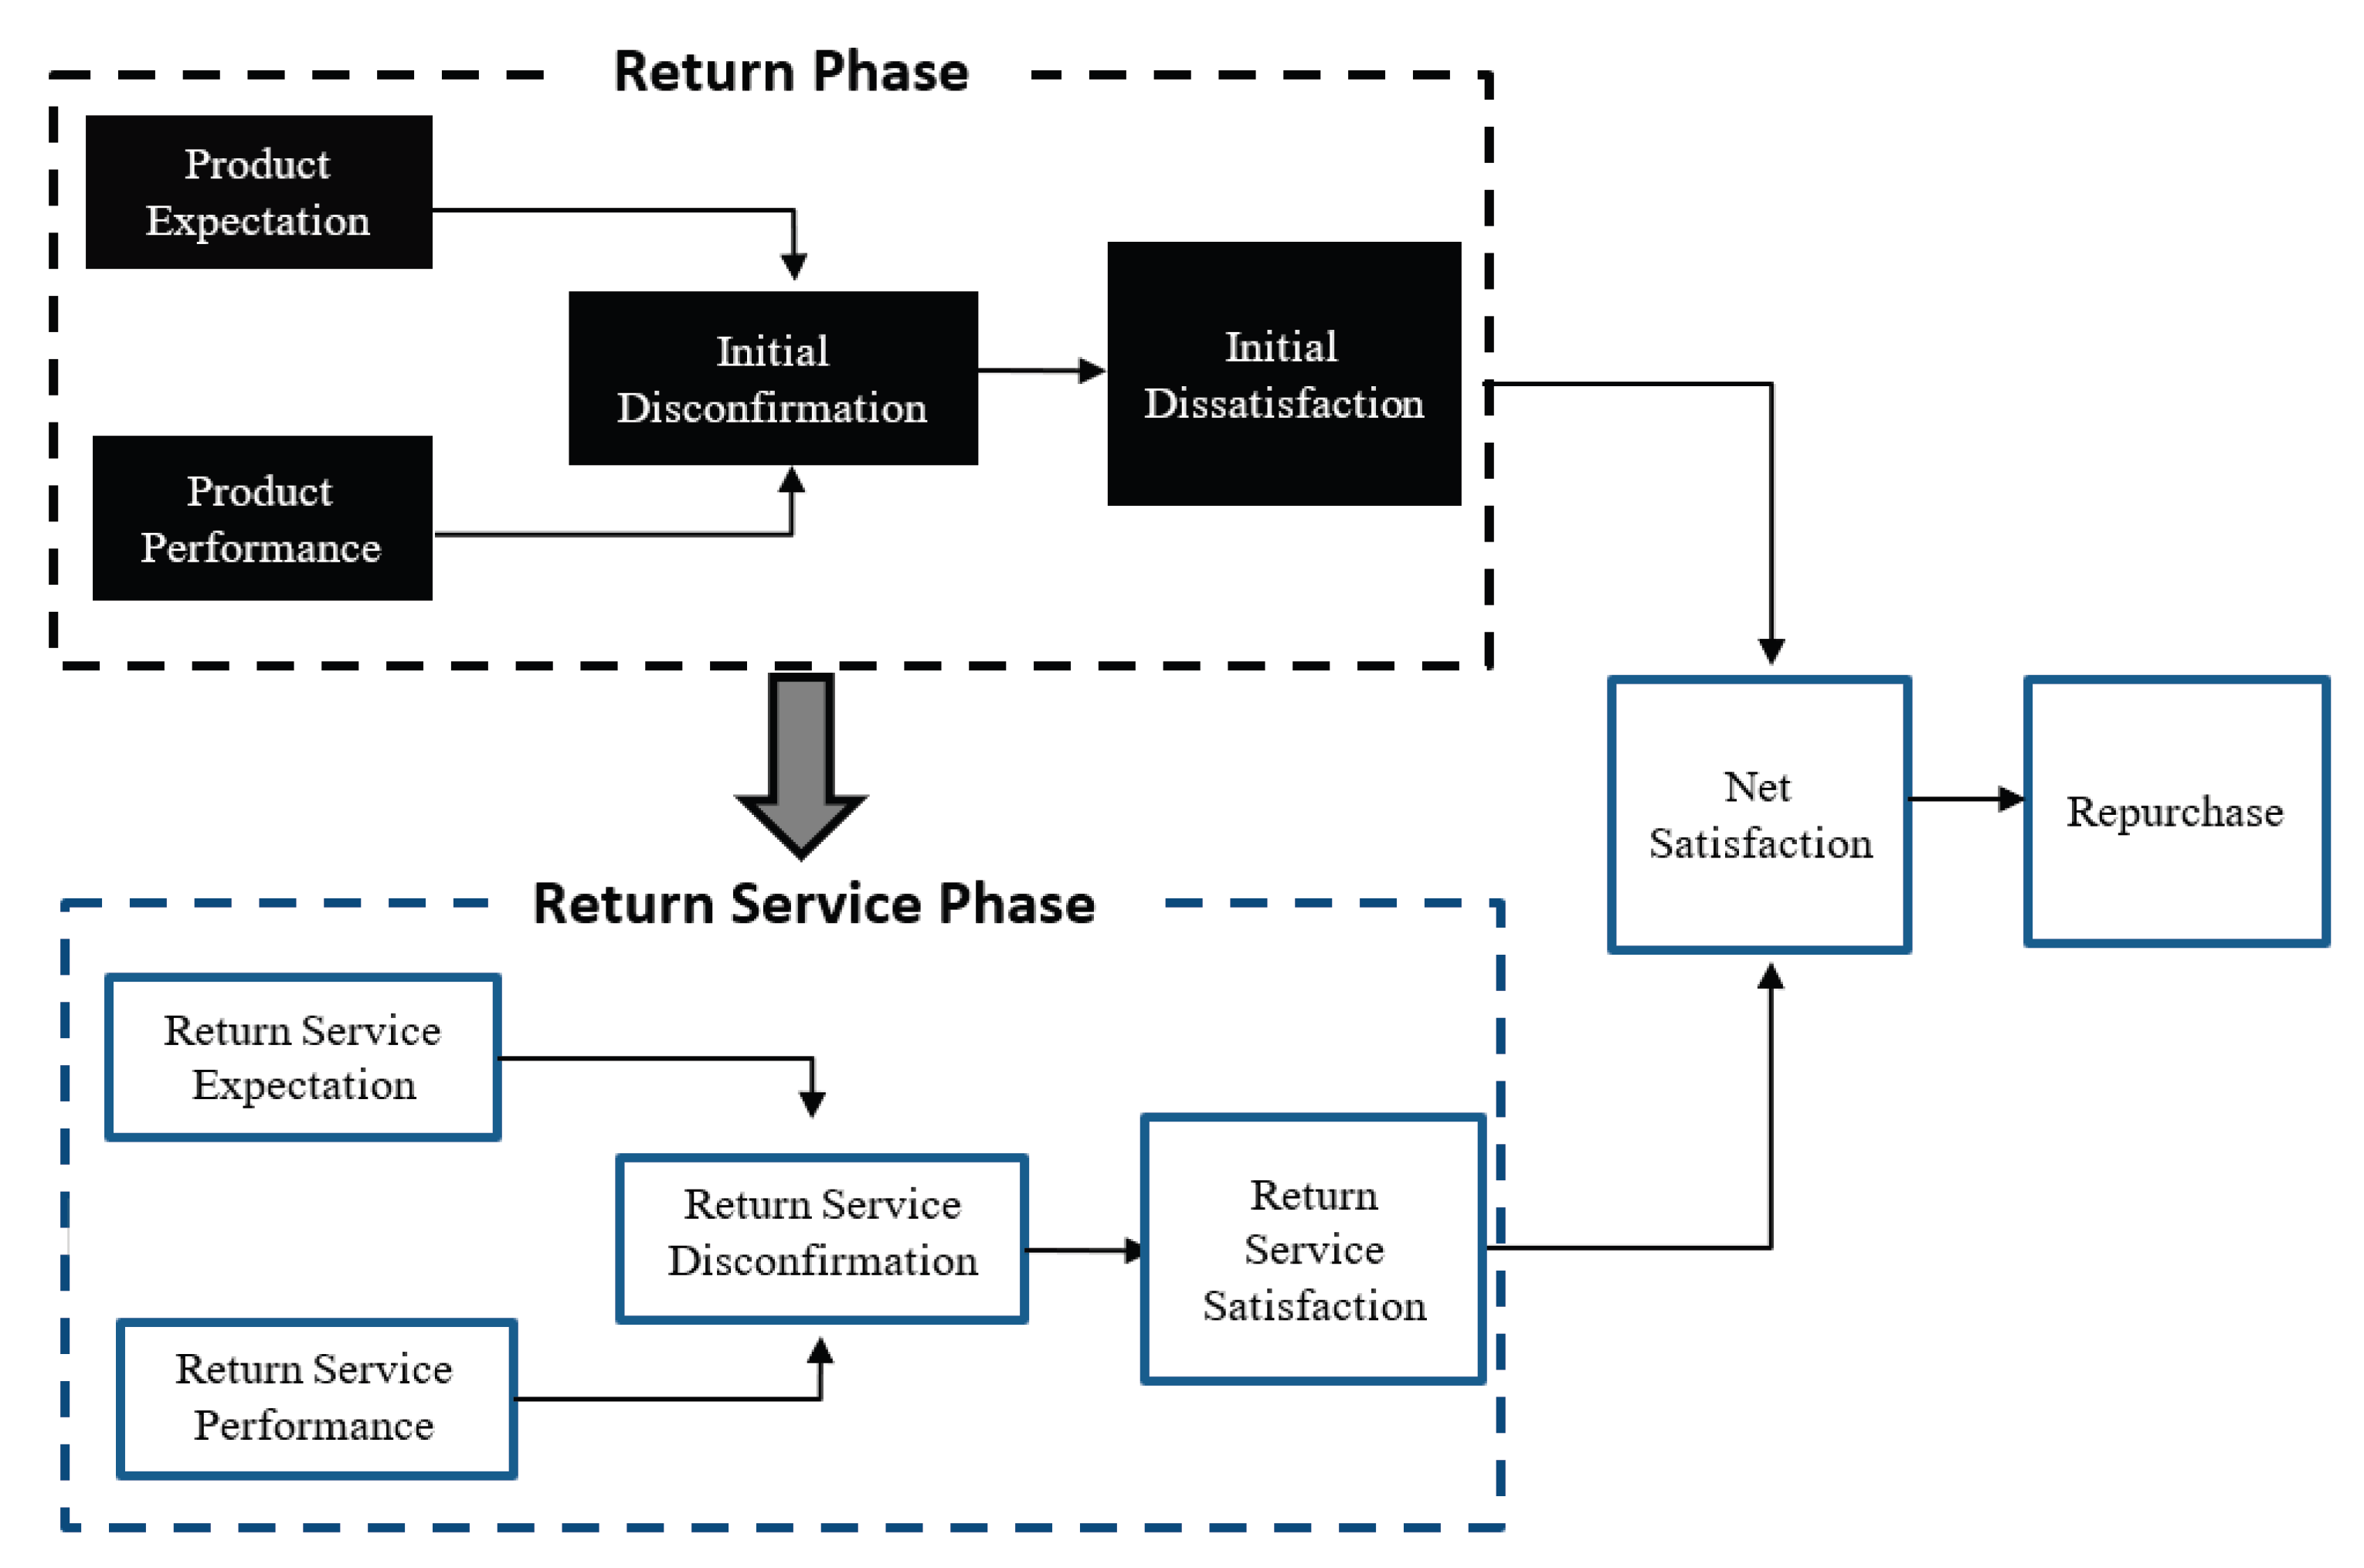
Figure 2.
Repurchase Distribution by Period (Days).
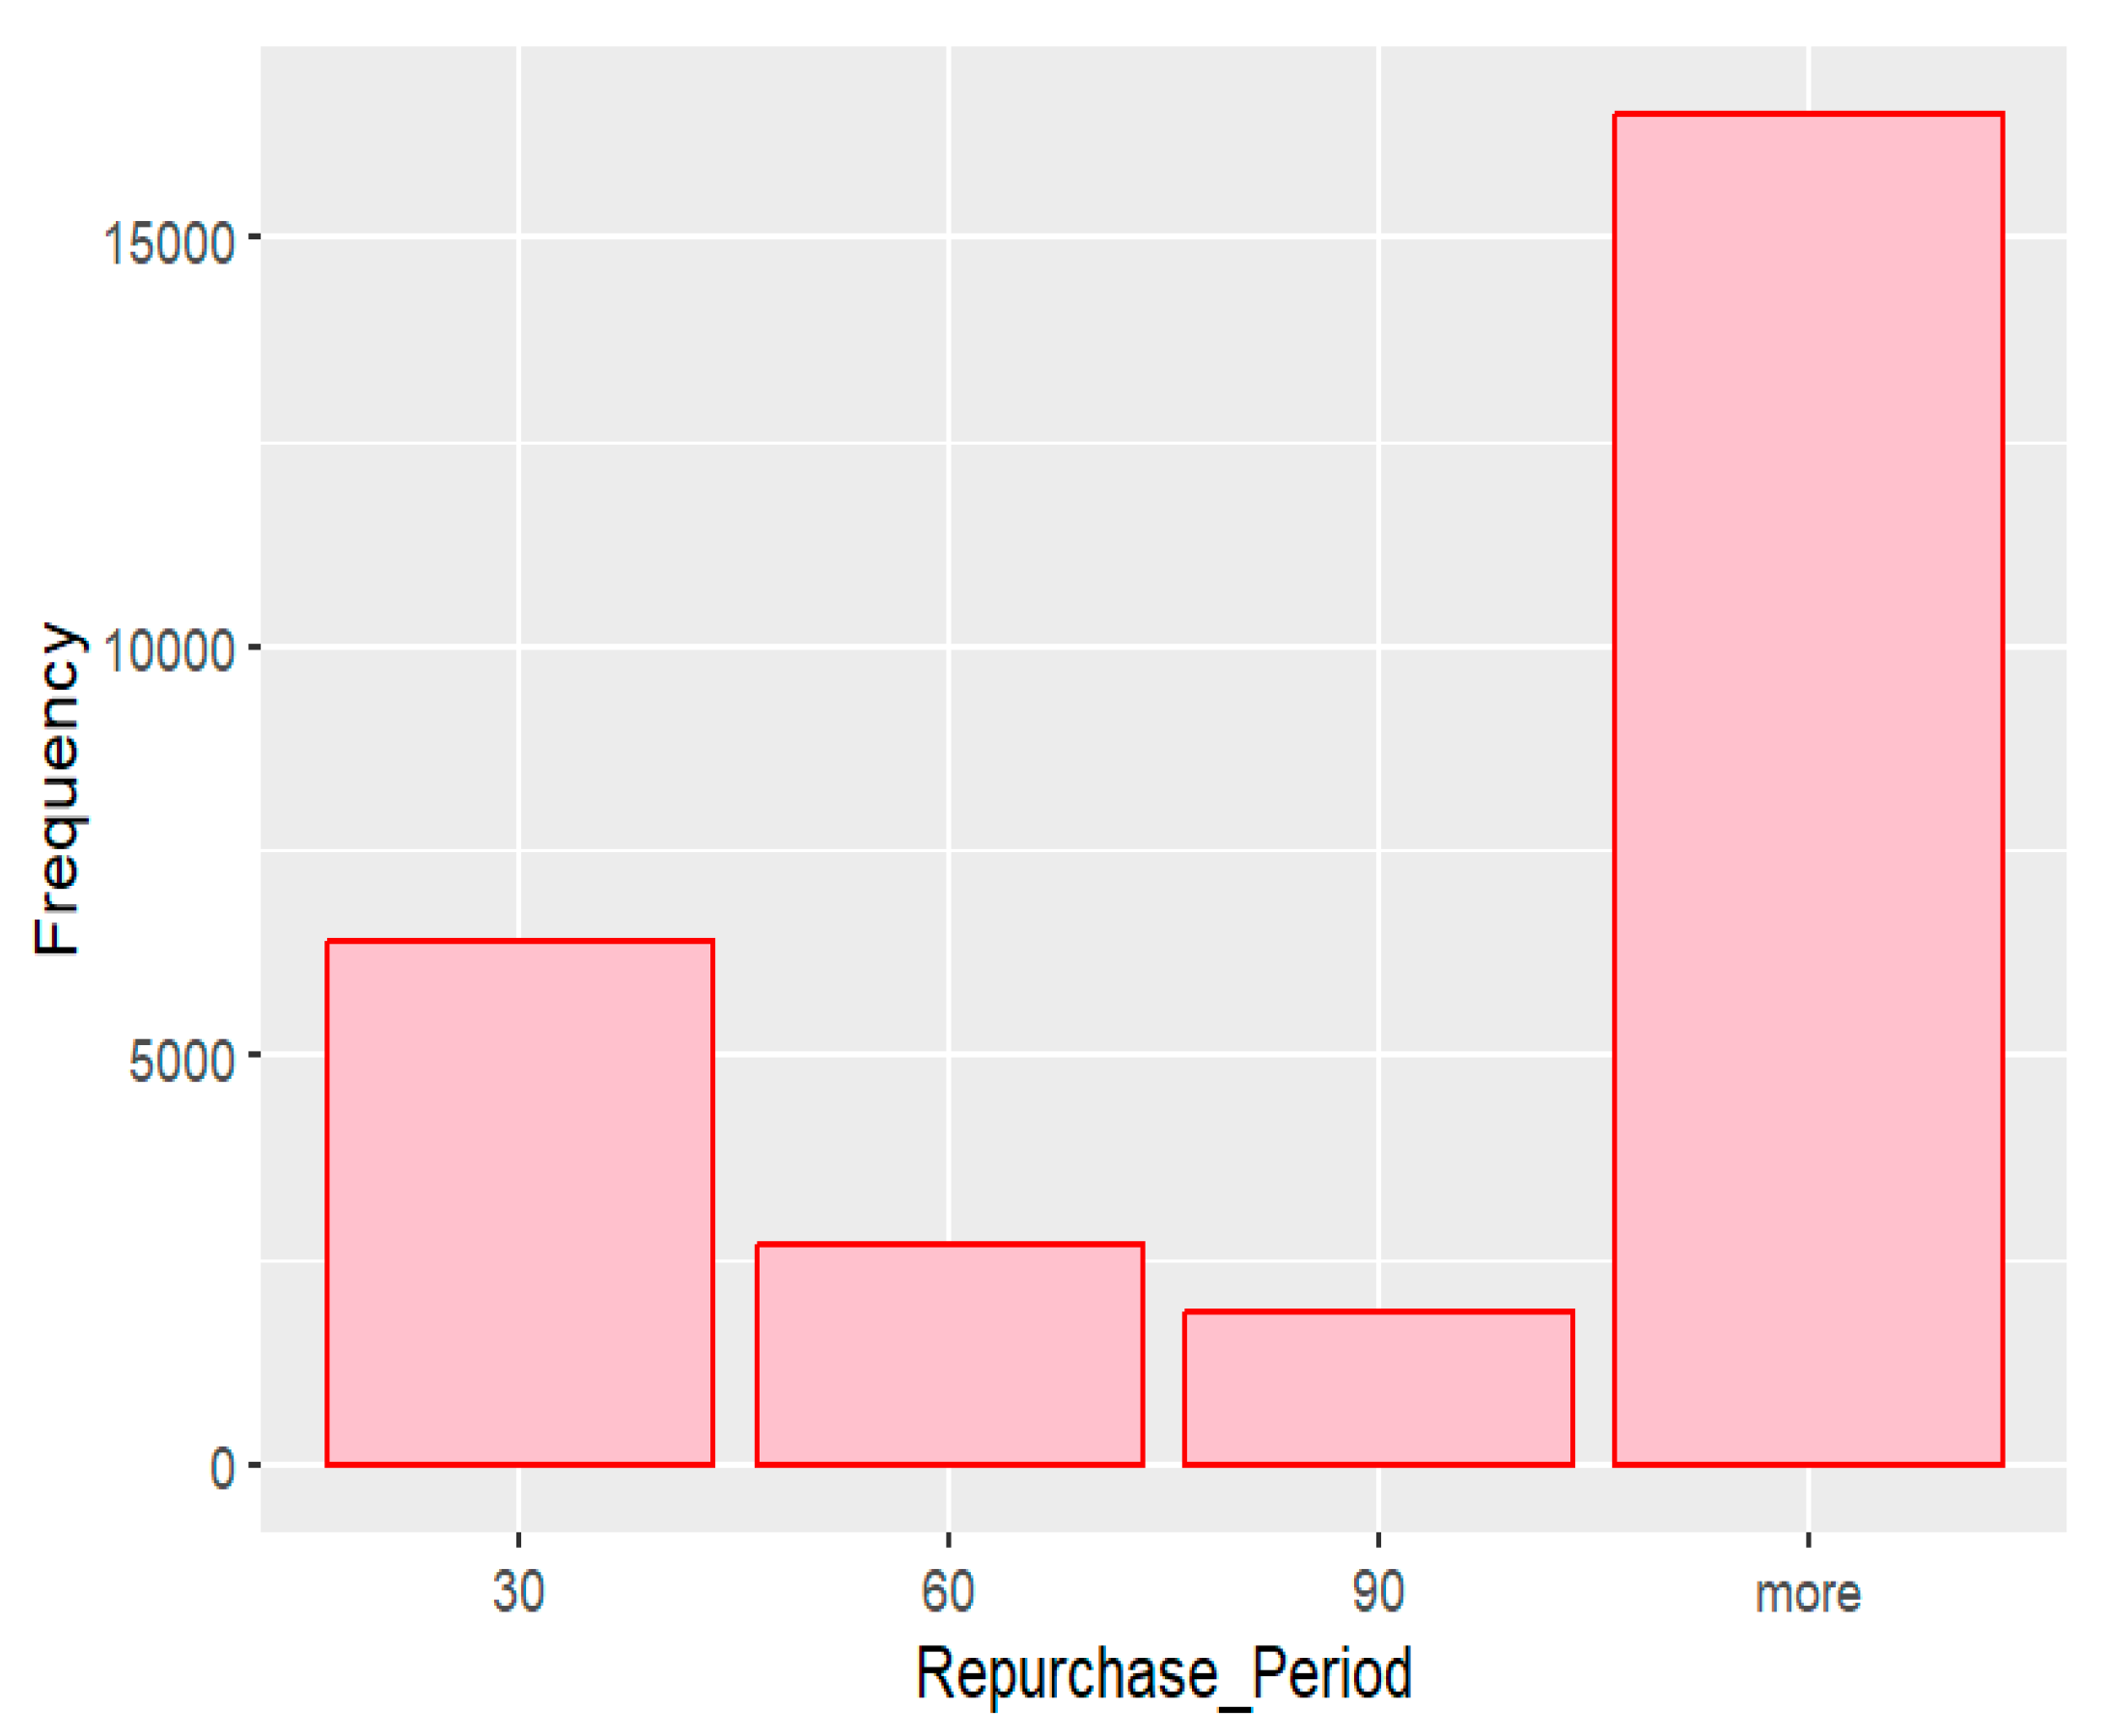

Table 1.
Returns Service Recovery Literature.
| Returns (IV) | Author | Review of Article | DV | |
|---|---|---|---|---|
| Returns | Proportion of returns (of sales) | Reinartz and Kumar (2003) | Product returns is positively related to (up to a threshold) customer lifetime value to the firm. | Consumer Value |
| Amount of returned products | Petersen and Kumar (2009) | Returns positively affects (up to a threshold) customer repurchase. | Repurchase | |
| Return or not | Griffis et al. (2012) | Returns-experienced customers purchase more frequently, a larger size and a larger value than customers having no returns experience. | Repurchase | |
| Return Service | Speed | Griffis et al. (2012) | Faster returns processing positively influences customer repurchase frequency and amount. | Repurchase |
| Site Ease | Mollenkopf et al. (2007) | Returns management significantly affects customer loyalty intentions. | Repurchase Intentions | |
| Service Recovery Quality | ||||
| Customer Effort | ||||
| Instore Return experience | Ertekin (2018) | The customer’s instore return experience positively impacts their lifetime value through their future purchases. | Repurchase | |
Table 2.
Summary of Return Reason Code.
| Reason Code | Count | Meaning |
|---|---|---|
| TB | 4341 | Too Big |
| TS | 3403 | Too Small |
| DNL | 2043 | Do Not Like |
| NAP | 784 | Item / Color Not as Pictured |
| QTY | 769 | Dissatisfied With Quality |
| OWI | 339 | Ordered Wrong Item |
| DM | 111 | Damage |
| RWI | 51 | Received Wrong Item |
Table 3.
Descriptive Statistics of Variables.
| Variables | Description | Mean | SD | Min | Max |
|---|---|---|---|---|---|
| Repurchase Dummy | Whether a consumer will repurchase a product from a retailer within 60 days |
0.30 | 0.46 | 0 | 1 |
| Return Dummy | Whether a consumer returns one or multiple products in an order |
0.26 | 0.44 | 0 | 1 |
|
Self Attributed Returns (Dummy) |
Whether a consumer returns a product due to consumer-caused issues |
0.16 | 0.36 | 0 | 1 |
|
Seller Attributed Returns (Dummy) |
Whether a consumer returns a product due to seller-related issues |
0.52 | 0.22 | 0 | 1 |
|
Intermediary Attributed Returns (Dummy) |
Whether a consumer returns a product due to product problems involving a intermediary |
0.04 | 0.20 | 0 | 1 |
| OrderValue | The total dollar value of an order | 268.32 | 253.00 | 21.60 | 8295.00 |
| OrderSize | The number of items purchased in an order | 1.95 | 1.61 | 1 | 42 |
| ShippingPrice | The shipping and handling fee charged to a customer |
1.20 | 3.31 | 0 | 30.00 |
| OrderDiscount | The discount provided to a customer | 6.71 | 17.01 | 0 | 418.40 |
|
Customer Previous Orders |
The number of previous orders placed by a customer | 2.14 | 4.48 | 0 | 48 |
|
Customer Previous Bracketing Orders |
The number of previous bracketing orders placed by a customer | 0.47 | 1.32 | 0 | 24 |
Table 4.
Results for Returns’ Effect on Repurchase.
| Independent Variables | Repurchase |
|---|---|
| Return_Dummy | 0.091* |
| (0.036) | |
| Order_Value | 0.001*** |
| (0.000) | |
| Order_Size | -0.041 |
| (0.022) | |
| Shipping_Price | -0.016*** |
| (0.005) | |
| Order_Discount | -0.001 |
| (0.001) | |
| CustomerPreviousOrders | 0.171*** |
| (0.005) | |
| CustomerPreviousBracketingOrders | -0.027 |
| (0.017) | |
| R square | 0.08 |
Note: p < 0.05 *, p < 0.01 **, p < 0.001 ***. The sample size is 26,159 for all models. All regressions include category, month, and weekday fixed effects.
Table 5.
Results for Effect of Consumer Attributions on Repurchase.
| Independent Variables | Repurchase |
|---|---|
| CustomerSelfAttributedReturns | 0.163*** |
| (0.041) | |
| SellerAttributedReturns | -0.149* |
| (0.070) | |
| IntermediaryAttributedReturns | -0.067 |
| (0.073) | |
| Order_Value | 0.001*** |
| (0.000) | |
| Order_Size | -0.042 |
| (0.022) | |
| Shipping_Price | -0.017*** |
| (0.005) | |
| Order_Discount | -0.001 |
| (0.001) | |
| CustomerPreviousOrders | 0.171*** |
| (0.005) | |
| CustomerPreviousBracketingOrders | -0.029 |
| (0.017) | |
| R square | 0.082 |
Note: p < 0.05 *, p < 0.01 **, p < 0.001 ***. The sample size is 26,159 for all models. All regressions include category, month, and weekday fixed effects.
Table 6.
Results for Effect of Consumer Attributions on Repurchase Amount.
| Independent Variables | Repurchase Amount |
|---|---|
| CustomerSelfAttributedReturns | 10.028*** |
| (2.840) | |
| SellerAttributedReturns | -9.453* |
| (4.604) | |
| IntermediaryAttributedReturns | -2.081 |
| (4.927) | |
| Order_Value | 0.136*** |
| (0.009) | |
| Order_Size | -5.045*** |
| (1.498) | |
| Shipping_Price | -0.387 |
| (0.319) | |
| Order_Discount | -0.238*** |
| (0.059) | |
| CustomerPreviousOrders | 5.366*** |
| (0.276) | |
| CustomerPreviousBracketingOrders | 14.339*** |
| (0.958) | |
| R square | 0.105 |
Table 7.
Results for Effect of Consumer Attributions on Repurchase Size.
| Independent Variables | Repurchase Size |
|---|---|
| CustomerSelfAttributedReturns | 0.042* |
| (0.021) | |
| SellerAttributedReturns | -0.108*** |
| (0.033) | |
| IntermediaryAttributedReturns | -0.032 |
| (0.036) | |
| Order_Value | 0.0001** |
| (0.000) | |
| Order_Size | 0.070*** |
| (0.011) | |
| Shipping_Price | -0.003 |
| (0.002) | |
| Order_Discount | -0.002*** |
| (0.000) | |
| CustomerPreviousOrders | 0.045*** |
| (0.002) | |
| CustomerPreviousBracketingOrders | 0.108*** |
| (0.007) | |
| R square | 0.108 |
Disclaimer/Publisher’s Note: The statements, opinions and data contained in all publications are solely those of the individual author(s) and contributor(s) and not of MDPI and/or the editor(s). MDPI and/or the editor(s) disclaim responsibility for any injury to people or property resulting from any ideas, methods, instructions or products referred to in the content. |
© 2025 by the authors. Licensee MDPI, Basel, Switzerland. This article is an open access article distributed under the terms and conditions of the Creative Commons Attribution (CC BY) license (http://creativecommons.org/licenses/by/4.0/).
Copyright: This open access article is published under a Creative Commons CC BY 4.0 license, which permit the free download, distribution, and reuse, provided that the author and preprint are cited in any reuse.


