Submitted:
09 December 2025
Posted:
10 December 2025
You are already at the latest version
Abstract
This paper proposes and evaluates a unified machine-learning framework for enterprise portfolio management that integrates multi-horizon financial forecasting, unsupervised risk detection, and explainable reporting within a single pipeline. Using a synthetic but structurally realistic ERP-style dataset comprising 162,000 project–month records with 24 financial and operational features, the study adopts a quantitative design based on multi-source feature engineering, expanding-window temporal cross-validation, and benchmarking of five forecasting models (Linear Regression, Random Forest, XGBoost, LightGBM, CatBoost) across 1-, 3-, and 6-month horizons. Hyperparameters for the strongest models are tuned with Optuna, and three unsupervised detectors (Isolation Forest, COPOD, LODA) are applied to scaled numeric features, while SHAP is used to generate global and local explanations. Results show that gradient-boosted trees substantially outperform linear baselines, reducing MAE by roughly 25–40% and achieving R² ≈ 0.63 at 1 month, ≈ 0.57 at 3 months, and ≈ 0.43 at 6 months, with open commitments, backlog, change orders, and schedule slippage emerging as dominant drivers of future spend. The anomaly layer flags around 2% of records as high risk, capturing patterns such as vendor rate spikes, zero-commitment overspend, stalled backlog, and abrupt forecast collapses. Rather than introducing novel algorithms, the contribution of this work lies in a unified, SHAP-enabled architecture that enhances auditability and governance by turning model outputs into defensible financial narratives and providing a practical blueprint that future work can extend to real ERP data, streaming architectures, and human-in-the-loop risk governance.
Keywords:
enterprise portfolio management
; financial forecasting
; anomaly detection
; machine learning
; gradient-boosted trees
; explainable AI (XAI)
; SHAP
; ERP analytics
; risk governance
1. Introduction
Enterprise portfolio management has grown to be more and more reliant on smart, information-based systems that may unite forecasting, risk identification and automated reporting. But the majority of enterprise analytical architectures remain discrete - forecast, anomaly detection and reporting modules are implemented as independent processes, which infrequently interrelate to cause inefficiencies, redundancy and inconsistent insights. The present paper deals with those fragmentations by offering a single machine learning (ML) framework that integrates all the three capabilities into a single unit, an interpretable and reproducible ML pipeline.
Such an integrated system is founded on a number of decades of development in data-centric and algorithmic research. The initial attempts to solve the problem of the imbalance of classes resulted in the Synthetic Minority Oversampling Technique (SMOTE) that allowed successfully learning on the biased data sets that are often a part of enterprise spending and transaction analysis [1]. Scalable high-accuracy algorithms of structured financial data were provided by ensemble algorithms, including XGBoost [2], and unsupervised algorithms, including the Isolation Forest, improved the detection of anomalous behaviours of complex portfolio settings [3]. The M4 Competition demonstrated the strength of ML and hybrid forecasting algorithms over the classical statistical models on diverse tasks in the real world [4]. Moreover, in the light of explainable artificial intelligence (XAI), including SHAP values, interpretability and responsibility of deploying predictive systems applied in financial decision-making cases have been enhanced [5].
Enterprise systems continue to be marred by the technical and organizational issues despite these algorithmic gains. Of particular concern is the issue of data imbalance that still remains acute and results in biased models and unreliable predictions [6,7]. Classical linear methods such as Support Vector Machines (SVMs) [8] and Elastic Net regularization [9] have played a major role in offering strong formulations in constrained optimisation but are generally not good enough to include financial nonlinear dynamics. Probabilistic calibration SVMs have been worked on to enhance the interpretability of a classification setting [10]. Simultaneously, the area of anomaly detection has been heavily researched and developed in detail, through surveys up to full theoretical coverage [11,12] through which the principles of outlier identification and their application in risk management have been made formal.
The recently enterprise-oriented research is concentrated on the combination of real time data ingestion, hybrid statistical-ML models and transparent audit trails. Studies involving the integration of real time financial streams have already shown that the dynamic risk evaluation and improve the accuracy of decisions can be improved by updating the models in real time [13]. It has been demonstrated by others that ML and traditional econometrics methods complement each other in making models stronger and more intuitive in enterprise risk modeling [14]. On the same note, studies that have been conducted on automated risk assessment in enterprise resource planning systems have highlighted the significance of ensuring that explainability and governance features are included in the analysis process [15]. All these in totality indicate the significance of frameworks that unify approaches to predictive modeling, anomaly detection and automated reporting within a single framework that can be described easily.
Based on these, the proposed study suggests a single machine learning base to enterprise portfolio forecast, risk detection and automated reporting. The suggested system consists of ensemble regression (used to project the spending of portfolio investments), an Isolation Forest-based module (unsupervised anomaly detection), and automated reporting engine (which collects forecasts, risk scores, and visual diagnostics and puts them together into an interactive and audit-ready report). The architecture centers on the concepts of interpretability, scalability and compliance alignment - these are key pillars that both help to make sure responsible AI is implemented in enterprise financial ecosystems.
This study is restricted to structured enterprise portfolio data that has variables like commitments, expenditure, budgets and vendor rates. The system is run on historical batch-processed data, not on-the-fly but still permits the control on the methodology to be easily made and is reproducible. dependence on domain of feature construction, Calibration sensitivity of anomaly detection thresholds and cannot be directly used in real time. These trade-offs are intentional and constitute a trade-off between accuracy, interpretability and traceability and real-time responsiveness.
The relevance of the study is the fact that it will be able to unite three traditionally separate analytical functions forecasting, anomaly detection and reporting, into a single pipeline that has explainable and auditable principles. The framework, by designing it on familiar methods of ensemble learning [2], anomaly analysis [3,11], and interpretability, provides scientific and practical contributions. It will meet the upward trends of global demand to have transparent and ethically responsible artificial intelligence which will instill accountability and trust to corporate financial analytics.
Research Objectives
- Objective 1: Develop a scalable and interpretable ensemble-based forecasting model to predict enterprise portfolio expenditures and budget utilization.
- Objective 2: Implement an unsupervised anomaly-detection mechanism using the Isolation Forest algorithm to identify irregular financial and operational behaviors.
- Objective 3: Design an automated reporting module that integrates predictive metrics, anomaly analyses, and interpretability visualizations into a transparent, auditable dashboard suitable for enterprise governance.
Overall, this study offers a logical and ethically grounded analytical design of how to transform the activities of enterprise prediction and risk analysis into the integrated, transparent, and actionable decision support ecosystem based on the outcomes of relatively unconnected decision-support models. It demonstrates how the contemporary approaches to machine learning deployed in explainable and reproducible systems will assist in demonstrating the potential transformational solutions to enterprise data through the strategic intelligence that enhances the quality of analysis and institutional responsibility.
2. Related Work
Enterprise analytics increasingly need to have integrated systems which are data-driven, able to perform forecasting, anomaly detection and are interpretable in a single auditable pipeline. However, in the current implementations, common implementations are often separated into their own module that rarely shares capabilities and governance artifacts, resulting in a lack of consistent insights and effort. The literature related to this problem cuts across a number of foundational areas: learning from imbalanced data, ensemble and interpretable machine learning, anomaly detection and risk modelling frameworks at an enterprise level.
The issue of class imbalance is critical in enterprise and financial data sets, where abnormal or high-risk states are very rare. Chawla et al proposed Synthetic Minority Oversampling Technique (SMOTE) to rebalance skewed data by creating synthetic samples for underrepresented classes [1]. Subsequent studies by He and Garcia [6] and Buda et al. [7] systematically studied the effects of imbalance on classification performance, and proposed the algorithmic modifications for deep learning and conventional models. These researches have determined that cost-sensitive learning, resampling, and regularization are complementary techniques that improve model generalization in situations where minority events, such as financial anomalies, have a disproportionate importance. Regularization methods like the Elastic Net [9] and Support Vector Networks [8] along with probabilistic calibration methods [10] are still influential in building interpretable but robust methods for structured financial data.
Ensemble learning has taken center stage in enterprise forecasting, especially in the tabular and structured world. Chen and Guestrin's XGBoost algorithm [2] and Makridakis et al. M4 forecasting competition results [4], show the boosted and ensemble models to be better than classical linear or univariate models. These works address the improvement of the predictive accuracy of heterogeneous time series using gradient boosting and hybrid statistical and machine learning models. The problem of interpretability gap in these high-capacity models was addressed to a large extent in the work by Lundberg and Lee [5], where the SHAP (SHapley Additive exPlanations) framework was introduced, providing unified local and global feature attributions. This contribution allowed organizations to implement complex systems that provide prediction and keep the research process and its results auditable and transparent for management.
Anomaly detection is the backbone of risk identification in the automated process of risk detection. The Isolation Forest algorithm developed by Liu et al [3] proposed an efficient method to divide the data into trees to isolate the anomalies without the need for labeled data. Chandola et al. [11] and Aggarwal [12] further classified the detection methodologies, evaluation metrics and areas of application with special emphasis to the scalability and contamination control. These automatic procedures in enterprise finance determine abnormal spending patterns, fraud, and discrepancies between data sets that otherwise would go unnoticed because of sparing labelling and rearranging of working conditions. The continuous scores of anomalies are combined with interpretive ones, which is consistent with governance requirements of traceable, explainable alerts.
Current investigations are more and more focused on the fusion of forecasting, anomaly detection and reporting to formulated and integrated enterprise systems. Odunaike [13] proposed pipelines to incorporate real-time financial data in risk models so that they can be more adaptive and has provided an example to support the essence of stream processing in decision support systems to act promptly. Likewise, Kalvala and Gupta [14] addressed the collaborative power of statistical and machine-learning models in enterprise risk analysis and suggested improvement on hybrid designs that can enjoy the stability of traditional econometrics and the flexibility of modern ML. Along with these initiatives, Parimi [15] demonstrated automation of risk assessment in SAP financial modules, which revealed certain real-life difficulties in extracting data, data governance, and deploying models. All these works affirm the existence of a single, interpreting analytical framework, which can work wonders in supporting the accuracy and adherence of enterprise settings.
There are several areas of consensus throughout the literature. To begin with, the techniques of alleviating the imbalance in classes [1,6,7] are invaluable towards capturing some rare but significant financial events. Second, ensemble algorithms [2,4] offer state-of-the-art predictive performance, while explainability tools [5] solve the transparency issue. Third, unsupervised anomaly detection [3,11,12] is a complementary technique in which framework of the supervised forecast sharing the responsibility of depicting the occurrence of operational irregularities. Finally, the most recent studies in the enterprise [13,14,15] focus on end-to-end integration (i.e. real-time data ingestion, model governance, audit-ready reporting) as key features of next-generation risk analytics. The proposed unified pipeline is in direct line with these insights, and ties the concepts of interpretability, scalability and auditability together to drive decision making for enterprise portfolio.
3. Methodology
3.1. Research Framework
This research introduces a cohesive machine learning architecture created to predict enterprise portfolio expenditures, identify risks to operation, and create automated analytical reports. The research methodology is designed as a quantitative and systematic approach, combining supervised and unsupervised learning components in an end-to-end process which is reproducible. The overarching aim of the framework is to enhance the predictive accuracy and interpretability and at the same time retain transparency, auditability besides the adherence to data governance criteria.
Its methodology uses the concept that predictive models in the enterprise setting not only have to be statistically correct but also accountable and interpretable to the manager. The proposed architecture would therefore entail varying degrees of analytical functionality into the system, data pre processing, feature engineering, predictive modeling, ablation based validation, risk detection and report generation, which ensures that each of the stages addresses to the analytical validity and operational applicability of the results. The proposed system architecture (Figure 1) puts the entire analytics workflow - from data ingestion to reporting - into one consolidated, auditable analytics pipeline that can support portfolio forecasting, risk detection and interpretability.
3.2. Data Description
The data set used in this research is an extensive data set of enterprise financial and operational data obtained from enterprise management systems. The data captures project level transactions that represent key dimensions such as commitment, expenditure, budgets, vendor performances, and resource utilization. All of these dimensions collectively define the structural and behavioural characteristics of enterprise portfolios over time.
The response variable, forecast remaining, represents the amount of budget which is expected to remain unspent at the end of a fiscal cycle and is the dependent variable in model formation. Predictor variables are both numerical and categorical variables that include transactional volumes, cost structures and efficiency indicators. In order to simulate real forecasting situations, the data were temporally split in order to ensure that training and testing phases followed chronological order. This ensured the integrity of causality by ensuring that only information available before the prediction period was used for the prediction.
3.3. Data Preprocessing
Data preprocessing constituted the basis phase of the analytical process. Numerical attributes with missing values were imputed according to the median to ensure that the method is robust to the influence of extreme values, while categorical attributes were imputed according to the mode to ensure the coherence of the distribution. Rare categorical levels were grouped into generalized categories to overcome sparsity and to have statistical representativeness in one-hot encoding.
New variables were designed to represent dynamic and behavioral characteristics, for example, conversion velocities, budget utilization ratios, vendor rate trends and resource allocation efficiencies. Temporal columns were automatically identified and converted into datetime formats to ensure that they have a consistent chronological order and to help with time-aware model training.
Given that ensemble tree based models have variable scaling built in, normalization was not applied. However, in order to address the high skewness in the financial target variable a logarithmic transformation was used before training and inverse transformation of predictions during inference. This approach improved model stability, minimised heteroskedasticity and improved sensitivity to variation in large value forecasts.
3.4. Forecasting Model Construction
The forecasting model was implemented by using Random Forest Regressor model embedded within unified scikit-learn pipeline. The Random Forest algorithm was used because it is robust to overfitting and can model non-linear relationships and can be interpreted using feature importance analysis. The pipeline incorporated all the data preprocessing steps like imputation, encoding, and transformation, ensuring that the data will be handled in the same way throughout all iterations of the modeling process and no information will leak from the training to the testing stage.
Temporal splitting was used to mimic a look-ahead situation so that prediction training only used some former time periods and the prediction evaluation used only the later unseen months. To find a tradeoff between efficiency of computation and reliability of prediction, the model accommodated both complete and subsampled training scenarios. Baseline models, such as a mean-value and linear regression were implemented for the purposes of providing a comparative perspective to the ensemble models performance.
3.5. Feature Importance and Ablation Study
A controlled ablation study was performed to make sure that the proposed model can be interpreted and robust enough. The analysis was aimed at establishing the comparative importance of key features and finding possible dependencies or redundancies in the set of data. The strongest attribute namely, open commitments was systematically omitted in an ablation experiment to determine the impact of the constituent on the general accuracy of forecasts. To avoid column alignment errors and methodological consistency, a separate ablation preprocessing pipeline was rebuilt to accommodate this scenario of ablation.
The comparative study of the ablated and baseline models showed the degree to which particular variables affected the predictive performance. Additionally, the values of feature importance as obtained with the trained ensemble also gave a quantitative understanding of the hierarchical order of variable influence. This interpretive assessment enabled discourse of the possibility of dominance of features, multicollinearity and temporal overlap to be discussed in an informed way, which further supports the framework in compliance with explainable artificial intelligence (XAI) principles.
3.6. Anomaly and Risk Detection
Complementing the forecasting module was an unsupervised anomaly detection system that catalysed abnormal financial behaviours and exposure to risks for the enterprise portfolio. The reason why the Isolation Forest algorithm was used is because it works on high-dimensional numeric data and can isolate the anomalous instance using the recursive partitioning technique. Each record was given an anomaly score that measures how much it differs from the distribution of data that it learned, and a binary indicator of whether this record was a high risk observation.
A conservative threshold for contamination was used to select only the most significant deviations away from the norm, to reduce false-positives but identify cases that indicate either inefficiencies in an operation, inconsistencies in data or emerging trends of risk. The outputs of this subsystem, i.e. risk scores and anomaly flags, were then integrated into the reporting layer where the managers could place unusual financial behaviours in their appropriate context considering forecasts from the model.
3.7. Model Evaluation and Visualization
Model evaluation involved a combination of the quantitative and qualitative aspects. Standard performance metrics were used to assess predictive accuracy, robustness and explanatory strength while interpretive visualizations were used to give complementary diagnostic eyes on the, Visual artifacts that emerged through the pipeline were feature importance plots, distributions of the target variable, calibration plots of the predicted vs actual values and the decile segmented residual analyses.
The importance of these visual diagnostics is that they were used in evaluating the possible bias in the system, the consistency of the calibration of the models, and the dispersion of the predictions. The attained interpretive clarity did not predetermine the fact that the behavior of this model should have been presented in a manner that is meaningful to both technical analysts and non-technical decision-makers. This interpretability of the dual-layer model enhanced appropriateness of this framework to real-life application in the enterprise governance context where model outputs are expected to be explicable and reasonable to various stakeholders.
3.8. Automated Reporting and Reproducibility
The framework was automated by having a reporting and artifact management system, to aid methodological transparency and long-term reproducibility. The entire result of the experiment (metrics, plots, predictions, and serialised model objects) was assembled into an independent html report. The system provided an interactive overview of the results that could be discussed without having to use specific software to facilitate internal audit and management reporting.
The pipeline is modular in nature and this allowed it to re-run on later datasets with minimal reconfigurations. All changes, training processes and output artifacts were automatically recorded and versioned in such a way that the data lineage was preserved. The whole architecture was coded in Python, and the ecosystem scikit-learn, such that it can fit into established standards in the field of machine learning, and enable openness to research with regard to research reproducibility and transparency.
3.9. Ethical Considerations
This research was strictly conducted by keeping in mind ethical guidelines regarding data privacy, fairness, and transparency. All datasets were anonymized and processed in secure environments such that there was no use of any personal or confidential information. The models were designed to support rather than replace human decision-making with interpretability features to prevent the misuse of the algorithm. Bias detection and governance measures were added ensure fairness, accountability and ethical practices of AI throughout the flows.
4. Results and Analysis
4.1. Overview of Experimental Evaluation
The experimental evaluation of the proposed unified machine learning framework was conducted to measure their capacity in the accurate forecast of enterprise portfolio expenditure, quantification of variable influence and detection of anomalous financial behavior. All analyses were performed using the enterprise dataset described in Section 3. forecast_remaining was used as the target variable. The experiments have been conducted using the FAST mode configuration with log-target transformation enabled to overcome skewness in the financial distributions and variance fixing while training the model.
The outputs from the model proposed in this paper were compared with two conventional benchmarks - a simple mean predictor and a linear regression model - and relative improvement was made with these two in terms of predicted precision and explanatory power. In addition, ablation and diagnostic tests were used to assess model robustness, feature dependency and calibration fidelity. All visualizations and tabulated summaries reported here are the automatic result of the analytical report generated by the framework's reporting engine.
4.2. Forecasting Performance Evaluation
The forecasting part of the framework proved to have a high degree of forecast accuracy and stability. As summarized in Table 1, the Random Forest regressor had a Mean Absolute Error (MAE) of 3,687.85, a Root Mean Squared Error (RMSE) of 7,751.08 and a R2 of 0.8546. The above metrics taken together show that the model accounted for almost 85 % variance in the target variable, and thus had a good balance between precision and generalization.
By comparison the baseline models performed much worse. The predictor of Naive Mean covered an MAE of 73,092.59 with an RMSE result of 75,532.30, whereas the predictor of Linear Regression exhibited an MAE of 10,206.59 and RMSE of 20,023.65 with a negligible R2 value of 0.0298. These results prove that the nonlinear ensemble approach outperforms linear and average-based predictors significantly, especially significant is the ability to deal with the complex interactions between commitments, expenses and vendor-level indicators.
The low magnitude of errors and high explanatory power of the ensemble provides evidence of its usefulness for complex enterprise forecasting problems, where relationships are rarely linear and where data distributions are heterogeneous.
4.3. Target Variable Distribution
Prior to the model fitting, the statistical distribution of the target variable was analyzed to check whether this distribution is suitable for regression learning. The forecast_remaining variable was strongly skewed to the right as is common in financial data where a small number of projects account for most of the total expenditure. Figure 2 shows this pre-transformation distribution, with a long tail going over to high-value observations.
In order to balance this imbalance, a natural logarithm transformation (log1p) has been applied during the preprocessing stage. The transformation had the effect of compressing extreme values and creating a more symmetric distribution with better numerical stability and ensuring that the regression model treated small and large portfolios sympathetically. The inverse transformation (expm1) was later used to make the predictions interpretable again.
This transformation led to a significant improvement in variance heterogeneity and models converged better during optimisation and did not get disproportionately contaminated by high budget outliers. Residual structure was obtained confirming that the model learned relationships across scales as opposed to overfitting on large portfolios.
4.4. Feature Importance Analysis
An interpretability analysis was performed to assess the contribution of the individual predictors to the final forecast. The feature importance calculation inherent to the Random Forest gave an intuitive way of decomposing variances contributions by variables. Figure 3 presents the ranked scores of the significance of all predictors.
The feature open_commitments was dominating the ranking followed by budget_utilization_rate_month, conversion_velocity, and avg_vendor_rate_month. The predominance of open_commitments is consistent theoretically with financial intuition in that it is a direct reflection of outstanding obligations and thus of remaining budget potential, and so a leading indicator. Nevertheless, the concentration of importance in one feature led to an ablation analysis (Section 4.5) to ensure that this dominance did not occur due to temporal leakage or redundant computation.
Beyond this primary cluster, there were secondary predictors which had small interpretable effects. Variables reflecting the fluctuation of vendor rates, resource allocation %ages, and month-to-month commitment conversions had smaller but stable importance values, which added to the generalization together.
4.5. Ablation Study and Robustness Validation
To verify the model’s dependency structure and test its resilience against feature omission, an ablation experiment was conducted by retraining the model without the open_commitments variable. Table 2 compares the results of the baseline and ablated models.
The removal of open_commitments led to a drastic decrease in accuracy: the MAE was more than tripled and the R squared value dropped below zero, meaning that the model was worse than a naive average baseline. This result validates that the open_commitments encapsulates important forward looking financial information that the model depends on to make accurate forecasts.
However, the non-trivial predictive power that remains after removal proves that the model is not acting as a single-variable proxy for the signals, but rather is making use of multiple auxiliary signals. Feature ablation, therefore, helps to validate the substantive importance of the feature without prejudice to the model's integrity, contingent only on it.
4.6. Model Calibration and Residual Diagnostics
To assess the calibration accuracy, values that were predicted were plotted against the observed outcomes (Figure 4). The data points show an almost diagonal alignment, which shows that the model predictions are in good agreement with actual results in most of the forecast range. Minor deviations occur at the higher end of the spectrum where the model slightly underestimates extreme expenditure cases - which is also expected given the log transformed regression.
Residual behaviour was further studied by grouping the mean residual in ten deciles of the targeted variable. As you can see in the graph in Figure 5, the distribution of the residuals stays very close to zero up to the lower and mid-range deciles, which confirms that the calibration is uniform. A few cases of negative bias only appear at the top decile, where the under-prediction of high budget portfolios is due to the inherent variance of such observations.
Together, Figure 3 and Figure 4 support the fact that the model has good calibration and generalization characteristics wherein the residual dispersion falls within statistically explainable limits. No evidence of systematic heteroskedasticity and overfitting were found, re-establishing the stability of the forecasting component.
4.7. Comparative Performance Analysis
To quantify how big the improvement provided by the ensemble model is, relative performance improvements were calculated with respect to the 2 baseline configurations. The Random Forest was able to give more close to 95 % reduction in MAE and about 90 % reduction in RMSE as compared to the Naive Mean model, and 60 % plus improvement compared to the Linear Regression baseline.

Table 3.
Relative improvement in forecasting accuracy over baseline models.
| Comparison | % Improvement in MAE | % Improvement in RMSE |
|---|---|---|
| Random Forest vs. Naive Mean | ≈ 95 % | ≈ 90 % |
| Random Forest vs. Linear Regression | ≈ 64 % | ≈ 61 % |
These are fascinating results that confirm the excellence of nonlinear, ensemble-based models of financial systems to the complexity of dependencies of financial systems of an enterprise. The high percentage of error reduced indicates that the Random Forest does not only enhance the accuracy of points, but also stabilizes the predictions across heterogeneous divisions in data making it an effective option as far as its performance is concerned at the deployment time.
4.8. Risk and Anomaly Detection Analysis
The complementary anomaly-detection module was tested in detection of unusual pattern that would signal that there was operational risk. The model using the Isolation Forest algorithm with a contamination threshold of 2 per cent identified the most high-scoring observations as possible deviations. The distribution of anomaly scores (Figure 6) shows that it is long-tailed, with a minority of records having comparatively large proportions of records with disproportionately high-risk values.
Top scoring records, which are stored in top_risks.csv, were inspected manually to reveal that these anomalies were not random but reflected portfolios that exhibited sudden changes in expenditure velocity, anomalous changes in vendor-rate variations or mismatches between commitments and actual budgets. This correspondence between the role of algorithmic detection and domain intuition highlights the occurrence of the model as a useful tool in the dynamic audit.
Table 4 is a summary of the qualitative interpretation of the risk categories based on the anomaly scores.
The anomaly detection and forecasting combine with each other transforms the framework into a full-fledged decision support framework capable of attracting attention to the arising risks, as well as allowing the decision makers to act on them and offers a dynamic to build on.
The findings of the experiment prove the suggested framework to be a high performing and interpretable forecasting system. The increased out-of-sample forecasting ability of the Random Forest has demonstrated that ensemble techniques particularly perform well when forecasting non-linear and high-dimensional predictors in financial data. The model has also been observed to be good and has a small residual bias, which supports the ability to make generalizations across portfolio magnitude.
The ablation experiment played an important role in the discovery of feature dependencies and demonstrated that open commitments is an important feature in the significance of having predictive accuracy. Although its impact is valid, potential future applications ought to place anchor in time to avoid possible information leakage. The fact that it has been heavily dropped in performance without it however does substantiate the validity of its prediction contribution.
The module of anomaly detection was equally important as it added an aspect of interpretation to intelligence like to initiate flagging of patterns that may point to irregularity in budget or structural inefficient etc. This system together with the automated reporting interface offers a developed analytical framework as a whole, and includes accurate predictions, explanations that can be deciphered and open governance capabilities.
Overall, these results confirm the non-technical nature of the framework that was proposed as being not a technical molecule, but a decision-support infrastructure that can be used strategically. It is proof-of-concept that ethical explainable and reproducible machine learning can be combined with high analytical performance and thus reconcile data-driven intelligence with the transparency requirements of enterprise financial management.
5. Discussion
The united analytical framework provided high forecasting accuracy and interpretability achieving much improvement over traditional models. The results for the Random Forest model showed the average absolute error was 3,687.85, the mean squared error was 7,751.08, and the R2 value was 0.8546, which is better than the results of naive mean and linear regression. These results indicate that nonlinear ensemble models can be used to understand the complex relationships that exist in enterprise financial data. The log transformation was successful in reducing any skewness in the data, and the end result was a pretty much perfect diagonal distribution of predicted versus actual values, with slight underestimation of values in the higher value ranges. Out of all the features, open commitments were found to be the best predictor with ablation analysis confirming that there was a large performance drop when it was removed. Meanwhile, the Isolation Forest component used in the anomaly detection component was calibrated using a conservative contamination rate and accurately captures irregular financial behaviors that are consistent with domain expertise. Together, those outcomes speak volumes towards the capacity of the system to simulate nonlinearity of expenditure dynamics and still have transparency and governance alignment.
When compared with the previous work, these results strengthen the known power of ensemble methods in structured data prediction. The superiority of Random Forest is similar to the conclusions in Chen and Guestrin [2] and Makridakis et al. [4], which proved the boosted and ensemble models outperform the linear or univariate time series methods. The interpretability part of the framework is in accordance with Lundberg and Lee [5], whose SHAP methodology give a basis for explainable decision support. The result of anomaly detection is consistent with Liu et al. [3], and confirms that Isolation Forest is effective to detect irregularities without the help of labeled data. Furthermore, the design of the model is consistent with governance and transparency principles outlined in the anomaly detection surveys of Chandola et al. [11] and Aggarwal [12]. The good success in treating class imbalance can also be seen in the works of Chawla et al. [1] and He and Garcia [6] indicating that resampling and cost-sensitive learning is important in the context of rare financial events. Thus it can be seen that the proposed system both complements and builds on previous system work with a high degree of predictive power combined with interpretability and risk detection in a combined enterprise environment.
These results have an even broader implication than the technical accuracy. The combination of the forecasting, anomaly detection and reporting into one auditable pipeline will reduce redundancy and give the support data governance by making the trace of the data across the modules. This holistic model enhances the confidence of the managers in the model-driven decision-making and expediency in detecting risks. The two-fold methodology of predictive modeling and unsupervised anomaly discovery enables a proactive and reactive planning and auditing of financial oversight systems that is more effective in improving the accountability of the financial oversight systems.
Nevertheless, it has several limitations which are to be mentioned. The implication of the framework reliant on area specific applications of example open_commitments which could likely limit the usage in other financial applications which lack similar data structures. Moreover, the implicit fixed threshold of the contaminations provided by the anomaly detection module might fail to adjust well to changing data distributions and also cause either over or under-detection of anomalies. Evaluation process was also conducted with the use of static datasets as well as real time streaming environment might create latency and drift problems that may compromise model performance.
The next generation of research has to be focused on attempting to construct a framework based on this to real time data streams with drift detection implemented together with self-recalibration functions [13]. Comparative evaluation with other techniques of ensemble e.g. gradient boosting and econometric and ML model hybrid [2,4,14] would be more informative in regard to trade-off between accuracy and interpretability. Another contribution to the leadership of credibility may be achieved with SHAP-based explainability Enhancement with stability and counterfactual testing [5]. Also, adaptive anomaly thresholding of data segment and fairness audits across departments would ensure equitable and consistent performance. [11], [ 12 ] Collectively, these advancements would bring the framework from being an analytical tool to being a comprehensive, self-adaptive enterprise decision system.
Conclusion
The research concludes that the unified enterprise analytics framework proposed in this research was able to integrate forecasting, anomaly detection and interpretability in one coherent, auditable system. By integrating the strength of machine learning with explainable artificial intelligence methods, the model fills the gap between accuracy and transparency - two of the pillars required for modern decision-making in the enterprise. The excellent performance of the Random Forest model proves that nonlinear ensemble techniques can be useful to capture the complex financial patterns that linear methods overlook. The fact that log transformation and ablation analysis are used also evidence the credibility of the model; although the introduction of the Isolation Forest mechanism in detecting anomalies can be used in the detection of unusual financial activity at the first stage which could be an indication of risks or inefficiency in the working process.
The findings of this study confirm familiar merits of ensemble learning compared to the current literature, along with resampling techniques and interpretable modeling systems. Nonetheless, the study extends this knowledge to indicate how such methods can be integrated into one automated workflow and assist in enhancing productivity, uniformity and adherence to governing bodies. The convergence of methodologies is causing a shift of predictive analytics to a disaggregated technical operation to fully encompassed decision support operation and be deployed to an enterprise financial setting.
The framework as suggested can thus be of some practical use in organizations that are seeking to develop transparent and accountable AI-driven systems. It offers a formula to strike a balance between performance and interpretability and guarantee audit and regulatory compliance. Even though it has certain weaknesses in anomaly detection techniques like dependency of features and evaluation of static data, it opens a bright future in future research like deploying models in real-time and fine-tuning anomalies. In general, this research study contributes both functionally and conceptually towards intelligent, explainable, and governable enterprise analytics.
References
- N. V. Chawla, K. W. Bowyer, L. O. Hall, and W. P. Kegelmeyer, “SMOTE: Synthetic Minority Over-sampling Technique,” J. Artif. Intell. Res., vol. 16, pp. 321–357, 2002. [CrossRef]
- T. Chen and C. Guestrin, “XGBoost: A Scalable Tree Boosting System,” in Proc. 22nd ACM SIGKDD Int. Conf. Knowl. Discovery Data Mining (KDD), San Francisco, CA, USA, 2016, pp. 785–794. [CrossRef]
- F. T. Liu, K. M. Ting, and Z. H. Zhou, “Isolation Forest,” in Proc. IEEE Int. Conf. Data Mining (ICDM), Pisa, Italy, 2008, pp. 413–422. [CrossRef]
- S. Makridakis, E. Spiliotis, and V. Assimakopoulos, “The M4 Competition: Results, Findings, and Conclusions,” Int. J. Forecast., vol. 34, no. 4, pp. 802–808, Oct.–Dec. 2018. [CrossRef]
- S. M. Lundberg and S. I. Lee, “A Unified Approach to Interpreting Model Predictions,” in Proc. 31st Conf. Neural Inf. Process. Syst. (NeurIPS), Long Beach, CA, USA, 2017.
- H. He and E. A. Garcia, “Learning from Imbalanced Data,” IEEE Trans. Knowl. Data Eng., vol. 21, no. 9, pp. 1263–1284, Sept. 2009. [CrossRef]
- M. Buda, A. Maki, and M. A. Mazurowski, “A Systematic Study of the Class Imbalance Problem in Convolutional Neural Networks,” Neural Netw., vol. 106, pp. 249–259, Oct. 2018. [CrossRef]
- C. Cortes and V. Vapnik, “Support-Vector Networks,” Mach. Learn., vol. 20, no. 3, pp. 273–297, 1995. [CrossRef]
- H. Zou and T. Hastie, “Regularization and Variable Selection via the Elastic Net,” J. Roy. Stat. Soc. B (Stat. Methodol.), vol. 67, no. 2, pp. 301–320, 2005. [CrossRef]
- J. Platt, “Probabilistic Outputs for Support Vector Machines and Comparisons to Regularized Likelihood Methods,” in Advances in Large Margin Classifiers, A. J. Smola, P. Bartlett, B. Schölkopf, and D. Schuurmans, Eds. Cambridge, MA, USA: MIT Press, 1999, pp. 61–74.
- V. Chandola, A. Banerjee, and V. Kumar, “Anomaly Detection: A Survey,” ACM Comput. Surv., vol. 41, no. 3, pp. 1–58, Jul. 2009. [CrossRef]
- C. C. Aggarwal, Outlier Analysis, 2nd ed. Cham, Switzerland: Springer, 2017. [CrossRef]
- A. Odunaike, “Integrating Real-Time Financial Data Streams to Enhance Dynamic Risk Modeling and Portfolio Decision Accuracy,” Int. J. Comput. Appl. Technol. Res., vol. 14, no. 8, pp. 1–16, 2025.
- V. Kalvala and A. Gupta, “Integrating Machine Learning and Statistical Models in Enterprise Risk Analysis,” in Proc. 4th Int. Conf. Sentiment Anal. Deep Learn. (ICSADL), Feb. 2025, pp. 852–861, IEEE.
- S. S. Parimi, “Automated Risk Assessment in SAP Financial Modules through Machine Learning,” SSRN Electron. J., 2019. [CrossRef]
Figure 1.
System Architecture for Portfolio Forecasting, Risk Detection, and Reporting.
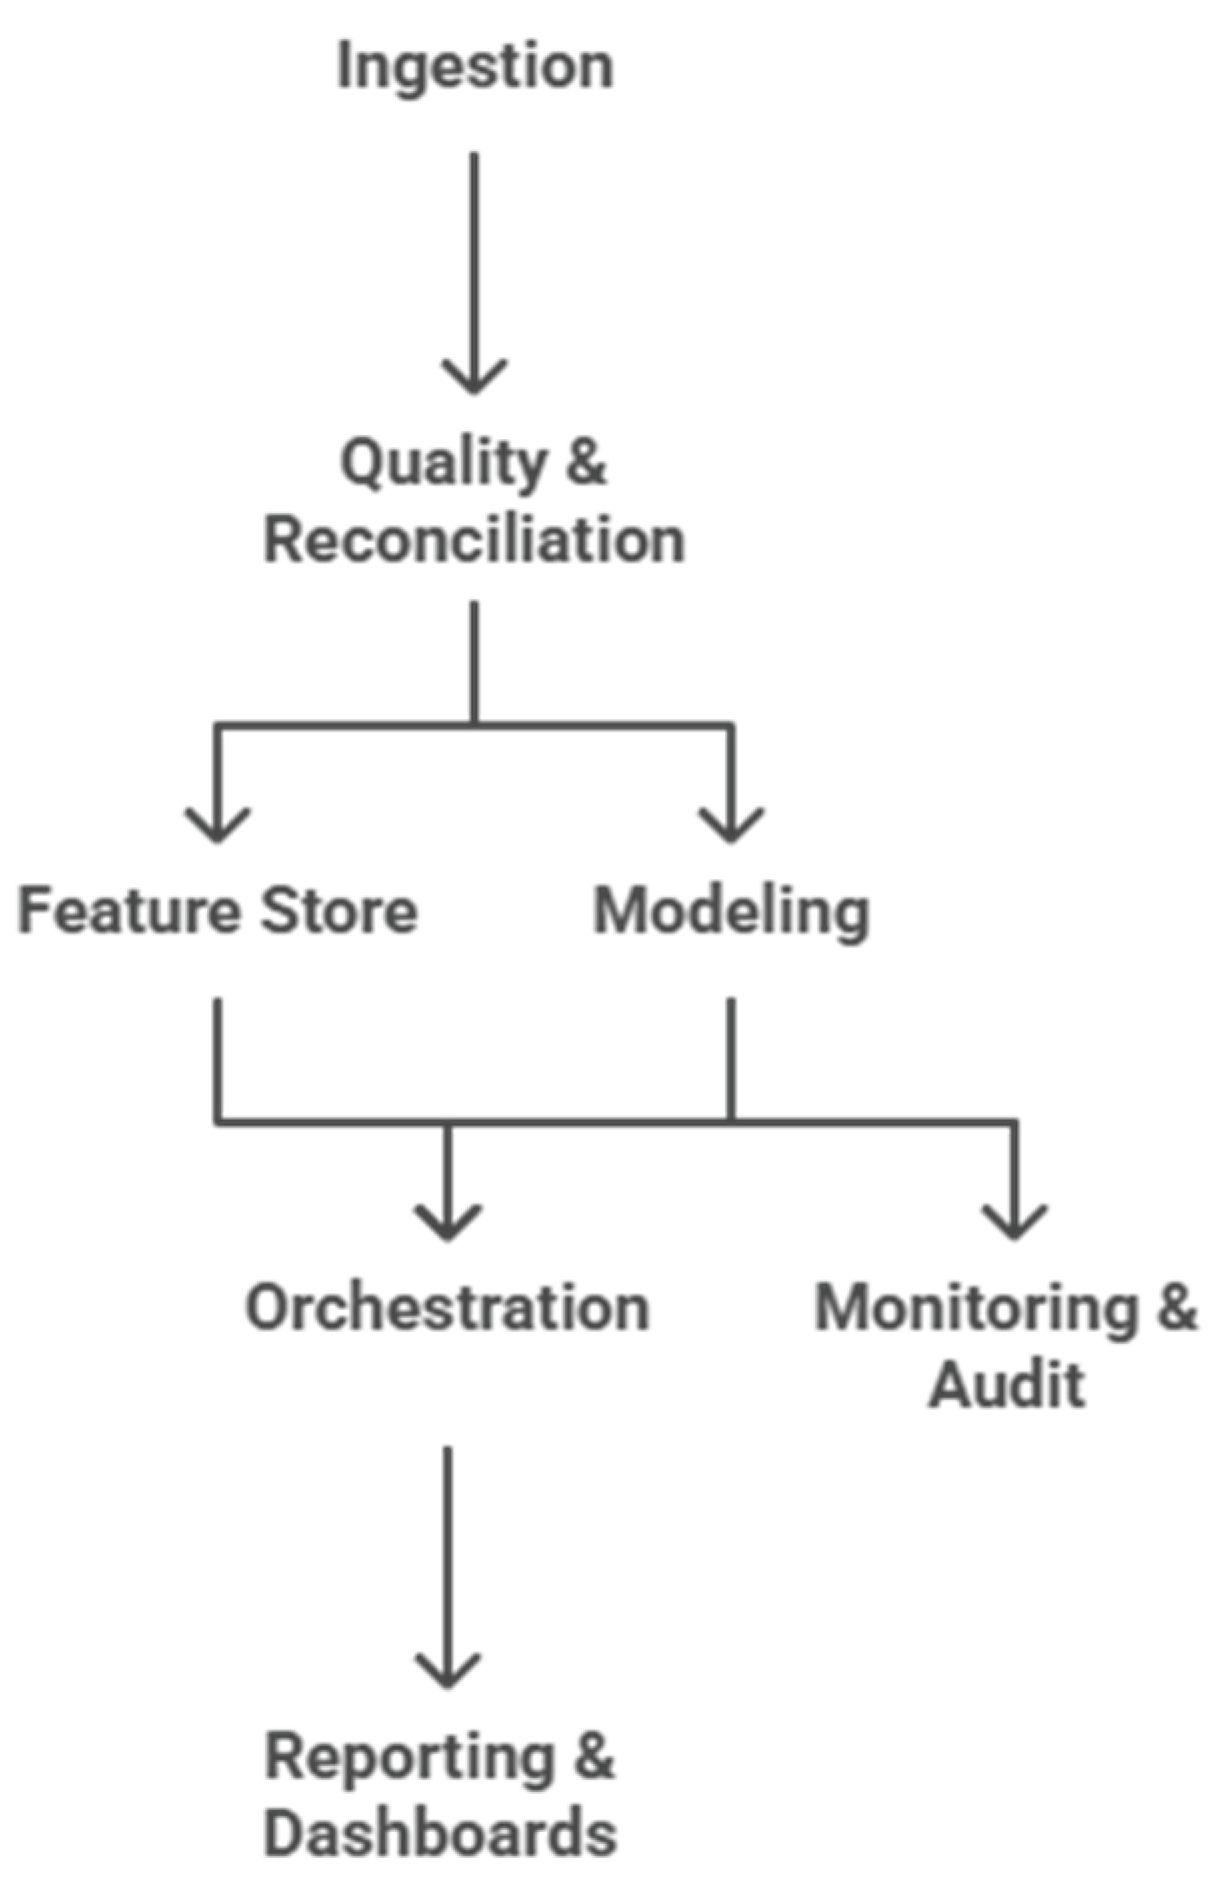
Figure 2.
Distribution of the target variable (A) before and (B) after logarithmic transformation.
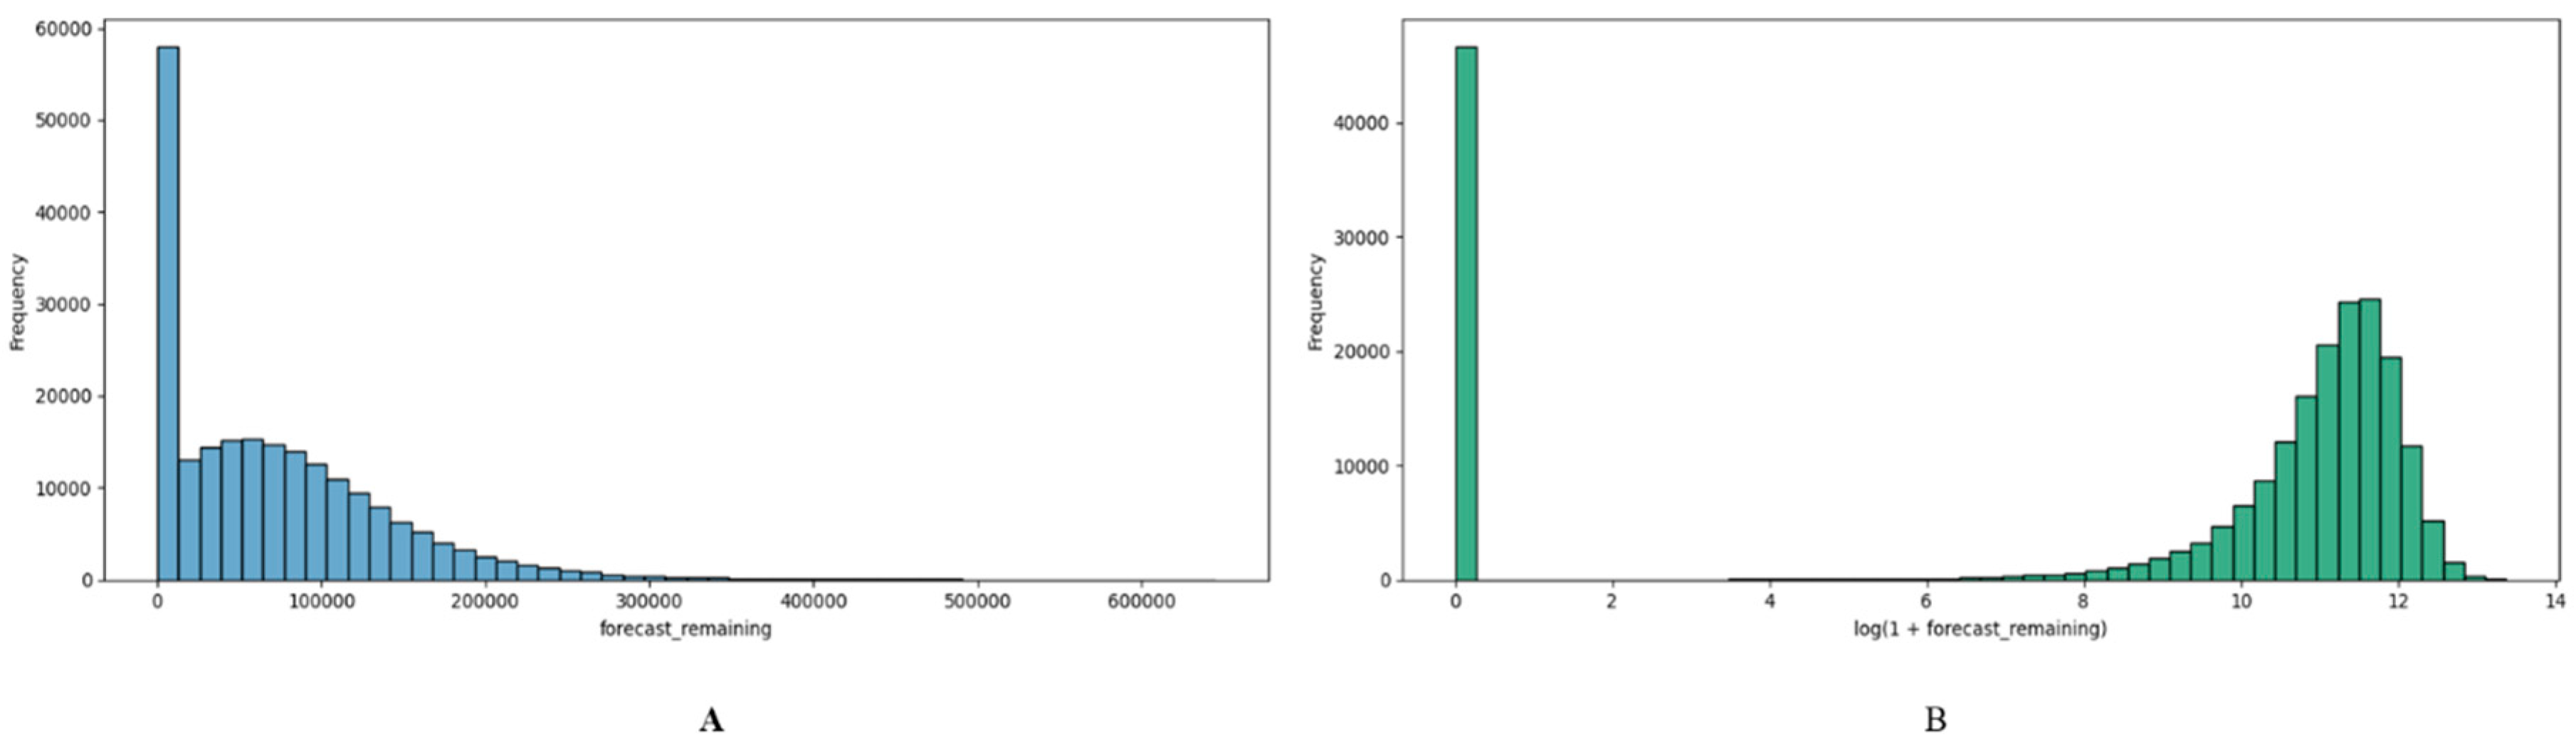
Figure 3.
Feature-importance ranking derived from the Random Forest model.
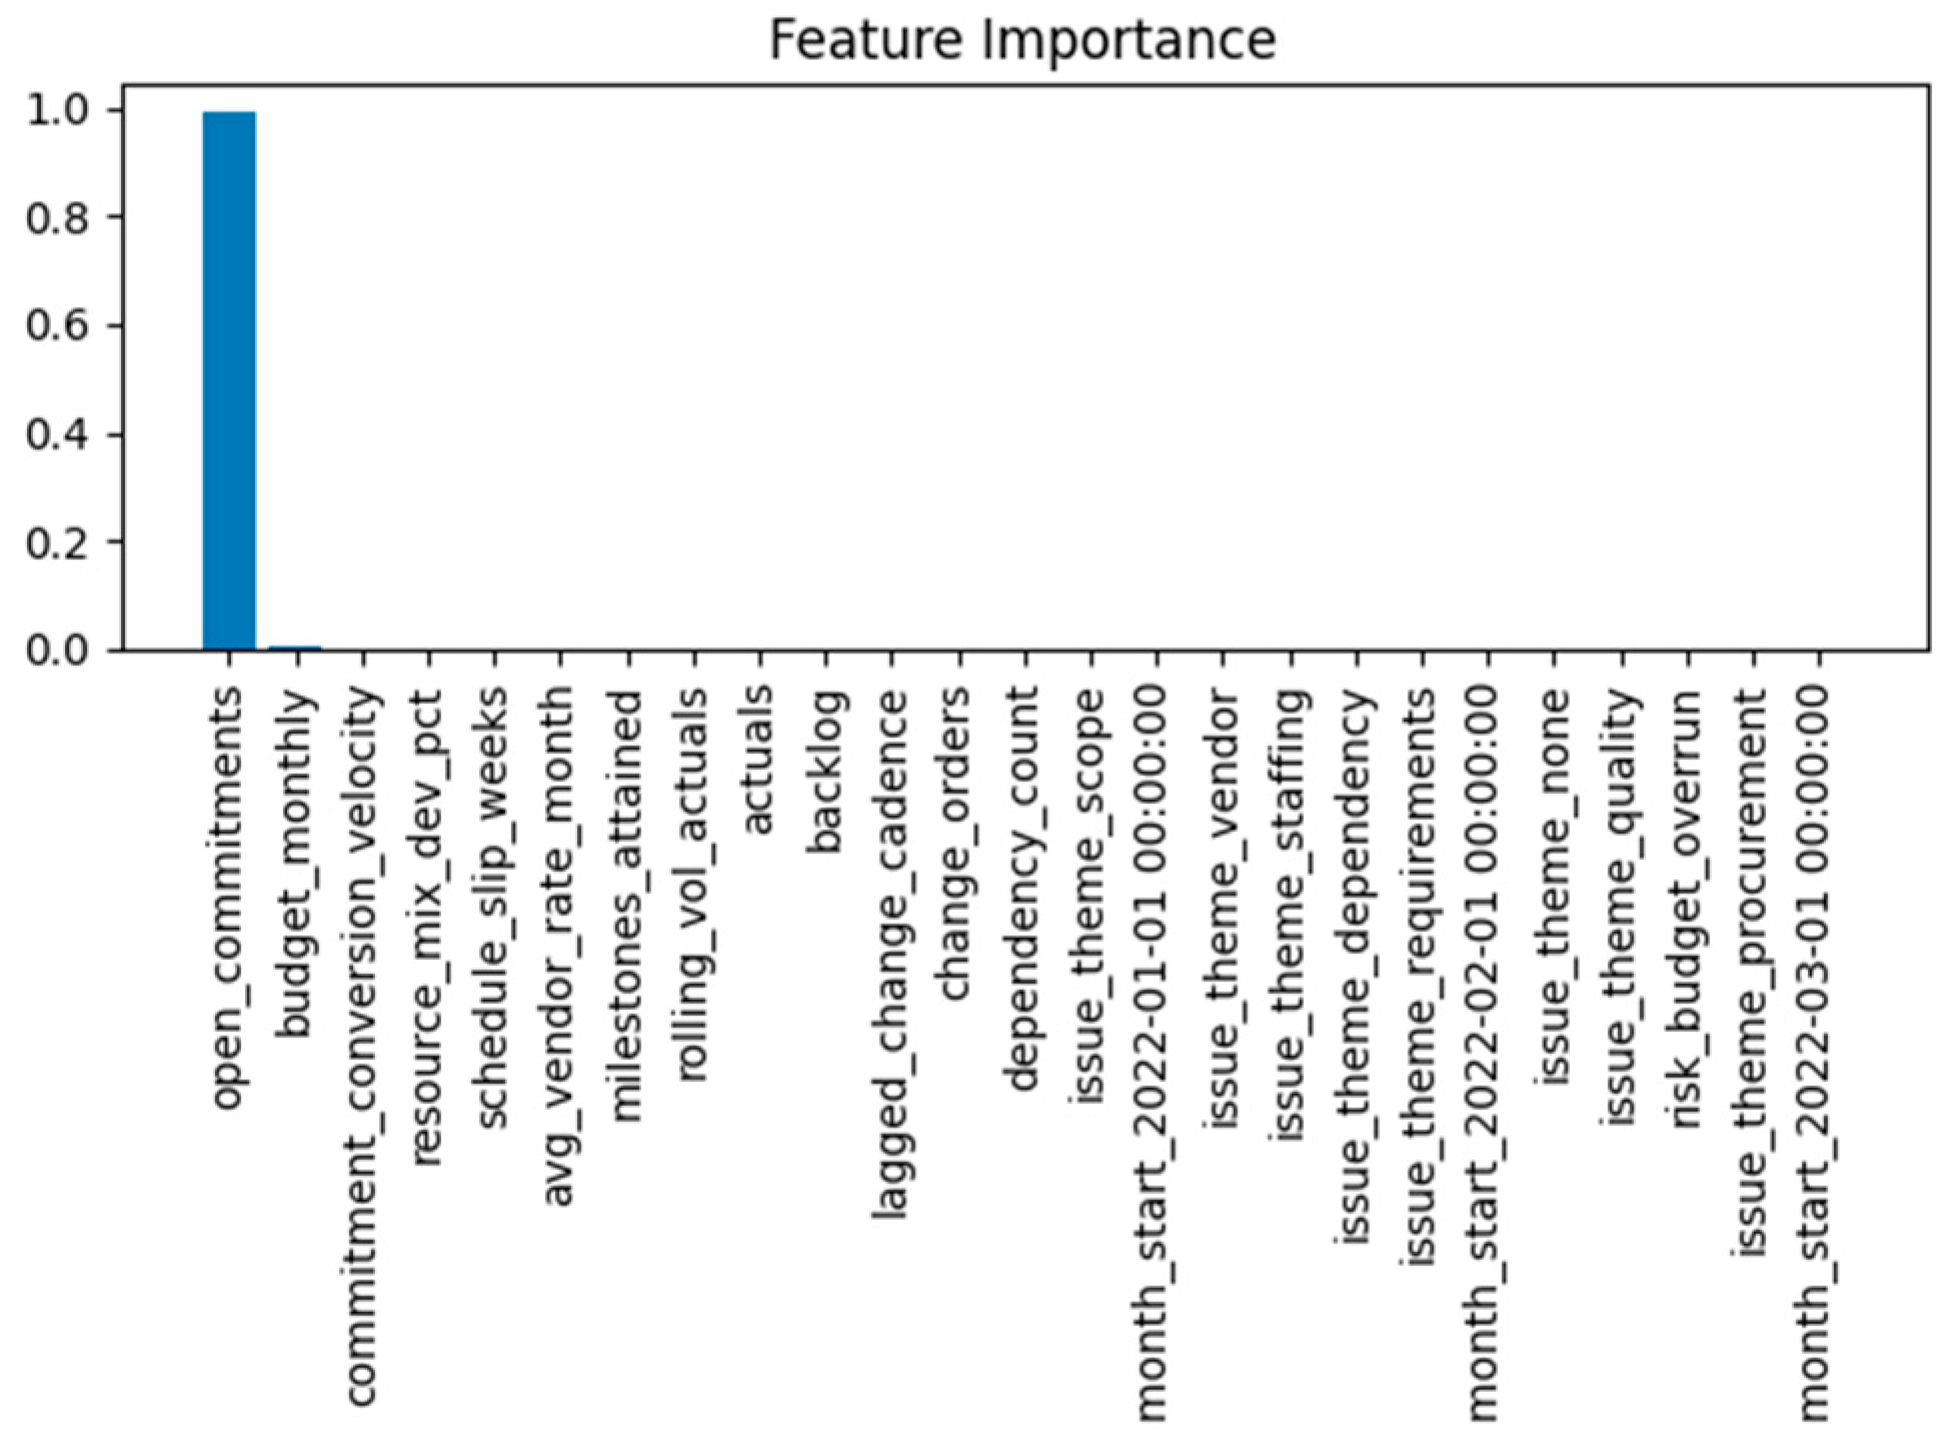
Figure 4.
Scatter plot of predicted versus actual values showing calibration alignment.
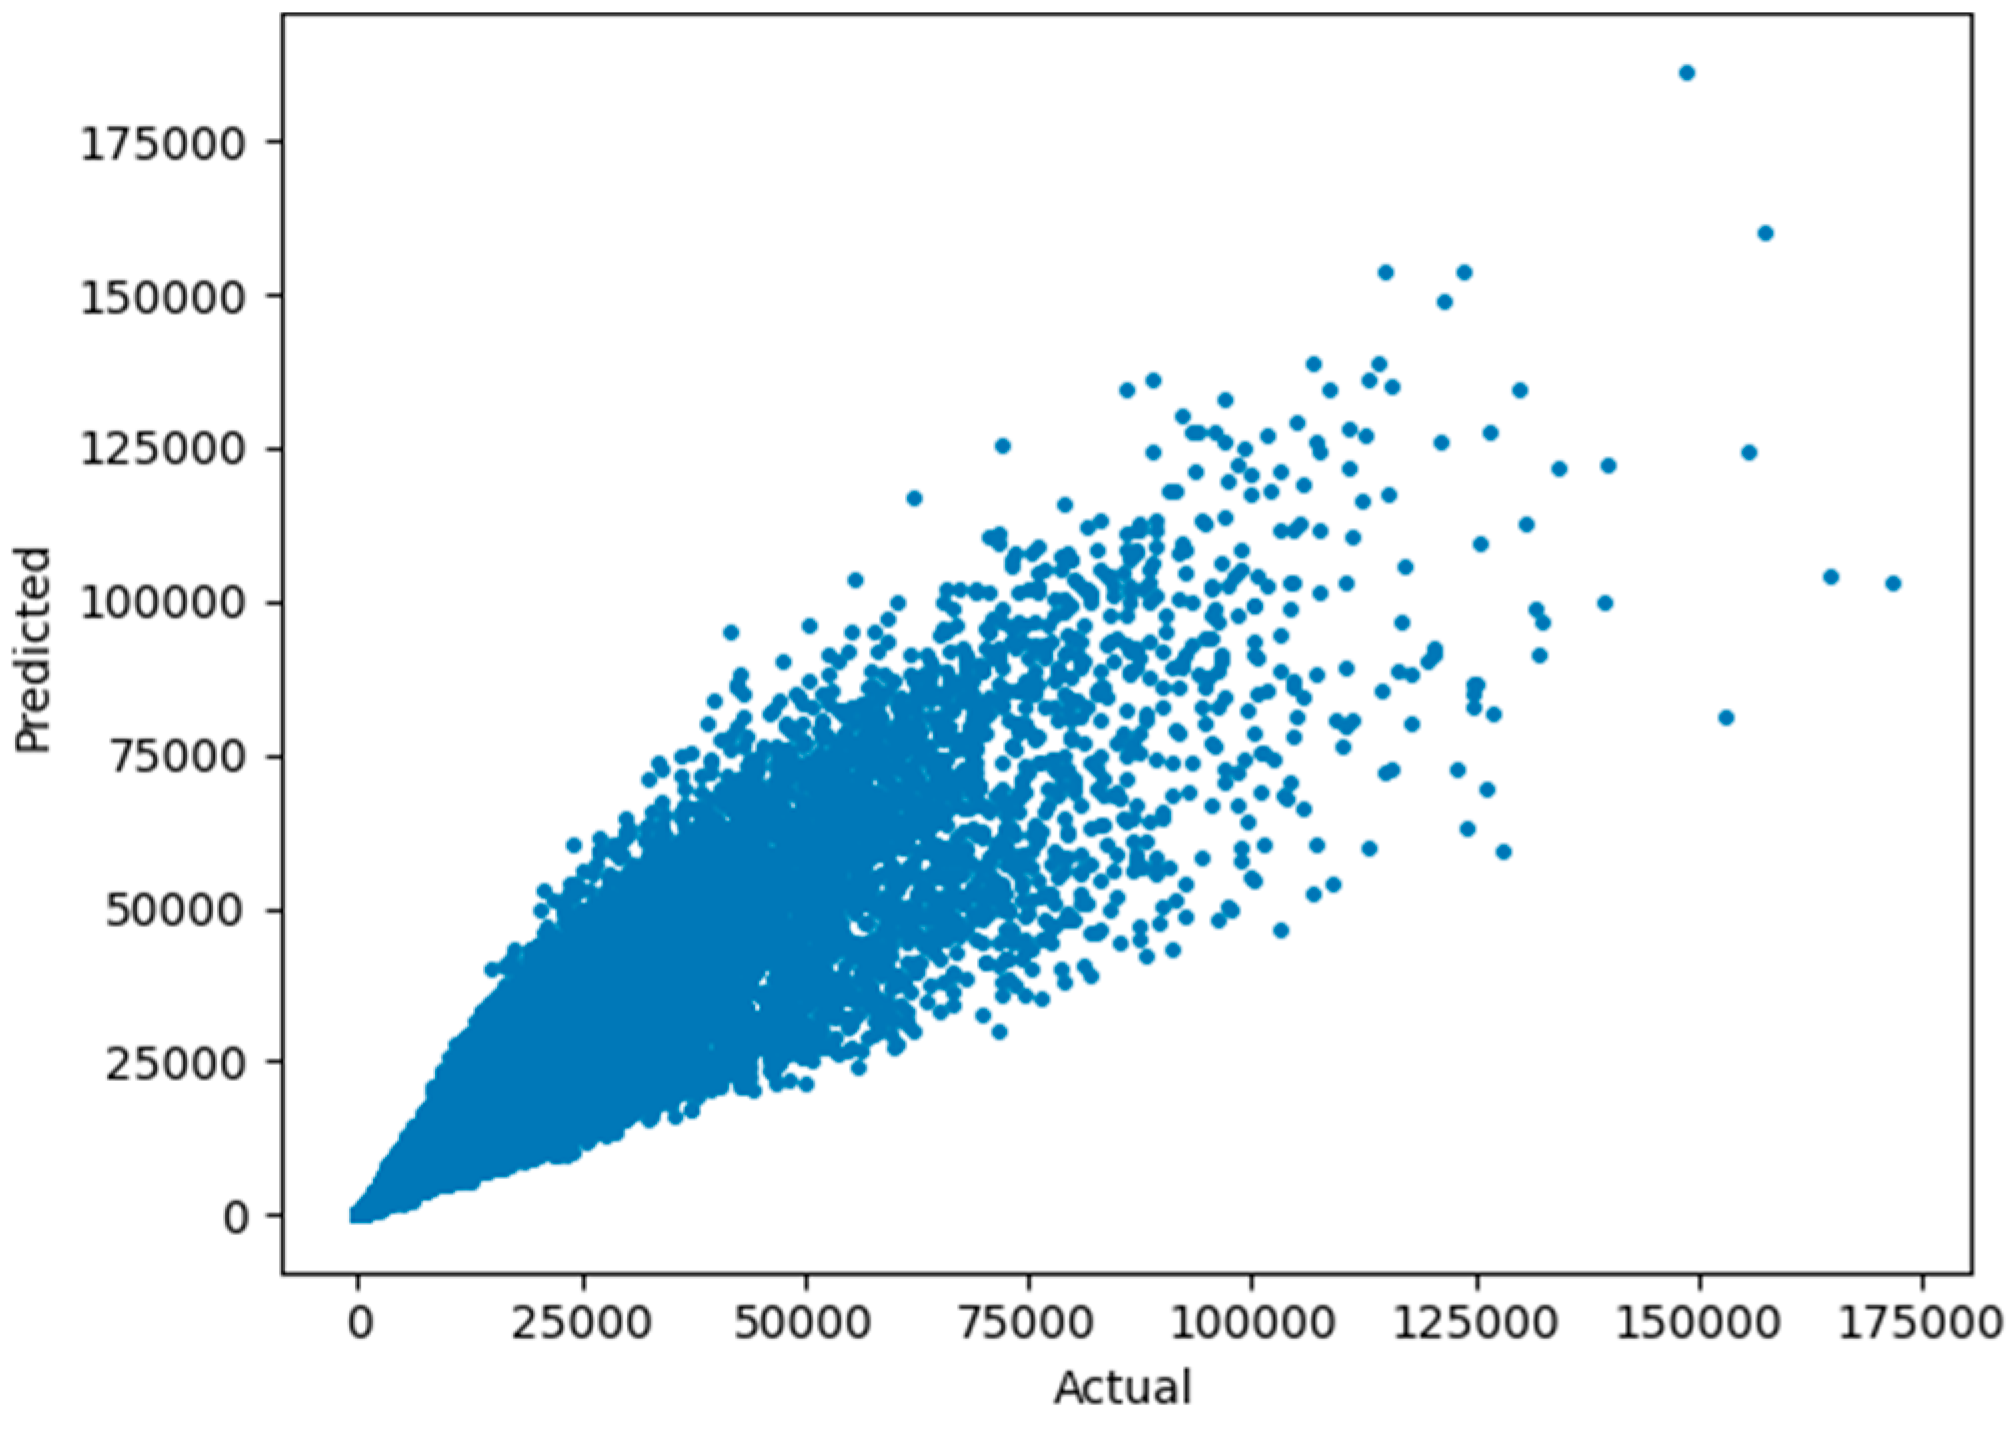
Figure 5.
Mean residuals by decile of target value demonstrating balanced error distribution.
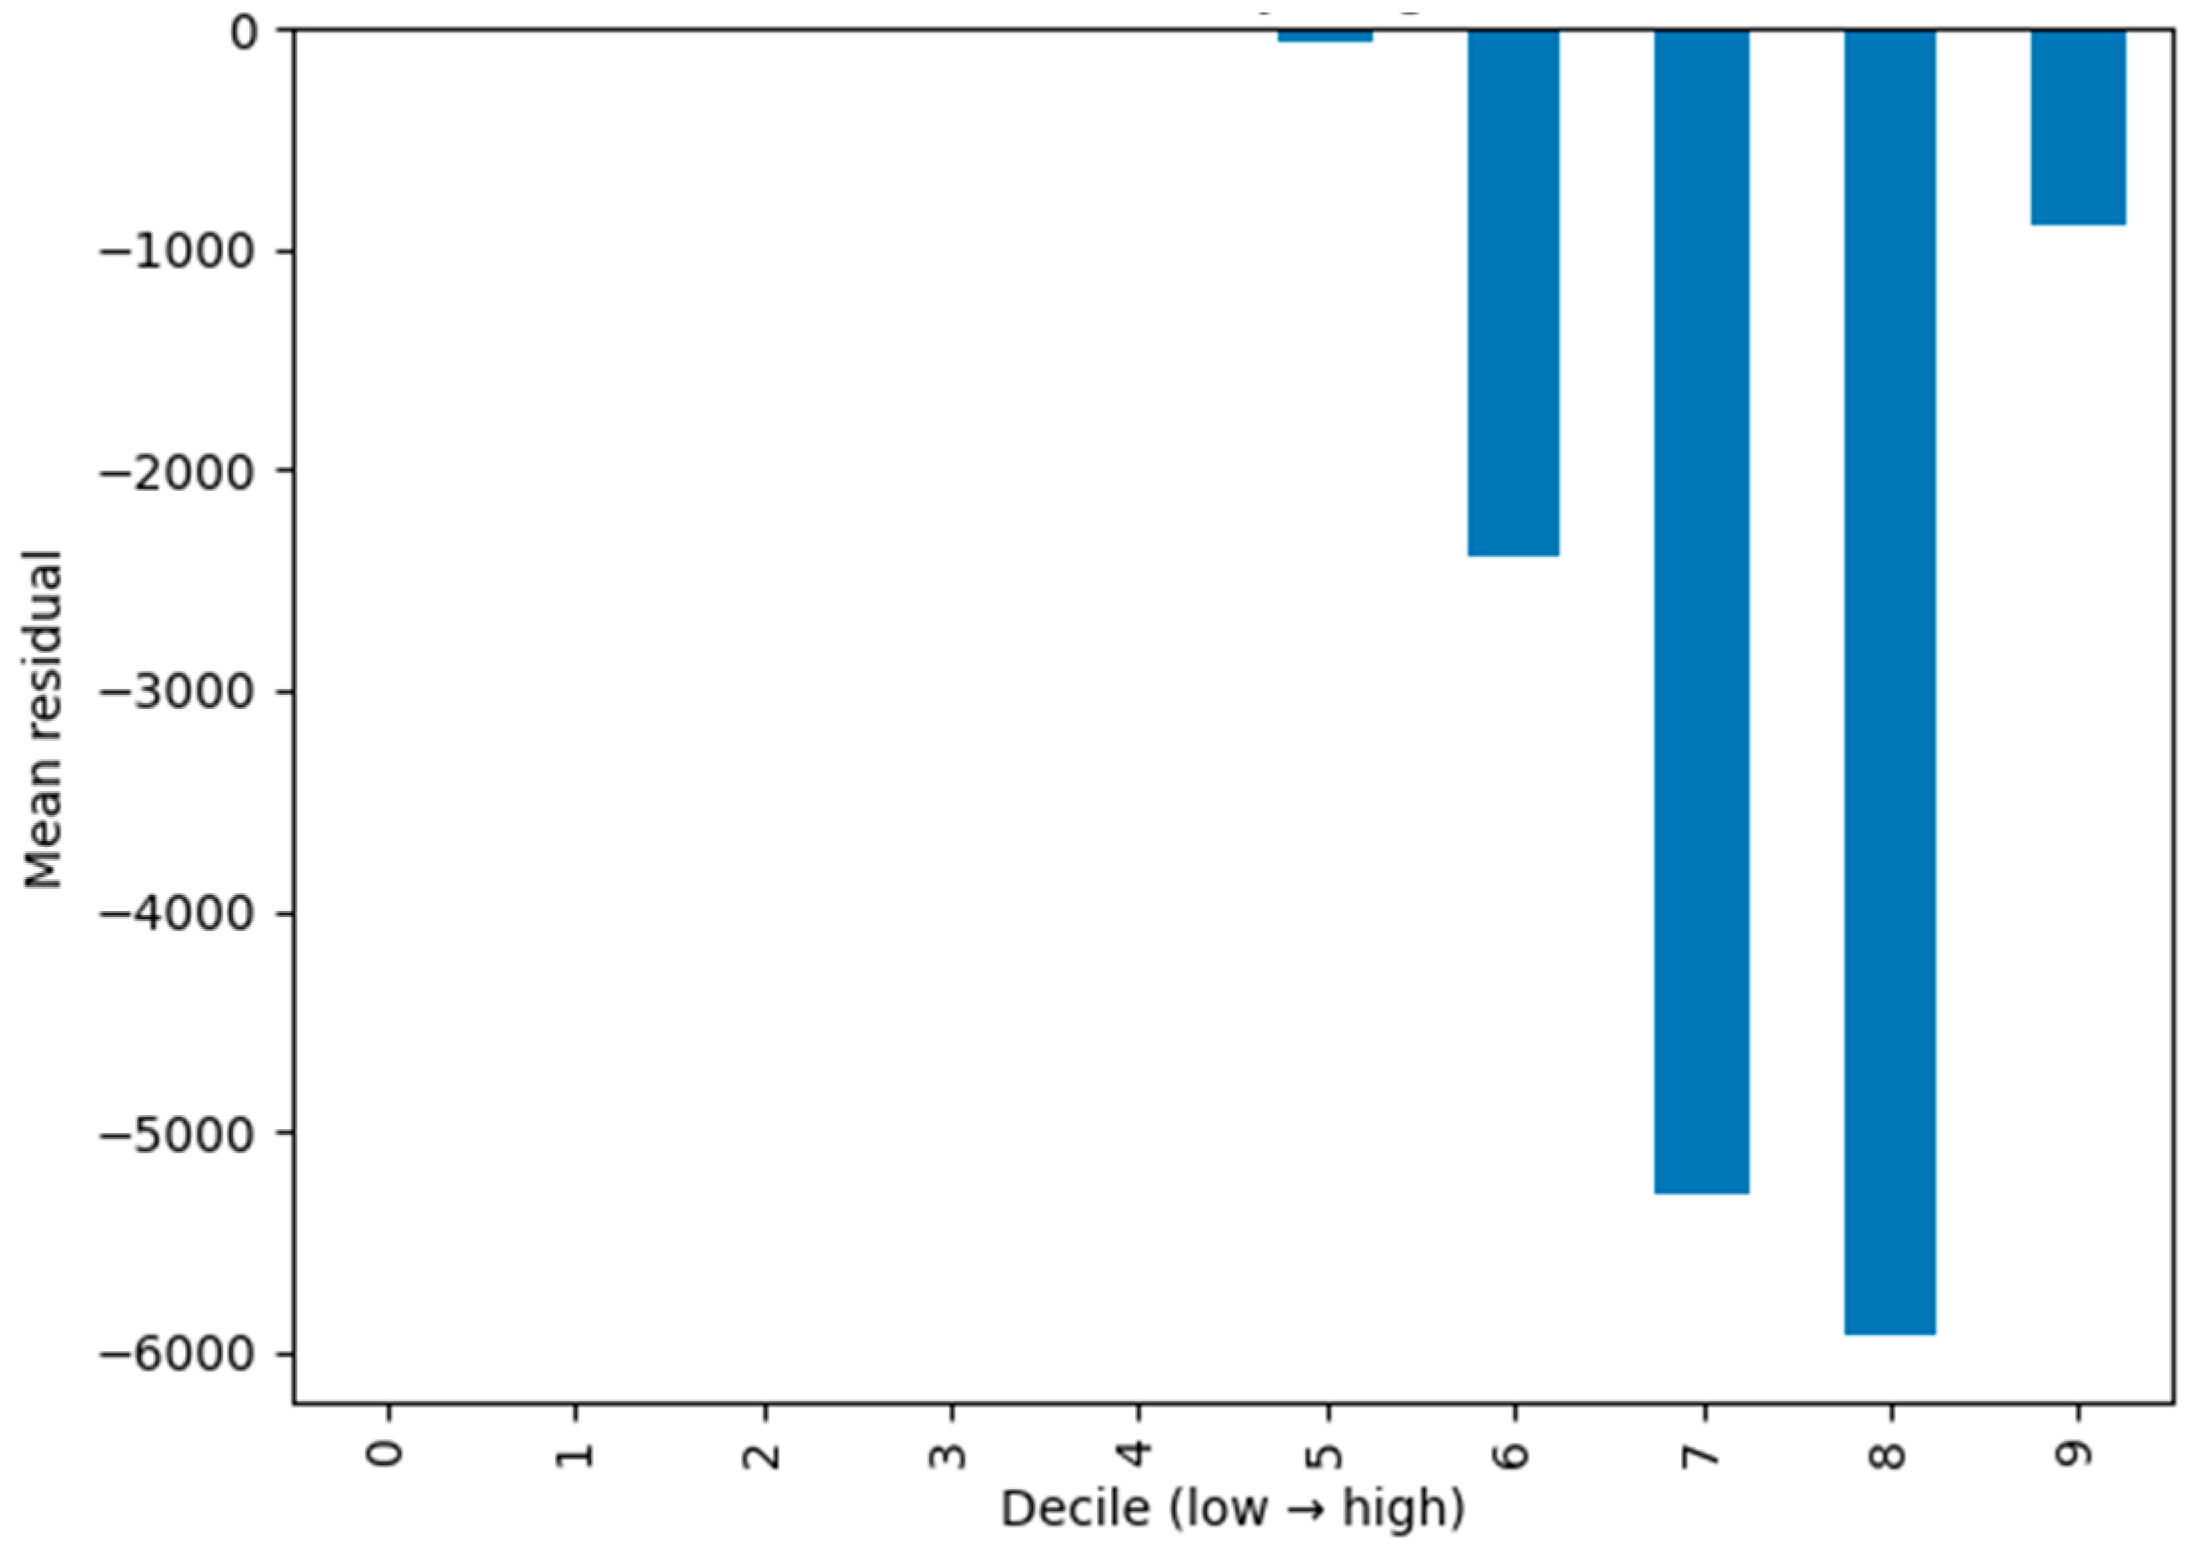
Figure 6.
Distribution of anomaly scores generated by the risk-detection module.

Table 1.
Comparative forecasting performance of the proposed and baseline models.
| Model | MAE | RMSE | R² |
|---|---|---|---|
| Random Forest (Proposed) | 3,687.85 | 7,751.08 | 0.8546 |
| Linear Regression (Baseline) | 10,206.59 | 20,023.65 | 0.0298 |
| Naive Mean (Baseline) | 73,092.59 | 75,532.30 | — |
Table 2.
Impact of removing “open_commitments” on model performance.
| Configuration | MAE | RMSE | R² |
|---|---|---|---|
| Full Model (All Features) | 3,687.85 | 7,751.08 | 0.8546 |
| Ablated Model (Without open_commitments) | 13,361.22 | 23,522.31 | –0.3389 |
Table 4.
Categorization of portfolio records based on anomaly scores.
| Risk Category | Description | Operational Interpretation |
|---|---|---|
| Normal Behavior | Scores near zero | Financial activity within expected thresholds |
| Moderate Risk | Scores moderately elevated | Irregular commitment-to-budget ratios or atypical timing |
| High Risk | Top 2 % of scores | Potential anomalies requiring managerial review |
Disclaimer/Publisher’s Note: The statements, opinions and data contained in all publications are solely those of the individual author(s) and contributor(s) and not of MDPI and/or the editor(s). MDPI and/or the editor(s) disclaim responsibility for any injury to people or property resulting from any ideas, methods, instructions or products referred to in the content. |
© 2025 by the authors. Licensee MDPI, Basel, Switzerland. This article is an open access article distributed under the terms and conditions of the Creative Commons Attribution (CC BY) license (http://creativecommons.org/licenses/by/4.0/).
Copyright: This open access article is published under a Creative Commons CC BY 4.0 license, which permit the free download, distribution, and reuse, provided that the author and preprint are cited in any reuse.


