
Submitted:
24 November 2025
Posted:
26 November 2025
You are already at the latest version
Abstract
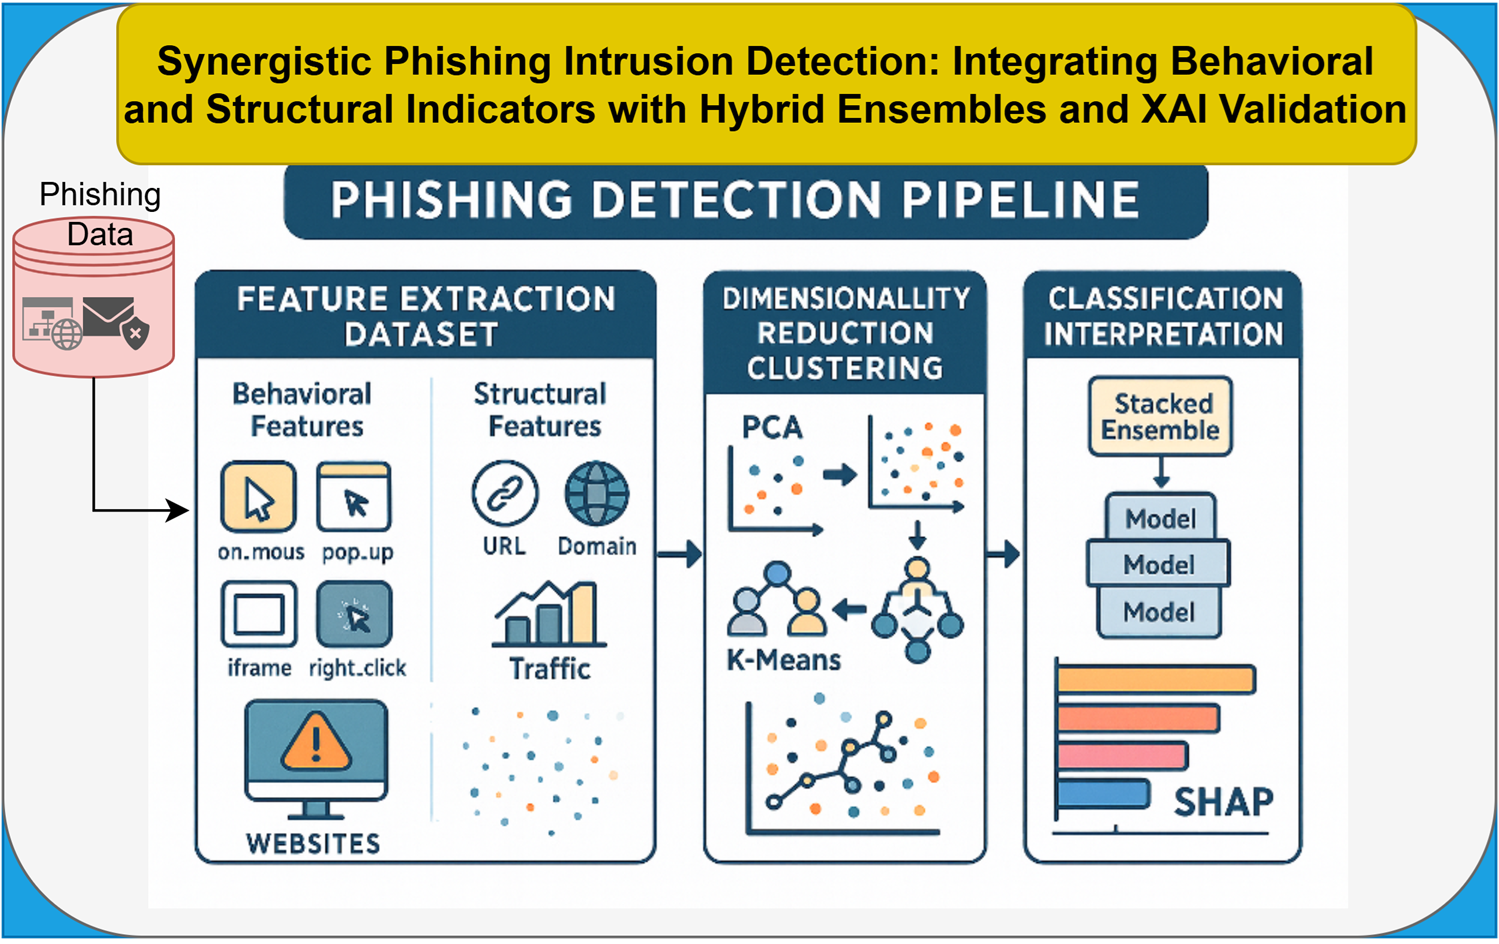
Phishing websites continue to evolve in sophistication, making them increasingly difficult to distinguish from legitimate platforms and challenging the effectiveness of current detection systems. In this study, we investigate the role of subtle deceptive behavioral cues such as mouse over effects, pop up triggers, right click restrictions, and hidden iframes in enhancing phishing detection beyond traditional structural and domain-based indicators. We propose a hierarchical hybrid detection framework that integrates dimensionality reduction through Principal Component Analysis (PCA), phishing campaign profiling using K Means clustering, and a stacked ensemble classifier for final prediction. Using a public phishing dataset, we evaluate multiple feature configurations to quantify the added value of behavioral indicators. The results demonstrate that behavioral indicators, while weak predictors in isolation, significantly improve performance when combined with conventional features, achieving a macro F1 score of 97 percent. Explainable AI analysis using SHAP confirms the contribution of specific behavioral characteristics to model decisions and reveals interpretable patterns in attacker manipulation strategies. This study shows that behavioral interactions leave measurable forensic signatures and provides evidence that combining structural, domain, and behavioral features offers a more comprehensive and reliable approach to phishing intrusion detection.
Keywords:
phishing detection
; behavioral features
; ensemble learning
; explainable artificial intelligence (XAI)
; cybersecurity
1. Introduction
Phishing attacks continue to be one of the most enduring and flexible cyber threats that affect organizations worldwide. The number of phishing incidents keeps growing because attackers send out millions of phishing attempts every year [1,2]. Security measures have advanced, yet attackers keep developing new deception methods that use deceptive website elements [3,4,5,6,7,8]. The identification of these phishing sites proves difficult because they duplicate authentic websites in every detail, which makes them difficult to detect even for skilled users. Research studies have concentrated on identifying standard phishing signs, which include suspicious URLs, absent SSL certificates, and newly registered domains [9,10,11]. The user interface contains behavioral indicators, which include pop-ups, mouse-over effects, right-click blocking, and hidden iframes, but researchers have not studied these elements. The web-based actions of users according to Kavya and Sumathi [12] and Taha et al. [13] play a significant role in how users perceive websites and build trust with them. Current studies fail to recognize the importance of user interface activities because phishing sites use these behaviors to create fake legitimate experiences through right-click blocking and mouse gesture hijacking, according to interpersonal deception theory [14]. The deception methods used in phishing attacks work to manipulate user perceptions while making it difficult for users to detect malicious content, which contradicts HCI principles that demand transparent and user-friendly interfaces. Theories of web trust [15,16] demonstrate that small interface problems can lead to trust breakdowns. The detection of phishing attacks depends heavily on behavioral characteristics because these elements strengthen the appearance of authenticity [17,18].
Research investigations now focus on developing behavioral fingerprints that help identify phishing attacks. Research has incorporated these features into classification tasks through machine learning, but the resulting performance has been inconsistent [12,19,20]. Research studies [21,22,23,24] demonstrate that these features show limited predictive power when used independently. The combination of traditional indicators with behavioral features leads to enhanced phishing profiling and detection capabilities. The current research lacks empirical evidence that demonstrates the combined power of these features. Research indicates that behavioral indicators by themselves achieve less than 50% success rate and their cumulative effect remains unproven. The success rate of behavioral cues in phishing detection remains below 50% when used independently. The application of clustering methods together with large language models enables researchers to group phishing websites based on their shared characteristics, which helps them understand attack methods and infrastructure [27,28,29]. Most clustering models analyze domain and content features, but few studies investigate how behavioral elements affect URL- and domain-based data. The additional behavioral data layer shows promise to create more defined clusters and improve phishing attack classification [29]. The research field continues to develop, but experts face an ongoing major challenge. Most current phishing detection systems depend on structural indicators, which include URLs and domain names. The features prove useful, but they have restrictions because phishing sites have learned to duplicate authentic websites. The analysis of behavioral website features, including mouse-over effects, pop-ups, right-click blocking, and hidden iframes, remains an underexplored field. Attackers use these features to create trust manipulation schemes that help them stay undetected. Human-computer interaction and deception theories support these behaviors, but researchers tend to view them as insignificant problems instead of potential scam indicators. Early machine learning systems failed to recognize the value of behavioral indicators, which proved to be important for both individual assessment and combined analysis with established features. The lack of attention to behavioral indicators weakens detection system performance because attackers continue to evolve their tactics. A complete solution requires testing how behavioral indicators improve phishing identification and campaign analysis through complex machine learning systems, which combine multiple approaches with explanation capabilities. The implementation of Explainable AI (XAI) through SHAP values becomes essential because hybrid models present complex security challenges that require proof of behavioral features' actual contribution to accurate classification.
To address this gap, we explore how behavioral features enhance phishing detection when combined with traditional factors, employing advanced hybrid ensemble and explainable machine learning techniques. This approach should be integrated with sophisticated machine learning methods, especially tiered hybrid models, to effectively analyze both low-level behavioral traces and high-level structural indicators. We focus on the following research questions (RQ):
- RQ1: How do behavioral interface cues, such as mouse over actions, pop up events, hidden iframes, and right click restrictions, interact with structural and domain-based indicators on phishing websites?
- RQ2: To what extent do behavioral features improve the clustering and profiling of phishing campaigns compared to using only structural or technical attributes?
- RQ3: How does the integration of behavioral features with traditional indicators influence the performance of phishing intrusion detection models, particularly in terms of classification accuracy and macro F1 score?
- RQ4: How do the observed behavioral phishing indicators relate to established theories of deception, HCI, and trust formation?
This study advances phishing detection by emphasizing the often-overlooked importance of behavioral web features. We are developing hybrid detection systems that identify subtle signs of deception, such as mouse-over movements, unexpected pop-ups, and sites that block right-click menus. While most research has focused on website structure and domain features, we investigate whether incorporating behavioral indicators can enhance detection accuracy, especially when used alongside traditional signals. Using a publicly available phishing dataset from archive.ics.uci.edu, we apply both classification and clustering models. We aim to assess whether behavioral features improve model performance, how they relate to factors such as structure, domain, and traffic metrics, and their potential for real-time phishing detection. We also propose an ensemble-of-ensembles architecture that combines multiple base learners in voting and stacking configurations to enable layered decision-making, as discussed in the literature [21,29,30,31]. Furthermore, we utilize SHAP, an explainable AI (XAI) tool, to improve the transparency and interpretability of the models, as supported by [12,32,33]. This research adds to the growing body of work promoting more comprehensive phishing detection systems, moving away from reliance on single features toward multi-faceted analysis [6,12,17,20]. Our goal is to establish a data-driven foundation for understanding how behavioral fingerprints can complement existing detection heuristics and enhance the profiling of online phishing campaigns. The key contributions of this study are as follows:
- We provide empirical evidence that subtle behavioral deception cues, including mouse over effects, right click blocking, hidden iframes, and pop up triggers, significantly enhance phishing intrusion detection when combined with traditional structural indicators, addressing a gap in prior work.
- We introduce a hierarchical hybrid architecture that integrates PCA-based dimensionality reduction, phishing campaign profiling through K Means clustering, and a stacked ensemble classifier specifically designed to capture both structural and behavioral intrusion signals.
- We advance the use of SHAP-based Explainable AI from descriptive visualization to a formal validation mechanism, demonstrating the specific diagnostic contribution of behavioral features and improving transparency, interpretability, and forensic trustworthiness.
- We establish a conceptual link between behavioral deception mechanisms, Human Computer Interaction principles, trust formation, and signal detection theory, showing how interface rule violations translate into measurable behavioral indicators that enhance intrusion detection and XAI-grounded security interpretation.
2. Literature Review
2.1. What is Phishing: A Brief Background
Cyber attackers use phishing to deceive people into disclosing their sensitive information [3,11]. The attackers use fake identities of trusted organizations to obtain passwords, banking information, and personal details from victims. Phishing techniques have undergone major development since their initial emergence as email-based fraud during the 1990s. The first phishing emails contained multiple grammatical mistakes, which made them easy to identify. Phishing attacks have developed into a significant global cybersecurity threat because they produce increasing numbers of sophisticated attacks. Security incidents result in an average financial loss of $150,000 for each attack, according to [34]. The majority of cloud platform attacks against Microsoft 365 occur through credential phishing methods [35]. The widespread adoption of the HTTPS protocol by phishing sites makes them more difficult to detect because they display legitimate-looking security indicators [35,36,56]. The effectiveness of phishing attacks depends on social engineering because it remains a primary method for cyber intrusions, which results in numerous data breaches [34,37]. The implementation of Artificial Intelligence (AI) technology has introduced major changes to the field because attackers now employ large language models (LLMs) to create authentic-looking phishing emails that mimic official company messages [13]. The attackers now use three different methods to conduct their attacks, which include website cloning, customized messages, and two-factor authentication evasion [38,39]. The security threat from phishing attacks has evolved because attackers now use websites, text messages, phone calls, and social media platforms to deceive victims, which requires advanced security systems that can adapt to new threats.
2.2. Factors and Techniques Used in Phishing Detection
Research on phishing detection has investigated multiple elements, which include behavioral patterns, URL characteristics, domain information, and network traffic data. The literature [3], [6,9,11,31,40,41] uses the classification system shown in Figure 1. The way a website interacts with users through behavioral features includes pop-up windows, disabled right-clicks, on-mouseover effects, hidden iframes, and JavaScript manipulations [1,19,42]. These features seem unimportant, but they help attackers hide their activities from users. Research shows that these features help detect phishing attacks when used together with other warning signs [1,19,42]. The detection systems focus on URL structure analysis through three main indicators, which include URL length, IP address usage, suspicious keyword presence, and excessive dot numbers [10,30,43]. The first defense mechanism uses these indicators because they provide fast evaluation results that can be measured precisely. Website metadata analysis through domain-based signals examines three elements, which include registration date, activity duration, and SSL certificate expiration time. The short duration of phishing domains leads systems to identify new unverified websites as potential threats [11,29]. The analysis of user and browser interactions with websites through time-based traffic features includes traffic statistics, session length, bounce rates, and page referral patterns. The existing system prevents immediate access to essential metrics, which organizations need to perform post-incident assessments and develop machine learning models.
2.3. Related Works
Research now uses machine learning (ML) and deep learning (DL) to develop improved protection systems which defend against the increasing number of phishing attacks. The new detection methods, feature combination approaches, and model interpretation techniques have emerged through these research studies. The deep learning system which combines image data with frame information and textual content achieved better results in phishing attack identification [44]. The RNN system called “Phish-armour” developed by Dhanavanthini and Chakkravarthy [45] uses quick URL text analysis to demonstrate its potential for running on devices with limited resources. Taha et al. [13] evaluated multiple machine learning algorithms for phishing classification through their comparison of random forests and decision trees which showed random forest achieved the best results. The research shows that ensemble ML algorithms function as reliable security systems that defend against phishing threats. The current main obstacle with ML models exists because they generate output that users cannot understand. The development has triggered a major rise in demand for explainable AI systems, which need to function in AI applications. The authors of [46] developed a system to assess explanation methods according to their complexity levels and robustness performance, which helps users pick suitable interpretation tools for their needs. The EXPLICATE framework developed by Lim et al. [The authors in [47] use LIME with large language models (LLMs) to generate explanations from complex ML system outputs. The system enables advanced ML systems to work with user trust because trust stands as a fundamental requirement for cybersecurity protection. Yan et al. [7] studied phishing detection systems operating within blockchain systems because these systems create specific difficulties due to their restricted training data and their tendency to shift domains. The ADA-Spear model developed by Yan et al. The researchers used adversarial domain adaptation methods to achieve successful phishing detection on Ethereum and Bitcoin networks. Table 1 summarises existing studies on phishing detection systems.
The summary in Table 1 shows that researchers continue to develop systems to detect phishing attacks. The majority of research studies [1,7,13,44,45,47,48,49] focus on structural indicators, including URLs, domain data, and SSL certificate information. The detection of structural features has limitations because these features do not protect against modern phishing attacks. Modern detection systems lack the ability to identify advanced behavioral methods that attackers employ to deceive users into accepting their attacks. According to interpersonal deception theory [14], phishing sites use fake interfaces to conceal their malicious nature through right-click disablement, mouse-over hijacking, and hidden iframe embedding. The attacker uses these tactics to execute deception strategies, which help them create fake situations that reduce user investigation. The system fails to meet Human-Computer Interaction (HCI) heuristics because users normally expect interfaces to be both transparent and interactive right away [50]. Web interface trust theories developed by Fogg [15] and Fogg et al. [16] demonstrate that minor interface problems can negatively impact user perceptions of website credibility. The detection process of phishing attack operational effectiveness relies on behavioral signals for its operation. The research investigates how machine learning detection systems achieve better results by leveraging behavioral indicators that experts typically disregard when using them alongside conventional detection features.
3. Materials and Methods
The following section explains the research methods that this study implemented. The study begins by establishing the official definition of phishing website detection before presenting the complete hybrid system developed for phishing website identification.
3.1. Problem Definition
Let be the set of all labeled websites in the dataset, where each website is represented by a structured features comprising behavioral indicators (b), URL-based (u), domain (d), webpage-based (w), and traffic and search engine (t). Thus, the full representation of the website is defined as in Equation (1). Let the label space where denote a phishing (malicious) website and indicate a legitimate (benign) website.

- where: || denotes vector concatenation , the total number of features after integration. Give a labeled website represented by the phishing detection task is to learn a decision function: where
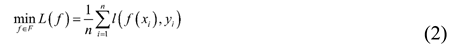
 is the predicted class for wi The goal of learning is to reduce a loss function (see Equation (2)), which looks at the prediction mistakes between phishing and legitimate websites and may also include regularization to improve generalization. where l is a binary classification loss function, is the true label of the website is the model’s predicted label.
3.2. Study Framework
Figure 2 shows the data flow framework of the study. The framework contains nine stages, which start with dataset preprocessing, followed by Exploratory Data Analysis (EDA), feature set construction, dimensionality reduction, unsupervised clustering, supervised classification, model evaluation, and model explainability. The following sections of this paper explain each phase of the study through detailed descriptions.
3.3. Data Preparation and Feature Categorization
The research uses phishing website data accessible at archive.ics.uci.edu. The dataset includes 11,055 instances, each containing 30 features and a binary label indicating whether a website is phishing (malicious) or legitimate (benign): 1 and -1, respectively. The features in this study are organized into five distinct categories (see Table 2). The data inspection revealed that it contained no missing values. The model required binary target values, so the researchers converted the target variable to 1 for phishing and 0 for legitimate. The researchers performed typo correction on popUpWidnow to popUpWindow to achieve successful plotting and correlation evaluation. The researchers divided the prepared data into training and test sets at a 70:30 ratio. We used the Synthetic Minority Oversampling Technique (SMOTE) to address class imbalance in the training set. The training set was balanced, with phishing sites comprising 56% of the dataset and legitimate sites comprising 44%.
3.4. Exploratory Data Analysis (EDA)
The Exploratory Data Analysis (EDA) process allowed researchers to identify patterns between study data characteristics and their distribution patterns. The process helps researchers pick the most important variables that will work best for their phishing detection model. The two visualization tools serve as the main components of our EDA analysis. The first step involved using frequency bar charts to study data distribution for pattern identification in each feature. The Pearson correlation heatmap enables us to identify fundamental relationships between features, yet most variables consist of binary data. The visualization process for this section used Matplotlib and Seaborn Python libraries to create all images.
Feature Integration and Clustering
The next phase of our dataflow pipeline integrates the feature sets and performs unsupervised clustering. The research goal at this point involved testing how the combination of behavioral signals with structural and security indicators would enhance phishing website identification in a basic feature space. We created a comprehensive feature representation by integrating selected attributes across the datasetLet our study’s relabeled dataset consist of website samples, each annotated with a label , where 0 indicates a legitimate (benign) website and 1 indicates a phishing (malicious) website. The five different feature categories that describe websites are presented through Equations (3)–(7).
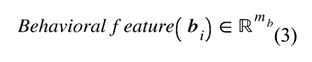
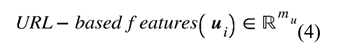
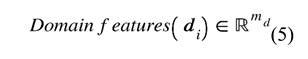
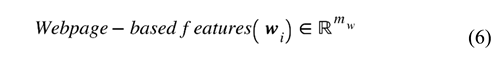

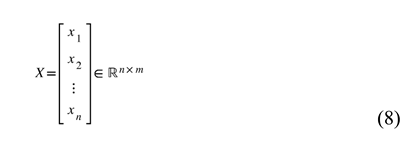
- where etc., are vectors of features from a specific category for the sample, and is the dimensionality corresponds to the number of features in that category. We define the full feature vector for the sample as the concatenation of the five feature categories (see Equation (1)). The final feature matrix is defined in Equation (8). We normalized the final feature matrix with the z-score as defined in Equation (9) and produced a normalized feature matrix defined by Equation (10), which becomes the input to our machine learning models.
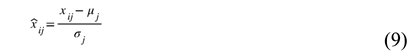
- where is the values of feature j for sample i, is the mean of feature j and is the standard deviation of feature j.
3.5. Detection Framework: Dimensionality Reduction, Clustering, and Classification Modelling
The study developed an efficient prediction system through experimental verification of different machine learning approaches, which included ensemble and hybrid methods. The following sections explain each method in detail.
3.5.1. Principal Component Analysis (PCA)
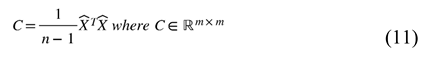
The method of principal component analysis transforms complicated data into simpler form by identifying essential axes which reveal major differences between data points. The method allows researchers to analyze complex data through basic evaluation methods, which preserve vital information. The study used PCA to decrease the number of variables in () while maintaining the maximum amount of data variation. The research achieved its goal through the following methodological approach.
- Compute covariance matrix (Equation (10))
- 2.
- Compute eigenvectors and eigenvalues: Find and such that:

- 3.
- Project the data onto the top k components: choose the top k eigenvectors that capture the most variance from the projection matrix . Then project:
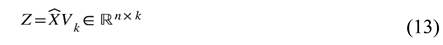
- where Z is the PCA-transformed feature matrix and becomes the input for clustering.
Our implementation used n_components=0.95 to maintain 95% of the explained variance. The selection of n_components=0.95 achieved the best possible trade-off between data dimensionality reduction and information preservation. The sensitivity analysis used 90% and 99% variance thresholds to evaluate the stability of our results (Section 4, Table 4).
3.5.2. K-Means Clustering
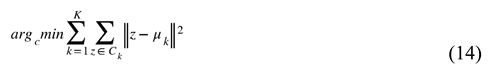
The K-means is an unsupervised algorithm that partitions data into K clusters by minimizing the distance between each data point and its assigned cluster centroid [11]. The goal of the K-means was to partition the PCA output Z into K clusters as defined in Equation (14). Thus, K-Means clustering was used in this study to explore latent structure in the data and identify potential groupings of phishing campaigns in an unsupervised manner. In this study, K was initially set to 4. However, our final cluster (K) was n_clusters = 2 to align with the binary class structure (phishing vs. legitimate). A sensitivity analysis was conducted for K = 2, 3, and 4 to evaluate robustness (see Table 4). where is the centroid of cluster , is the Euclidean norm in the reduced space.
K-Means was selected due to its computational efficiency, scalability, and suitability for numeric, structured feature spaces. It enables the discovery of natural groupings among phishing samples without prior labeling, helping profile attack patterns and complement the supervised classification stage.
3.5.3. Classification Approach
This research used multiple machine learning algorithms to create integrated classification systems that combined behavioral signals with structural system performance data for phishing attack detection. We employed three advanced ensemble algorithms which included Random Forest and XGBoost and Gradient Boosting as individual classifiers. The algorithms were selected because they demonstrated exceptional performance in previous phishing detection research and other fields of study [31,46]. Also, due to their proven effectiveness in handling high-dimensional, structured datasets and their ability to model non-linear interactions [57].
Random Forest (RF) functions as an ensemble method that generates multiple decision trees that produce combined predictions to reduce overfitting and prediction variability. RF handles big data sets well and includes automatic feature selection capabilities [31,46]. The Random Forest classifier used 100 decision trees (n_estimators = 100) with 'sqrt' as the max features selection and 'gini' as the splitting criterion (criterion = 'gini').
The XGBoost algorithm operates as a gradient boosting system, which constructs decision trees sequentially to improve the predictions of previous trees [51]. The XGBoost algorithm operates at high speed while producing accurate results when analyzing structured data. Our XGBoost classifier operated with 100 boosting rounds (n_estimators =100) and used 'binary:logistic' as the objective function and 'logloss' for evaluation. The model ran without label encoding while using a fixed random_state value of 42 for reproducibility purposes. The XGBoost unites weak prediction models into a powerful predictive system through gradient descent optimization of a defined loss function. XGBoost uses each new tree to fix the mistakes made by previous trees. The ensemble technique of Gradient Boosting constructs decision trees sequentially to build its predictive model. In this study, we used 100 estimators with a learning rate of 0.1 and a maximum depth of 3 to balance bias and variance.
The Ensemble-of-Ensembles framework at a higher level was developed to determine if different learning approaches would enhance classification performance. The base models produced voting results for class predictions, which the system used to determine the final classification outcome. The hard voting ensemble of ensemble classifiers (VEoE) combined predictions from four base learners, which included Random Forest, XGBoost, Gradient Boosting Classifier, and Logistic Regression. The Ensemble-Of-Ensembles (EoE) strategy used two different methods, which included Voting-Based (VEoE) and Stacked Ensemble (SEoE). We combined different learning approaches through tree-based and linear methods to achieve prediction bias reduction.
We constructed two distinct models that used different meta-classifiers for prediction. The study used a stacking ensemble with single learners, which operated through two stages where multiple classifiers ran in the first stage, and a meta-classifier processed their output in the second stage.
- Stacking Model A (Meta: Logistic Regression) used LogReg as its level-1 meta-learner while RF and XGBoost and Gradient Boosting and logistic regression operated as level-0 models.
- Stacking Model B (Meta: Support Vector Classifier) used RF and XGBoost and Gradient Boosting and Logistic Regression as level-0 models while SVC operated as the level-1 meta-learner. The level-0 models produced output that served as input to the level-1 meta-classifier for predictions.
The study assesses base model performance to create an optimal method for their combination. The StackNet architectures receive their definitions through Equations (15)–(20). The base and meta-learner hyperparameter selection process employed a limited grid search with 5-fold cross-validation and particular hyperparameter sensitivity evaluation tests. The optimization process included three main parameters: ensemble model estimator numbers, Gradient Boosting learning rate, and PCA explained variance thresholds. The fivefold cross-validation process served two purposes by reducing random sampling effects and producing dependable evaluation results. The performance metrics reported in Section 4 of this paper represent average scores across these folds.
Let the first-level models be:

For each model, Make a prediction:

Build a meta-feature vector for each sample:

These meta-features form a new dataset:
Second-level (meta) classifier learns:

In stacknet model A, In stacknet model B, Figure 3 and Figure 4 illustrate the schematic structure of our stacking models A and B, respectively. Each base learner generates a prediction (P1–P4), which is used as input to a meta-classifier (logistic regression or support vector machine). The meta classifier (logistic regression or support vector machine) learns how to optimally combine the base predictions to generate a final prediction (Pf). This two-level architecture enhances performance by leveraging the complementary strengths of different learners. The overall training cost of the proposed ensemble (see Figure 3 and Figure 4) is dominated by tree-based models, with complexity ranging from to , while the SVC meta-learner introduces additional cost due to probability estimation . However, given the dataset’s moderate size and the use of optimized libraries, training and inference times remained efficient. A full breakdown is included in Appendix A.1 and A.2.
3.6. Model Explainability with Shapley Additive exPlanations (SHAP)
The development of Explainable AI (XAI) techniques demonstrates that model transparency stands as a crucial element for machine learning applications across all domains. The SHAP tool enabled us to enhance model decision transparency for phishing detection tasks. The game-theoretic approach of SHAP enables users to understand model outputs through feature importance values, which explain specific predictions [32]. The shape.Explainer class enabled us to produce both global and local explanations for our top models which included XGBoost and RF. The TreeExplainer variant of SHAP proved suitable for tree-based models because it delivered both high precision and fast computation times. The SHAP values revealed which features produced the most significant impact on predictions while showing their positive or negative effect on phishing prediction results. The test set served as the data source for explanation generation because it contained new instances for which the interpretation would apply. The predictive framework demonstrates that the models achieved both high accuracy and expert knowledge alignment through their behavioral feature understanding. The SHAP value for feature j in model f and input feature set x is calculated through the formula shown in Equation (21).

where F is the set of all features, S is a subset of features excluding j, and is the model's prediction using only feature j across all feature subsets.
3.7. Model Evaluation
The evaluation of our model used established metrics, which included precision, recall, F1-score, and support, to determine its performance. The precision metric (Equation (22)) shows the percentage of identified phishing sites that actually contain phishing content. The model achieves better results when it produces fewer incorrect positive predictions because this helps maintain user trust and system usability. The recall metric (Equation (23)) measures how well the model identifies genuine phishing sites because failing to detect malicious sites leads to severe security risks. The F1-score (Equation (24)) combines precision and recall through harmonic mean calculation to produce a single performance metric that works well for situations with unbalanced data classes and equal costs for false positives and negatives. The scikit-learn classification report generated results for all models through per-class and macro-averaged scores, which provided detailed performance assessments for each category. The table shows all essential hyperparameters that the models received during their training process.

3.8. Experimental Setup
The experiments took place on a Windows 11 Enterprise system, which used an Intel Core i7 CPU (16 cores at 2.1 GHz) and 32 GB of RAM on a laptop. The software environment used Python 3.12.7 with NumPy 1.26.4, Pandas 2.2.2, scikit-learn 1.5.1, XGBoost 3.0.0, LightGBM 4.6.0, SHAP 0.47.1, and imbalanced-learn 0.12.3. The software used a fixed random seed value of 42 to achieve controlled randomization throughout all processes. The evaluation process used stratified 5-fold cross-validation with fixed data splits that remained constant between models. The model optimization process used a restricted search of pre-defined parameter values for each classifier (Appendix B.1 shows the complete hyperparameter search range). The table shows the best model parameters, which were determined through a 5-fold grid search process. The stacking model hyperparameter tuning process includes complete search configurations and cross-validation accuracy results, which are presented in Appendix B.2. The section 4 metrics display mean values with standard deviation error bars from multiple folds while using a 30% test set for validation.

Table 3.
Key Model Hyperparameters.
| Model | Hyperparameters |
|---|---|
| Random Forest (RF) | n_estimators=100, max_features=’sqrt’, criterion=’gini’, random_state=42 |
| XGBoost (XGB) | n_estimators=100, eval_metric=’logloss’, use_label_encoder=False, objective=’binary:logistic’, random_state=42 |
| Gradient Boosting (GB) | n_estimators=100, learning_rate=0.1, loss=’log_loss’, max_depth=3, random_state=42 |
| Logistic Regression (LR) | penalty=’l2’, solver=’lbfgs’, max_iter=1000, C=0.1 |
| SVC | C = 0.1 |
| K-Means Clustering | n_clusters=2 (final), with sensitivity analysis for K = 2, 3, 4; random_state=42 |
| Principal Component Analysis (PCA) | n_components=0.95 (final), with sensitivity analysis for 90%, 95%, 99% explained variance |
4. Results and Discussions
This section discusses the study's findings and their implications, guided by the research questions. It summarizes the key results and explores important behavioral and technical details to better understand the broader impact of employing hybrid features and ensemble learning in phishing detection.
4.1. Exploratory Data Analysis (EDA)
The research team conducted their first analysis to determine which behaviors including on_mouseover RightClick popUpWindow and Iframe appear together and which ones link to phishing or legitimate websites. The analysis provided us with better knowledge about the dataset. The visual presentation of Figure 5 displays count plots to show the data. The research revealed that phishing sites displayed their behaviors at higher rates than legitimate websites. The analysis in Figure 5 demonstrates that phishing sites used "on_mouseover" and "popup window" functions extensively during their operations. The analysis revealed that phishing samples used right-click blocking and "iframe" functions in an irregular pattern, even though these functions appeared infrequently throughout the dataset. The observed patterns indicate that phishing sites use fake user interface actions to trick users into performing specific actions. The study validates the significance of deceptive interface behaviors in phishing detection through empirical evidence, which supports both interpersonal deception theory and usability-centered trust models.
The correlation heatmap in Figure 6 shows the relationship between behavioral data, URL information, and domain characteristics. The analysis reveals that behavioral indicators align with the structural elements researchers uses to detect phishing attacks. The behavioral features demonstrate strong positive relationships with each other through their connection between popUpWindow and on_mouseover (r = 0.73) and their link between Iframe and popUpWindow (r = 0.63). The analysis shows that phishing websites implement multiple behavioral warning signs at the same time. The behavioral features in the dataset do not show significant relationships with URL_Length and SSLfinal_State and Domain_registration_length because they operate as independent signals. The analysis reveals minimal connections between behavioral characteristics and URL-based indicators through their weak correlation between popUpWindow and DNSRecord (r = 0.099). The research results demonstrate that behavioral indicators help phishing detection systems when used together with other detection methods. The research shows that behavioral indicators by themselves do not work as phishing detectors, but they often appear with structural modifications which support their function in deception detection.
4.2. Clustering Analysis Using PCA and K-Means
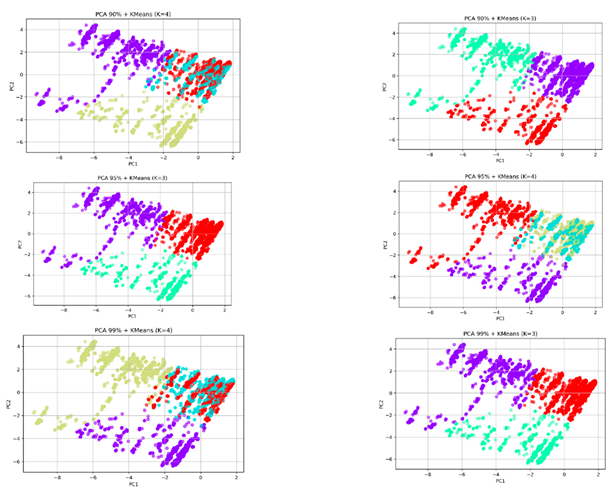
The analysis used Principal Component Analysis (PCA) for dimensionality reduction before applying K-Means clustering to discover hidden structural patterns in the data. Our research goal focused on determining whether uniting behavioral data with structural information would create distinct groups through unsupervised methods. The analysis included a sensitivity test, which examined how different PCA explained variance thresholds (90%, 95%, 99%) and K values (2, 3, 4) affected clustering stability. The results in Table 4 show that K=3 produced the best clustering results because it achieved the highest Silhouette Score (0.3046) and lowest Davies-Bouldin Index (1.5290) when using 90% variance. The performance decreased performance occurred when K reached 4 because the groups became too similar or contained too much noise. The 2D PCA visualizations at different variance levels showed consistent separation patterns, which indicated that meaningful groups form when different features are combined.
The results from unsupervised learning show promise, but behavioral signals need supervised refinement to achieve effective phishing detection. The optimal unsupervised clustering results were obtained at 90% explained variance with K=3 (see Appendix C), but we selected 95% variance and K=2 for the final configuration (see Figure 7) to maintain better alignment with the binary classification labels and preserve additional data variability (23 components instead of 19). The selected configuration maintained excellent interpretability and clustering stability while achieving high classification accuracy without significant deterioration of clustering performance. The unsupervised method maintained its ability to work within the established classification system instead of creating new label categories.
Table 4.
Sensitivity analysis of K-Means clustering (K = 2, 3, 4) applied to PCA-transformed feature spaces with varying explained variance thresholds (90%, 95%, 99%).
Table 4.
Sensitivity analysis of K-Means clustering (K = 2, 3, 4) applied to PCA-transformed feature spaces with varying explained variance thresholds (90%, 95%, 99%).
| PCA Variance (%) | # Components | K=2 (Silh / DB) | K=3 (Silh / DB) | K=4 (Silh / DB) |
|---|---|---|---|---|
| 90% | 19 | 0.2921 / 1.7888 | 0.3046 / 1.5290 | 0.1290 / 2.0189 |
| 95% | 23 | 0.2796 / 1.8457 | 0.2907 / 1.5848 | 0.1201 / 2.1135 |
| 99% | 28 | 0.2797 / 1.9096 | 0.2850 / 1.6354 | 0.1140 / 2.1650 |
| Silh = Silhouette Score (higher is better); DB = Davies-Bouldin Index (lower is better) | ||||
The PCA analysis reduced our phishing website data to 95% of its original information before K-Means clustering produced two clusters (k=2). The clustering method failed to separate phishing websites from legitimate websites. The two clusters (Cluster 0 and Cluster 1) contained nearly equal proportions of phishing and legitimate websites, which suggests the clusters formed from fine-grained structural patterns instead of a clear phishing-legitimate distinction. The data distribution showed Cluster 0 contained 83% of the total samples (2,752) while Cluster 1 contained 17% of the samples (565). The websites demonstrate different patterns of operation. The performance of our classifier showed different results when it processed data from these two unsupervised clusters: Cluster 0 (The Ambiguous Group). The majority of incorrect predictions originated from this extensive cluster. The model achieved 96.8% accuracy but produced higher rates of false positive and false negative errors (FPR: 4.24% and FNR: 2.42%). The cluster contains websites that display strong similarities between phishing and legitimate characteristics.
The smaller cluster of websites proved simple to identify because it achieved 98.8% accuracy with minimal false positive and false negative errors (1.23% and 1.25%). The websites in this group demonstrate distinct behavioral patterns. The data present an organized pattern, but Cluster 1 stands out as the only cluster which can be easily distinguished from others. The classifier achieves high accuracy but needs supervised training to identify the difficult-to-distinguish instances in cluster 0.
4.3. Performance of Base Models Using Only Website Behavioral Features
The main models including Random Forest and XGBoost and Gradient Boosting and Logistic Regression achieved 50% accuracy in phishing website detection through behavioral web feature training (on_mouseover, popUpWindow, Iframe, and RightClick). The models achieved accuracy rates that exceeded random chance by a small margin at 50%. The macro F1-score which represents balanced performance across all labels reached 0. The models demonstrated strong ability to detect phishing sites through their high recall values of 0.94 for Random Forest and XGBoost and GBC and 0.93 for Logistic Regression. The models displayed a low recall rate of 0.09 for legitimate sites but achieved high recall rates of 0.94 for phishing sites across all models. The results confirm previous research which demonstrated behavioral features alone cannot effectively identify phishing websites from legitimate ones.
The warning signals from behavioral features do not provide enough information to make accurate distinctions between phishing and legitimate websites. The findings support deception and trust theories because users can identify suspicious behavior through mouse-over redirects and disabled right-clicks, but these actions also occur on legitimate websites. Behavioral indicators function best as additional warning indicators, which need additional information to make accurate distinctions. The combination of behavioral indicators with stronger structural and domain and content-based indicators produces better results. The use of behavioral cues as standalone indicators for high-confidence classification produces insufficient results. The integrated modeling approach which uses ensemble classifiers to combine behavioral features with traditional features represents the findings from this study. The hybrid approach achieves better results than previous methods while solving the problems that were discovered in this research.
4.4. Performance of Base Models with All Website Features
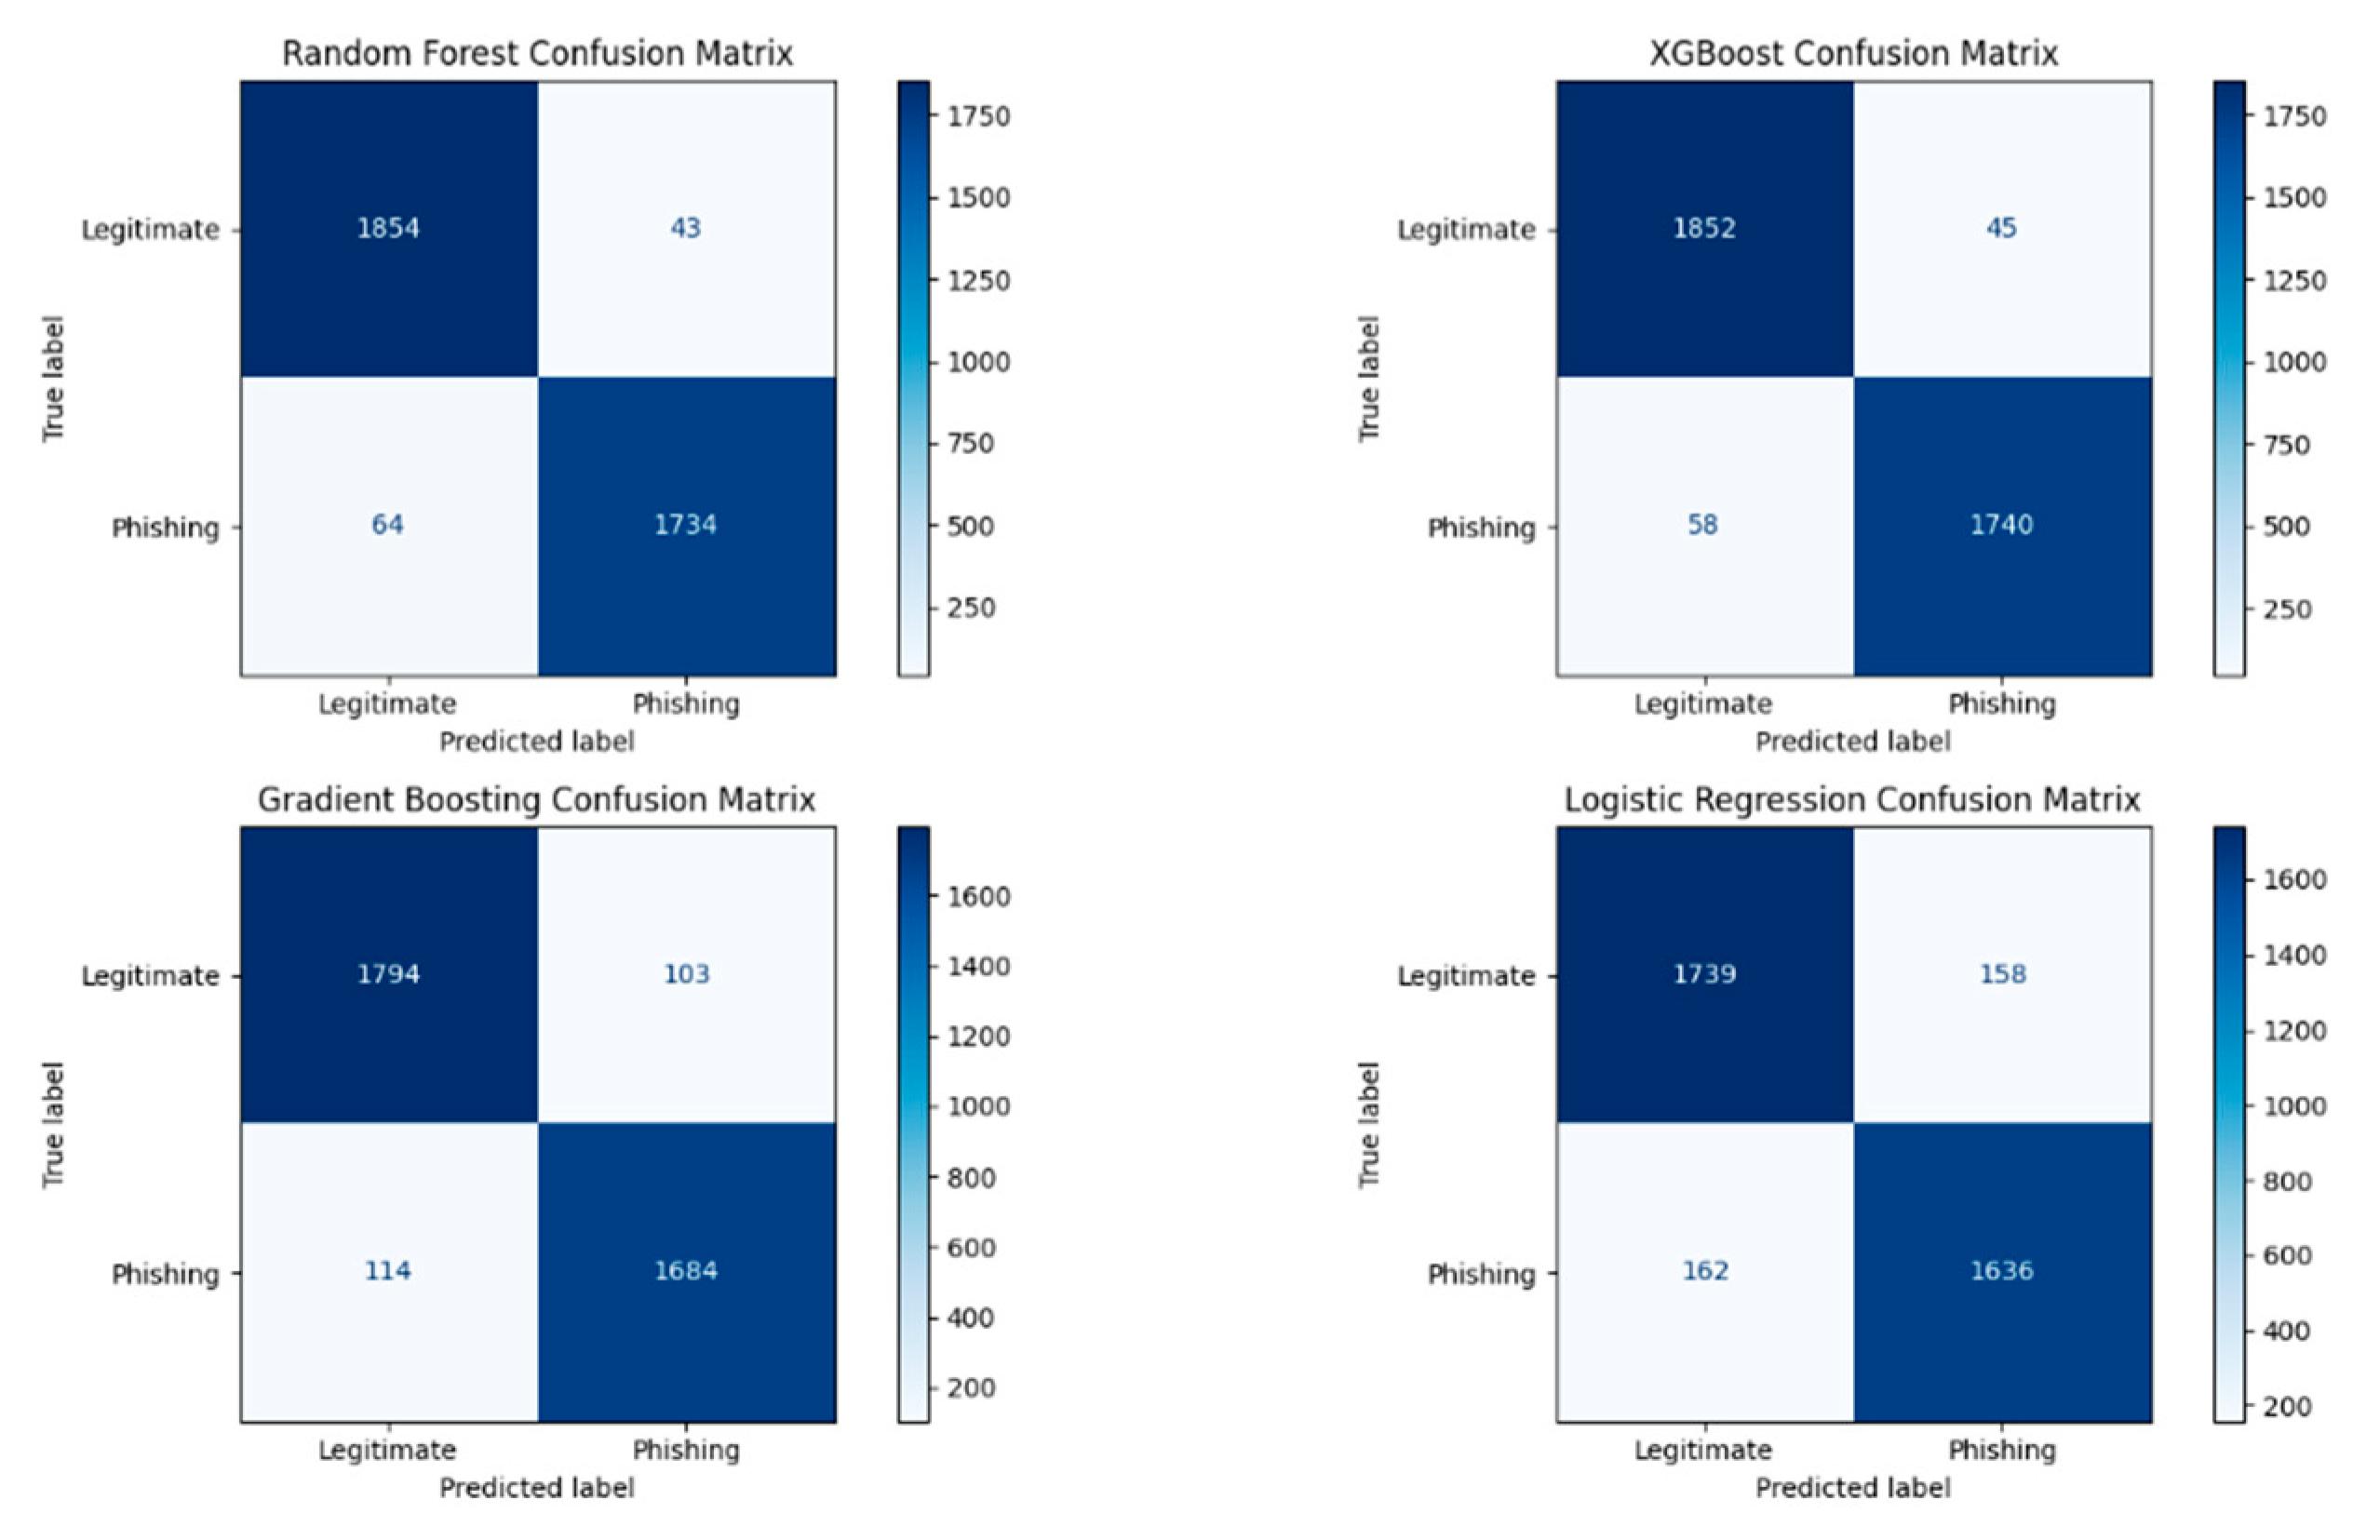
The performance metrics from Figure 9 show how the baseline and voting ensemble models operate with their combined website features which include behavior and structure and domain and traffic information. We created a voting ensemble classifier to determine the advantages of model combination. The results from Figure 9 demonstrate that all models achieve better performance than when using behavioral features alone, as shown in Figure 8. The random forest and XGBoost classifiers produced the best results among all models with 97% prediction accuracy. The two algorithms achieved perfect precision and recall values (≥ 0.96) for both phishing and legitimate website identification, which makes them suitable for real-world phishing site detection applications. The gradient boosting classifier achieved 94% accuracy while logistic regression reached 91% accuracy. The results show that logistic regression performs worse than other models because its basic linear decision-making approach fails to handle the complex relationships between features. Figure 10 shows confusion matrix for the base models trained with full website features.
The voting ensemble achieved 96% overall accuracy through its ability to detect 98% of legitimate sites and 98% of phishing samples. The model shows equal ability to predict both phishing and legitimate websites. The ensemble model achieves a macro F1-score of 0.96 because model combination improves performance by compensating for individual model weaknesses. The integration of different feature types including behavioral and structural and domain indicators leads to better phishing threat understanding. The successful performance of our ensemble and tree-based models demonstrates that complex decision-making processes and feature relationships play a vital role in critical tasks, including phishing detection. The experimental results demonstrate that operational environments can successfully implement ensemble-based detection systems because these systems provide accurate results with explainable output and balanced class performance.
Figure 8.
Comparative performance analysis of base classifiers (Random Forest, XGBoost, Gradient Boosting Classifier, and Logistic Regression) trained exclusively on behavioral features.
Figure 8.
Comparative performance analysis of base classifiers (Random Forest, XGBoost, Gradient Boosting Classifier, and Logistic Regression) trained exclusively on behavioral features.
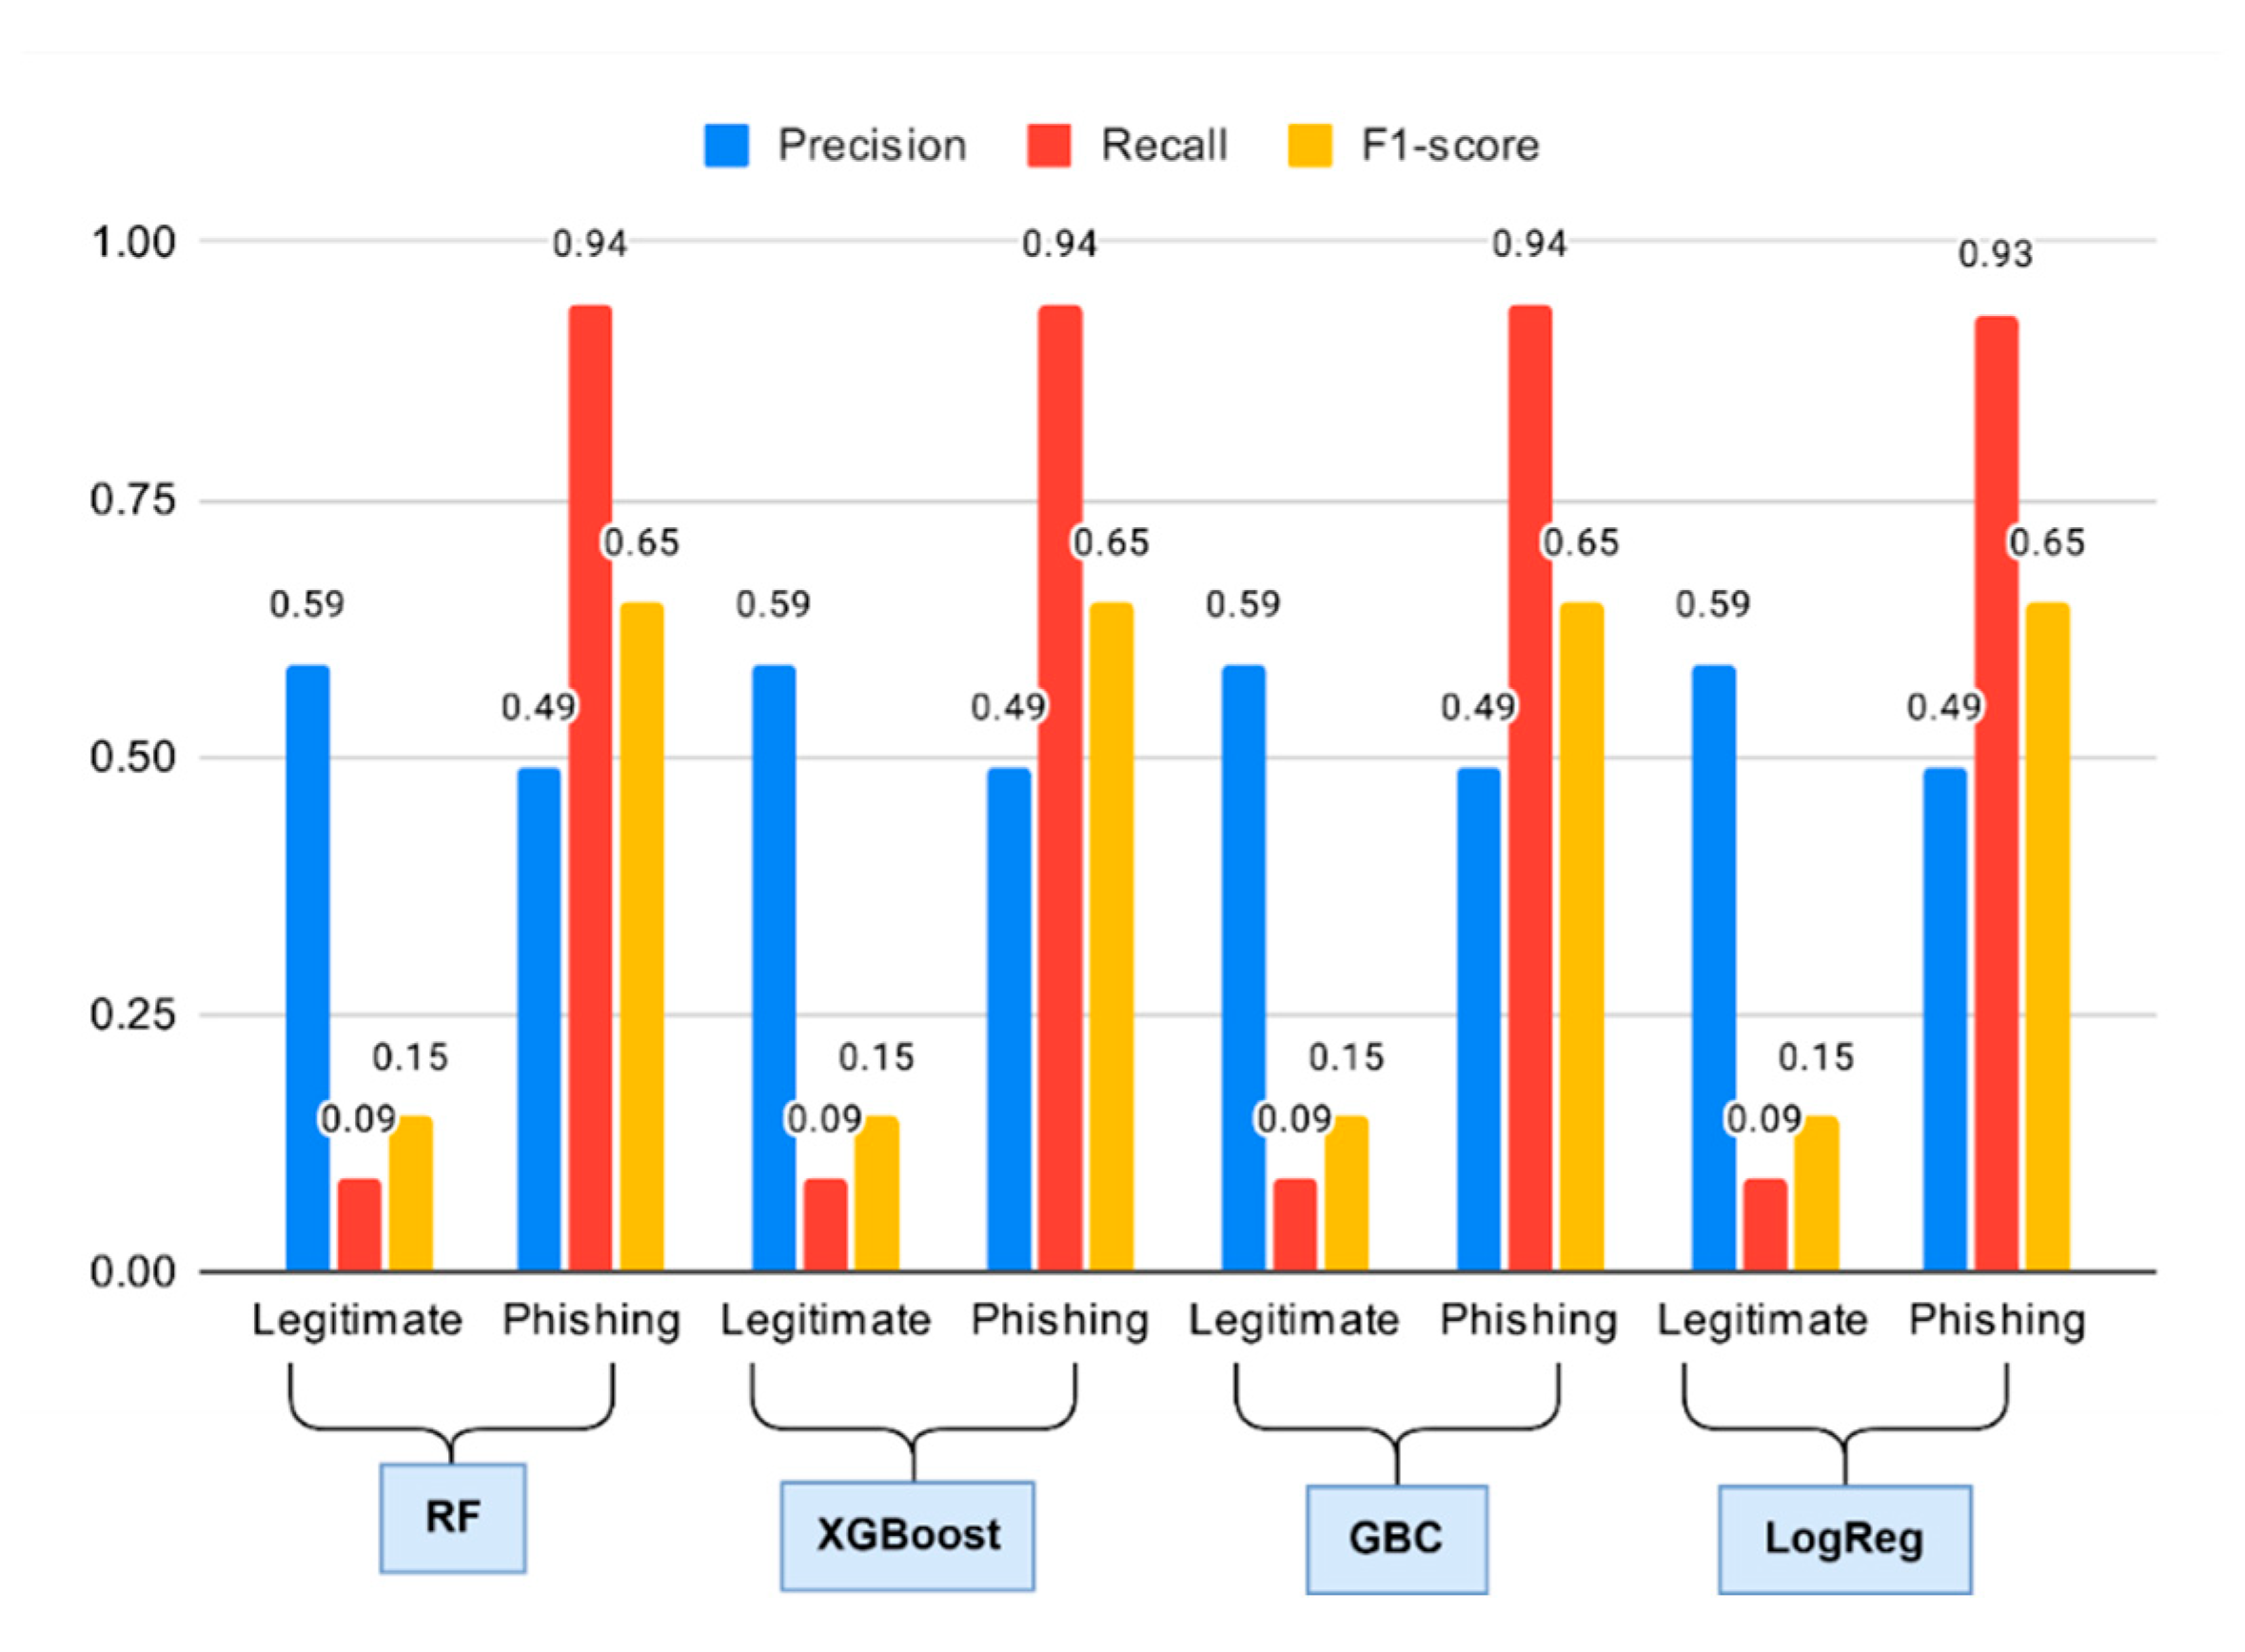
Figure 9.
A comparison of how different base classifiers (Random Forest, XGBoost, Gradient Boosting Classifier, and Logistic Regression) and a voting ensemble model perform using all website features.
Figure 9.
A comparison of how different base classifiers (Random Forest, XGBoost, Gradient Boosting Classifier, and Logistic Regression) and a voting ensemble model perform using all website features.
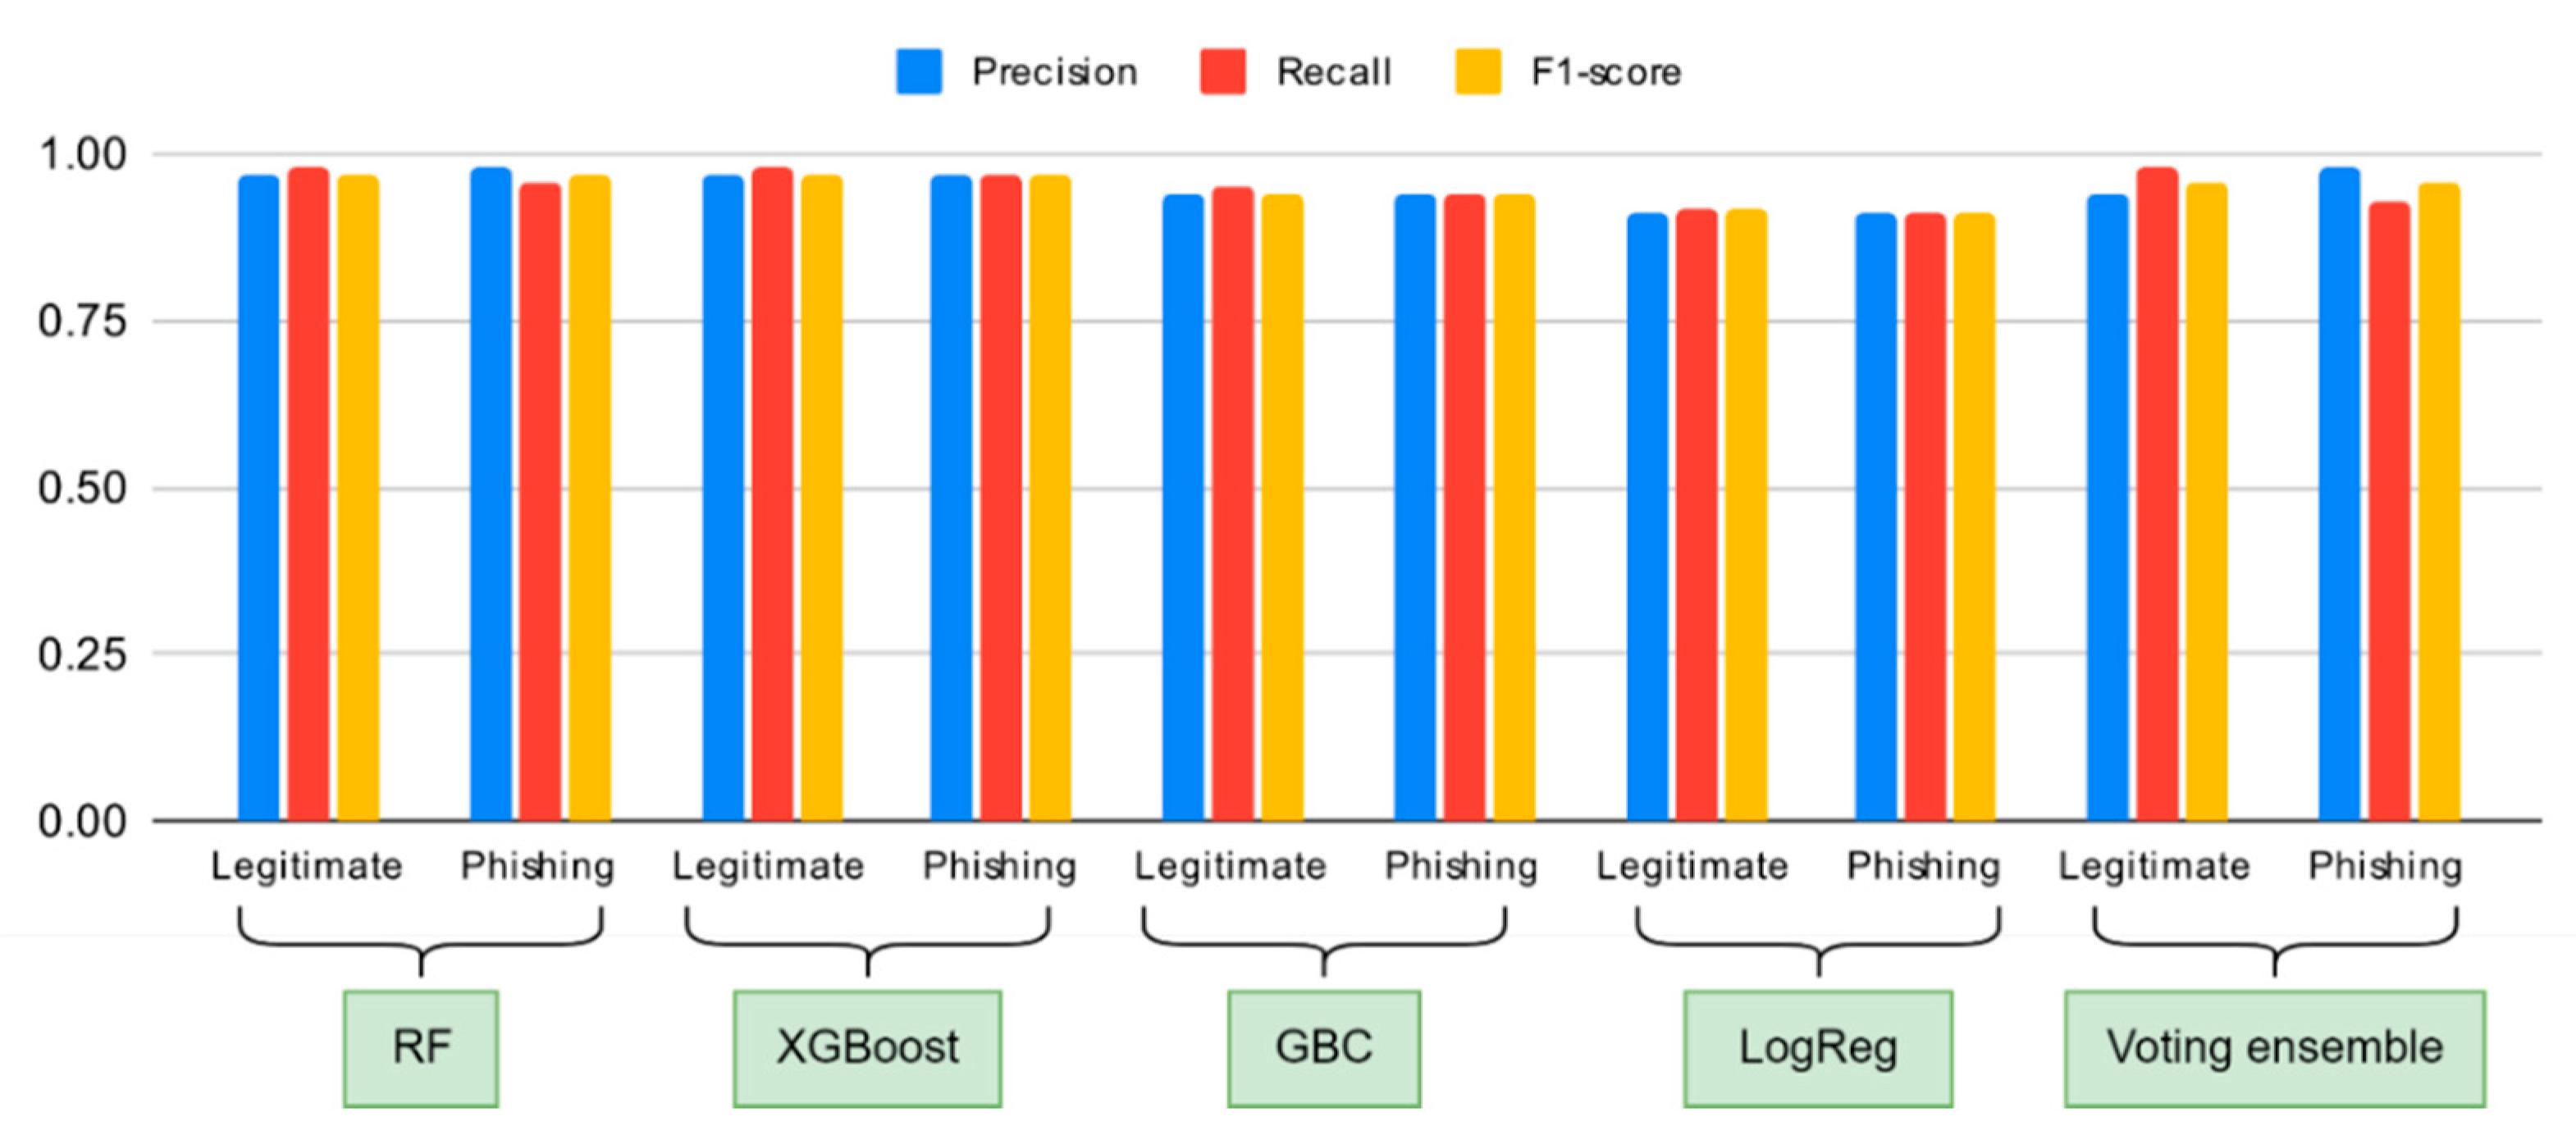
Figure 10.
Confusion matrices showing the classification performance of base models (Random Forest, XGBoost, Gradient Boosting Classifier, and Logistic Regression) when trained on the complete set of website features.
Figure 10.
Confusion matrices showing the classification performance of base models (Random Forest, XGBoost, Gradient Boosting Classifier, and Logistic Regression) when trained on the complete set of website features.
Model Performance Using Only Structural Features
The evaluation process required us to train classifier models using structural indicators, which included URL-based and domain-related features. The features used in this analysis included ‘having_IP_Address’, ‘URL_Length’, ‘Shortening_Service’, ‘having_At_Symbol’, ‘double_slash_redirecting’, ‘Prefix_Suffix’, ‘having_Sub_Domain’, ‘SSLfinal_State’, ‘Domain_registeration_length’, ‘age_of_domain’, and ‘DNSRecord’. The Random Forest and XGBoost models achieved 91% accuracy while producing macro-averaged F1-scores of 0.91 for both phishing and legitimate website classification. The Gradient Boosting classifier demonstrated a preference for identifying legitimate websites through its 90% accuracy rate and F1-score of 0.90. The linear modeling approach of Logistic Regression resulted in poor performance because it failed to handle complex feature relationships, which led to 88% accuracy and a macro F1-score of 0.88.
The performance of baseline classifiers using behavioral, structural, and combined website features for phishing detection appears in Table 5. The models trained on structural and behavioral features together achieved their highest performance, with 97% accuracy and macro F1-scores. The results confirm that behavioral features lack effectiveness on their own but gain importance when integrated with structural features.
4.5. Performance of Stacked Ensemble Models
Figure 11 shows the performance results of our stacking models. The two ensemble models share identical base learner settings to achieve better stability through combined classifier performance. The two models differ only in their meta-classifier selection because Model A uses logistic regression, but Model B uses a support vector classifier (SVC). The two models achieved 97% accuracy through their identical macro and weighted F1 scores (0.97). The classification results demonstrated balanced precision and recall values for all classes, which proved successful in reducing both false positive and false negative errors. The recall value for legitimate websites reached 0.98 (class 0) while phishing websites (class 1) achieved precision and recall values exceeding 0.97. The two stacking models produced identical results, which demonstrate that their meta-classifiers performed equally well in finding the best decision threshold from base learner predictions. The research demonstrates how different indicators, when combined, produce stable and reliable features for analysis.
The results demonstrate that a properly designed stacked ensemble system achieves performance levels equal to or superior to those of individual classifiers. The system provides enhanced capabilities to handle both feature noise and model bias during operation. The combination of linear logistic regression and kernel-based SVC meta-learners in architecture enhances its ability to perform well in various operational environments. Table 6 presents the training and inference times for our stack models. Model ‘A’ needed 9.87 seconds to train and 0.11 seconds to test while model ‘B’ needed 12.15 seconds for training and 0.31 seconds for testing. The models demonstrate suitable performance for near-real-time deployment in phishing detection systems when hardware factors and optimization techniques are applied.
4.6. Feature Importance and Explainability Analysis
The research used two methods to study feature effects on models through Gini-based feature importance from random forests and SHAP values. The research aimed to explain the decision-making mechanisms of the models. Figure 12 shows the random forest model feature importance plot. The three most important features for the model were SSLfinal_State and URL_of_Anchor and web_traffic. The SSL final state feature accounted for more than 30% of the total importance in the model. The model used subdomains and Links_in_tags and prefixes-suffixes as its main features because these indicators represent typical phishing threats based on domain and content information. The analysis confirmed previous results by showing behavioral indicators have limited value but still help confirm phishing signals through their supporting evidence.
The global feature importance rankings (see Figure 13) give additional interpretation through SHAP summary plots, which displayed feature influence directions and magnitudes for all samples. The beeswarm plot shows how different values of URL_of_Anchor and SSLfinal_State and other essential features affect model predictions between phishing and legitimate classes. The SHAP force plot in Figure 14 demonstrates how particular features affect model predictions for individual classification instances. The SHAP summary plot in Figure 14 shows detailed information about how particular feature values affect model prediction outcomes. The SHAP influence analysis in Figure 13 shows that URL_of_Anchor and SSLfinal_State and web_traffic features have the highest impact on model predictions because they consistently affect model performance. The SHAP plot in Figure 13 provides better model interpretability because it shows which features affect model outputs and their corresponding impact levels. The model predicts phishing when URL_of_Anchor values are high because of many external links, but SSLfinal_State with valid values leads to legitimate classification. The model uses IP address presence and prefix-suffix patterns to detect phishing attacks through their different impact levels based on their values. The model achieves high F1 scores (Table 5) because it uses meaningful structural and behavioral indicators that match domain expertise.
The SHAP force plot in Figure 14 supports the global interpretability shown in Figure 13. The XGBoost model prediction receives an individual feature influence demonstration through this plot. The force plot shows both the strength and direction that each feature applies to the model output for this particular instance. The model output shows a strong non-phishing prediction because the cumulative SHAP value creates a significant downward shift from the baseline. The model used Prefix_Suffix, URL_of_Anchor, SSLfinal_State, Links_in_tags, and web_traffic to make a legitimate classification (blue bars), with Prefix_Suffix showing the highest individual impact. The prediction moved toward phishing because Links_pointing_to_page and having_Sub_Domain applied negative forces. The legitimate indicators produced a stronger effect than the phishing indicators did. The model bases its decisions on multiple feature interactions, demonstrating that AI trustworthiness emerges from complex systems rather than relying on a single dominant variable.
4.7. Models Statistical Significance Testing Using McNemar’s Test
Figure 15 illustrates the results from McNemar’s test for Random Forest (RF) and Voting Ensemble (VE) models. The research evaluates model performance through error analysis to determine its distinct prediction patterns. The models produced identical results for 3,181 out of 3,317 test samples, while both models incorrectly classified 70 samples. The models produced different results in 41 cases where RF performed better than VE and in 25 cases where VE outperformed RF. The McNemar chi-square statistic reached χ² = 3.41 while the p-value reached 0.0648 which exceeds 0.05 thus indicating no statistically significant difference between their error patterns. The models show equivalent performance in their disagreements according to previous accuracy and F1 score results. The evaluation reveals that each model excels at specific tasks, yet neither model demonstrates superior performance in difficult prediction scenarios. The models show identical decision patterns because their disagreement rates remain small and statistically insignificant.
4.8. Comparative Analysis with Related Studies
Table 7 presents a comparative analysis of our student results with existing literature on phishing detection. The research studies [13,53,54], and [55] used the same dataset source, which matches our study, but [44,45,48], and [49] used different datasets. The research results from these studies appear for reference purposes, although they do not receive direct evaluation. Our model predicts phishing sites by uniting user conduct information with website organization elements, which results in a 97% F1-score and accuracy. The detection results from our study align with previous research findings: Mohammad et al. [53] achieved 96.07% accuracy with functional tree detection, and Omari [55] reached 96% F1-score with deep neural networks. The two main distinctions of our method include behavioral feature integration and SHAP-based explainability implementation. The combination of structural and behavioral features through our approach enables better model decision interpretation while producing effective phishing detection systems that remain transparent and adaptable.
4.9. Theoretical Implications
The research combined behavioral web indicators with deception detection principles, human-computer interaction concepts, trust models, and signal detection theory. The study evaluated how interface elements, including pop-ups and mouse-over links, and disabled right-click functions, together with structural signals and user focus areas, would improve phishing detection capabilities. The research used interpersonal deception theory [14] to show that phishing sites use multiple behavioral layers to conceal their actual intentions. The research findings demonstrate that these indicators boost detection rates when used with powerful signals, yet they fail to produce reliable results independently (Section 4.3). The research indicates that deception appears through small behaviors that depend on specific situations. The implemented manipulations violate the established HCI heuristics, which users depend on for interface navigation [50]. The research confirms that users recognize unusual design elements that affect their trust level toward interfaces [15,16]. The behavioral feature importance rankings in Figure 12 and their effects on local predictions in Figure 13 suggest a relationship between machine-generated signals and user trust evaluations. The ensemble models achieved 97% accuracy, which demonstrates how signal detection theory [52] enables weak behavioral indicators to become valuable diagnostic tools when combined with strong structural signals. The research establishes a basic connection between HCI principles and machine learning by converting interface rule violations into measurable data points. The research advances current initiatives to merge usability science with explainable AI [33].
5. Limitations, Conclusions, and Future Work
5.1. Limitations and Conclusions
The research investigated which website elements affect phishing website identification and their connection to established detection approaches, including URL structures, domain characteristics, and traffic metrics. Our findings show that phishing websites employ deceptive user interface behaviors through mouse-over actions, pop-up events, hidden iframes, and right-click restrictions, which support traditional structural indicators (RQ1). The unsupervised clustering analysis demonstrates that uniting behavioral data with structural elements results in more distinct and meaningful campaign groupings than using technical indicators alone (RQ2). The supervised modeling results show that behavioral features improve classification accuracy when combined with structural indicators 97% for the hybrid stacked ensemble, but do not enhance results when used alone (RQ3). The theoretical assessment shows that interface modifications generate particular warning indicators that match deception theory and HCI heuristics and signal detection principles to develop explainable intrusion detection systems (RQ4). The research produced positive findings, but multiple ongoing challenges continue to affect the study. The training dataset lacked sufficient data on modern phishing methods and websites that use different languages.
The system needs periodic model updates, such as retraining or fine-tuning, to operate in real time. The model evaluation was conducted in laboratory settings rather than operational environments, and the researchers failed to conduct a memory analysis of the ensemble system. Future detection systems need to develop methods that counter adaptive attackers’ evolving evasion techniques while performing adversarial training to improve robustness. The system generates privacy issues because it monitors all user activities through its mouse-over tracking and right-click blocking functionality. Security deployment needs users to give direct permission for data collection while protecting user privacy through full data anonymization and restricted access to information. Organizations can achieve security excellence through ethical standards by developing privacy protection systems that operate at their highest security level.
5.2. Future Work
The research shows promising results, but future studies will use dynamic data streams, including mouse movements, hover times, and scrolling behavior, to identify real-time user deception patterns. The following research will test model scalability through performance assessments on different datasets and real-time feeds, including newly discovered phishing attacks. The clustering models will achieve better results when researchers incorporate domain registration information, threat data, and hosting location details to detect the reuse of phishing tools and attacker network connections. Our research team will create hybrid models that use user feedback data, including hesitation clicks and cursor movement patterns, to develop individualized detection systems that minimize false alerts in adaptive environments. The research team will test the hybrid architecture’s runtime performance and resource usage before deploying it as a browser or edge device application.
The SHAP analysis provides useful results, but researchers should investigate additional XAI methods, such as LIME and counterfactual explanations, to further enhance model explainability and user confidence. The validation process for clustering results becomes more effective when researchers use datasets that include threat intelligence annotations and campaign metadata. The current research uses centralized learning with structured features, but FL is a growing approach for secure distributed model training. The integration of FL with explainable phishing detection systems shows great potential for future research because it supports secure user data sharing in decentralized systems. The research demonstrates that behavioral patterns play a crucial role in developing effective phishing detection systems. The combination of behavioral indicators with structural data, ensemble techniques, and XAI produces better cybersecurity systems that adapt to changing situations and maintain user trust.
Author Contributions
I.K.N.: Conceptualization, Methodology, Software, Validation, Formal Analysis, Investigation, Writing – Original Draft, and Writing – Review & Editing. M.O.: Supervision and Writing – Review & Editing. L.C.: Validation and Writing – Review & Editing. All authors contributed to the analysis and interpretation of the data, reviewed the manuscript critically for important intellectual content, approved the final version to be published, and agreed to be accountable for all aspects of the work.
Funding
This research received no external funding.
Data Availability Statement
: All data used in this study are publicly available and can be accessed at: https://archive.ics.uci.edu/dataset/327/phishing+websites.
Acknowledgments
Not applicable
Conflicts of Interest
The authors declare that there are no conflicts of interest regarding the publication of this paper.
Appendix A
Appendix A.1. Computational Steps for Stacked Ensemble Models A and B
Algorithm 1: Training Procedure for Stacked Ensemble Models A and B
Input:
- Training dataset D = {}
- Base models: Random
- Meta-learner A: Logistic Regression
- Meta-learner B: Support Vector Classifier (SVC)
Output:
- Trained
1. Initialize base models:
2. Create Stacking Ensemble A:
3. Fit StackingClassifier_A on
4. Create Stacking Ensemble B:
5. Fit
6. Return trained
Appendix A.2: Stacked Ensemble Models A and B Computational Complexity
| Component | Model(s) | Complexity |
| Base Learners | RF | |
| XGB, GB | ||
| LR | ||
| Meta Learner (Model A) | Logistic Regression | |
| Meta Learner (Model B) | SVC (probability) | |
| Model A is more efficient for large datasets due to the linear meta-learner. Model B might become computationally expensive at the meta-level if the dataset is large, due to the quadratic complexity of SVC with probability estimation. | ||
Appendix B
Appendix B.1: Hyperparameter Search Space for Grid Search Optimization
| Model | Hyperparameter | Parameter Range (∈) |
| Random Forest (RF) | Number of Estimators (n_estimators) | {50, 100, 200} |
| Maximum Depth (max_depth) | {6, 8, 10} | |
| Gradient Boosting Classifier (GBC) | Number of Estimators (n_estimators) | {50, 100, 200} |
| Learning Rate (learning_rate) | {0.05, 0.1, 0.2} | |
| Maximum Depth (max_depth) | {3, 5, 7} | |
| LightGBM (LGBM) | Number of Leaves (num_leaves) | {31, 63, 127} |
| Support Vector Machine (SVM) | Regularization Parameter (C) | {0.1, 1, 10} |
| Kernel Type (kernel) | {rbf, poly} |
Appendix B.2: Cross-Validated Grid Search Results for Stacking Models A and B
| Model | Accuracy | Std. Dev. | Meta-Learner | C Value | learning_rate (GB) | n_estimators (RF, XGB) |
| Model A | 0.973 | ±0.00 | Logistic Regression | 0.1 | 0.1 | 100 |
| Model A | 0.973 | ±0.00 | Logistic Regression | 1.0 | 0.1 | 100 |
| Model A | 0.972 | ±0.00 | Logistic Regression | 10.0 | 0.1 | 100 |
| Model B | 0.973 | ±0.00 | SVC (probability=True) | 0.1 | 0.1 | 100 |
| Model B | 0.970 | ±0.00 | Logistic Regression | 1.0 | 0.1 | 100 |
Appendix C: K-Means clustering results (K = 3 and K = 4) on PCA-reduced feature spaces with 90%, 95%, and 99% explained variance thresholds.
References
- Abhishek Gautam, Aditya Prakash, and Gariyas Kaushal, “Artificial Intelligence in Cybersecurity,” Int. J. Adv. Res. Sci. Commun. Technol., pp. 607–610, Apr. 2024. [CrossRef]
- Anti-Phishing Working Group (APWG), “Phishing Activity Trends Report, Q1 2023,” 2023. https://apwg.org/membership/.
- L. Tang and Q. H. Mahmoud, “A Survey of Machine Learning-Based Solutions for Phishing Website Detection,” Machine Learning and Knowledge Extraction, vol. 3, no. 3. pp. 672–694, 2021. [CrossRef]
- Taha, “Intelligent ensemble learning approach for phishing website detection based on weighted soft voting,” Mathematics, vol. 9, no. 21, 2021. [CrossRef]
- N. Abdelhamid, A. Ayesh, and F. Thabtah, “Phishing detection based Associative Classification data mining,” Expert Syst. Appl., vol. 41, no. 13, pp. 5948–5959, Oct. 2014. [CrossRef]
- H. Salem, S. M. Azzam, O. E. Emam, and A. A. Abohany, Advancing cybersecurity: a comprehensive review of AI-driven detection techniques, vol. 11, no. 1. Springer International Publishing, 2024.
- Yan, X. Han, Y. Zhu, D. Du, Z. Lu, and Y. Liu, “Phishing behavior detection on different blockchains via adversarial domain adaptation,” Cybersecurity, vol. 7, no. 1, 2024. [CrossRef]
- Alhuzali, A. Alloqmani, M. Aljabri, and F. Alharbi, “In-Depth Analysis of Phishing Email Detection: Evaluating the Performance of Machine Learning and Deep Learning Models Across Multiple Datasets,” Appl. Sci., vol. 15, no. 6, pp. 1–30, 2025. [CrossRef]
- K. Dutta, “Detecting phishing websites using machine learning technique,” PLoS One, vol. 16, no. 10 October, pp. 1–17, 2021. [CrossRef]
- K. Adane and B. Beyene, “Machine Learning and Deep Learning Based Phishing Websites Detection: The Current Gaps And Next Directions,” Rev. Comput. Eng. Res., vol. 9, no. 1, pp. 13–29, 2022. [CrossRef]
- R. Zieni, L. Massari, and M. C. Calzarossa, “Phishing or Not Phishing? A Survey on the Detection of Phishing Websites,” IEEE Access, vol. 11, no. January, pp. 18499–18519, 2023. [CrossRef]
- S. Kavya and D. Sumathi, “Staying ahead of phishers: a review of recent advances and emerging methodologies in phishing detection,” Artif. Intell. Rev., vol. 58, no. 2, 2025. [CrossRef]
- M. A. Taha, H. D. A. Jabar, and W. K. Mohammed, “A Machine Learning Algorithms for Detecting Phishing Websites: A Comparative Study,” Iraqi J. Comput. Sci. Math., vol. 5, no. 3, pp. 275–286, 2024. [CrossRef]
- D. B. Buller and J. K. Burgoon, “Interpersonal Deception Theory,” Commun. Theory, vol. 6, no. 3, pp. 203–242, Aug. 1996. [CrossRef]
- J. Fogg, “Prominence-interpretation theory: Explaining how people assess credibility online,” Conf. Hum. Factors Comput. Syst. - Proc., pp. 722–723, 2003. [CrossRef]
- J. Fogg, C. Soohoo, D. R. Danielson, L. Marable, J. Stanford, and E. R. Tauber, “How do users evaluate the credibility of Web sites?: A study with over 2,500 participants,” Proc. 2003 Conf. Des. User Exp. DUX ’03, pp. 1–15, 2003. [CrossRef]
- W. Li, S. Manickam, Y. W. Chong, W. Leng, and P. Nanda, “A State-of-the-art Review on Phishing Website Detection Techniques,” IEEE Access, vol. 12, no. November, pp. 187976–188012, 2024. [CrossRef]
- Hossain, L. Khin, and G. Wison, “An Intelligent Phishing Detection and Protection Scheme using a fusion of Images, Frames and Text,” 2020, [Online]. Available: https://www.researchgate.net/publication/353482275_An_Intelligent_Phishing_Detection_and_Protection_Scheme_using_a_fusion_of_Images_Frames_and_Text.
- K. Jain and B. B. Gupta, “A machine learning based approach for phishing detection using hyperlinks information,” J. Ambient Intell. Humaniz. Comput., vol. 10, no. 5, pp. 2015–2028, May 2019. [CrossRef]
- Safi and S. Singh, “A systematic literature review on phishing website detection techniques,” J. King Saud Univ. - Comput. Inf. Sci., vol. 35, no. 2, 2023. [CrossRef]
- Y. Li, Z. Yang, X. Chen, H. Yuan, and W. Liu, “A stacking model using URL and HTML features for phishing webpage detection,” Futur. Gener. Comput. Syst., vol. 94, pp. 27–39, May 2019. [CrossRef]
- Karim, M. Shahroz, K. Mustofa, S. B. Belhaouari, and S. R. K. Joga, “Phishing Detection System Through Hybrid Machine Learning Based on URL,” IEEE Access, vol. 11, pp. 36805–36822, 2023. [CrossRef]
- S. Hamadouche, O. Boudraa, and M. Gasmi, “Combining Lexical, Host, and Content-based features for Phishing Websites detection using Machine Learning Models,” ICST Trans. Scalable Inf. Syst., vol. 11, no. 6, pp. 1–15, 2024. [CrossRef]
- Joshi, L. Lloyd, P. Westin, and S. Seethapathy, “Using Lexical Features for Malicious URL Detection -- A Machine Learning Approach,” Oct. 2019, [Online]. Available: http://arxiv.org/abs/1910.06277.
- J. Hong, T. Kim, J. Liu, N. Park, and S.-W. Kim, “Phishing URL Detection with Lexical Features and Blacklisted Domains,” in Adaptive Autonomous Secure Cyber Systems, Cham: Springer International Publishing, 2020, pp. 253–267.
- Q. E. ul Haq, M. H. Faheem, and I. Ahmad, “Detecting Phishing URLs Based on a Deep Learning Approach to Prevent Cyber-Attacks,” Appl. Sci., vol. 14, no. 22, 2024. [CrossRef]
- P. Prakash, M. Kumar, R. R. Kompella, and M. Gupta, “PhishNet: Predictive Blacklisting to Detect Phishing Attacks,” in 2010 Proceedings IEEE INFOCOM, Mar. 2010, pp. 1–5. [CrossRef]
- F. Rashid, B. Doyle, S. C. Han, and S. Seneviratne, “Phishing URL detection generalisation using Unsupervised Domain Adaptation,” Comput. Networks, vol. 245, no. April, p. 110398, 2024. [CrossRef]
- Catal, G. Giray, B. Tekinerdogan, S. Kumar, and S. Shukla, Applications of deep learning for phishing detection: a systematic literature review, vol. 64, no. 6. Springer London, 2022.
- M. Al-Sarem et al., “An optimized stacking ensemble model for phishing websites detection,” Electron., vol. 10, no. 11, 2021. [CrossRef]
- N. Mohamed, H. Taherdoost, and M. Madanchian, “Enhancing Spear Phishing Defense with AI: A Comprehensive Review and Future Directions,” ICST Trans. Scalable Inf. Syst., vol. 11, Dec. 2024. [CrossRef]
- M. C. Calzarossa, P. Giudici, and R. Zieni, “An assessment framework for explainable AI with applications to cybersecurity,” Artif. Intell. Rev., vol. 58, no. 5, pp. 1–19, 2025. [CrossRef]
- Molnar, Interpretable Machine Learning: A Guide for Making Black Box Models Explainable, 2nd ed. Independently published, 2020. [Online]. Available: https://books.google.com/books/about/Interpretable_Machine_Learning.html?id=jBm3DwAAQBAJ.
- G. Smith “Top Phishing Statistics for 2025: Latest Figures and Trends,” 2025. https://www.stationx.net/phishing-statistics/.
- Hoxhunt, “Phishing Trends Report (Updated for 2025),” 2025. https://hoxhunt.com/guide/phishing-trends-report?
- Egress, “Must-know phishing statistics for 2025,” 2024. https://www.egress.com/blog/security-and-email-security/must-know-phishing-statistics-for-2025?
- National University, “101 Cybersecurity Statistics and Trends for 2025,” 2025. https://www.nu.edu/blog/cybersecurity-statistics/?
- T. Bhattacharya, S. Veeramalla, and V. Tanniru, “A Survey on Retrieving Confidential Data Using Phishing Attack,” in 2023 Congress in Computer Science, Computer Engineering, & Applied Computing (CSCE), Jul. 2023, pp. 2528–2535. [CrossRef]
- S. Alhashmi, A. Alneyadi, M. Alshehhi, and H. Lamaazi, “Mobile and Web Applications Clones: A Comprehensive Study,” in 2023 International Wireless Communications and Mobile Computing (IWCMC), Jun. 2023, pp. 464–469. [CrossRef]
- Akanbi, I. S. Amiri, and E. Fazeldehkordi, A Machine-Learning Approach to Phishing Detection and Defense. 2014.
- Basit, M. Zafar, X. Liu, A. R. Javed, Z. Jalil, and K. Kifayat, “A comprehensive survey of AI-enabled phishing attacks detection techniques,” Telecommun. Syst., vol. 76, no. 1, pp. 139–154, Jan. 2021. [CrossRef]
- Y. Wang, W. Ma, H. Xu, Y. Liu, and P. Yin, “A Lightweight Multi-View Learning Approach for Phishing Attack Detection Using Transformer with Mixture of Experts,” Appl. Sci., vol. 13, no. 13, Jul. 2023. [CrossRef]
- J. Zhou, H. Cui, X. Li, W. Yang, and X. Wu, “A Novel Phishing Website Detection Model Based on LightGBM and Domain Name Features,” Symmetry (Basel)., vol. 15, no. 1, 2023. [CrossRef]
- M. A. Adebowale, K. T. Lwin, and M. A. Hossain, “Intelligent phishing detection scheme using deep learning algorithms,” J. Enterp. Inf. Manag., vol. 36, no. 3, pp. 747–766, Apr. 2023. [CrossRef]
- P. Dhanavanthini and S. S. Chakkravarthy, “Phish-armour: phishing detection using deep recurrent neural networks,” Soft Comput., Mar. 2023. [CrossRef]
- M. C. Calzarossa, P. Giudici, and R. Zieni, “How robust are ensemble machine learning explanations?,” Neurocomputing, vol. 630, p. 129686, May 2025. [CrossRef]
- Lim, R. Huerta, A. Sotelo, A. Quintela, and P. Kumar, “EXPLICATE: Enhancing Phishing Detection through Explainable AI and LLM-Powered Interpretability,” Mar. 2025, doi: /10.48550/arXiv.2503.20796.
- P. Pavan Kumar, T. Jaya, and V. Rajendran, “SI-BBA – A novel phishing website detection based on Swarm intelligence with deep learning,” Mater. Today Proc., vol. 80, pp. 3129–3139, 2023. [CrossRef]
- T. Rasymas and L. Dovydaitis, “Detection of Phishing URLs by Using Deep Learning Approach and Multiple Features Combinations,” Balt. J. Mod. Comput., vol. 8, no. 3, Sep. 2020. [CrossRef]
- N. Jakob, Usability Engineering. ACADEMIC PRESS LIMITED 24-2 8 Oval Road, London NW1 7DX, 1993.
- K. Nti and A. R. Somanathan, “A Scalable RF-XGBoost Framework for Financial Fraud Mitigation,” IEEE Trans. Comput. Soc. Syst., 2022. [CrossRef]
- M. Green and J. A. Swets, Signal Detection Theory and Psychophysics, vol. 27, no. 4. Wiley & Sons, Inc., New York, 1974.
- R. M. Mohammad, F. Thabtah, and L. McCluskey, “Predicting phishing websites based on self-structuring neural network,” Neural Comput. Appl., vol. 25, no. 2, pp. 443–458, 2014. [CrossRef]
- Omari, "Comparative Study of Machine Learning Algorithms for Phishing Website Detection," Int. J. Adv. Comput. Sci. Appl., vol. 14, no. 9, pp. 417–425, 2023. [CrossRef]
- Lakshmi, M. P. Reddy, C. Santhaiah, and U. J. Reddy, "Smart Phishing Detection in Web Pages Using Supervised Deep Learning Classification and Optimization Technique ADAM," Wirel. Pers. Commun., vol. 118, pp. 3549-3564, 2021.
- Aljofey, Q. Jiang, Q. Qu, and J.-P. Niyigena, “Graph-based phishing detection: URLGBM model driven by machine learning,” Int. J. Comput. Appl., vol. 46, no. 1, pp. 180–186, 2024. [CrossRef]
- S. S. A. Khanafer, S. S. Aljameel, A. H. Alqahtani, A. A. Alshamrani, N. H. Alqahtani, and T. Alharbi, “Adaptive phishing detection using features engineered from web page code,” Int. J. Comput. Appl., vol. 45, no. 4, pp. 546–555, 2023. [CrossRef]
Figure 1.
Classification of website features used for malicious URL detection, categorized into behavioral, URL-based, domain-specific, webpage-based, and traffic and search engine-based groups.
Figure 1.
Classification of website features used for malicious URL detection, categorized into behavioral, URL-based, domain-specific, webpage-based, and traffic and search engine-based groups.
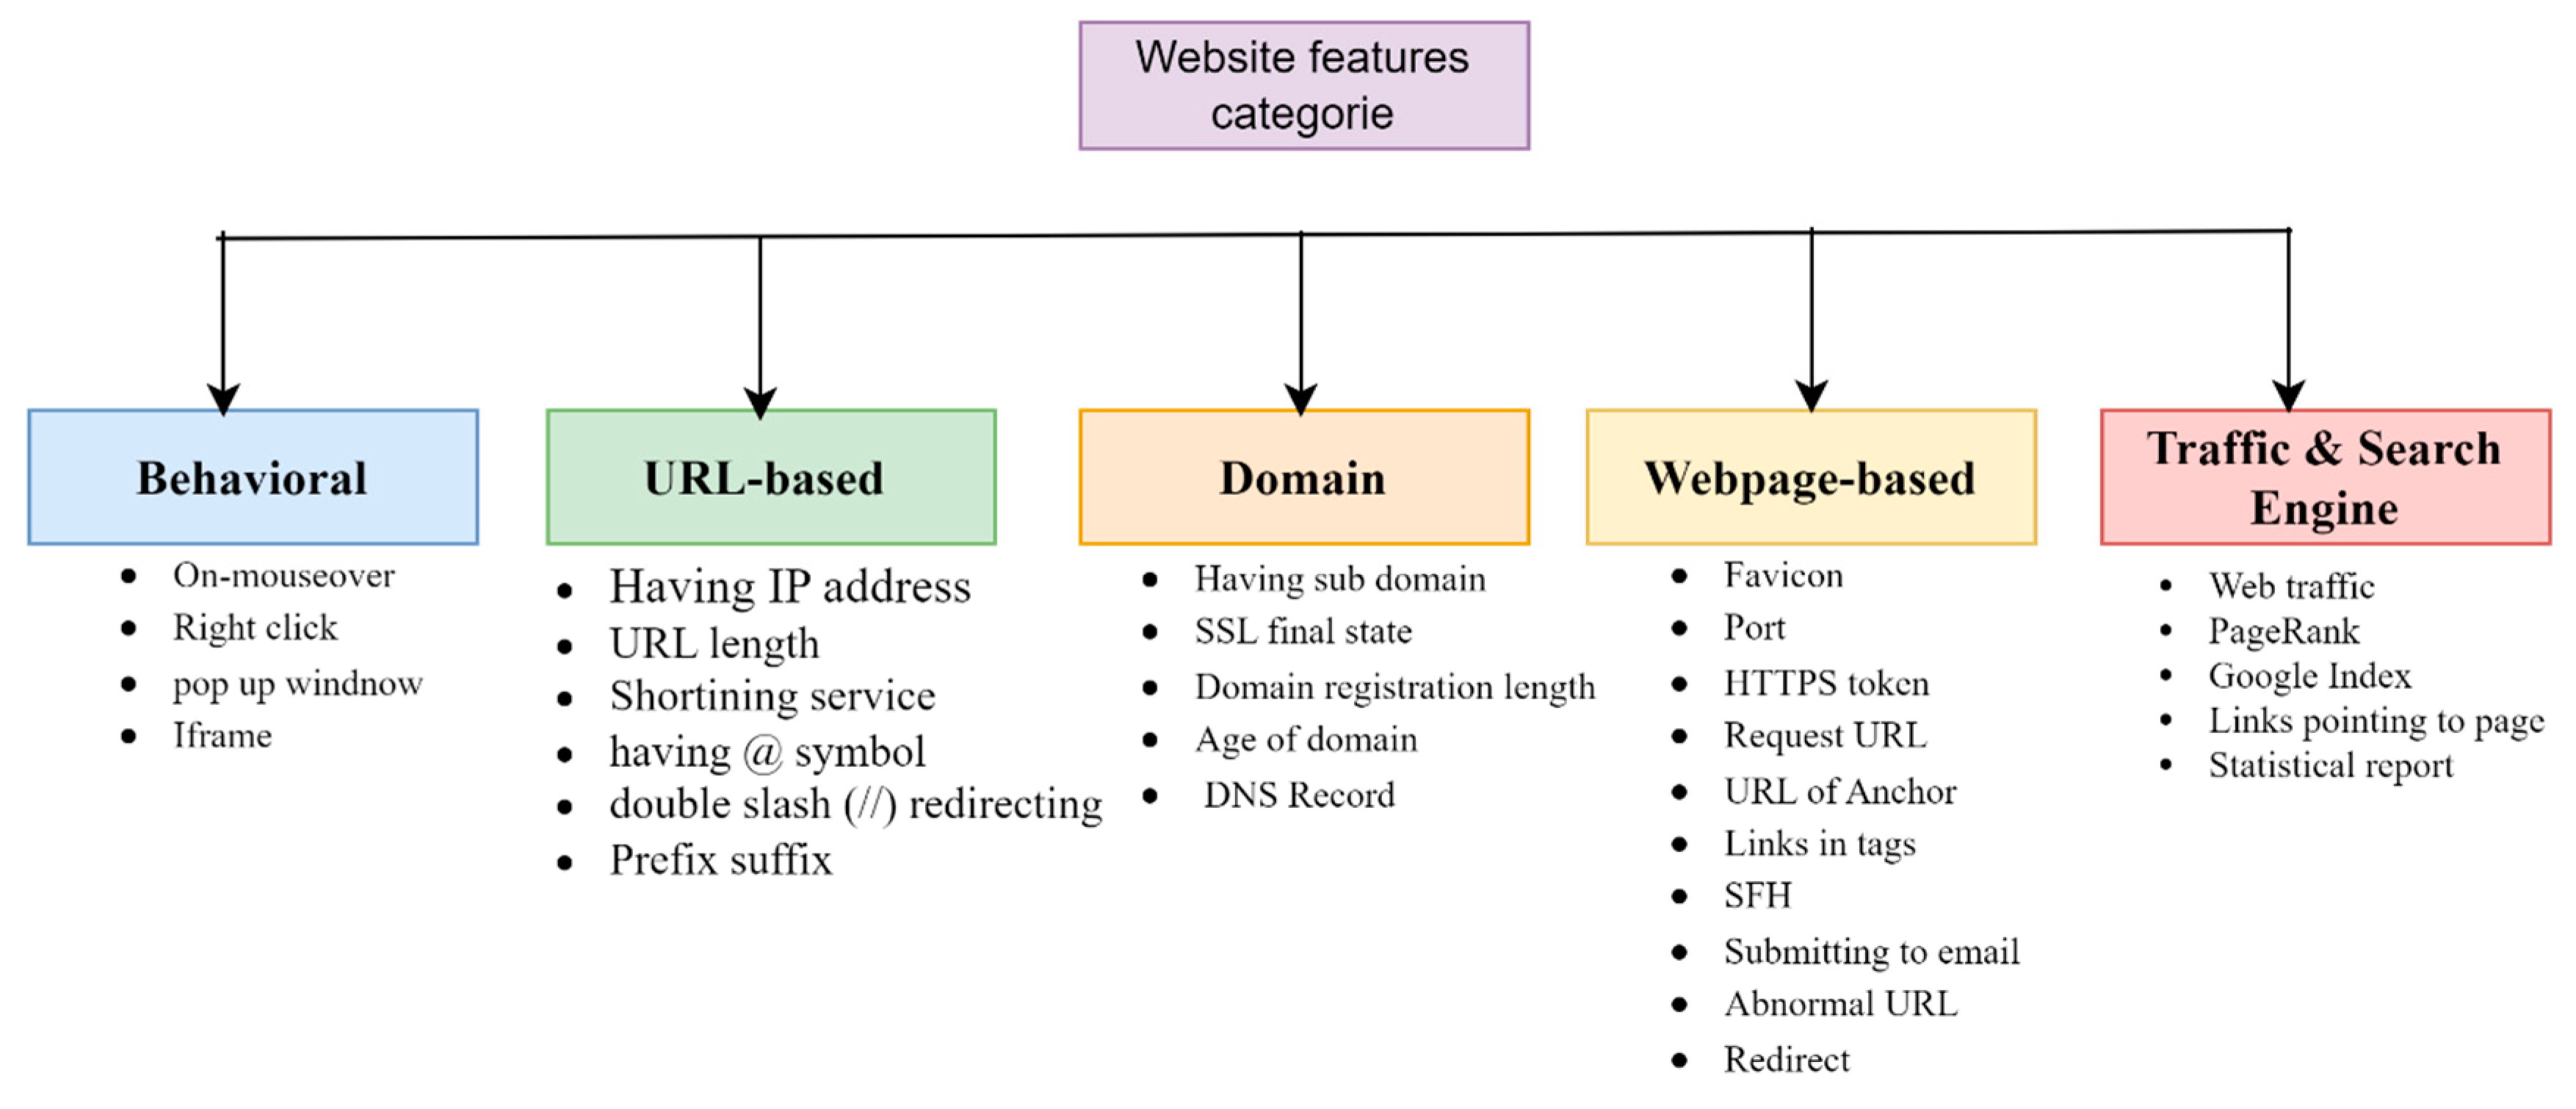
Figure 2.
Dataflow framework for phishing detection and profiling. The architecture consists of two parallel paths: an unsupervised branch using PCA and K-Means for campaign profiling, and a supervised branch using ensemble classifiers for phishing detection. Clustering output is not fed into classification; both branches operate independently on the same preprocessed features.
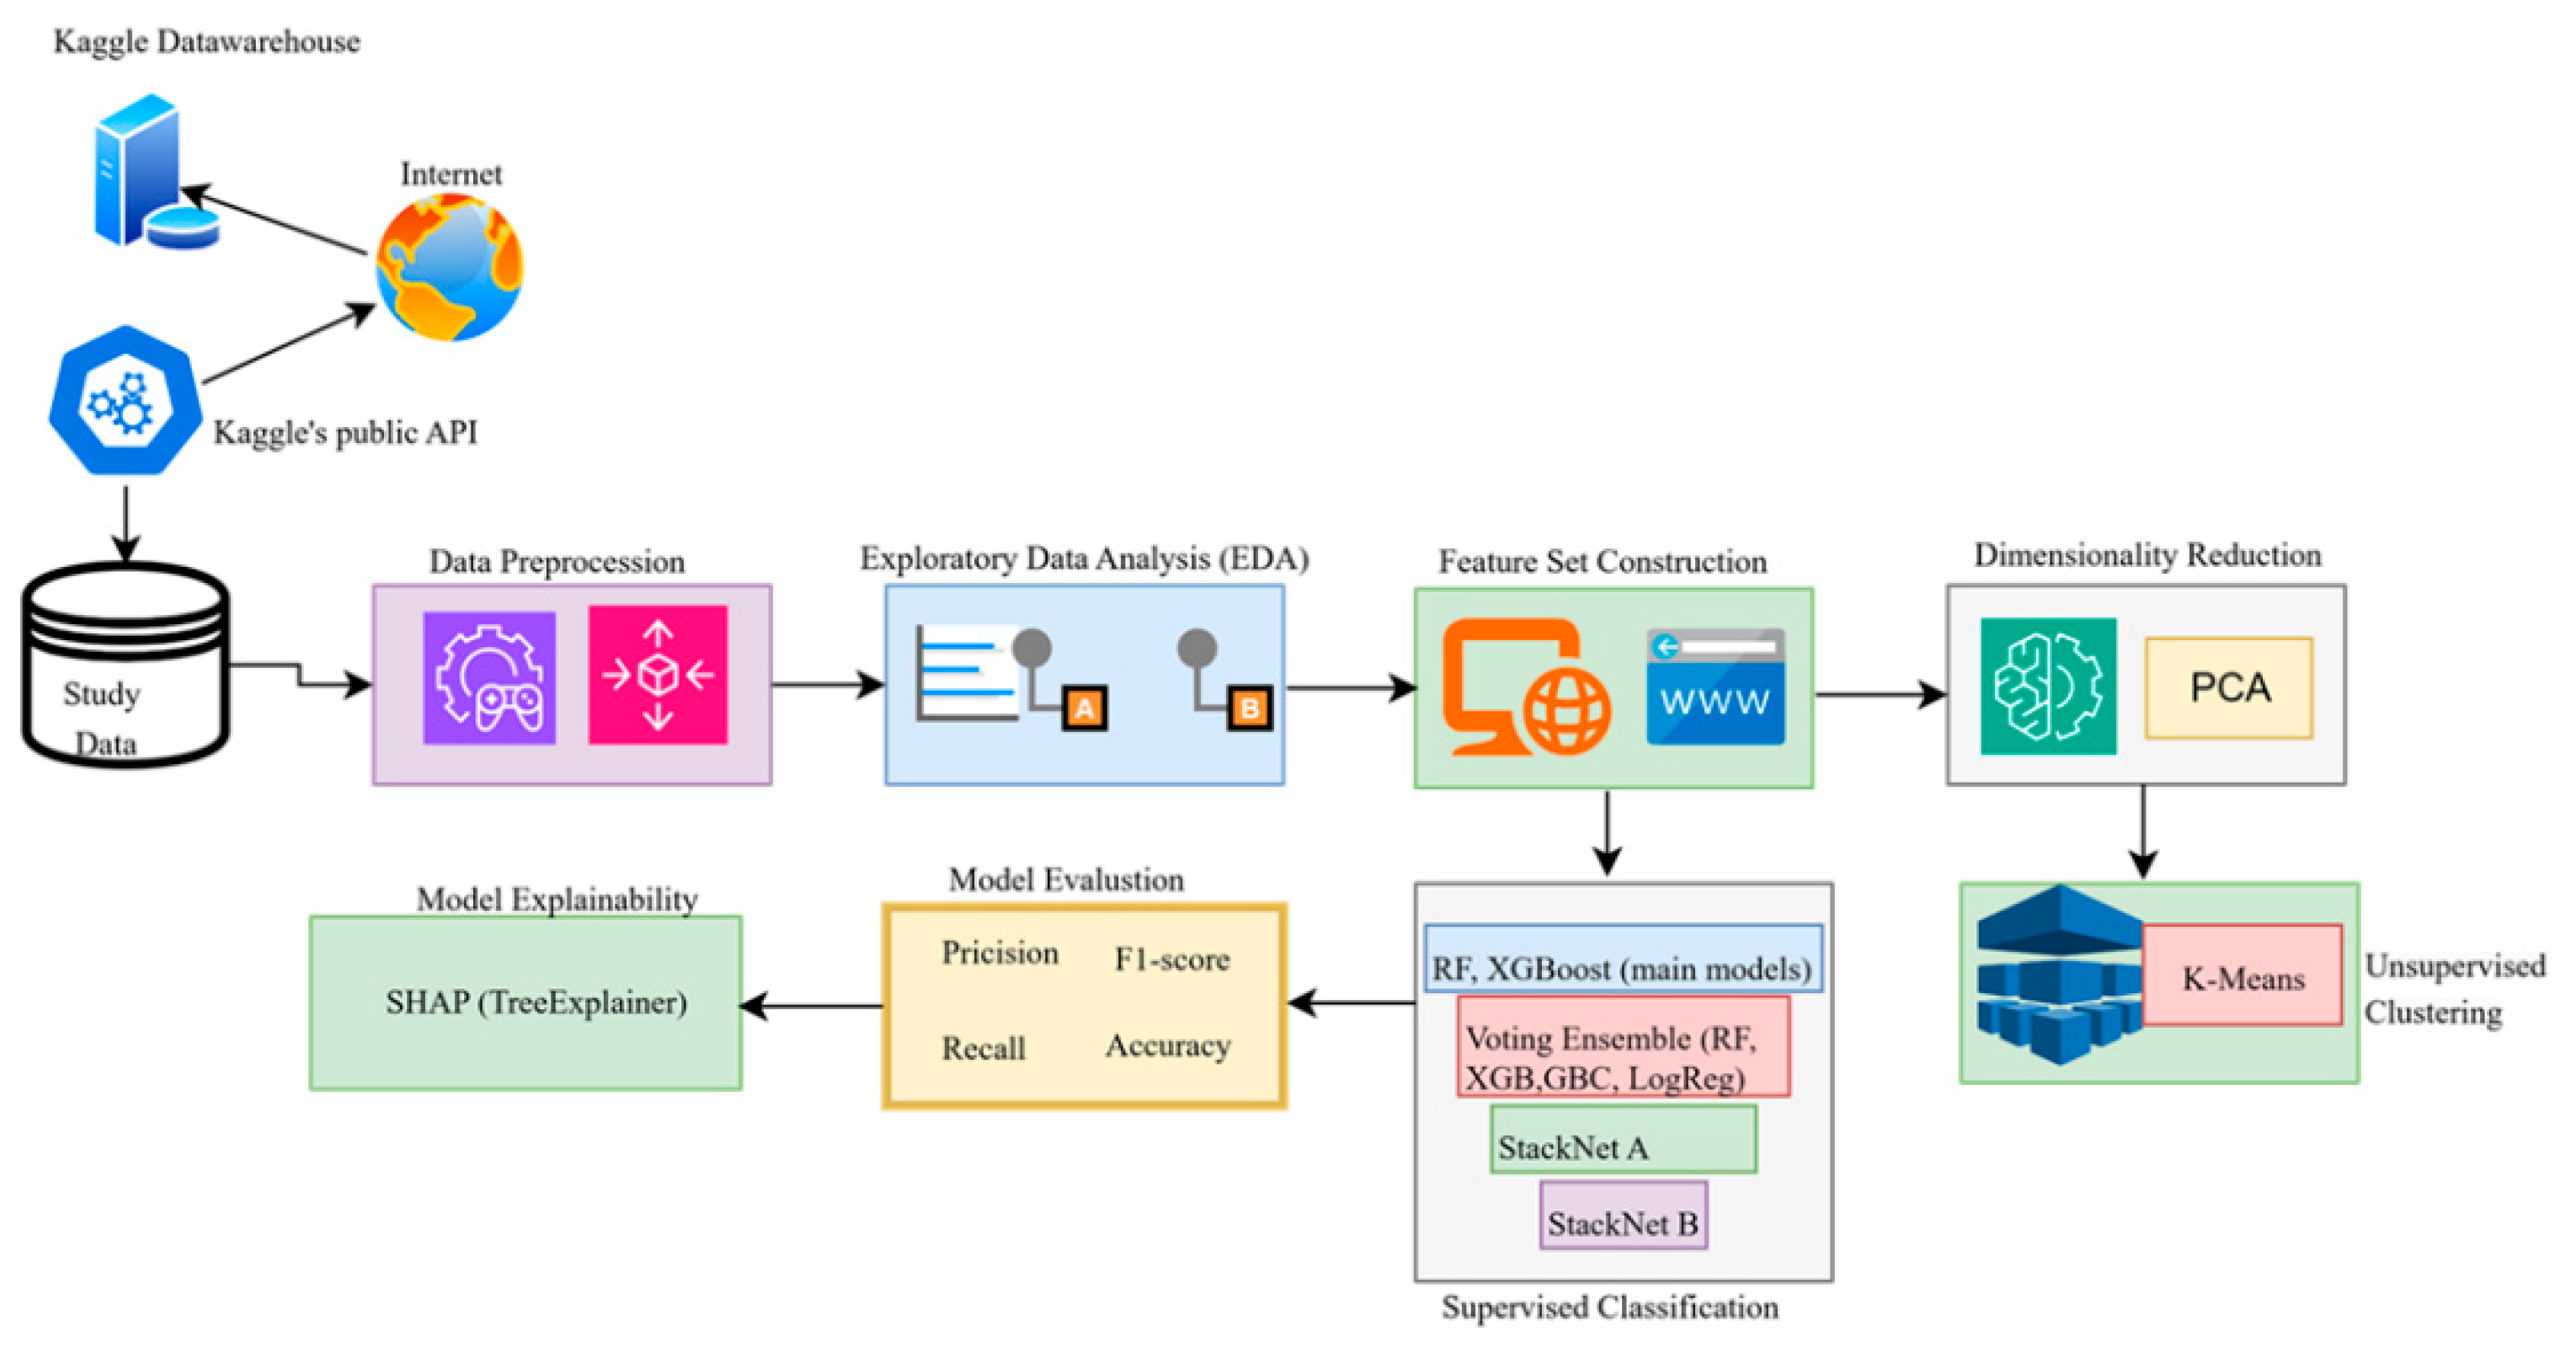
Figure 3.
Architecture of Stacked Ensemble (Model A).
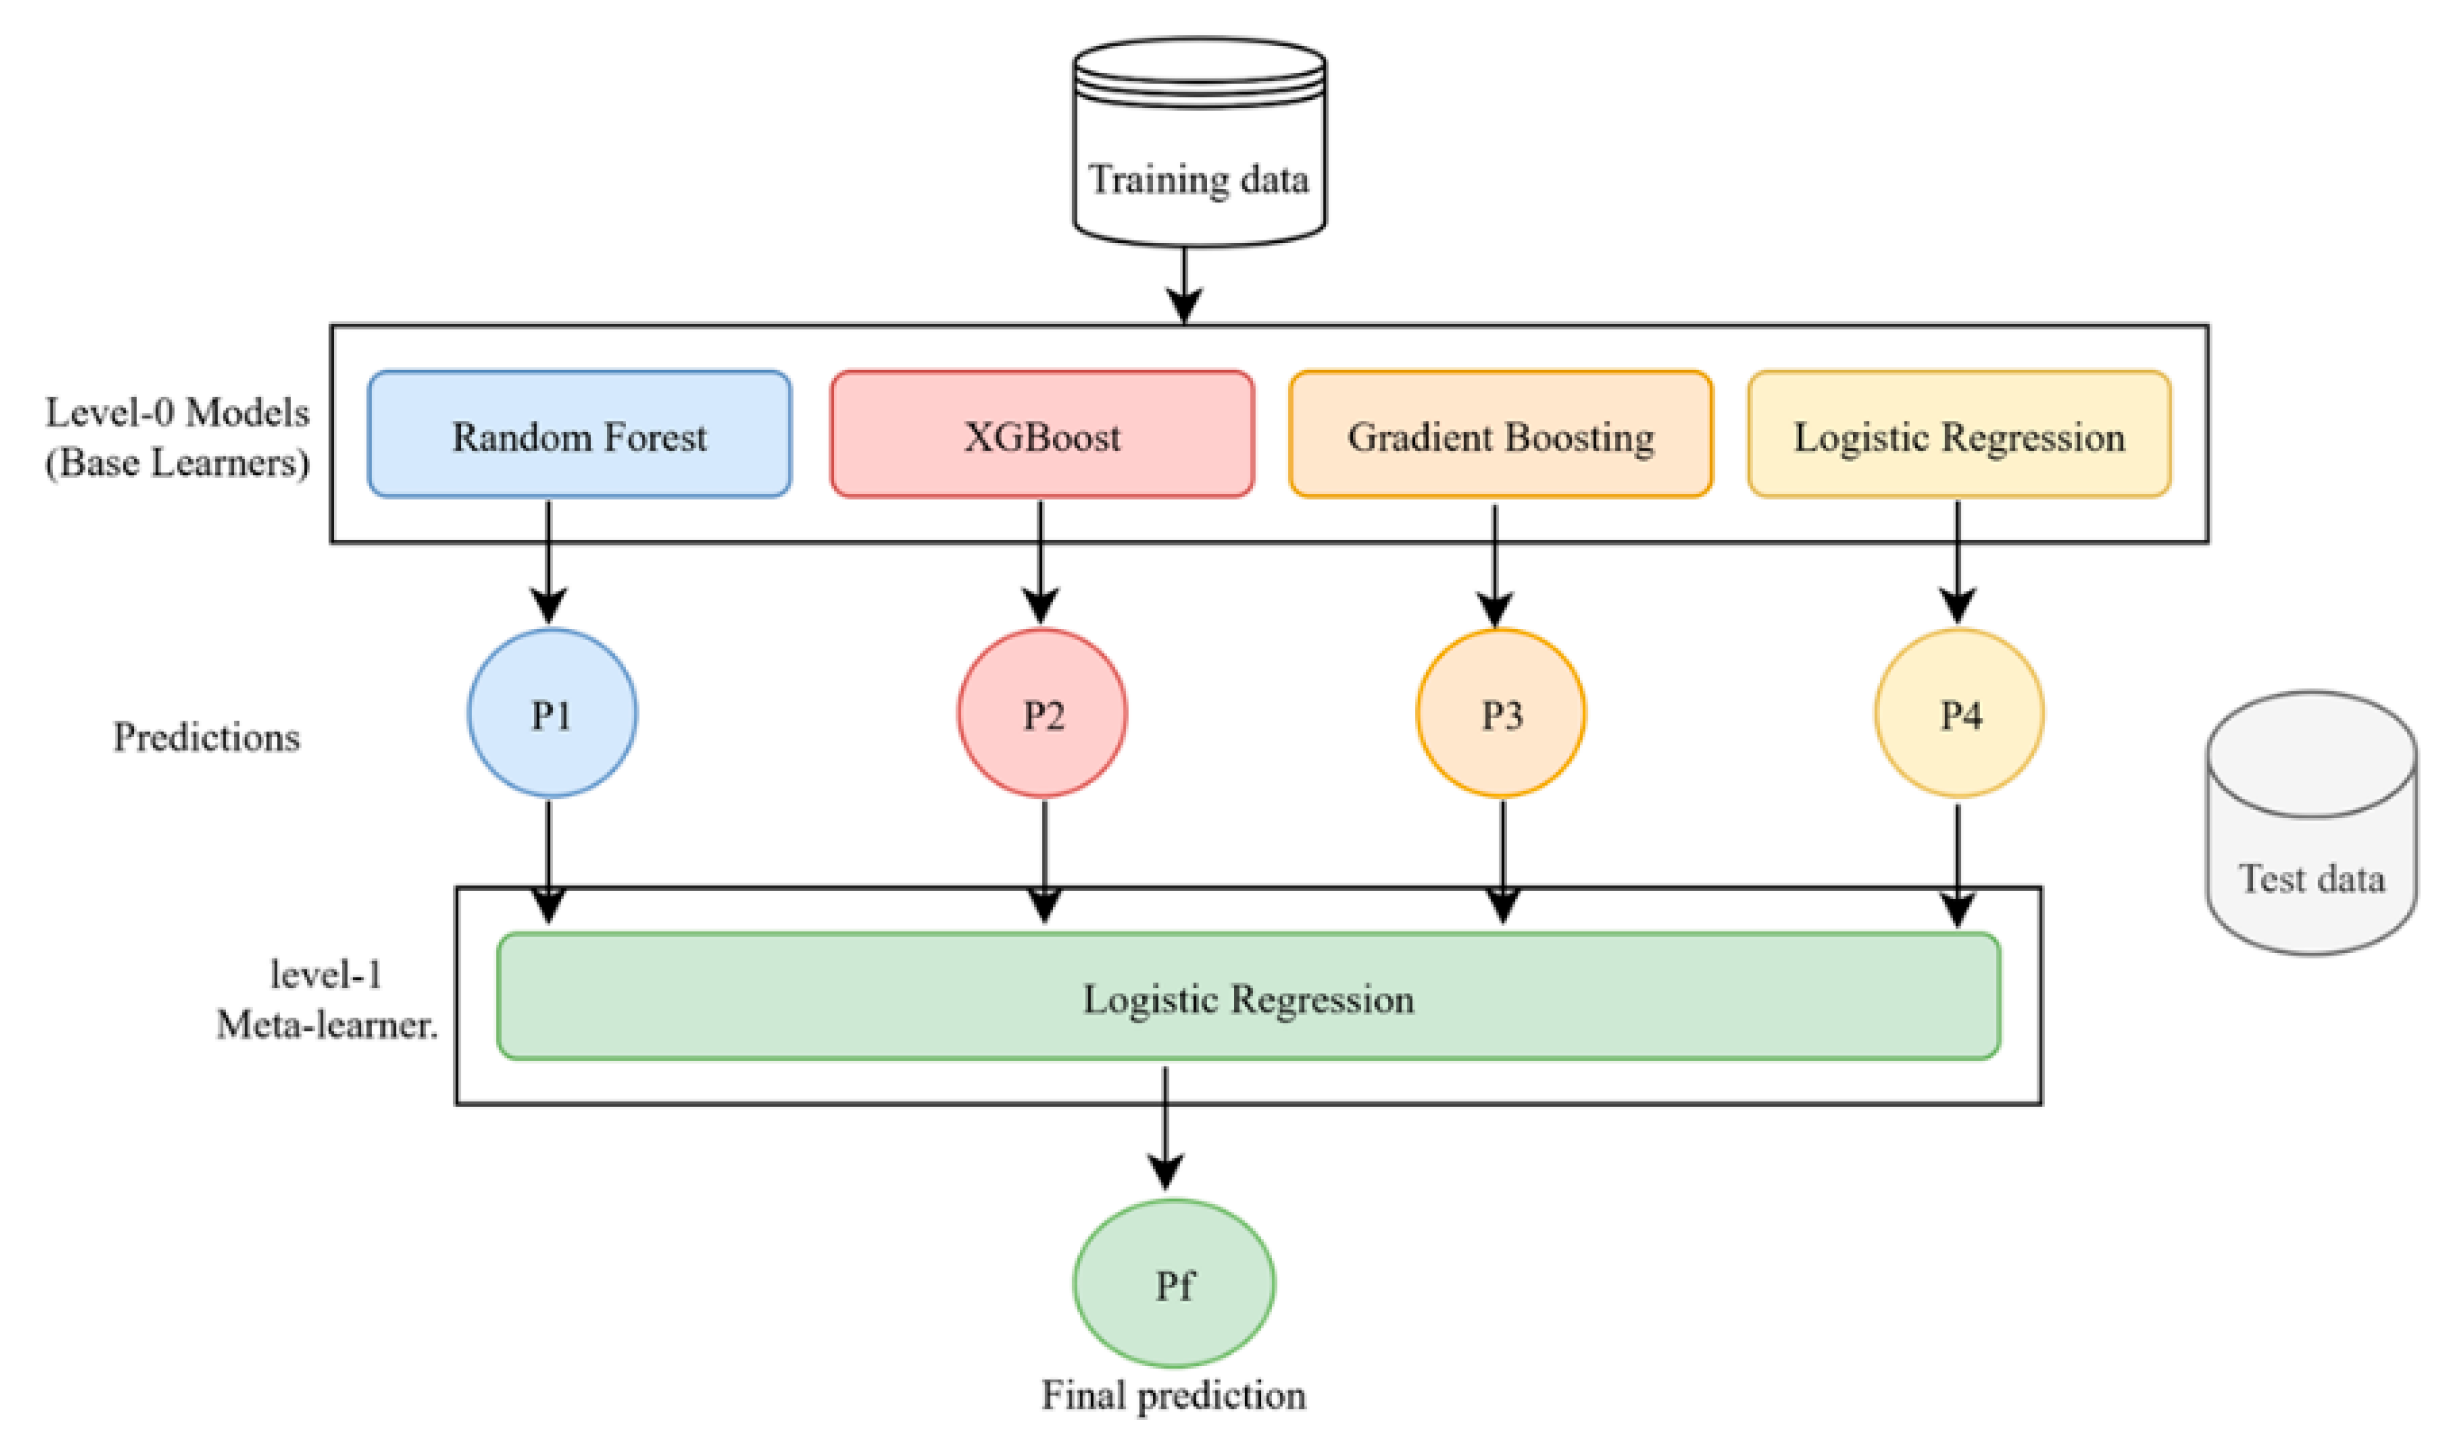
Figure 4.
Architecture of Stacked Ensemble (Model B).
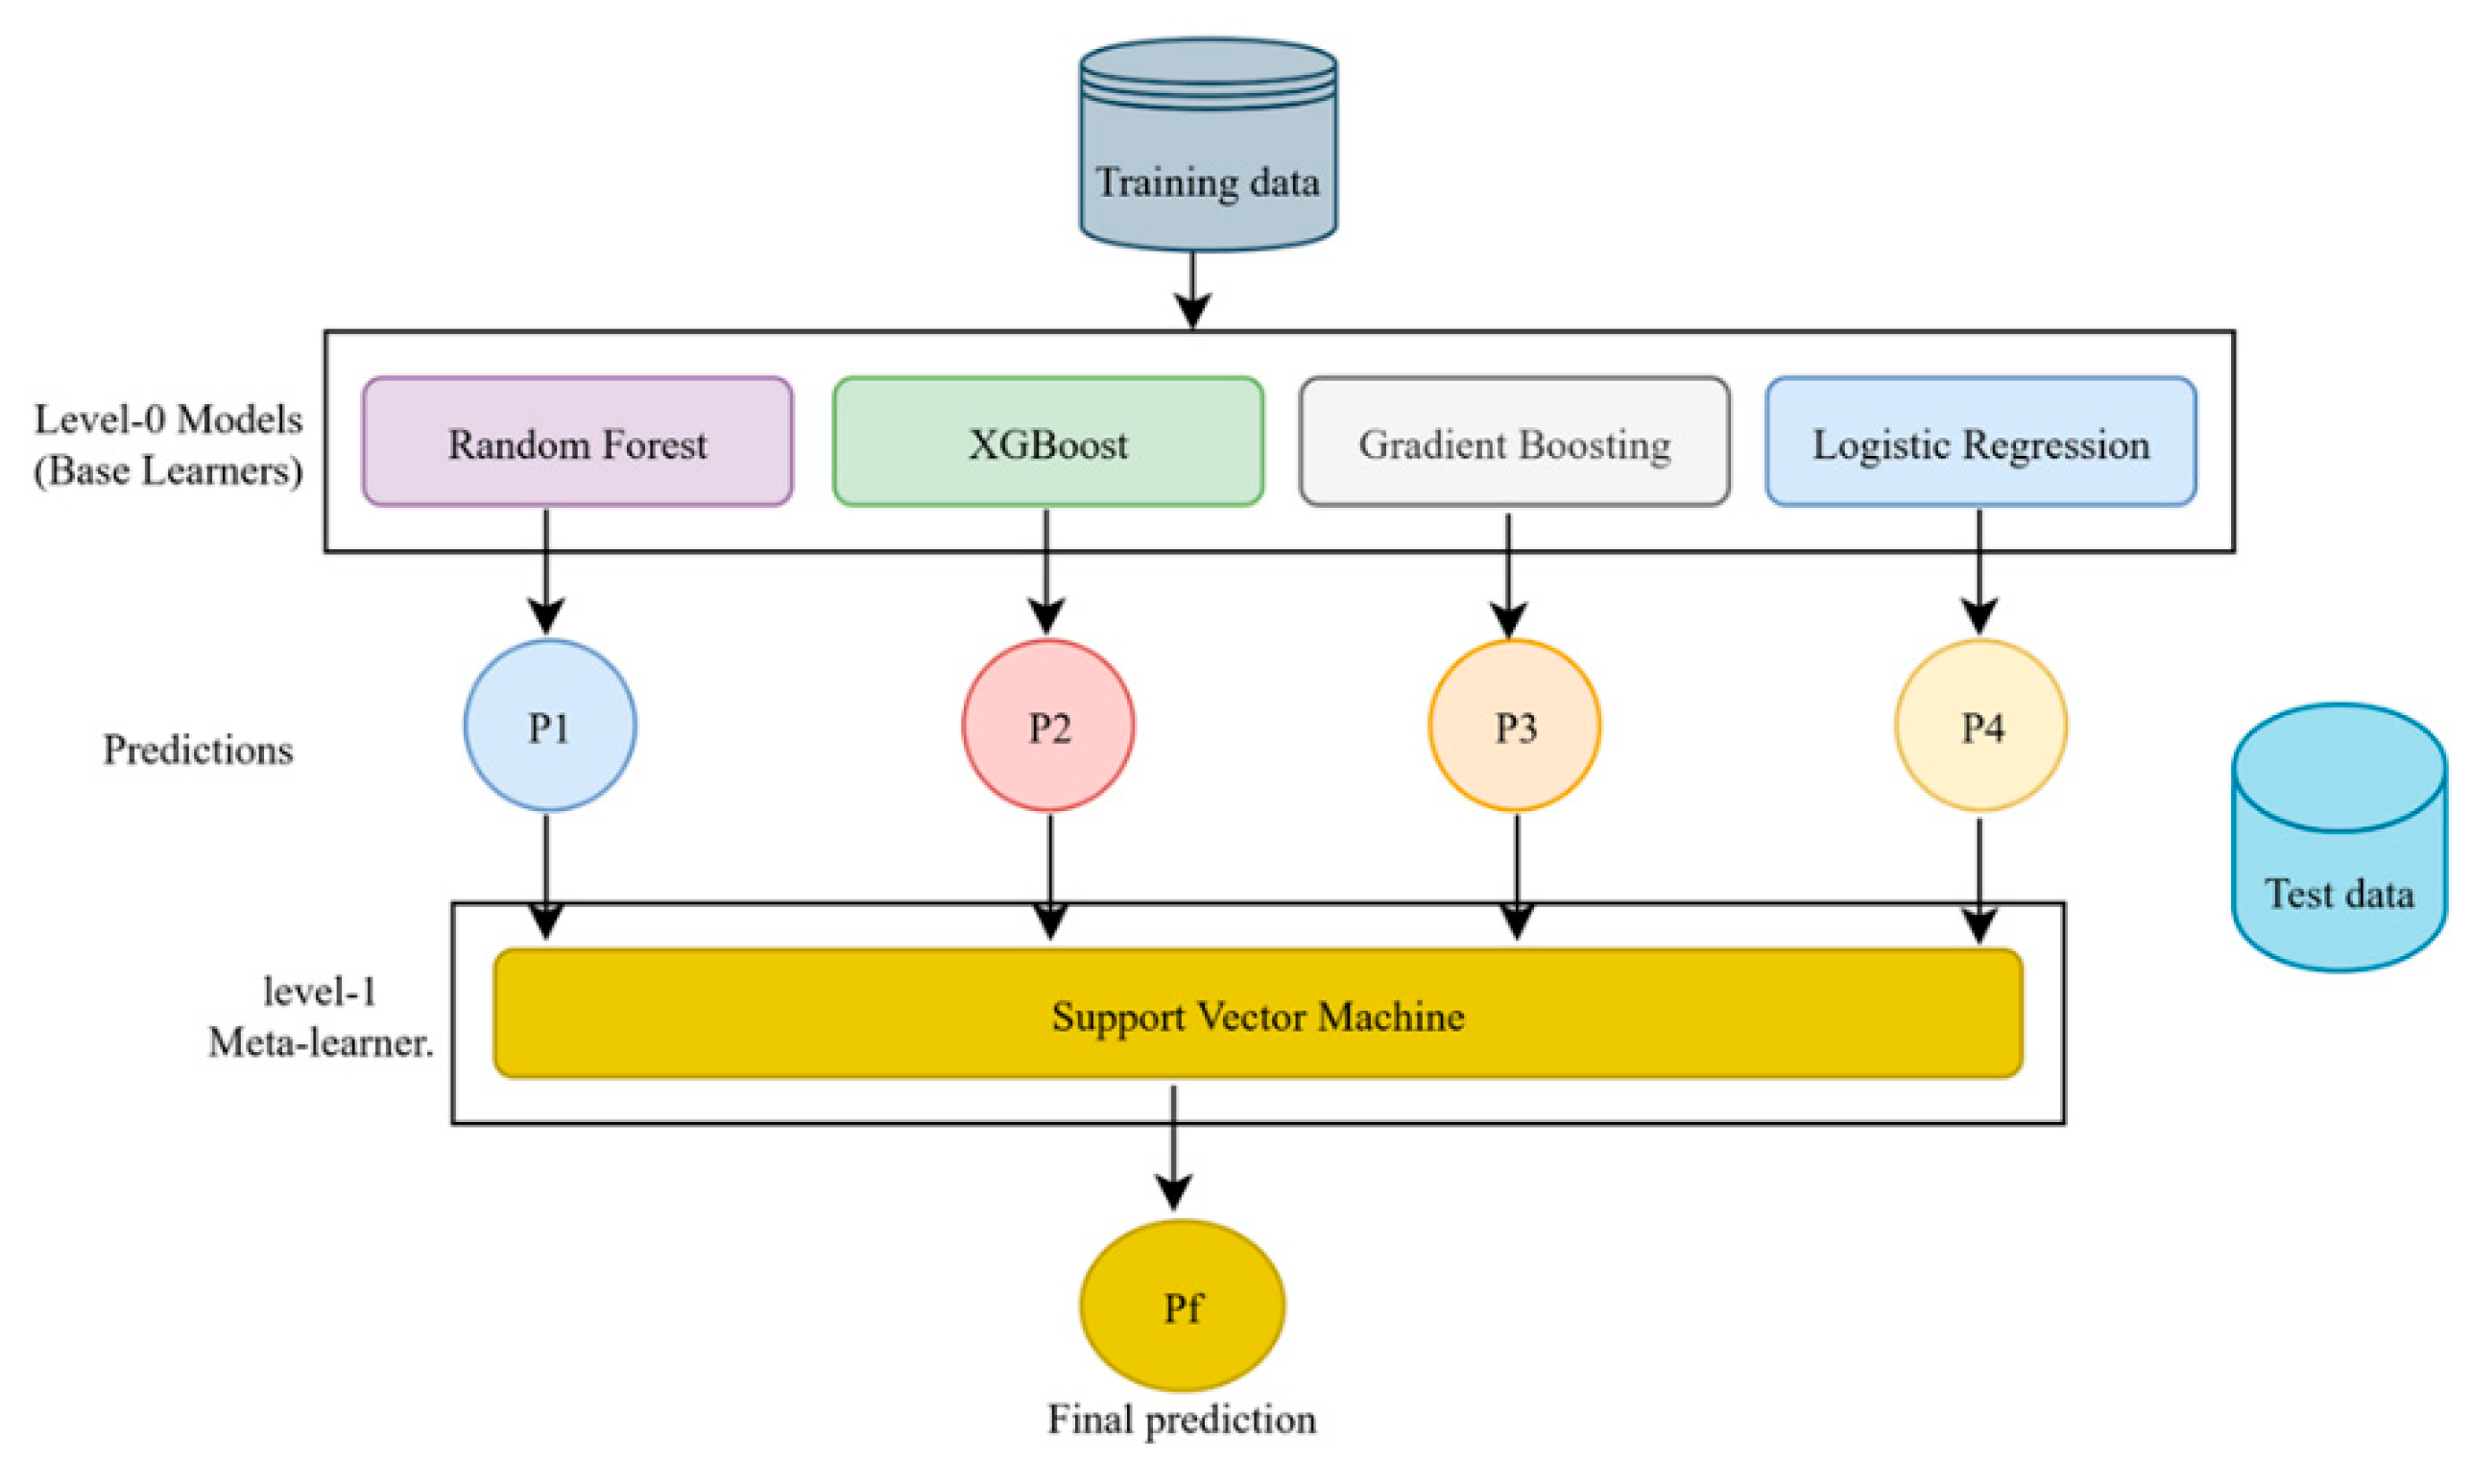
Figure 5.
Frequency distribution of behavioral features (“on_mouseover,” “RightClick,” “popUpWindow,” and “Iframe”) comparing legitimate and phishing websites in the dataset.
Figure 5.
Frequency distribution of behavioral features (“on_mouseover,” “RightClick,” “popUpWindow,” and “Iframe”) comparing legitimate and phishing websites in the dataset.
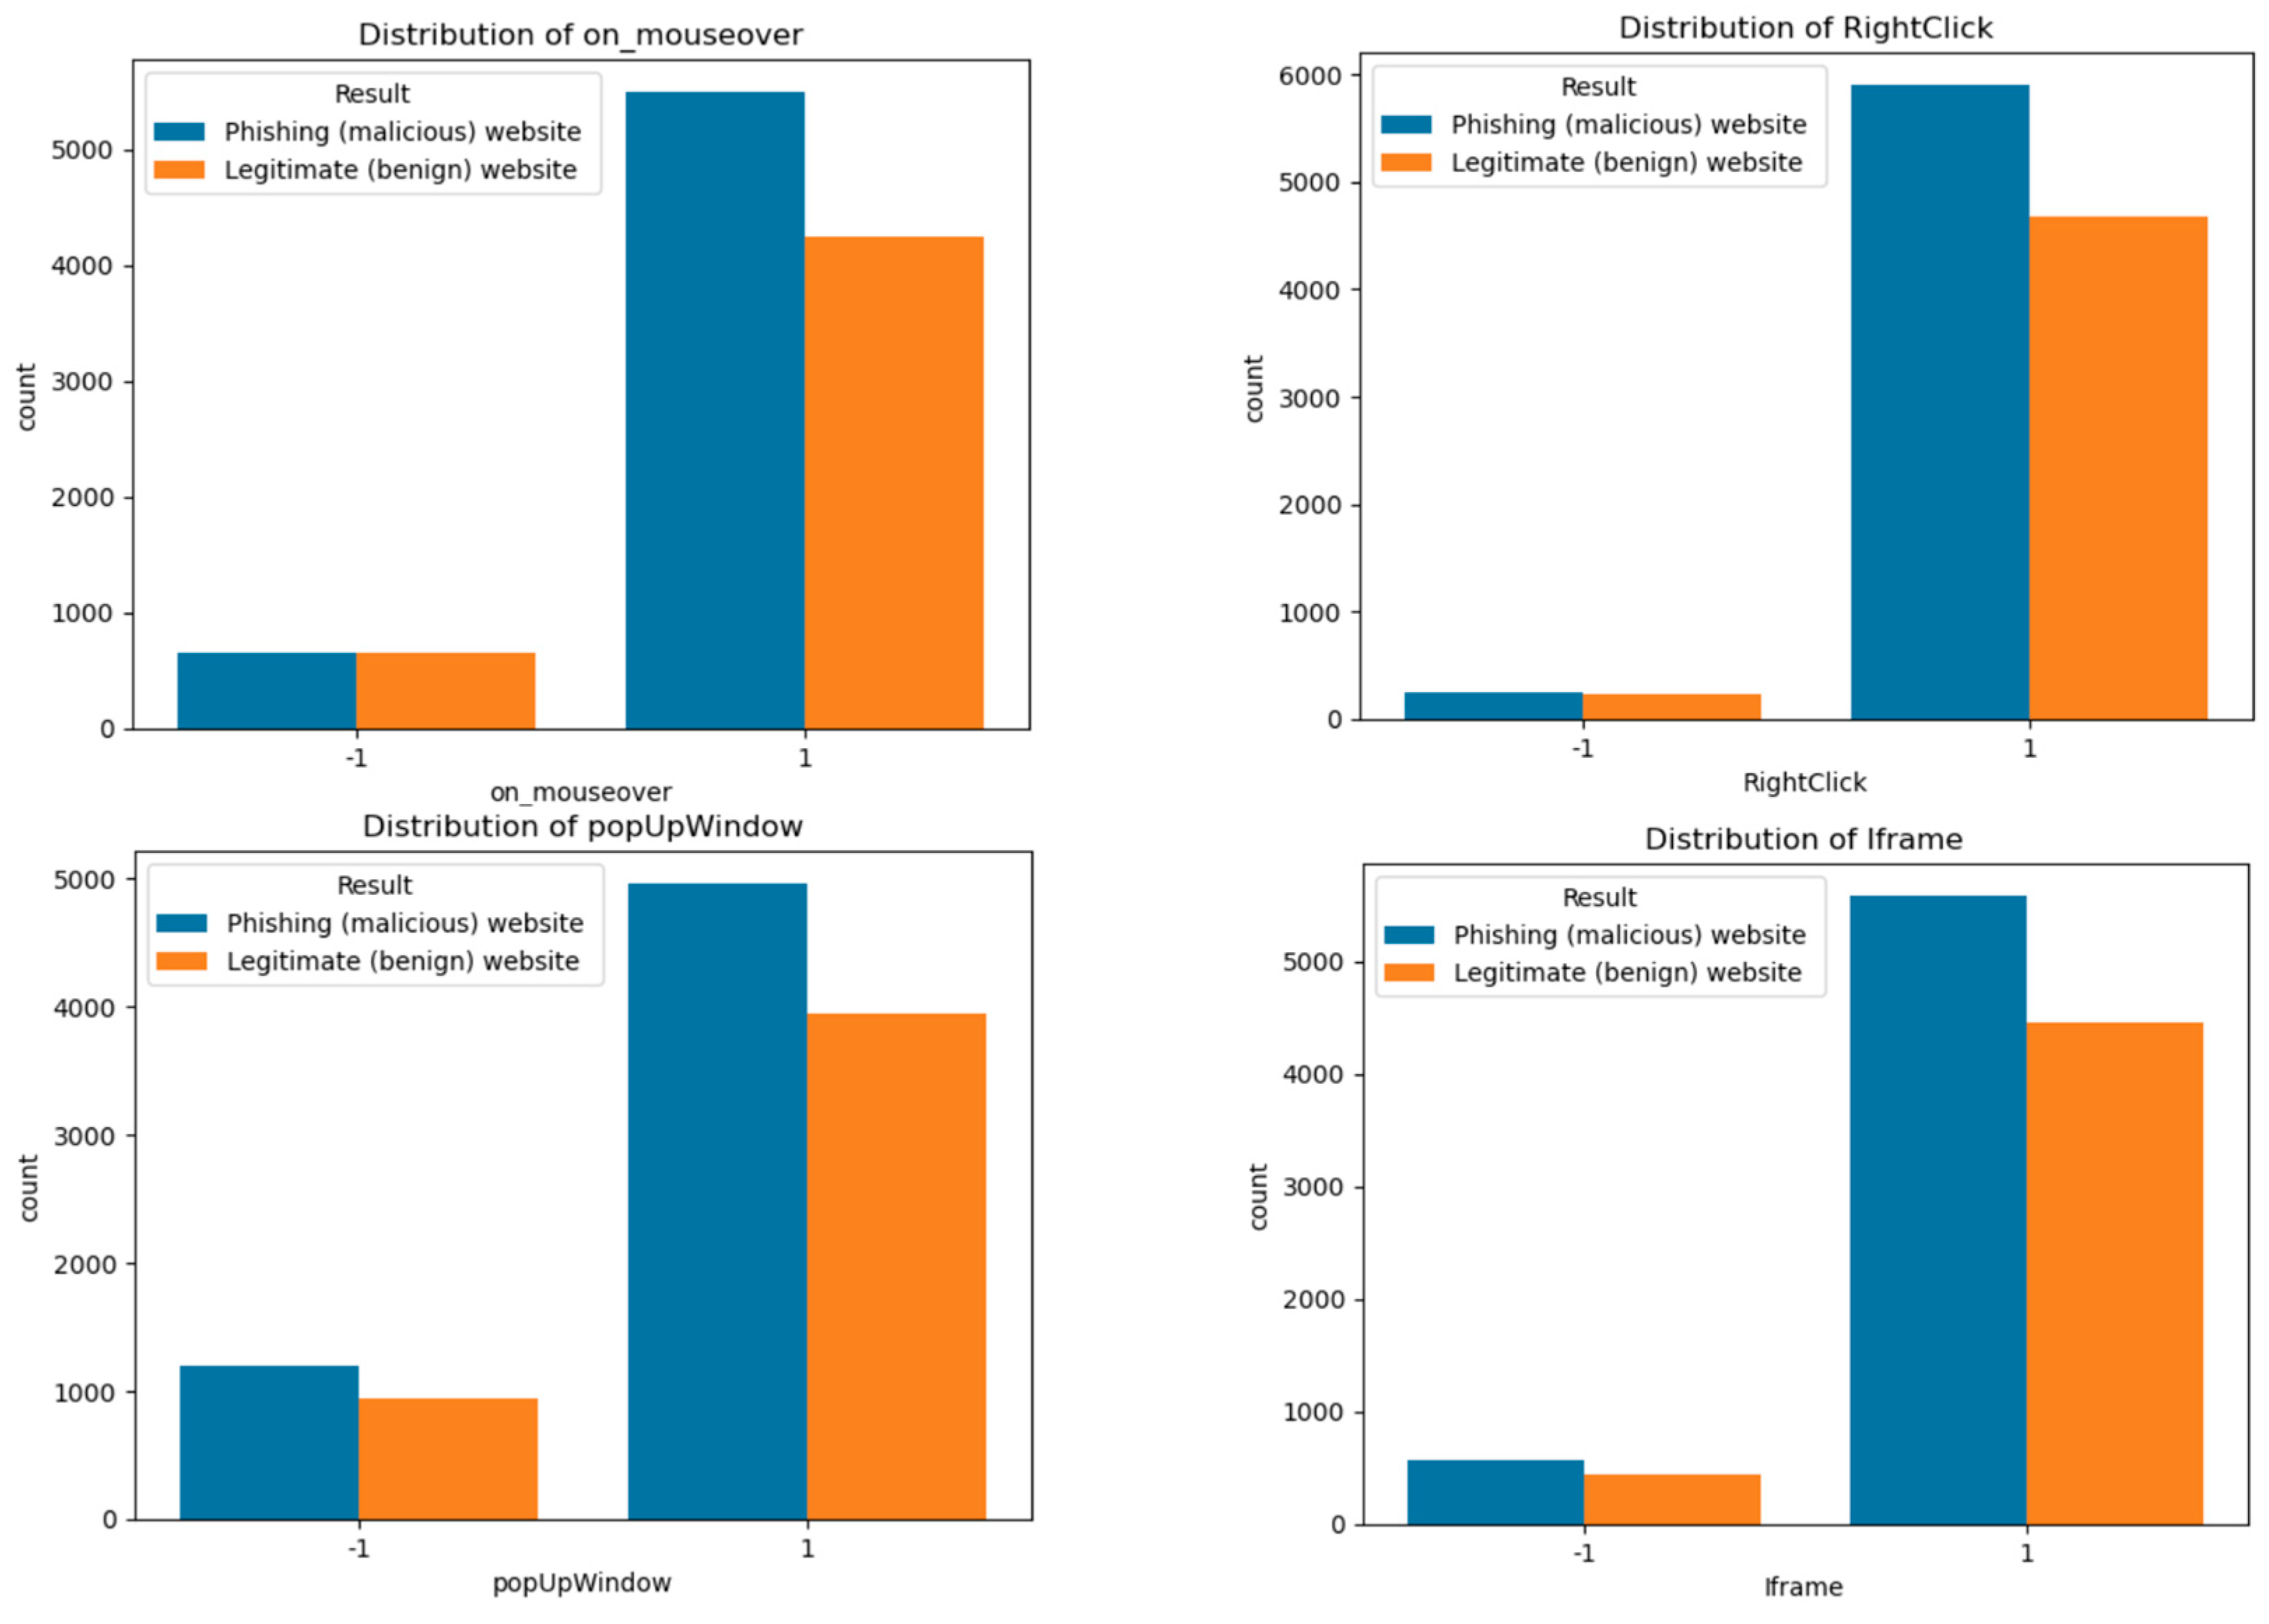
Figure 6.
Correlation heatmap illustrating pairwise relationships among selected dataset features, highlighting degrees of correlation that may influence the malicious URL detection process.
Figure 6.
Correlation heatmap illustrating pairwise relationships among selected dataset features, highlighting degrees of correlation that may influence the malicious URL detection process.
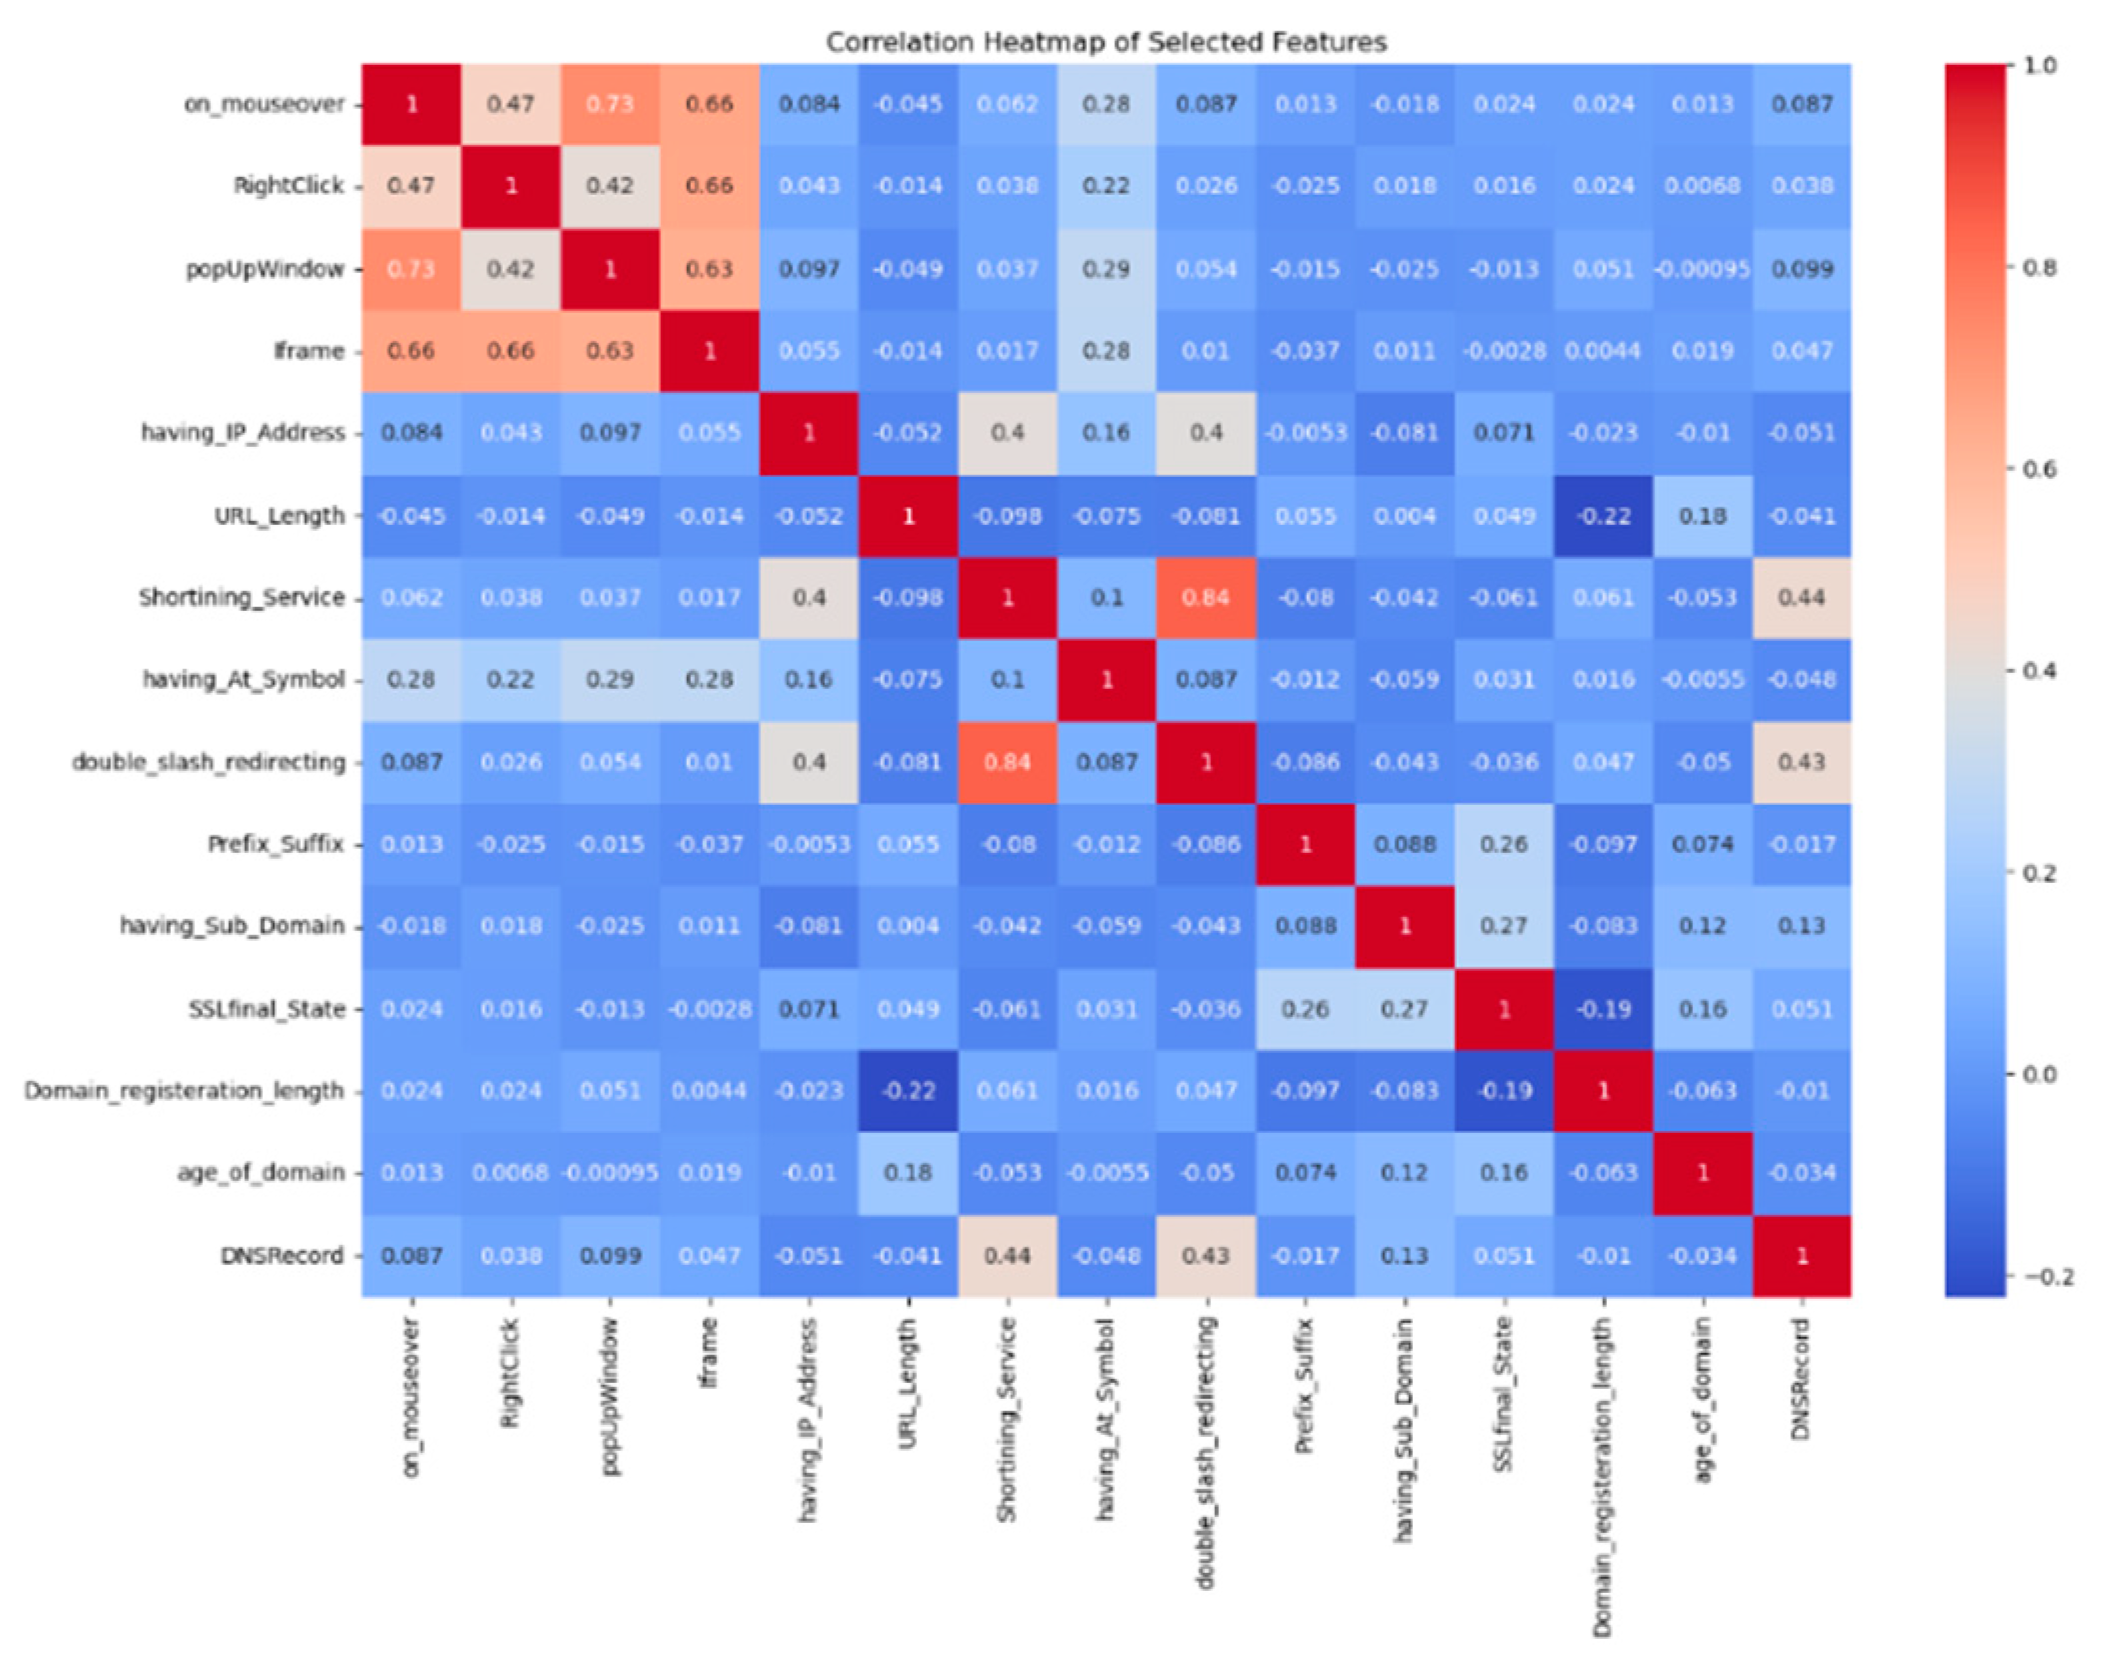
Figure 7.
K-Means clustering results (K = 2) on PCA-reduced feature space with varying explained variance thresholds: 90% (left), 95% (middle), and 99% (right).
Figure 7.
K-Means clustering results (K = 2) on PCA-reduced feature space with varying explained variance thresholds: 90% (left), 95% (middle), and 99% (right).
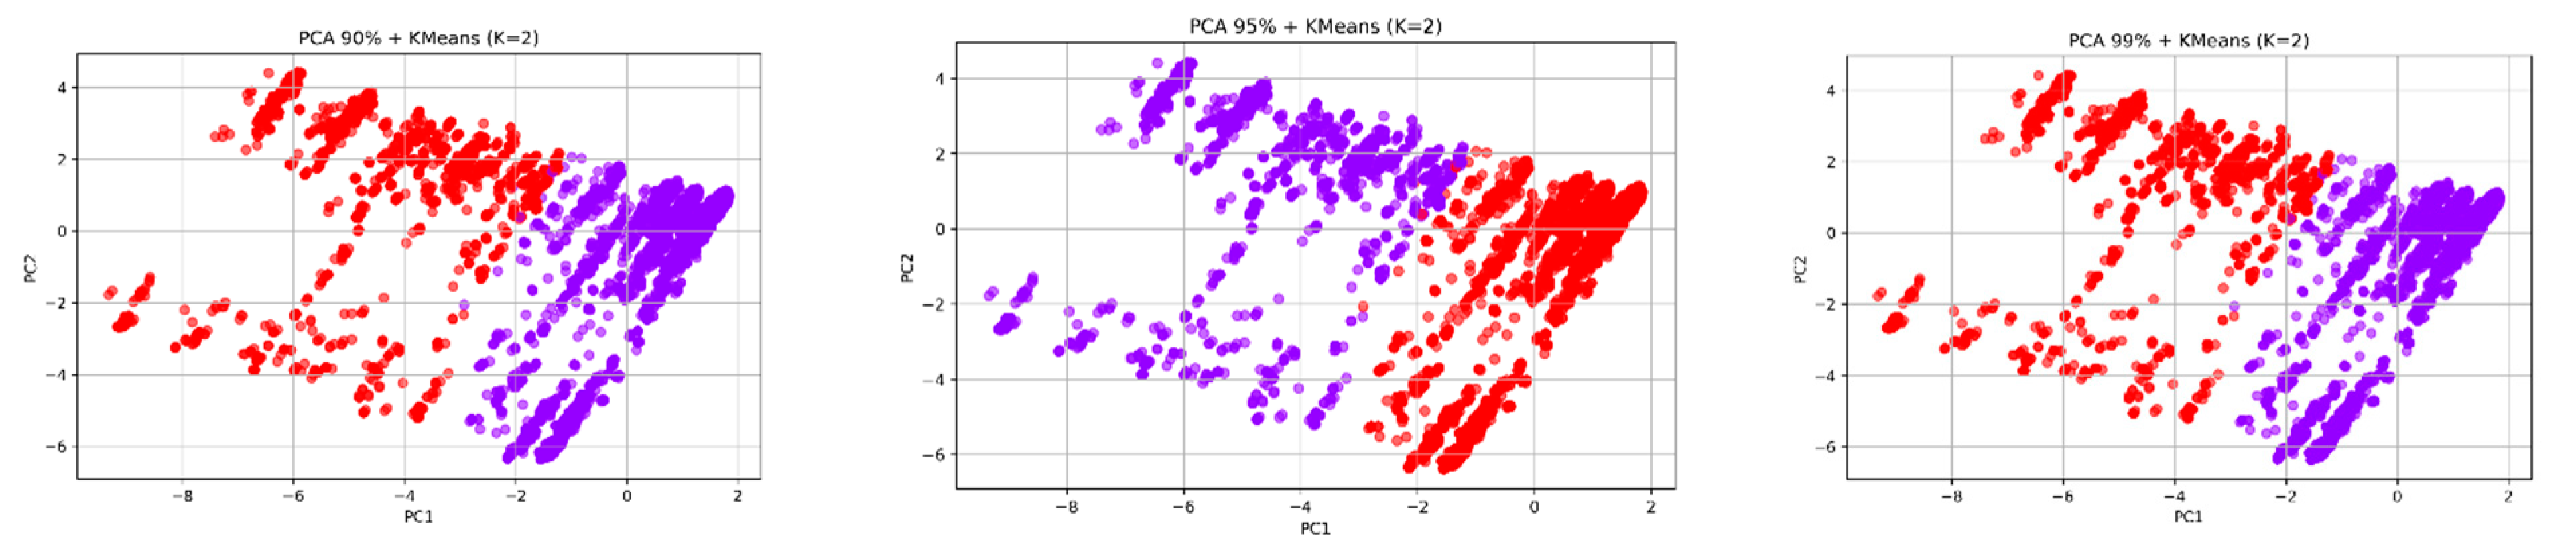
Figure 11.
Performance evaluation of stacked ensemble models (Stacking Model A and Stacking Model B), showcasing precision, recall, and F1-score for the classification of legitimate and phishing websites.
Figure 11.
Performance evaluation of stacked ensemble models (Stacking Model A and Stacking Model B), showcasing precision, recall, and F1-score for the classification of legitimate and phishing websites.
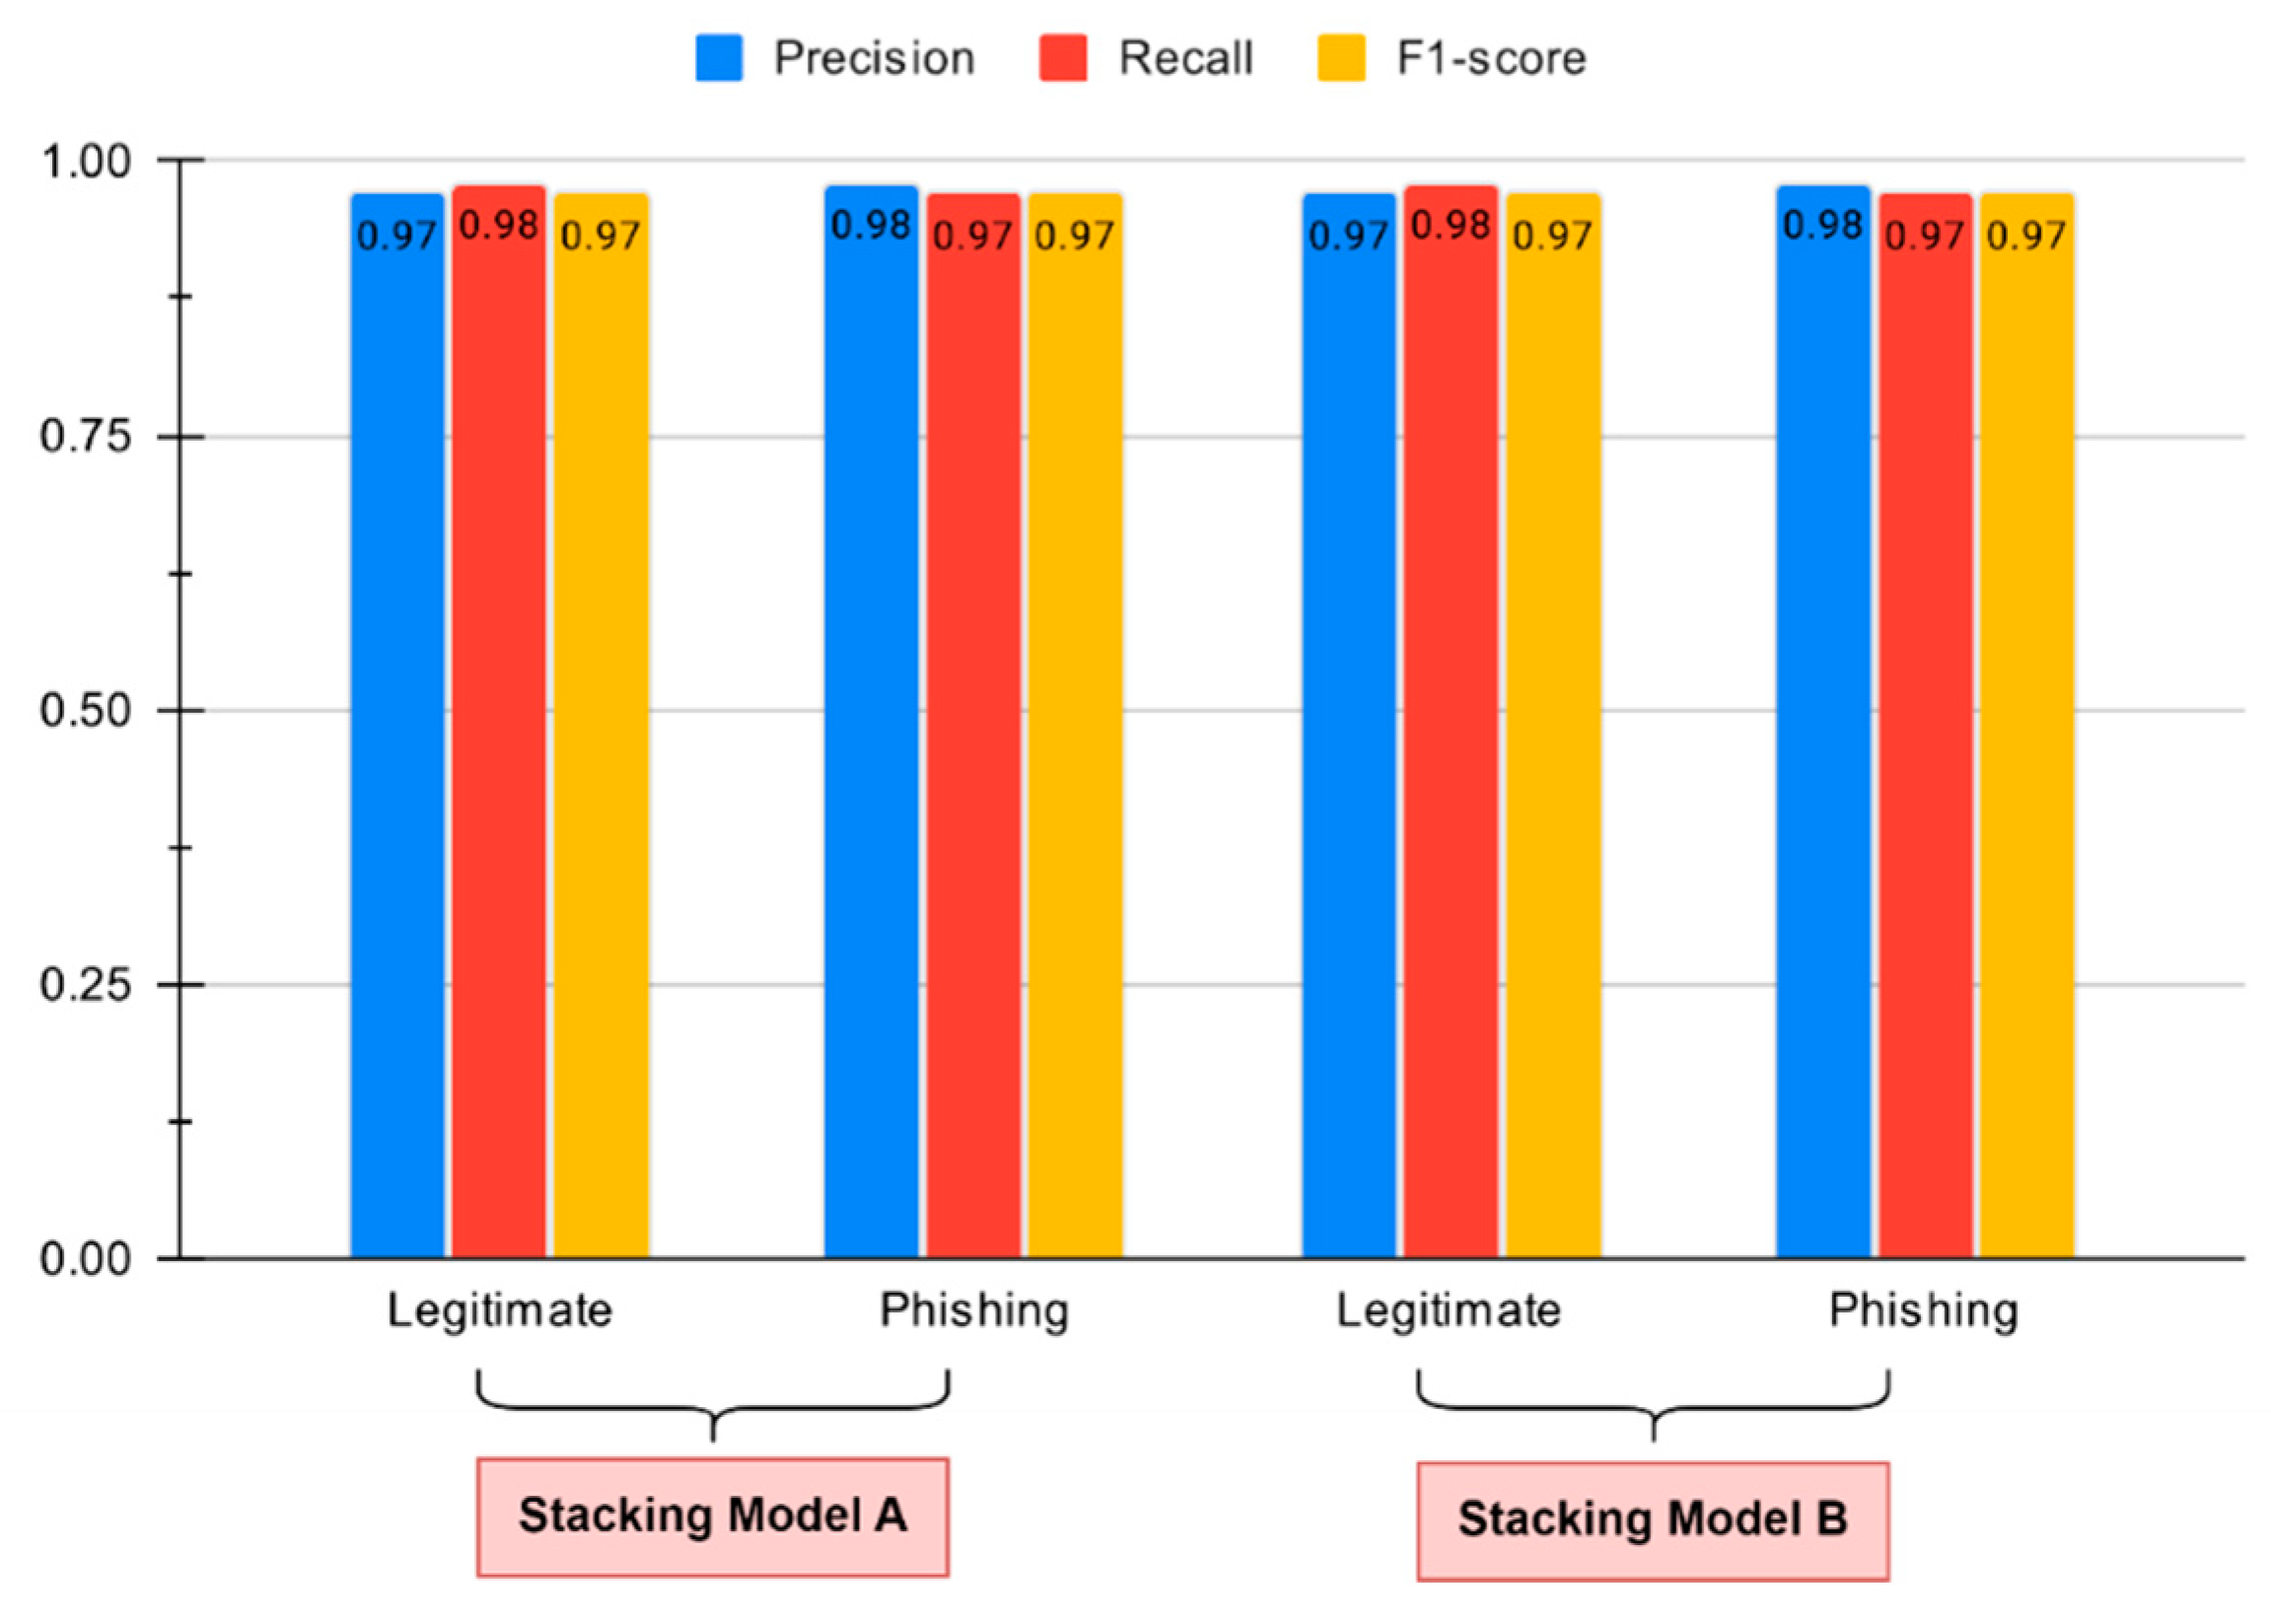
Figure 12.
Feature importance ranking derived from the Random Forest classifier, emphasizing the most influential website attributes in differentiating between phishing and legitimate websites.
Figure 12.
Feature importance ranking derived from the Random Forest classifier, emphasizing the most influential website attributes in differentiating between phishing and legitimate websites.
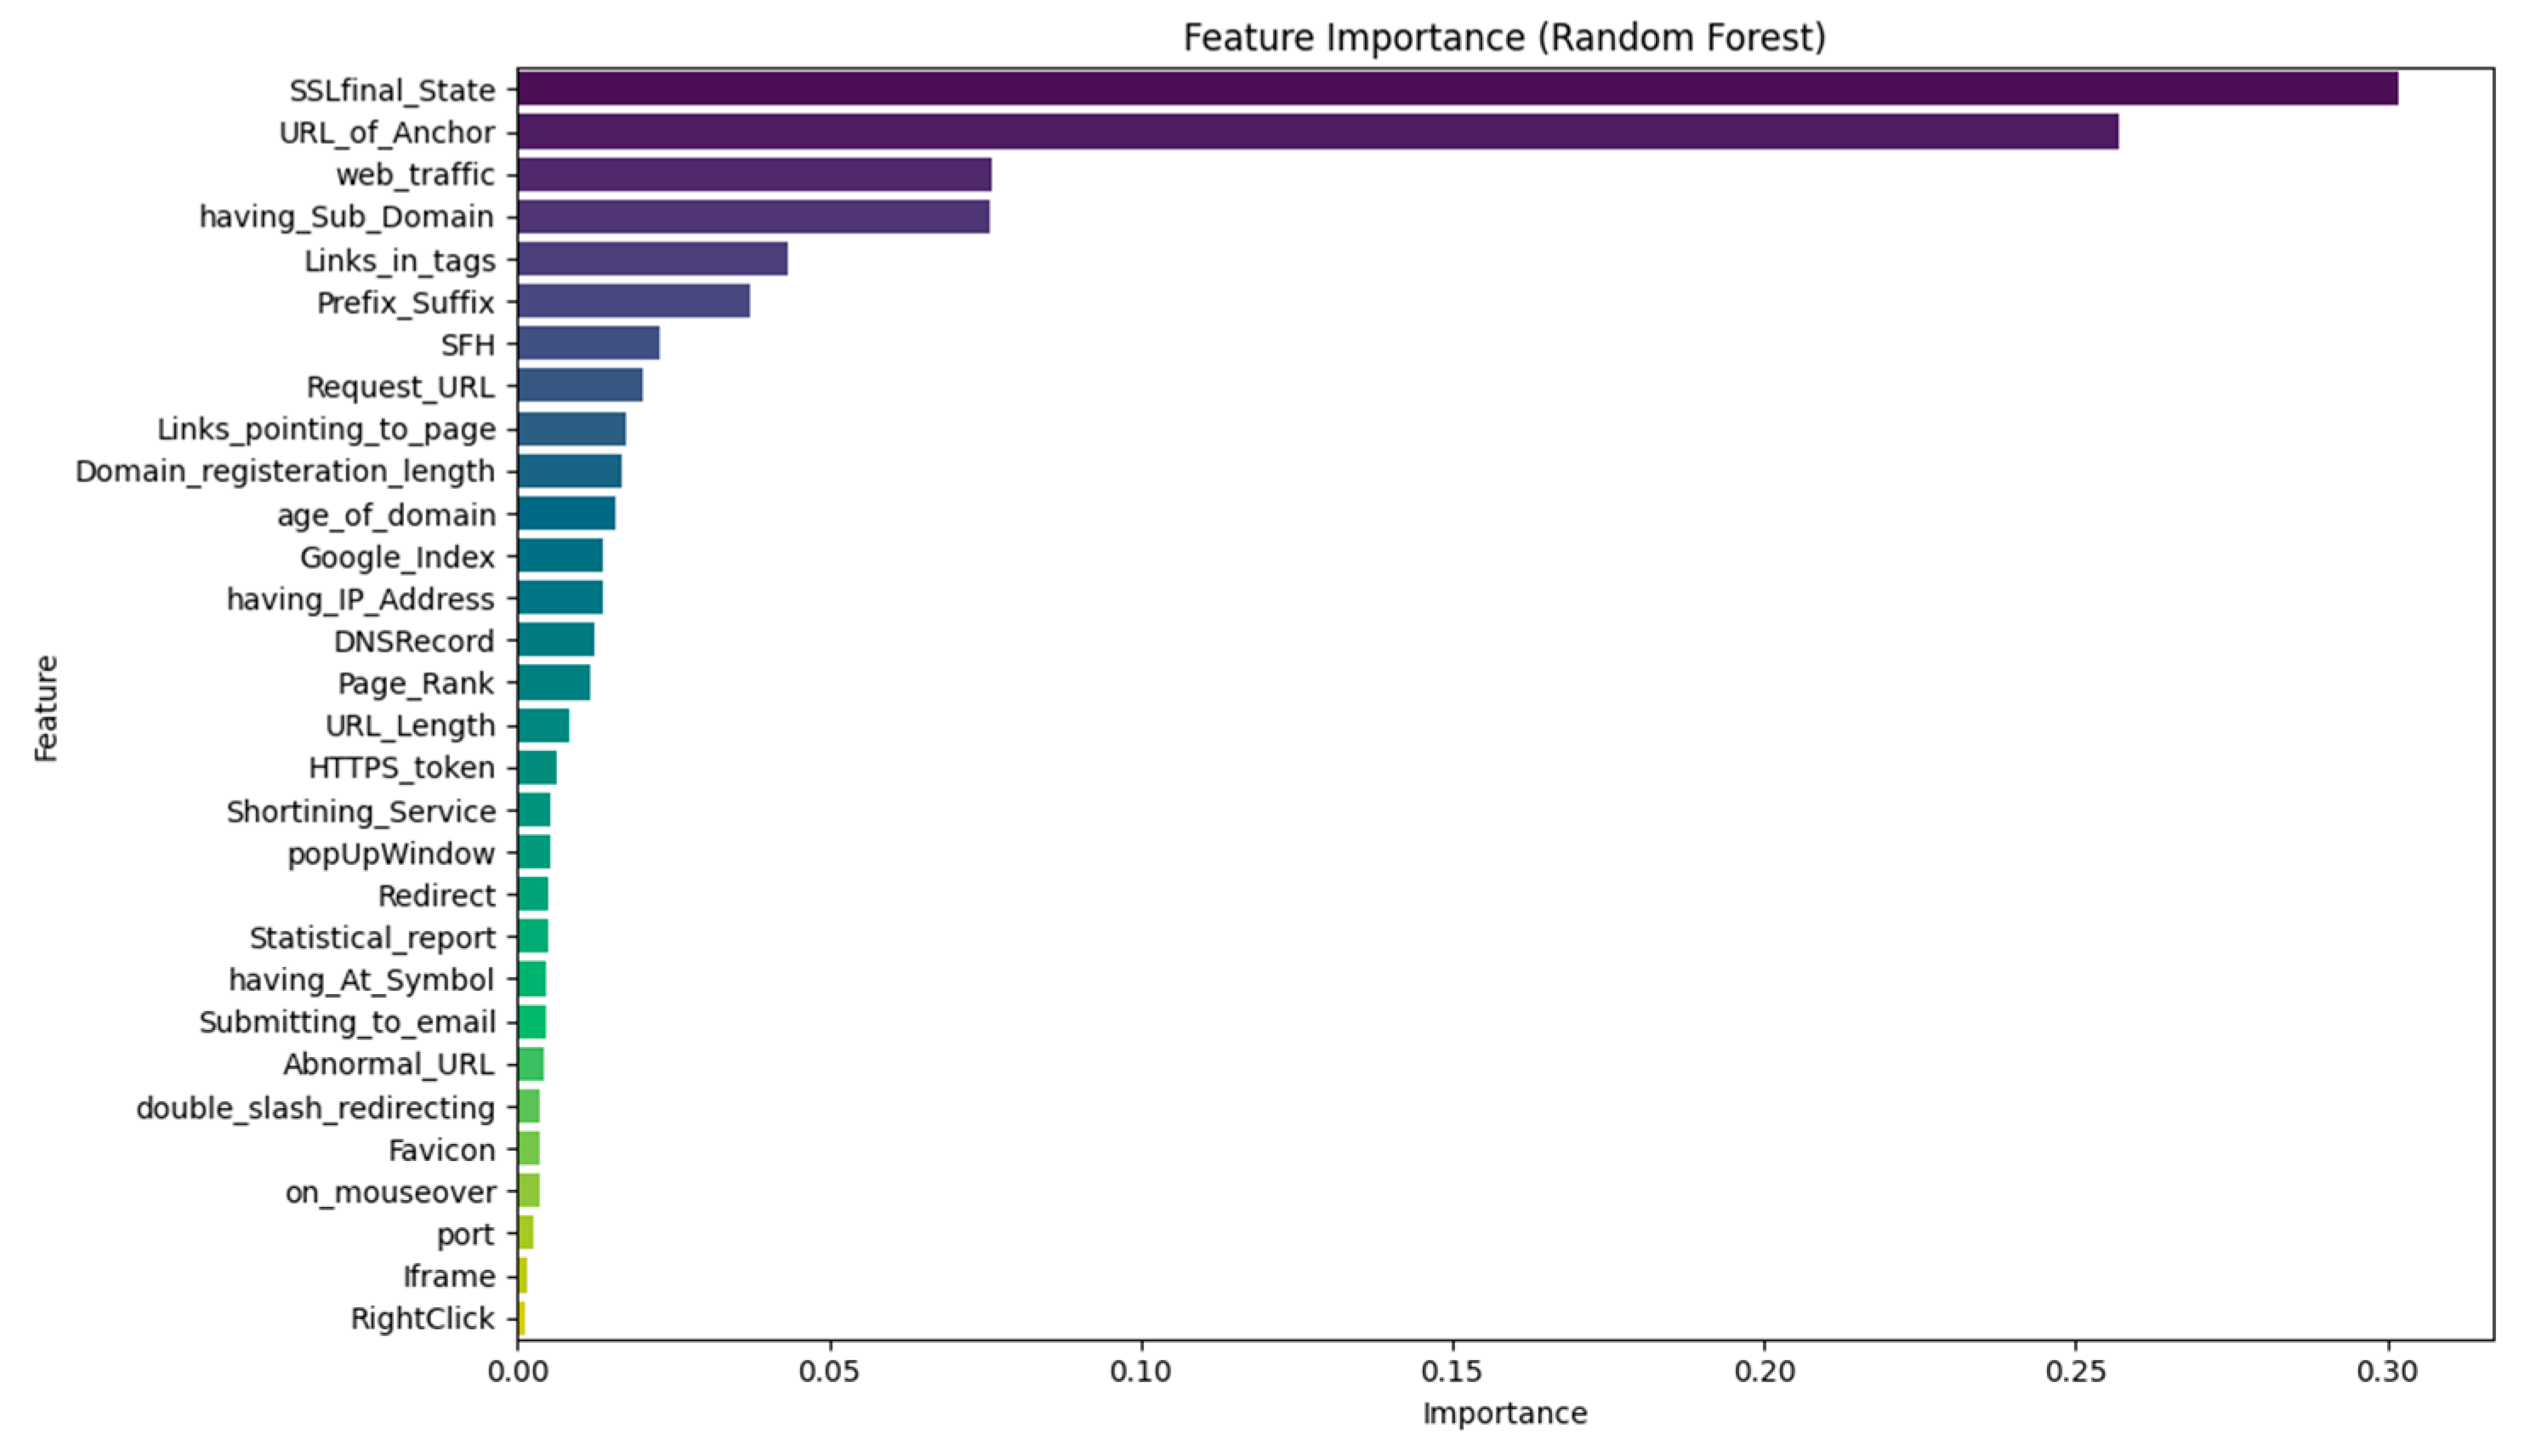
Figure 13.
SHAP summary (beeswarm) plot displaying the influence of each feature on the model’s output. Features are ordered by importance, with color gradients showing feature values (red for high, blue for low), and SHAP values indicating the size and direction of their effect on phishing classification.
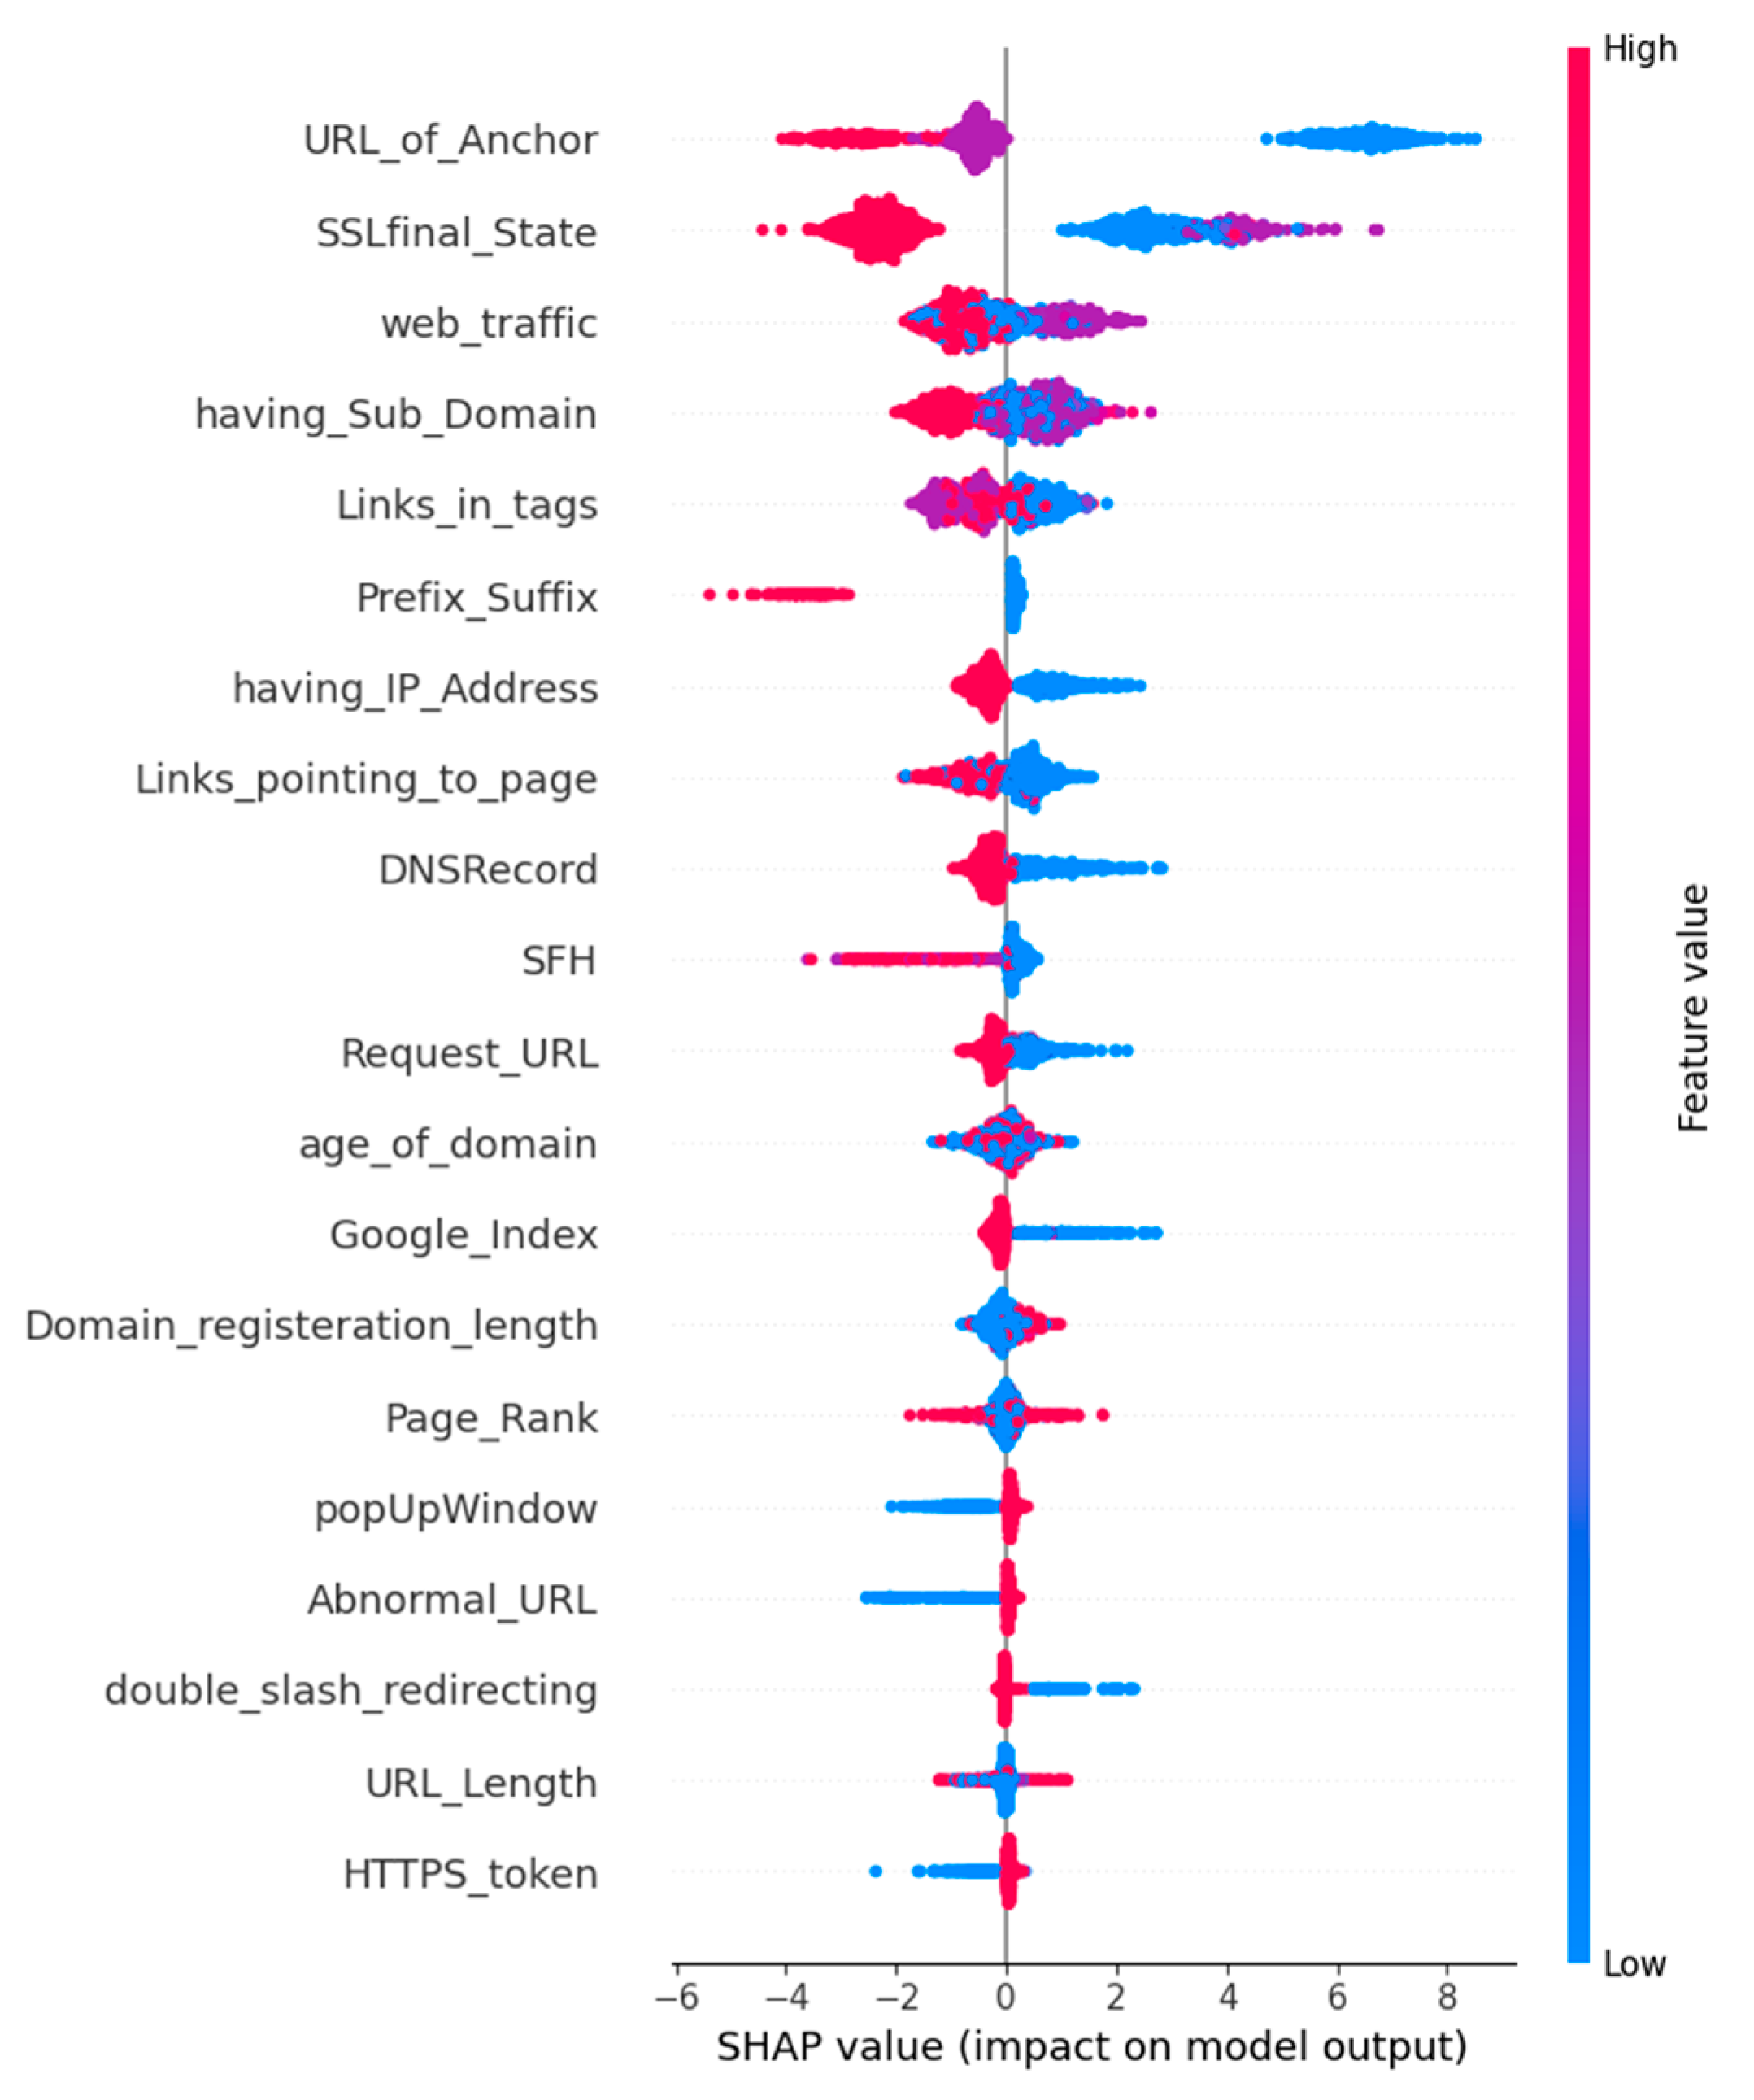
Figure 14.
SHAP force plot showing a local explanation of a single instance classified by the XGBoost model.
Figure 14.
SHAP force plot showing a local explanation of a single instance classified by the XGBoost model.
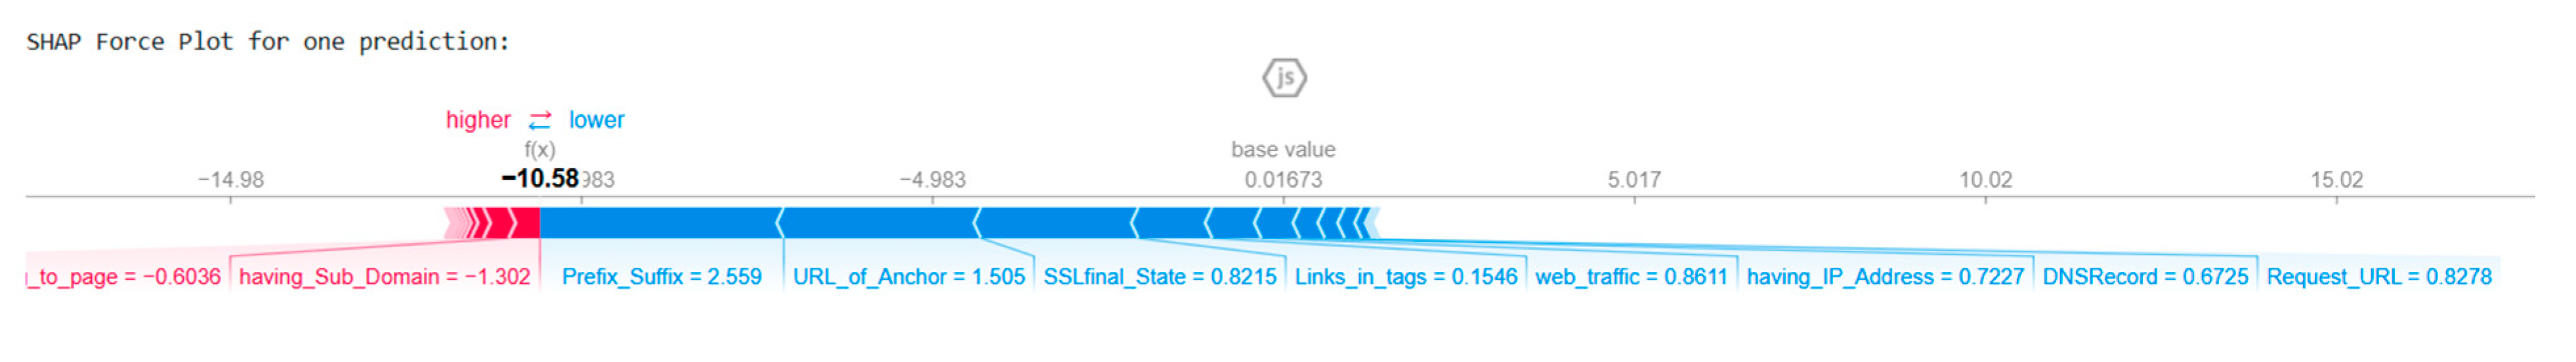
Figure 15.
McNemar’s test results compare the prediction outcomes between the Random Forest (RF) and Voting Ensemble (VE) models, showing the number of samples where both models were correct, incorrect, or differed in correctness, to evaluate the statistical significance of performance differences.
Figure 15.
McNemar’s test results compare the prediction outcomes between the Random Forest (RF) and Voting Ensemble (VE) models, showing the number of samples where both models were correct, incorrect, or differed in correctness, to evaluate the statistical significance of performance differences.
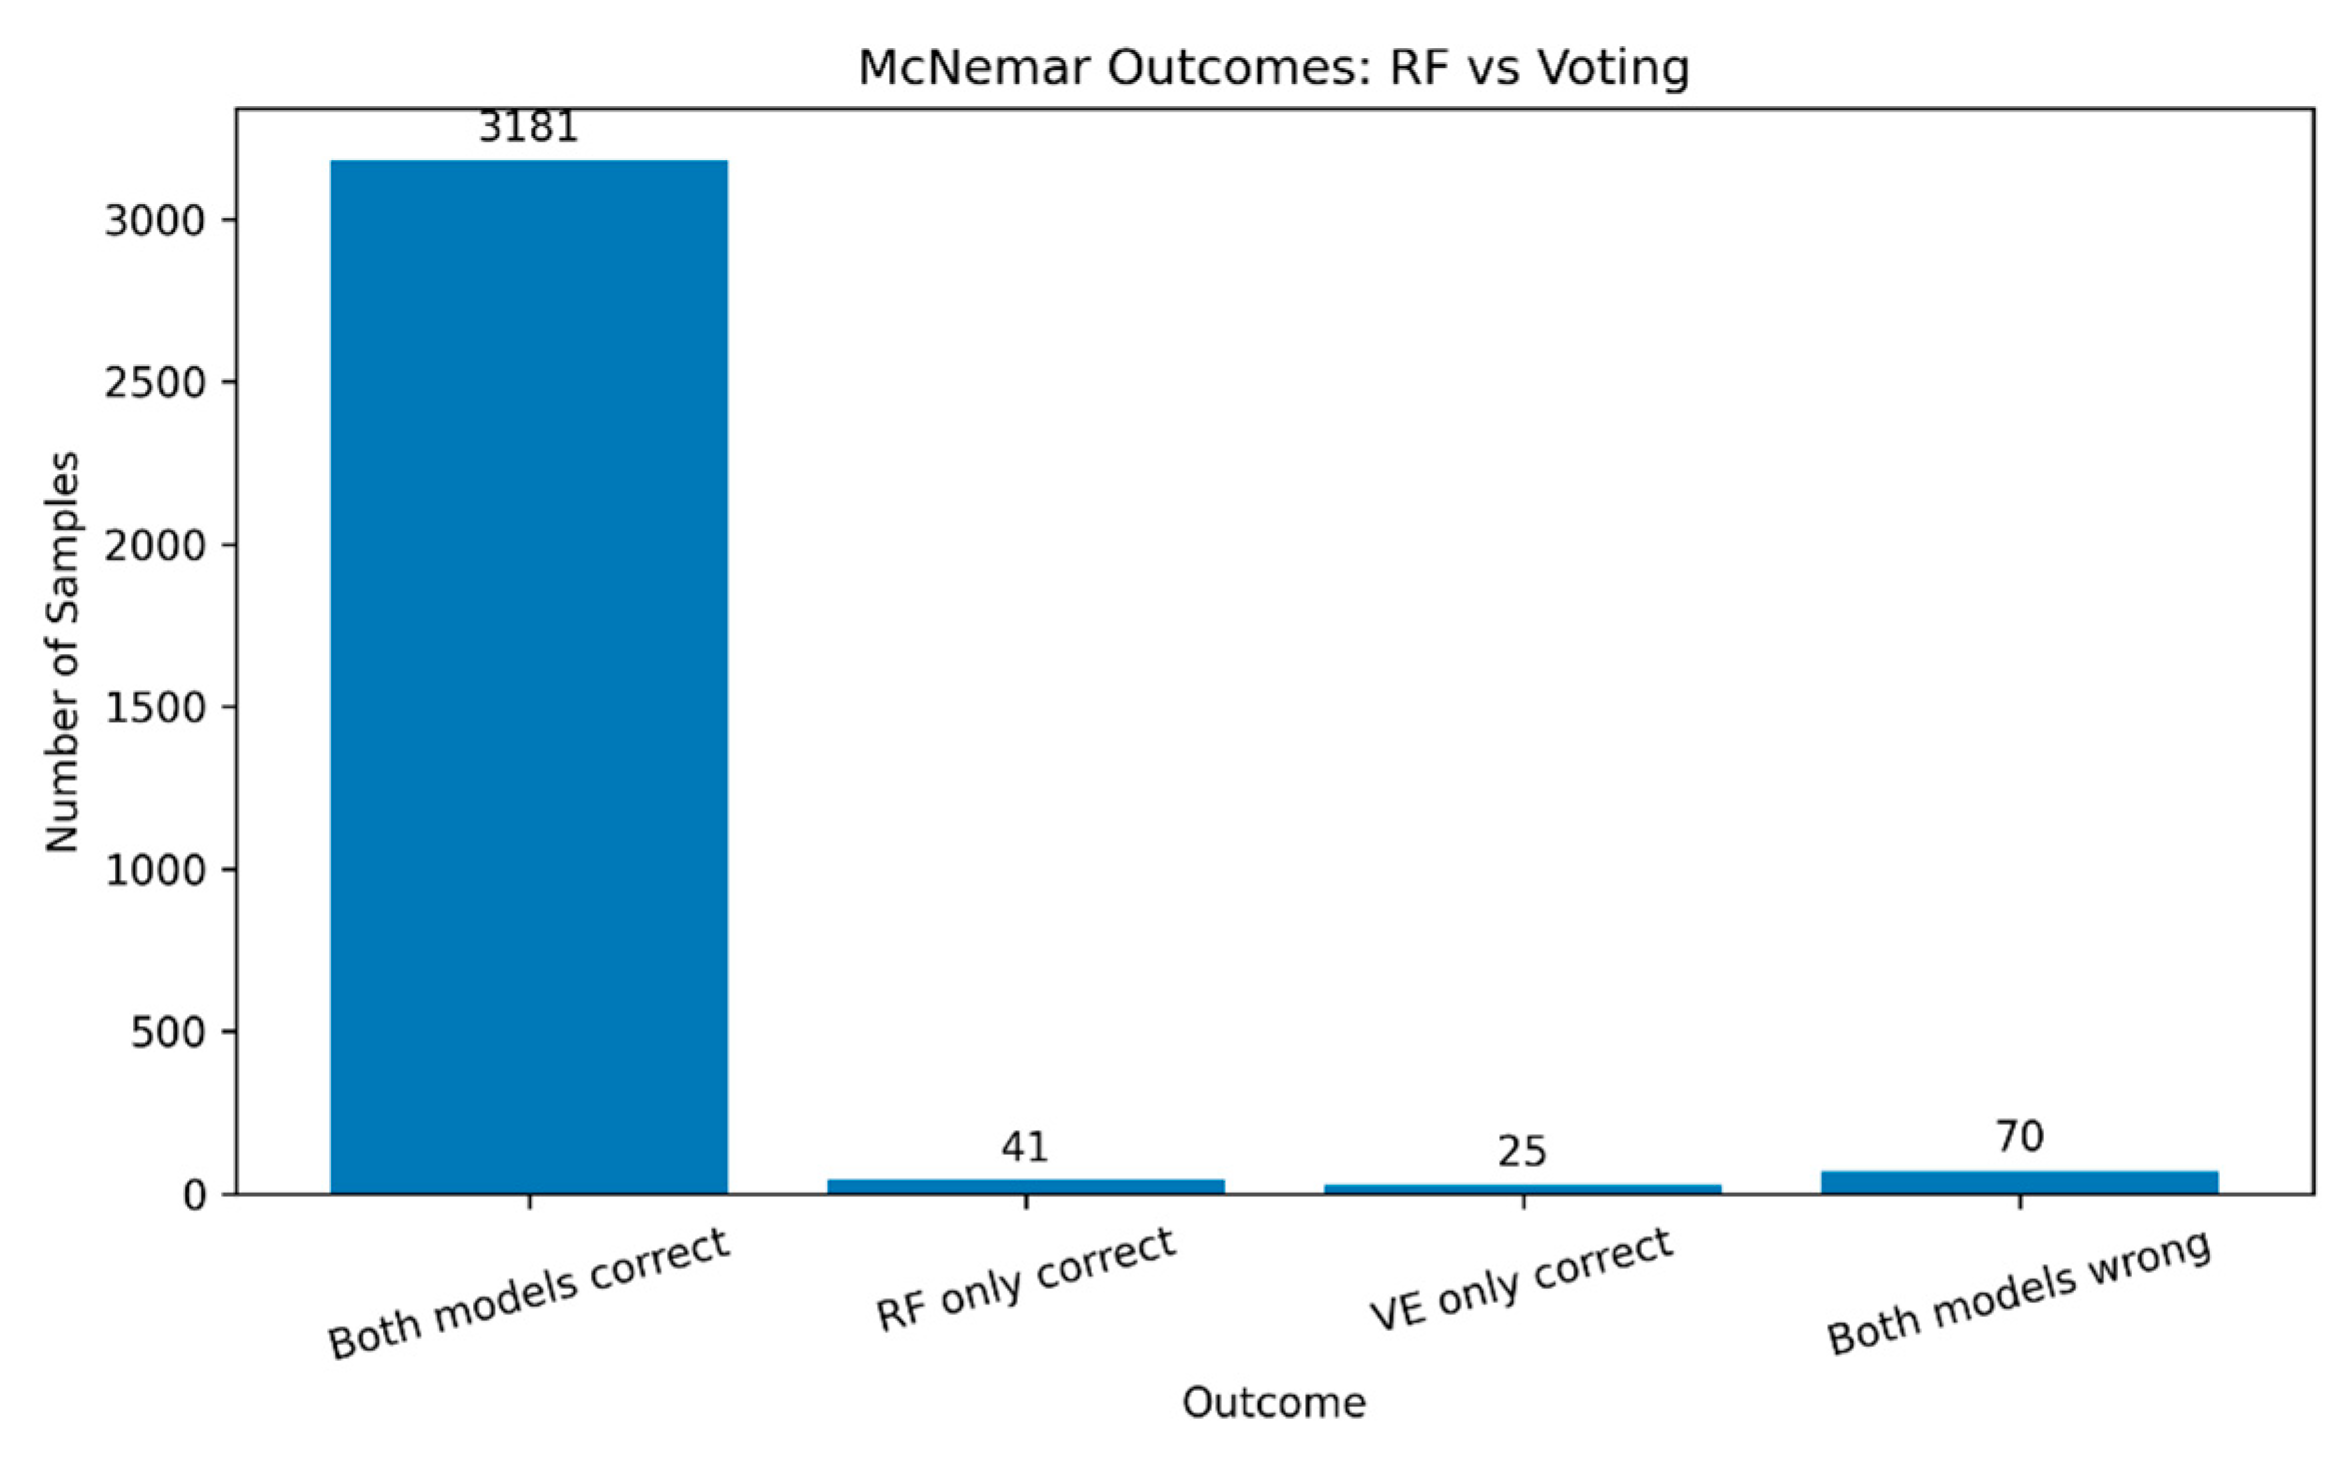
Table 1.
Summary of related studies on malicious URL detection, highlighting methodologies, study objectives, input features, and identified research gaps.
Table 1.
Summary of related studies on malicious URL detection, highlighting methodologies, study objectives, input features, and identified research gaps.
| Ref. | Methodology (Machine Learning or AI Module) | Study Objectives | Input Features | Research Gap (Limitation) |
|---|---|---|---|---|
| [44] | Deep Learning (Convolutional Neural Networks) | Design and develop a deep learning-based phishing detection solution leveraging URL and website content (images, text, frames). | These include URL features, website images, text content, and frames. | The computational complexity of deep learning might limit its application in resource-constrained environments. |
| [45] | Deep Learning (Recurrent Neural Networks) | Achieve high accuracy in detecting malicious URLs using RNNs, focusing solely on URL text. | URL text. | The system is limited to URL text analysis and may not detect phishing sites with benign-looking URLs but malicious content. |
| [47] | Explainable AI, Large Language Models | Develop an AI framework for real-time phishing detection with enhanced interpretability to build user trust. | Not specified. | Preliminary results require further validation in real-world scenarios. |
| [48] | Swarm Intelligence (Binary Bat Algorithm), Deep Learning | Propose a deep learning-based swarm intelligence-binary bat algorithm for detecting phishing URLs. | URL features. | Computational complexity may hinder real-time applications. |
| [49] | Deep Learning (CNN, LSTM) | Compare different feature combinations (lexical, character-level, and word-level embeddings) for phishing URL classification. | These include lexical features, character-level embeddings, and word-level embeddings. | The computational complexity of deep learning might limit its application in resource-constrained environments. |
| [13] | Machine Learning (Random Forest, Decision Tree, XGBoost) | Compare the performance of various machine learning algorithms in detecting phishing websites. | Website features. | The study is limited to specific algorithms and may not reflect the performance of other models. |
Table 2.
Categorization of dataset features utilized in the study, grouped into behavioral, URL-based, domain-specific, webpage-based, and traffic and search engine-based attributes.
Table 2.
Categorization of dataset features utilized in the study, grouped into behavioral, URL-based, domain-specific, webpage-based, and traffic and search engine-based attributes.
| Features Category | Features |
|---|---|
| Behavioral | ‘on_mouseover,’ ‘RightClick,’ ‘popUpWindnow,’ ‘Iframe’ |
| URL-based | ‘having_IP_Address,’ ‘URL_Length,’ ‘Shortening_Service,’ ‘having_At_Symbol,’ ‘double_slash_redirecting,’ ‘Prefix_Suffix’ |
| Domain | ‘having_Sub_Domain,’ ‘SSLfinal_State,’ ‘Domain_registeration_length,’ ‘age_of_domain,’ DNSRecord’ |
| Webpage-based | ‘Favicon,’ ‘port,’ HTTPS_token,’ Request_URL,’ ‘URL_of_Anchor,’ ‘Links_in_tags,’ ‘SFH,’ ‘Submitting_to_email,’ ‘Abnormal_URL,’ ‘Redirect’ |
| Traffic & Search Engine | ‘web_traffic,’ ‘Page_Rank,’ ‘Google_Index,’ ‘Links_pointing_to_page,’ ‘Statistical_report’ |
Table 5.
Phishing Detection Baseline Comparison Table.
| Model | Behavioral Only | Structural Only | Combined | |||
|---|---|---|---|---|---|---|
| Accuracy | Macro F1 | Accuracy | Macro F1 | Accuracy | Macro F1 | |
| Random Forest | 0.50 | 0.40 | 0.91 | 0.91 | 0.97 | 0.97 |
| XGBoost | 0.50 | 0.40 | 0.91 | 0.91 | 0.97 | 0.97 |
| Gradient Boosting | 0.50 | 0.40 | 0.90 | 0.90 | 0.94 | 0.94 |
| Logistic Regression | 0.50 | 0.40 | 0.88 | 0.88 | 0.91 | 0.91 |
Table 6.
Training and Testing Duration of Stacked Ensemble Models.
| Model | Meta-Learner | Training Time (s) | Testing Time (s) |
|---|---|---|---|
| Stacked A | Logistic Regression | 9.87 | 0.11 |
| Stacked B | Support Vector Classifier (SVC) | 12.15 | 0.31 |
Table 7.
Comparative analysis of the proposed phishing detection model against selected recent studies. The table highlights differences in dataset origin, dataset type, detection techniques, and reported evaluation metrics.
Table 7.
Comparative analysis of the proposed phishing detection model against selected recent studies. The table highlights differences in dataset origin, dataset type, detection techniques, and reported evaluation metrics.
| Reference | Dataset | Dataset Description | Technique | Evaluation metrics | |
|---|---|---|---|---|---|
| F1-score (%) | Accuracy (%) | ||||
| [44] | PhishTank, Common Crawl, OpenPhish | Uses URL, text, images, frame content (per paper) | Hybrid deep learning (CNN & LSTM) | X | 93.28 |
| [45] | PhishTank, Common Crawl, OpenPhish | URL-based features only | Federated Learning + Deep NN | 90.50 | 90.50 |
| [13] | UCI Phishing Websites Dataset | Structured features from URLs | RF, DT, XGBoost | X |
94.57 – 96.89 |
| [48] | PhishTank, Alexa, UNB ISCX 2016 | Character-level URL features only | Deep learning (1D CNN) | X | 94.8 |
| [49] | PhishTank + public benign URL sources | Character & word-level embeddings; lexical features | Deep neural network (CNN + GRU, char & word embeddings) | X | 94.4 |
| [53] | UCI Phishing Websites Dataset | Structured features from URLs | Functional Tree | 96.1 | 96.07 |
| [54] | UCI Phishing Websites Dataset | Structured features from URLs | LR, KNN, SVM, NB, DT, RF and Gradient Boosting | 96.9 | 97.2 |
| [55] | UCI Phishing Websites Dataset | Structured features from URLs | DNN +Adam | X | 96 |
| Our study | UCI Phishing Dataset | Features include URL + behavioral metadata | Stacking, XGBoost, Random Forest | 97 | 97 |
Disclaimer/Publisher’s Note: The statements, opinions and data contained in all publications are solely those of the individual author(s) and contributor(s) and not of MDPI and/or the editor(s). MDPI and/or the editor(s) disclaim responsibility for any injury to people or property resulting from any ideas, methods, instructions or products referred to in the content. |
© 2025 by the authors. Licensee MDPI, Basel, Switzerland. This article is an open access article distributed under the terms and conditions of the Creative Commons Attribution (CC BY) license (https://creativecommons.org/licenses/by/4.0/).
Copyright: This open access article is published under a Creative Commons CC BY 4.0 license, which permit the free download, distribution, and reuse, provided that the author and preprint are cited in any reuse.


