Submitted:
22 November 2025
Posted:
24 November 2025
You are already at the latest version
Abstract
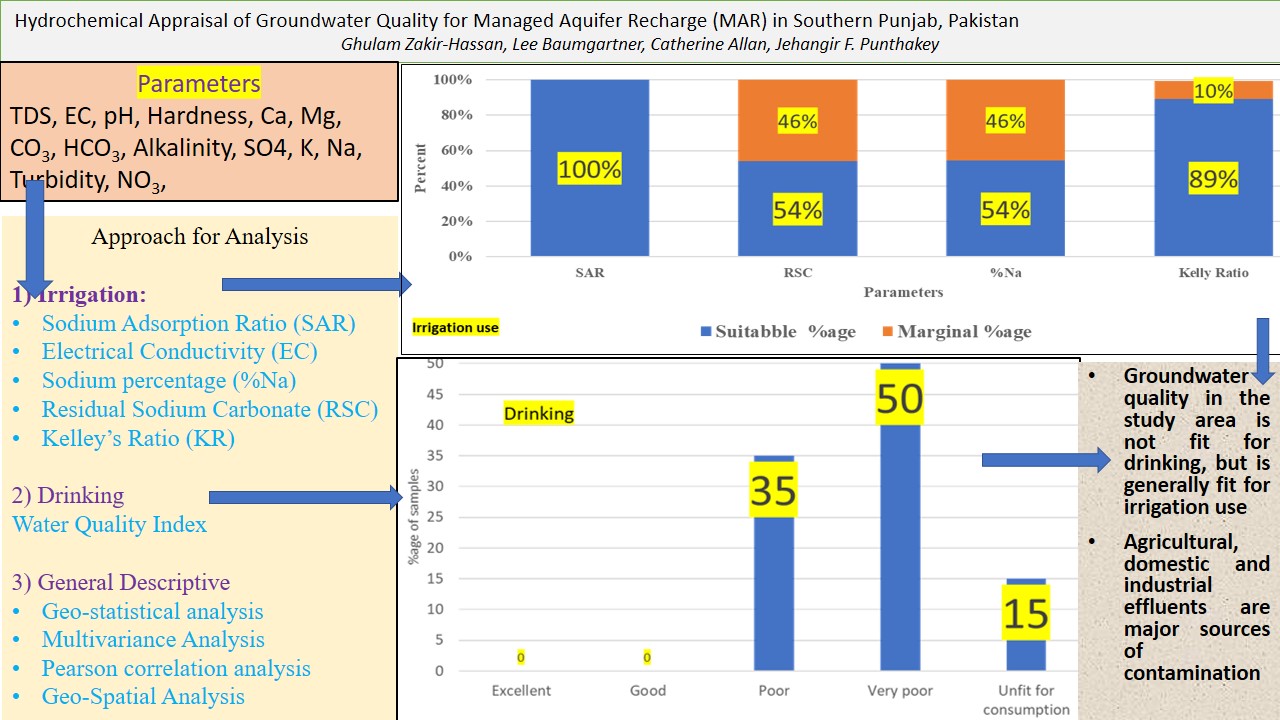
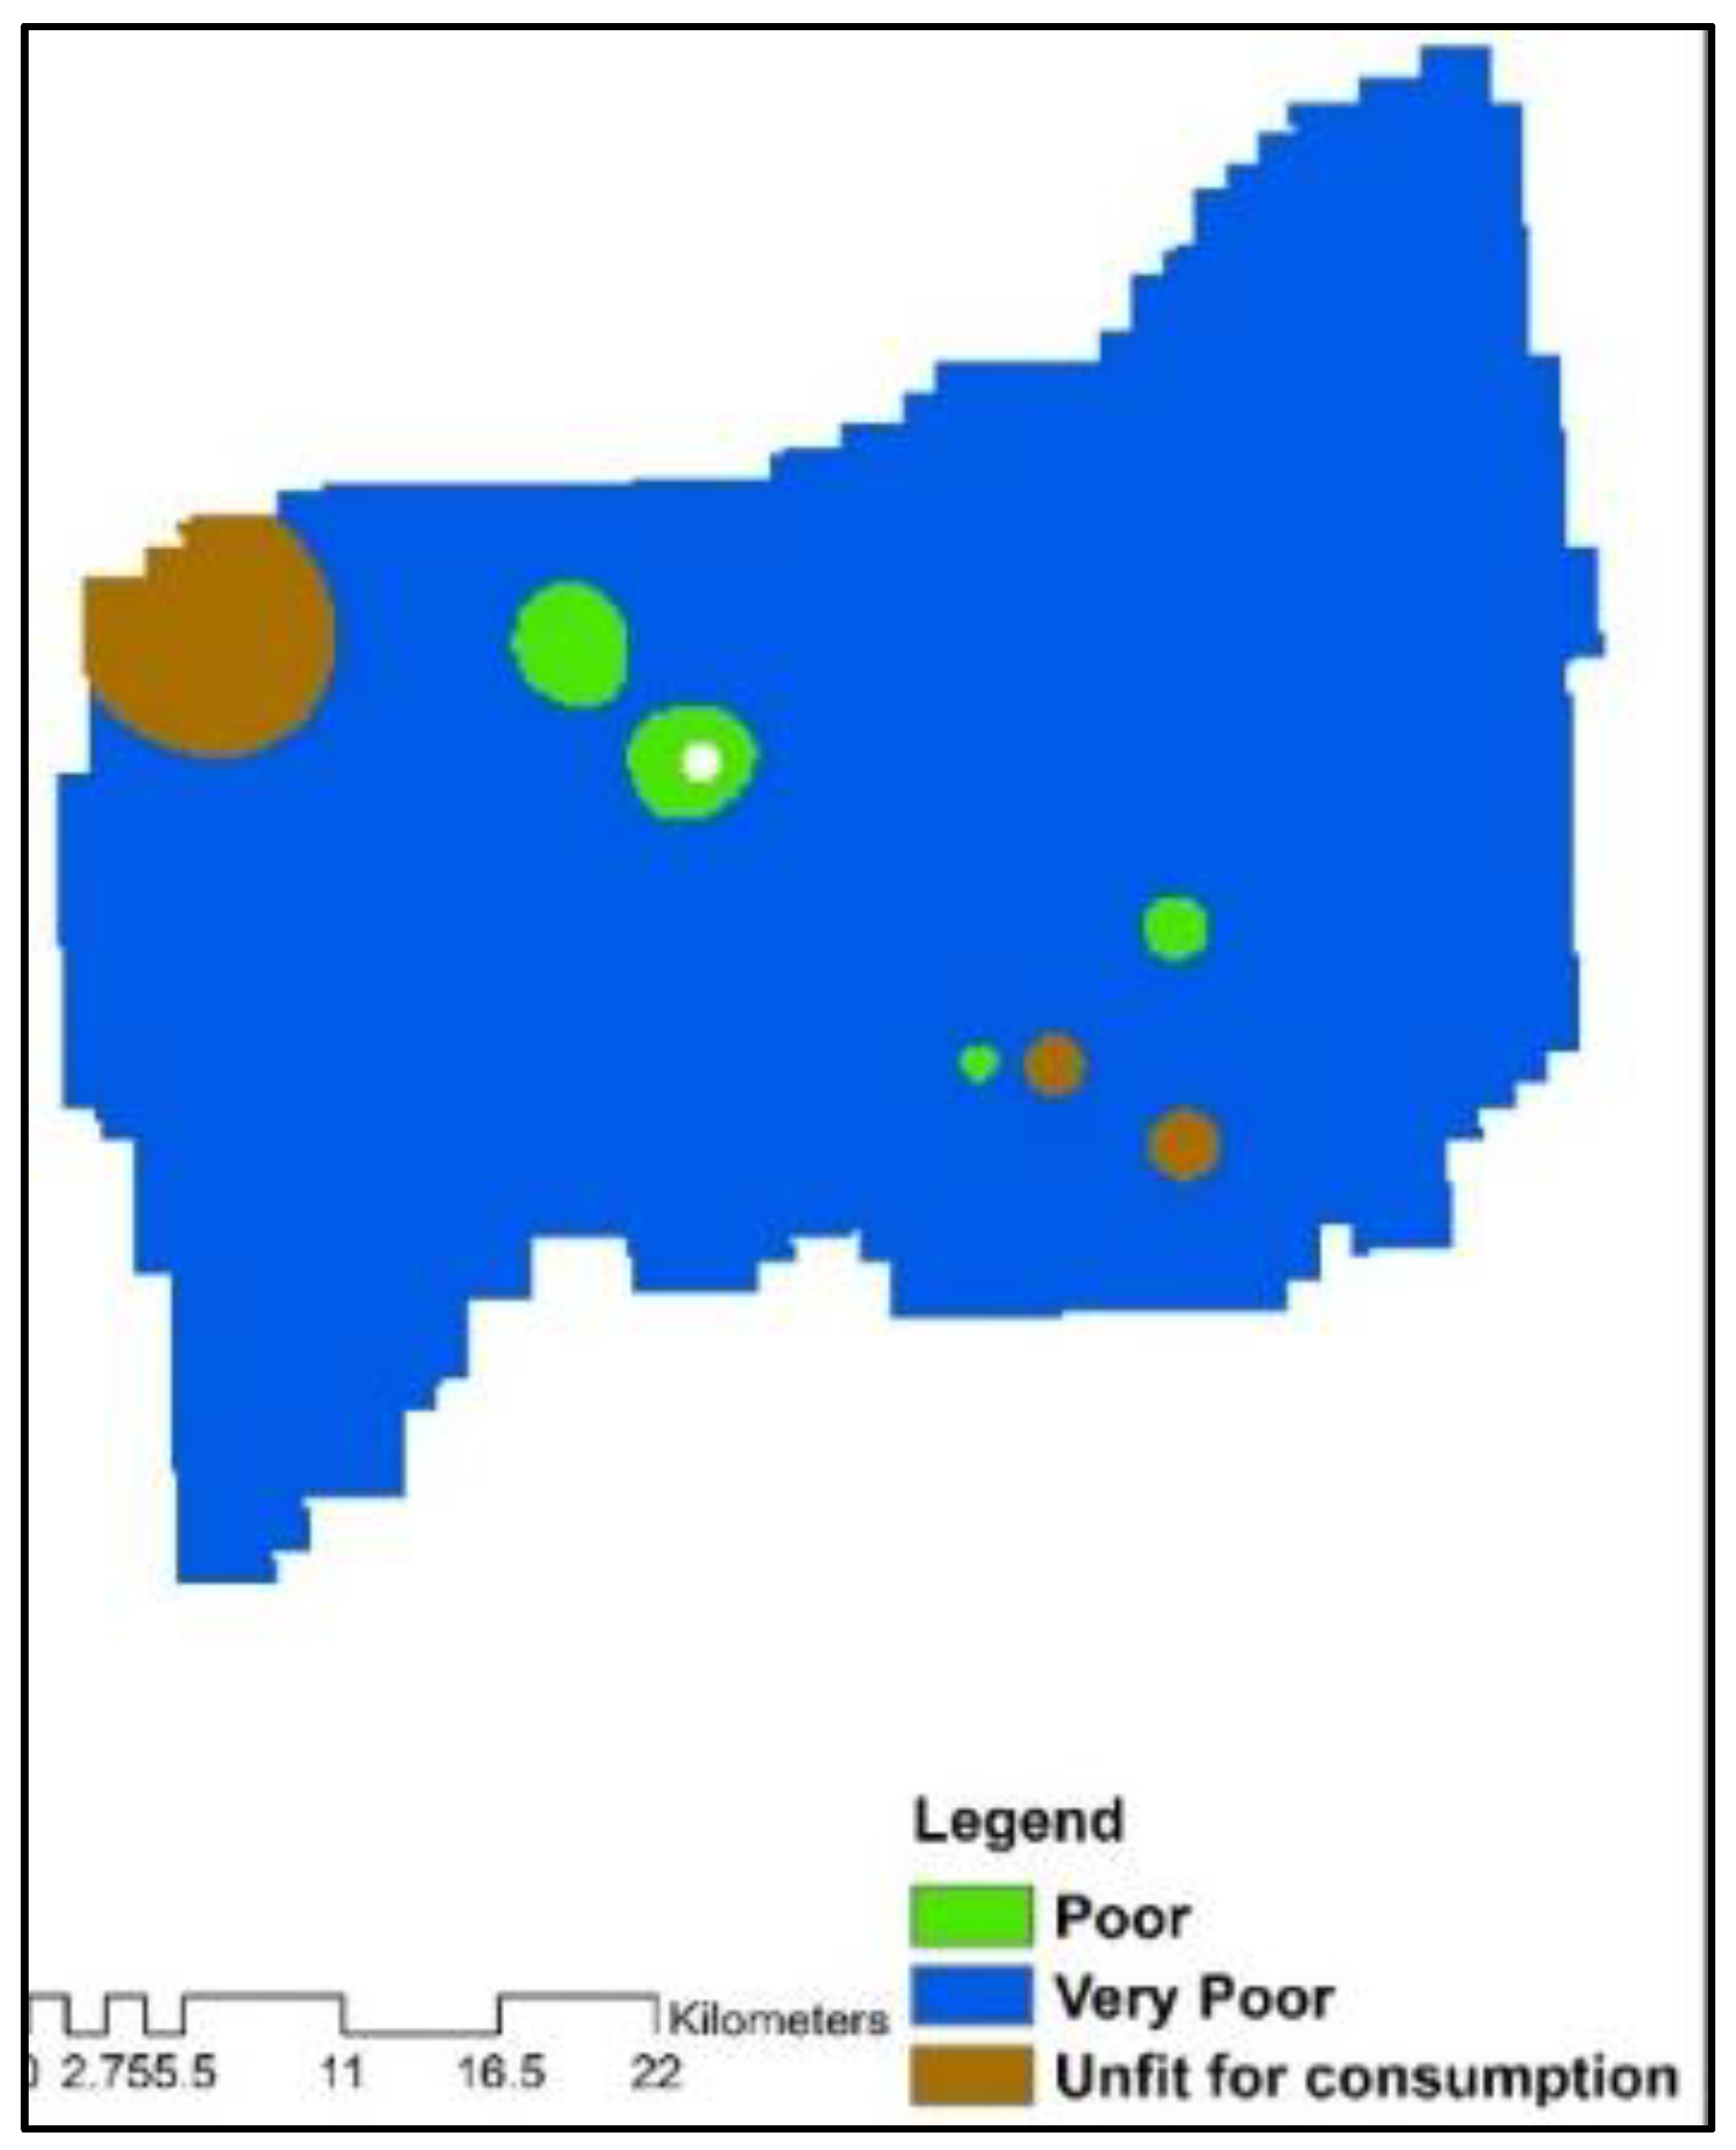
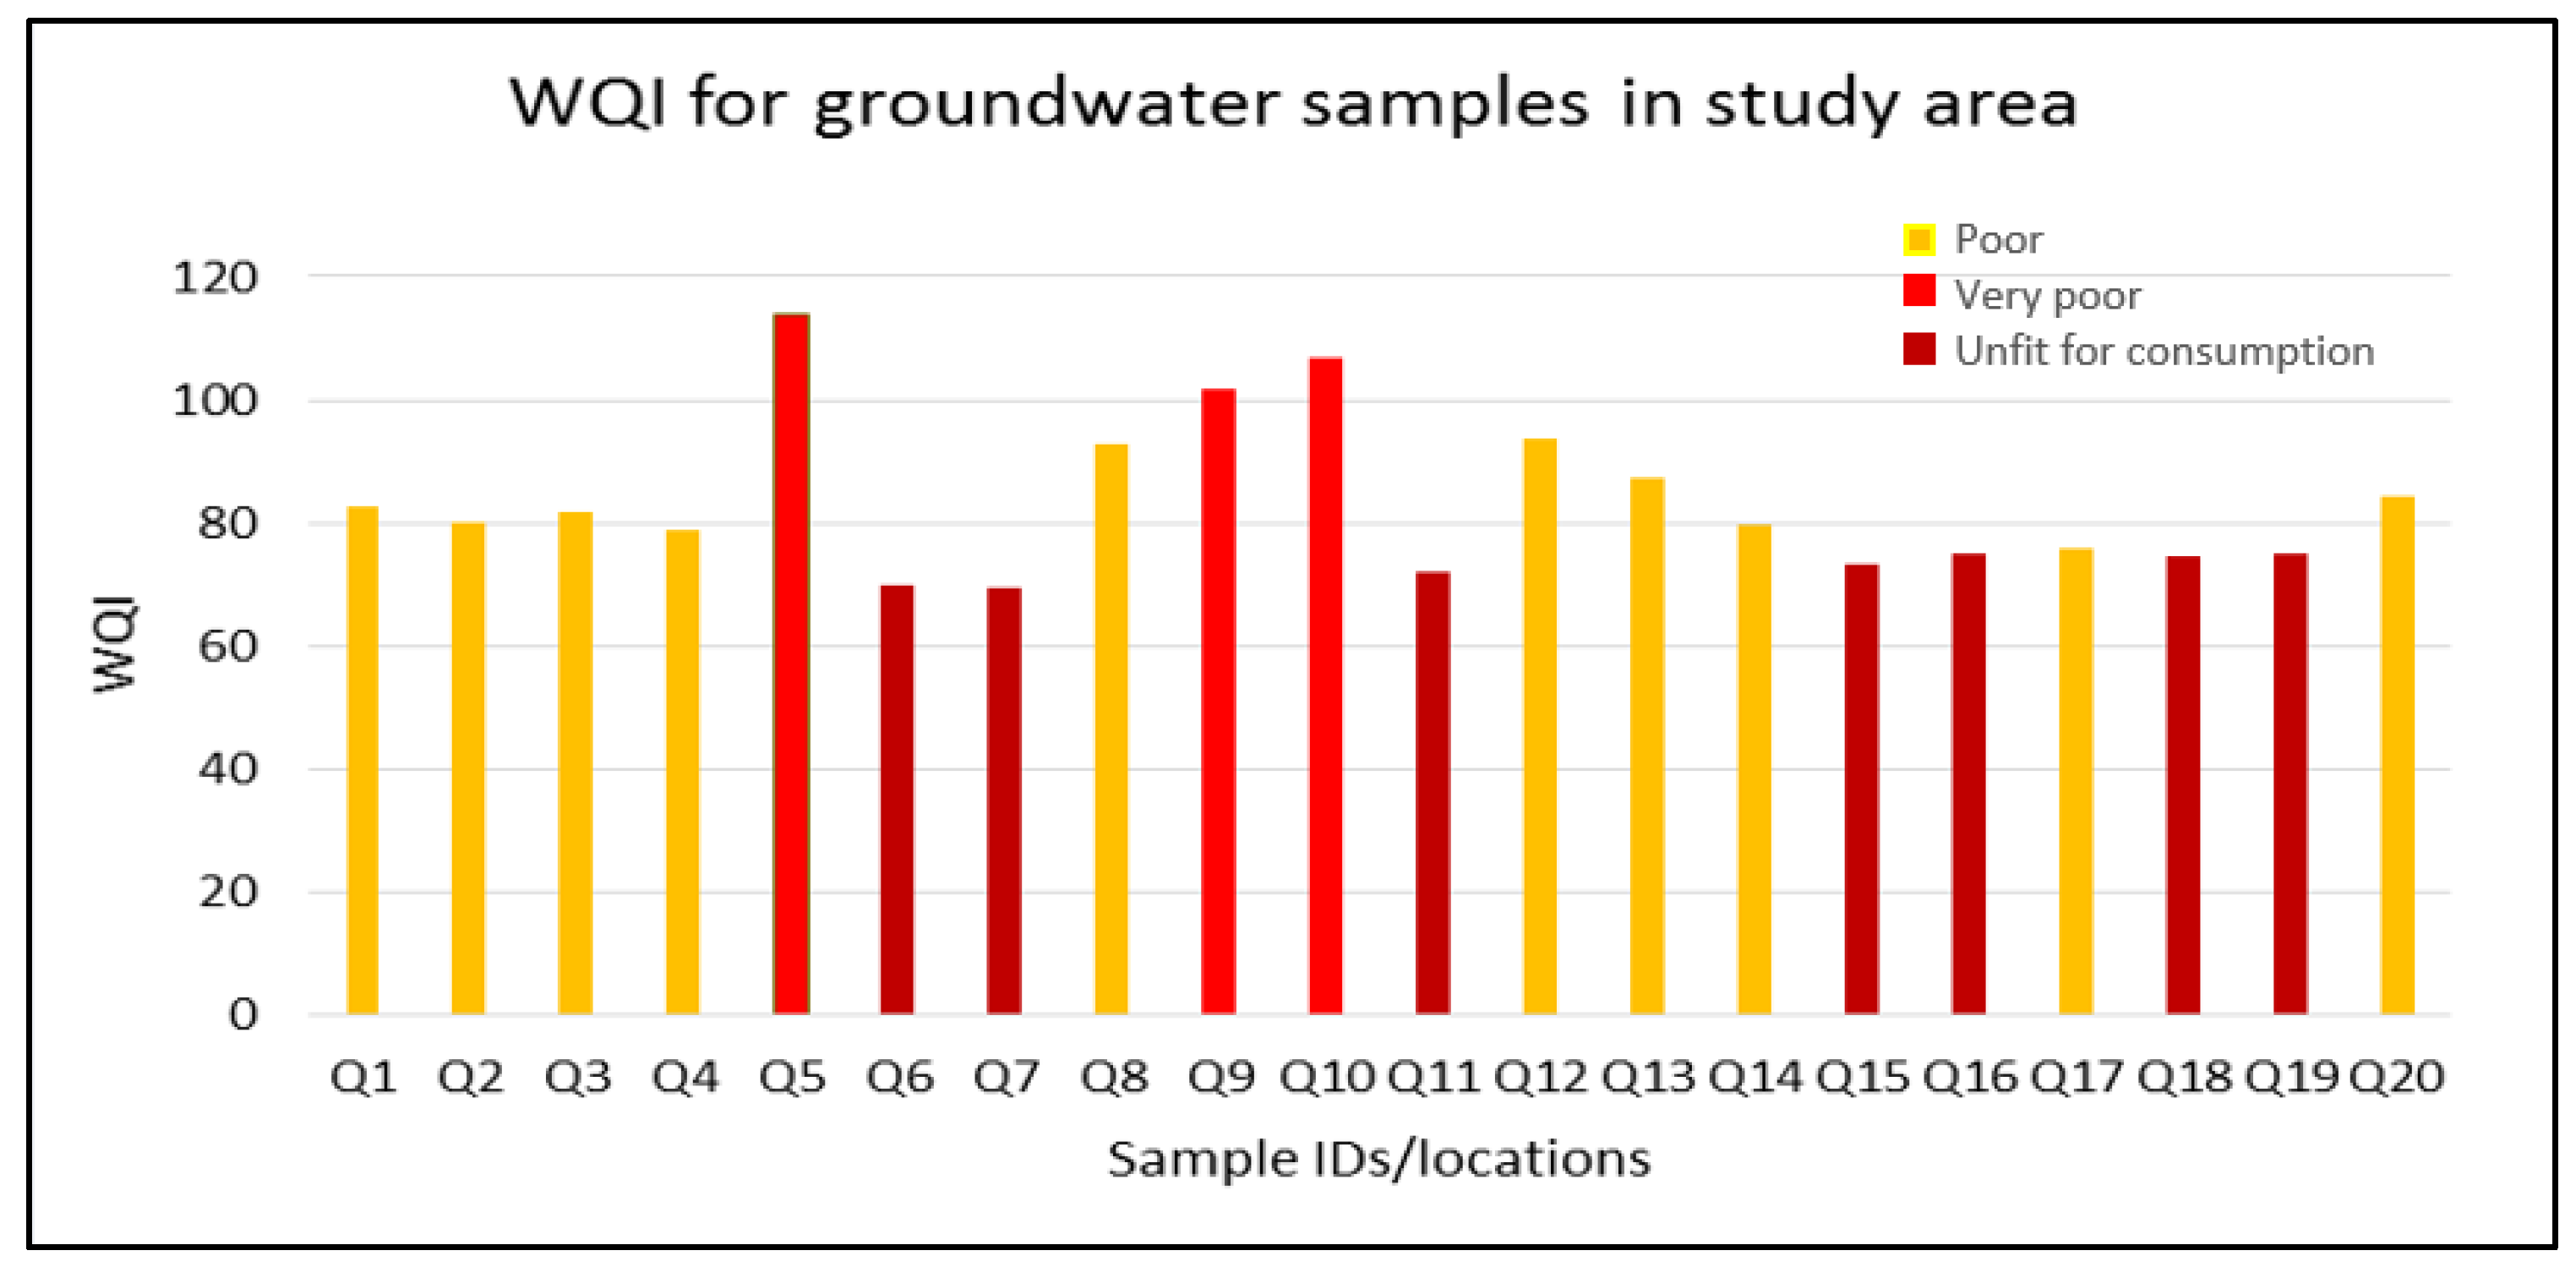
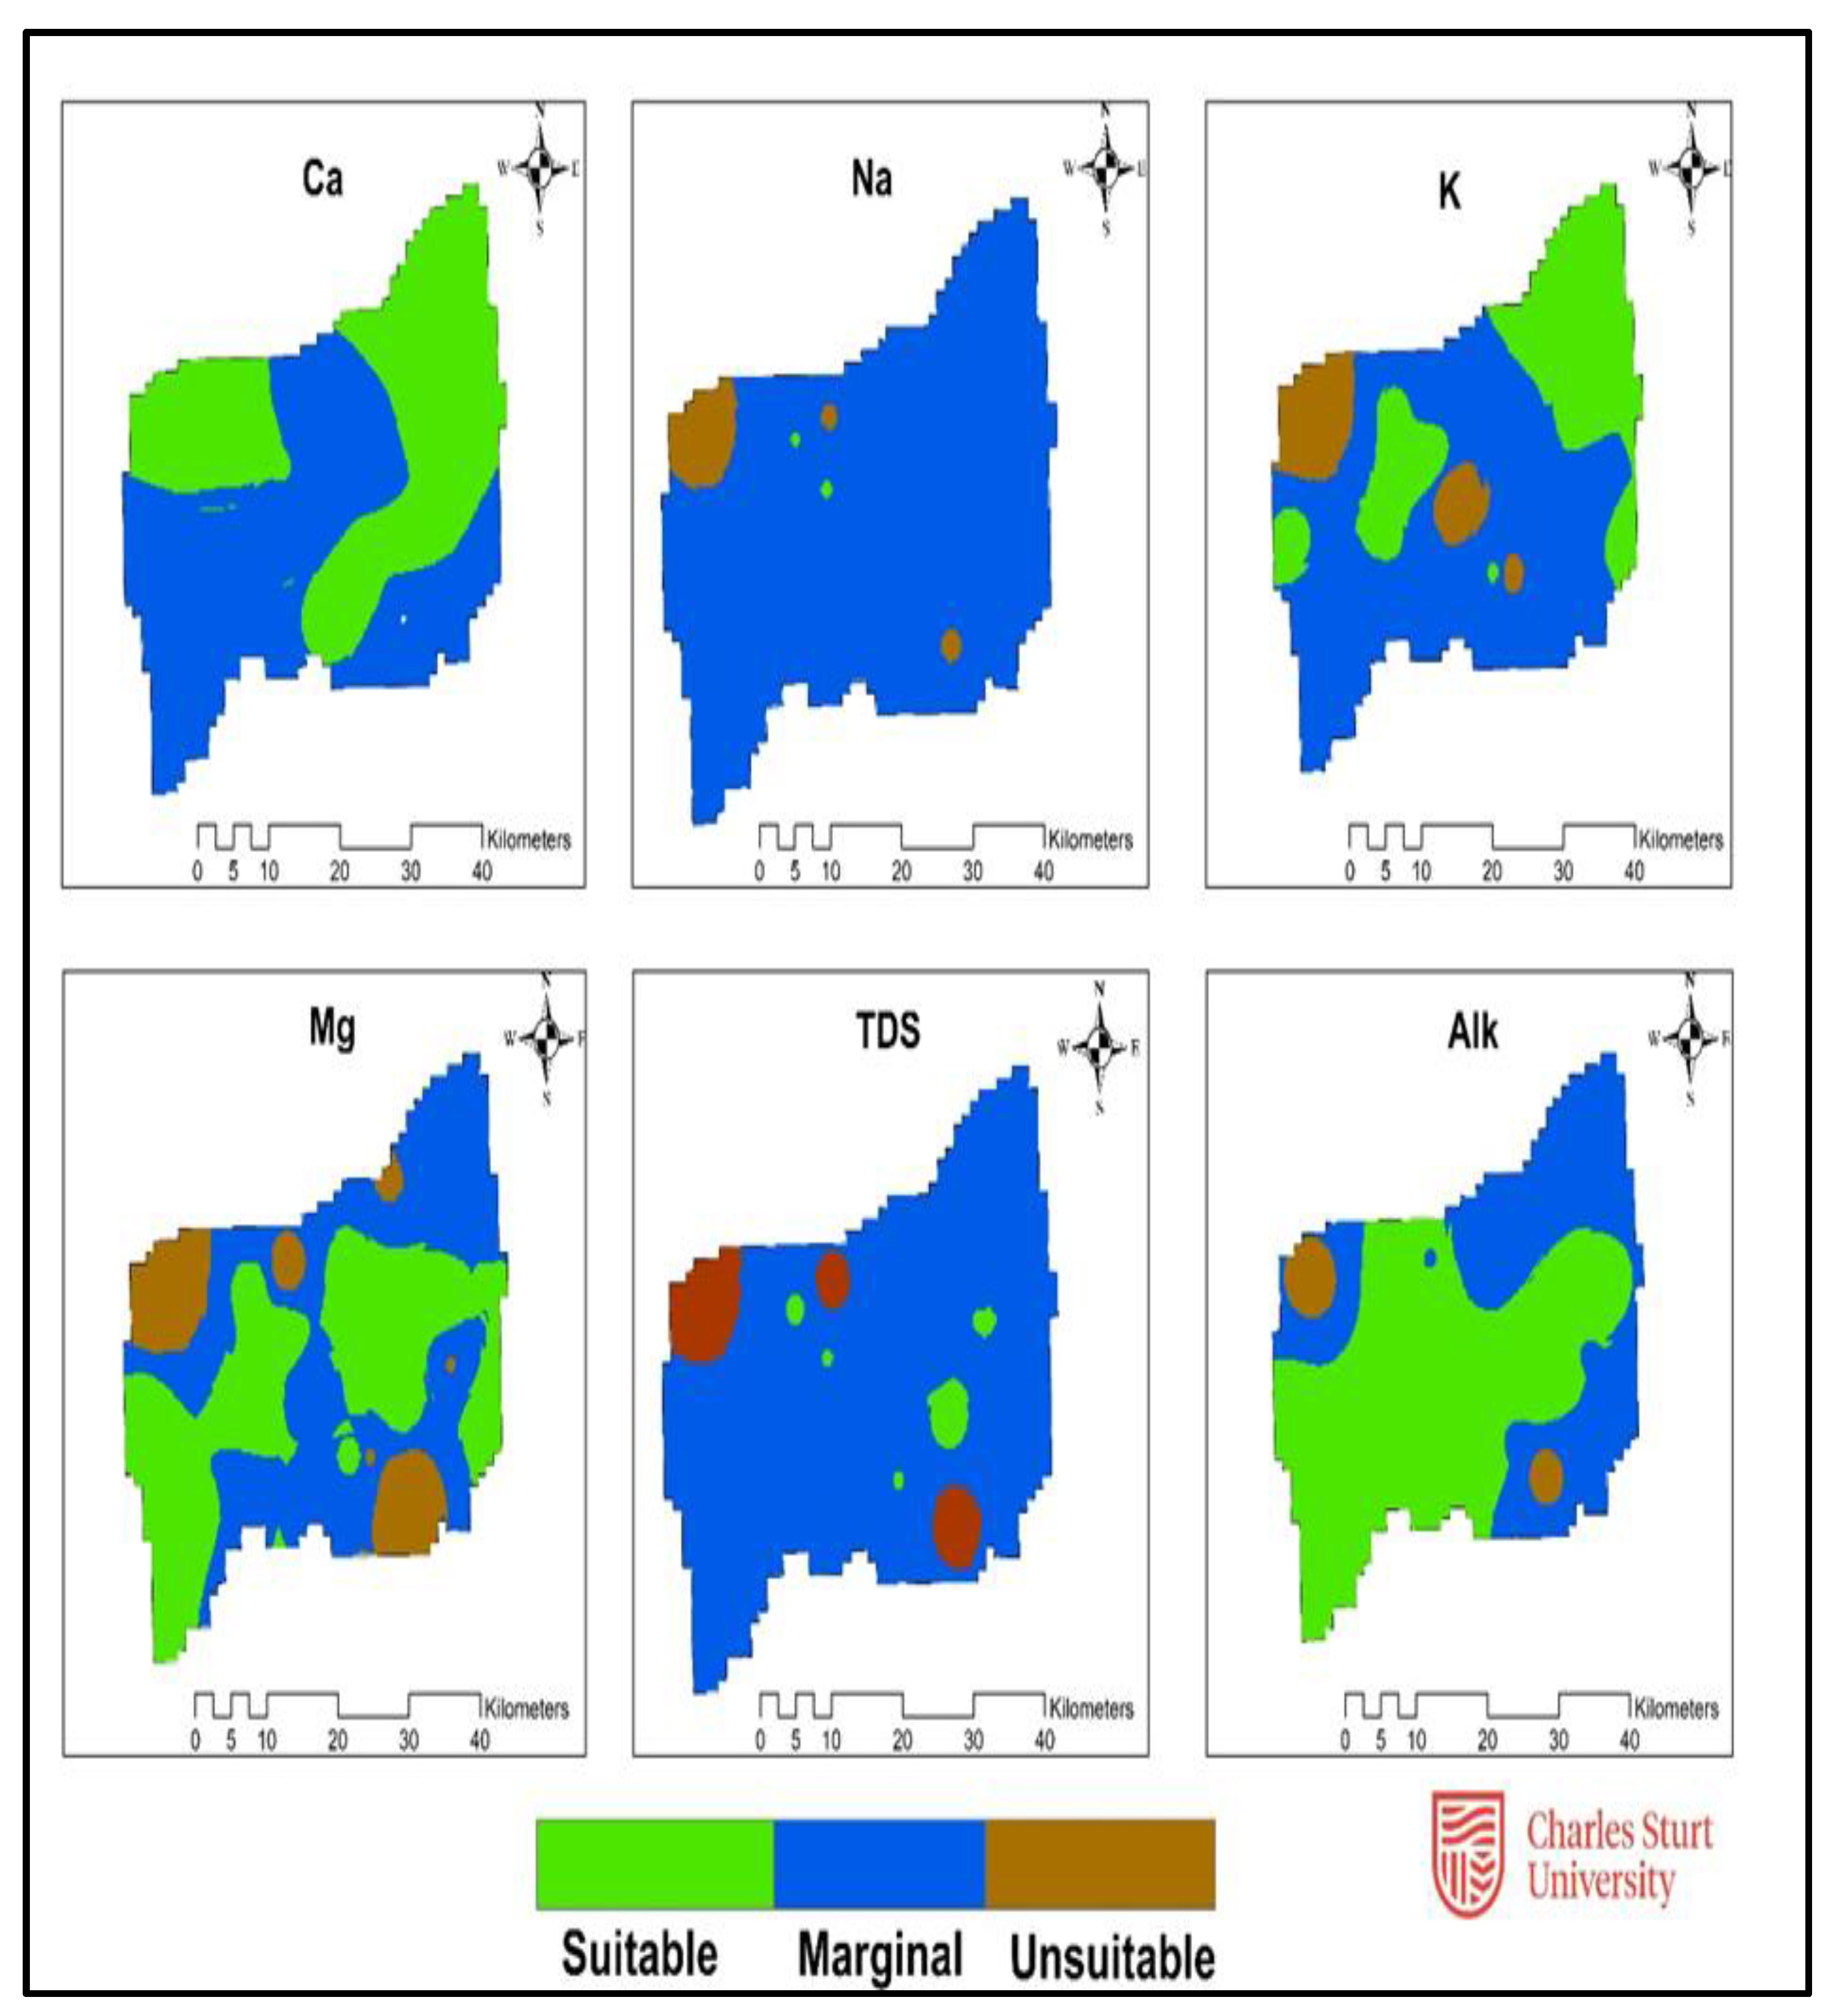
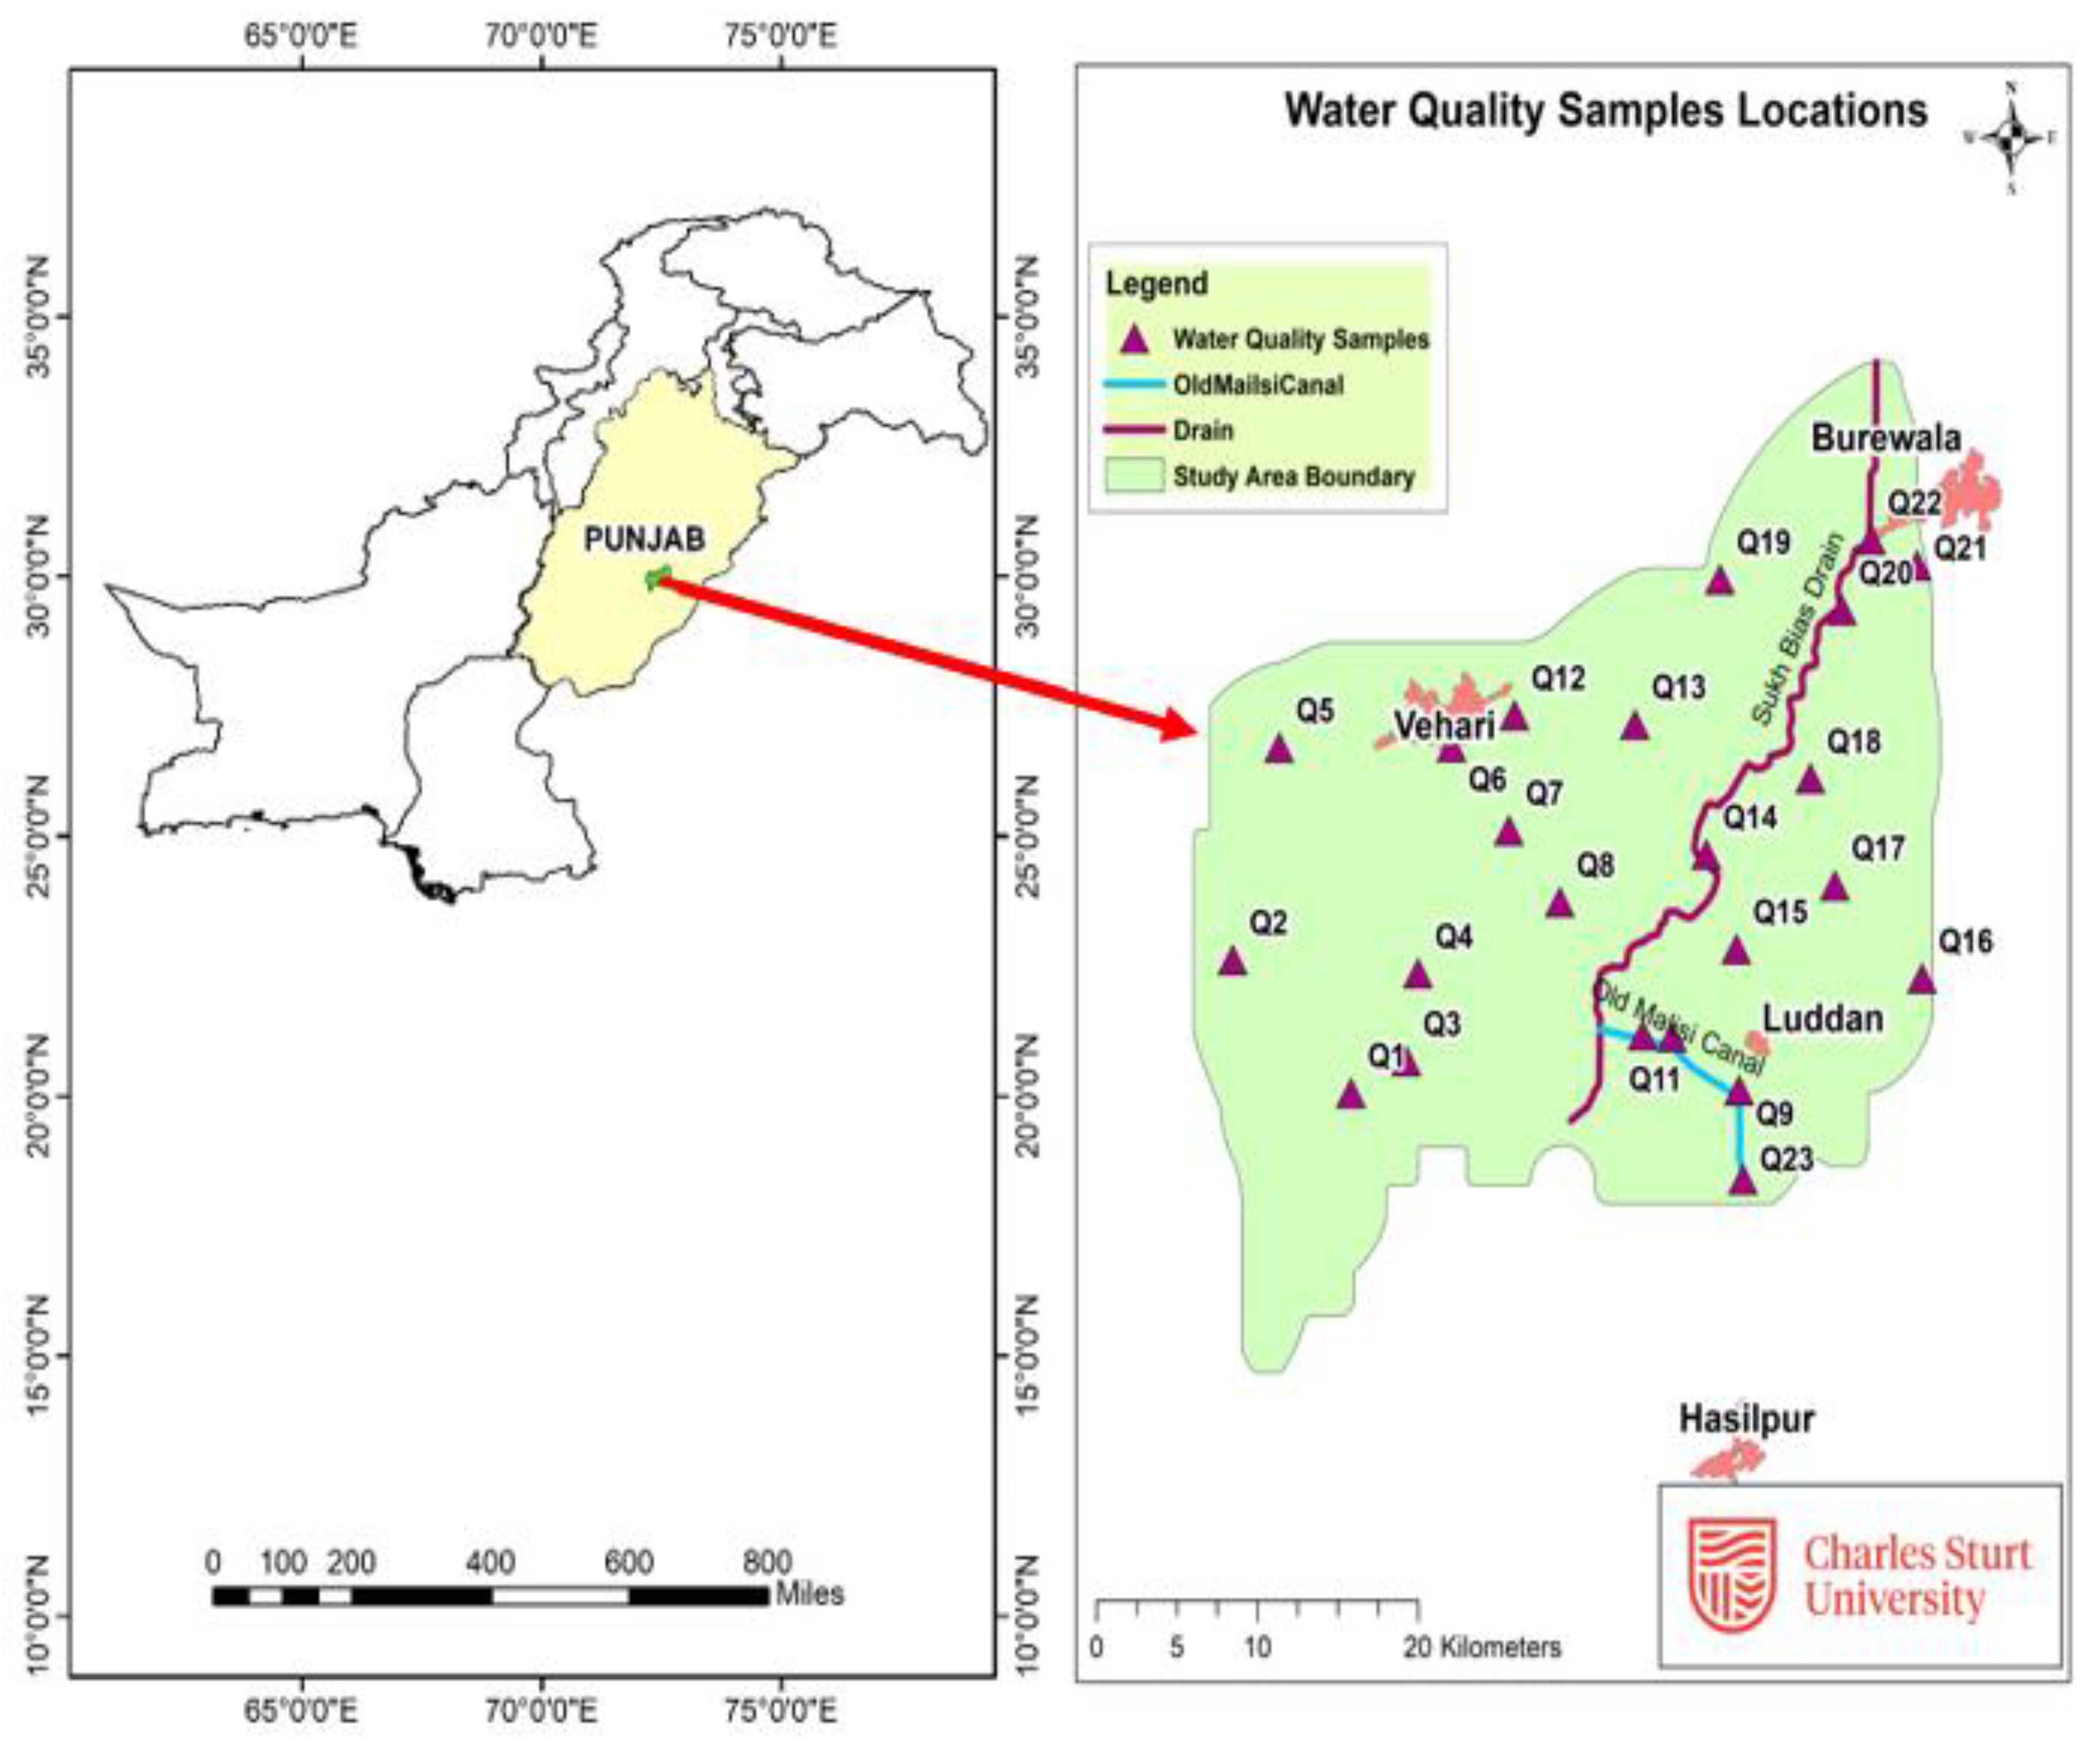
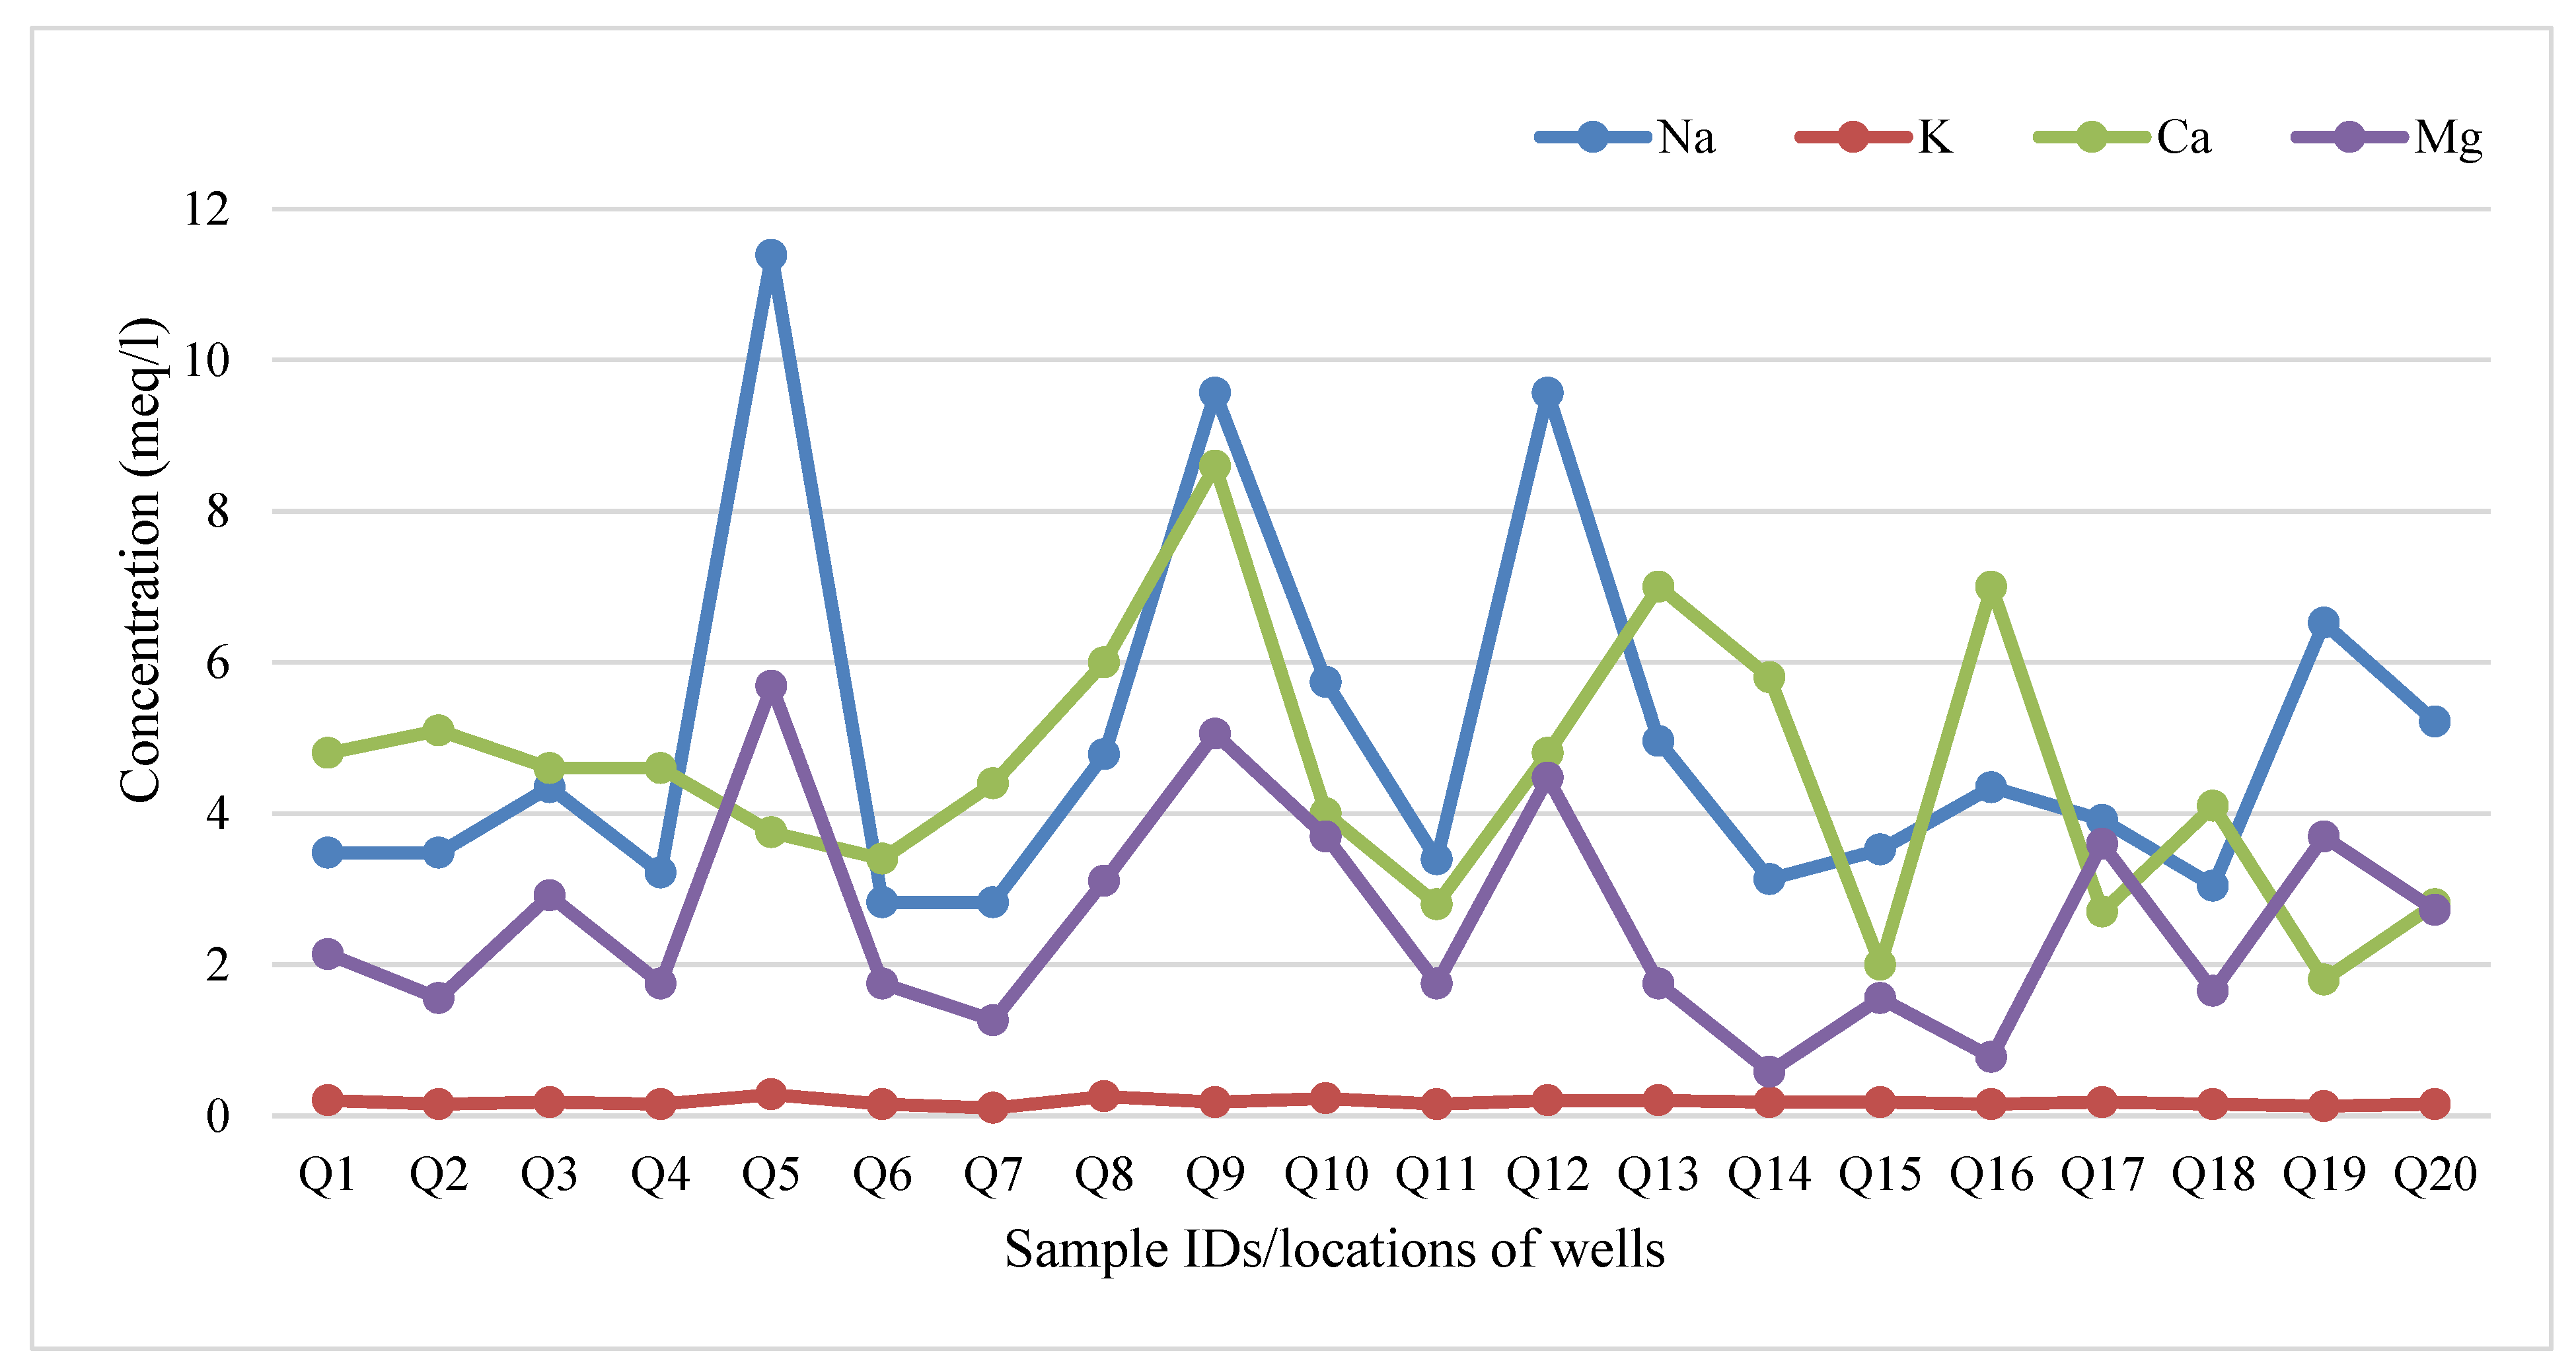
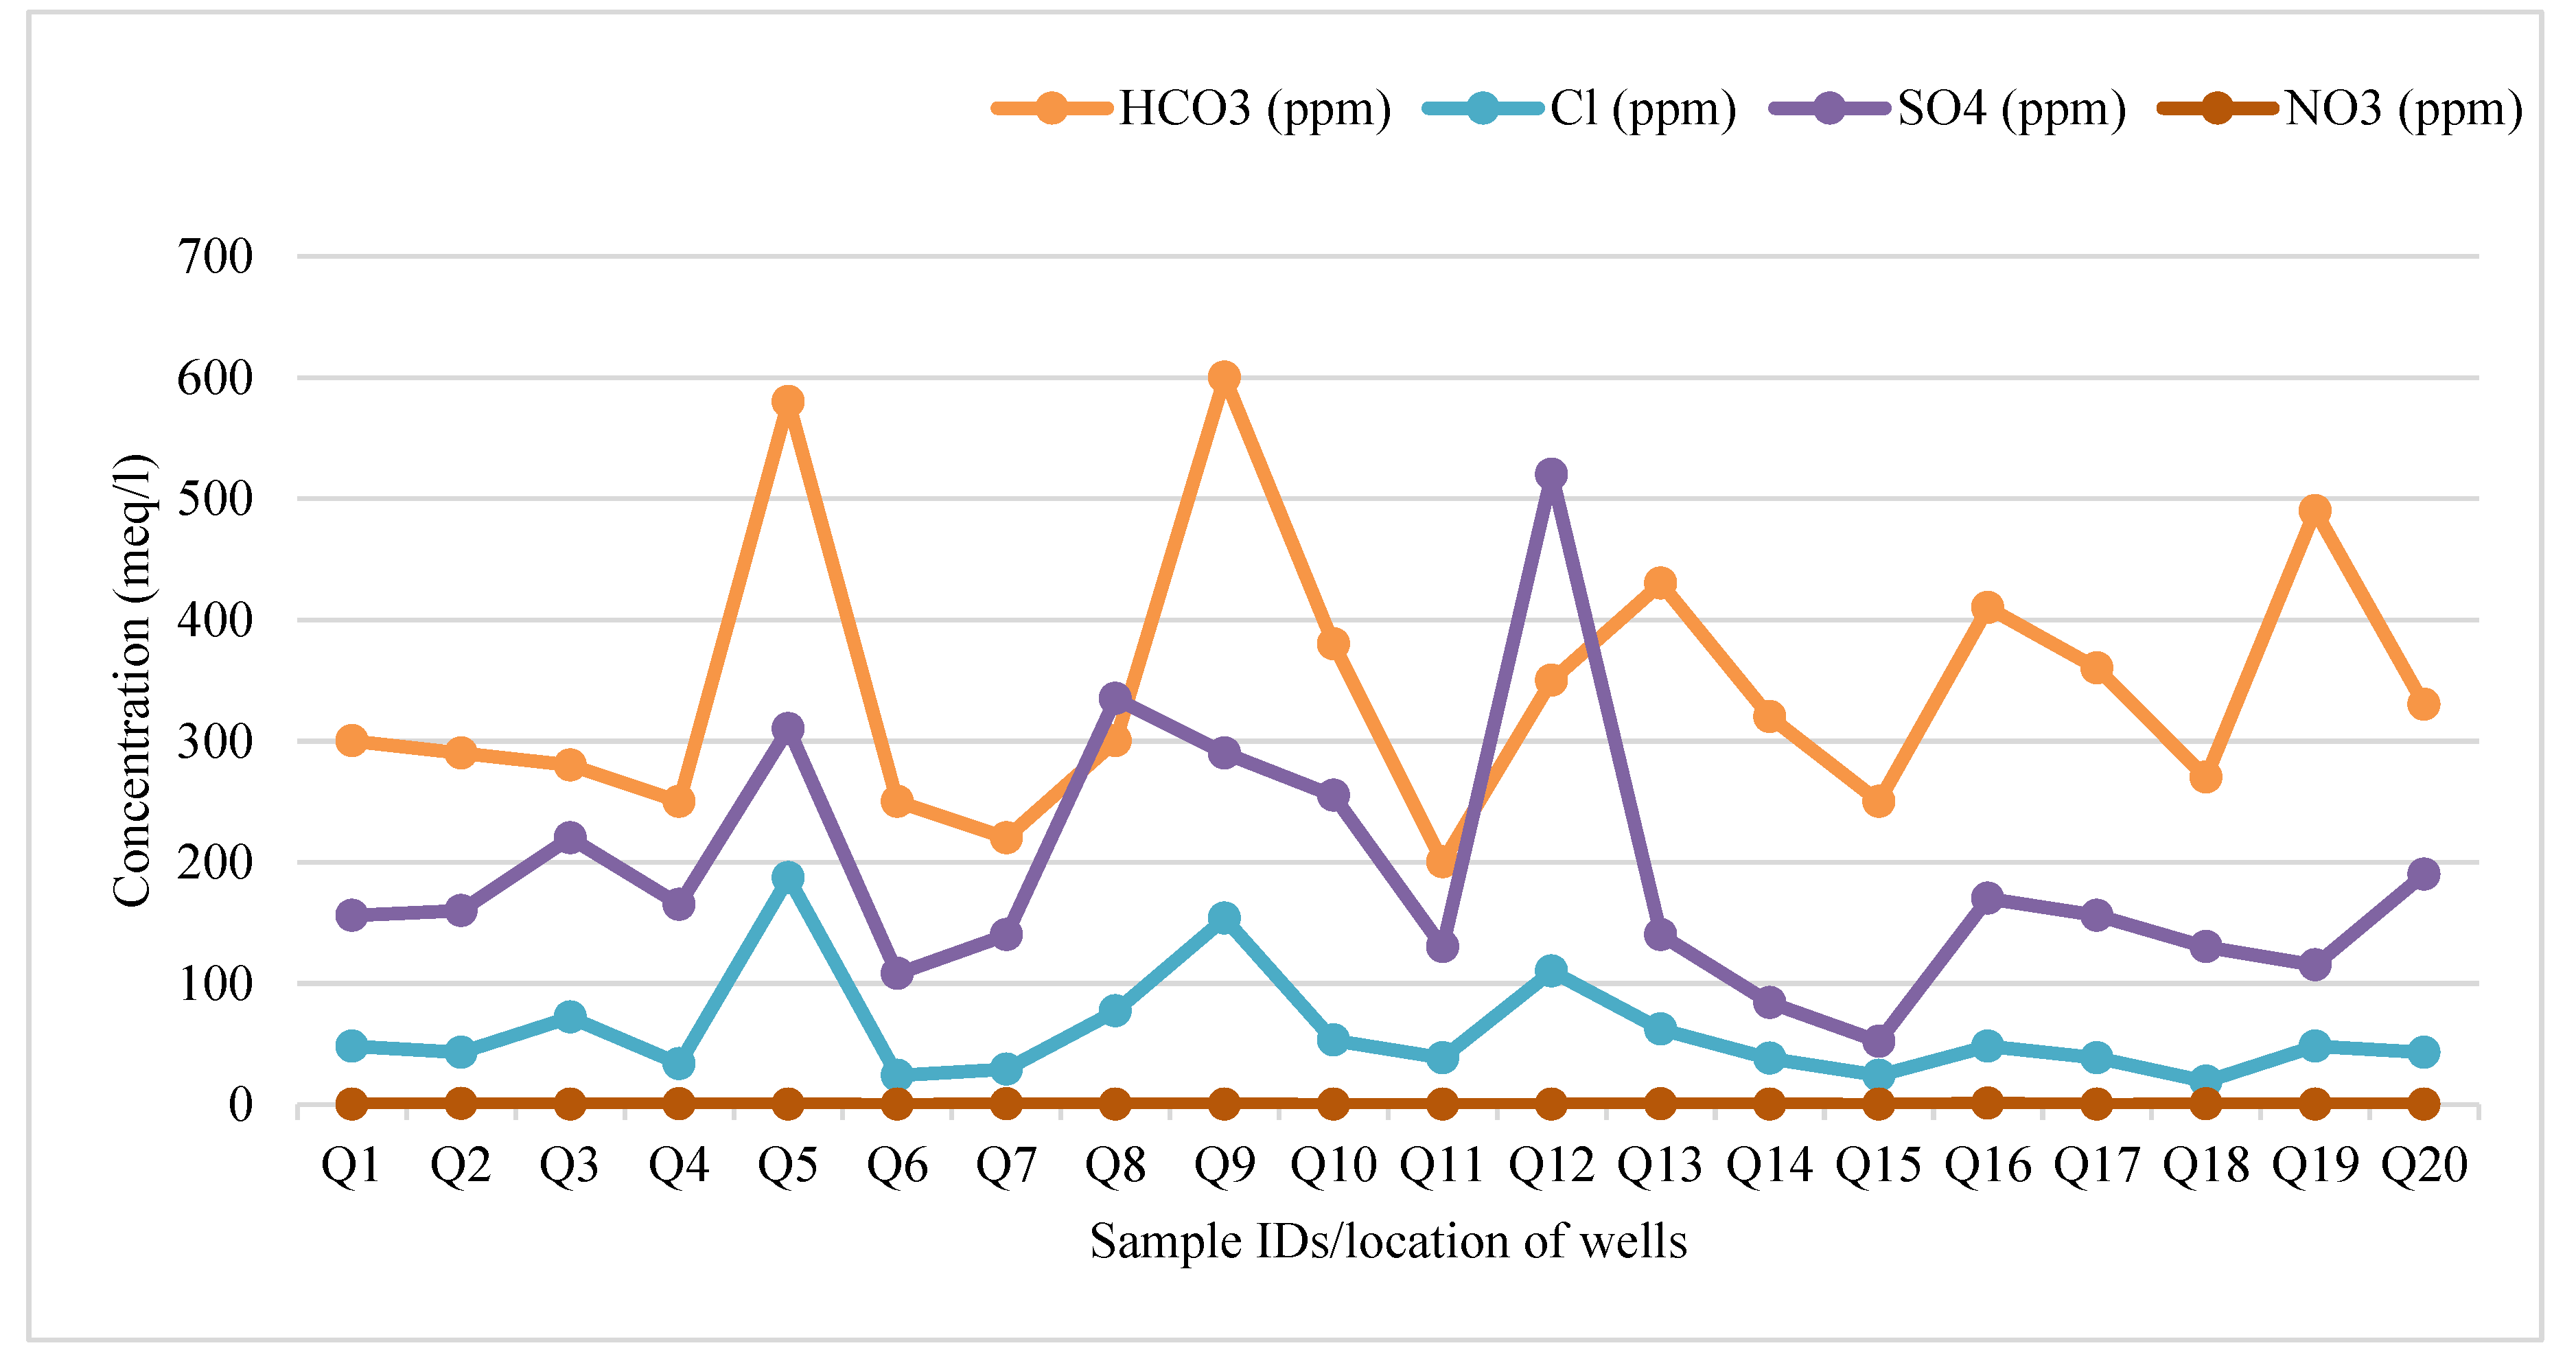
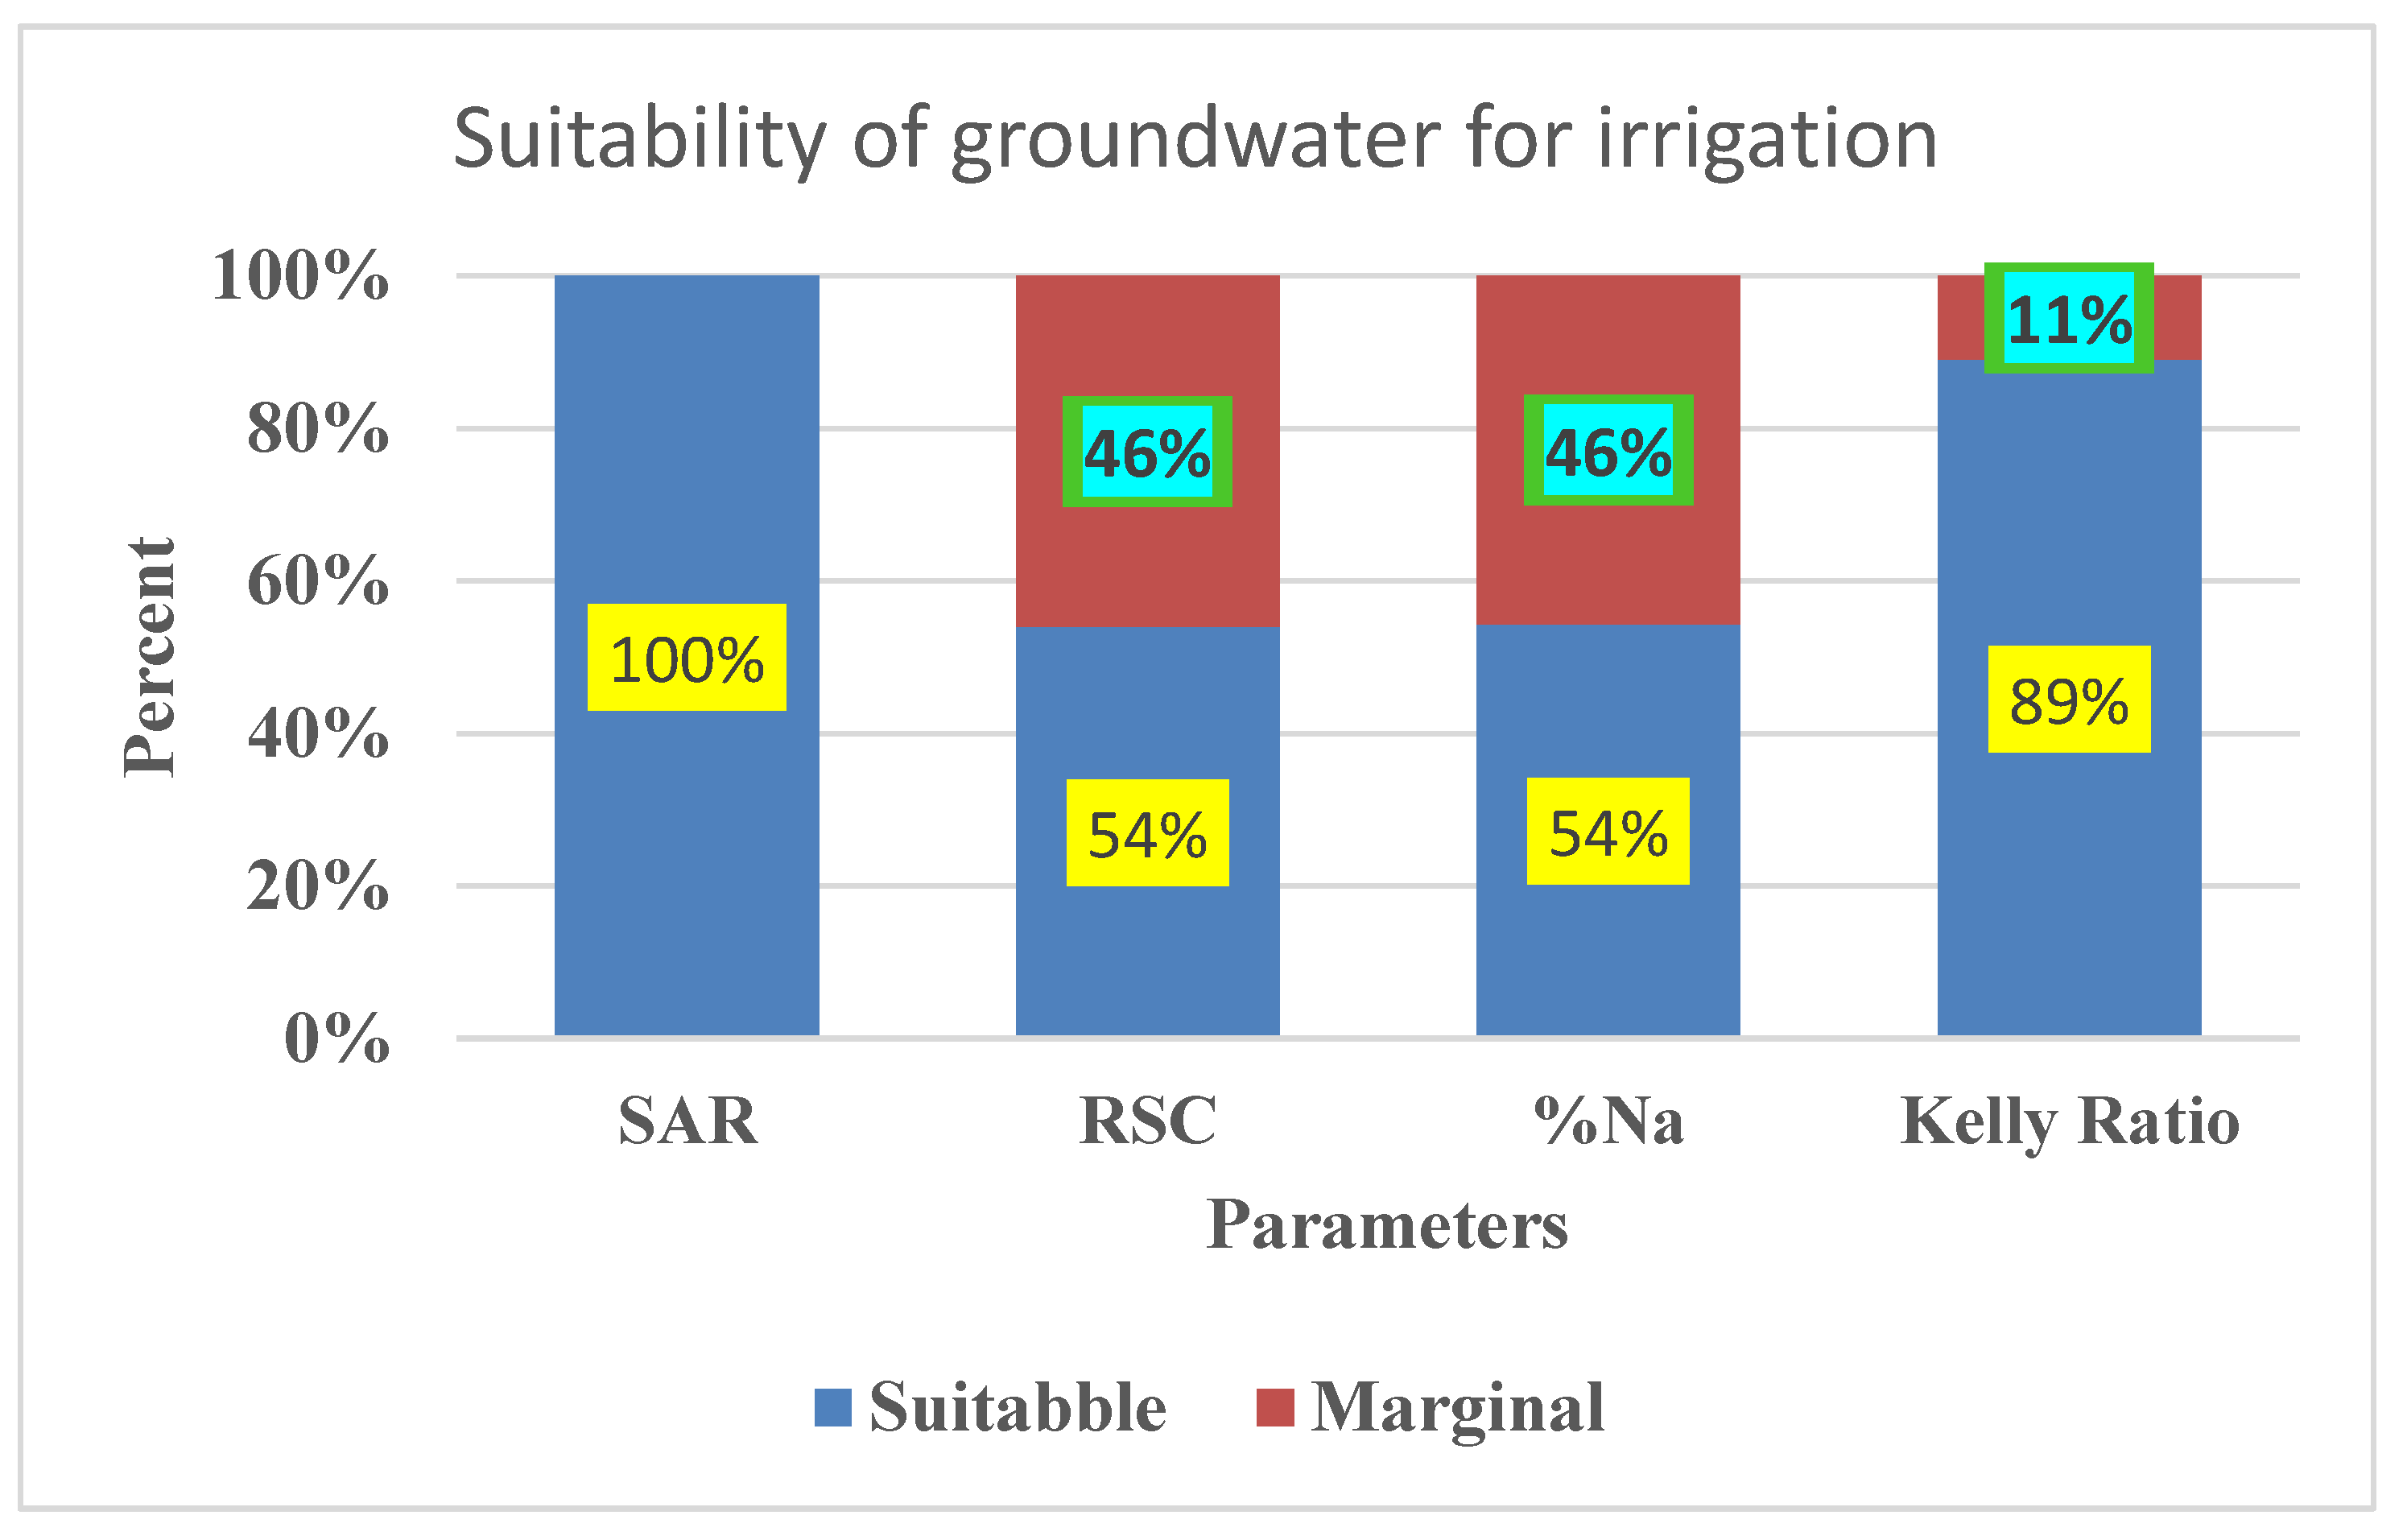
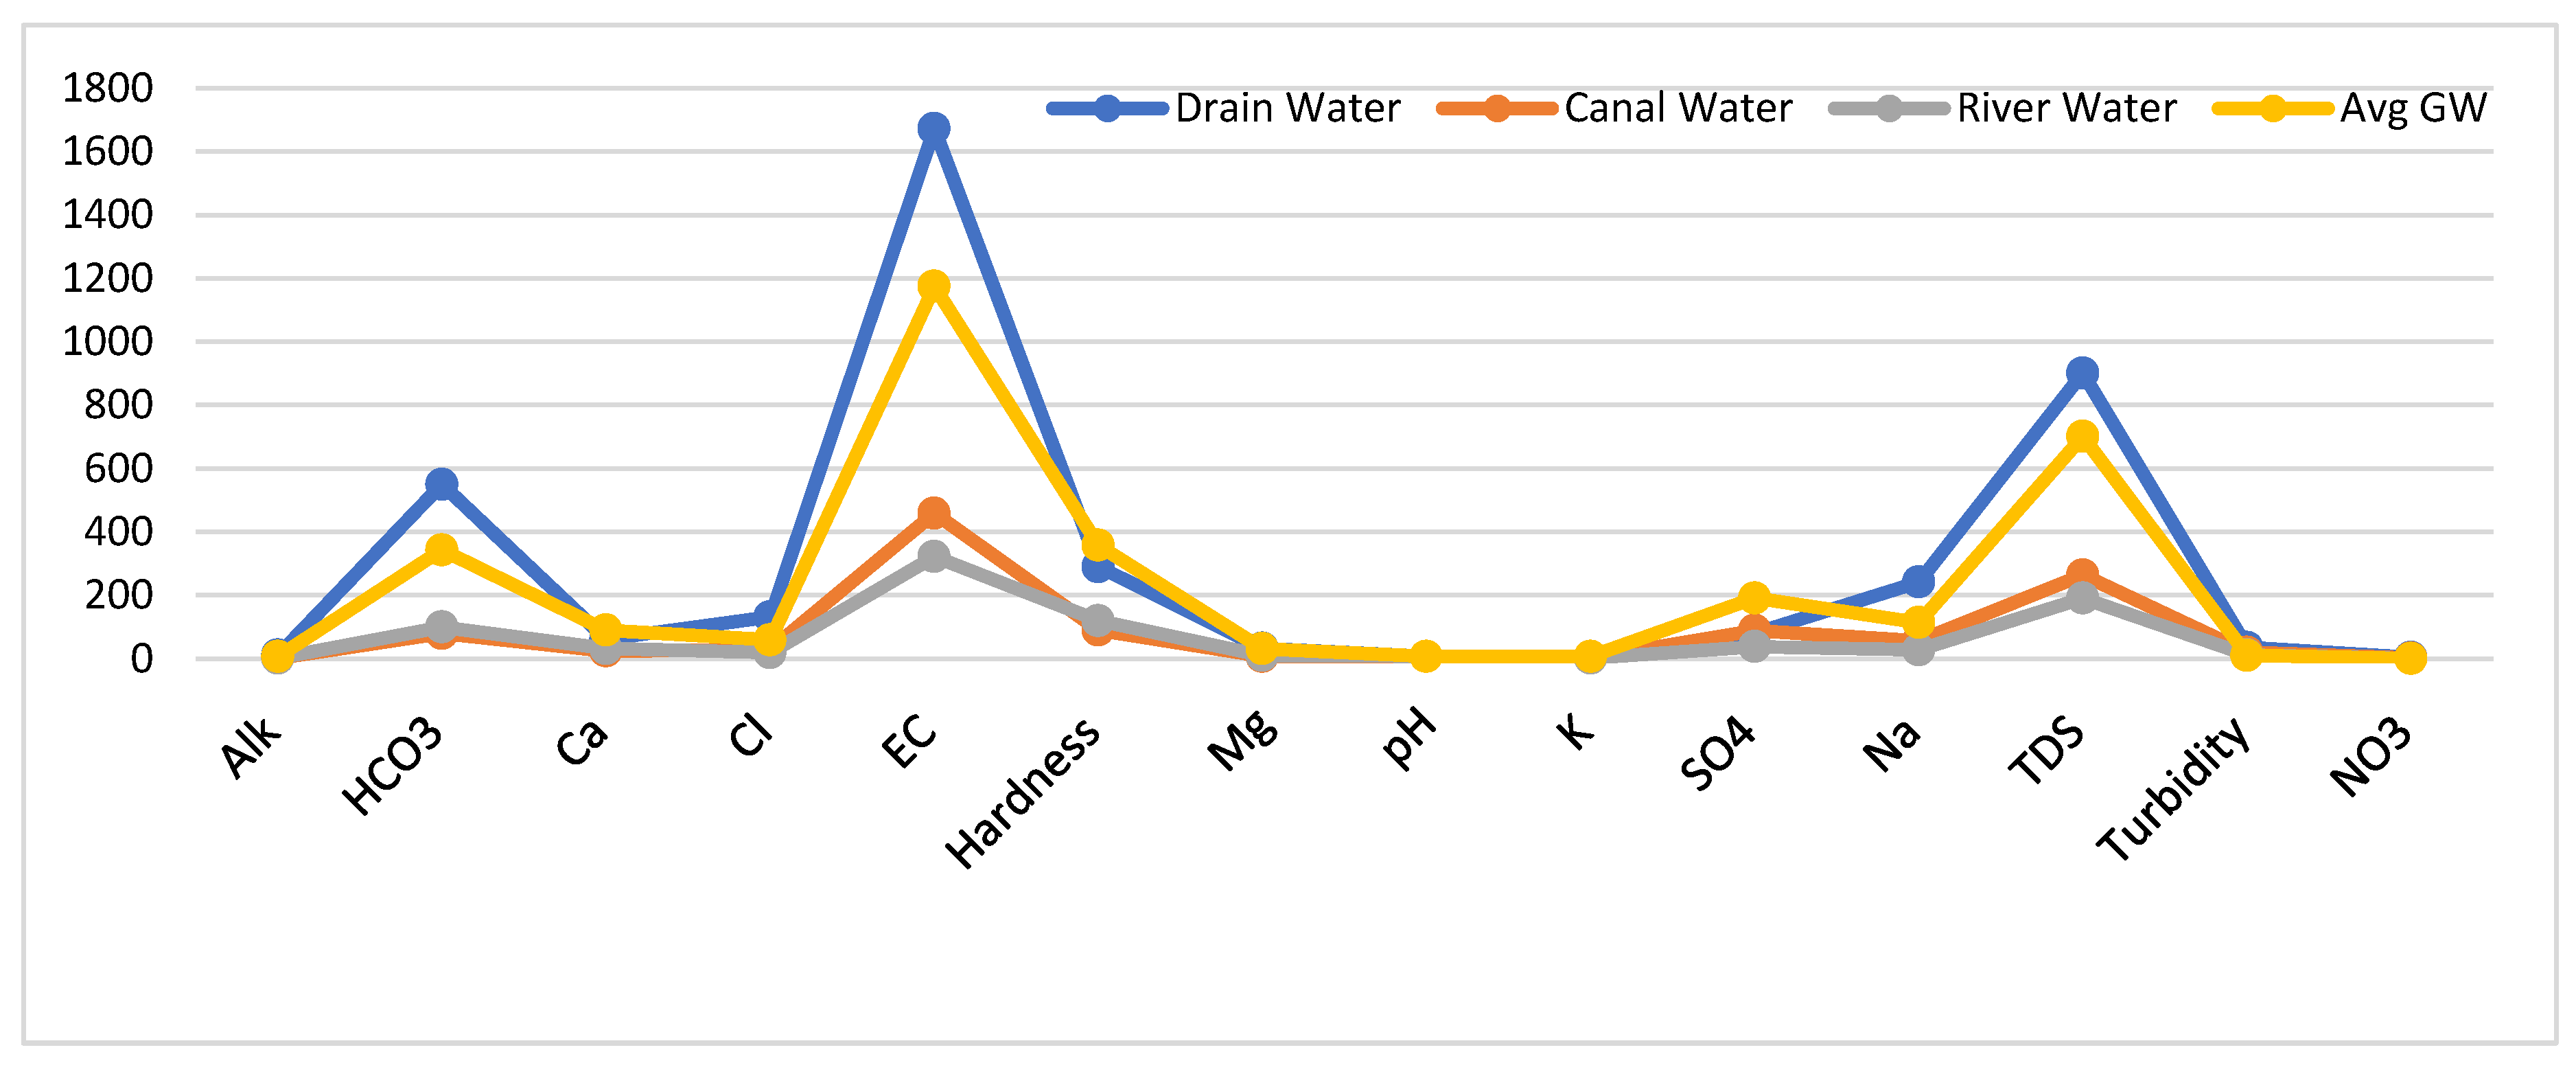
Water quality assessment is crucial for the sustainable use and management of groundwater resources. This study was carried out in the irrigated plains of Vehari District, Punjab, Pakistan, to evaluate groundwater suitability for a managed aquifer recharge (MAR) project. Twenty-three groundwater samples were collected in June 2021 from an area of 1,522 km² and analyzed for major physicochemical parameters including electrical conductivity (EC), total dissolved solids (TDS), pH, turbidity, calcium (Ca), magnesium (Mg), chloride (Cl), alkalinity (Alk), bicarbonate (HCO₃⁻), hardness, potassium (K), sulphate (SO₄²⁻), sodium (Na), and nitrate (NO₃⁻). Water quality was assessed using WHO and PID standards, alongside derived hydrochemical indices such as sodium percentage (%Na), Kelley’s ratio (KR), sodium adsorption ratio (SAR), residual sodium carbonate (RSC), and the water quality index (WQI). The dataset was interpreted using geo-statistical, geospatial, multivariate, and correlation analyses. Cation and anion dominance followed the order Na⁺ > Ca²⁺ > Mg²⁺ > K⁺ and HCO₃⁻ > SO₄²⁻ > Cl⁻ > NO₃⁻. WQI results showed that 35% of samples indicate “poor,” 50% “very poor,” and 15% “unsuitable” drinking-water quality. However, irrigation suitability indices confirmed that groundwater is generally acceptable for agricultural use, though unfit for drinking. The outcomes of this study provide essential insights for groundwater management in the region, where the Punjab Irrigation Department (PID) has initiated a MAR project. Considering that the irrigation sector is the major groundwater consumer in the area, the compatibility of groundwater and surface water quality supports the implementation of MAR to enhance agricultural sustainability.
Keywords:
1. Introduction
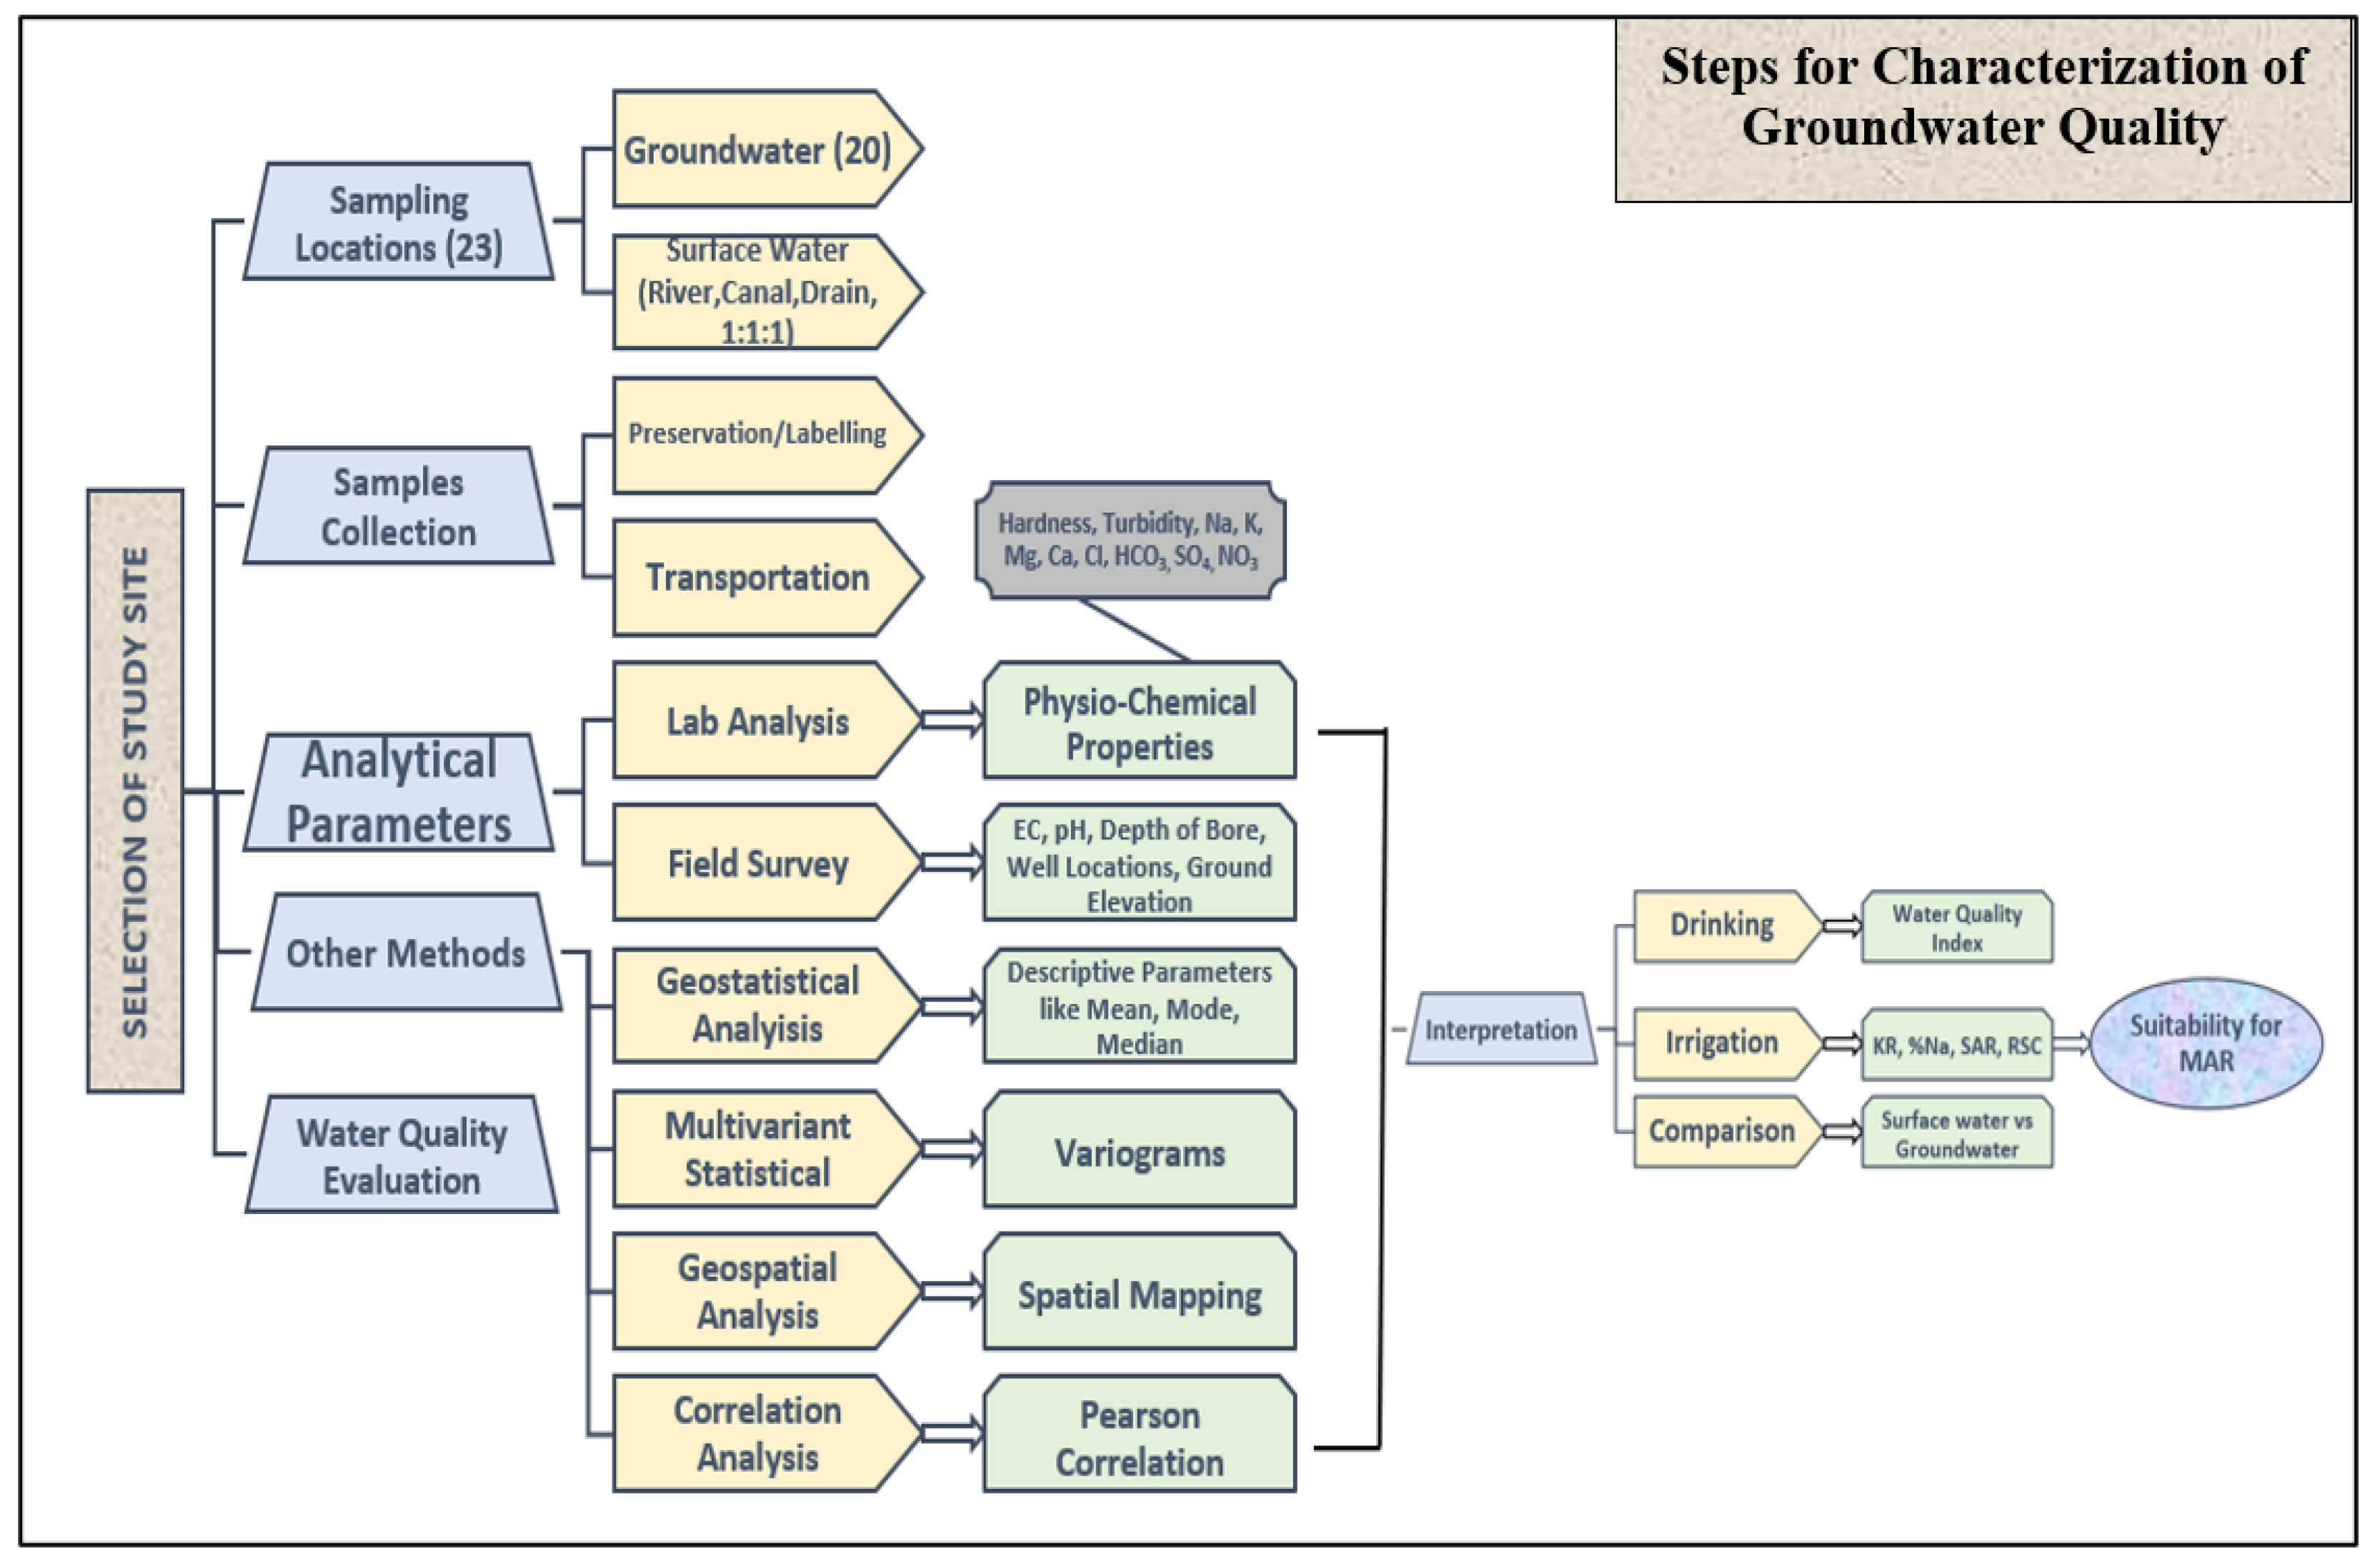
2. Materials and Methods
2.1. Study Area
2.2. Water Samples Collection and Lab Analysis
2.3. Methods of Interpretation of Water Quality
2.4. Suitability of Groundwater for Irrigation
3. Results and Discussions
3.1. Geo-Statistical Analysis
3.2. Multivariate Analysis
3.3. Pearson Correlation Analysis
3.4. Subsurface Hydrogeology
3.5. Suitability of Groundwater for Drinking Purpose
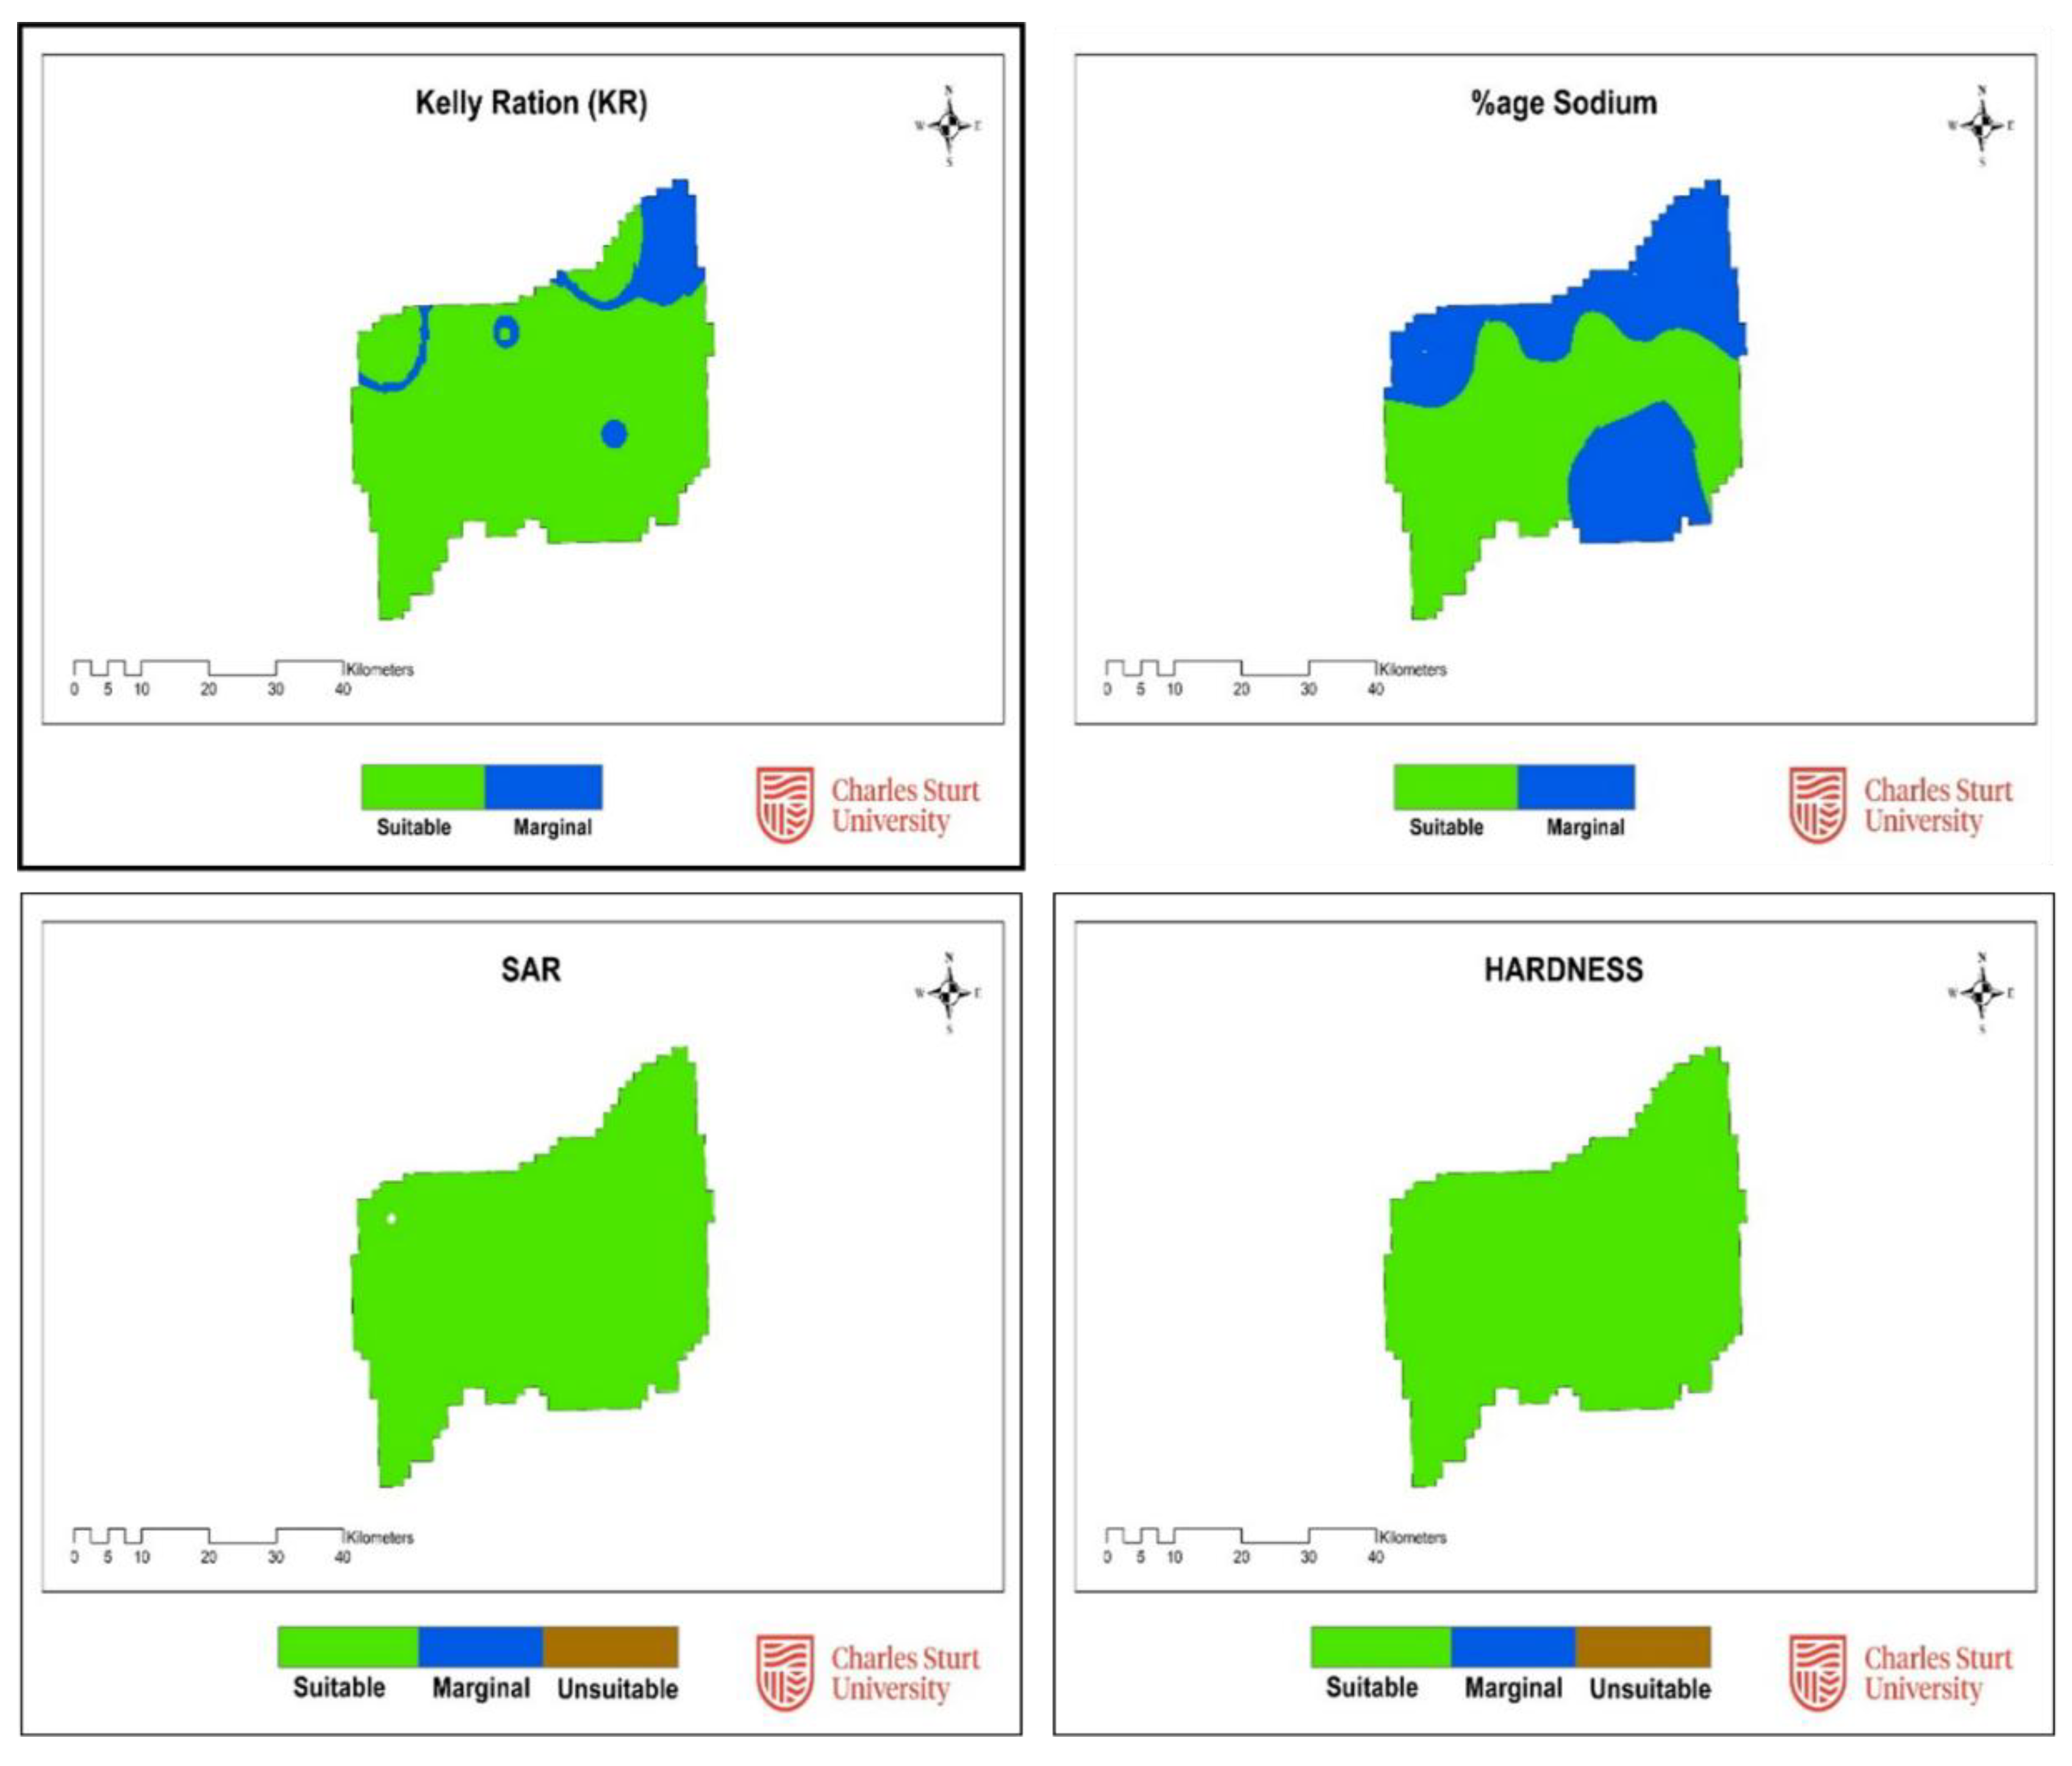
3.6. Suitability of Groundwater for Irrigation
4. Conclusions and Recommendations
Funding
Institutional Review Board Statement
Informed Consent Statement
Data Availability Statement
Acknowledgments
Conflicts of Interest
References
- Adimalla, N. (2020). Controlling factors and mechanism of groundwater quality variation in semiarid region of South India: an approach of water quality index (WQI) and health risk assessment (HRA). Environ Geochem Health, 42(6), 1725-1752. [CrossRef]
- Adimalla, N. (2021). Application of the Entropy Weighted Water Quality Index (EWQI) and the Pollution Index of Groundwater (PIG) to Assess Groundwater Quality for Drinking Purposes: A Case Study in a Rural Area of Telangana State, India. Arch Environ Contam Toxicol, 80(1), 31-40. [CrossRef]
- Adimalla, N., & Qian, H. (2019). Groundwater quality evaluation using water quality index (WQI) for drinking purposes and human health risk (HHR) assessment in an agricultural region of Nanganur, south India. Ecotoxicol Environ Saf, 176, 153-161. [CrossRef]
- Adimalla, N., & Taloor, A. K. (2020). Hydrogeochemical investigation of groundwater quality in the hard rock terrain of South India using Geographic Information System (GIS) and groundwater quality index (GWQI) techniques. Groundwater for Sustainable Development, 10. [CrossRef]
- Amarachi, N., Austin, T., Michael, O., Bilar, A. and Christopher, A., 2023. Quality assessment and health impact of bottled water in Uratta, Imo state: a retrospective study. Sustainable Water Resources Management, 10(1): 3 https://. [CrossRef]
- APHA. (2021). Standard Methods for the Examination of Water 23rd Ed: American Public Health Association (APHA). Retrieved from https://secure.apha.org/imis/ItemDetail?iProductCode=978-087553-2875&CATEGORY=BK.
- Barry, K., Vanderzalm, J., Miotlinski, K., & Dillon, P. (2017). Assessing the Impact of Recycled Water Quality and Clogging on Infiltration Rates at A Pioneering Soil Aquifer Treatment (SAT) Site in Alice Springs, Northern Territory (NT), Australia. Water, 9(3). [CrossRef]
- Bento, S., Melo, M.T.C.d. and Gramaglia, C., 2023. Ethical reflections on groundwater in contaminated areas. Sustainable Water Resources Management, 10(1): https://. [CrossRef]
- Brown, R. M., McClelland, N. I., Deininger, R. A., & O’Connor, M. F. (1972). A water quality index—crashing the psychological barrier. In Indicators of Environmental Quality: Proceedings of a symposium held during the AAAS meeting in Philadelphia, Pennsylvania, December 26–31, 1971 (pp. 173-182). Springer US.
- Chin DA (2013) Water-quality engineering in natural systems: fate and transport processes in the water environment. John Wiley and Sons.
- Custodio E (2012). Low Llobregat aquifers: intensive development, salinization, contamination, and management. The Llobregat: The Story of a Polluted Mediterranean River. 2012:27-49.
- Davis ML (2010) Water and Wastewater Engineering. McGraw Hill.
- Dillon, P., Gale, I., Contreras, S., Pavelic, P., Evans, R., & Ward, J. (2009). Managing aquifer recharge and discharge to sustain irrigation livelihoods under water scarcity and climate change. IAHS Publ. 330, IAHS, Wallingford, UK, pp 1–12.
- EPA_Victoria. (2009). Guidelines for managed aquifer recharge (MAR) – Health and environmental risk management. Retrieved from www.epa.vic.gov.au/publications.
- Gao, Y., Qian, H., Ren, W., Wang, H., Liu, F., & Yang, F. (2020). Hydrogeochemical characterization and quality assessment of groundwater based on integrated-weight water quality index in a concentrated urban area. Journal of Cleaner Production,260(121006). [CrossRef]
- GOP. (2018). Pakistan-Economic Survey 2017-18: Economic Adviser’s Wing, Finance Division, Government of Pakistan, Islamabad, Pakistan. Retrieved from www.finance.gov.pk.
- Hopkins, B. G., Horneck, D. A., Stevens, R. G., Ellsworth, J. W., & Sullivan, D. M. (2007). Managing irrigation water quality for crop production in the Pacific Northwest: PNW 597-E; A Pacific Northwest Extension publication, Oregon State University • University of Idaho • Washington State University, USA. Retrieved from https://brightspotcdn.byu.edu/4b/6f/c34da4954078a51620833c51773d/managing-irrigation-water-quality.pdf.
- Hossain, M. I., Bari, M. N., Miah, S. U., Jahan, C. S., & Rahaman, M. F. (2019). Performance of MAR model for stormwater management in Barind Tract, Bangladesh. Groundwater for Sustainable Development, 10 (100285) . [CrossRef]
- Iqbal Z, Abbas F, Mahmood A, Ibrahim M, Gul M, Yamin M, Aslam B, Imtiaz M, Elahi NN, Qureshi TI, Sial GZ (2021) Human health risk of heavy metal contamination in groundwater and source apportionment. International Journal of Environmental Science and Technology, 19(2022): 7251–7260.
- Kumar L, Kumari R, Kumar A, Tunio IA, Sassanelli C (2023) Water Quality Assessment and Monitoring in Pakistan: A Comprehensive Review. Sustainability, 15(7) https://. [CrossRef]
- Leslie, D. L., Reba, M. L., & Czarnecki, J. B. (2022). Managed aquifer recharge using a borrow pit in connection with the Mississippi River Valley alluvial aquifer in northeastern Arkansas. Journal of Soil and Water Conservation, 77(6). [CrossRef]
- Kelly WP (1963). Use of saline irrigation water. Soil Science,95, 355–391. https://. [CrossRef]
- Malik, A., & Sugandh. (2022). Groundwater hydro-geochemistry, irrigation and drinking quality, and source apportionment in the intensively cultivated area of Sutlej sub-basin of main Indus basin. Environmental Earth Sciences, 81, 456.
- Munkholm L (2011). Soil friability: A review of the concept, assessment and effects of soil properties and management. Geoderma, s 167–168. 236–246. 10.1016/j.geoderma.2011.08.005.
- Mohan, U., & Krishnakumar, A. (2021). Geospatial distribution of groundwater quality using entropy water quality index and statistical assessment: A study from a tropical climate river basin. Environmental Quality Management. [CrossRef]
- Natasha, N., Shahid, M., Murtaza, B., Bibi, I., Khalid, S., Al-Kahtani, A. A., . . . Shaheen, S. M. (2022). Accumulation pattern and risk assessment of potentially toxic elements in selected wastewater-irrigated soils and plants in Vehari, Pakistan. Environ Res, 214(Pt 3), 114033. [CrossRef]
- Nisa, Z.-U. (2018). GIS Based Evaluation of Groundwater Quality of Western Lahore Using Water Quality Index. Pakistan Journal of Agricultural Sciences, 55(03), 653-665. [CrossRef]
- Page, D., Dillon, P., Vanderzalm, J., Toze, S., Sidhu, J., Barry, K., . . . Regel, R. (2010). Risk assessment of aquifer storage transfer and recovery with urban stormwater for producing water of a potable quality. J Environ Qual, 39(6), 2029-2039. [CrossRef]
- Palit, D., Mondal, S., & Chattopadhyay, P. (2018). Analyzing water quality index of selected pit–lakes of Raniganj coal field area, India. Environ Ecol, 36(August).
- Pant M, Singhal N, and Singh J (2023) Spatio-temporal variations in water quality of Rispana river in Dehradun, India. Sustainable Water Resources Management, 9(4): 123 https://. [CrossRef]
- Pavelic, P., Hoanh, C. T., D’haeze, D., Vinh, B. N., Viossanges, M., Chung, D. T., . . . Ross, A. (2022). Evaluation of managed aquifer recharge in the Central Highlands of Vietnam. Journal of Hydrology: Regional Studies, 44 (101257). [CrossRef]
- Richards LA (Ed.) (1954) Diagnosis and improvement of saline and alkali soils (No. 60). US Government Printing Office.
- Ross, A. (2022). Benefits and Costs of Managed Aquifer Recharge: Further Evidence. Water, 14(20). [CrossRef]
- Ruhela, M., Singh, V. K., & Ahamad, F. (2021). Assessment of groundwater quality of two selected villages of Nawada district of Bihar using water quality index. Environment Conservation Journal, 22(3), 387-394. [CrossRef]
- Saleem, M., Hussain, A., Mahmood, G., & Dubey, S. (2016). Analysis of groundwater quality using water quality index: A case study of greater Noida (Region), Uttar Pradesh (U.P), India. Cogent Engineering, 3(1). [CrossRef]
- Sharma, G., Lata, R., Thakur, N., Bajala, V., Kuniyal, J. C., & Kumar, K. (2021). Application of Multivariate Statistical Analysis and Water Quality Index for Quality Characterization of Parbati River, Northwestern Himalaya, India. research Square. [CrossRef]
- Sherif, M., Sefelnasr, A., Al Rashed, M., Alshamsi, D., Zaidi, F. K., Alghafli, K., . . . Ebraheem, A. A. (2023). A Review of Managed Aquifer Recharge Potential in the Middle East and North Africa Region with Examples from the Kingdom of Saudi Arabia and the United Arab Emirates. Water, 15(4). [CrossRef]
- Singh A, Panda SN, Kumar KS, Sharma CS (2013) Artificial groundwater recharge zones mapping using remote sensing and GIS: a case study in Indian Punjab. Environmental management, 52:61-71.
- Singh J, Bhardwaj P, and Awasthi A, (2022) Health implications among school children due to fluoride in underground aquifers of Haryana state, India. Environmental Quality Management, 31(3): 233-240 https://. [CrossRef]
- Sindhu, A. S. (2010). District Vehari: Hazard, vulnerability and development profile: Rural Development Policy Institute (RDPI), Islamabad, Pakistan.
- Snousy, M. G., Wu, J., Su, F., Abdelhalim, A., & Ismail, E. (2021). Groundwater Quality and its Regulating Geochemical Processes in Assiut Province, Egypt. Exposure and Health. [CrossRef]
- Solangi, G. S., Siyal, A. A., Babar, M. M., & Siyal, P. (2019). Evaluation of drinking water quality using the water quality index (WQI), the synthetic pollution index (SPI) and geospatial tools in Thatta district, Pakistan. Desalination and Water Treatment, 160, 202-213. [CrossRef]
- Srinidhi, N. S., Madhusudhana Reddy, P., & Anji Reddy, M. (2021). Evaluation of Water Quality Status of Ameenpur Lake, Hyderabad, Telangana, India Using Water Quality Index (Wqi) and Geo-Spatial Technology. Plant Archives, 21(1). [CrossRef]
- van der Zee, S. E. A. T. M., Shah, S. H. H., & Vervoort, R. W. (2014). Root zone salinity and sodicity under seasonal rainfall due to feedback of decreasing hydraulic conductivity. Water Resources Research, 50(12), 9432-9446. [CrossRef]
- Vanderzalm, J. L., Dillon, P. J., Tapsuwan, S., Pickering, P., Arold, N., Bekele, E. B., . . . McFarlane, D. (2015). Economics and experiences of managed aquifer recharge (MAR) with recycled water in Australia: Australian Water Recycling Centre of Excellence. Retrieved from https://vuir.vu.edu.au/32058/1/MARRO%2BCase%2BStudies%2B-%2BFinal%2BReport.pdf.
- Wang H, Zhang Q (2019) Research Advances in Identifying Sulfate Contamination Sources of Water Environment by Using Stable Isotopes. Int J Environ Res Public Health, 30;16(11):1914. [CrossRef]
- WHO-Edition Fourth (2011) Guidelines for drinking-water quality. WHO chronicle, 38(4):104-8.
- Wiesman, Z. (2009). Biotechnologies for intensive production of olives in desert conditions: in Desert Olive Oil Cultivation; https://www.sciencedirect.com/topics/agricultural-and-biological-sciences/soil-sodicity.
- Wilcox, L. V. (1955). Classification and use of irrigation water (p. 19). Washington: U.S. Department of Agriculture Circular 969.
- Zakir-Hassan, G., Hassan, F. R., Punthakey, J. F., & Shabir, G. (2021). Challenges for groundwater-irrigated agriculture and management opportunities in Punjab province of Pakistan. International Journal of Research in Agronomy, 4(2), 142-153.
- Zakir-Hassan, G. (2023). Improving Sustainable Groundwater Management: A Case Study of Managed Aquifer Recharge in Punjab Pakistan: PhD thesis, School of Agricultural, Environmental, and Veterinary Sciences Charles Sturt University, Australia,.
- Zakir-Hassan, G., Allan, C., Punthakey, J. F., Baumgartner, L., & Ahmad, M. (2023). Groundwater Governance in Pakistan: An Emerging Challenge. In M. Ahmad (Ed.), Water Policy in Pakistan: Issues and Options (pp. 143-180). Cham: Springer International Publishing.
- Zakir-Hassan, G., Akhtar, S., Punthakey, J.F. and Shabir, G., 2022. Assessnment of groundwater potential and threats for its sustainable use, case study of Greater Thal Canal area from Punjab Pakistan: . Water Productivity Journal, 2(4): 53-71.
- Zakir-Hassan, G., Hassan, F. R., Punthakey, J. F., Shabir, G., & Khan, M. A. H. (2022). Groundwater Contamination from Drainage Effluents in Punjab Pakistan. Journal of Agricultural Research Pesticides and Biofertilizers, 4(1).
- Zakir-Hassan, G., Hassan, F. R., Shabir, G., & Rafique, H. (2021). Impact of Floods on Groundwater—A Case Study of Chaj Doab in Indus Basin of Pakistan. International Journal of Food Science and Agriculture, 5(4), 639-653. [CrossRef]
- Zakir-Hassan, G., Kahlown, M. A., Punthakey, J. F., Shabir, G., Aziz, M., Sultan, M., . . . Majeed, F. (2023). Evaluation of hydraulic efficiency of lined irrigation channels – A case study from Punjab, Pakistan. Hydrology Research, 54(4), 523-546. doi:http://iwaponline.com/hr/article-pdf/54/4/523/1211072/nh0540523.pdf.
- Zakir-Hassan, G., Punthakey, J. F., Allan, C., & Baumgartner, L. (2025). Integrating Groundwater Modelling for Optimized Managed Aquifer Recharge Strategies. Water, 17(14). [CrossRef]
- Zakir-Hassan, G., Punthakey, J. F., Hassan, F. R., & Shabir, G. (2022). Methodology for Identification of Potential Sites for Artificial Groundwater Recharge in Punjab Province of Pakistan. Canadian Journal of Agriculture and Crops, 7(2), 46-77. [CrossRef]
- Zakir-Hassan, G., Punthakey, J. F., Hassan, F. R., Shabir, G., & Khan, M. A. H. (2022). Groundwater Contamination by wastewater _ a threat for human–heath In Punjab Pakistan. . Medpress Nutrition and Food Sciences, 1(1). doi:https://www.medpresspublications.com/articles/mpnfs/mpnfs-202207001.pdf.
- Zakir-Hassan, G., Punthakey, J. F., Shabir, G., & Hassan, F. R. (2024). Assessing the potential of underground storage of flood water: A case study from Southern Punjab Region in Pakistan. Journal of Groundwater Science and Engineering, 12(4), 387-396. [CrossRef]

| Parameters | Alk (ppm) | HCO3 (ppm) | Ca (ppm) | Cl (ppm) | EC (µS/cm) | Hardness (ppm) | Mg (ppm) | pH | K (ppm) | SO4 (ppm) | Na (ppm) | TDS (ppm) | Turbidity (NTU) | NO3 (ppm) | Arsenic (ppb) |
| Minimum | 4 | 200 | 36 | 19 | 703 | 180 | 7 | 7 | 4 | 52 | 65 | 373 | 5.1 | 0.04 | 6.2 |
| Maximum | 12 | 600 | 208 | 451 | 4650 | 1040 | 126 | 8 | 13 | 1320 | 580 | 2887 | 18.1 | 0.9 | 122.3 |
| Mean | 6.8 | 342 | 95.7 | 78.1 | 1340 | 390 | 36.2 | 7.5 | 7.3 | 245 | 136 | 805 | 10.5 | 0.2 | 29.3 |
| Standard Deviation | 2.1 | 106 | 41.8 | 93.2 | 872.7 | 180.7 | 26.8 | 0.2 | 2.0 | 261 | 113 | 531 | 2.5 | 0.2 | 29.4 |
| Standard Error | 0.46 | 23.1 | 9.1 | 20.3 | 190.4 | 39.4 | 5.9 | 0 | 0.4 | 56.9 | 24.6 | 116 | 0.55 | 0.05 | 6.4 |
| Coefficient of variation(CV)% | 27 | 27 | 24 | 22 | 22 | 21 | 22 | 20 | 23 | 21 | 22 | 21 | 19 | 24 | 25 |
| Parameter | Best fitted Model | Range | Nugget | Sill | Partial Sill | Nugget % | Spatial Class* | R2 |
| (m) | Co | Co+C” | C” | 100*C/(Co+C”) | ||||
| Alk | Exponential | 0.06 | 2.497 | 4.995 | 2.498 | 50.01001001 | W | 0.021 |
| HCO3 | Exponential | 0.06 | 6230 | 12470 | 6240 | 50.04009623 | W | 0.021 |
| Ca | Gaussian | 0.04 | 1 | 1259 | 1258 | 99.92057188 | S | 0.354 |
| Cl | Gaussian | 0.05 | 1 | 1810 | 1809 | 99.94475138 | S | 0.297 |
| EC | Spherical | 0.08 | 100 | 248100 | 248000 | 99.95969367 | S | 0.203 |
| Hardness | Spherical | 0.07 | 1750 | 14430 | 12680 | 87.87248787 | S | 0.075 |
| Mg | Gaussian | 0.05 | 145.3 | 320.2 | 174.9 | 54.62211118 | S | 0.17 |
| pH | Gaussian | 0.07 | 0.0001 | 0.46 | 0.4599 | 99.97826087 | M | 0.347 |
| K | Linear | 0.21 | 2.62358 | 2.62358 | 0 | 0 | S | 0.026 |
| SO4 | Spherical | 0.07 | 10 | 14420 | 14410 | 99.93065187 | S | 0.279 |
| Na | Gaussian | 0.05 | 327 | 3460 | 3133 | 90.54913295 | S | 0.317 |
| TDS | Spherical | 0.08 | 6700 | 80200 | 73500 | 91.64588529 | S | 0.166 |
| Turbidity | Linear | 0.21 | 8.57956 | 8.57956 | 0 | 0 | W | 0.122 |
| NO3 | Gaussian | 0.06 | 0.0001 | 0.0407 | 0.0406 | 99.75429975 | M | 0.515 |
| Alk | HCO3 | Ca | Cl | EC | Hardness | Mg | pH | K | SO4 | Na | TDS | Turbidity | NO3 | |
| Alk (ppm) | 1*** | |||||||||||||
| HCO3 (ppm) | 1*** | 1*** | ||||||||||||
| Ca (ppm) | 0.351* | 0.351* | 1*** | |||||||||||
| Cl (ppm) | 0.771*** | 0.771*** | 0.377* | 1*** | ||||||||||
| EC (µS/cm) | 0.848*** | 0.848*** | 0.438* | 0.961*** | 1*** | |||||||||
| Hardness (ppm) | 0.722** | 0.722** | 0.764*** | 0.821*** | 0.885*** | 1*** | ||||||||
| Mg (ppm) | 0.696** | 0.696** | -0.022 | 0.817*** | 0.843*** | 0.629** | 1*** | |||||||
| pH | 0.486* | 0.486* | -0.409 | 0.603** | 0.513** | 0.144 | 0.715** | 1*** | ||||||
| K (ppm) | 0.406 | 0.406* | 0.199 | 0.636** | 0.585** | 0.513** | 0.554** | 0.452* | 1*** | |||||
| SO4 (ppm) | 0.356* | 0.356* | 0.306* | 0.701** | 0.753*** | 0.690** | 0.700** | 0.333* | 0.554** | 1*** | ||||
| Na(ppm) | 0.817*** | 0.817*** | 0.195 | 0.926*** | 0.956*** | 0.721*** | 0.882*** | 0.658** | 0.543** | 0.734*** | 1*** | |||
| TDS (ppm) | 0.78*** | 0.780*** | 0.443* | 0.936*** | 0.985*** | 0.884*** | 0.835*** | 0.486* | 0.603** | 0.847*** | 0.945*** | 1*** | ||
| Turbidity (NTU) | -0.16 | -0.16 | -0.003 | -0.009 | -0.033 | -0.003 | -0.001 | -0.104 | 0.360* | 0.174 | 0.003 | 0.028 | 1*** | |
| NO3 (ppm) | 0.001 | 0.001 | 0.412* | -0.168 | -0.143 | 0.0263 | -0.455 | -0.335 | -0.305 | -0.164 | -0.227 | -0.12 | -0.141 | 1*** |
| WQI Range | Type of Water/Status | Class | No of samples (%) |
| 0-25 | Excellent | I | - |
| 26-50 | Good | II | - |
| 51-75 | Poor | III | 7 (35%) |
| 76-100 | Very poor | IV | 10 (50%) |
| >100 | Unfit for consumption | V | 3 (15%) |
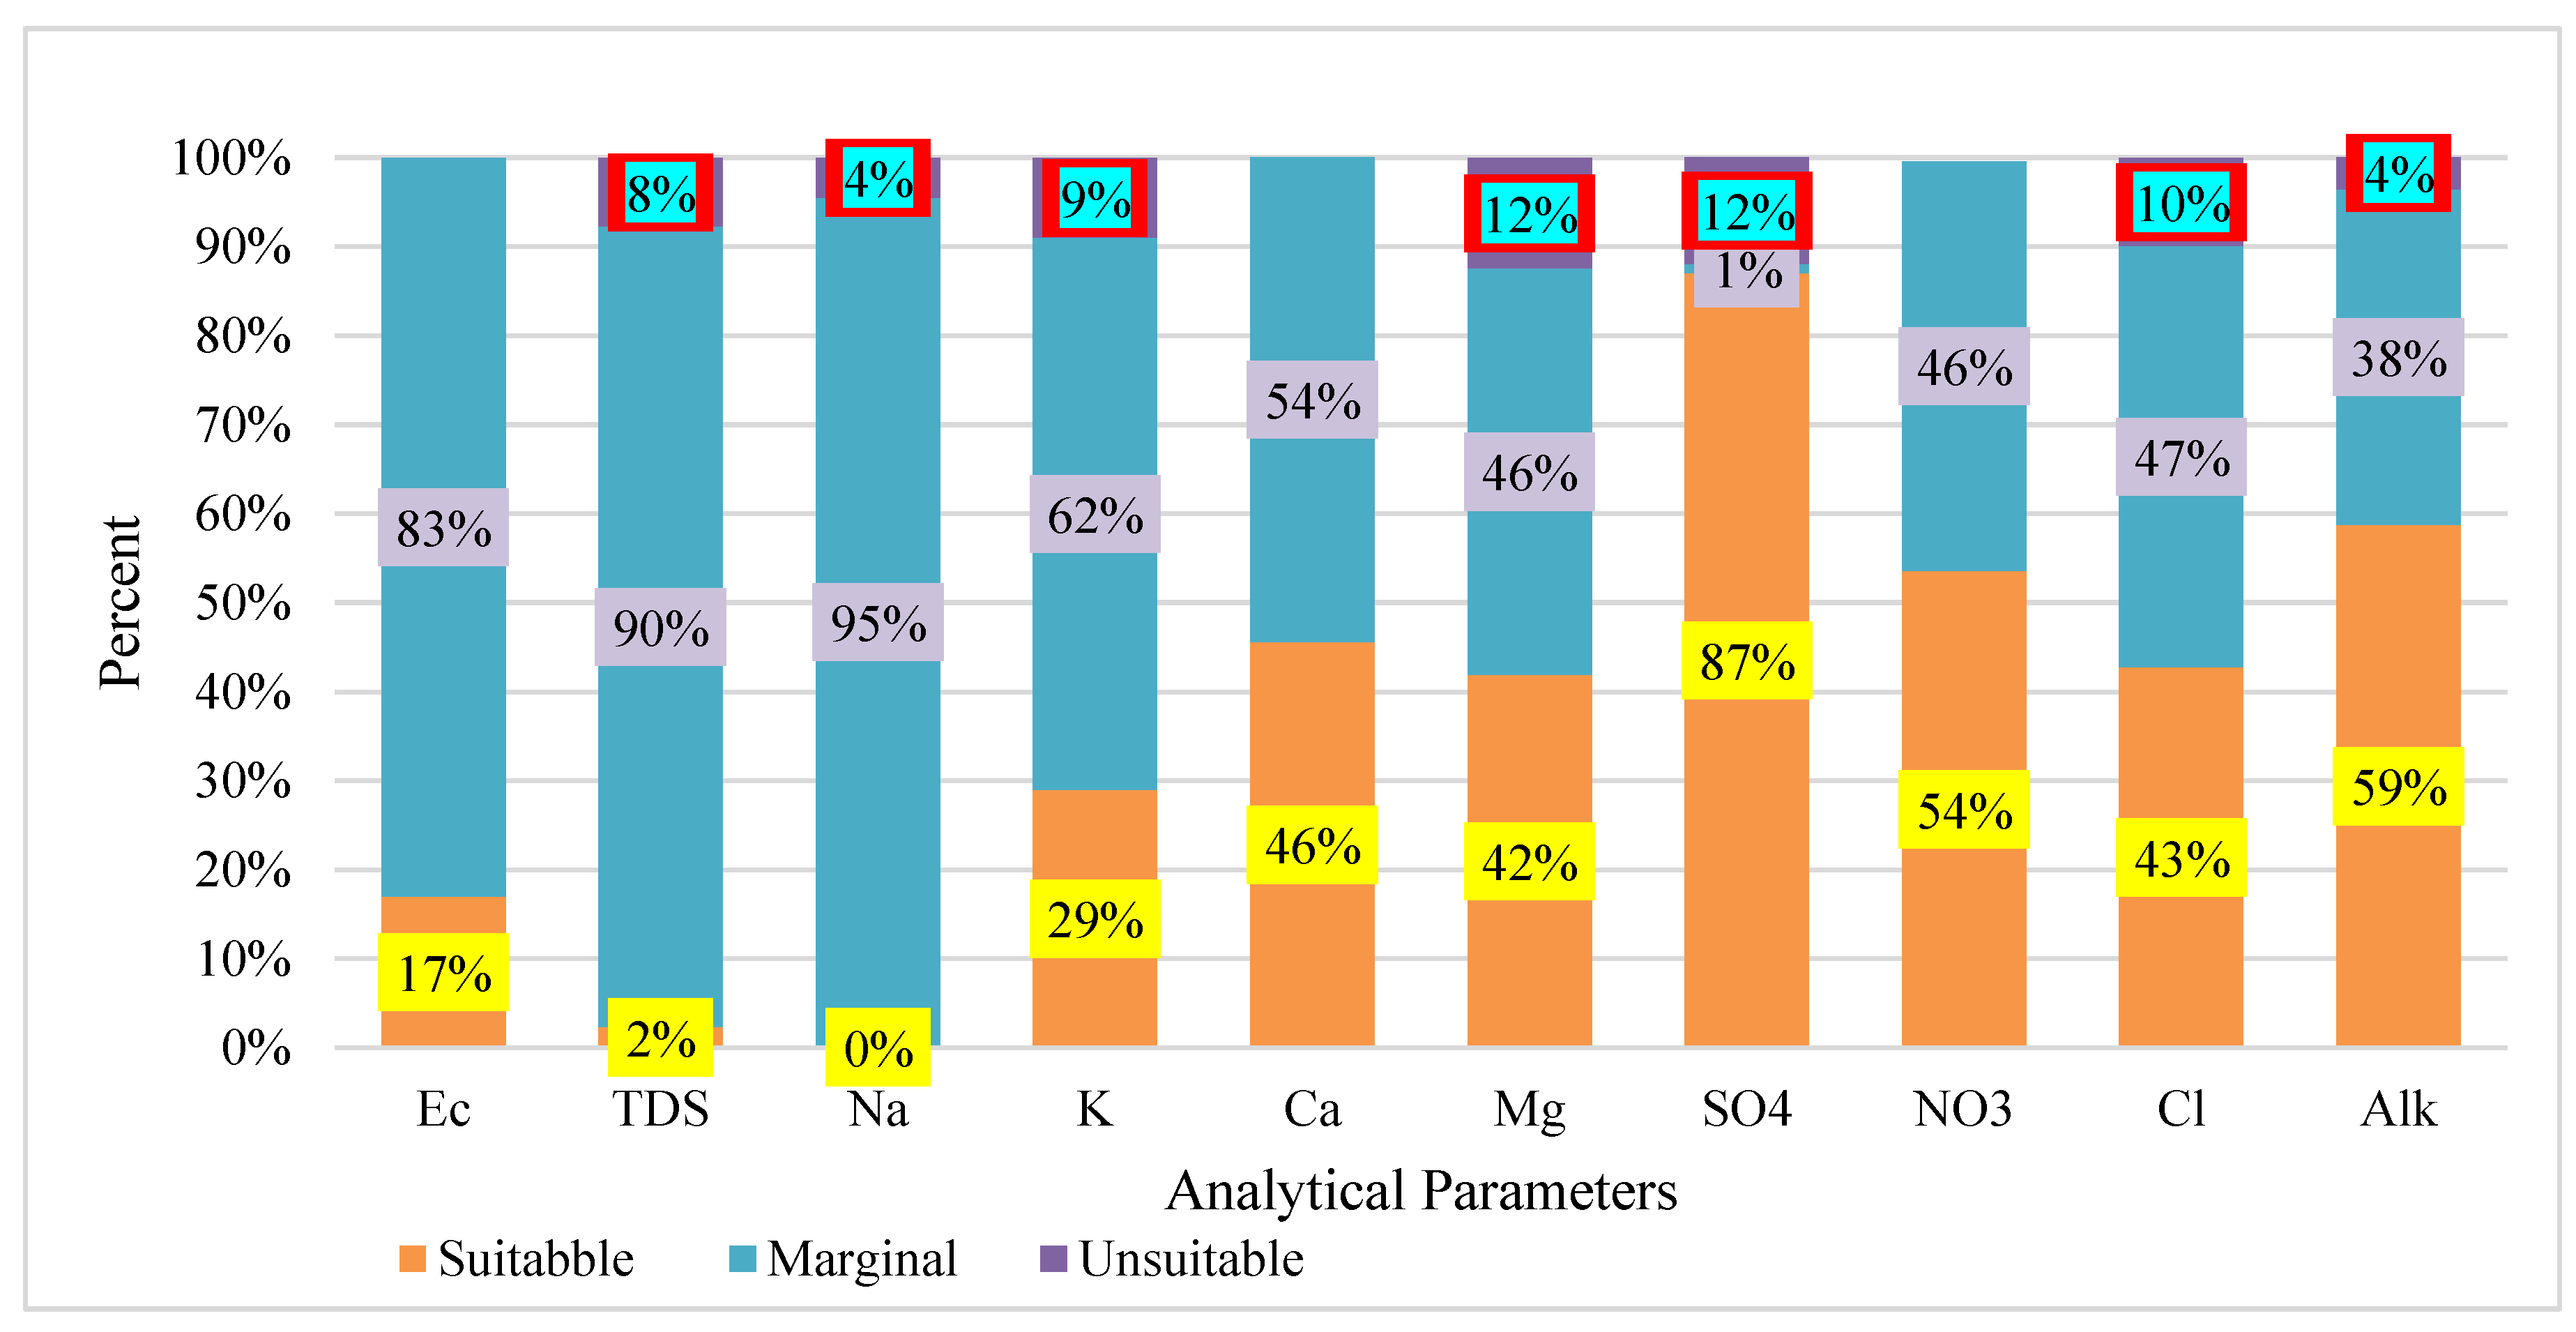
| Sr. No. | Parameters | Standard | Suitable | Marginal | Unsuitable | |||
| Values (WHO 2011; Zakir-Hassan et al 2023) |
Area (km2) | % | Area (km2) | % | Area (km2) | % | ||
| 1 | Ec | 1000 | 254.9 | 17 | 951.6 | 83 | - | - |
| 2 | TDS | 1000 | 35.6 | 2 | 1368.4 | 90 | 117.5 | 8 |
| 3 | Na | 200 | 2.6 | 0 | 1451.2 | 95 | 67.7 | 4 |
| 4 | K | 200 | 436.7 | 29 | 910.3 | 60 | 136.6 | 9 |
| 5 | Ca | 75 | 694.4 | 46 | 827.8 | 54 | - | - |
| 6 | Mg | 30 | 637.5 | 42 | 695.0 | 46 | 189.0 | 12 |
| 7 | SO4 | 200 | 1324.9 | 87 | 2.9 | 0 | 193.7 | 13 |
| 8 | NO3 | 50 | 815.8 | 54 | 693.3 | 46 | 0 | |
| 9 | Cl | 250 | 651.1 | 43 | 719.4 | 47 | 150.9 | 10 |
| 10 | Alk | 10 | 894.5 | 59 | 573.2 | 38 | 55.9 | 4 |
| 11 | SAR | <10 | 1522 | 100 | - | - | - | - |
| 12 | RSC | <2.5 | 826 | 54 | 697.0 | 46 | - | - |
| 13 | %Na | 50 | 826.3 | 54 | 697.2 | 46 | - | - |
| 14 | Kelly Ratio | >1 | 1354.9 | 89 | 155.5 | 10 | 4.5 | 1 |
Disclaimer/Publisher’s Note: The statements, opinions and data contained in all publications are solely those of the individual author(s) and contributor(s) and not of MDPI and/or the editor(s). MDPI and/or the editor(s) disclaim responsibility for any injury to people or property resulting from any ideas, methods, instructions or products referred to in the content. |
© 2025 by the authors. Licensee MDPI, Basel, Switzerland. This article is an open access article distributed under the terms and conditions of the Creative Commons Attribution (CC BY) license (http://creativecommons.org/licenses/by/4.0/).


