
Submitted:
23 November 2025
Posted:
24 November 2025
You are already at the latest version
Abstract
This study explores what drives housing prices in Ames, Iowa by looking at both the usual structural and spatial characteristics of homes and a set of new variables engineered from the original dataset.Three newly created variables including the percentage of finishing living area, the proportion of basement area to total living space, and years since last remodel are used to enhance interpretability and predictive power. In this paper, I investigate the effectiveness of engineered variables with traditional predictors over five supervised learning models including Linear Regression, Ridge Regression, Lasso Regression, Random Forest, and XGBoost. Model performance was assessed quantitatively using RMSE, R², correlation coefficients, and SHAP-based interpretability analyses. All results show that engineered features consistently improved predictive accuracy across all models as extra values but not in dominant effects. SHAP analysis further reveals that while traditional predictors remain highly influential, engineered features offer additional explanatory depth by capturing some obvious structural and temporal patterns.
Keywords:
housing prices
; feature engineering
; machine learning
; SHAP analysis
Introduction
The following section draws substantially from my earlier proposal completed for HU GRAD 695 (Wang, 2025).
The U.S. housing market has becoming increasingly challenging for young American people, many of whom struggle to afford their own homes due to rising prices, economic volatility, and shifting market dynamics (Case & Shiller, 1989). While national housing trends reveal broad drivers of cost, such as location, inflation, interest rate and economic factors. These high-level insights often fail to capture the nuanced factors affecting property values in specific local markets. The dataset of housing prices in Ames, Iowa offers a unique setting for exploring these dynamics due to its diverse housing stock, varied neighborhood characteristics, and accessible market data from a Kaggle competition.
This paper aims to analyze the key factors influencing housing prices in Ames, incorporating both numeric and categorical variables versus newly engineered variables derived from the existing dataset. By creating new ratios including percentage of finished area occupied, percentage of basement area to total living space and years since last remodel, the paper aims to uncover deeper insights that may not be visible from traditional structural variables.These engineered features are designed to reflect practical considerations for buyers and sellers, offering more holistic indicators of value and livability.
Although prior research has examined the determinants of housing prices in the United States, many studies focus on traditional property features and broad macroeconomic indicators. There is limited empirical evidence on whether engineered features that are created through meaningful transformation or combination of raw housing data could add predictive value to price predictive models at granular level. This lack of focus on granular, context specific modellings leave an important gap in understanding the drivers of housing price valuation in local market like Ames, where unique combinations of structural, locational, and temporal factors may play important roles and provide more model interpretability.
To address this gap, the research aims to identify the most influential features for predicting housing prices in Ames, Iowa, using both traditional and engineered variables. Additionally, assessing if newly engineered features improve predictive accuracy beyond conventional housing attributes.
Literature Review
The following section draws substantially from my earlier proposal completed for HU GRAD 695 (Wang, 2025).
There are a couple of research work regarding housing prices in the United State. This literature review explores key methods, datasets, and findings from prior research, with the aim of identifying gaps and informing the dynamics of the real estate market.
Classic economist Case & Shiller (1989) stated that housing prices are determined by supply and demand, interest rates, income level, and macroeconomic indicators (Case & Shiller, 1989). Rosen proposed the Hedonic pricing models, using structural, locational, and neighborhood attributes to explain variation (Rosen, 1974). Early works like Malpezzi et al. (1999) emphasized the importance of school quality, proximity to city centers, and local zoning policies (Malpezzi, 1999). More examples from the literature on the capitalization effect of analysis of school quality and school investments (Bayer et al., 2007; Hussain, 2023). Gyourko and Tracey (1991) found a strong correlation between labor market conditions and housing pricing growth (Gyourko & Tracey, 1991). However, the limitations of all the above classic economic theories assume linear relationships between housing prices with property attributes and macro-economic variables, which ignoring spatial autocorrelation and collinearity, resulting in lower predictive power.
Many researchers have integrated spatial and demographic variables to improve model accuracy using machine learning techniques. Das et al. (2020) introduced Geo-Spatial Network Embedding (GSNE), a graph neural network approach that learns embeddings for properties and nearby points of interests (Das et al., 2020).
More recent studies apply machine learning models, including regression trees, random forests, and gradient boosting. Ye (2024) compared linear regression, random forest, and XGBoost using the Ames dataset and found that XGBoost achieved the best performance, with importance placed on total area, overall quality, living area, and basement area (Ye, 2024). Sharma, Harsora, and Ogunleye (2024) confirmed XGBoost’s superior predictive capacity when comparing it to support vector regressor, random forest, multilayer perceptron, and linear regression (Sharma et al., 2024). Zhou (2023) evaluated multiple machine learning regressors including LASSO, Elastic Net, Gradient Boosting, XGBoost, and LightGBM on the Ames dataset, and found ensemble and hybrid approaches improved accuracy (Zhou, 2023). At broader scales, time-series models like ARMA, GARCH, KAR, and MCMC simulations have achieved around a 37% reduction in forecasting error for short-term U.S. housing price predictions (Guirguis et al., 2024). Zhang (2024) analyzed macroeconomic predictors using state-level panel data from 1982 to 2018, finding GDP positively and taxes negatively influenced housing prices (Zhang, 2024).
Modern research also uses some fancy deep learning models to predict housing prices. Li (2025) surveys recent forecasting literature, stressing the advantage of fusing numerical, textual, and image data via machine learning and deep learning frameworks to enhance housing price forecasting model performance (Li, 2025). Chen (2025) developed a backpropagation (BP) neural network enhanced with Bayesian regularization to mitigate multicollinearity in Boston housing data (Chen, 2025). Hasan, Jahan, Ali, and Li (2024) proposed a cutting-edge multi-modal deep learning model that fuses raw housing attributes, textual descriptions, geo-spatial neighborhood embeddings, and image data into a joint representation (Hasan et al., 2024). Yazdani (2021) compared artificial neural networks with traditional hedonic models and random forest regressions to Boulder, Colorado housing data and demonstrated that neural networks performed much better in capturing nonlinear relationships.
All the above classic theories and machine learning models have demonstrated high predictive accuracy using traditional and macroeconomic features in the Ames or other contexts with black-box machine learning models. However, few have explored the added value of engineered composite features on model performance and casual interpretability. Therefore, this proposal combines traditional econometric approaches with modern data science techniques to not only enhance predictive accuracy but also deepens understanding of what truly drives housing prices in mid-market cities.
Purpose Statement and Research Questions
The purpose of this study is to develop a systematic and interpretable predictive framework for housing prices in Ames, Iowa using both traditional structural and locational attributes as well as engineered composite variables derived from the raw dataset. While prior studies have focused on macroeconomic indicators, conventional housing attributes or black-box machine learning methodologies, limited research has investigated the effectiveness of engineered features over this dataset and mid-market city housing market. This study addresses that gap by constructing 3 new variables: percentage of finished area occupied, percentage of basement area to total living space and years since last remodel, and evaluating 5 supervised learning models, including Linear, Lasso and Ridge regressions, Random Forest and XGBoost, to examine the incremental predictive value offered by engineered variables. Through systematic data preprocessing, model developments and model evaluation using RMSE, R2, Correlation and Min-Max Accuracy metrics, the study aims to identify the most significant predictors of housing prices and determine the extent to which engineered features contribute to predictive accuracy and explainable variation in residential property values in a mid-sized U.S. housing market.
Research Questions
RQ1: Do engineered composite features, including the percentage of finished living area, the proportion of basement area to total living space, and years since last remodel, provide additional explanatory power or improve the predictive accuracy of different models beyond traditional features?
RQ2: Are traditional or engineered features emerge as the most influential predictors of sale price when evaluated through regularized regression models and interpretability tools like SHAP?
RQ3: What insights can feature importance rankings and SHAP value analyses provide about different factors that most strongly drive housing price variation in Ames?
Methods
The following section draws substantially from my earlier proposal completed for HU GRAD 695 (Wang, 2025).
To address the three research questions specified earlier, a quantitative analysis was conducted using structured housing attributes and engineered composite features derived from the raw dataset. The dataset was preprocessed through missing value imputation, outlier handling, feature transformation, and one-hot encoding of categorical variables. For the first research question, predictive models were trained using both traditional and engineered features, and model performance was evaluated using RMSE, R-squared, Correlation and Min-Max Accuracy to determine if the engineered variables provided additional explanatory power. To answer the second research question, the relative importance of traditional and engineered predictors was examined through regularized regression models, including Ridge and Lasso by SHAP-based interpretability tools. Finally, to address the third research question, SHAP analyses were used to compare feature influence patterns for a deeper understanding of the underlying factors driving housing price variation in Ames.
Data
The dataset used for this analysis is sourced from Kaggle’s House Prices Prediction competition, consisting of multiple attributes of residential homes in Ames, Iowa. The dataset contains 1460 observations, including 79 explanatory variables, with 37 being numeric variables and 42 being characters (House Prices—Advanced Regression Techniques, n.d.). Several variables in the dataset have been widely acknowledged in housing literature as strong predictors of market value, including OverallQual(overall quality of materials and finish), GrLivArea(above-ground living area), GarageArea(garage size), TotalBsmtSF (total basement area), and 1stFlrSF (first floor size).This study utilizes both the raw variables provided in the dataset and additional engineered variables designed to capture extra information not directly represented in the original data.
Preprocessing
A preprocessing pipeline was implemented to ensure data quality. The major steps include imputation of missing values, detection and handling of outliers. Categorical features were transformed using one-hot encoding for regression-based learning algorithms. Boolean type variable was converted into binary integers to maintain consistency across the dataset. The dataset was then partitioned into training, validation, and test splits using 5 different randomly generated seeds to enable robust out-of-sample model evaluation and reduce the effect of sample errors.
Feature Engineering
To improve model interpretability and predictivity, several engineered features were created according to specific definitions explained below. These engineered variables were constructed to represent practical considerations in real life housing valuation.
1. Percentage of Finished Area (PctFinishedArea):
Computed as the ratio of above-ground living area to the sum of total usable space. To eliminate dividing by zero error, total area is calculated as the sum of 3 variables 1stFlrSF, 2ndFlrSF and TotalBsmtSF. This ratio reflects the real area of the home that is finished and livable, which serves as a practical available usage of a house that raw square footage alone may not represent.
2. Percentage of Basement Area to Living Space (PctBasementArea):
Computed as the ratio of basement space relative to total above-ground living area, which provides a standard for utility and layout design within overall home functionality.
3. Years Since Last Remodel (YearsSinceRemodel):
Computed as the difference between the sale year and the last remodeling year. This number gives specific time information of a home’s interior updates and modernization contributes to its market valuation.
Modelling
This study employed a wide range of supervised learning algorithms to assess the predictive performance of both traditional and engineered housing features. Five models were selected here: Linear Regression, Ridge Regression, Lasso Regression, Random Forest, and XGBoost. The selection includes both linear and non-linear models serving for different model considerations including easy interpretability, ability to handle multicollinearity, effective factor selections and powerful predictive accuracy.
Linear Regression
Multiple Linear Regression served as the benchmark model, providing an interpretable framework for estimating the linear relationships between predictors and sale price. The coefficients of the linear model define how each individual variable contributes to the final housing price. Its easy setup also allows it to be a good baseline model to be compared with other complex models.
Ridge Regression
Ridge Regression was implemented to address multicollinearity inherent in the dataset, where reducing the effect of many structural variables being highly correlated. The L2 regularization shrinks coefficient magnitudes without eliminating predictors, improving model stability and reducing variance. Ridge regression is particularly useful for evaluating whether engineered features provided incremental value beyond the raw variables.
Lasso Regression
Lasso Regression introduced L1 regularization, enabling automatic feature selection by shrinking less informative coefficients to zero. This model serves not only as a predictive model but also as an interpretability tool to determine most significant factors driving housing price.
Random Forest
Random Forest Regression provided a non-linear, tree-based model capable of capturing complex interactions among various features. The model constructs an ensemble of decision trees using bootstrap aggregation, which can be used to reduce overfitting and capture non-additive effects. Random Forest also generates feature importance rankings, offering a complementary, non-parametric perspective to the linear models.
XGBoost
XGBoost, short for Extreme Gradient Boosting, was widely used in predictive tasks as a high-performance ensemble learning method that sequentially builds decision trees. So that it can correct residual errors from previous iterations by itself during the model run. It provides highly accurate modeling of non-linear relationships. Its regularization mechanisms incorporating both L1 and L2, shrinkage parameter, and learning rate help control overfitting while optimizing predictive accuracy.
Model Evaluation
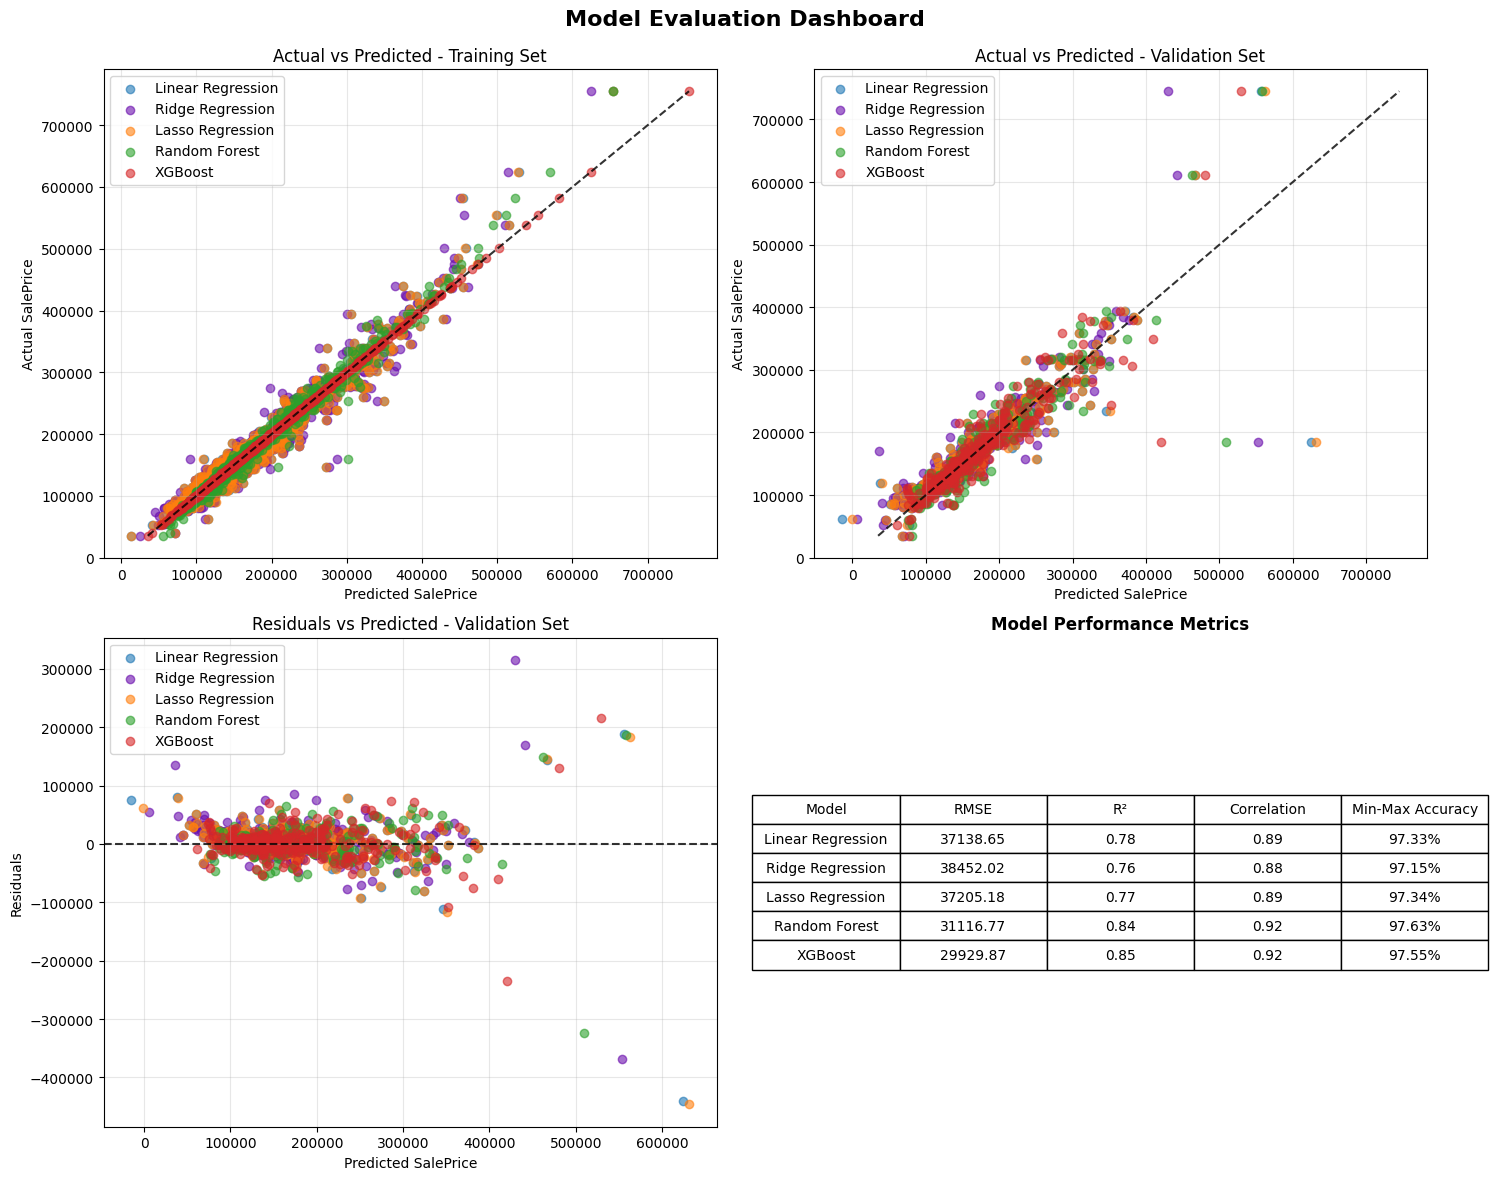
Model performance was evaluated using 4 different quantitative metrics: Root Mean Squared Error (RMSE), R-squared (R2), Pearson correlation coefficient, and Min-Max Accuracy, to assess prediction accuracy, stability, and goodness of fit across the five supervised learning models. For each model, predictions were generated using both the training and validation datasets.
RMSE and
RMSE is a measure of average prediction errors, with lower values indicating stronger predictive performance. R2 stands for the proportion of variance in sale price explained by the model. Pearson correlation measured the linear association between predicted and actual prices. Min-Max Accuracy, defined as 1 minus the ratio of absolute error to the price range, served as an additional scaled measure of model performance.
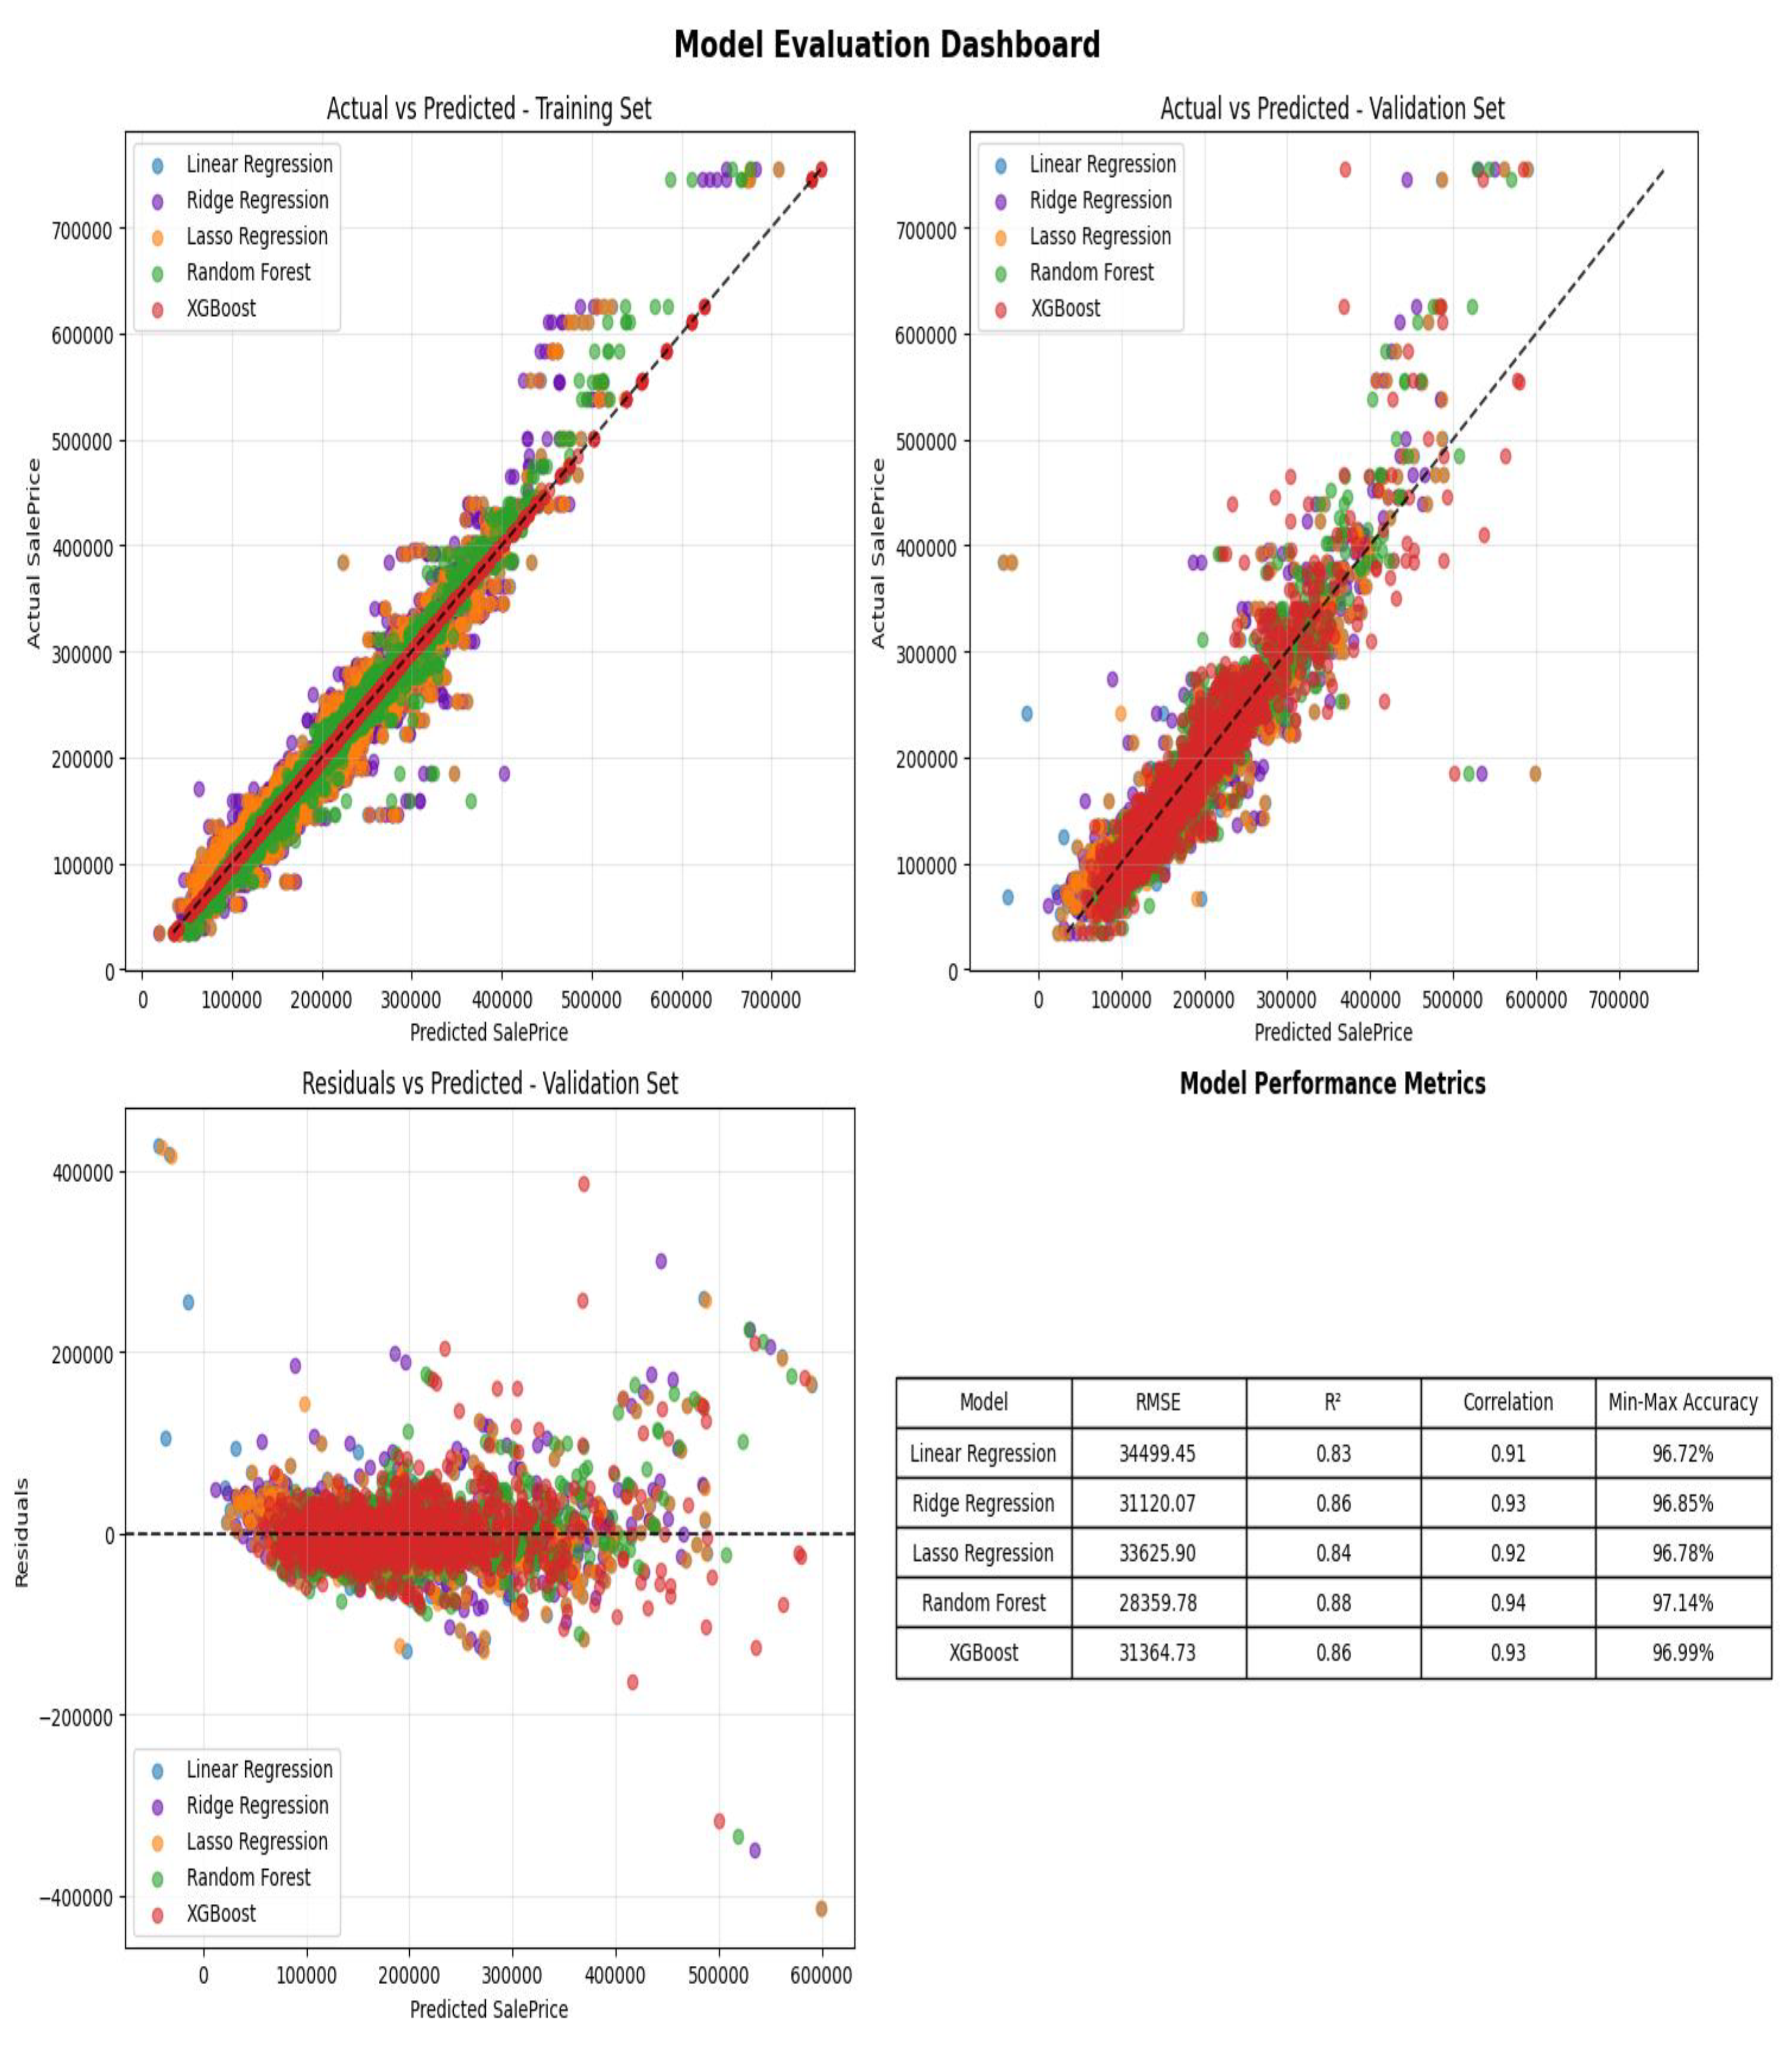
Residual plots, scatterplots of predicted versus actual values, and performance dashboards were generated to visually diagnose model fit, heteroscedasticity, and potential outlier sensitivity. SHAP-based interpretability analysis was conducted for all models to assess feature influence and stability.
All above metrics and analyses provide both quantitative and qualitative evaluations to assess factors that might affect the housing price in Ames.
Results
This section shows the results and visualizations of the analyses conducted and addresses each of the research questions accordingly.
SHAP Analysis
SHAP analysis is a powerful and widely adopted approach in machine learning for interpreting the predictions of complex models. SHAP provides both global and local explanations of model behavior by decomposing each prediction into additive feature contributions. This methodology also visualizes the individual feature impact which enabled direct comparisons of traditional structural variables and the engineered composite features.
Linear Models (Linear, Ridge, Lasso)
From the Fiugre 1 & 2 with top 20 averaged SHAP importances on linear regression, Total Area displays as the dominant predictor with the highest SHAP values with stable and monotonic SHAP trend. It’s common that every house buyer will be interested in how big my house is and it has a positive linear relationships with housing price. Specifically, increasing in size will increase predicted homes price. The engineered features also demonstrate significant contributions to model interpreatbility and predictions. PctBasementArea and PctFinishedArea show positive SHAP values, reflecting the economic importance of fully usable, finished living space and larger basement area. YearSinceRemodel yields smaller positive relationship but still show up in the top 20 list that capture temporal depreciation effect. New builds give higher housing value and vice versa.
The introduction of regularization through Ridge and Lasso produces more refined SHAP interpretations. Ridge regression stabilizes coefficients in the presence of multicollinearity, resulting in smoother and more evenly distributed SHAP contributions across correlated predictors, particularly among the various size features including total area, basement area, first-floor area. From Figure 2, we conclude that GrLivArea, TotalArea, OverallQual and 2ndFlrSF display as the dominator attributes in the model that highlight the importance of space area and quality in housing price determinants. Compared to linear model, it penalizes large coefficients and distributes weight among correlated predictors such as 1stFlrSF and 2ndFlrSF. The engineered factor PctBasementArea still list in the top 5 factors to provide posititve values, while YearSinceRemodel also yields small but impactful positive relationship with the housing price. To conclude, as of top influential factors, Ridge regression give structural robust selections over housing size, quality and functional space as main drivers.
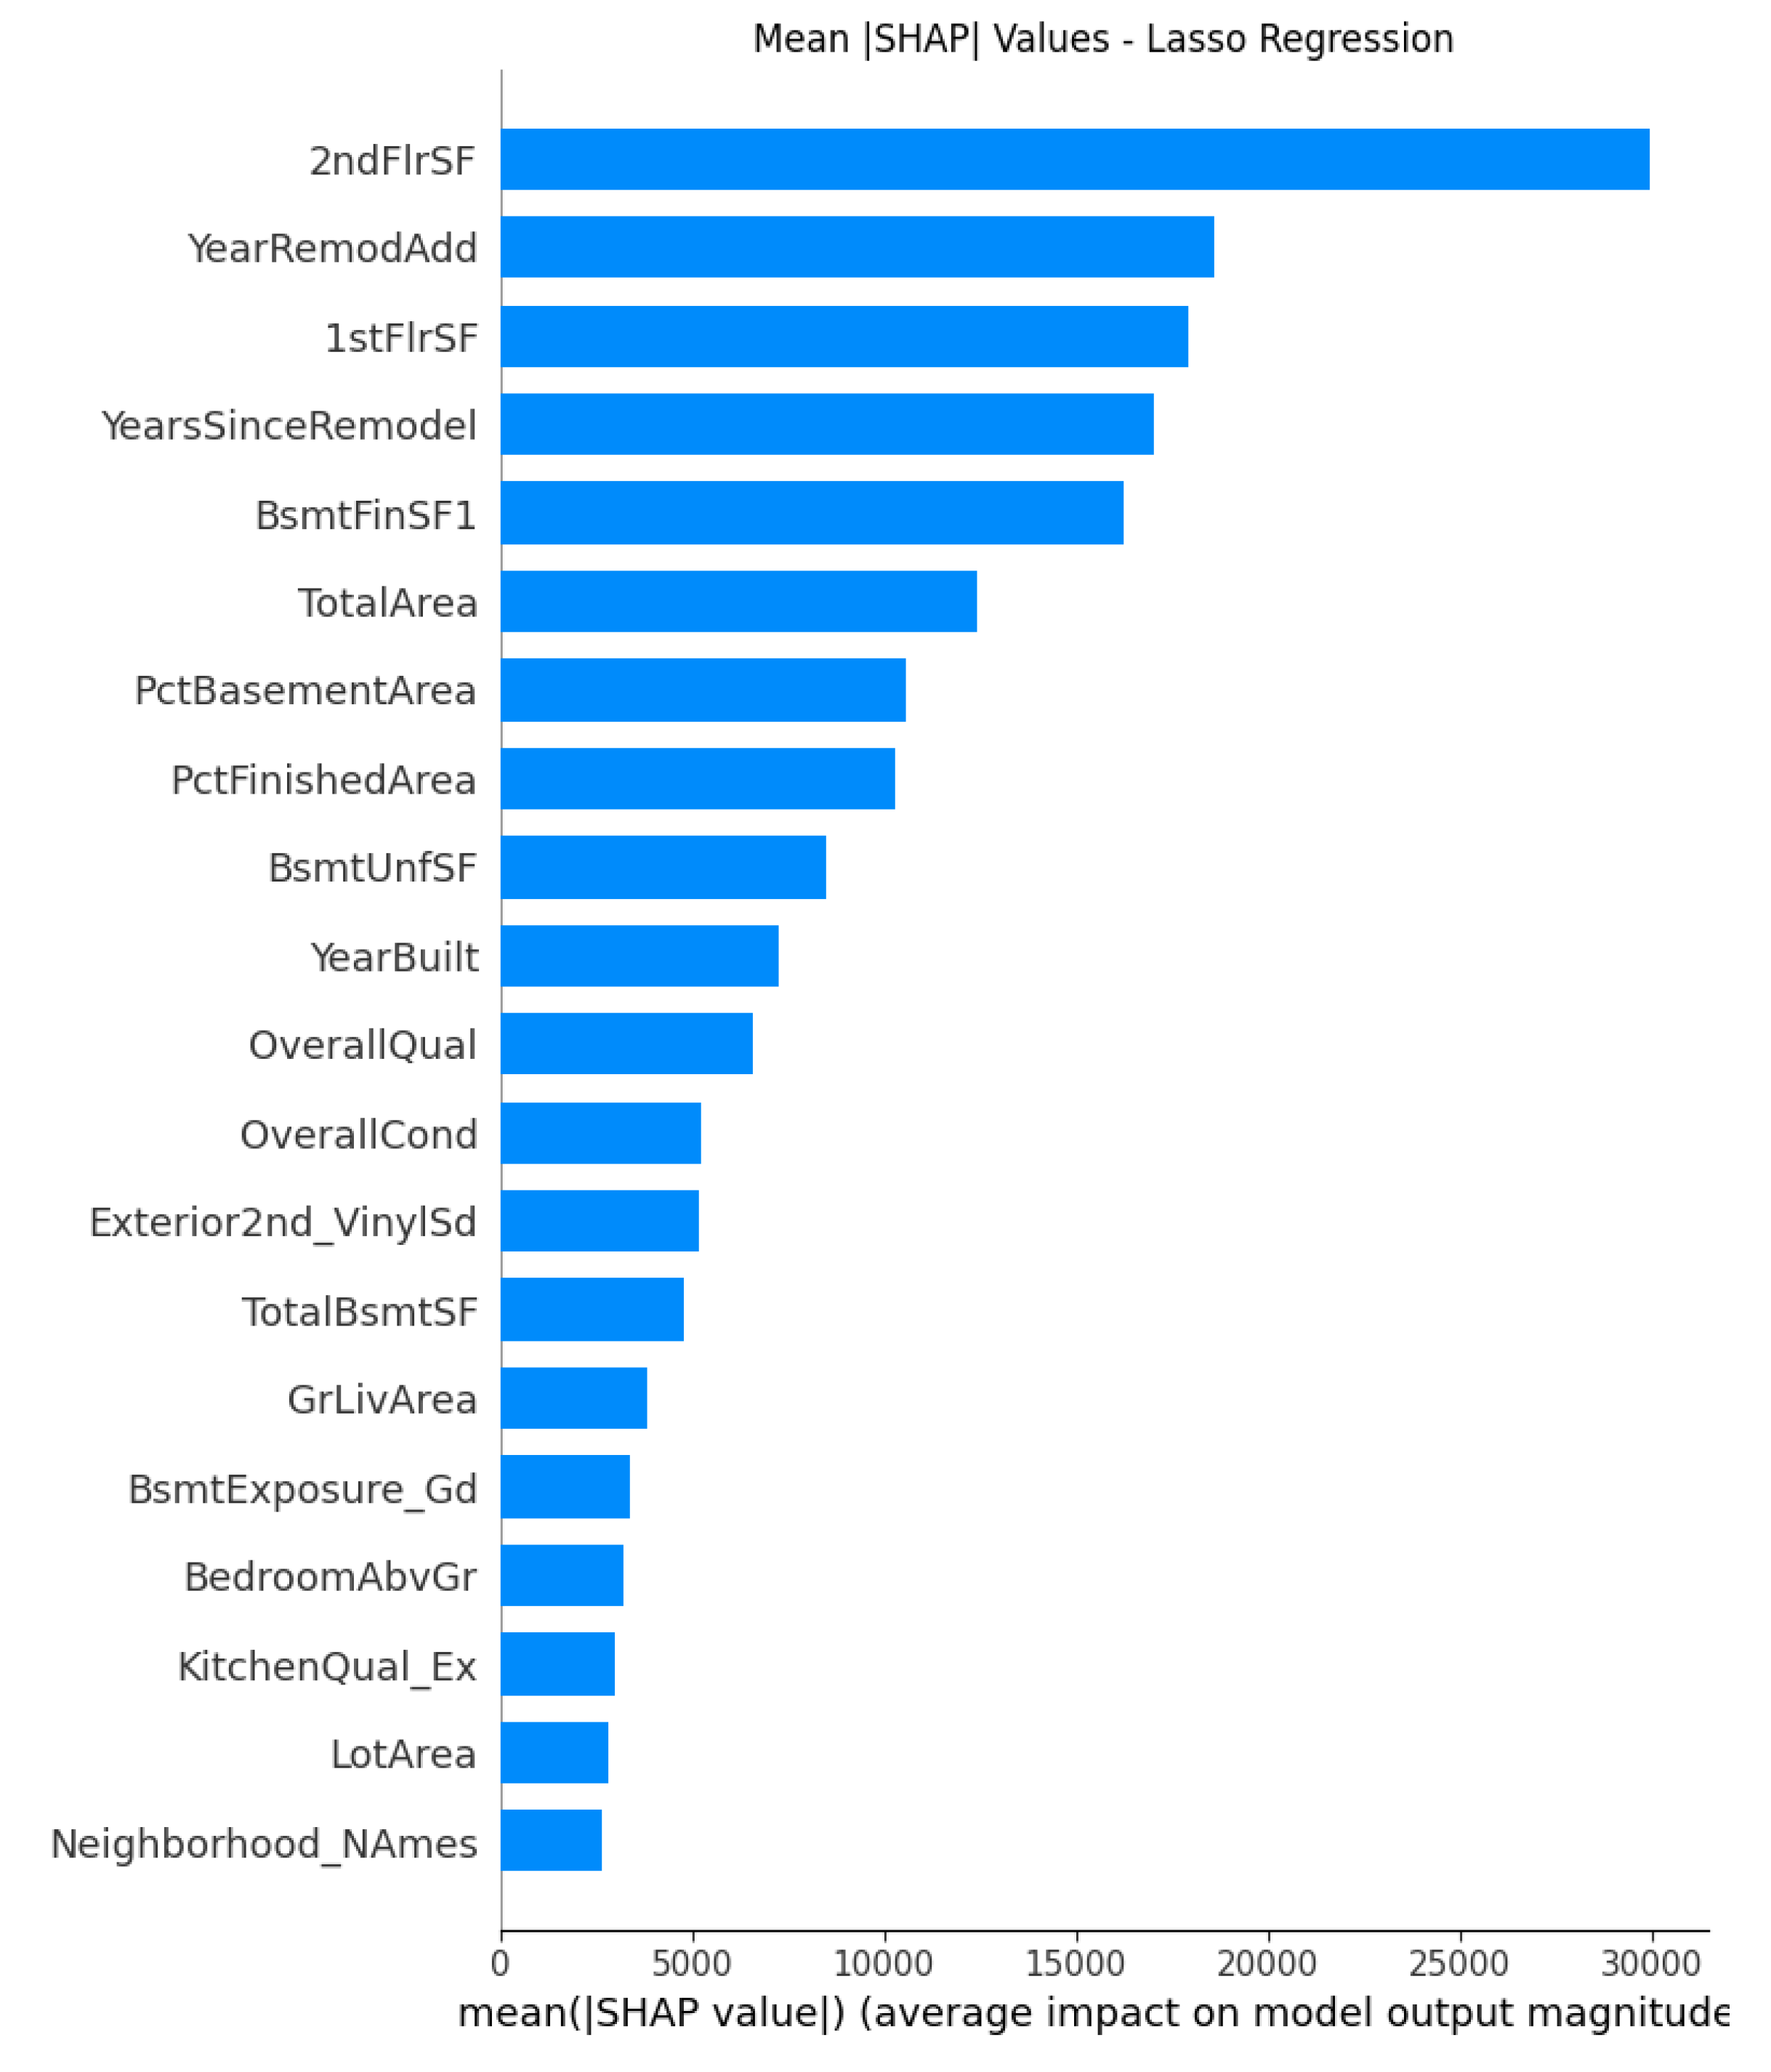
Lasso regression performs aggressive coefficient shrinkage, eliminating less important predictors and performing feature selections that highlights a smaller set of dominant variables. In Lasso, larger floor areas raise predicted prices with strong positive relationships among 2ndFlrSF, 1stFlrSF and TotalArea. The engineered features such as PctFinishedArea and YearsSinceRemodel frequently rise in importance relative to correlated traditional attributes, providing as strong evidences of their value in predictive models. Neighborhood_NAmes and LotArea appear first time at the bottom with smaller but new perspective of housing price deterninants. Therefore, the Lasso regression highlights a complete set of structural, temporal and aging drivers of Ames housing price.
To conclude, the SHAP analyses for the three linear models reveal a consistent trend of influential predictors driven by home size, strucural quality and mordernity as the pillars of price predictions. The analyses also reveal significant contributions from engineered features reflecting modernization and space efficiency. While the Linear Regression model provides the most direct reflection of additive relationships with detailed but overlapping influencial factors, Ridge and Lasso enhance interpretability by stabilizing or selecting among correlated features to provide more concise and focused view that explaining key drivers in simple terms. Therefore, the linear model SHAP results show that engineered features significantly enrich the explanatory power of linear frameworks and offer clearer insight into the components of housing value.
Figure 1.
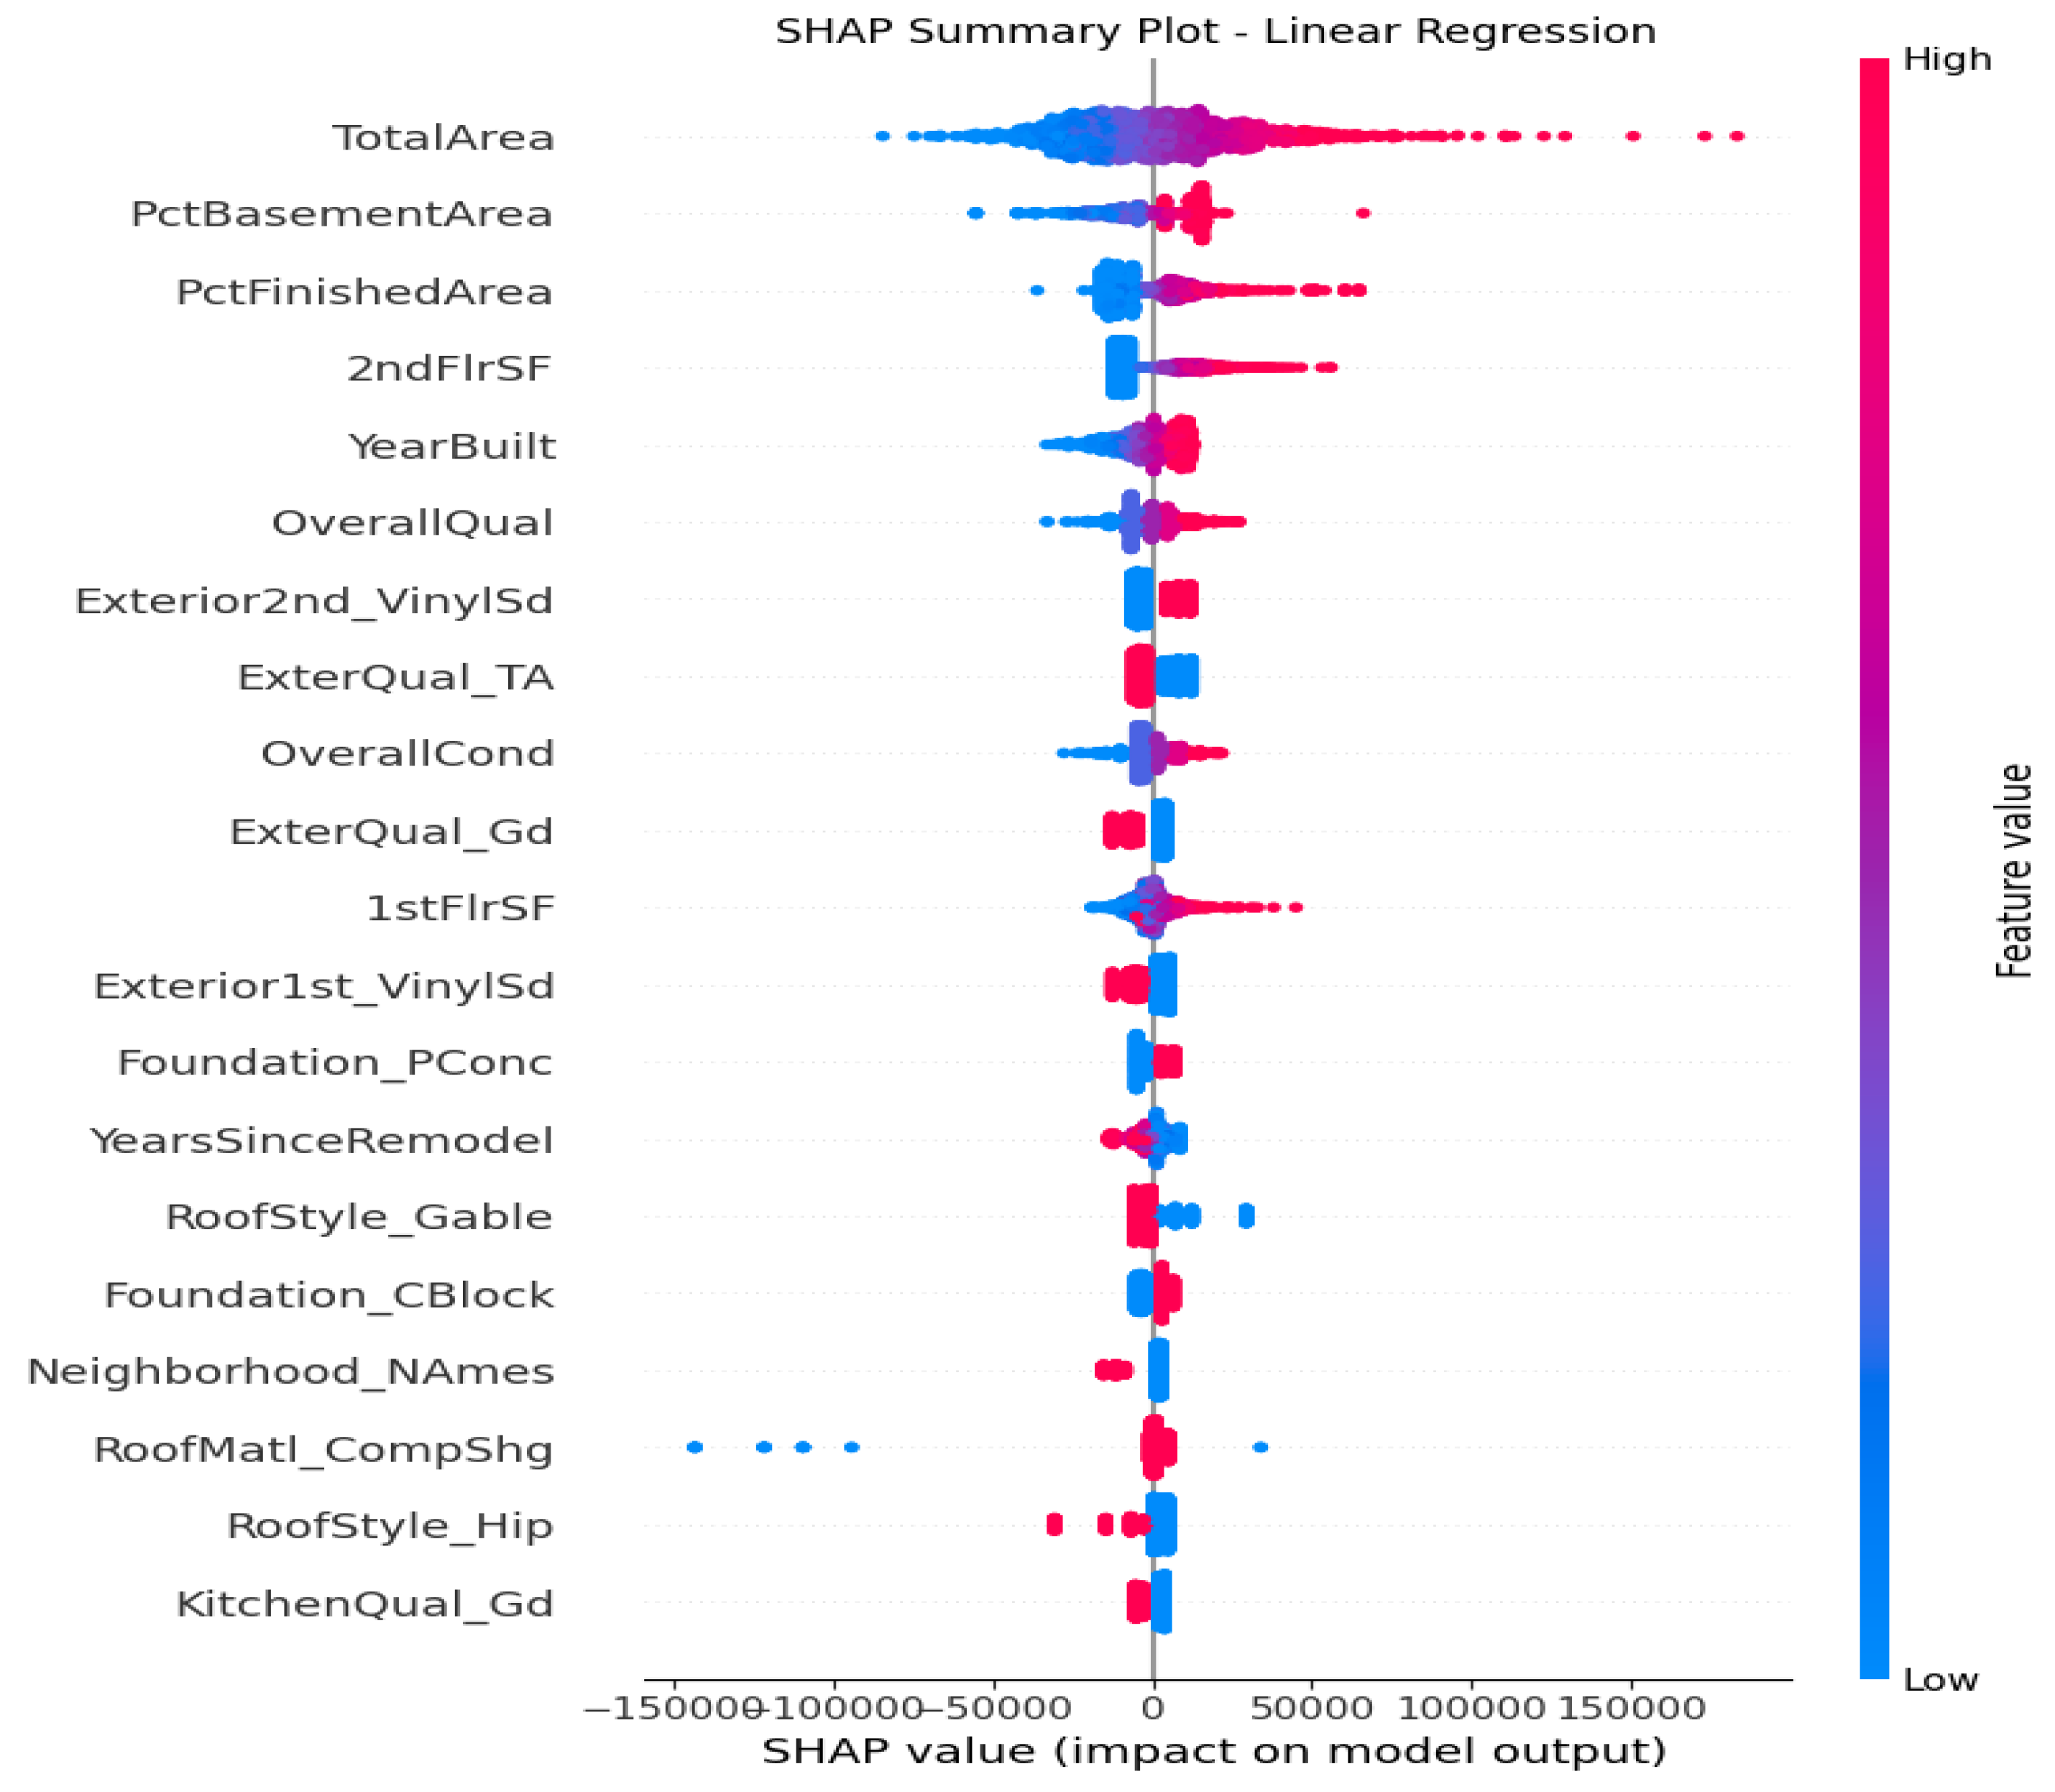
Figure 2.
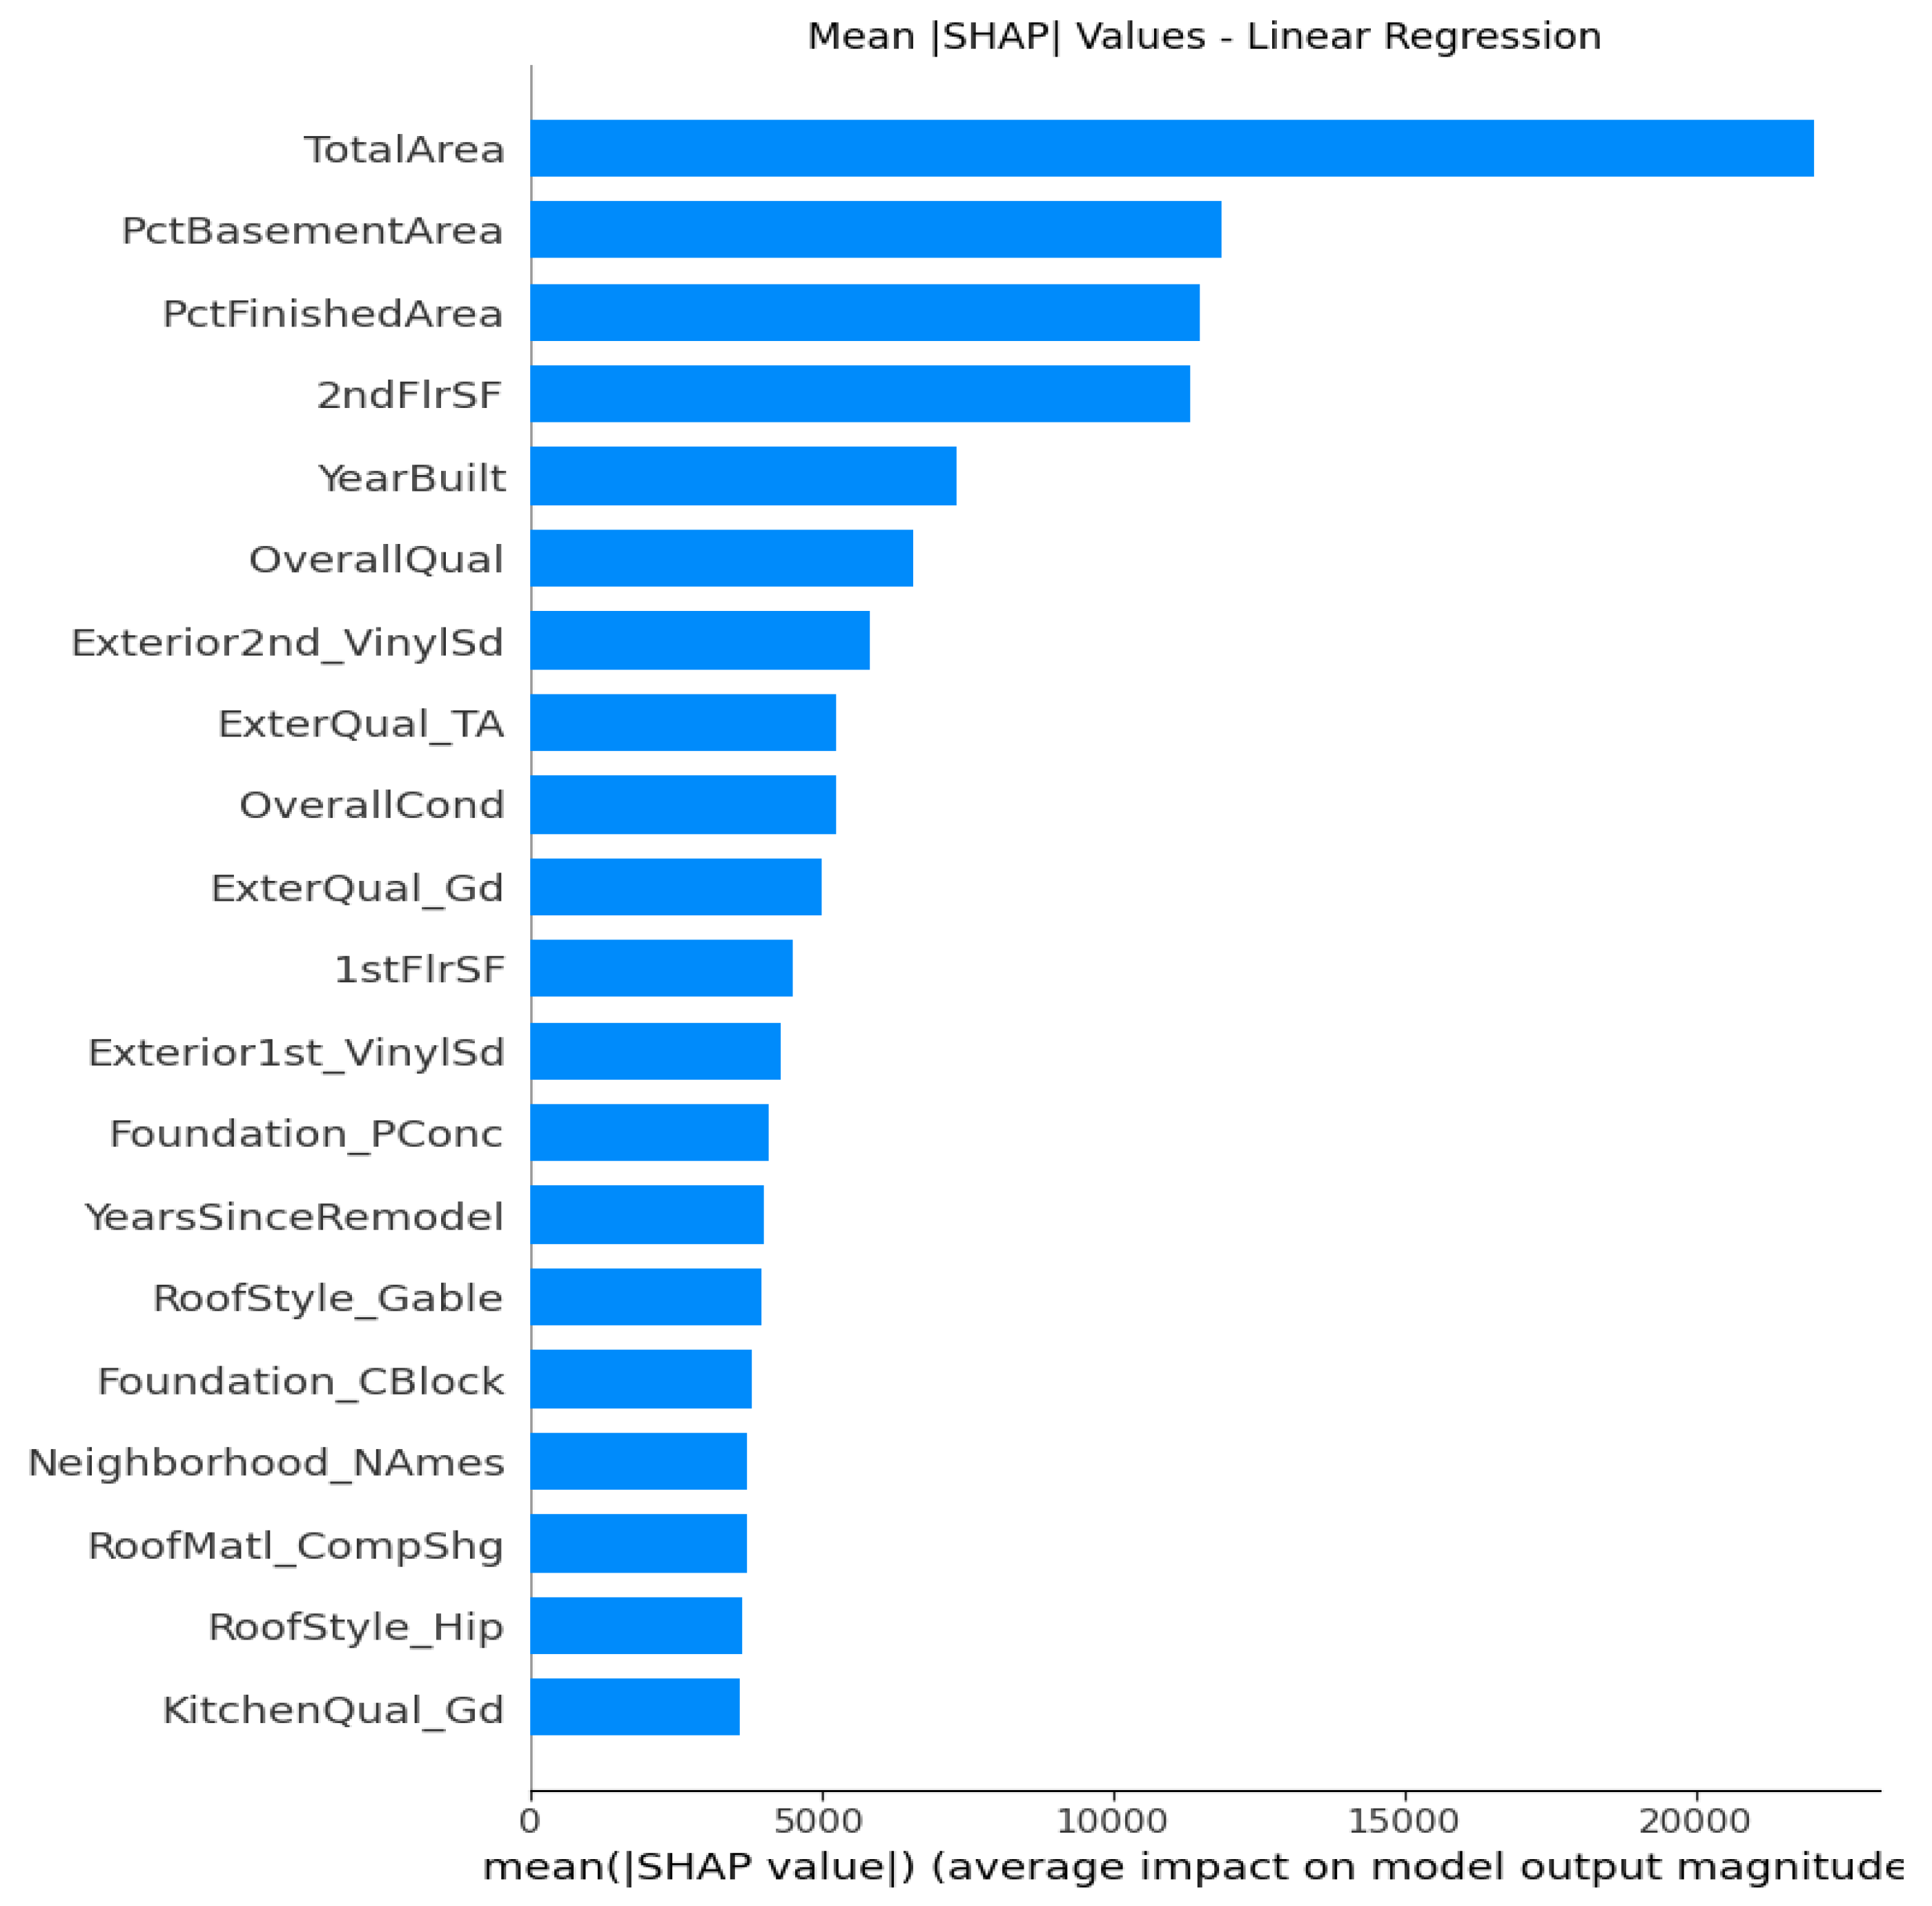
Figure 3.
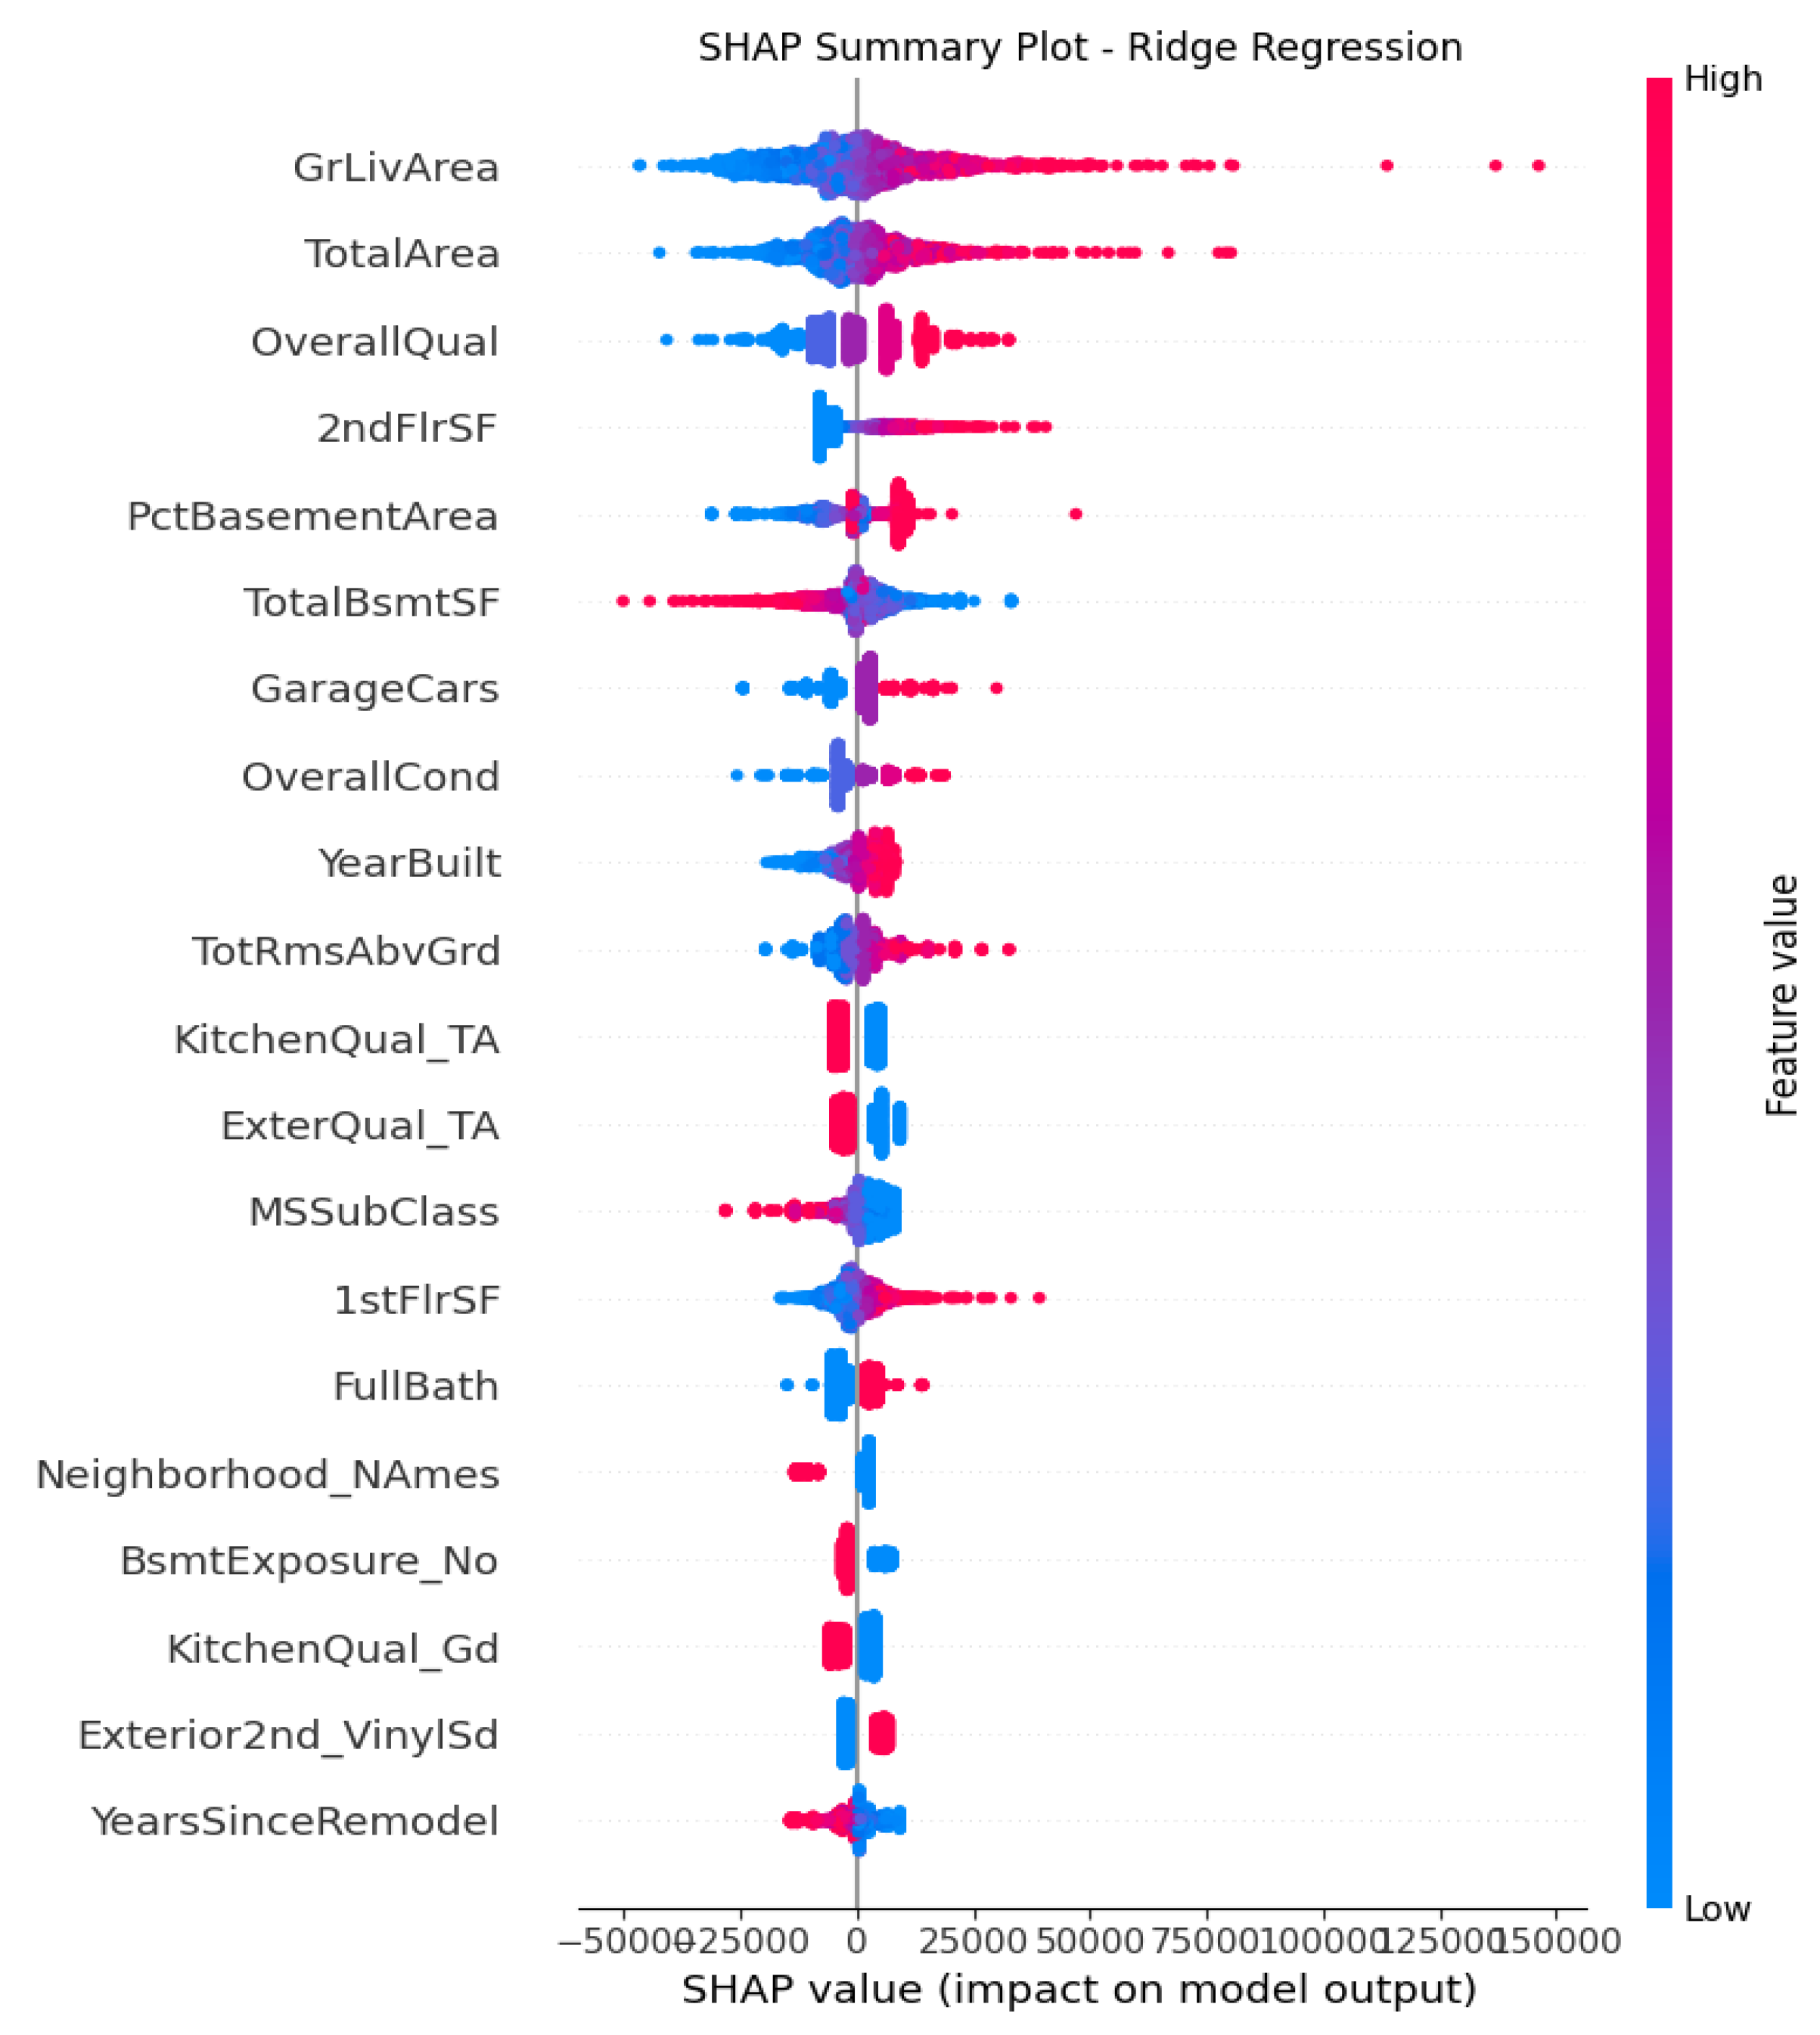
Figure 4.
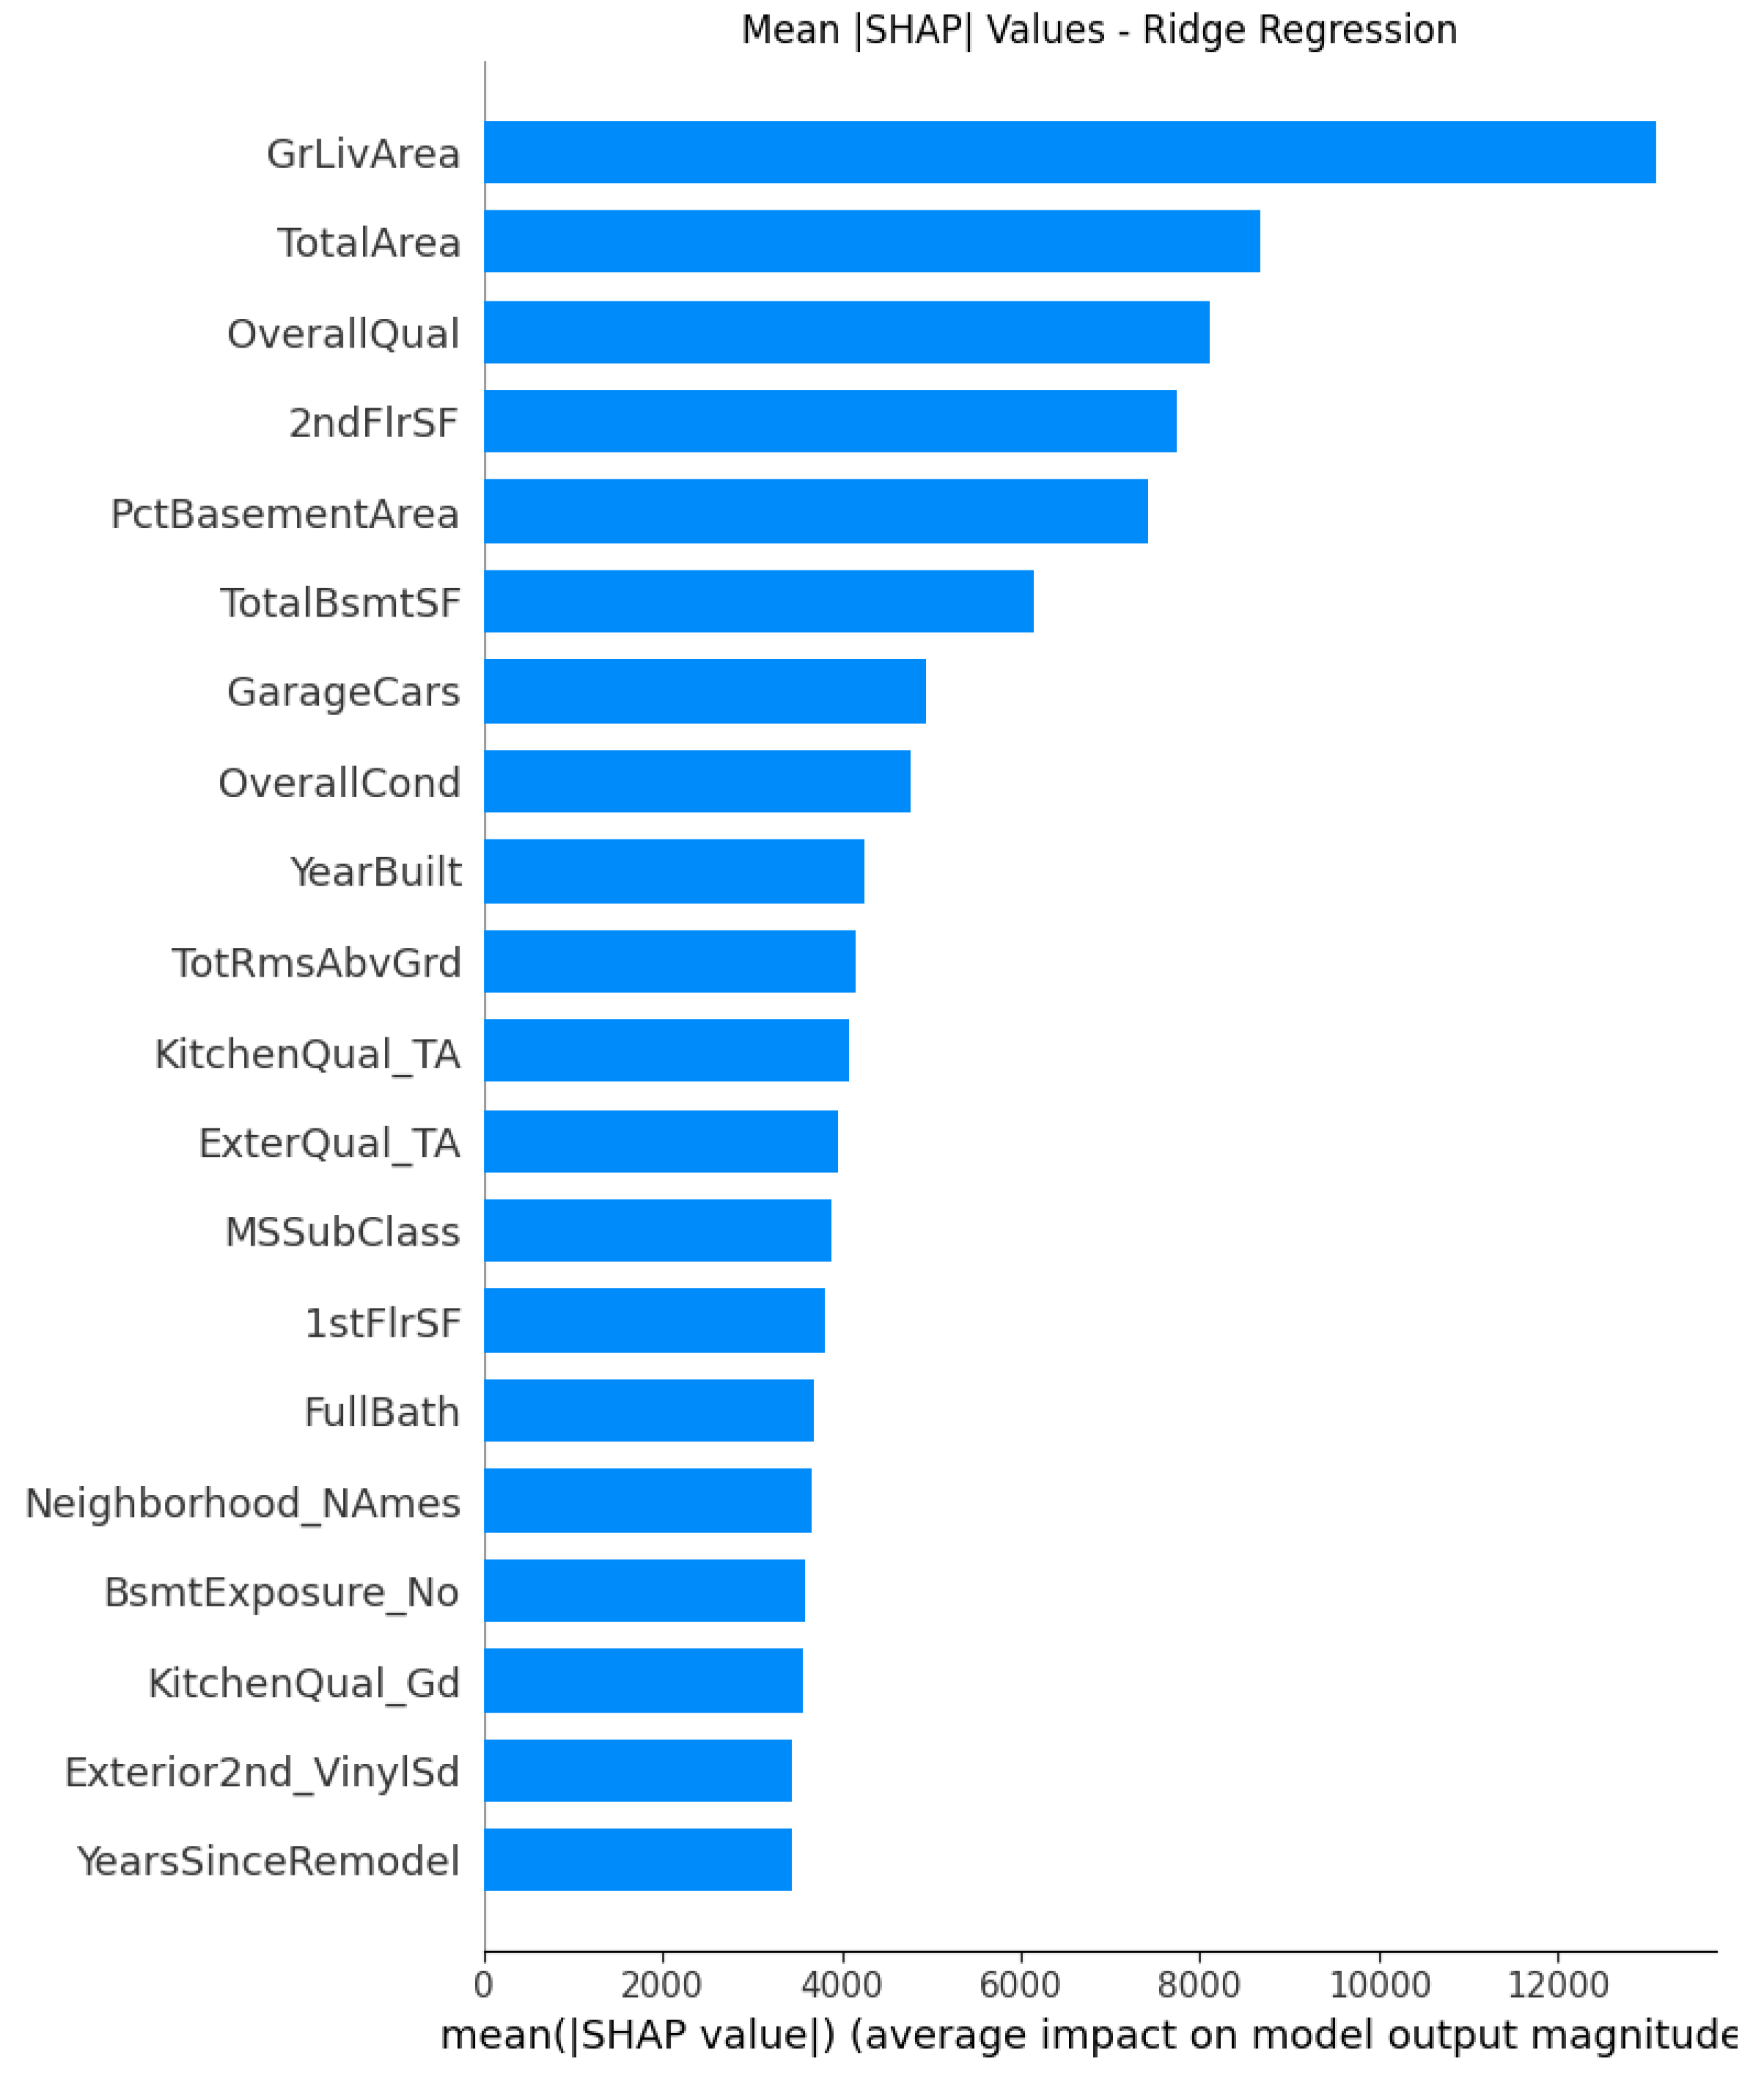
Figure 5.
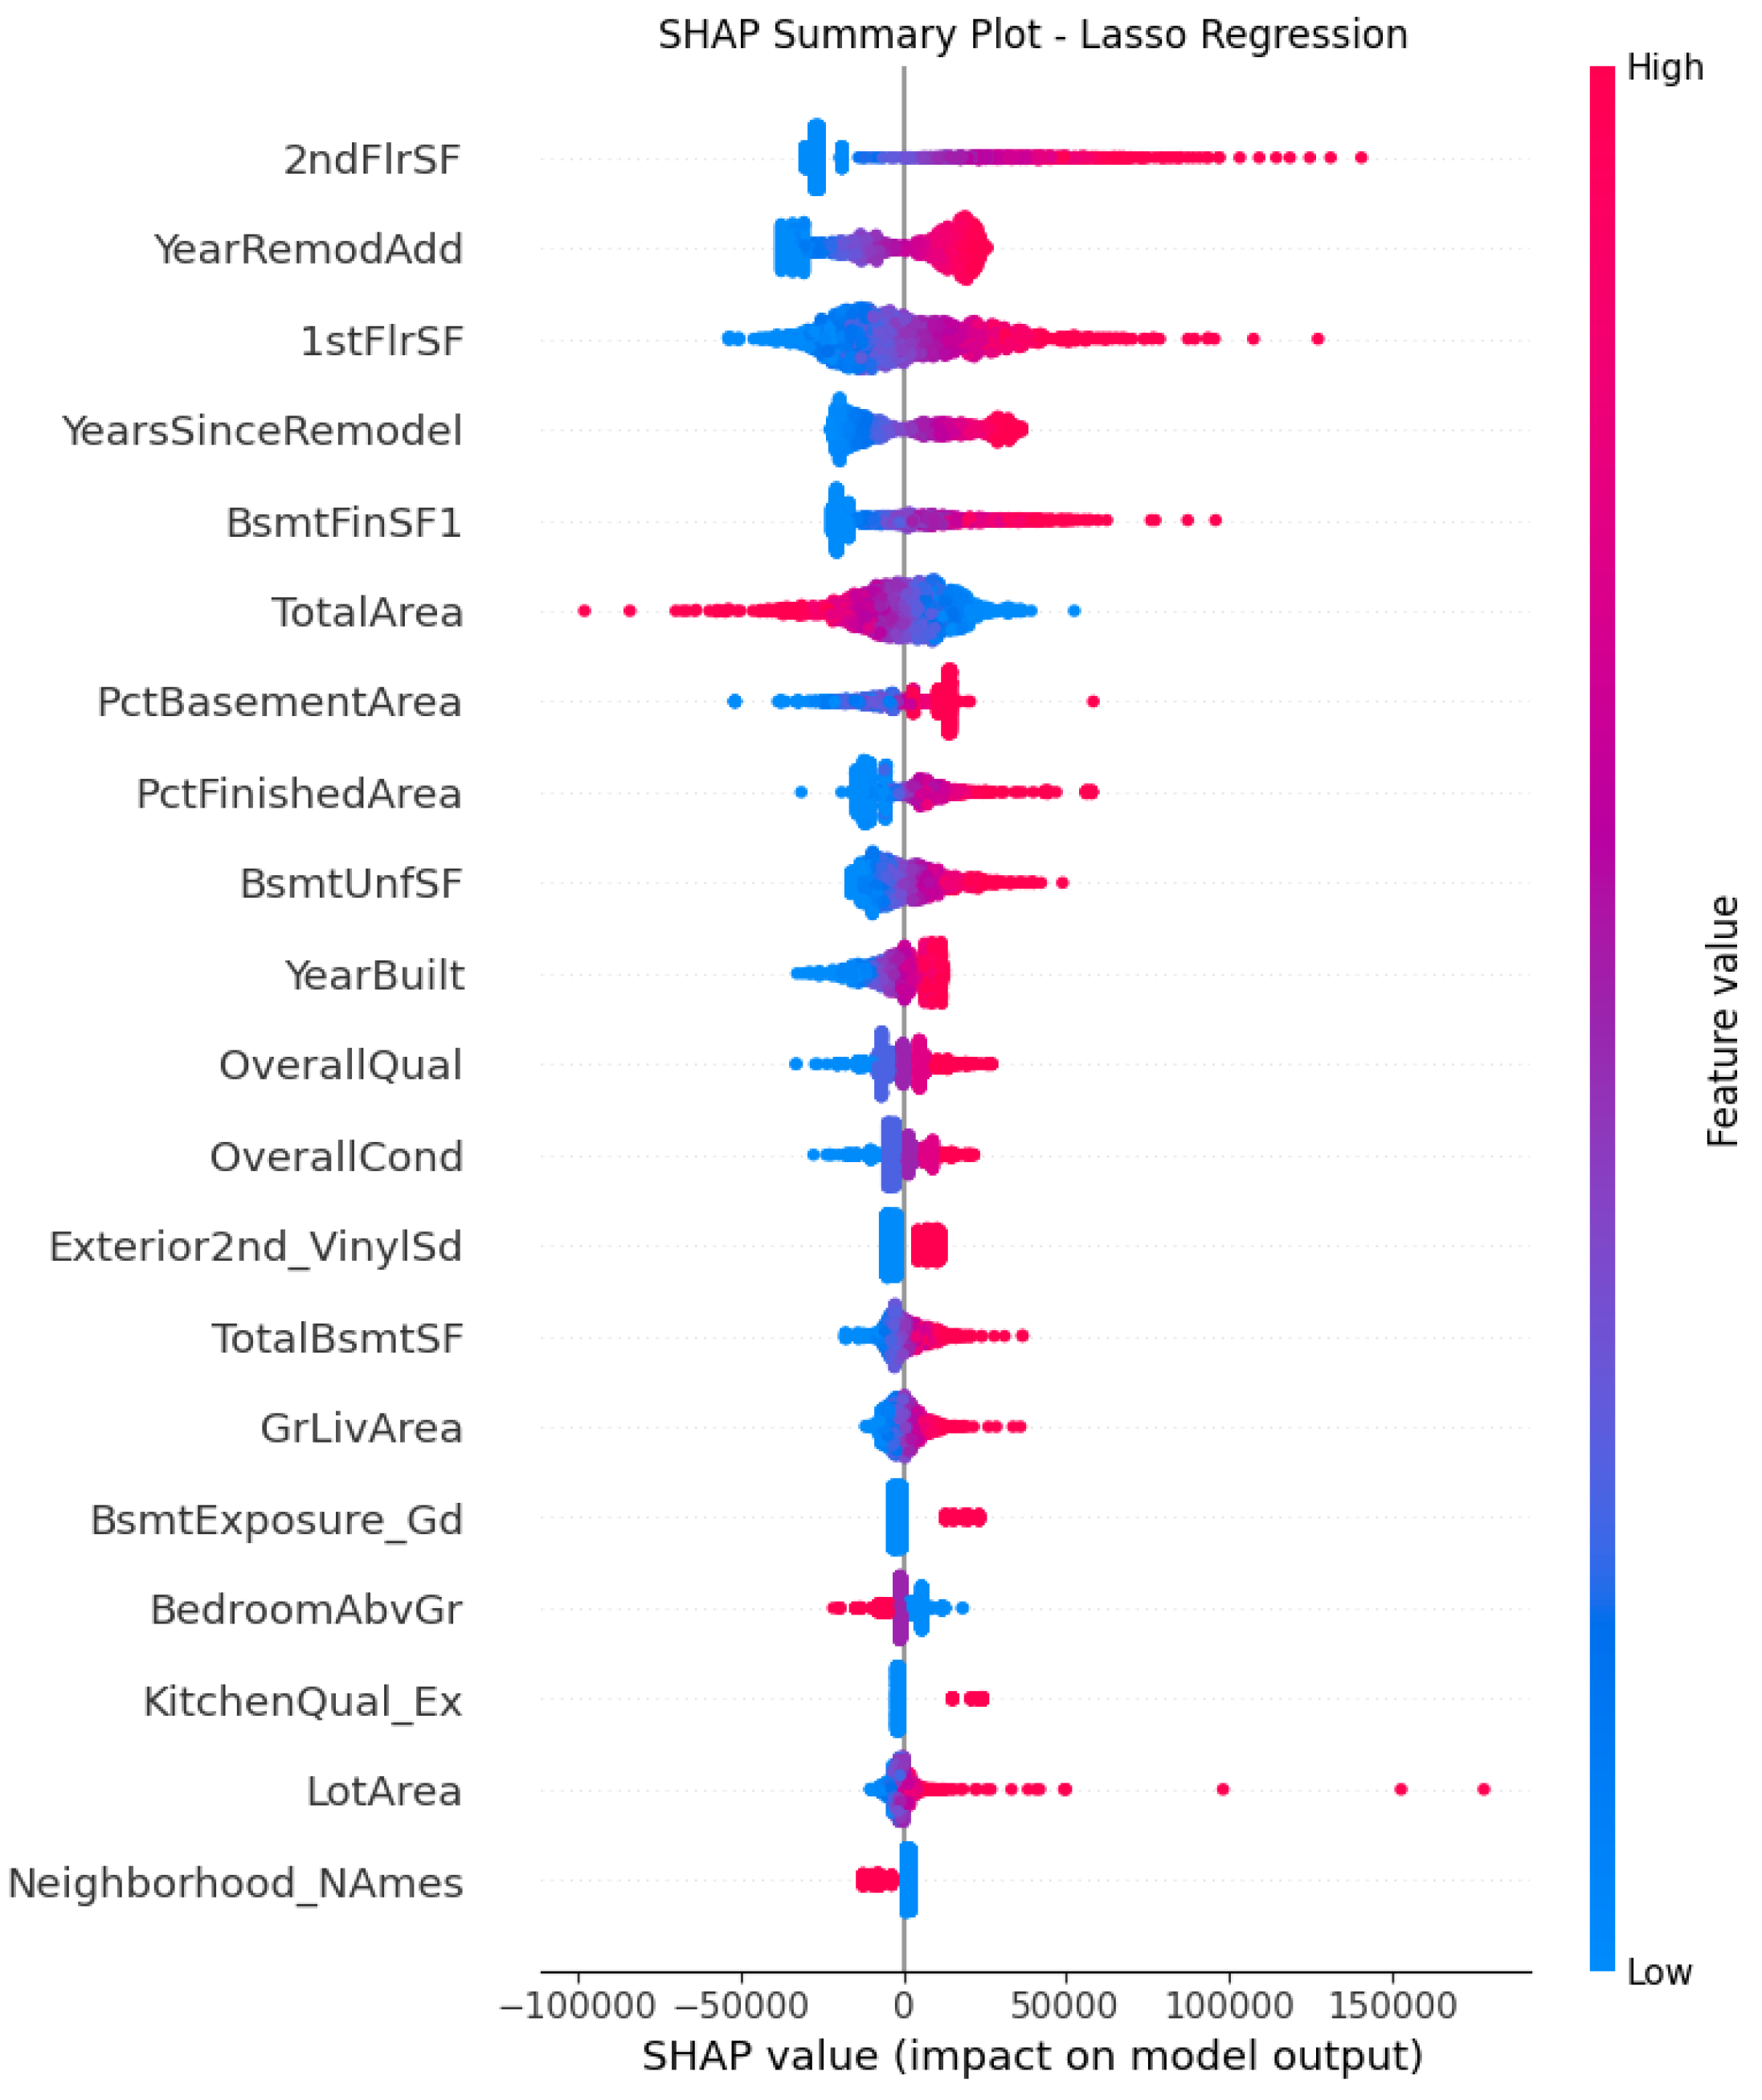
Figure 6.
Non-Linear Models (Random Forest, XGBoost)
SHAP analysis applied to the non-linear models provides a unified framework to explain the output of any model by assigning each feature an importance value for a particular prediction. Unlike linear models, which impose additive and monotonic constraints, these tree-based ensemble methods allow for flexible modeling of thresholds, interactions, and nonlinear patterns. However, in order to make linear and non-linear models consistent in comparisons, we only visualizes the individual feature impact.
For Random Forest and XGBoost, TotalArea, Overall Quality, YearBuilt and GrLivArea, in Figure 7 to 10 dominate with strong positive relationships with price that indicates similar conclusions that structural quality, size and aging are key to house values. However, unlike in linear models, there are more complex interactions and curvature patterns observed in these non-linear models.
The Figure 7 of Random Forest shows OverallQual a very wide red to blue gradient, indicating it as the most influential nonlinear factors. GarageArea and GarageCars add measurable contributions but with some diminishing returns with flattened spread. LotArea and Fireplaces contribute modestly as secondary amenities recognized in Random Forest with nonlinear but smaller magnitude effect. It also captures interactions and nonlinearities. The effect of TotalArea depends on OverallQual and YearBuilt with clusters and tails in the plot. This observation illustrates that beyond a certain size, added area contributes less to the price.
The Figure 9 of XGBoost shows the clearest interaction structures, with SHAP values indicating that quality, modernization, and space efficiency work together to elevate prices. Take Basement and garage features BsmtFinSF1, GarageArea, GarageCars as an example, all of them consistently contribute positively, but the diminishing returns pattern suggests the model captures nonlinearity with the third garage adds less value than the first. Quality and condition attributes like OvrallCond, BsmtQual_Ex, KitchenQual_TA still matter, but XGBoost reduces their dominance relative to structural size variables because tree ensembles model these interactions implicitly. All these findings clearly state that XGBoost is more powerful than Random Forest in non-linear relationship capture.
The same effects also apply to the engineered features from the plots. Although only YearsSinceRemodel shows up as an influential factor in both models, it ranks very high. People are willing to pay premiums on recently remodeled houses with strong upward pattern on predicted price. At the same time, the older remodels generate disproportionately negative effects. However, the SHAP variance of the factor tells a bit of difference in these two models. Random Forest captures discrete segmentations with clear nonlinear jumps across threshold, while XGBoost produces a more smoothed spread which indicates gradual diminishing returns over price. The Random Forest model generates segmented SHAP distributions that reflect discrete market thresholds, while XGBoost offers greater sensitivity to nuanced interactions and diminishing returns.
Figure 7.
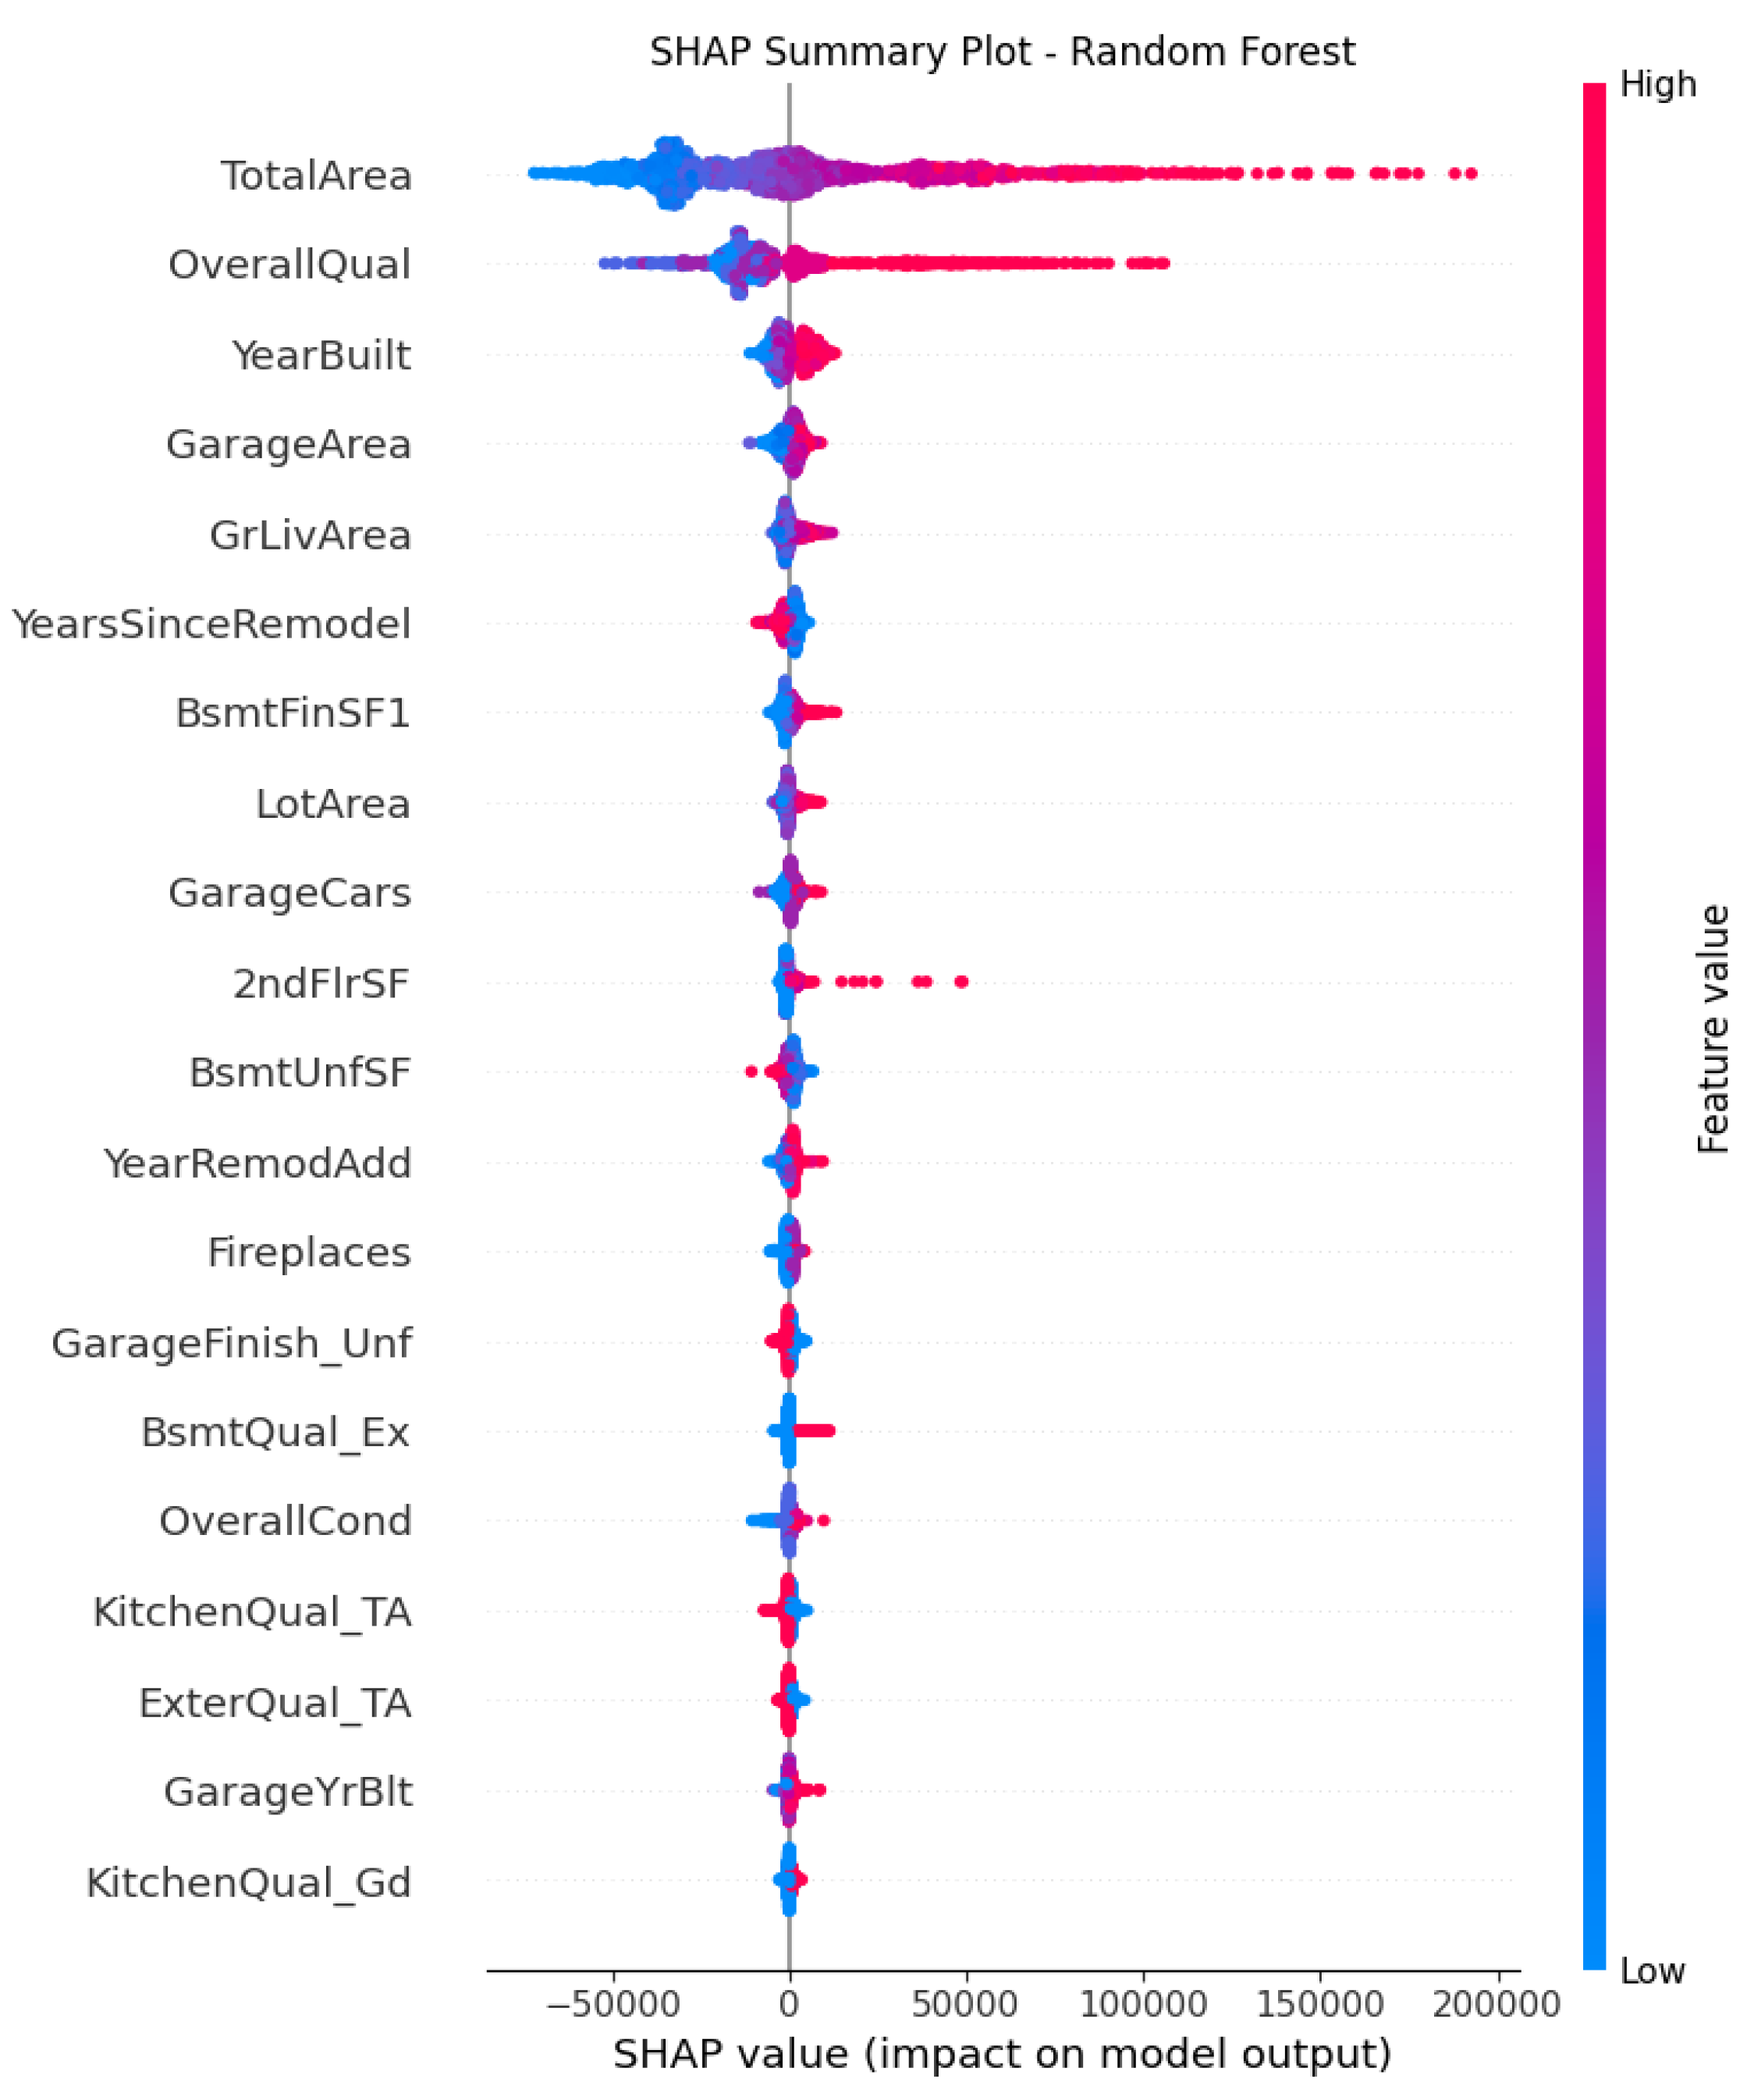
Figure 8.
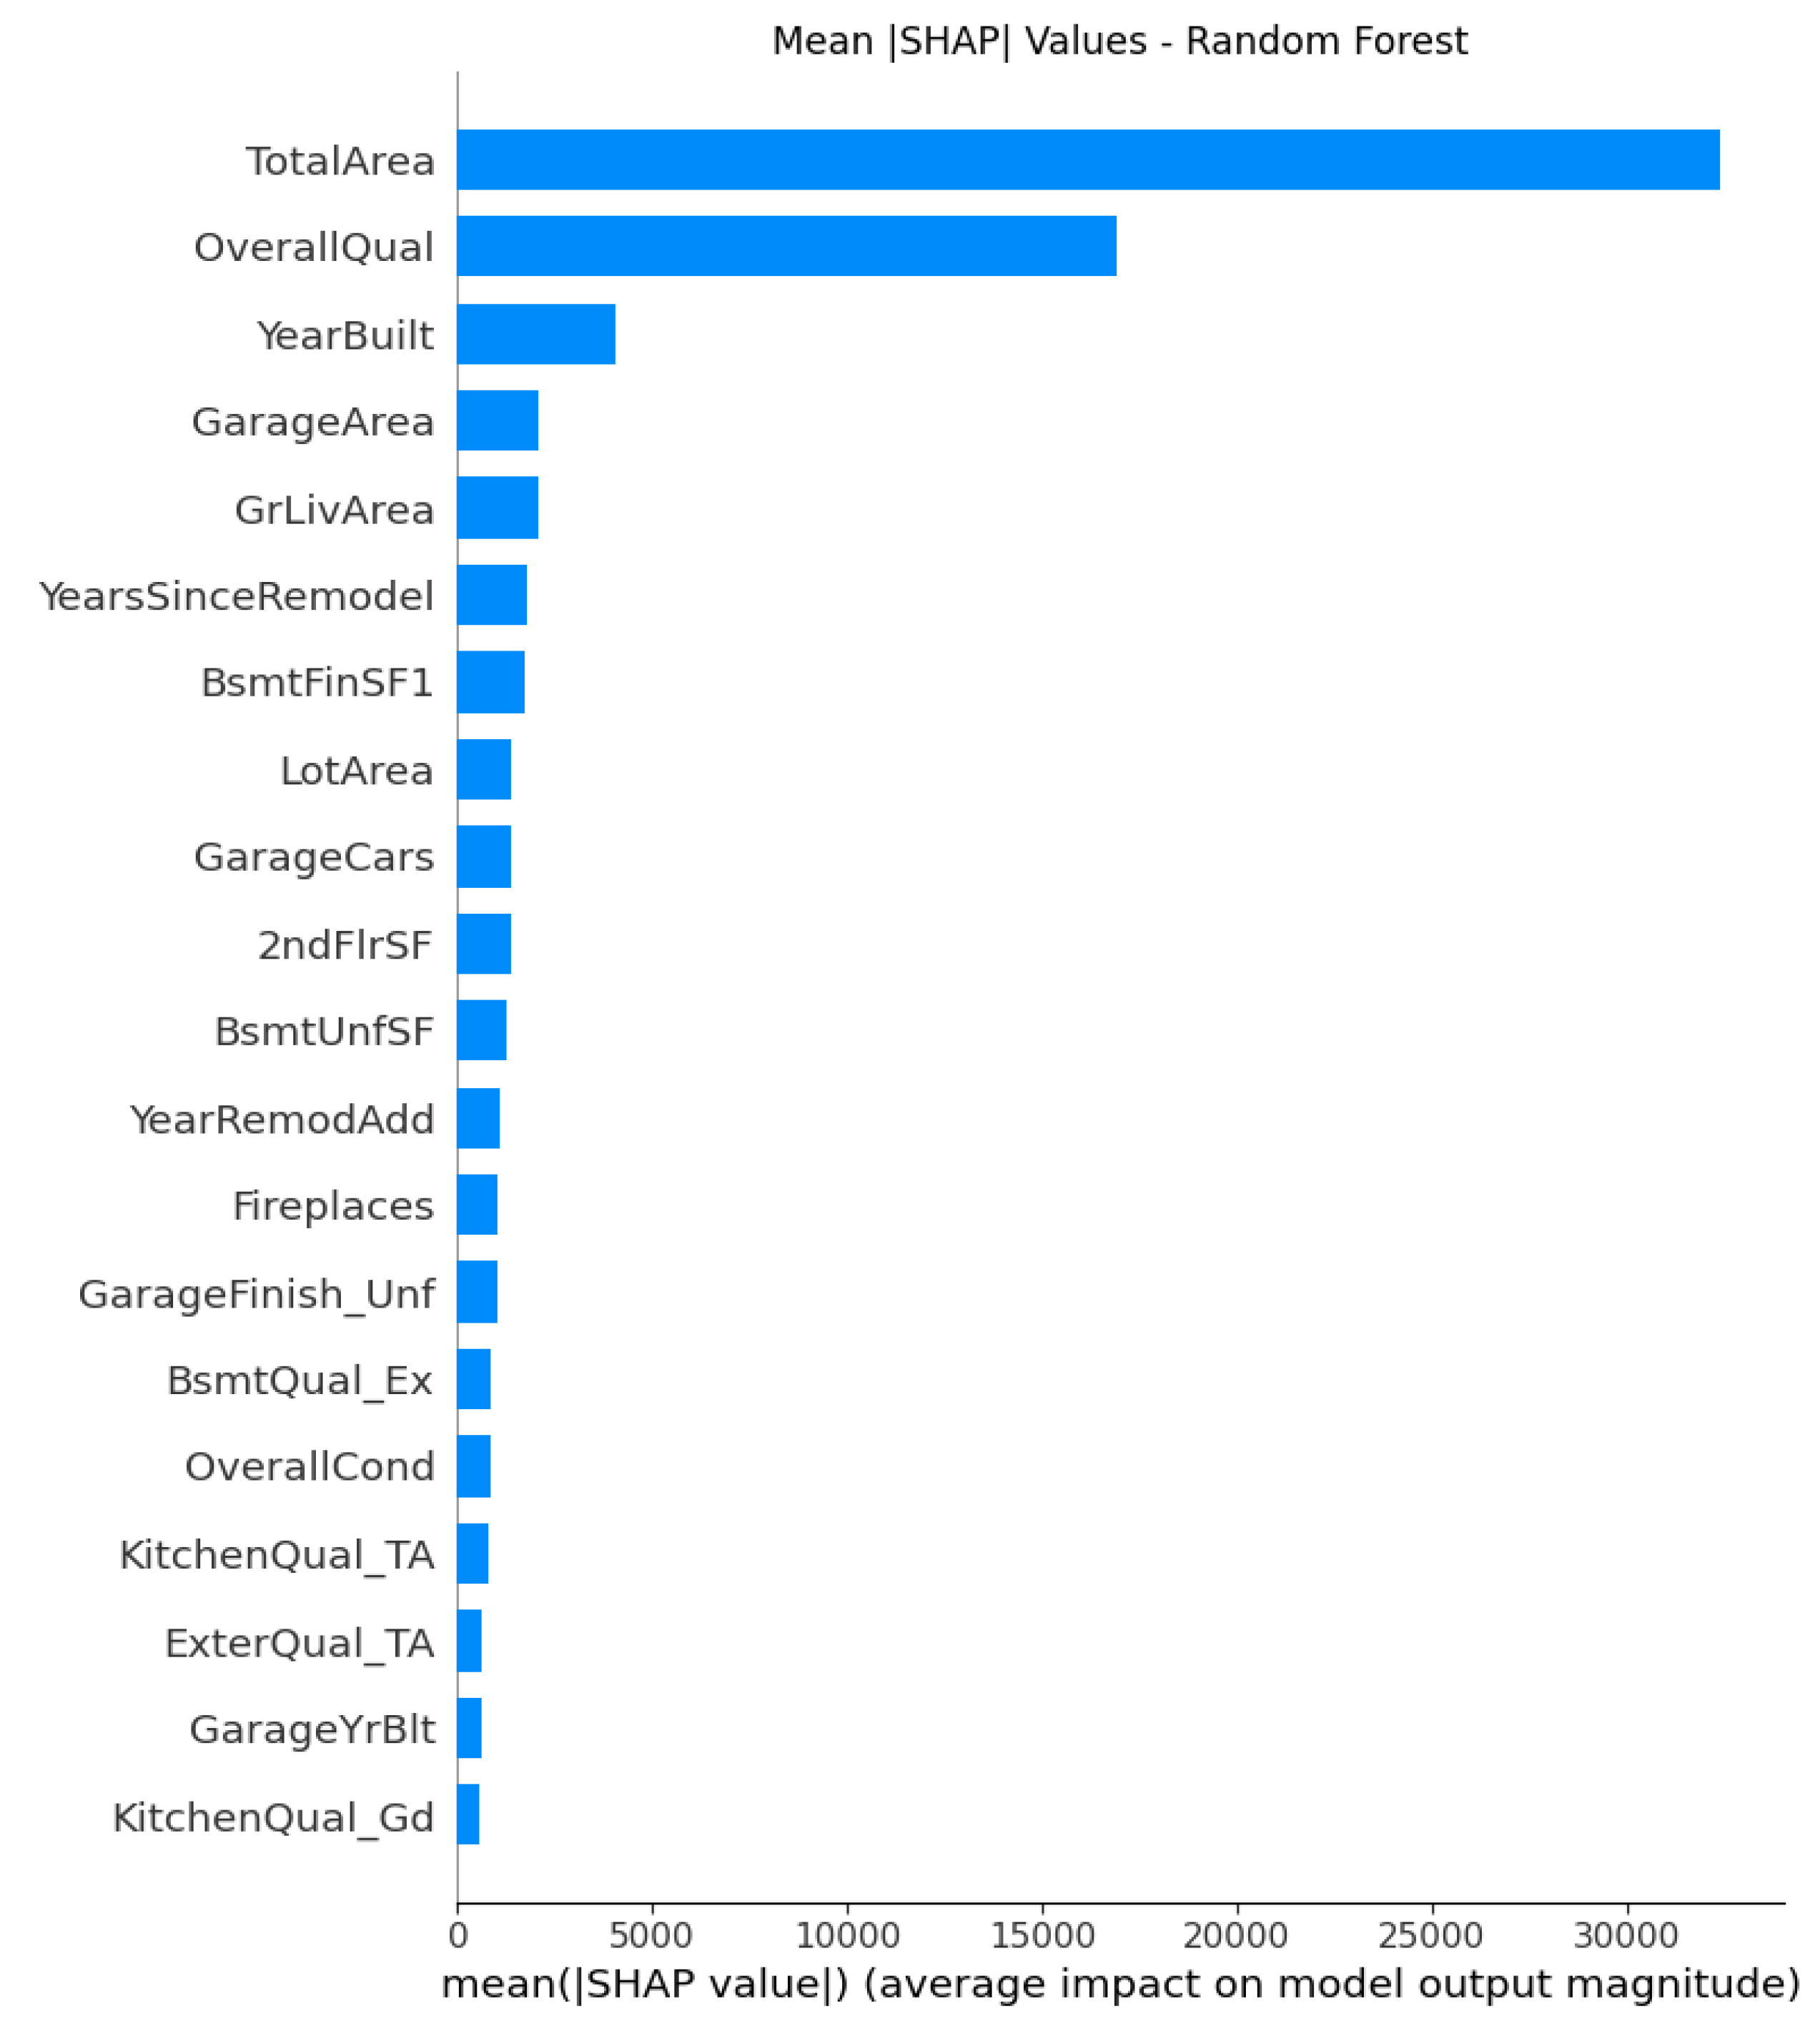
Figure 9.
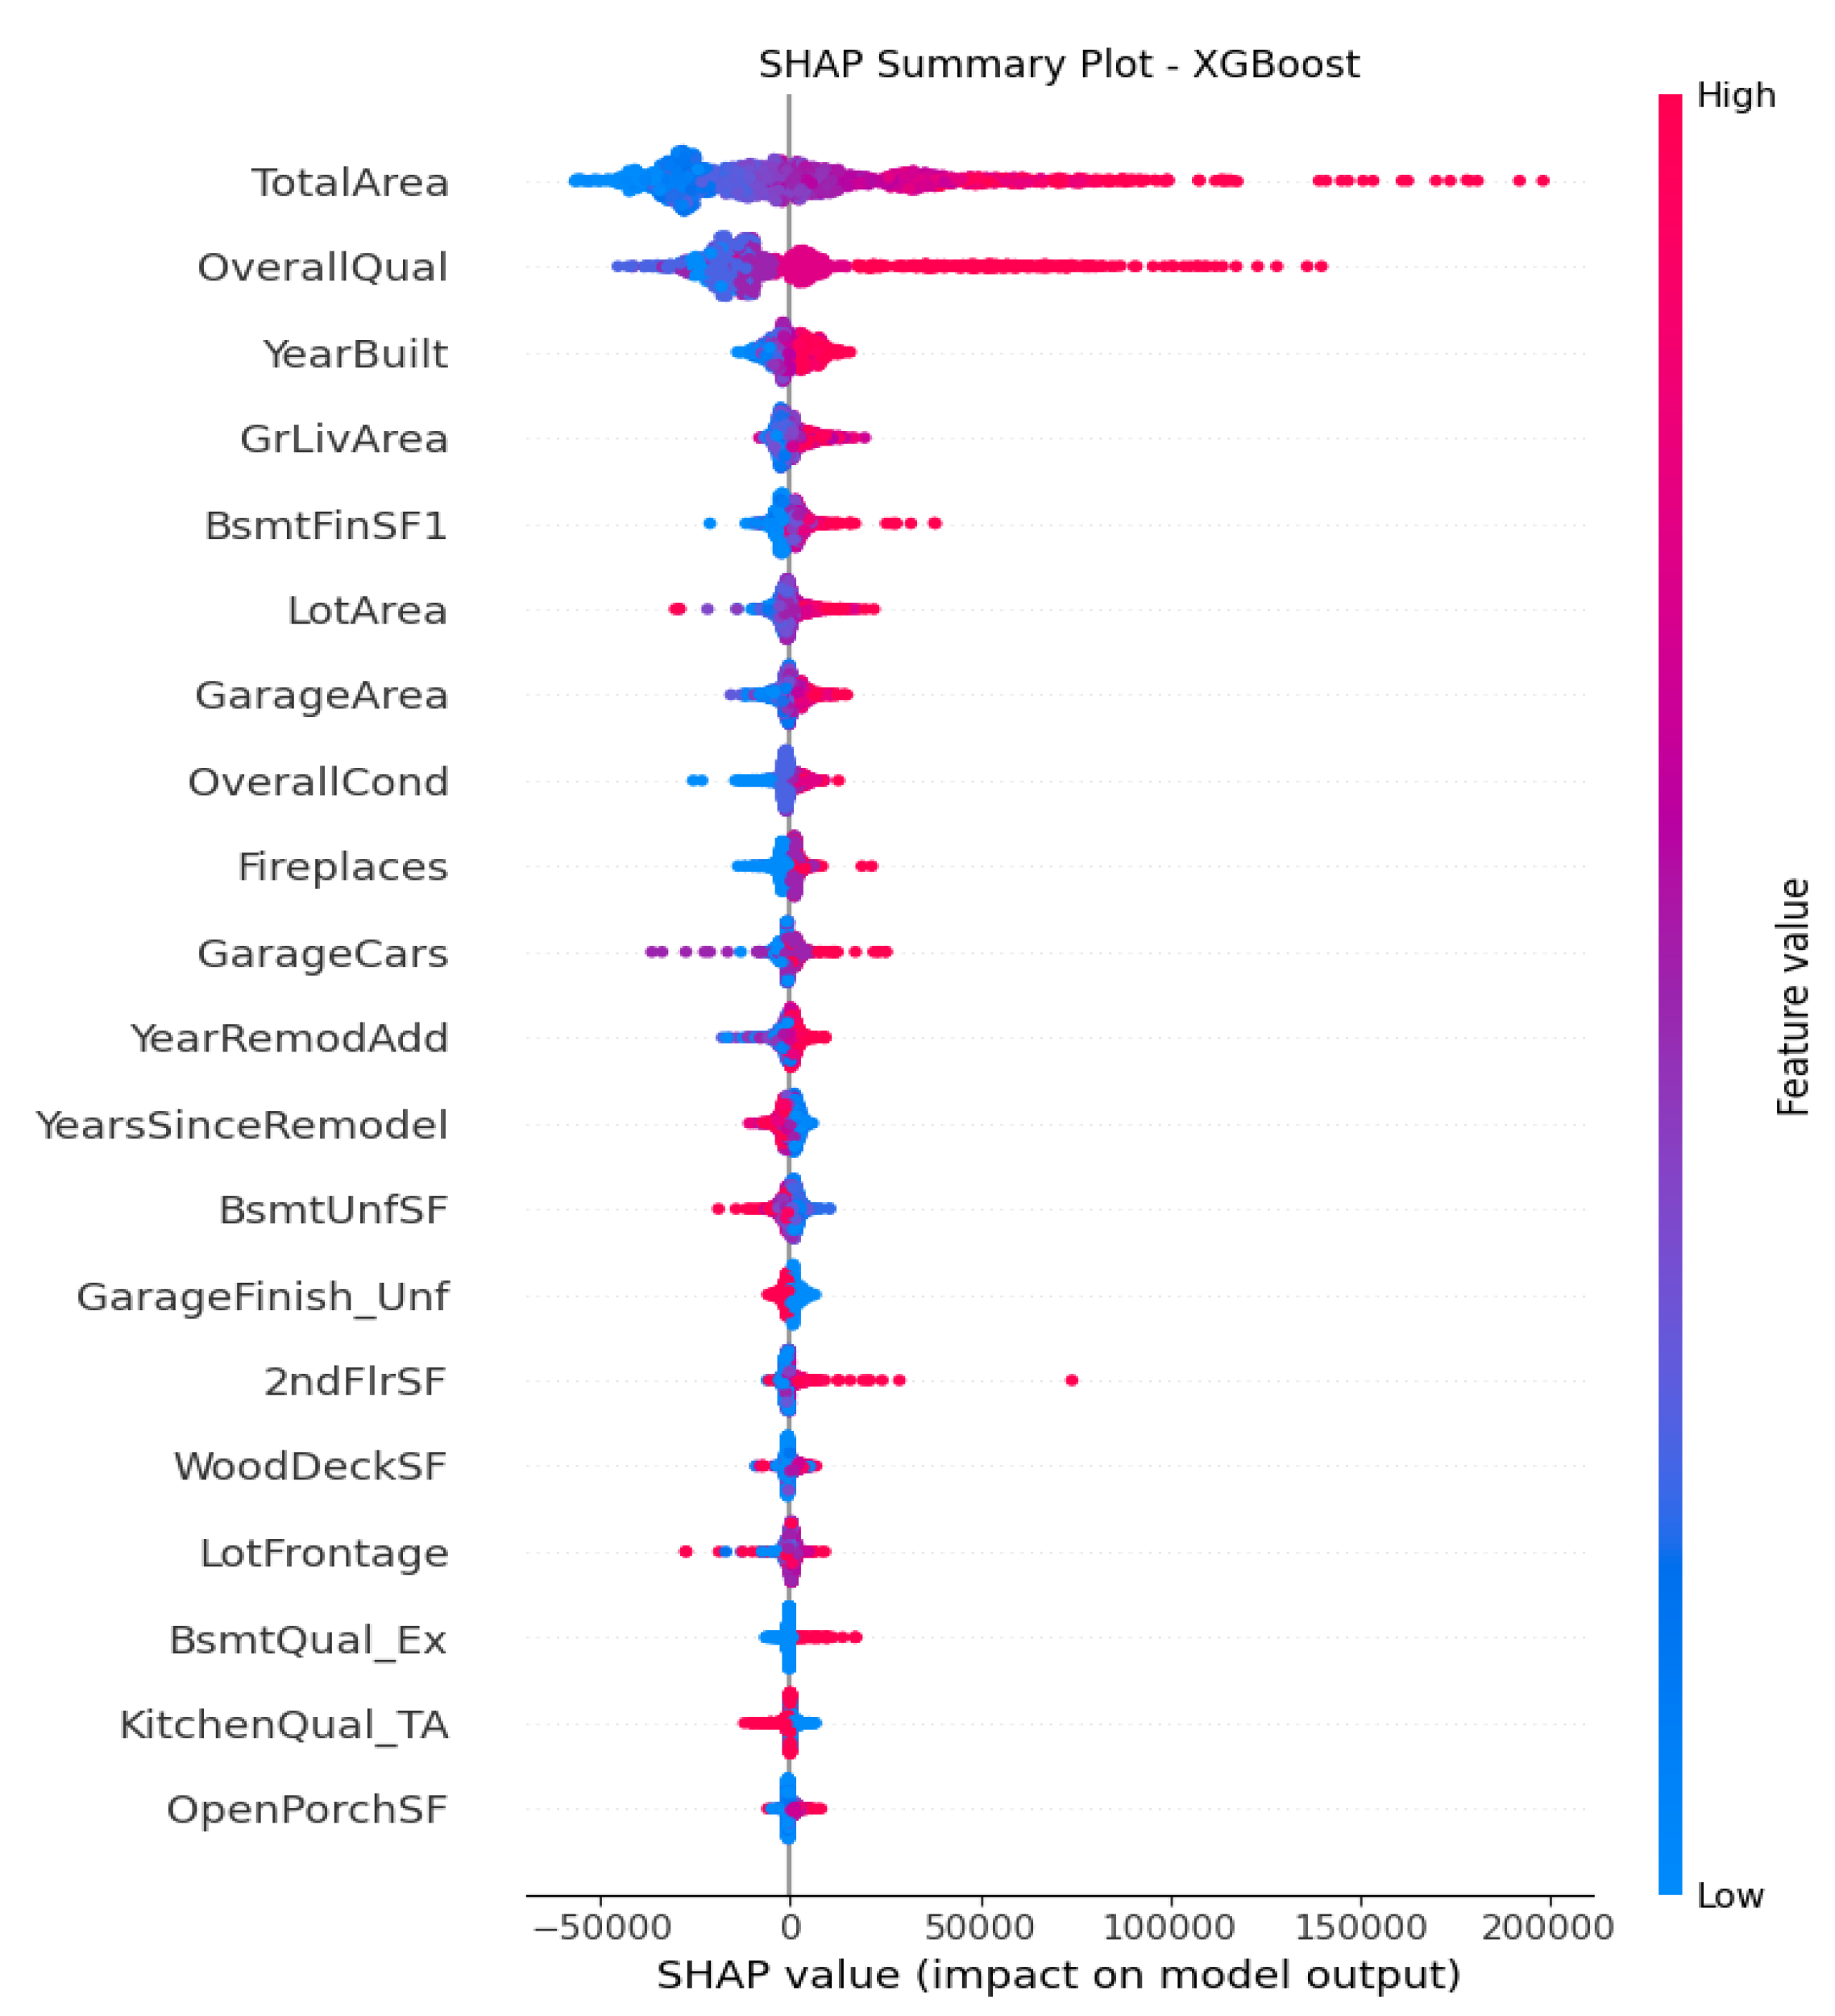
Figure 10.
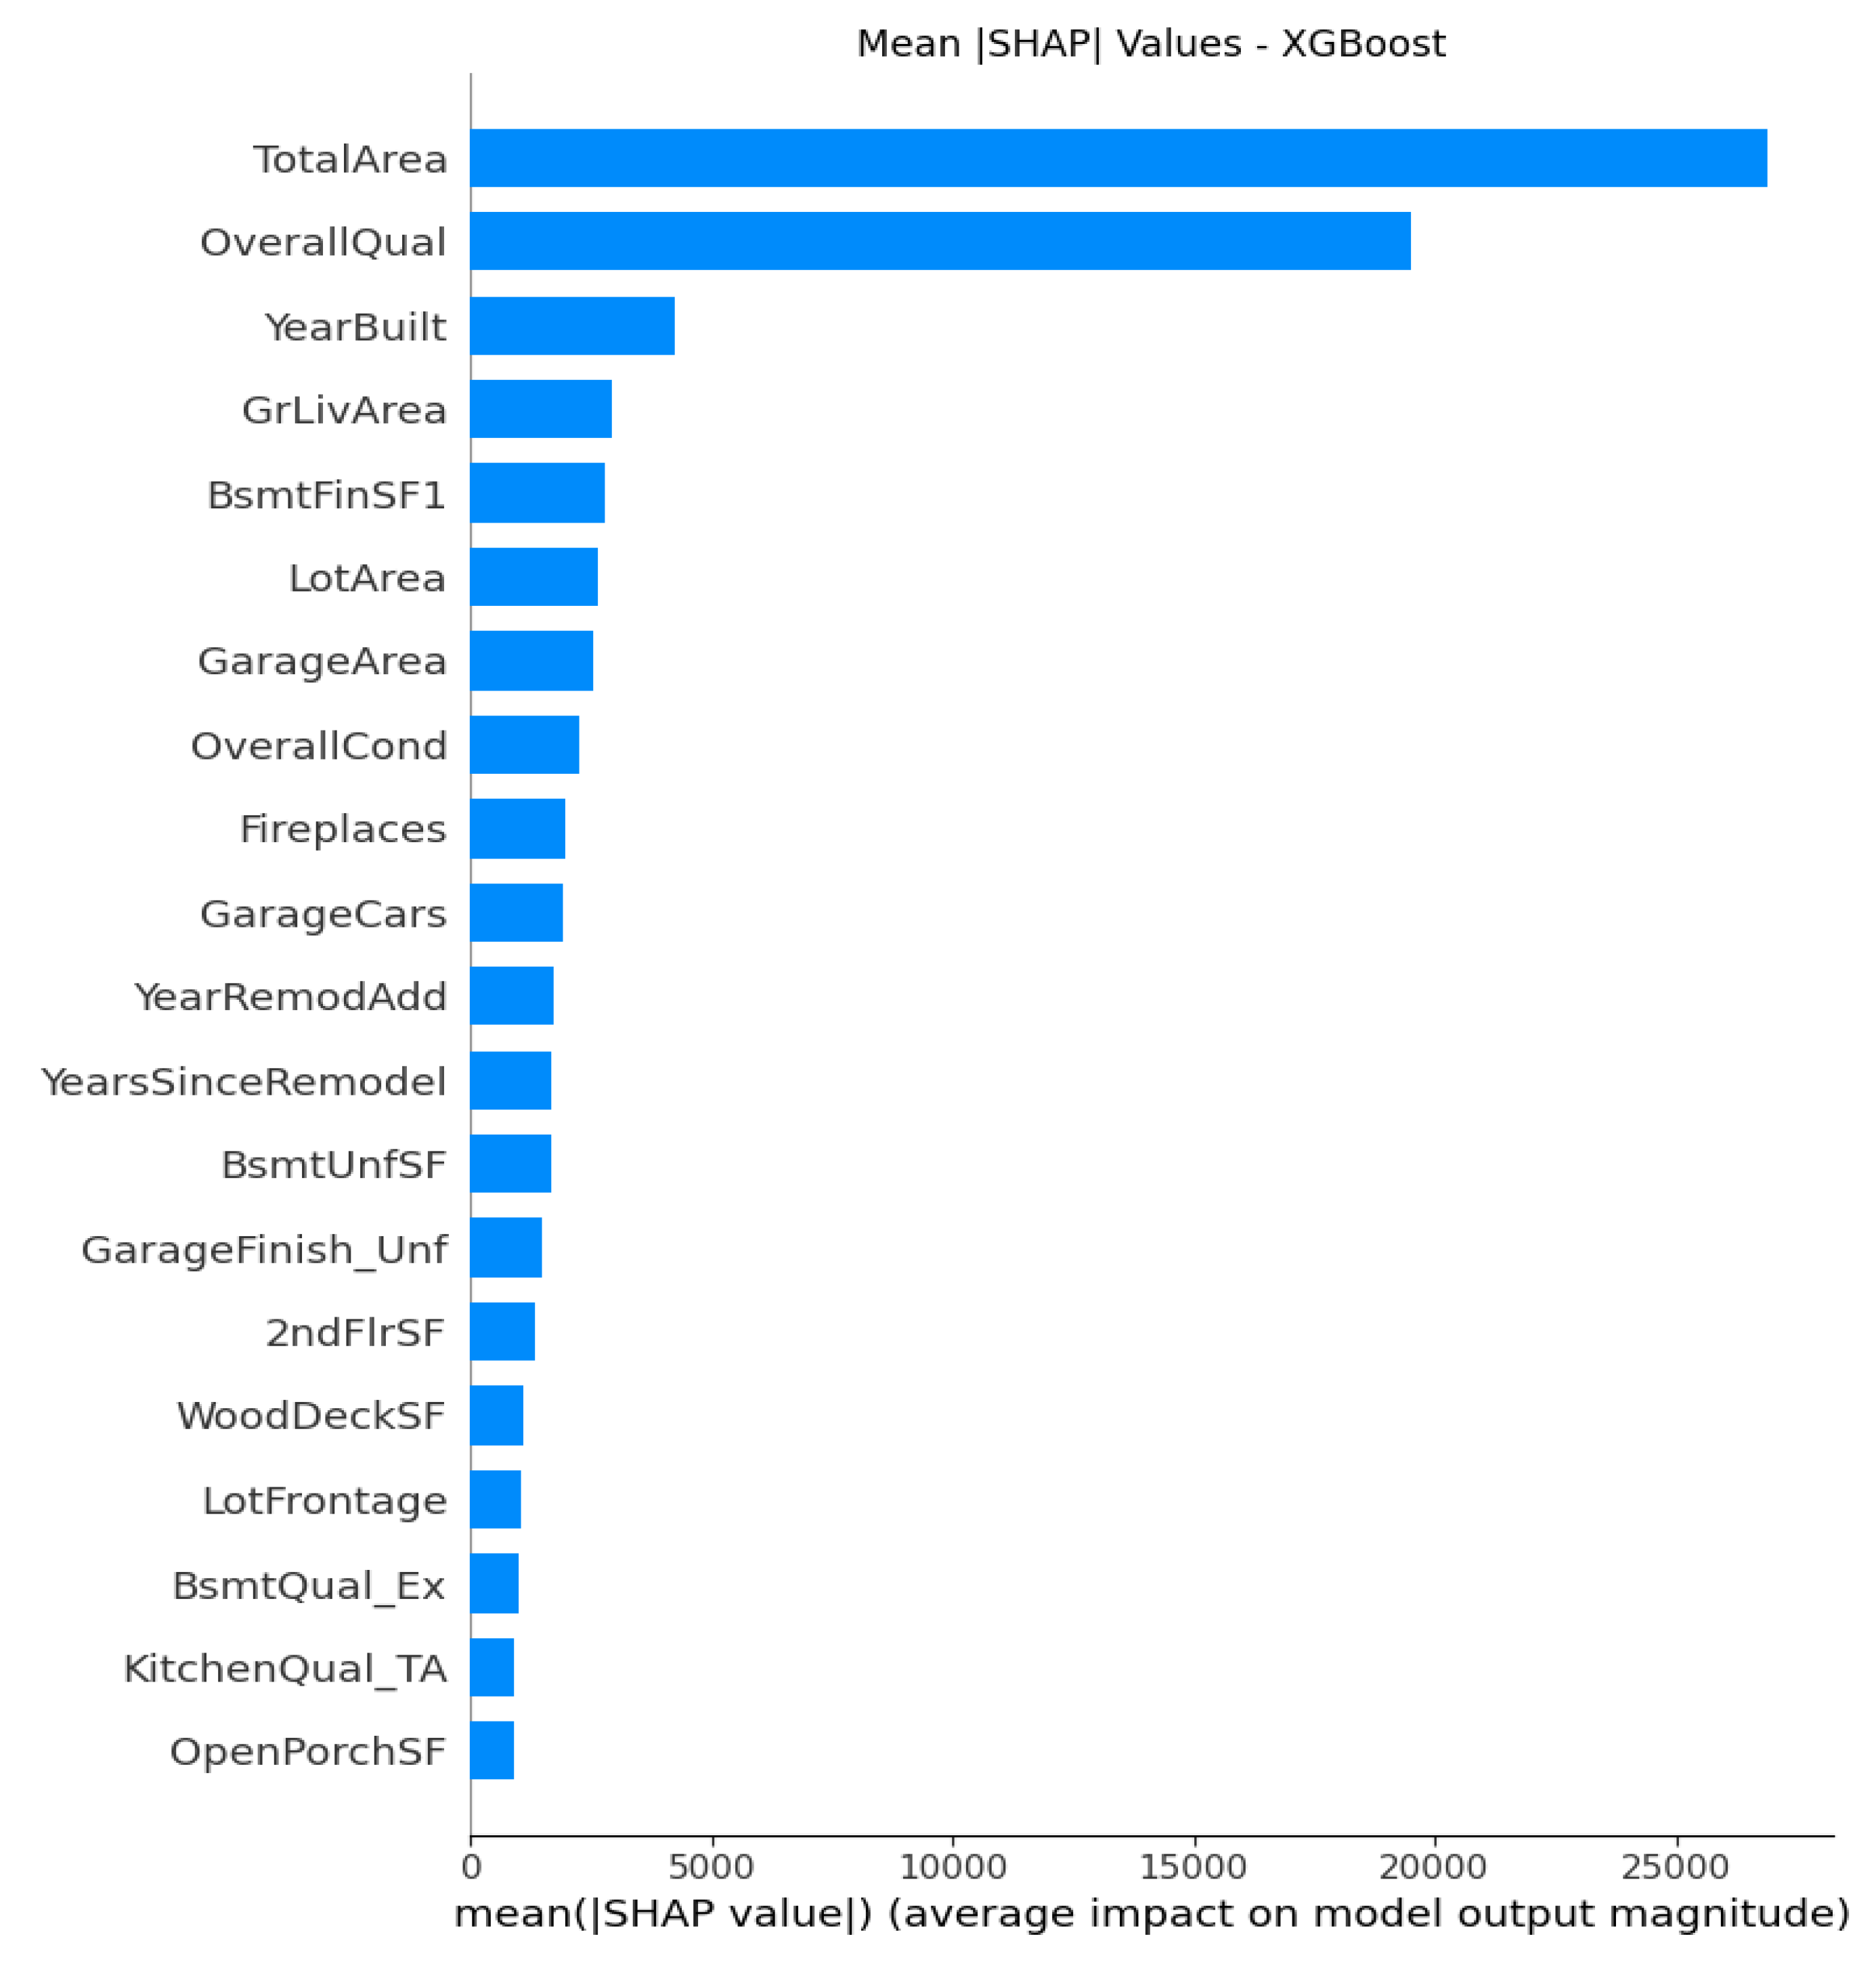
Figure 11.
RQ 1
Do engineered composite features, including the percentage of finished living area, the proportion of basement area to total living space, and years since last remodel, provide additional explanatory power or improve the predictive accuracy of different models beyond traditional features alone?
All five models consistently show that the engineered composite features PctFinishedArea, PctBasementArea, and YearsSinceRemodel, provide additional explanatory power and increase predictive accuracy beyond what traditional features can achieve alone, but in incremental ways rather than dominating drivers.
From the SHAP attribute importance plots above from Figure 1 to Figure 10 with detailed analyses explained before, we can conclude that at least one of these engineered composite variables are among the top 20 feature list contributing to the predictive models, especially in linear models. This proves that these engineered features capture additional information and interpretability that raw features could not fully represent, which serve as direct ratio metrics standardizing what house buyers really care about, which can be valuable for understanding the housing market.
RQ 2
Are traditional or engineered features emerge as the most influential predictors of sale price when evaluated through regularized regression models and interpretability tools such as SHAP?
Both traditional and engineered features emerge as influential predictors, but their relative importance varies by model type.
For all regularized regression models, traditional structural predictors such as Overall Quality, GrLivArea, GarageArea, YearBuilt and TotalBsmtSF, keep the most powerful contributors to the price. These variables have been established in housing economics as core elements toward housing values. Both models provide great evidence through both magnitude and stability of SHAP distributions.
On the other hand, the engineered features are effective but with smaller SHAP magnitudes and lower consistency. In general, they provide interpretive nuance to inform some space efficiency and modernization, but they do not surpass the predictive power of the raw traditional factors. Lasso highlights this distinction by shrinking many derived attributes while keeping traditional ones and delivers the clear message that the engineered features add incremental value instead of foundational predictive strength.
RQ 3
What insights can feature importance rankings and SHAP value analyses provide about the underlying structural, spatial, and temporal factors that most strongly drive housing price variation in Ames?
Structural Drivers
Overall Quality consistently showed as the most influential predictor over all models, serving as a high-level foundational importance of construction quality, materials, and finishings in establishing property value. In addition, both GrLivArea and TotalBsmtSF demonstrated strong, non-linear effects, indicating an accelerating increase in predicted sale price as these spatial attributes expand. The engineered variable PctFinishedArea informed the efficient usage and configuration of real living space are as important as the total size or available area in housing evaluation.
Spatial Drivers
These variables including Neighborhood_NAmes and LotArea generally show low ranks in overall importance compared with structural drivers. However, in particular models like Lasso regression and XGBoost, these variables provide the contextual adjustment necessary for accurate price in local submarket. On the other hand, the engineered factor PctBasementArea can be used to explain the effect of spatial configuration on housing price with positive relationships. In both Ridge and XGBoost models, the same total area predicts different price depending on the neighborhood, which meaning that spatial segmentation do modify valuation. However, spatial features serve more as multiplicative or moderating attributes towards housing price prediction rather than core determinants as strong structural factors.
Temporal Drivers
An obvious temporal effect associated with YearSinceRemodel, an engineered feature, can be identified in the top importance list from the SHAP plots almost over all models as an indicator of aging and modernization of the house. More recent remodels consistently show positive SHAP contributions to predicted housing price, while older remodels express opposite direction that indicates reduction in predicted values. Temporal variables act as time modifiers of structural and quality attributes with newer construction and recent renovations increasing house price. This feature enables a comparison of home values of similar structure and close locations but differing in maintenance histories in real life applications.
Cross-Model Insights
Comparing all results over 5 models give a consistent trend of major determinants selections but with varying degrees of nuance how each model captures relationship. Traditional structural and quality factors are flagged as universally dominant drivers over all models.
Linear models primarily show additive and monotonic relationship of factors with price. Regularized models enhance interpretability by eliminating and shrinking redundant parameters in feature selection processes. On the other hand, ensemble methods such as Random Forest and XGBoost demonstrated more complex nonlinearities and interaction effects. Among the models evaluated, XGBoost consistently produced the clearest and most stable SHAP patterns, while Random Forest produces lowest RMSE and highest R squared indicating best predictive accuracy in Figure 11. SHAP values provide a consistent and objective explanation of how each feature impacts a model’s prediction, offering insights into both the magnitude and direction of feature contributions.
Discussion
Summary of Results
This study evaluated the effectiveness of traditional structural versus engineered composite features in enhancing the prediction of housing prices in Ames, Iowa. The analysis incorporated five supervised learning algorithms, including linear and regularized regression models and non-linear ensemble methods. The results show that engineered features improved predictive accuracy across all models, but in incremental values not as top drivers as traditional structural factors such as overall quality and size.
The SHAP analysis provided further evidence that engineered features contributed meaningfully to prediction quality and interpretability. YearsSinceRemodel consistently ranked among the top 20 predictors in most predictive models. The rest engineered factors also exhibit moderating contributions in some predictive models, in particular linear models.
The non-linear models provide additional complex, context-dependent nature of housing markets. In summary, price is primarily driven by size and quality, moderated by spatial and temporal drivers, and refined by engineered ratios of functional efficiency.
Limitations
First, the analysis is only using the housing dataset from Ames, which might not be a good representative of housing markets in other regions since the market dynamics vary from region to region. Therefore, it limits the generalization of all findings concluded from this study to be applied to the entire mid-market U.S. housing price market.
Second, the engineered features rely on transformations of existing variables and may not capture all housing characteristics like neighborhood socioeconomic trends. The dataset also lacks some factors related to real life housing buyer considerations such as school district quality, which shows a huge impact on modern American family buying choices.
Third, although XGBoost and Random Forest capture some non-linear information, they remain sensitive to hyperparameter choices. Parameter tuning was limited for the scope of this thesis, so that more extensive fine-tuning techniques could further enhance performance and dependence plots can be a good visualization of interaction effects.
Finally, SHAP analysis can be computationally intensive for large datasets and models. The SHAP results generated here are based on validation subsets and approximations, which may slightly affect precision.
Future Works
First, extend the analysis to multiple housing markets across different cities, states or countries to evaluate the external validity of the engineered features. Comparing performance across diverse regions would help determine whether engineered features behave consistently in varying contexts.
Future work for model selections could apply advanced methodologies like neural networks, or hybrid models that combine structured and unstructured data. Nonlinear model performances can be further improved by parameter tunings using grid search or other modern techniques.
Implications
The models highlight the economic significance of structural quality, size and modernization aging in determining housing values. The engineered features created also provide incremental values to all models in predictive power and interpretability with both qualitative and quantitative analyses. This finding fully illustrates that industry specific transformations are useful in modern housing market analysis. These features are widely used in the real estate industry and housing market to affect customer’s buying decisions.
To conclude, incorporating interpretable engineering into machine learning models can be a valid technique for housing price forecasting task with better accuracy and model explainability. SHAP-based interpretation enhances trust in predictive models by uncovering interactions and patterns of various factors shaping the housing price. This methodological framework can be applied to a wide range of real estate, urban planning, and economic forecasting problems.
Acknowledgments
I would like to thank Ziyuan Huang PhD for providing feedback and guidance throughout this research.
References
- Wang, Y. (2025). Final proposal for GRAD 695: Research Methodology & Writing [Unpublished course manuscript]. Harrisburg University of Science and Technology.
- Case, K. E., & Shiller, R. J. (1989). The efficiency of the market for single-family homes. The American Economic Review, 79(1), 125–137. https://www.jstor.org/stable/1804778.
- Rosen, S. (1974). Hedonic Prices and Implicit Markets: Product Differentiation in Pure Competition. Journal of Political Economy, 82(1), 34–55. https://www.jstor.org/stable/1830899.
- Malpezzi, S. (1999). A Simple Error Correction Model of House Prices. Journal of Housing Economics, 8(1), 27–62. [CrossRef]
- Bayer, P., Ferreira, F., & McMillan, R. (2007). A Unified Framework for Measuring Preferences for Schools and Neighborhoods. Journal of Political Economy, 115(4), 588–638. [CrossRef]
- Hussain, I. (2023). Housing market and school choice response to school quality information shocks. Journal of Urban Economics, 138, 103606. [CrossRef]
- Gyourko, J., & Tracy, J. (1991). The Structure of Local Public Finance and the Quality of Life. Journal of Political Economy, 99(4), 774–806. [CrossRef]
- Das, S. S. S., Ali, M. E., Li, Y.-F., Kang, Y.-B., & Sellis, T. (2020, September 1). Boosting House Price Predictions using Geo-Spatial Network Embedding. ArXiv.org. [CrossRef]
- Ye, Q. (2024). House price prediction using machine learning for Ames, Iowa. Applied and Computational Engineering, 55(1), 44–54. [CrossRef]
- Sharma, H., Harsora, H., & Ogunleye, B. (2024). An Optimal House Price Prediction Algorithm: XGBoost. Analytics, 3(1), 30–45. [CrossRef]
- Zhou, X. (2023). Comparative Analysis of Machine Learning Performance in House Price Prediction for Ames Iowa. Highlights in Science, Engineering and Technology, 39, 738–743. [CrossRef]
- Guirguis, H., Mueller, G., Dutra, V., & Jafek, R. (2024). Advances in Forecasting Home Prices. Computational Economics. [CrossRef]
- Zhang, Y. (2024). Macro Indicators and Housing Prices in the U.S. Advances in Economics Management and Political Sciences, 120(1), None-None. [CrossRef]
- Li, C. (2025). Review of Housing Price Forecasting Methods Based on Machine Learning and Deep Learning. Applied and Computational Engineering, 118(1), 146–151. [CrossRef]
- Chen, Z. (2025). House Price Prediction in Boston Based on BP Neural Network. Highlights in Science, Engineering and Technology, 124, 152–156. [CrossRef]
- Hasan, M. H., Jahan, M. A., Ali, M. E., Li, Y.-F., & Sellis, T. (2024). A Multi-Modal Deep Learning Based Approach for House Price Prediction. ArXiv.org. https://arxiv.org/abs/2409.05335.
- Yazdani, M. (2021, October 14). Machine Learning, Deep Learning, and Hedonic Methods for Real Estate Price Prediction. ArXiv.org. [CrossRef]
- House Prices—Advanced Regression Techniques. (n.d.). Kaggle.com. https://www.kaggle.com/competitions/house-prices-advanced-regression-techniques/data.
Disclaimer/Publisher’s Note: The statements, opinions and data contained in all publications are solely those of the individual author(s) and contributor(s) and not of MDPI and/or the editor(s). MDPI and/or the editor(s) disclaim responsibility for any injury to people or property resulting from any ideas, methods, instructions or products referred to in the content. |
© 2025 by the authors. Licensee MDPI, Basel, Switzerland. This article is an open access article distributed under the terms and conditions of the Creative Commons Attribution (CC BY) license (http://creativecommons.org/licenses/by/4.0/).
Copyright: This open access article is published under a Creative Commons CC BY 4.0 license, which permit the free download, distribution, and reuse, provided that the author and preprint are cited in any reuse.


