
Submitted:
20 November 2025
Posted:
21 November 2025
You are already at the latest version
Abstract
We propose a Dual Anaplerotic Model (DAM) of beta cell insulin secretion, integrating two anaplerotic pathways: the classical glucose-driven route via pyruvate carboxylase (PC) and the GABA shunt–mediated pathway. PC plays a crucial role in the PEP cycle, enabling localized ATP production in microdomains near KATP channels. The GABA shunt provides fresh carbon to the TCA cycle, thereby amplifying the mitochondrial oxidative (MitoOx) phase. Replenishment of the GABA pool is linked to the cataplerosis of α-ketoglutarate during the mitochondrial cataplerotic (MitoCat) phase, a process critically supported by simultaneous PC-derived anaplerotic flux. For the first time, these pathways are recognized as integral, interdependent, and temporally coordinated routes of anaplerosis in beta cells. DAM thus synthesizes recent advances: the PC anaplerotic pathway with the PEP cycle, and the anaplerotic role of the GABA shunt, within the coordinating framework of the MitoCat–MitoOx model. This synergistic minimal model captures key experimental findings and predicts the interplay of major metabolite pools—the glycolytic, TCA, and GABA pools, together with the signaling role of Ca²⁺—highlighting the central role of the TCA–GABA–Ca²⁺ module in determining slow oscillatory periods in beta cells.
Keywords:
beta cell oscillations
; mitochondrial metabolism
; anaplerosis
; cataplerosis
; GABA shunt
; PEP cycle
1. Introduction
Insulin secretion from pancreatic islet beta cells occurs in a pulsatile manner, with a typical periodicity of approximately five minutes [1]. The mechanistic basis of this oscillatory behavior has been investigated for several decades, with a variety of models proposed to explain it. These models range from qualitative to mathematical, differing in their core mechanisms of rhythmogenesis and regulatory details. A common feature across most canonical models is the central role of ATP production and the ATP-dependent closure of ATP-sensitive potassium (KATP) channels—a concept well-established and significantly refined over recent years.
One of the most comprehensive frameworks, the Dual Oscillator Model (DOM), was developed to account for the complex interplay between metabolic and electrical activity in beta cells. The DOM integrates a glycolytic oscillator, driven by feedback of fructose-1,6-bisphosphate (FBP) on phosphofructokinase (PFK), with an electrical oscillator, based on calcium-dependent ion channel dynamics [2]. This model successfully reproduces the range of bursting behaviors observed in experiments, including fast, slow, and compound oscillations. A major advancement came from experimental findings showing that glycolytic intermediates, particularly FBP, oscillate in antiphase with the well-documented Ca²⁺ oscillations [3]. This discovery led to the development of a modified DOM model [4], which attributes slow islet oscillations to the interplay between glycolytic dynamics and Ca²⁺ feedback. In this model, Ca²⁺ regulates pyruvate dehydrogenase (PDH) and stimulates ATP hydrolysis; together, these interactions modulate ATP production and consequently influence the cell’s electrical activity.
Building on this foundation, the Integrated Oscillator Model (IOM) was introduced by Bertram et al. (2018) [5], incorporating feedback regulation of glycolytic flux by cytosolic Ca²⁺ via PDH activity. In this framework, low Ca²⁺ levels reduce glycolytic efflux, leading to FBP accumulation, whereas high Ca²⁺ levels enhance efflux, resulting in FBP depletion. These dynamics closely match experimentally observed FBP oscillations [3], reinforcing the view that glycolysis and calcium signaling are tightly coupled in beta cell oscillations.
A significant shift in beta cell modeling occurred with the recognition that anaplerotic and cataplerotic fluxes, in conjunction with oxidative metabolism, play essential roles in shaping the oscillatory behavior of glucose-stimulated beta cells and their pulsatile insulin secretion. By incorporating not only the temporal but also newly appreciated spatial aspects of beta cell metabolism, the MitoCat–MitoOx model was introduced [6]. This model integrates the roles of anaplerosis, pyruvate kinase (PK) activity, and the mitochondrial phosphoenolpyruvate (PEP) cycle into a comprehensive framework of glucose-stimulated insulin secretion (GSIS). It proposes that during the MitoCat phase, PK elevates ATP/ADP ratios in the plasma membrane microdomain, leading to closure of KATP channels and membrane depolarization. In contrast, during the MitoOx phase, mitochondrial oxidative phosphorylation (OxPhos) is activated in response to rising ADP levels, generating ATP to meet the energetic demands of insulin exocytosis and ion transport. Viewed more broadly, the MitoCat–MitoOx model acknowledges that multiple interconnected metabolic and ionic processes exhibit phase-specific acceleration and deceleration—coinciding with either the electrically silent triggering phase (MitoCat) or the electrically active secretory phase (MitoOx) of insulin oscillations.
Building on these advances, we have recently developed a comprehensive computational model that integrates anaplerotic metabolism, localized ATP production, and redox signaling to simulate beta cell responses to both glucose and glucose-glutamine stimulation Grubelnik et al. (2024) [7]. This model extends beyond the conventional emphasis on OxPhos and KATP channel activity by highlighting localized ATP generation from PEP in close proximity to KATP channels. It also emphasized the signaling role of H₂O₂ during the first phase of insulin secretion and underscored the importance of anaplerotic metabolism in the second phase—particularly the production of NADPH and glutamate (Glu) as key amplifiers of insulin release. In a follow-up study [8], further emphasis was placed on distinguishing between distinct ATP pools and separately analyzing the first triggering phase and the second amplifying phase of beta cell activation.
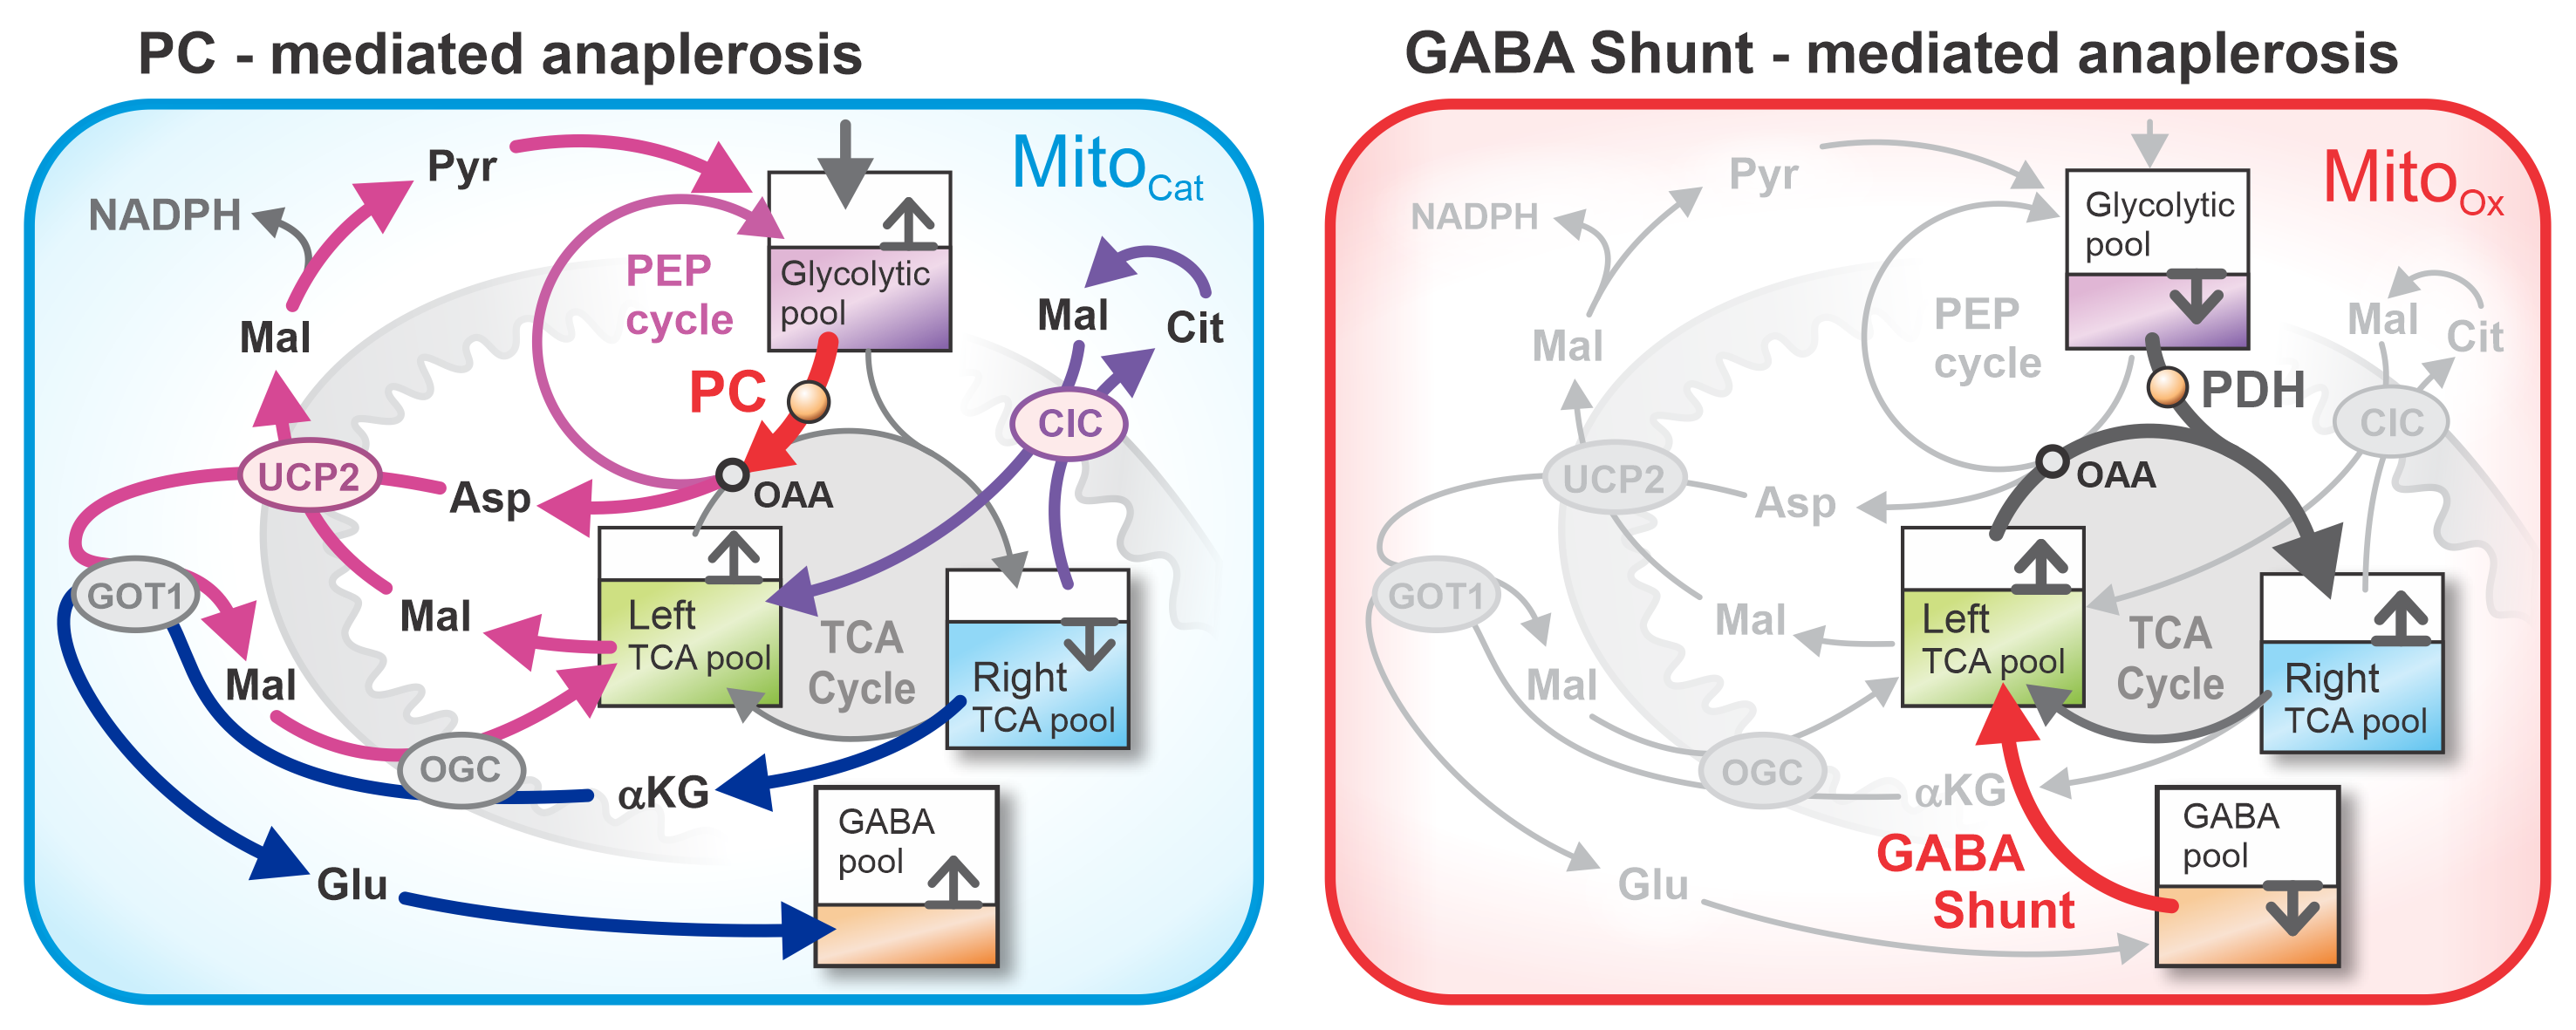
Expending on this work, we present a new conceptual framework: the Dual Anaplerotic Model (DAM). Central to this model is the understanding that two major anaplerotic pathways contribute to refilling the tricarboxylic acid (TCA) cycle intermediates. The first is the well-established glucose-induced anaplerosis via pyruvate carboxylase (PC), while the second involves the gamma-aminobutyric acid (GABA) shunt—an often-overlooked route that recent evidence suggests plays a crucial anaplerotic role [9]. Following the terminology of earlier models [6,7,8], we distinguish between two alternating mitochondrial metabolic states: the oxidative (MitoOx) and cataplerotic (MitoCat) phases.
In the MitoOx phase, a Ca²⁺ pulse initiates oxidative metabolism by activating PDH, which drives downstream production of NADH and FADH₂. Shortly thereafter, GABA-derived succinate enters the TCA cycle, providing additional carbon that increases flux through the cycle, acting as a metabolic highway to amplify the rate of ATP production [10,11]. As Ca²⁺ is subsequently sequestered, the system transitions into the MitoCat phase, enabling net carbon efflux and cytosolic conversion of exported intermediates—including αKG to GABA—thereby restoring the GABA pool. Importantly, this replenishment of the GABA pool, linked to αKG cataplerosis during the MitoCat phase, is critically supported by simultaneous PC-derived anaplerotic flux. Together, these pathways function as interdependent and temporally coordinated PC- and GABA shunt–driven anaplerotic routes.
In what follows, we first present the model conceptually, describing its qualitative operation. The system is represented by four core metabolic pools, and we outline the key processes that govern the fluxes between them. The mathematical formulation of these fluxes is deliberately kept as simple as possible to construct a minimal model of the dynamics occurring in glucose-stimulated beta cells. The purpose of this model is to highlight the temporal transitions and distinct activation phases—specifically, the cyclic emptying and refilling of individual pools—and to illustrate how their interplay constitutes an efficient and responsive regulatory mechanism. To complement the mathematical model, we also provide an animation that visually demonstrates the oscillatory behavior of the principal metabolic pools. Finally, we discuss how our model predictions align with available experimental observations and outline how this minimal framework may serve as a foundation for future extensions toward more comprehensive and physiologically realistic models of glucose-stimulated beta cell function.
2. Model
In this model, beta cell metabolism is conceptualized as a synergistic interplay among glycolysis, the TCA cycle, the PEP cycle, and the GABA shunt. To reduce biochemical complexity while retaining essential functional relationships, the system is represented using a four-pool framework.
The first pool, P₀, comprises downstream glycolytic intermediates, primarily FBP and PEP. These metabolites are direct precursors of pyruvate (Pyr), which serves as the principal source of carbon entering mitochondrial metabolism.
The second pool, P₁, corresponds to the right half of the TCA cycle and includes citrate (Cit), isocitrate (Isocit), and α-ketoglutarate (αKG). This pool effectively represents the primary site of carbon entry into the TCA cycle via the condensation of acetyl-CoA with oxaloacetate (OAA).
The third pool, P₂, represents the left half of the TCA cycle, comprising primarily C₄ dicarboxylates such as malate (Mal) and fumarate (Fum). Mal, in particular, plays a dominant role in redox balance and metabolite transport, while other intermediates are assumed to be in near-equilibrium with it.
The fourth pool, P₃, captures the GABA reservoir, which is tightly linked to TCA cycle metabolism through the GABA shunt. This pathway provides an alternative anaplerotic input into the TCA cycle via succinate production, especially under conditions that favor increased GABA flux, such as elevated glucose availability or glutamine co-stimulation.
The main fluxes between pools P₀–P₃ are schematically illustrated in Figure 1. A central flux connects P₀ to P₁ via PDH, representing the Ca²⁺-sensitive entry of Pyr into the TCA cycle through acetyl-CoA. Elevated Ca²⁺ enhances PDH activity, thereby facilitating carbon flow from P₀ to P₁ and simultaneously from P₂ to P₁, as one OAA combines with one acetyl-CoA to form Cit in P₁. This reaction enables oxidative metabolism, defining the MitoOx phase [12,13].
The GABA pool (P₃) contributes to the TCA cycle through the GABA shunt, an anaplerotic pathway that generates succinate and feeds it into P₂. This flux from P₃ to P₂ provides a source of »fresh carbon« to the cycle and plays a crucial role in enhancing the MitoOx phase [9].
A second, well-established anaplerotic flux—also indicated in red in Figure 1—is the glucose-derived entry via PC, which channels Pyr into the PEP cycle and contributes to OAA replenishment. This OAA is further required for aspartate (Asp) extrusion, a process that interacts with GABA metabolism, together forming tightly interdependent and temporally coordinated PC- and GABA shunt–driven routes (see inset of Figure 1).
Because both GABA-mediated and PC-mediated fluxes are anaplerotic, they must be balanced by cataplerotic fluxes to maintain a zero net carbon flux and allow metabolite concentrations to oscillate around quasi-stationary values. Cataplerotic fluxes, however, are complex: metabolites such as Mal, Cit, and αKG often exchange between compartments without causing true net carbon loss [6]. Genuine efflux occurs only through regulated transport processes—most notably UCP2-mediated extrusion of C₄ metabolites (experimentally demonstrated by Vozza et al., 2014)—which are tightly controlled by GTP and its co-regulation with quinol (Qred), as reviewed by [14]. These cataplerotic fluxes were analyzed in detail in Grubelnik et al. (2024) [7].
In the present framework, the principal net cataplerotic flux is represented in the inset of Figure 1, illustrating redistribution of carbon from P₁ into P₃ via cytosolic Glu production and conversion to GABA. Notably, this replenishment of the GABA pool (P₃), linked to αKG cataplerosis, is critically supported by simultaneous PC-derived anaplerotic flux—via UCP2-extruded Asp and Mal, and via malic enzyme (ME1) conversion of Mal back to Pyr. Together, the PC- and GABA shunt–driven anaplerotic routes function as interdependent and temporally coordinated processes. This synergistic interaction completes the cycle by replenishing P₃. In parallel, redistribution of Cit from P₁ into Mal in P₂ via the Cit–Mal exchanger (CIC) is also shown in Figure 1.
The model dynamics is based on the experimentally measured Ca2+ and ATP traces. Several studies [15,16,17,18] have shown that in beta cells the temporal oscillations of ATP and Ca²⁺ are in opposite phase. When Ca²⁺ concentration is at its lowest, ATP concentration is at its highest, while ATP reaches its minimum shortly before the Ca²⁺ peak [16]. We take experimental measurements from Gregg et al. (2019) [17] as the basis for modeling Ca²⁺ and ATP dynamics, and obtain the following equations:
In these equations, the concentrations of Ca²⁺ and ATP, time t, and all parameters are expressed in dimensionless units. The constants are defined as follows , , , , , , , and .
As a result, the model generates oscillatory dynamics of Ca²⁺ and ATP that vary between 0 and 1, closely resembling the temporal profiles observed in the experimental data. The original measurements from Gregg et al. (2019) [17], along with the fitted curves based on Eqs. 1 and 2, are shown in Figure 2.
As presented in Figure 1, we consider the system as a four-pool model, for simplicity grouping together the key metabolites into the glycolytic compartment, the “left” part of the TCA cycle, the “right” part of the TCA cycle, and the GABA pool. Mathematically, we assume that the concentrations of the metabolites within each pool oscillate simultaneously; although their absolute values differ, their temporal dynamics are considered to be in phase. In the mathematical formulation, we define the four pools as follows:
To mathematically describe the dynamic behavior of metabolite pools involved in GSIS, we developed a minimal model based on four interacting metabolic pools. These pools represent key components of beta cell metabolism: glycolysis (), the right-hand segment of the TCA cycle (), the left-hand segment of the TCA cycle (), and the GABA shunt (). Each pool comprises a representative group of metabolites that are assumed to oscillate with broadly similar temporal dynamics, while the fluxes between them are governed by biologically motivated, nonlinear expressions.
Rather than aiming for biochemical detail, the model prioritizes simplicity without sacrificing physiological relevance. We use multiplicative power-law expressions for fluxes, where each flux depends on the concentrations of key regulators—typically in the form of products of variables raised to fixed exponents. This structure captures fundamental features of metabolic control, including Ca2+ activation, NADH-mediated feedback inhibition, and ATP-dependent regulation, while ensuring that the model remains analytically and computationally manageable.
Although both ATP and NADH reflect the cellular energy state and act as activators/inhibitors in multiple pathways, we simplify the model by assuming rapid interconversion between them via the electron transport chain. As a result, we treat NADH and ATP as directly proportional. This simplification is expressed as:
Simultaneous measurements in beta cells using Perceval-HR (ATP/ADP ratio) and flavin autofluorescence (reflecting NADH) show that the two oscillate in phase, indicating tight metabolic coupling [3]. However, in a majority of cases, a second flavin-1 peak, not mirrored in ATP, has been observed. This second peak can be explained either by Ca²⁺-dependent stimulation of TCA-cycle dehydrogenases, transiently increasing NADH and FADH₂ production during the active phase [3], or by two distinct peaks of NADH and NADPH [8].
The resulting system of model equations offers a mechanistic yet minimal framework for simulating the oscillatory metabolic dynamics that underpin insulin secretion. In the sections below, we define the dynamics of each pool and the fluxes that interconnect them.
The dynamics of the glycolytic pool () is modeled based on experimental data for FBP reported by Tornheim (1997) [19]. As shown in Figure 3A, we extracted these data and annotated regions (white and gray shaded) to indicate phases during which FBP and ATP exhibit synchronous behavior. Specifically, both FBP and ATP increase during the white regions and decrease during the gray regions, demonstrating that their oscillations are in phase.
Although the waveform profiles of FBP and ATP are not identical, more recent studies—specifically in pancreatic beta cells [3]—have shown that FBP oscillations adopt a smoother, more sinusoidal-like profile that closely resembles ATP dynamics. Based on these findings, we approximate the FBP dynamics using a sinusoidal function fitted to the experimental data. Figure 3B compares the extracted data from Merrins et al. (2016) [3] with the sinusoidal function used in our model, showing good agreement.
Accordingly, the FBP-related glycolytic pool () is modeled as:
where , .
The glycolytic pool () is tightly coupled to the TCA cycle through the generation of Pyr from the intermediates FBP and PEP. One major route for Pyr to enter the TCA cycle is via the oxidative pathway through PDH, which converts Pyr into acetyl-CoA. Acetyl-CoA subsequently combines with OAA, derived from Mal (), to form Cit in the first TCA pool (). The flux through PDH, denoted , is regulated by several factors: the concentration of glycolytic intermediates () that give rise to Pyr [4,20], the availability of OAA as reflected by Mal levels in [20], and intracellular Ca²⁺, which stimulates PDH activity [12,13]. Although PDH is also inhibited by NADH—in other words, activated by the term () in our model—Ca²⁺ and () (which is related to ) oscillate in phase (see Figure 2). This means that both signals would modulate in the same direction. To reduce redundancy while preserving physiologically relevant regulation, we simplify the model by including only Ca²⁺ as the modulating factor. This results in a reduced yet biologically meaningful representation of PDH regulation. The resulting flux is defined as:
with .
Given that Cit synthase consumes one molecule of acetyl-CoA and one molecule of OAA to generate Cit, and assuming a steady-state concentration of acetyl-CoA, the flux through Cit synthase () must equal the flux of acetyl-CoA production via PDH (). This reflects the 1:1 stoichiometry of the reaction and allows us to equate these two fluxes:
Accordingly, the dynamics of pool —representing intermediates in the “right-hand” side of the TCA cycle—is governed by:
The flux represents the carbon transfer from the “right” to the “left” side of the TCA cycle. This includes both the canonical clockwise flux through succinyl-CoA and succinate, as well as the cataplerotic–anaplerotic route via Cit–Mal exchange. The latter becomes particularly active under high-energy, nutrient-rich conditions, when excess Cit is exported from mitochondria to the cytosol via the Cit/Isocit carrier (CIC) (see inset of Figure 1). Since the canonical oxidative pathway results in complete carbon loss as CO₂ and does not contribute to net carbon redistribution between pools, it is excluded from the model. Accordingly, is defined solely through the Cit–Mal exchange and is expressed as:
Here, reflects the dependence on metabolite levels in the right-hand segment of the TCA cycle. The parameter value is set to . The term emphasizes that flux is primarily regulated by the concentration of NADH. Elevated NADH levels inhibit the clockwise TCA flux by suppressing the activity of Isocit dehydrogenase (IDH) and αKG dehydrogenase (αKGDH) [21,22,23,24]. This inhibition results in Cit accumulation and its export from mitochondria to the cytosol, where it is cleaved into acetyl-CoA and OAA. The latter is then reduced by MDH, using NADH, to form Mal, which is subsequently transported back into the mitochondrial matrix (see the inset of Figure 1). Together, these processes highlight the strong dependence of flux on NADH concentration.
Flux represents the production of GABA from αKG via the Mal–Asp shuttle and the C4 efflux through UCP2 channels, as illustrated in greater detail in the inset of Figure 1. In our model, this flux is simplified by assuming dependence on the concentration of αKG (represented by ) and primarily on the level of NADH:
The parameter value is set to . The effect of NADH on this flux is closely linked to the activity of UCP2 channels, which facilitate the net transfer of carbon from α-KG to GABA (see inset of Figure 1). Elevated NADH levels reflect a high cellular energy state and lead to an oversupply of electrons to the mitochondrial electron transport chain (ETC). This oversupply can slow the overall rate of electron flow due to limited availability of downstream electron acceptors, thereby increasing the mitochondrial membrane potential and promoting the generation of reactive oxygen species (ROS). These ROS, in turn, activate UCP2 channels, which reduce the membrane potential and limit further ROS accumulation. The principal net cataplerotic flux enabled by this mechanism is illustrated in the inset of Figure 1, showing the redistribution of carbon from to via cytosolic Glu production and subsequent conversion to GABA. Critically, UCP2 plays a central role as a C4 metabolite carrier, enabling the export of intermediates such as Mal and OAA from the mitochondrial matrix to the cytosol [25,26,27]. This supports cytosolic Glu synthesis and downstream GABA production, thereby completing the cataplerotic arm of the GABA shunt.
The dynamics of pool , which represents the metabolites in the left-hand segment of the TCA cycle, is described by the following equation:
where the fluxes (Eq. 7) and (Eq. 9) have been defined previously.
The flux accounts for the anaplerotic input into the left-hand segment of the TCA cycle via the GABA shunt, with succinate as the key product replenishing the cycle. The GABA shunt is a three-step enzymatic pathway in which Glu is first converted to GABA by Glu decarboxylase (GAD), then to succinic semialdehyde by GABA transaminase (GABA-TK), and finally to succinate by succinic semialdehyde dehydrogenase (SSADH). This pathway bypasses the αKGDH step and provides an alternative route of carbon entry into the TCA cycle (see Figure 1).
Among the enzymes involved, SSADH is directly dependent on NAD+ and produces NADH in its final step. While GAD and GABA-TK do not consume NADH, GAD is known to be inhibited by elevated NADH levels, linking the redox state of the cell to the activity of the GABA shunt and ultimately the magnitude of flux [9].
Given that pancreatic beta cells express the full set of enzymes required for GABA shunt activity [28], this pathway is metabolically relevant under physiological conditions. In our model, we describe as a function of GABA concentration () while incorporating the inhibitory effect of NADH on GAD, which in turn modulates downstream GABA-TK activity and thereby the overall magnitude of the GABA shunt:
with parameter value .
Finally, the dynamics of the GABA pool () is modeled as:
where flux is defined in Eq. 10 and in Eq. 12.
3. Results
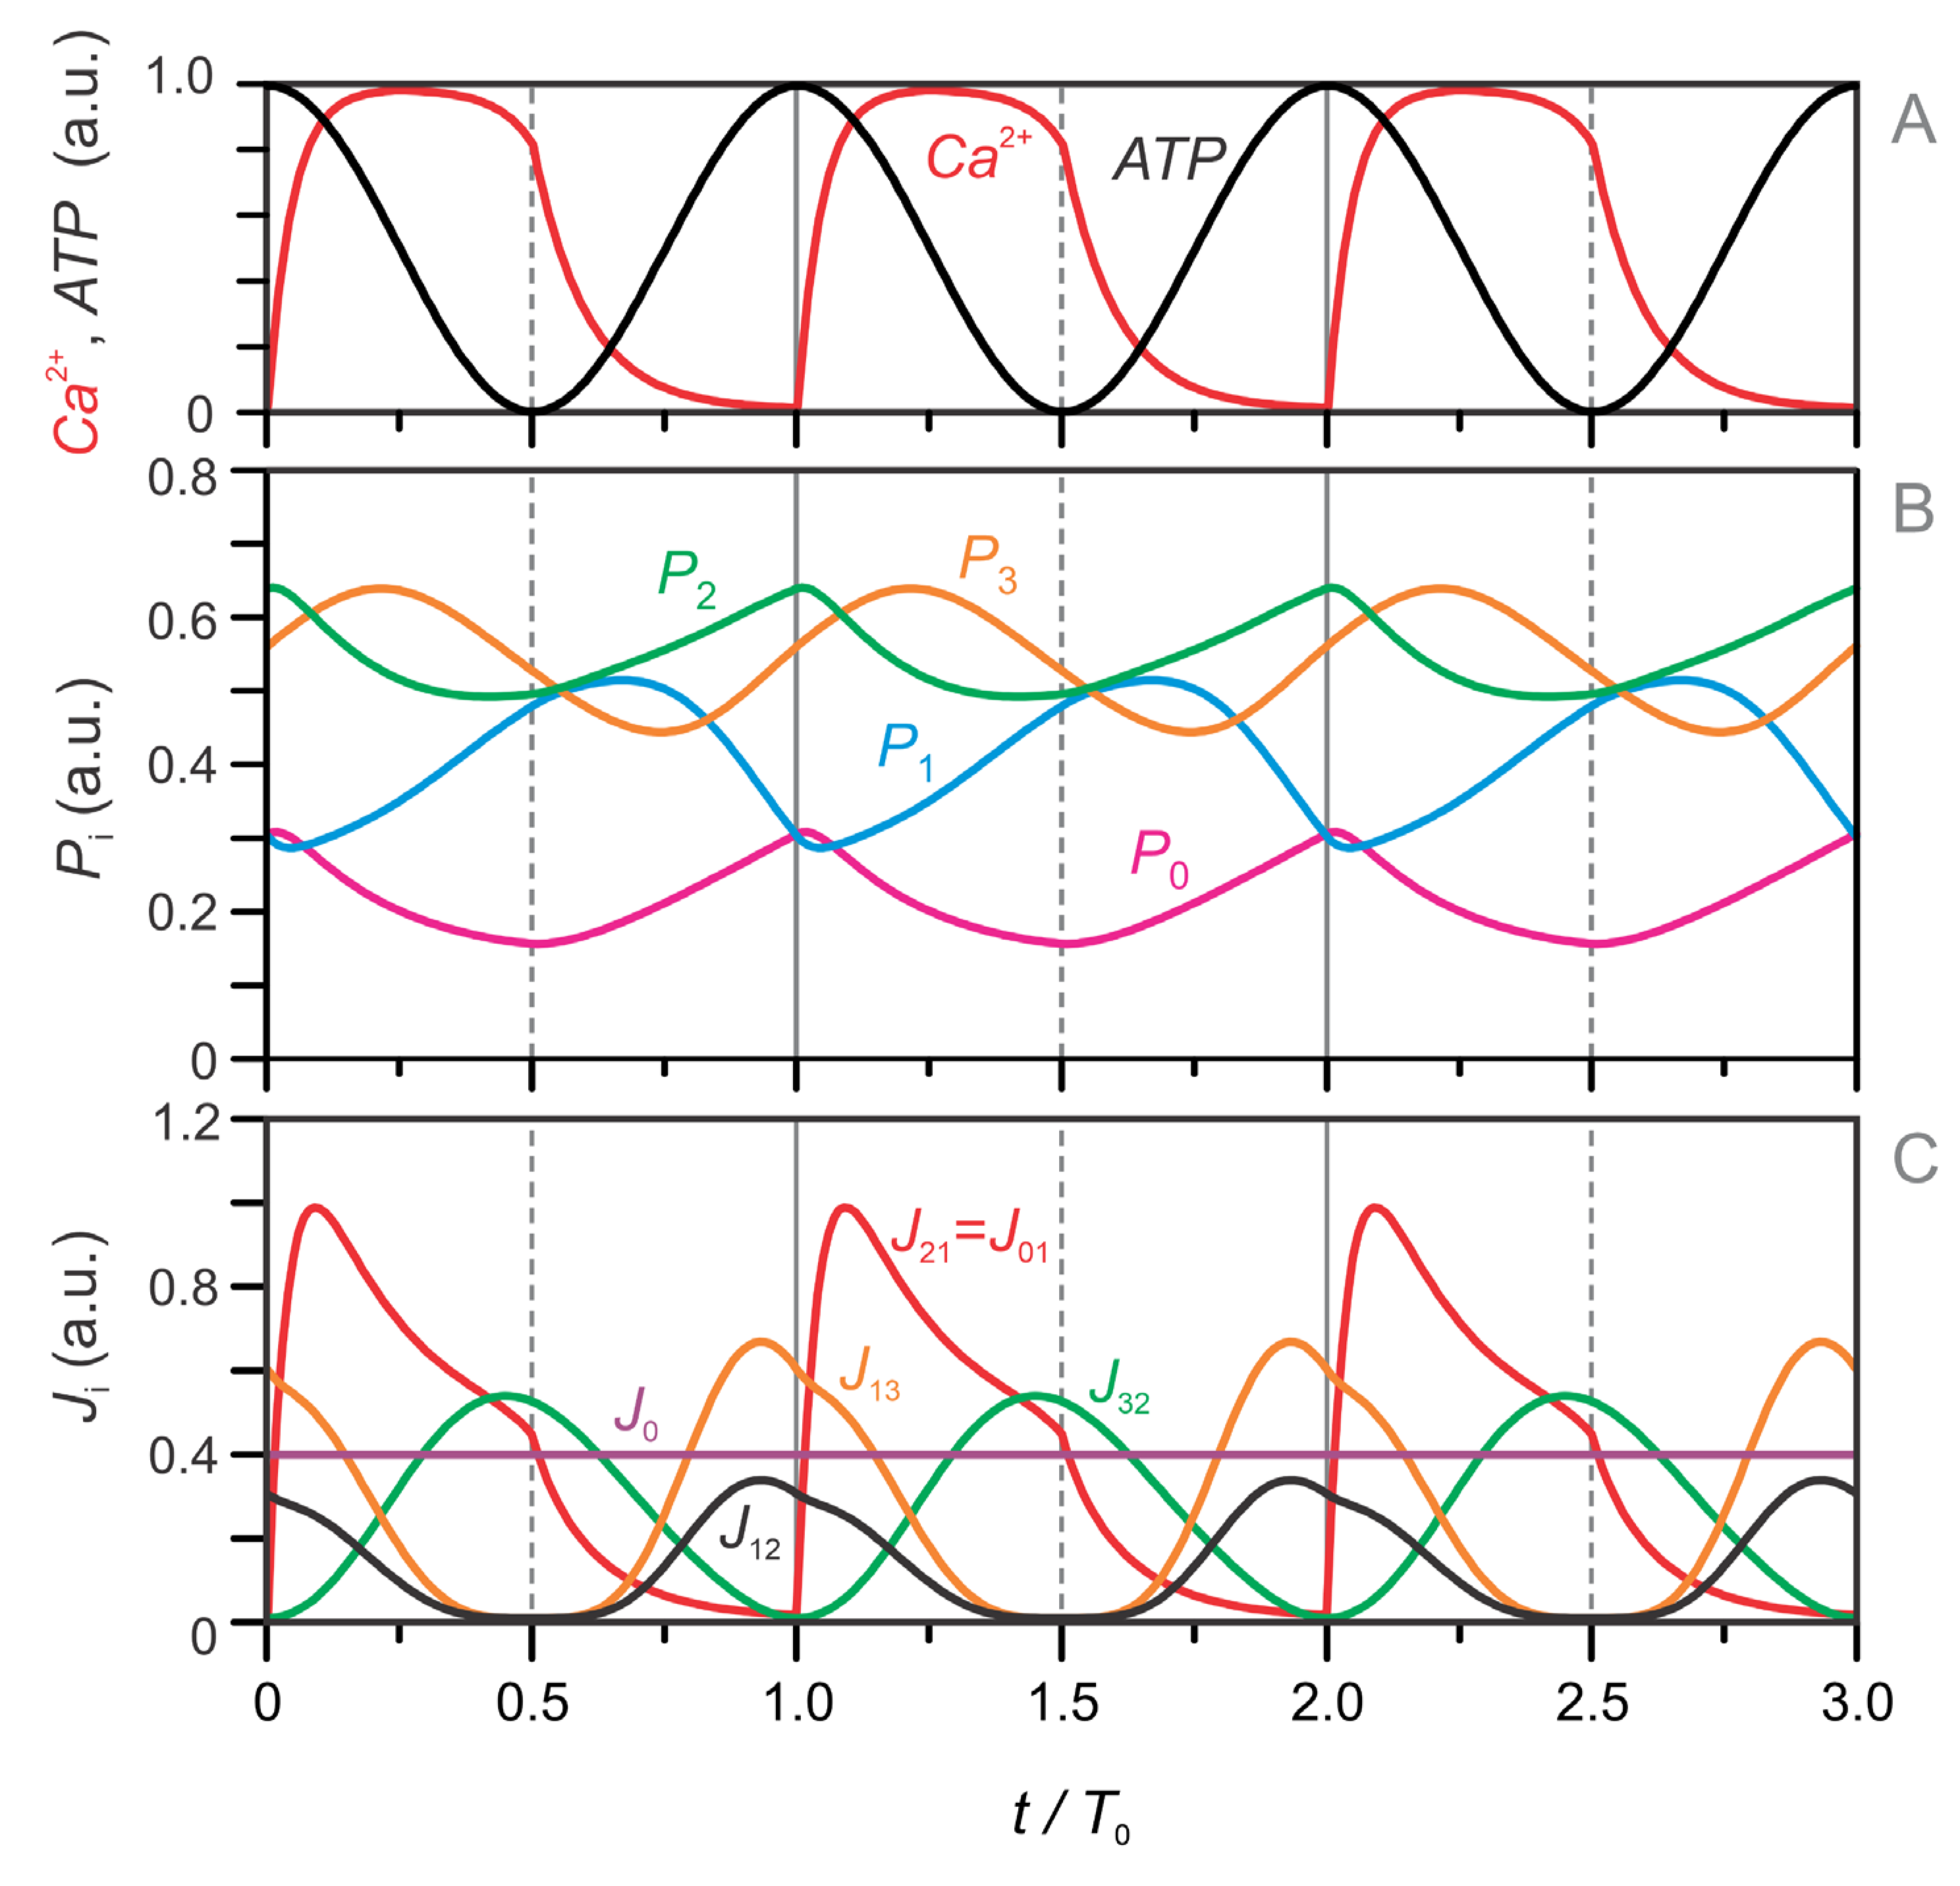
The model equations (Eqs. 1–13) were used to simulate the temporal evolution of metabolite concentrations across all four metabolic pools (–). These simulations also incorporate the dynamics of Ca²⁺ and ATP, which act as key regulatory inputs. For clarity, the time axis in Figure 4 begins at the onset of the Ca²⁺ pulse.
Figure 4A presents the imposed oscillatory profiles of Ca²⁺ and ATP, while Figure 4B and Figure 4C show the corresponding dynamics of the metabolite pools and fluxes. The Ca²⁺ pulse initiates the oscillatory sequence by triggering a depletion of the left-side TCA intermediates in pool . This depletion results from an increase in the flux (Figure 4C), which transfers carbon from to the right-side TCA pool . Simultaneously, Pyr derived from the glycolytic pool enters the TCA cycle via PDH, contributing to the flux . In our model, is set equal to , corresponding to the entry of acetyl-CoA into the TCA cycle. However, because Pyr entering via PDH is fully oxidized, it does not contribute to the net replenishment of TCA intermediates in . Consequently, this phase—driven by Ca²⁺-stimulated PDH activation—results in a net shift of carbon from to and marks the onset of the mitochondrial oxidative (MitoOx) phase, highlighted in red in Figure 4C.
Shortly thereafter, the GABA pool () becomes active, as seen in the declining trajectory in Figure 4B. This anaplerotic contribution via the GABA shunt replenishes through flux (Figure 4C), compensating for its earlier depletion. Because was initially emptied into , it is now capable of accepting fresh carbon from . This transfer is crucial for maintaining TCA cycling and OxPhos. As a result, continues to accumulate while declines. This orchestrated sequence— → , then → —builds a TCA cycle rich in carbon intermediates, sustaining NADH/FADH₂ production and oxidative metabolism during the MitoOx phase.
As ATP levels rise, the system transitions into the mitochondrial cataplerotic phase (MitoCat), indicated by the blue-shaded region in Figure 4C. In this phase, the TCA cycle—now saturated with carbon—shifts toward net efflux. UCP2 channels facilitate the export of C₄ dicarboxylates such as OAA, Asp, and Mal, while Cit and αKG are exchanged for Mal in the cytosol. These fluxes promote the production of cytosolic Glu (see Figure 1, inset) and contribute to carbon redistribution from back to and , as reflected in rising and . As a consequence, and refill, while becomes depleted (Figure 4B), completing the transition from oxidative to cataplerotic metabolism.
During the final stage of the MitoCat phase, the PEP cycle becomes fully active. This enables localized ATP production near the plasma membrane, particularly in microdomains adjacent to KATP channels. The locally elevated ATP concentration promotes KATP channel closure and initiates the next Ca²⁺ pulse, thereby restarting the cycle with a new MitoOx phase.
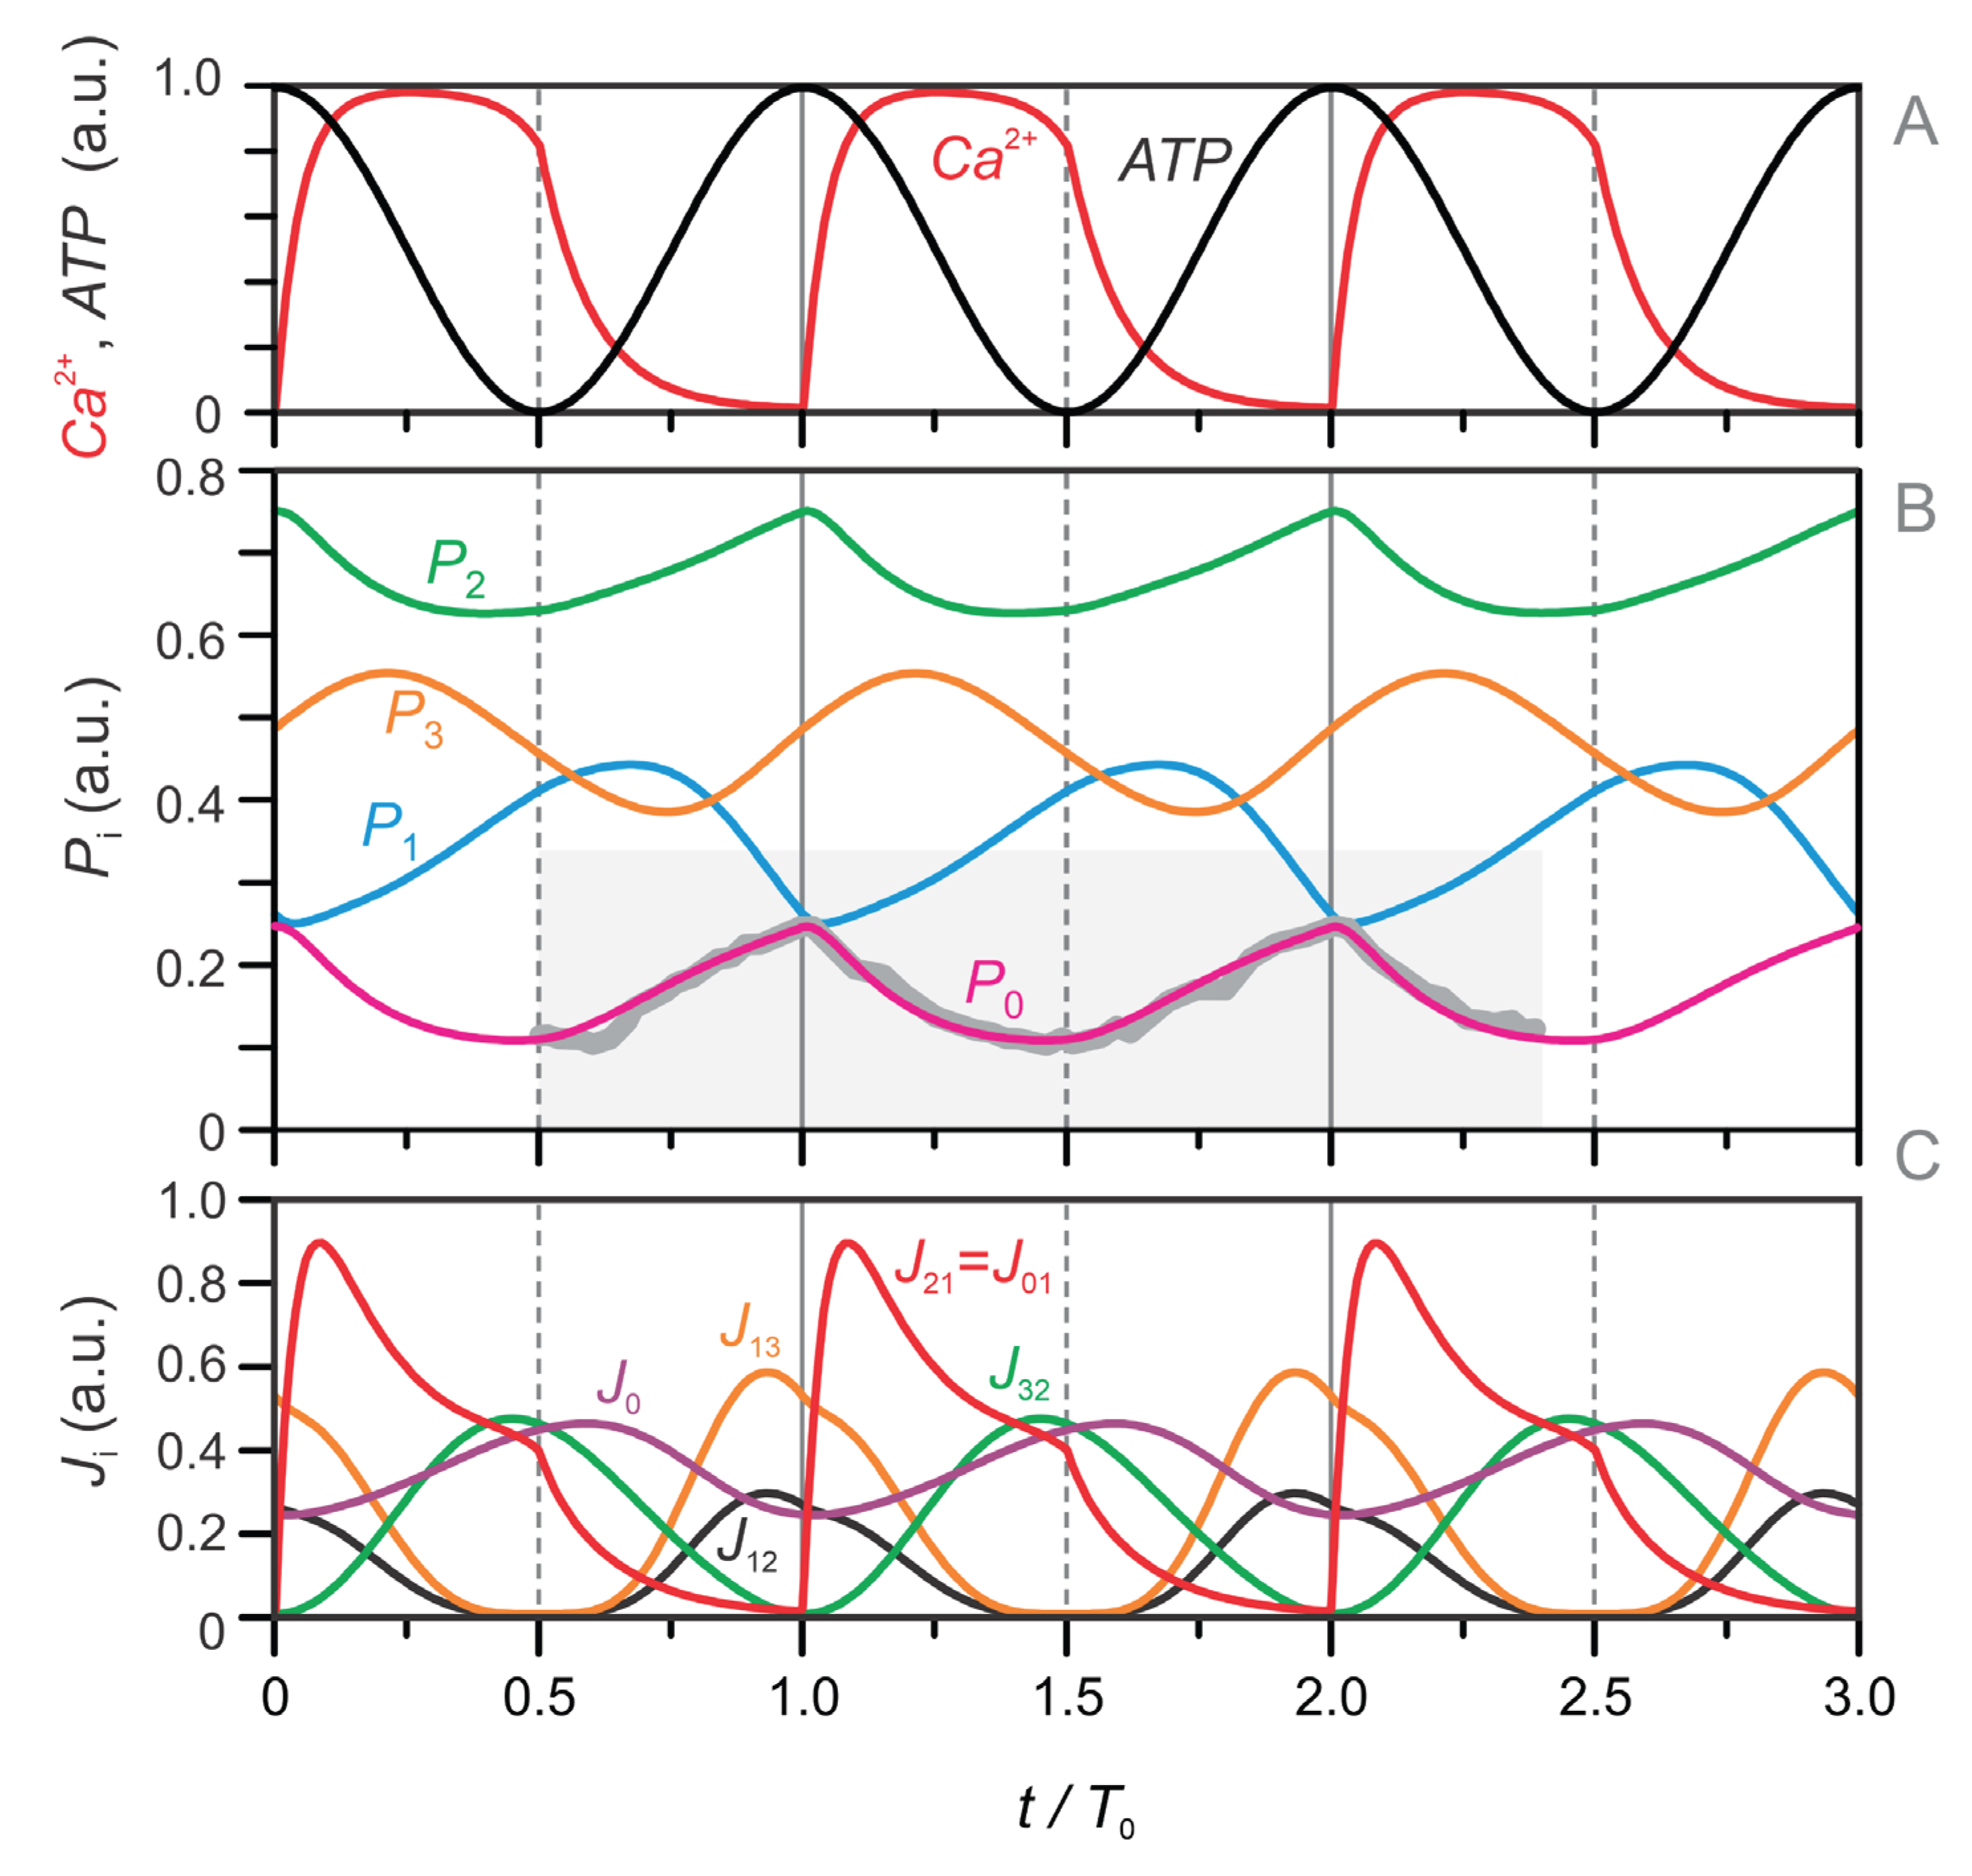
To evaluate the impact of glycolytic oscillations, we also simulated the model using a fixed value of —representing the average level of the oscillatory signal. The corresponding results are shown in Figure 4D–F. All other model parameters and equations remained unchanged. A comparison between Figure 4A–C and Figure 4D–F reveals that glycolytic oscillations, while contributing to fine-tuning, are fully synchronized and functionally dependent on the rest of the system—particularly through ATP produced in the TCA cycle. Notably, the core oscillatory pattern remains intact even with constant , underscoring the robustness and central regulatory role of the TCA–GABA oscillatory module.
To understand the coupling between glycolysis and TCA dynamics, it is crucial to recognize the central role of Ca²⁺. On one hand, Ca²⁺ pulses are triggered by ATP via KATP channels, thereby reflecting the redox state of the cell—particularly the metabolic activity within the TCA cycle. On the other hand, the sequestration of Ca²⁺ activates the TCA cycle, enhancing ATP production. This reciprocal Ca²⁺–TCA relationship—where Ca²⁺ both responds to and regulates mitochondrial metabolism—is tightly coupled to glycolysis. Specifically, Ca²⁺ directly influences the glycolytic–mitochondrial interface by promoting Pyr entry into the TCA cycle via PDH activation. This dual regulatory role of Ca²⁺ has been emphasized in previous modeling studies, particularly in the evaluation of the IOM model [29]. Notably, Bertram et al. (2023) [29] highlighted that the decline in FBP during the active (oxidative) phase results from elevated Ca²⁺ levels activating PDH, thereby accelerating the conversion of FBP-derived carbon into mitochondrial metabolism. This mechanistic coupling helps explain the experimentally observed “sawtooth” waveform of FBP [3].
In our simplified model, we clearly emphasize the Ca²⁺-dependent flux , consistent with the findings of Bertram et al. (2023) [29]; however, we do not reproduce the characteristic sawtooth-shaped profile of FBP, as its dynamics are approximated by a sinusoidal function (Eq. 5). To capture the detailed waveform of FBP, the FBP pool () would need to be modeled explicitly using a differential equation. This would require not only the efflux term , but also an influx term representing the conversion from F6P to FBP. In the Appendix, we demonstrate how such an extension can be implemented to reproduce the sawtooth dynamics. Appendix A1 presents the simplest approach, modeling as a constant influx. In Appendix A2, we introduce a more mechanistic formulation of , which incorporates the well-known ATP and Cit inhibition of PFK1 [30] and the positive feedback loop in which FBP enhances its own production by stimulating PFK1 activity [31,32,33]. As shown in Figure A2, this extended model shows good agreement with the experimentally observed sawtooth-shaped FBP oscillations [3].
3.1. Stock–Flow Diagrams Illustrating Model Behavior
To enhance intuitive understanding of the model’s dynamic behavior, we present a sequence of stock–flow diagrams (Figure 5) that illustrate the stepwise filling and emptying of the four metabolic pools (–) throughout the oscillatory cycle. These diagrams highlight the system’s progression through key transitional states and emphasize how metabolite pool levels and inter-pool fluxes evolve during the MitoOx and MitoCat phases.
In this representation, stocks refer to the concentrations of the metabolic pools (–), while flows denote the key metabolic fluxes: , , , , and . The glycolytic inflow is also shown for completeness, even though it is not explicitly defined in the core model. However, is analyzed in more detail in the Appendix.
Figure 5 illustrates six characteristic stages of the metabolic oscillation cycle:
Steps 2 and 3 represent the mitochondrial oxidative (MitoOx) phase (shaded red).
Steps 5 and 6 represent the mitochondrial cataplerotic (MitoCat) phase (shaded blue).
Steps 1 and 4 correspond to transitional phases that initiate/terminate the core oscillatory phases.
Step 1 – Ca²⁺-Triggered Entry into MitoOx Phase
This initial stage begins with a Ca²⁺ pulse that activates PDH, opening flux and allowing fresh carbon from the glycolytic pool to enter the TCA cycle. At this point, is relatively empty, primed to receive carbon from and . Fluxes and begin to rise in parallel, initiating the oxidative cycle.
Step 2 – Maximal OxPhos Phase
With strong PDH activation, high fluxes through and (highlighted in red) are initiated, leading to a temporary depletion of . Note that , because Cit formation in requires an equal input of Pyr (from ) and Mal-derived OAA (from ). These high fluxes support NADH and FADH₂ production and active OxPhos. During this stage, the TCA cycle operates fully in the clockwise direction (gray-shaded cycle in Figure 5), although the arrows are not drawn for the entire cycle. To avoid confusion with the graphical presentation, note that flux is not part of the TCA cycle (see Eq. (9)); its arrow is shown outside the gray-shaded cycle.
Step 3 – GABA Shunt-Driven Anaplerosis
Following the temporary depletion of , the GABA shunt (via , shown in red) replenishes , allowing TCA cycling to continue. This carbon input from sustains the MitoOx phase by restoring balance between the left and right TCA segments ( and ) and by providing additional NADH and FADH₂ through GABA-derived succinate entering the TCA cycle.
Step 4 – Transition to MitoCat Phase
This stage represents the metabolic turning point. Rising ATP levels and accumulation of TCA intermediates, especially in , cause oxidative cycling to slow and begin reversing. This initiates cataplerosis—extrusion of TCA intermediates—together with cataplerotic refilling of and . As regulatory signals shift (including declining Ca²⁺ together, changes in NADH/NAD⁺, and other metabolites), glycolytic influx is redirected from PDH toward PC. This PDH-off/PC-on switch, under conditions of high GTP, activates the PEP cycle.
Step 5 –Growing Cataplerosis, PEP Cycling, andRefilling
Cataplerotic fluxes intensify, with carbon extruded from to and . At high GTP levels, and with rising ( reaching its maximum at this stage), fluxes through the PEP cycle increase, efficiently translocating ATP from mitochondria into cytosolic microdomains near KATP channels.
Step 6 – Cataplerotic Refilling ofandCataplerosis now reaches its full extent. As GTP declines (consumed by the active PEP cycle), UCP2 inhibition weakens, enabling strong extrusion of C₄ units—mainly Asp and Mal. Together with Cit–Mal shuttling, this drives redistribution of intermediates through cataplerotic pathways converting αKG into Glu and further into GABA (see inset of Figure 1). Carbon is efficiently redistributed from to both and via large fluxes and (red arrows outside the gray-shaded TCA cycle). This final stage prepares the system for the next oscillation: and are fully replenished, while is in its final refilling phase. At the same time, the still-active PEP cycle completes ATP translocation to microdomains near KATP channels, setting the conditions for KATP channel closure and the next Ca²⁺ pulse.
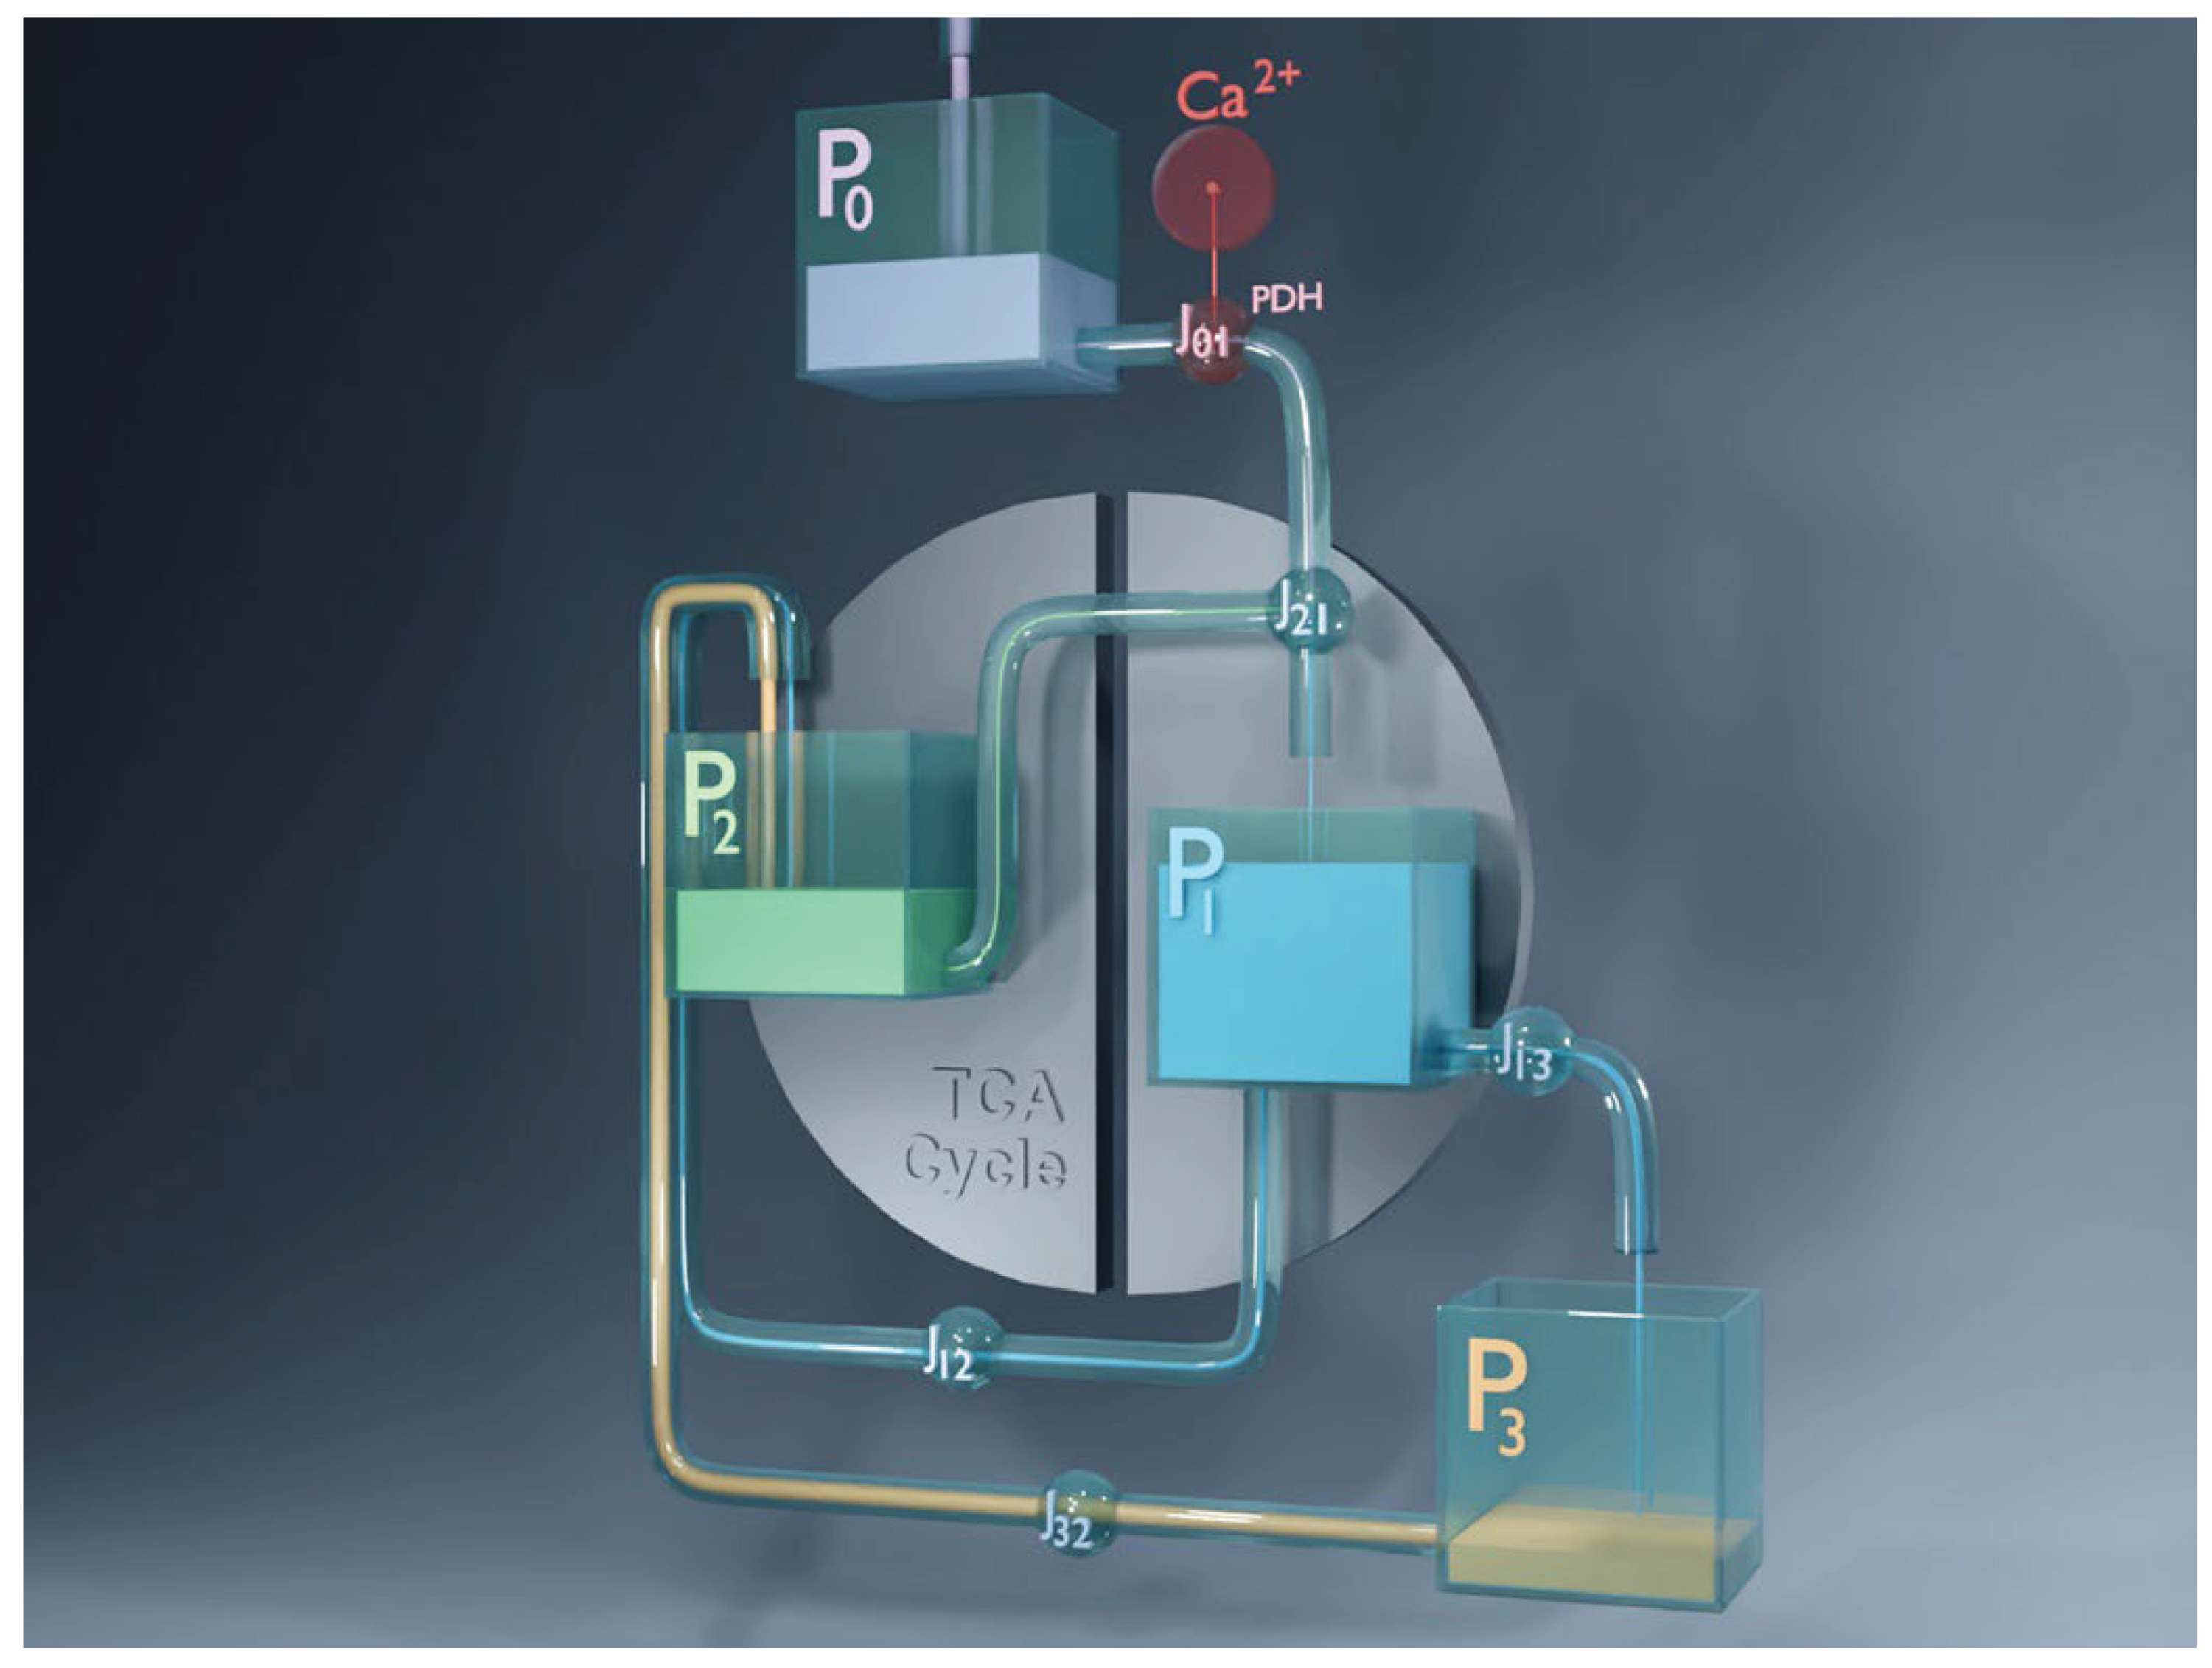
3.2. Simulated Animation of Metabolic Pool Dynamics
To better illustrate the model’s oscillatory behavior, we created an animated visualization showing the cyclic emptying and refilling of the four metabolic pools. The animation was generated in Blender and depicts the pools connected by pipelines, with fluxes represented as flowing liquid. It is based directly on the numerically simulated dynamics of the model in its most detailed form: the core system of equations described in the Model section, with the dynamics of defined explicitly as in Appendix A1 and the flux modeled with ATP-, FBP-, and Cit-dependent regulation as in Appendix A2. This ensures that the animation faithfully reflects the simulated metabolite and flux oscillations. A snapshot from the animation is shown in Figure 6, and the full video is available at: https://doi.org/10.5281/zenodo.16951481.
4. Discussion
In this study, we developed a mathematical model of beta cell dynamics that advances beyond canonical frameworks by integrating a more comprehensive representation of metabolic processes, including glycolysis, TCA cycle dynamics, and the interplay of key anaplerotic–cataplerotic pathways. We emphasize two critical anaplerotic routes. The first is Pyr carboxylation via PC, essential for supporting the PEP cycle—a mechanism crucial for fine-tuning Ca²⁺ pulses. Recent studies [18,34] have underscored the PEP cycle’s role in coordinating anaplerotic–cataplerotic cycling and in enabling spatially targeted ATP production near KATP channels, an understanding that contributed to the development of the MitoCat- MitoOx model [6], which we extend here. The second pathway is the GABA shunt, recently recognized as an important anaplerotic contributor to beta cell metabolism and insulin secretion [9]. Together, these routes form the foundation of the Dual Anaplerotic Model, which synthesizes elements from the canonical framework, the MitoCat- MitoOx model, and emerging concepts around the GABA shunt [35]. Importantly, DAM provides a new synergistic view in which the PC- and GABA shunt–driven anaplerotic routes function as interdependent and temporally coordinated processes: the GABA shunt reinforcing the MitoOx phase, and the PC-derived flux serving as a key element not only for PEP cycling, but also for cataplerotic replenishment of the GABA pool during the MitoCat phase, thereby enabling the coordinated redistribution of carbon across the pools defined in our model.
The model integrates glycolysis, TCA dynamics with anaplerosis and cataplerosis, and GABA metabolism into a tightly coupled system. This metabolic framework is further entrained with Ca²⁺ signaling, which plays a pivotal role in beta cell function. Although we did not explicitly model Ca²⁺ dynamics or plasma membrane electrophysiology, we linked experimentally observed Ca²⁺ oscillations to metabolic activity. This approach directly engages a long-standing debate: do Ca²⁺ oscillations drive metabolic oscillations, or do intrinsic metabolic oscillations drive Ca²⁺ and electrical activity [5]? Early work suggested that intrinsic glycolytic oscillations arise in beta cells through PFK-M, which is subject to positive feedback from its product, FBP [19]. Indeed, PFK-M was confirmed as the dominant isoform in beta cells [32]. However, experiments clamping Ca²⁺ levels produced mixed outcomes: metabolic oscillations were sometimes suppressed [36,37] but in other cases persisted or were restored [38]. Moreover, PFK-M knockout did not abolish slow oscillations in beta cells [39,40]. Marinelli et al. (2018) [40] proposed that other isoforms, particularly PFK-P, may compensate—a hypothesis supported by simulations using the IOM. Importantly, the IOM also demonstrated that the hierarchy of oscillatory control can vary by context: in some conditions, electrical and Ca²⁺ oscillations drive metabolism, whereas in others, intrinsic metabolic oscillations set the pace for Ca²⁺ and electrical activity [41].
Our model demonstrates that glycolytic oscillations, while important, are not the sole pacemaker. The simple fact that, for example, glycolytic oscillations in intact yeast cells have a period of about ~1 min [42] whereas in beta cells the period is ~5 min [3] clearly shows that the glycolytic apparatus is not a fixed, pre-determined system. Moreover, for yeast, Richard (2003) [43] demonstrated that the oscillation frequency is highly adaptable to environmental conditions—for instance, under aerobic conditions, oscillatory metabolism can occur at much lower frequencies. In beta cells, glycolytic oscillations appear to function as an entrained subsystem within a tightly synchronized network incorporating TCA metabolism and the GABA shunt. Here, the majority of ATP production occurs in mitochondria—particularly during the MitoOx phase—while a substantial fraction of ATP is consumed by Ca²⁺-ATPases. Consequently, glycolysis adapts its rhythm to align with mitochondrial ATP supply and Ca²⁺-dependent ATP consumption. As shown in our model, glycolysis is entrained by the slower, dominant TCA–GABA–Ca²⁺ module, which, as the primary timing element, serves as the effective pacemaker for GSIS. This entrainment ensures that glycolysis delivers carbon intermediates precisely when the TCA cycle and GABA shunt are optimally positioned to convert them into ATP and GTP. Such coordination maximizes metabolic efficiency and synchronizes ATP availability with the timing of KATP channel closure and Ca²⁺ influx, thereby enhancing the precision and robustness of pulsatile insulin secretion. Notably, the oscillatory behavior persists even in a reduced three-pool model (, , and ) with constant , underscoring the robustness and central regulatory role of the TCA–GABA–Ca²⁺ module in sustaining dominant ATP fluxes and coordinating critical anaplerotic–cataplerotic transitions.
Although the model includes Pyr entry via PC and carbon input through the GABA shunt, these anaplerotic fluxes are counterbalanced by cataplerotic outflows, rendering the system a quasi-closed loop governed primarily by internal fluxes among , , and . Importantly, the net anaplerotic fluxes are modest—consistent with experimental evidence showing that more than 80% of the utilized glucose is oxidized [44]. This indicates that beta cells prioritize signaling over biomass production, consistent with their endocrine role. Accordingly, anaplerotic–cataplerotic cycling in beta cells is best understood as serving regulatory and signaling functions rather than biosynthetic needs [45]. Nevertheless, biosynthesis—particularly of FFA—remains important in beta cells and can be tightly coupled to signaling. For example, short-chain acyl-CoAs derived from Cit cataplerotically exported from mitochondria have been shown to exert potent regulatory effects on beta cell function, especially in rodent islets [46]. More recently, it has been proposed that FFA biosynthesis may contribute to GSIS by replenishing membrane lipids required for vesicle-mediated exocytosis and/or by providing an electron sink to balance increased glucose catabolism [47]. In particular, the biosynthetic role may be crucial during beta cell development, as evidenced by recent findings of enhanced reductive TCA cycle activity in human pluripotent stem cell–derived islets [48]. These results underscore the importance of considering both oxidative and reductive TCA pathways, providing strong conceptual support for MitoCat-MitoOx models.
The dynamics of TCA metabolites—and their fluctuations in the cytosol via cataplerotic export—have been measured with high temporal resolution, allowing direct comparison with our model predictions. Unlike previous frameworks, our approach explicitly tracks TCA pools, capturing the dynamic redistribution of key intermediates. A particularly compelling line of evidence comes from MacDonald et al. (2003) [49], who measured mitochondrial Cit oscillations and identified Cit as the most prominently oscillating TCA intermediate. Consistently, our simulations predict that Cit oscillations are the most pronounced among TCA metabolites: the pool is emptied during the MitoOx phase (via fluxes from and ), replenished via and the GABA shunt, and then depleted again during MitoCat. The timing of maximal cataplerotic flux () in our model coincides with the experimentally observed anti-phasic oscillations of cytosolic Cit reported by Gregg et al. (2019) [17]. Furthermore, MacDonald et al. (2003) [49] demonstrated that mitochondrial Cit continues to oscillate even under constant Pyr supply, indicating that these fluctuations arise from intrinsic TCA dynamics—fully consistent with our model’s prediction of the dominant role of the TCA–GABA module. In addition, they emphasized citrate’s function as a potent PFK inhibitor, capable of modulating glycolytic flux and synchronizing mitochondrial activity. This feedback role of Cit strongly supports our concept of a synergistic, integrated metabolic network in which glycolysis, the TCA cycle, and the GABA shunt operate in tight coordination. Incorporating this feedback mechanism directly into our model has contributed to the improved predictive accuracy described in Appendix A2.
Similarly, Glu dynamics align closely with our predicted cataplerotic pattern. Lewandowski et al. (2020) [18] reported that cytosolic Glu levels peak during the MitoCat phase, in agreement with elevated J₁₃ flux in our model and with αKG-to-Glu conversion as mechanistically described in Grubelnik et al. (2024) [7]. Beyond its amplifying role in insulin secretion [7], Glu also contributes to refilling the GABA pool () toward the end of the MitoCat phase. This timing is consistent with the observations of Menegaz et al. (2019) [28], who showed pulsatile GABA dynamics and proposed that GABA contributes both to terminating insulin secretion bursts and to synchronizing the rhythm of pulsatile release. In our model, GABA replenishment at the end of the MitoCat phase aligns precisely with these experimental findings, linking cataplerotic fluxes to both the termination and resynchronization of GSIS cycles.
Finally, we emphasize that the DAM is intentionally constructed as a minimal model. Several dynamic components are taken directly from experimental observations rather than modeled explicitly, and the modeled dynamics are simplified to focus primarily on phase relationships and the sequential filling and emptying of metabolic pools. As a result, the detailed waveforms of certain metabolites are only approximated. For example, while FBP was represented as a smooth sinusoid in the core model, Appendix A2 demonstrates that its experimentally observed “sawtooth” profile [3] can be reproduced through more detailed modeling of the glycolytic influx . This highlights that the DAM is not a final or exhaustive description but rather a flexible, modular framework.
The strength of this approach lies in its modularity, which allows systematic refinement and extension. Future work could focus on incorporating more detailed representations of glycolysis, explicitly modeling PFK isoform-specific regulation, or extending the TCA module to include parallel shuttles and redox-balancing mechanisms. Similarly, the role of the GABA shunt in shaping pulsatile insulin secretion could be further explored by integrating its interaction with Glu metabolism and neurotransmitter-like signaling effects. Another important direction is to couple the metabolic core more explicitly with electrophysiological models of the plasma membrane, thereby linking metabolic oscillations with membrane potential dynamics and Ca²⁺ handling. Together, these refinements would provide a more comprehensive explanation of how the interplay between metabolic, electrical, and Ca²⁺ oscillations coordinates pulsatile insulin secretion under both physiological and pathophysiological conditions. Thus, while the DAM is intentionally minimal by design, its modular architecture provides a robust foundation for iterative refinement. By bridging experimental evidence with mechanistic modeling, it offers a promising platform for future investigations into the metabolic and signaling networks that govern beta cell oscillatory function and GSIS.
Supplementary Materials
The following supporting information can be downloaded at the website of this paper posted on Preprints.org, Figure S1: title; Table S1: title; Video S1: title.
Author Contributions
Conceptualization, M.M.; methodology, V.G.; software, V.G. and J.Z.; formal analysis, V.G.; writing—original draft preparation, M.M., V.G. and J.Z.; writing—review and editing, M.M., V.G. and J.Z.; visualization, V.G.; supervision, M.M.; All authors have read and agreed to the published version of the manuscript.
Funding
This research was funded by the Slovenian Research and Innovation Agency (research core funding no. P1-0055 and research project no. J3-60062).
Conflicts of Interest
The authors declare no conflicts of interest.
Abbreviations
The following abbreviations are used in this manuscript:
| αKG | α-ketoglutarate |
| α-KGDH | α-KG dehydrogenase |
| Asp | aspartate |
| CIC | citrate-isocitrate carrier |
| Cit | Citrate |
| DAM | dual anaplerotic model |
| DOM | dual oscillator model |
| ETC | electron transport chain |
| FBP | fructose-1,6-bisphosphate |
| Fum | fumarate |
| GABA | gamma-aminobutyric acid |
| GABA-TK | GABA transaminase |
| GAD | glutamate decarboxylase |
| Glu | glutamate |
| Gln | glutamine |
| GSIS | glucose-stimulated insulin secretion |
| IDH | isocitrate dehydrogenase |
| IOM | integrated oscillator model |
| KATP | ATP-sensitive potassium |
| Mal | malate |
| ME1 | malic enzyme |
| OAA | oxaloacetate |
| OxPhos | oxidative phosphorylation |
| PC | pyruvate carboxylase |
| PEP | phosphoenolpyruvate |
| PDH | pyruvate dehydrogenase |
| PFK | phosphofructokinase |
| PK | pyruvate kinase |
| Pyr | pyruvate |
| ROS | reactive oxygen species |
| SSADH | succinic semialdehyde dehydrogenase |
| TCA | tricarboxylic acid |
| UCP2 | uncoupling protein 2 |
Appendix A
Appendix A.1: Modeling as a Constant Influx into
In this simplest approach, the flux is modeled as a constant influx. The change in is described by the equation:
where , .
The value of must be sufficiently large to ensure an adequate supply of substrate. If is decreased, the influx into is reduced, causing the average value of to decrease. Consequently, the flux , which depends on , also decreases. This results in lower average values of P₁ and P₃, an increase in P₂, and eventual loss of oscillations.
Introducing a constant demonstrates that as long as substrate inflow is high enough, the system can sustain its function. As shown in Figure A1, the oscillations of , , , and are very similar to and phase-aligned with those in the core model (Figure 4), indicating that oscillations—and thus those of the other pools—are primarily driven by the flux , whose magnitude depends mainly on Ca²⁺.
Figure A1.
Simulated dynamics of metabolic pools (–) and the corresponding fluxes between them. (A) Time courses of intracellular Ca²⁺ (red) and ATP (black), which serve as inputs to the model and are fitted to experimental data (see Figure 2 and Eqs. 1–2). (B) Temporal dynamics of the four metabolic pools: the glycolytic pool (), right-hand TCA cycle intermediates (), left-hand TCA cycle intermediates (), and the GABA pool (). (C) Key fluxes between pools: (flux from through PDH), (oxidative carbon transfer from to ), (cataplerotic redistribution from to ), (cataplerotic outflow from to ), and (anaplerotic GABA shunt flux from to ). Initial values for (B and C) are: , , , .
A2 : Modeling with ATP, FBP, and Cit Regulation
The flux , taken as constant in Equation A1, is here modified to account for known inhibitory and activating effects on PFK1, modeled using the equation:
where: , , , and . The first term represents the well-known inhibition of PFK1 by ATP [19,30], modeled through the difference , so that a drop in ATP—during Ca²⁺-stimulated ATPase activity—leads to an increase in . The second component captures the positive feedback of FBP on its own production via PFK1 activation (), as established in earlier studies [4,31,32,33], with chosen to emphasize this effect relative to the FBP level. Finally, Cit inhibition of PFK1 is incorporated through the term, where represents mitochondrial Cit, which oscillates in antiphase to cytosolic Cit [17,49], making it a suitable proxy for cytosolic Cit inhibition. The constants and were selected to ensure that, for the oscillating values of ATP, , and , the flux provides sufficient substrate input to maintain metabolite oscillations within the physiological range.
The simulated dynamics of metabolic pools (–) and the corresponding fluxes between them are shown in Figure A2. When cytosolic Ca²⁺ rises, ATP begins to decline due to ATPase activity, which stimulates PFK via the ATP-dependent term and causes to increase, despite the concurrent decline in FBP () and the resulting loss of its positive feedback on PFK1 activation. Meanwhile, cytosolic Cit drops, and at the midpoint of the Ca²⁺ pulse—when ATP reaches its minimum— continues to rise slightly due to the reduced cytosolic Cit (reflected in the increase in ). Toward the end of the pulse, ATP and cytosolic Cit recover, and decreases, although elevated sustains it above baseline. Notably, the model reproduces oscillations of with the characteristic “sawtooth-like” profile observed experimentally for FBP oscillations in beta cells [3].
Figure A2.
Simulated dynamics of metabolic pools (–) and the corresponding fluxes between them. (A) Time courses of intracellular Ca²⁺ (red) and ATP (black), which serve as inputs to the model and are fitted to experimental data (see Figure 2 and Eqs. 1–2). (B) Temporal dynamics of the four metabolic pools: the glycolytic pool (), right-hand TCA cycle intermediates (), left-hand TCA cycle intermediates (), and the GABA pool (). Experimental FBP measurements from Merrins et al. (2016) [3] are shown in gray for direct comparison with model-predicted , highlighting the good agreement between simulations and observations. (C) Key fluxes between pools: (flux from through PDH), (oxidative carbon transfer from to ), (cataplerotic redistribution from to ), (cataplerotic outflow from to ), and (anaplerotic GABA shunt flux from to ). Initial values for (B and C) are: , , , .
References
- Matthews, D.R.; Lang, D.A.; Burnett, M.A.; Turner, R.C. Control of Pulsatile Insulin Secretion in Man. Diabetologia 1983, 24. [Google Scholar] [CrossRef] [PubMed]
- Bertram, R.; Satin, L.; Zhang, M.; Smolen, P.; Sherman, A. Calcium and Glycolysis Mediate Multiple Bursting Modes in Pancreatic Islets. Biophys J 2004, 87, 3074–3087. [Google Scholar] [CrossRef]
- Merrins, M.J.; Poudel, C.; McKenna, J.P.; Ha, J.; Sherman, A.; Bertram, R.; Satin, L.S. Phase Analysis of Metabolic Oscillations and Membrane Potential in Pancreatic Islet β -Cells. Biophys J 2016, 110, 691–699. [Google Scholar] [CrossRef]
- McKenna, J.P.; Ha, J.; Merrins, M.J.; Satin, L.S.; Sherman, A.; Bertram, R. Ca 2+ Effects on ATP Production and Consumption Have Regulatory Roles on Oscillatory Islet Activity. Biophys J 2016, 110, 733–742. [Google Scholar] [CrossRef]
- Bertram, R.; Satin, L.S.; Sherman, A.S. Closing in on the Mechanisms of Pulsatile Insulin Secretion. Diabetes 2018, 67, 351–359. [Google Scholar] [CrossRef] [PubMed]
- Merrins, M.J.; Corkey, B.E.; Kibbey, R.G.; Prentki, M. Metabolic Cycles and Signals for Insulin Secretion. Cell Metab 2022, 34, 947–968. [Google Scholar] [CrossRef]
- Grubelnik, V.; Zmazek, J.; Gosak, M.; Marhl, M. The Role of Anaplerotic Metabolism of Glucose and Glutamine in Insulin Secretion: A Model Approach. Biophys Chem 2024, 311, 107270. [Google Scholar] [CrossRef] [PubMed]
- Grubelnik, V.; Zmazek, J.; Marhl, M. The Synergistic Impact of Glycolysis, Mitochondrial OxPhos, and PEP Cycling on ATP Production in Beta Cells. Int J Mol Sci 2025, 26, 1454. [Google Scholar] [CrossRef]
- Tamarit-Rodriguez, J. Metabolic Role of GABA in the Secretory Function of Pancreatic β-Cells: Its Hypothetical Implication in β-Cell Degradation in Type 2 Diabetes. Metabolites 2023, 13, 697. [Google Scholar] [CrossRef]
- Pizarro-Delgado, J.; Braun, M.; Hernández-Fisac, I.; Martín-Del-Río, R.; Tamarit-Rodriguez, J. Glucose Promotion of GABA Metabolism Contributes to the Stimulation of Insulin Secretion in β-Cells. Biochemical Journal 2010, 431, 381–390. [Google Scholar] [CrossRef]
- Hagan, D.W.; Ferreira, S.M.; Santos, G.J.; Phelps, E.A. The Role of GABA in Islet Function. Front Endocrinol (Lausanne) 2022, 13. [Google Scholar] [CrossRef]
- Wiederkehr, A.; Wollheim, C. Impact of Mitochondrial Calcium on the Coupling of Metabolism to Insulin Secretion in the Pancreatic β-Cell. Cell Calcium 2008, 44, 64–76. [Google Scholar] [CrossRef]
- Idevall-Hagren, O.; Tengholm, A. Metabolic Regulation of Calcium Signaling in Beta Cells. Semin Cell Dev Biol 2020, 103, 20–30. [Google Scholar] [CrossRef]
- Woyda-Ploszczyca, A.M.; Jarmuszkiewicz, W. The Conserved Regulation of Mitochondrial Uncoupling Proteins: From Unicellular Eukaryotes to Mammals. Biochimica et Biophysica Acta (BBA) - Bioenergetics 2017, 1858, 21–33. [Google Scholar] [CrossRef]
- Tarasov, A.I.; Griffiths, E.J.; Rutter, G.A. Regulation of ATP Production by Mitochondrial Ca2+. Cell Calcium 2012, 52, 28–35. [Google Scholar] [CrossRef]
- Li, J.; Shuai, H.Y.; Gylfe, E.; Tengholm, A. Oscillations of Sub-Membrane ATP in Glucose-Stimulated Beta Cells Depend on Negative Feedback from Ca2+. Diabetologia 2013, 56, 1577–1586. [Google Scholar] [CrossRef] [PubMed]
- Gregg, T.; Sdao, S.M.; Dhillon, R.S.; Rensvold, J.W.; Lewandowski, S.L.; Pagliarini, D.J.; Denu, J.M.; Merrins, M.J. Obesity-Dependent CDK1 Signaling Stimulates Mitochondrial Respiration at Complex I in Pancreatic β-Cells. Journal of Biological Chemistry 2019, 294, 4656–4666. [Google Scholar] [CrossRef] [PubMed]
- Lewandowski, S.L.; Cardone, R.L.; Foster, H.R.; Ho, T.; Potapenko, E.; Poudel, C.; VanDeusen, H.R.; Sdao, S.M.; Alves, T.C.; Zhao, X.; et al. Pyruvate Kinase Controls Signal Strength in the Insulin Secretory Pathway. Cell Metab 2020, 32, 736–750.e5. [Google Scholar] [CrossRef]
- Tornheim, K. Are Metabolic Oscillations Responsible for Normal Oscillatory Insulin Secretion? Diabetes 1997, 46, 1375–1380. [Google Scholar] [CrossRef] [PubMed]
- Nazaret, C.; Heiske, M.; Thurley, K.; Mazat, J.-P. Mitochondrial Energetic Metabolism: A Simplified Model of TCA Cycle with ATP Production. J Theor Biol 2009, 258, 455–464. [Google Scholar] [CrossRef]
- Tretter, L.; Adam-Vizi, V. Alpha-Ketoglutarate Dehydrogenase: A Target and Generator of Oxidative Stress. Philosophical Transactions of the Royal Society B: Biological Sciences 2005, 360, 2335–2345. [Google Scholar] [CrossRef]
- Martínez-Reyes, I.; Chandel, N.S. Mitochondrial TCA Cycle Metabolites Control Physiology and Disease. Nat Commun 2020, 11, 102. [Google Scholar] [CrossRef]
- Fallon, M.J.; MacDonald, M.J. β-Cell α-Ketoglutarate Hydroxylases May Acutely Participate in Insulin Secretion. Metabolism 2008, 57, 1148–1154. [Google Scholar] [CrossRef]
- Hansen, G.E.; Gibson, G.E. The α-Ketoglutarate Dehydrogenase Complex as a Hub of Plasticity in Neurodegeneration and Regeneration. Int J Mol Sci 2022, 23, 12403. [Google Scholar] [CrossRef]
- Vozza, A.; Parisi, G.; De Leonardis, F.; Lasorsa, F.M.; Castegna, A.; Amorese, D.; Marmo, R.; Calcagnile, V.M.; Palmieri, L.; Ricquier, D.; et al. UCP2 Transports C4 Metabolites out of Mitochondria, Regulating Glucose and Glutamine Oxidation. Proceedings of the National Academy of Sciences 2014, 111, 960–965. [Google Scholar] [CrossRef]
- Nesci, S.; Rubattu, S. UCP2, a Member of the Mitochondrial Uncoupling Proteins: An Overview from Physiological to Pathological Roles. Biomedicines 2024, 12, 1307. [Google Scholar] [CrossRef]
- Pecqueur, C.; Bui, T.; Gelly, C.; Hauchard, J.; Barbot, C.; Bouillaud, F.; Ricquier, D.; Miroux, B.; Thompson, C.B. Uncoupling Protein-2 Controls Proliferation by Promoting Fatty Acid Oxidation and Limiting Glycolysis-derived Pyruvate Utilization. The FASEB Journal 2008, 22, 9–18. [Google Scholar] [CrossRef] [PubMed]
- Menegaz, D.; Hagan, D.W.; Almaça, J.; Cianciaruso, C.; Rodriguez-Diaz, R.; Molina, J.; Dolan, R.M.; Becker, M.W.; Schwalie, P.C.; Nano, R.; et al. Mechanism and Effects of Pulsatile GABA Secretion from Cytosolic Pools in the Human Beta Cell. Nat Metab 2019, 1, 1110–1126. [Google Scholar] [CrossRef]
- Bertram, R.; Marinelli, I.; Fletcher, P.A.; Satin, L.S.; Sherman, A.S. Deconstructing the Integrated Oscillator Model for Pancreatic <math Altimg=“si237.Svg” Display=“inline” Id=“d1e1207”> <mi>β</Mi> </Math> -Cells. Math Biosci 2023, 365, 109085. [Google Scholar] [CrossRef]
- Kondo, S.; Adachi, K. The Nature of the Inhibition and Activation of Epidermal Phosphofructokinase: An Allosteric Enzyme. Journal of Investigative Dermatology 1972, 59, 397–401. [Google Scholar] [CrossRef] [PubMed]
- Higgins, J. A CHEMICAL MECHANISM FOR OSCILLATION OF GLYCOLYTIC INTERMEDIATES IN YEAST CELLS. Proceedings of the National Academy of Sciences 1964, 51, 989–994. [Google Scholar] [CrossRef]
- Yaney, G.C.; Schultz, V.; Cunningham, B.A.; Dunaway, G.A.; Corkey, B.E.; Tornheim, K. Phosphofructokinase Isozymes in Pancreatic Islets and Clonal β-Cells (INS-1). Diabetes 1995, 44, 1285–1289. [Google Scholar] [CrossRef] [PubMed]
- Westermark, P.O.; Lansner, A. A Model of Phosphofructokinase and Glycolytic Oscillations in the Pancreatic β-Cell. Biophys J 2003, 85, 126–139. [Google Scholar] [CrossRef] [PubMed]
- Foster, H.R.; Ho, T.; Potapenko, E.; Sdao, S.M.; Huang, S.M.; Lewandowski, S.L.; VanDeusen, H.R.; Davidson, S.M.; Cardone, R.L.; Prentki, M.; et al. β-Cell Deletion of the PKm1 and PKm2 Isoforms of Pyruvate Kinase in Mice Reveals Their Essential Role as Nutrient Sensors for the KATP Channel. Elife 2022, 11. [Google Scholar] [CrossRef]
- Tamarit-Rodriguez, J. Stimulus–Secretion Coupling Mechanisms of Glucose-Induced Insulin Secretion: Biochemical Discrepancies Among the Canonical, ADP Privation, and GABA-Shunt Models. Int J Mol Sci 2025, 26, 2947. [Google Scholar] [CrossRef] [PubMed]
- Kennedy, R.T.; Kauri, L.M.; Dahlgren, G.M.; Jung, S.-K. Metabolic Oscillations in β-Cells. Diabetes 2002, 51, S152–S161. [Google Scholar] [CrossRef]
- Bertram, R.; Satin, L.S.; Pedersen, M.G.; Luciani, D.S.; Sherman, A. Interaction of Glycolysis and Mitochondrial Respiration in Metabolic Oscillations of Pancreatic Islets. Biophys J 2007, 92, 1544–1555. [Google Scholar] [CrossRef]
- Merrins, M.J.; Fendler, B.; Zhang, M.; Sherman, A.; Bertram, R.; Satin, L.S. Metabolic Oscillations in Pancreatic Islets Depend on the Intracellular Ca2+ Level but Not Ca2+ Oscillations. Biophys J 2010, 99, 76–84. [Google Scholar] [CrossRef]
- Richard, A.-M.T.; Webb, D.-L.; Goodman, J.M.; Schultz, V.; Flanagan, J.N.; Getty-Kaushik, L.; Deeney, J.T.; Yaney, G.C.; Dunaway, G.A.; Berggren, P.-O.; et al. Tissue-Dependent Loss of Phosphofructokinase-M in Mice with Interrupted Activity of the Distal Promoter: Impairment in Insulin Secretion. American Journal of Physiology-Endocrinology and Metabolism 2007, 293, E794–E801. [Google Scholar] [CrossRef]
- Marinelli, I.; Vo, T.; Gerardo-Giorda, L.; Bertram, R. Transitions between Bursting Modes in the Integrated Oscillator Model for Pancreatic β-Cells. J Theor Biol 2018, 454, 310–319. [Google Scholar] [CrossRef]
- Marinelli, I.; Fletcher, P.A.; Sherman, A.S.; Satin, L.S.; Bertram, R. Symbiosis of Electrical and Metabolic Oscillations in Pancreatic β-Cells. Front Physiol 2021, 12. [Google Scholar] [CrossRef]
- Richard, P.; Bakker, B.M.; Teusink, B.; Van Dam, K.; Westerhoff, H. V. Acetaldehyde Mediates the Synchronization of Sustained Glycolytic Oscillations in Populations of Yeast Cells. Eur J Biochem 1996, 235, 238–241. [Google Scholar] [CrossRef]
- Richard, P. The Rhythm of Yeast. FEMS Microbiol Rev 2003, 27, 547–557. [Google Scholar] [CrossRef] [PubMed]
- Schuit, F.; De Vos, A.; Farfari, S.; Moens, K.; Pipeleers, D.; Brun, T.; Prentki, M. Metabolic Fate of Glucose in Purified Islet Cells. Journal of Biological Chemistry 1997, 272, 18572–18579. [Google Scholar] [CrossRef]
- Marhl, M. What Do Stimulated Beta Cells Have in Common with Cancer Cells? BioSystems 2024, 242, 105257. [Google Scholar] [CrossRef]
- El Azzouny, M.; Longacre, M.J.; Ansari, I.H.; Kennedy, R.T.; Burant, C.F.; MacDonald, M.J. Knockdown of ATP Citrate Lyase in Pancreatic Beta Cells Does Not Inhibit Insulin Secretion or Glucose Flux and Implicates the Acetoacetate Pathway in Insulin Secretion. Mol Metab 2016, 5, 980–987. [Google Scholar] [CrossRef]
- Stremmel, N.; Lemke, O.; Textoris-Taube, K.; Ludwig, D.; Mülleder, M.; Muenzner, J.; Ralser, M. An INS-1 832/13 𝛽-Cell Proteome Highlights the Rapid Regulation of Fatty Acid Biosynthesis in Glucose-Stimulated Insulin Secretion. Proteomics 2025, 25, 13–26. [Google Scholar] [CrossRef]
- Barsby, T.; Vähäkangas, E.; Ustinov, J.; Montaser, H.; Ibrahim, H.; Lithovius, V.; Kuuluvainen, E.; Chandra, V.; Saarimäki-Vire, J.; Katajisto, P.; et al. Aberrant Metabolite Trafficking and Fuel Sensitivity in Human Pluripotent Stem Cell-Derived Islets. Cell Rep 2023, 42, 112970. [Google Scholar] [CrossRef] [PubMed]
- MacDonald, M.J.; Fahien, L.A.; Buss, J.D.; Hasan, N.M.; Fallon, M.J.; Kendrick, M.A. Citrate Oscillates in Liver and Pancreatic Beta Cell Mitochondria and in INS-1 Insulinoma Cells. Journal of Biological Chemistry 2003, 278, 51894–51900. [Google Scholar] [CrossRef] [PubMed]
Figure 1.
Schematic representation of the glucose-stimulated beta cell as a four-pool model: - Downstream glycolytic pool, - Right half of the TCA cycle, - Left half of the TCA cycle, - GABA pool. Abbreviations used in the figure: AGC – aspartate–glutamate carrier, αKG – α-ketoglutarate, αKGDH – α-ketoglutarate dehydrogenase complex, ATP – adenosine-triphosphate, Asp – aspartate, CIC – citrate carrier, Cit – citrate, FBP – fructose-1,6-bisphosphate, Fum – fumarate, GABA – γ-aminobutyric acid, GABA-TK – GABA transaminase, GAD – glutamate decarboxylase, GDH – glutamate dehydrogenase, Glu – glutamate, Gln – glutamine, GOT1 – glutamic-oxaloacetic transaminase 1, GOT2 – glutamate–oxaloacetate transaminase 2, GLS – glutaminase, GTP – guanosine-triphosphate, Isocit – isocitrate, Mal – malate, ME1 – malic enzyme, MDH – malate dehydrogenase, OAA – oxaloacetate, OGC – oxoglutarate carrier, PC – pyruvate carboxylase, PCK2 – phosphoenolpyruvate carboxykinase (mitochondrial isoform), PDH – pyruvate dehydrogenase, PEP – phosphoenolpyruvate, PFK – phosphofructokinase, PK – pyruvate kinase, Pyr – pyruvate, SCS – succinyl-CoA synthetase, SDH – succinate dehydrogenase, SSA – succinic semialdehyde, SSADH – succinic semialdehyde dehydrogenase, Succ – succinate, SuCoA – succinyl-CoA, UCP2 – uncoupling protein 2.
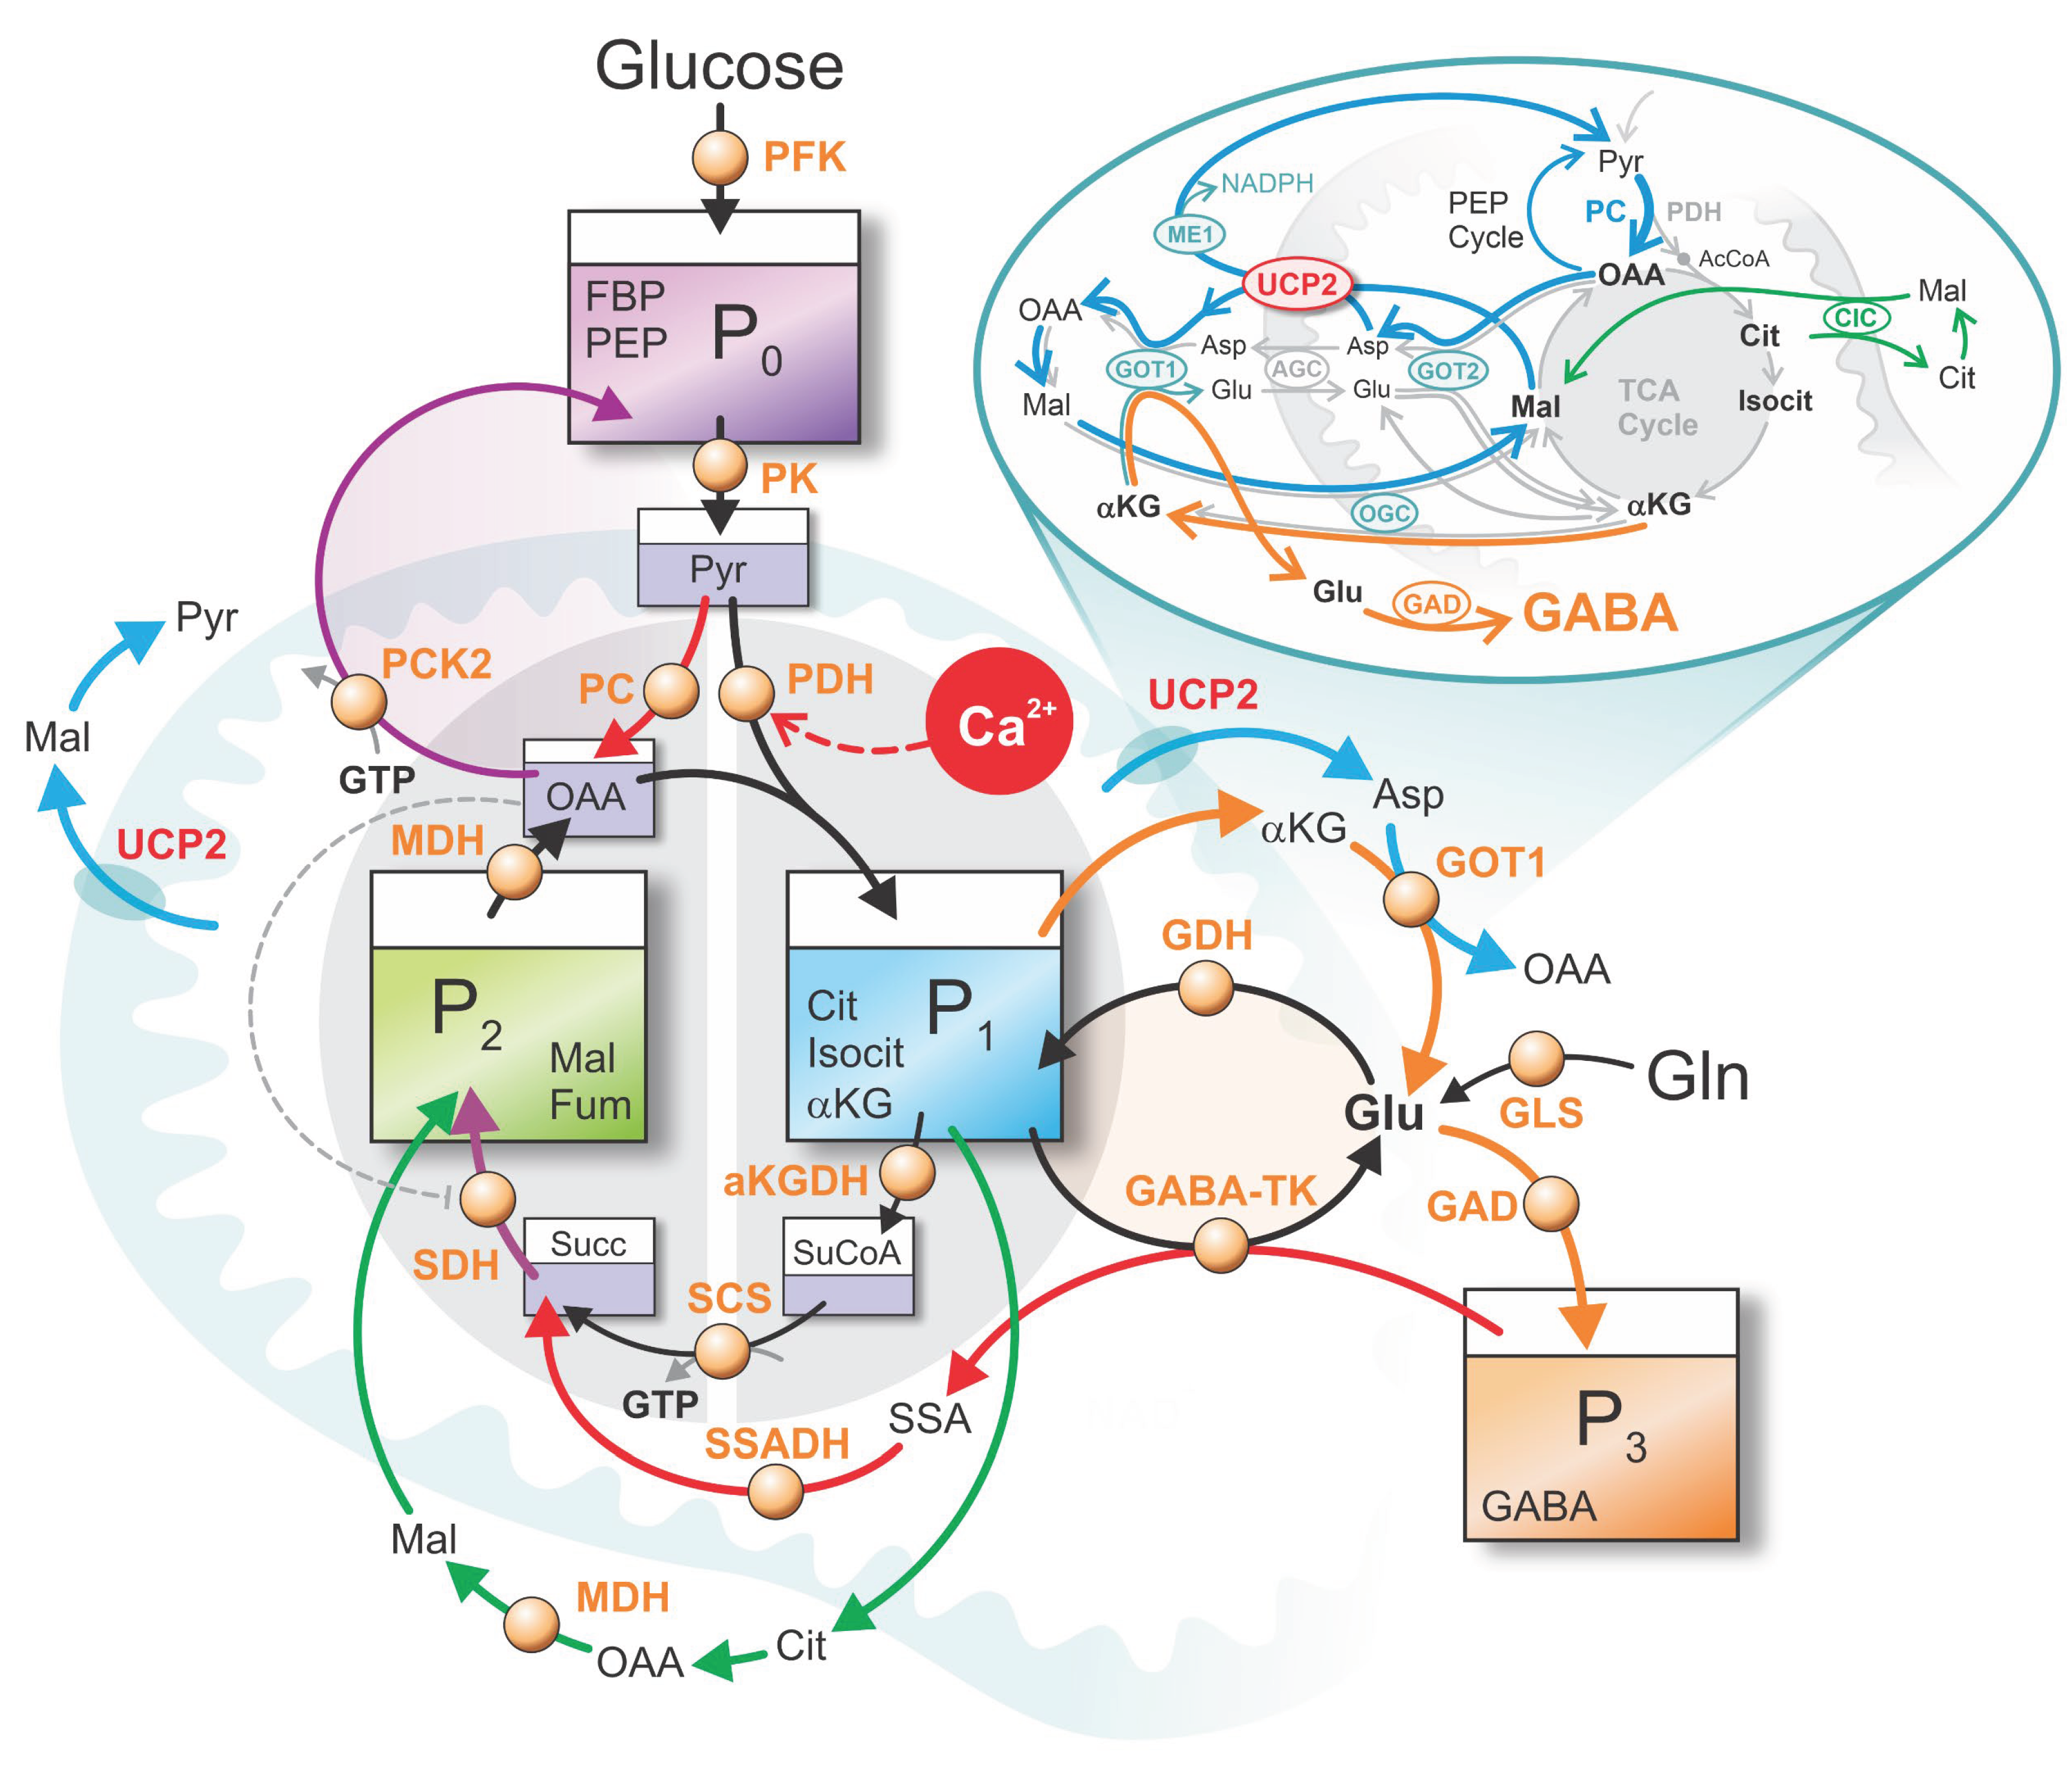
Figure 2.
Fitting of mathematical functions to experimental data. Gray lines represent experimental data from Gregg et al. (2019) [17]; the red curve shows the fitted mathematical function for Ca²⁺ dynamics (Eq. 1), and the black curve shows the fitted function for ATP concentration (Eq. 2).
Figure 2.
Fitting of mathematical functions to experimental data. Gray lines represent experimental data from Gregg et al. (2019) [17]; the red curve shows the fitted mathematical function for Ca²⁺ dynamics (Eq. 1), and the black curve shows the fitted function for ATP concentration (Eq. 2).
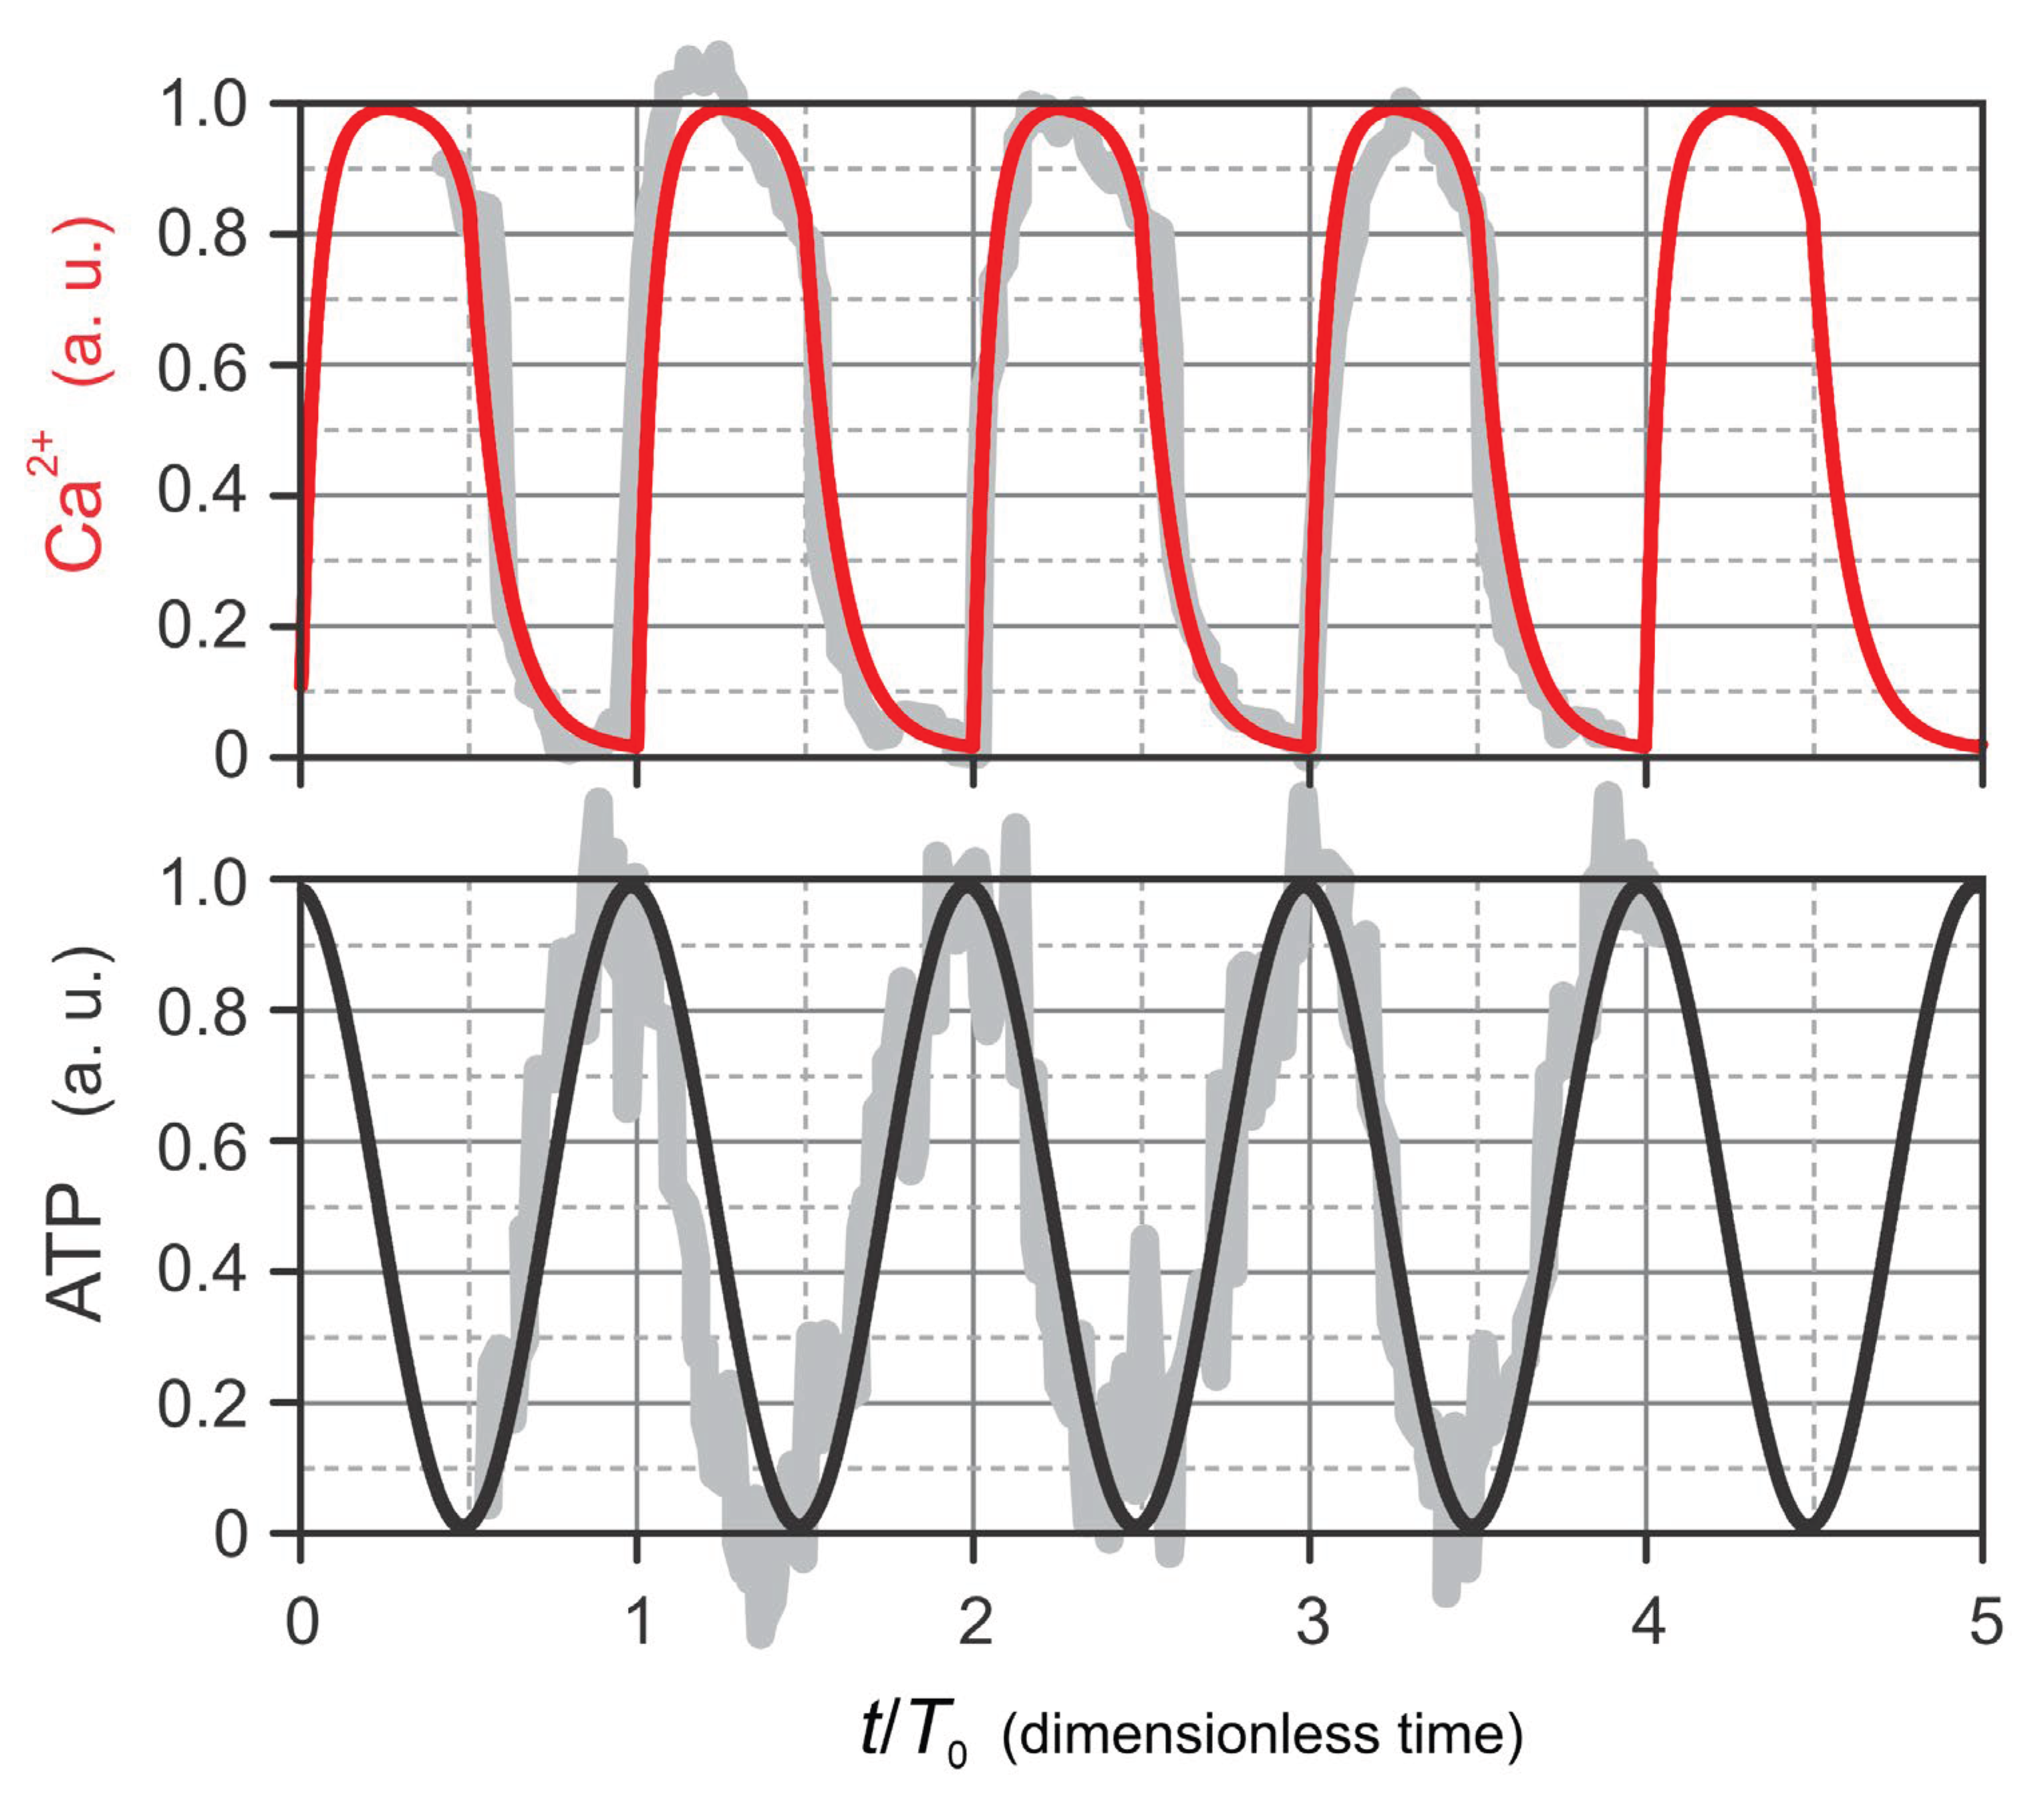
Figure 3.
FBP dynamics is synchronized with ATP oscillations. (A) Phase annotation of experimental data from Tornheim (1997) [19], highlighting the synchronous oscillatory behavior of ATP and FBP. White-shaded regions indicate phases during which both ATP and FBP concentrations increase, while gray-shaded regions denote phases of concurrent decline. In contrast, F6P dynamics is in anti-phase with FBP. (B) Fit of the model-based FBP dynamics (Eq. 5) to experimental data extracted from Merrins et al. (2016) [3], demonstrating that FBP oscillations exhibit a smooth, sinusoidal-like profile closely aligned with ATP dynamics.
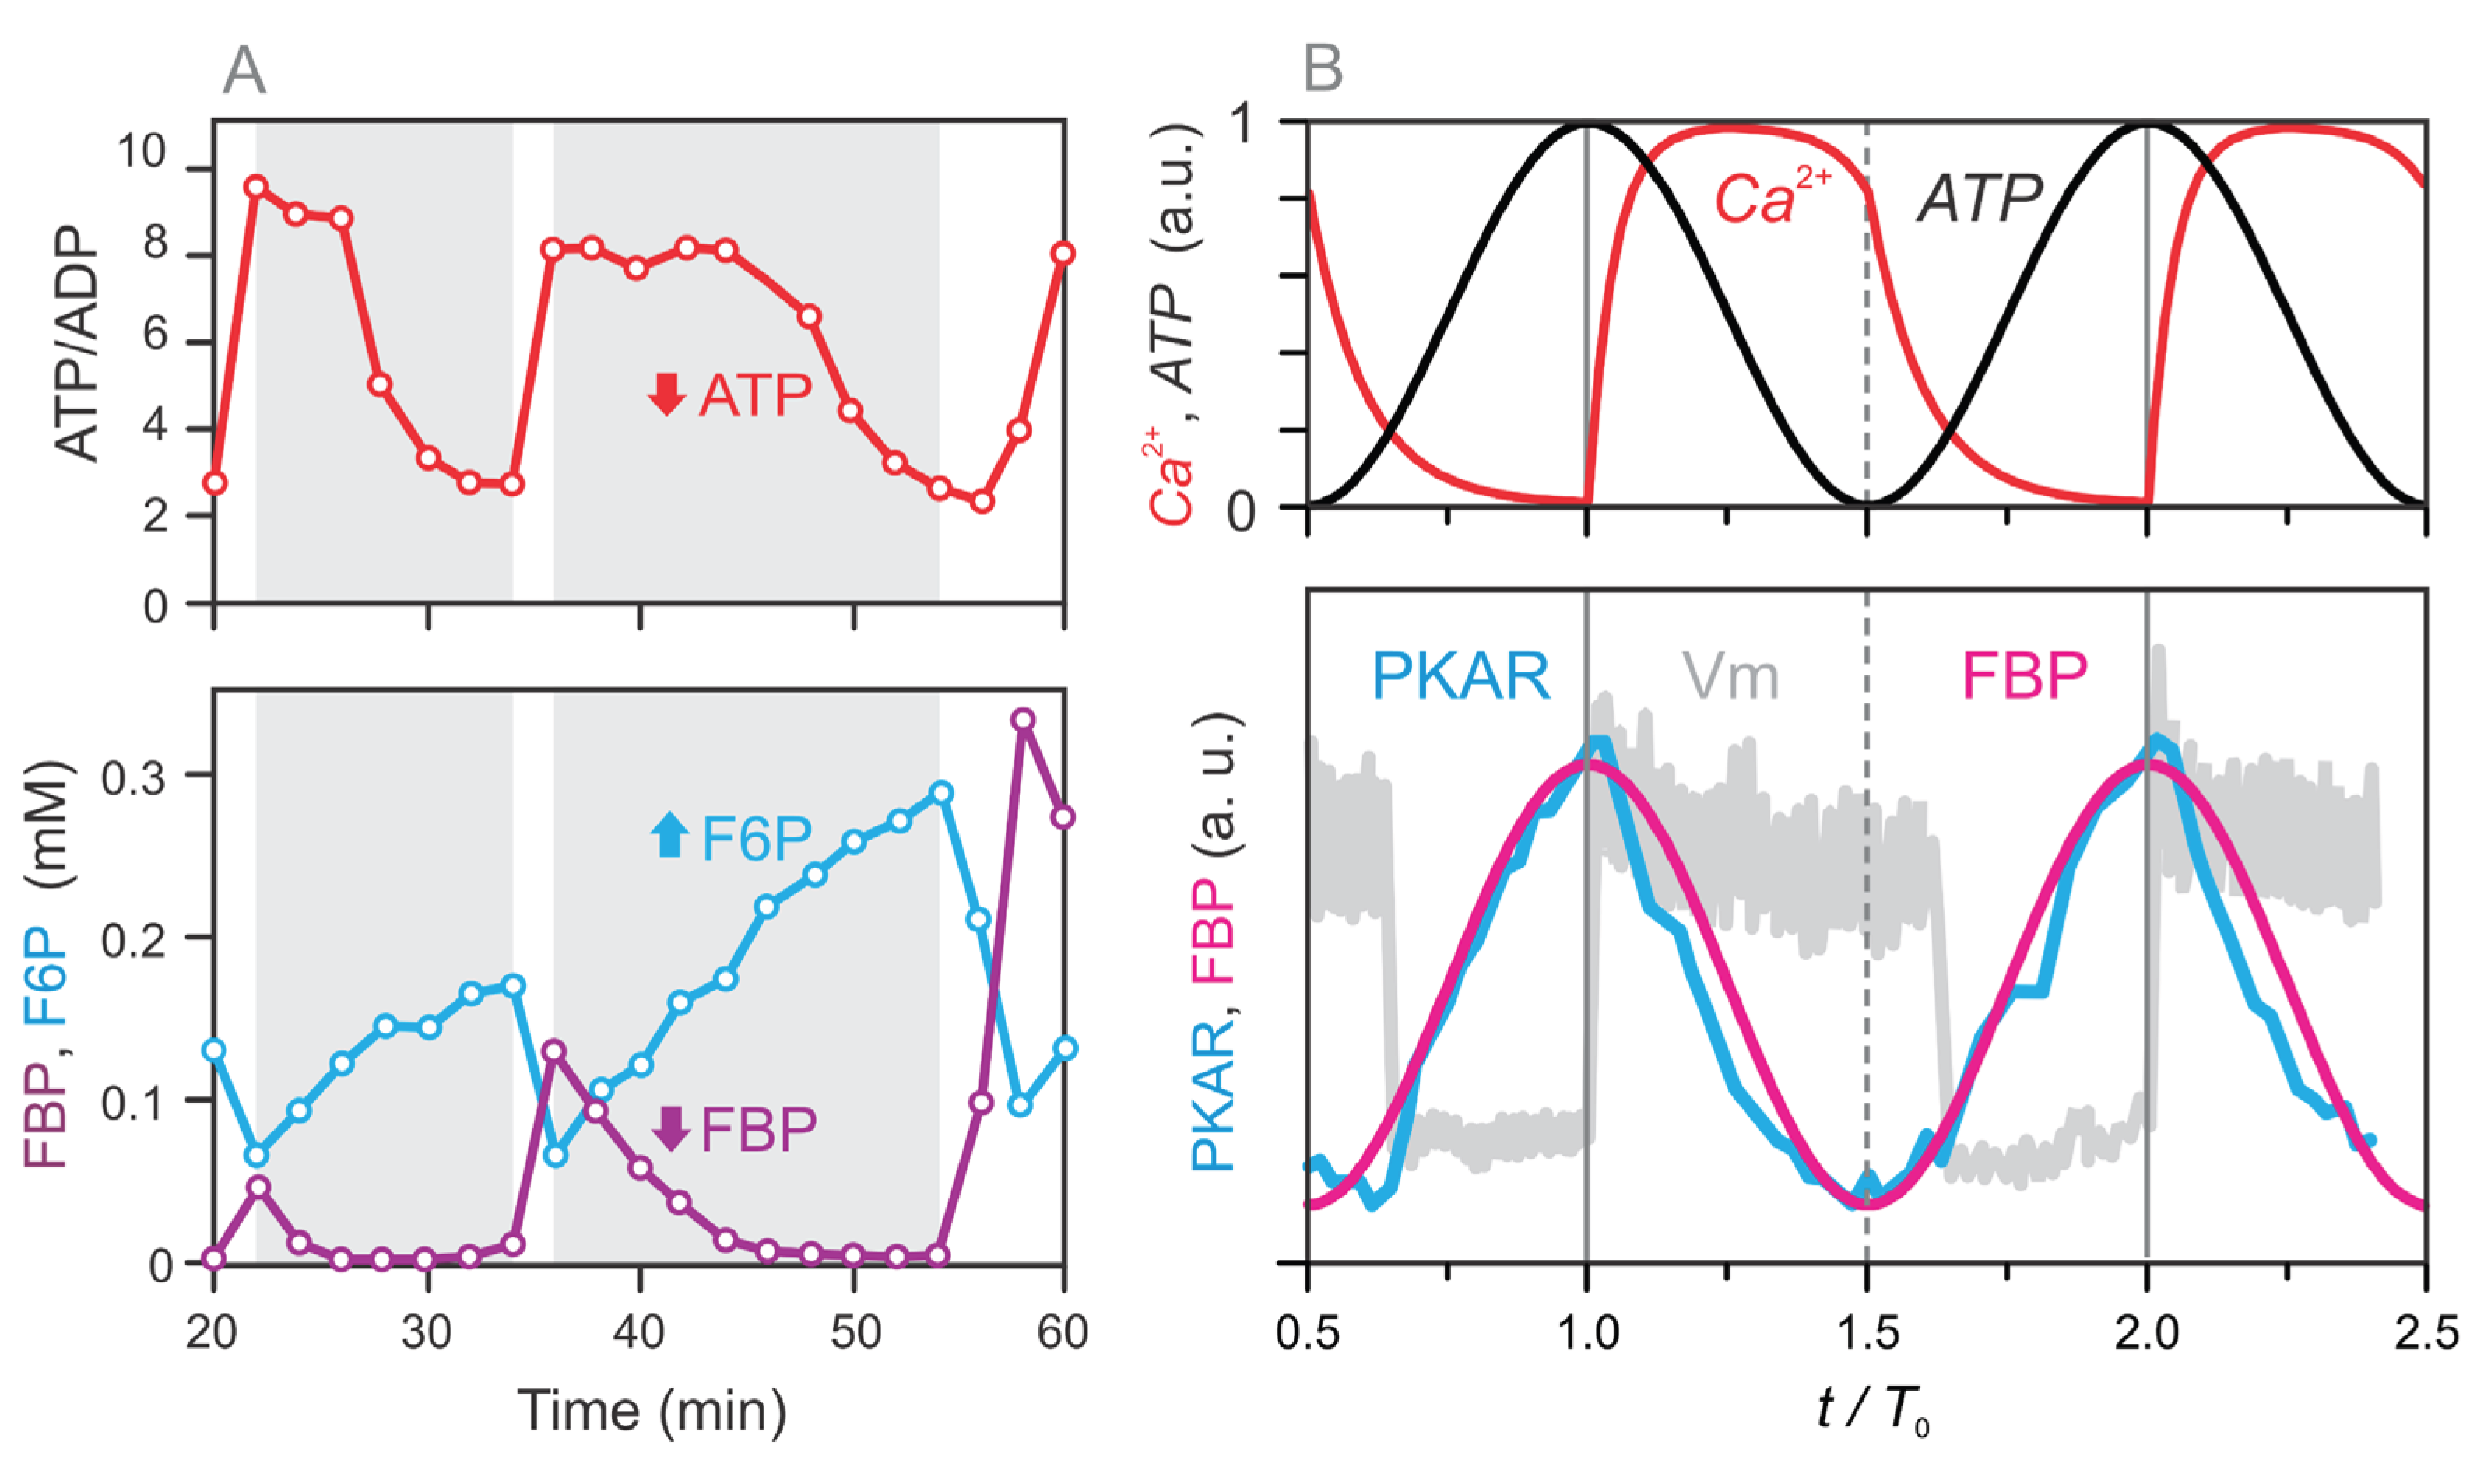
Figure 4.
Simulated dynamics of metabolic pools (–) and the corresponding fluxes between them. Panels (A–C) show results from the full four-pool model with oscillatory glycolysis, while panels (D–F) show results for the same model with a fixed glycolytic pool (P₀ = 0.2). (A, D) Time courses of intracellular Ca²⁺ (red) and ATP (black), which serve as inputs to the model and are fitted to experimental data (see Figure 2 and Eqs. 1–2). (B, E) Temporal dynamics of the four metabolic pools: the glycolytic pool (), right-hand TCA cycle intermediates (), left-hand TCA cycle intermediates (), and the GABA pool (). (C, F) Key fluxes between pools: (oxidative carbon transfer from to ), (cataplerotic redistribution from to ), (cataplerotic outflow from to ), and J₃₂ (anaplerotic GABA shunt flux from to ). The red-shaded regions indicate the mitochondrial oxidative (MitoOx) phase, and the blue-shaded regions mark the mitochondrial cataplerotic (MitoCat) phase. Initial values for (A–C) are: , , . In (D–F), the same values are used except for , which is fixed at .
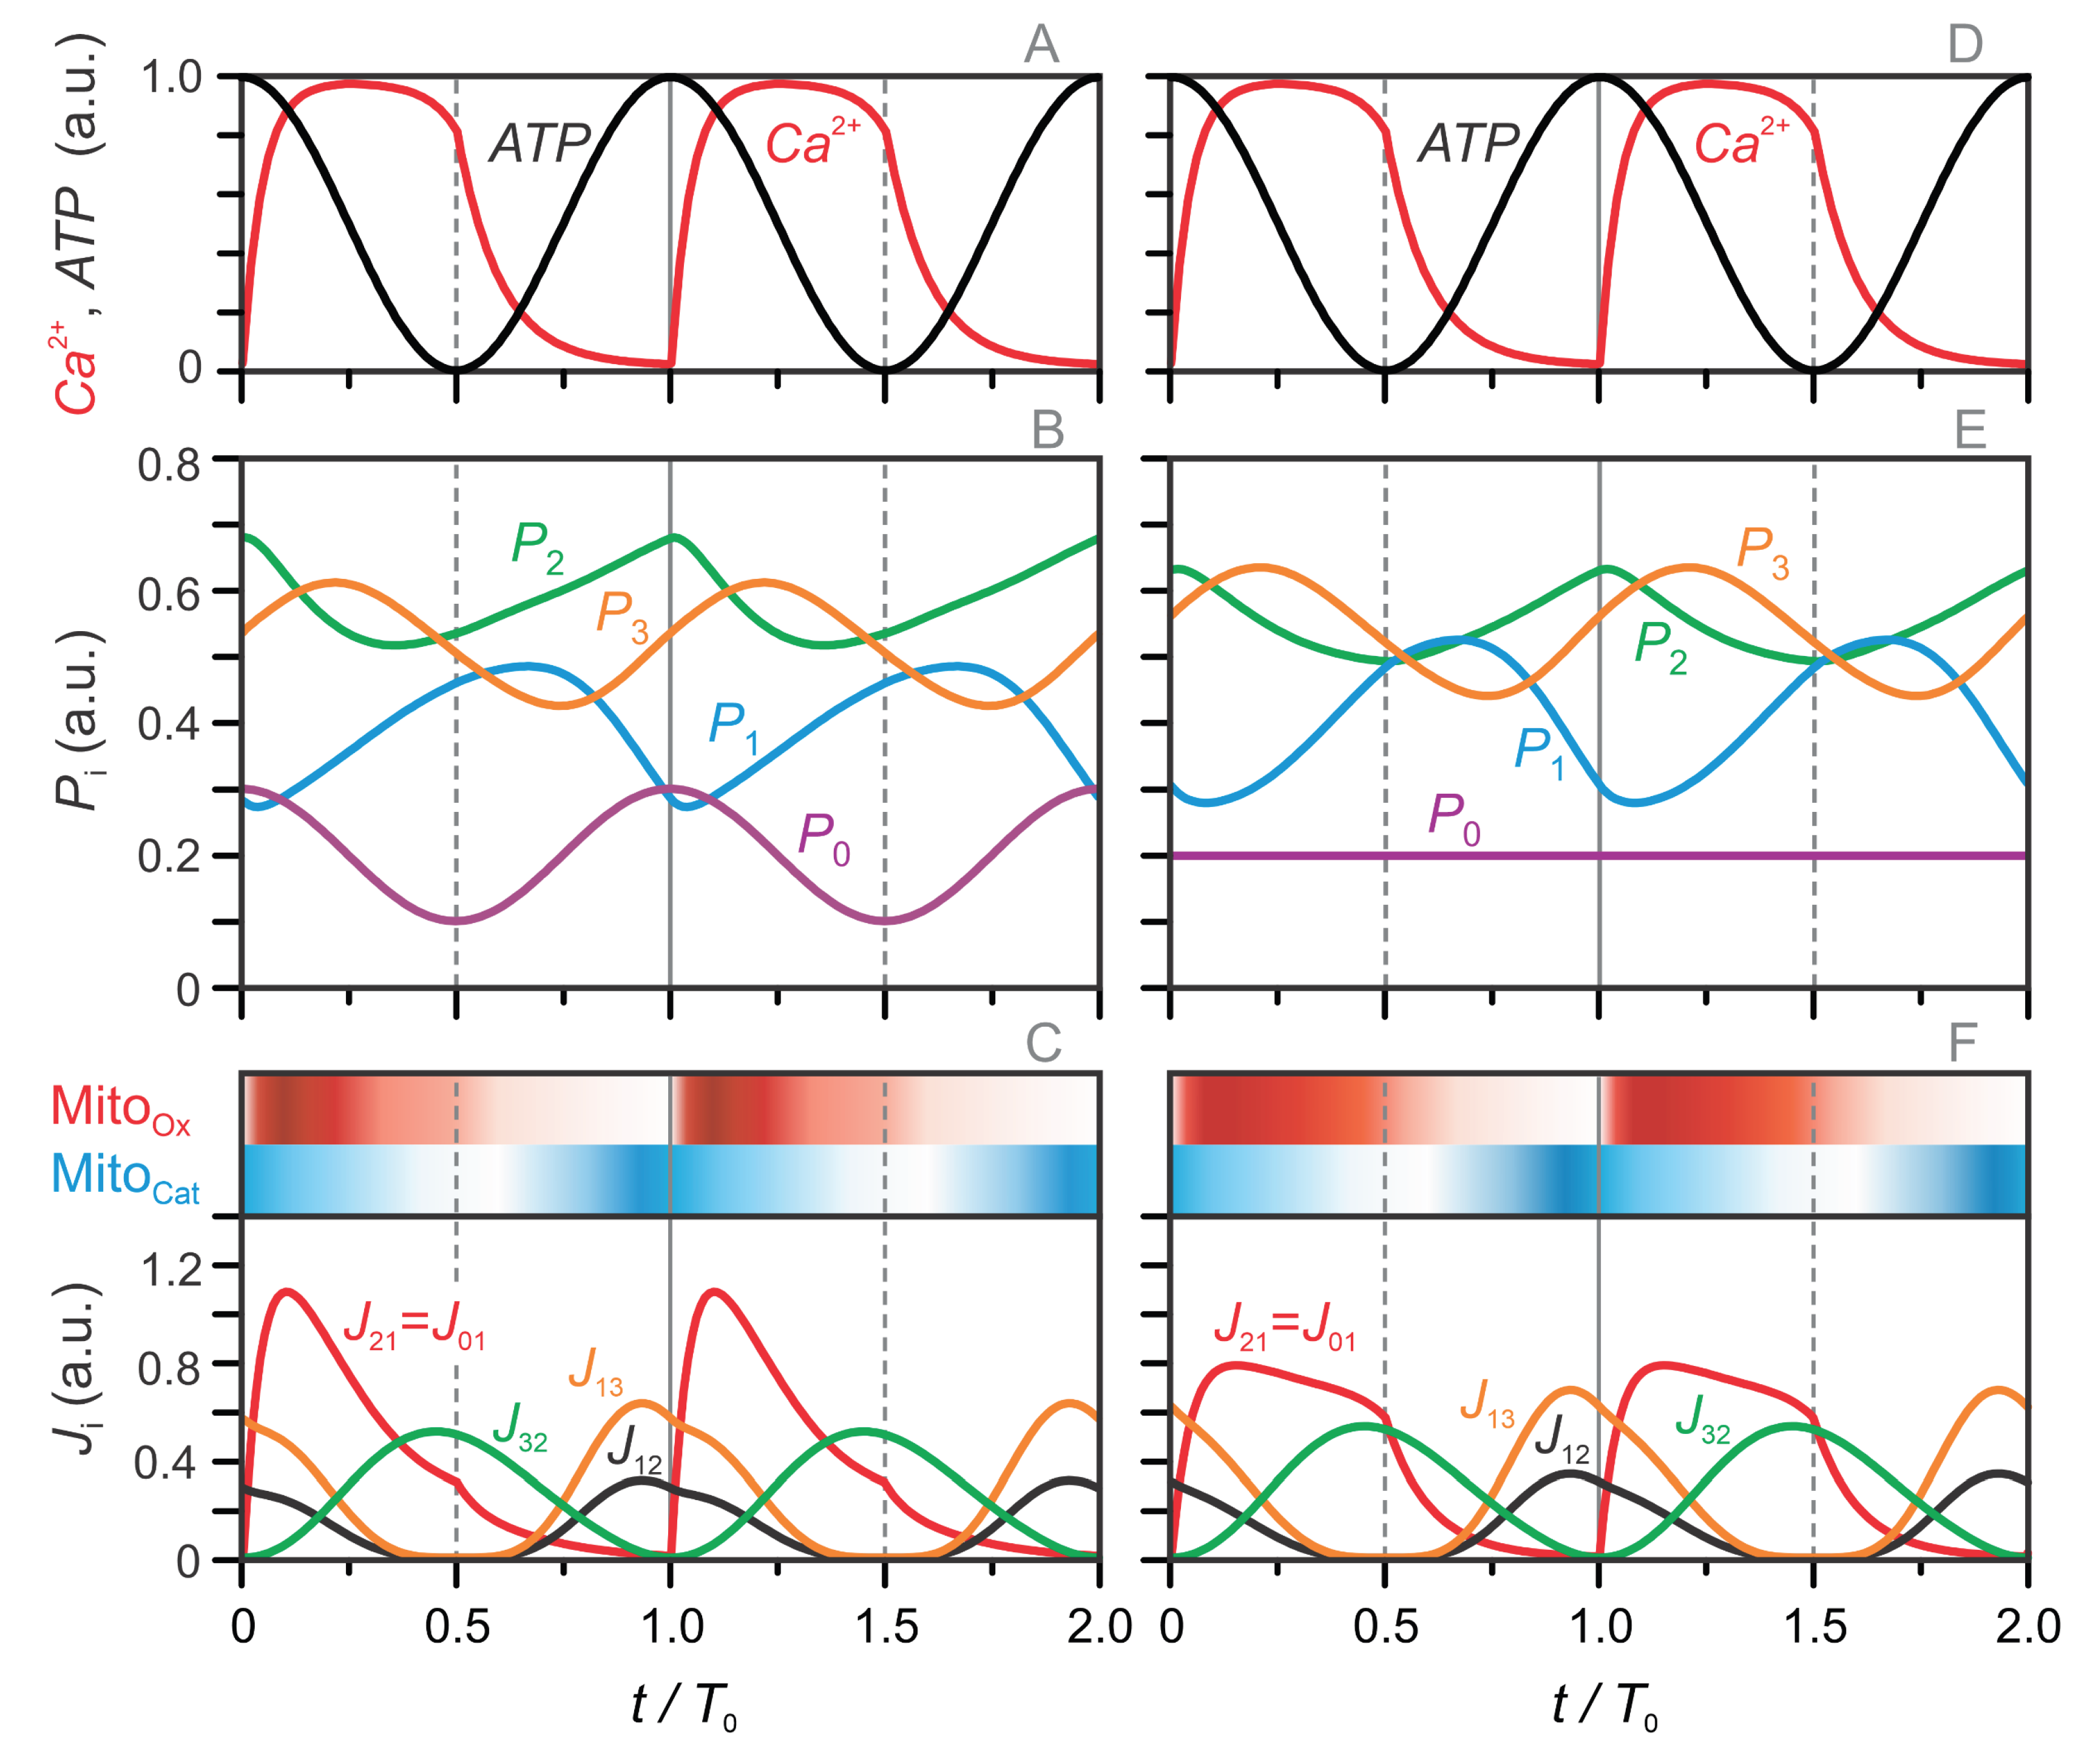
Figure 5.
Stock–flow diagrams illustrating the stepwise progression of the model’s metabolic oscillation cycle. Six characteristic stages are shown. Steps 2 and 3 represent the mitochondrial oxidative (MitoOx) phase (red shaded), characterized by oxidative carbon flux and active NADH production. Steps 5 and 6 correspond to the mitochondrial cataplerotic (MitoCat) phase (blue shaded). Steps 1 and 4 are transitional: Step 1 depicts Ca²⁺-induced activation of PDH and entry into the MitoOx phase, while Step 4 reflects the turning phase from MitoOx to MitoCat, characterized by the main switch PDH-off/PC-on. Arrow widths qualitatively indicate flux magnitude, and shading levels within each pool reflects simulated metabolite concentrations (corresponding to the values in Figure 4A). Note that is not part of the TCA cycle (see Eq. (9)); the TCA cycle itself is shown as gray-shaded circle. Metabolite levels in pools , , , and are shown relative to their respective minimum and maximum values, so that all pools can be compared on the same scale of filling and emptying, while their absolute oscillation spans differ: the largest amplitude occurs in (), followed by (), (), and ().
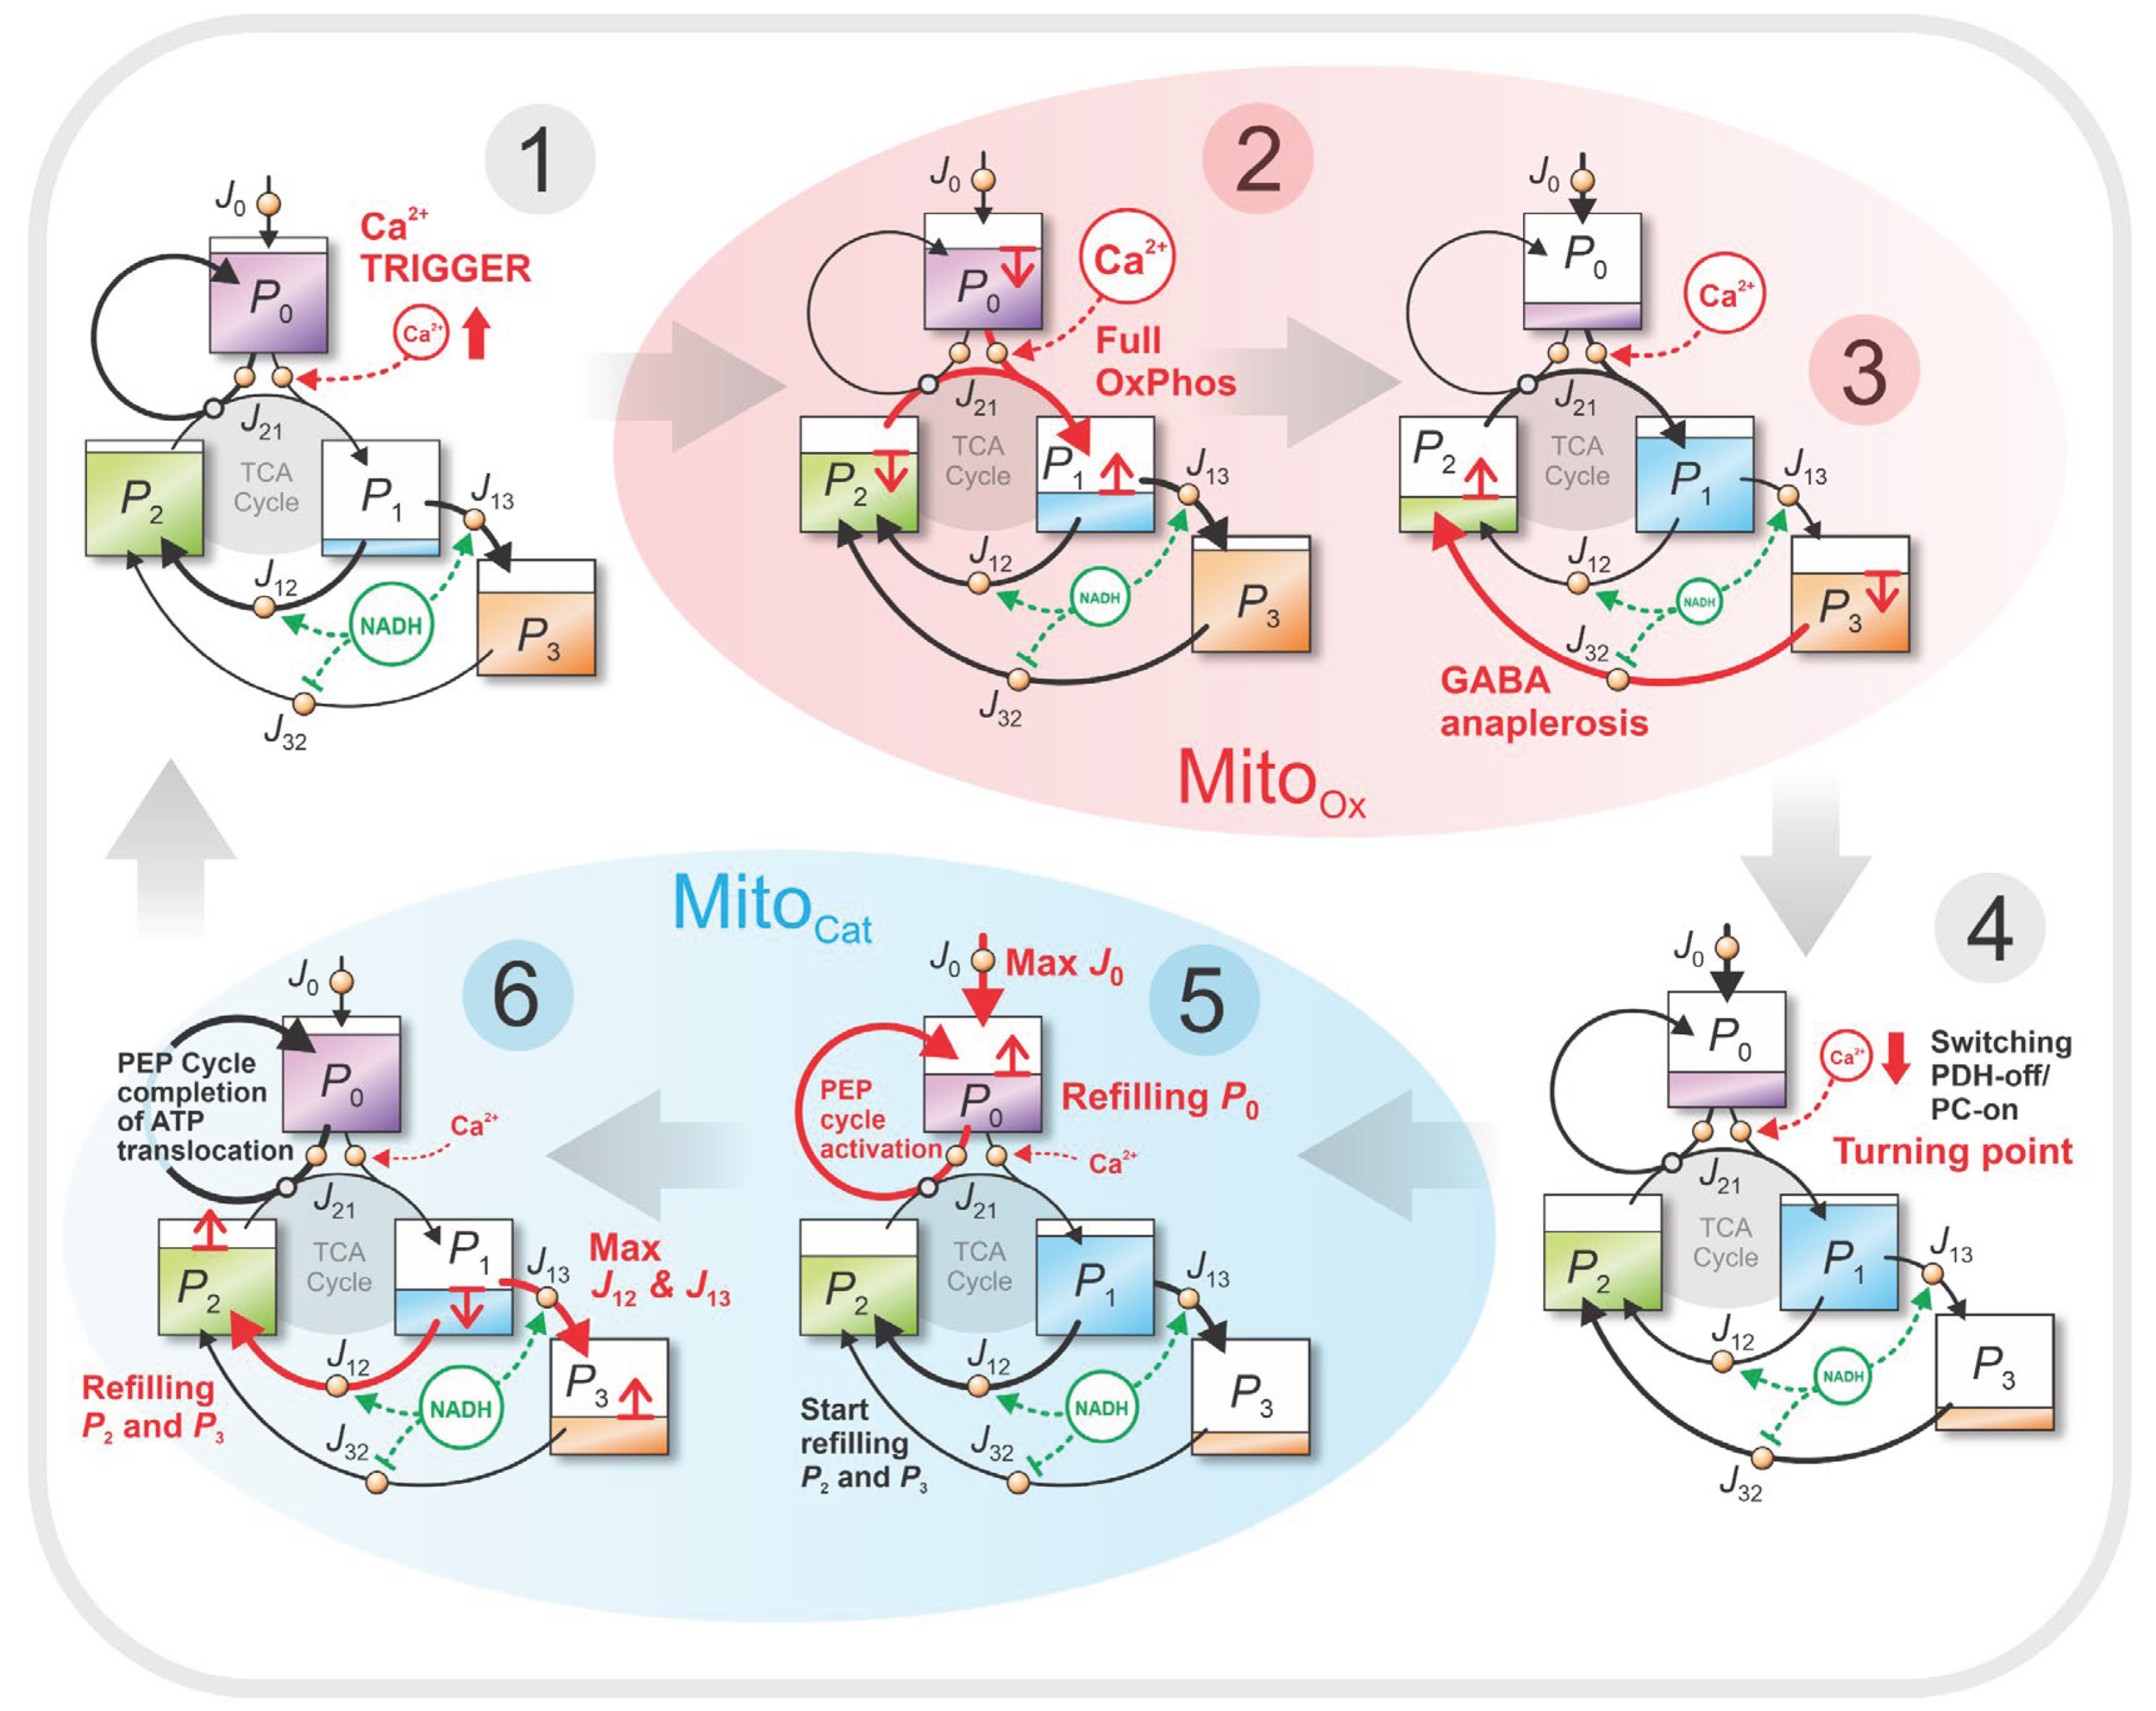
Figure 6.
Snapshot from the animated visualization of the four-pool model dynamics. The four metabolic pools (–) are connected by pipelines representing the fluxes between them as flowing liquid. The animation, created in Blender, is based on the numerically integrated model in its most detailed form: dynamics is governed by differential equation (A1), and regulation is implemented as described in Appendix A2. It depicts the cyclic emptying and refilling of pools during glucose-stimulated oscillations in beta cells and highlights the transitions between the MitoOx and MitoCat phases. The full animation is available at: https://doi.org/10.5281/zenodo.16951481.
Disclaimer/Publisher’s Note: The statements, opinions and data contained in all publications are solely those of the individual author(s) and contributor(s) and not of MDPI and/or the editor(s). MDPI and/or the editor(s) disclaim responsibility for any injury to people or property resulting from any ideas, methods, instructions or products referred to in the content. |
© 2025 by the authors. Licensee MDPI, Basel, Switzerland. This article is an open access article distributed under the terms and conditions of the Creative Commons Attribution (CC BY) license (http://creativecommons.org/licenses/by/4.0/).
Copyright: This open access article is published under a Creative Commons CC BY 4.0 license, which permit the free download, distribution, and reuse, provided that the author and preprint are cited in any reuse.


