Submitted:
19 November 2025
Posted:
20 November 2025
You are already at the latest version
Abstract
The quality of cow's milk is a critical parameter for human nutrition, making essential the development of rapid, sensitive, and cost-effective methods for monitoring them. Volatile Organic Compounds (VOCs) are odorant molecules that represent key indicators of milk quality since they reflect important factors such as, to name a few of them, animal metabolism, animal diet, and farming practices.
In this work we present the biophysical characterization of the porcine odorant-binding protein (pOBP) and the bovine odorant-binding protein (bOBP) as studied by fluorescence spectroscopy and the design of an innovative fluorescence biosensor based on the use of these two proteins to detect the presence odorant molecules in: a) milk produced by in-tensive livestock farming and b) milk produced by extensive livestock farming. The biosensor employs an “impinger” system to capture the odorant molecules from milk, which are then transferred to a liquid phase for quantitative and qualitative analyses. The binding of the odorant molecules to the OBPs triggers a Förster Resonance Energy Transfer (FRET) signal, allowing for a real-time VOC quantification.
The performance of the assays was evaluated by Head Space Solid-Phase Microextraction coupled with Gas Chromatography-Mass Spectrometry (HS-SPME/GC-MS) experiments. The obtained results are presented and discussed.
Keywords:
odorant-binding protein
; fluorescence spectroscopy
; gas chromatography-mass spectrometry
; biosensors
; protein fluorescence
; milk quality
1. Introduction
Food traceability is a fundamental aspect of food safety and quality assurance, enabling the monitoring of production chains and ensuring transparency regarding food origin and processing methods. Technologies such as blockchain and artificial intelligence are increasingly used to enhance traceability efficiency, allowing consumers to make informed choices about food products [1]. Milk, rich in proteins, fats, vitamins, and minerals, represents a key nutritional product [2] whose quality and composition are strongly influenced by factors such as diet, farming practices, and environmental conditions [3]. Understanding how these factors may influence the quality and the composition of milk is essential not only for the consumer’s safety but also for the optimization of milk production to meet market demands.
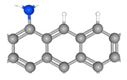
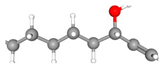
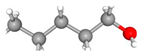
Volatile organic compounds (VOCs) have emerged as crucial biomarkers for milk quality and traceability. These small volatile molecules originate from animal metabolism, feed composition, microbial activity, and environmental conditions [4]. They significantly impact on the aroma, flavor, and freshness of milk, being valuable indicators for differentiating production systems. Several studies have shown that specific VOCs, such as 1-pentanol, 1-octen-3-ol, and 2-butanone, vary between milk obtained from intensive and extensive farming practices, allowing for the identification of production origins and quality standards [5,6], As a result, VOCs profiling has gained attention as a non-invasive and reliable method for milk authentication [7].
Several analytical techniques can be employed for VOCs detection. Among them, HS-SPME/GC-MS (Headspace Solid-Phase Microextraction coupled with Gas Chromatography-Mass Spectrometry) is the most used method for VOCs sampling and analysis, due to its high sensitivity and ability to characterize complex VOCs mixtures [6]. However, the use of this technique requires expensive instrumentation and trained personnel. The need for a rapid, cost-effective, and portable alternative method to analyze VOCs has led to the design of biosensors, which utilize biological recognition elements to detect the presence of specific analytes with high accuracy [8,9].
Specifically, fluorescence-based biosensors have gained significant interest due to their high sensitivity, rapid response time, and potential for real-time monitoring. One of the most effective fluorescence-based techniques is Förster Resonance Energy Transfer (FRET) which relies on energy transfer between a fluorescent donor and an acceptor, providing an efficient method for the observation of molecular interactions, including VOCs binding [10].
In this study, odorant-binding proteins (OBPs) were used as molecular recognition elements (MREs) in the biosensor design. OBPs are members of the lipocalin family. They are naturally occurring proteins involved in olfactory perception and capable of binding with small volatile molecules. OBPs have been explored in biosensor applications due to their stability and strong affinity for a wide range of VOCs. In this study, two OBPs were selected: porcine OBP (pOBP) and a bovine OBP (bOBP). These two proteins were selected based on their structural properties and binding affinities for the target VOCs associated with milk quality.
The developed biosensor integrates the two OBPs to detect and quantify VOCs in milk, and to provide a novel approach for real-time milk quality monitoring. For the first time, the biosensor’s performance was evaluated using HS-SPME/GC-MS, to ensure accuracy and specificity. This research paved the way for future advancements in biosensor technology, offering a cost-effective, portable, and highly efficient tool for monitoring milk traceability and authenticity in the dairy industry.
2. Results and Discussion
2.1. Docking Results
As reported in literature, 1-pentanol, 2-butanone and 1-octen-3-ol, can be considered reliable markers extensive farming, intensive farming and fresh, unpasteurized milk, respectively [5,11,12]. These VOCs provided a basis for biosensor development in milk traceability and quality assessment. This study examined two different OBPs: pOBP, a typical monomeric lipocalin, and bOBP, a de-swapped monomeric derived from bovine. To assess their potential use as MREs, molecular docking studies were firstly conducted to analyze the binding interactions and their affinity for selected VOCs.
2.1.1. Direct Docking Analysis
Molecular docking simulation experiments were performed using AutoDock 4.2, to predict the binding affinity of ligands to OBPs. Protein structures were selected based on the high-resolution crystallographic data (bOBP: PDB ID 2HLV, 1.71 Å; pOBP: PDB ID 1DZK, 1.48 Å). A re-docking phase was carried out to optimize simulation parameters, generating 100 conformations of each ligand-protein complex.
Binding affinity was evaluated based on:
- Predicted binding free energy (ΔG)
- Cluster population
- Ligand positioning within the binding site
The lowest-energy conformation from the most populated cluster was selected, and interactions were analyzed, revealing predominantly hydrophobic and Van der Waals bonds (Figure 1).
Initial docking simulations were conducted with 1-AMA, a commonly fluorophore used in OBP functional assays, to validate ligand binding consistency across OBP variants. Subsequent docking with selected VOCs (1-pentanol, 1-octen-3-ol, 2-butanone) demonstrated minimal differences in binding energy between pOBP and bOBP, suggesting similar VOC-binding capabilities. Predicted binding energies and estimated saturation concentrations are summarized in Table 1.
2.2. Fluorescence Characterization of OBPs
Fluorescence spectroscopy is a widely employed technique to investigate protein conformational changes and ligand-binding interactions. In proteins, the intrinsic fluorescence of tryptophan residues is highly sensitive to changes in the local environment, making it a valuable tool for studying protein folding, stability, and ligand binding. Upon excitation at 295 nm, the indole ring of tryptophan emits fluorescence with a peak near 340 nm. Any perturbations in the microenvironment surrounding tryptophan residue can alter fluorescence intensity and emission wavelength, providing insights into structural dynamics. A red-shift in fluorescence emission often indicates protein unfolding and subsequent functional loss.
Förster Resonance Energy Transfer (FRET) was exploited to evaluate protein-ligand interactions. The fluorescent ligand 1-AMA was used as an extrinsic reporter, due to its well-characterized ability to bind OBPs with high affinity.
The ability of pOBP and bOBP to bind 1-AMA was assessed through fluorescence titration experiments. Initially, 1-AMA alone exhibited weak fluorescence with an emission maximum at 537 nm upon excitation at 295 nm. However, upon binding to OBPs, two major spectral changes were observed:
- A blue-shift of the emission maximum to 481 nm, along with a significant increase in fluorescence intensity.
- A decrease in tryptophan fluorescence emission at 340 nm, indicating an energy transfer process.
These spectral changes show the presence of energy transfer from the single tryptophan residue (located at position 16 in pOBP and at an equivalent position in bOBP) to the 1-AMA molecules that are intercalated within the protein hydrophobic binding pocket.
The binding affinity values for 1-AMA of both pOBP and bOBP were calculated by plotting the fluorescence intensity values as a function of the ligand concentration values, as reported in Figure 2 and Figure 3. pOBP exhibits a higher binding affinity value for 1-AMA compared to bOBP. These results indicate that structural differences between pOBP and bOBP are responsible of different binding properties, and, consequently, it is possible to use them for comparative sensing applications.
A competitive FRET assay was performed to study the interaction between protein and the selected VOCs. In the assay, a solution with OBPs pre-saturated with 1-AMA, was placed in contact with increased concentration of each volatile compound. Fluorescence emissions at 481 nm (1-AMA bound state) and 340 nm (tryptophan emission) were recorded. A progressive decrease in 1-AMA fluorescence and a partial recovery of tryptophan emission were observed, confirming the displacement of 1-AMA by individual selected volatile. Variation in the FRET intensity signal, due to competitive binding, was observed to determine and quantify the presence of VOC compound. The Figure 4 shows the competition of 1-pentanol (Figure 4a), 1-octen-3-ol (Figure 4c), and 2-butanone (Figure 4e) with 1-AMA to the binding site of pOBP. The titration curves of 1-pentanol, 1-octen-3-ol, and 2-butanone are presented in Figure 4b, Figure 4d, and Figure 4f, respectively.
The Figure 5 shows the competition of 1-pentanol (Figure 5a,b), 1-octen-3-ol (Figure 5c,d), with 1-AMA to the binding site of bOBP. The titration curves of 1-pentanol, and 1-octen-3-ol are presented in Figure 5b and Figure 5d, respectively.
The constant dissociation values calculated through a nonlinear fitting function are shown in the Table 2. These results indicate that pOBP and bOBP have different ligand selectivity.
2.3. Thermal Stability of OBPs
Thermal stability studies were conducted to evaluate the temperature-induced denaturation of the pOBP and bOBP. The experiments aimed to determine the unfolding dynamics of these proteins and assess the influence of VOCs on their stability. The thermal stability of pOBP and bOBP was monitored by fluorescence spectroscopy, focusing on tryptophan residues as intrinsic probes of protein folding. The temperature-dependent fluorescence emission spectra were recorded in the range 320–410 nm, with excitation at 295 nm to selectively excite tryptophan residues.
The fluorescence intensity of pOBP progressively decreased as temperature increased from 25 °C to 95 °C, indicating the protein unfolding (Figure 6a). This decrease was accompanied by a red shift of the maximum emission wavelength from 340 nm to 360 nm, a hallmark of protein denaturation due to solvent exposure of tryptophan residues.
A similar trend was observed for bOBP, where the denaturation curve revealed a gradual decline of the fluorescence intensity emission, reflecting a loss of the integrity of the tertiary structure (Figure 7a).
Fitting curves of fluorescence emission intensity at 340 nm as a function of the thermal stability of pOBP and bOBP are reported in Figure 6b and Figure 7b, respectively.
2.3.1. Cooperativity and Boltzmann Fit Analysis
The sigmoidal shape of the fluorescence decay curves suggests a cooperative unfolding process. A Boltzmann fit was applied to describe the thermal denaturation behavior and determine the melting temperature (Tm), defined as the midpoint of the transition between the folded and unfolded states. The calculated Tm values were approximately 60 °C for pOBP (Figure 6b) and 50 °C for bOBP (Figure 7b), indicating that pOBP exhibits higher thermal stability.
Conversely, the thermal denaturation profile of bOBP revealed a more progressive unfolding process. Unlike proteins exhibiting highly cooperative transitions, which typically manifest as a distinct sigmoidal curve, bOBP displayed an exponential decline in fluorescence. This observation points towards a non-cooperative unfolding mechanism, involving the population of several intermediate states (Figure 7b). Such behavior suggests that the bOBP structure is composed of regions possessing differential stabilities, resulting in a stepwise and cumulative loss of its native conformation across the investigated temperature spectrum.
2.3.2. Effect of VOC Binding on Thermal Stability
To assess whether VOCs contribute to protein stabilization, thermal denaturation experiments were repeated in the presence of saturating concentrations of selected VOCs: 1-pentanol (50 mM), 1-octen-3-ol (5 mM), and 2-butanone (10 mM). The results demonstrated that VOC binding significantly stabilized pOBP, as evidenced by a shift in Tm towards higher temperatures (Figures S1–S3 in Supplementary materials). Among the tested VOCs, 1-octen-3-ol exhibited the strongest stabilizing effect, resulting in the highest Tm shift (Figure S2). This suggests that ligand binding restricts protein flexibility, reducing the likelihood of unfolding at elevated temperatures.
For bOBP, a similar protective effect was observed, although the stabilization was less pronounced compared to pOBP. The Tm values of bOBP increased in the presence of the selected VOCs, with the highest stability conferred by 1-pentanol (Figures S4–S6 in Supplementary materials). The stabilization mechanism probable involves an enhanced hydrophobic interaction which can promote the formation of a more compact conformation able to resist to the thermal denaturation.
2.3.3. Comparison of the Thermal Denaturation Curves Exhibited by pOBP and bOBP
The comparative analysis of the denaturation curves with and without the VOCs binding highlighted the role of the ligand-induced stabilization of OBPs (Figure 8a,b). In the absence of VOCs, both pOBP and bOBP exhibited clear denaturation transitions, with a more pronounced cooperative unfolding for pOBP. The binding of VOCs to the OBPs led to a notable increase in stability, which reduced the overall fluorescence quenching rate and delayed structural disruption at elevated temperatures.
The data on the thermal stability experiments show that pOBP becomes more stable in the presence of VOCs. In fact, when the VOCs bind to the pOBP, they interact with key amino acid residues, making the protein more rigid and reducing its flexibility, which helps prevent unfolding. Additionally, VOCs, may protect the protein’s hydrophobic core from solvent exposure during heating, preserving protein stability. As a result, the energy required to denature the protein increases, leading to a more gradual unfolding process. In the absence of VOCs, pOBP is more vulnerable to destabilization and unfolding at higher temperatures. As shown in Figure 8a, the largest stabilization occurs in the presence of 1-octen-3-ol, which has the highest affinity for the protein. This stronger interaction contributes significantly to the increased thermal stability observed during the denaturation experiments.
2.4. Fluorescence Quenching Experiments
To study the protein conformational changes and the accessibility of the aromatic residues, fluorescence quenching experiments were conducted. According to Lakowicz [13], acrylamide is the most suitable quencher for tryptophan fluorescence. The quenching effect of acrylamide on the intrinsic fluorescence of the protein was analyzed. The study aimed to characterize the accessibility of tryptophan residues, to differentiate between static and dynamic quenching mechanisms, and to assess the effects of the VOCs binding on protein stability [14]. Fluorescence quenching can occur through two primary mechanisms: dynamic (collisional) and static quenching. Dynamic quenching occurs when acrylamide molecules collide with the fluorophore in its excited state, facilitating a non-radiative energy transfer or electron exchange. In contrast, static quenching results from the formation of a non-fluorescent complex between the acrylamide and the protein fluorophore, before excitation [15].
To distinguish between these quenching mechanisms, a modified Stern-Volmer equation was applied:
where:
- F0 and F represent fluorescence intensities in the absence and in the presence of acrylamide, respectively,
- Ksv is the Stern-Volmer constant (indicative of dynamic quenching),
- [Q] is the acrylamide concentration,
- V is the static quenching constant.
2.4.1. Quenching Experiments of pOBP Fluorescence Emission
The pOBP fluorescence emission spectra were recorded in the presence of increasing concentrations of acrylamide (Figure 9a). The emission intensity decreased proportionally along with the acrylamide concentration increase, indicating an efficient quenching. The Stern-Volmer plot (Figure 9b) shows a non-linear trend at higher quencher concentrations, suggesting a mixed quenching mechanism.
The presence of VOCs influenced the fluorescence quenching. Figures S7–S9 in Supplementary materials illustrate the fluorescence emission spectra of pOBP in the presence of saturating concentrations of 1-pentanol, 1-octen-3-ol, 2-butanone, and 1-AMA, respectively, followed by acrylamide titration. The quenching curve transitioned from an exponential to a linear trend, indicating that VOCs binding stabilizes pOBP, reducing the accessibility of tryptophan residues to acrylamide.
2.4.2. Quenching Experiments of bOBP Fluorescence
The fluorescence emission spectrum of bOBP exhibited a broader distribution compared to the pOBP fluorescence emission spectrum, reflecting differences in their structures. Figure 10a, presents the fluorescence emission spectra of bOBP titrated with increasing concentrations of acrylamide. A progressive decline in intensity emission is observed.
The Stern-Volmer plot of bOBP quenching (Figure 10b) reveals an exponential trend, suggesting that the protein structure predominantly underwent dynamic quenching in the absence of VOCs.
2.4.3. Effect of VOCs on Quenching Experiments
The addition of the VOCs modulated the quenching efficiency of both pOBP and bOBP. Figures S10–S12 in Supplementary materials show the fluorescence spectra and the Stern-Volmer plots for bOBP in the presence of 1-pentanol, 1-octen-3-ol, and 2-butanone, respectively. The quenching curve of bOBP shifted towards a more linear response upon VOCs binding, suggesting a stabilization effect that limits fluorophore exposure. At 50 °C, additional quenching experiments were performed to determine possible protein conformational changes. Figures S13 and S14 in Supplementary materials illustrate the fluorescence spectra and the Stern-Volmer plots for bOBP at 50 °C. No significant deviations were observed compared to the experiments performed at 25 °C, suggesting that the protein retained its structural integrity within this temperature range.
2.4.4. Comparative Analysis of pOBP and bOBP
Comparing pOBP and bOBP, distinct quenching behaviors were evident:
- pOBP: Exhibited a predominantly static quenching profile, which stabilized by VOCs binding.
- bOBP: Displayed dynamic quenching, which indicated a higher structural flexibility and exposure of the tryptophan residues.
The linear quenching response of pOBP in the presence of VOCs suggested a tighter binding conformation, enhancing biosensor stability. Conversely, the dynamic quenching of bOBP may indicate multiple binding sites or a more flexible structure that could enable different interactions with VOCs.
2.4.5. VOC Profiling in Milk Samples
The VOC profile in milk serves as a crucial indicator of farming practices and animal diet. Scientific studies have highlighted distinct differences between milk sourced from intensive and extensive systems [16]. Milk from intensive and semi-intensive systems is characterized by a less diverse VOC profile, where specific ketones, such as acetone and 2-butanone, are predominant. This pattern is thought to reflect a metabolic link to a controlled diet based on total mixed rations (TMR) and silage6. The prevalence of these compounds suggests a standardized and less complex feed intake compared to pasturing animals [17].
In contrast, milk from extensive farming systems exhibits a significantly richer and more complex VOC profile [5]. This greater diversity is attributed to the ingestion of a wide variety of phytochemicals from fresh forage and pastures, which are subsequently metabolized by the animal and transferred to the milk [6]. Key VOCs associated with pasture-fed cows include alcohols, such as 1-pentanol, as well as aromatic hydrocarbons (e.g., toluene) and sulfur compounds (e.g., dimethyl sulfide). The higher number of metabolites belonging to different chemical classes in milk from extensive farming is a direct result of increased dietary diversity [18].
These findings indicate that VOC profiling can be a reliable tool for tracing milk origin and assessing the impact of farming practices and diet on milk quality, confirming that feeding and rearing conditions are determinant factors in the formation of milk’s distinct aroma and flavor.
2.4.6. Binding of VOCs to OBPs
To assess the ability of pOBP to bind VOCs, HS-SPME/GC-MS analyses were carried out on binding assays in the presence and absence of OBPs. Binding assays experiments were conducted in parallel on samples in absence (control) e in presence of BSA or pOBP revealing significant differences in VOCs peak intensities.
Specifically, the peak area of 2-butanone exhibited a nine-fold increase in presence of pOBP (blue profile) respect to the control (black profile) and the analysis in presence of BSA (red profile), confirming a strong affinity between the pOBP and this ketone (Figure 11).
The peak corresponding to 1-octen-3-ol, which has a retention time of approximately 12 minutes in Figure 12, showed a area seven times higher in presence of pOBP (blue profile), respect to the control (black line) and to the experiment conducted with BSA (red profile), indicating a discriminative interaction of this metabolite with the pOBP protein (Figure 12).
The peak area of 1-pentanol showed a 2.5-fold increase in presence of pOBP compared to BSA (red line) and the control (black line), suggesting a selective interaction of this compound with the pOBP protein (Figure 13).
Overall, the results obtained showed that the control samples (only PBS) demonstrated no interaction with VOCs, confirming that the detected increase of peak area was due to the binding of individual volatile with OBP. Moreover, a direct comparison between pOBP and BSA in the binding assays showed the superior selectivity of OBPs for the target VOCs. In fact, when analyzing the peak areas of VOCs in the presence of these proteins pOBP significantly enhanced the peak areas of each selected volatile (2-butanone, 1-octen-3-ol and 1-pentanol), while BSA showed a weaker interaction, as expected, indicating a less specific binding mechanism of this protein.
These results highlight the potential of OBPs as molecular recognition elements for VOCs detection, supporting their application in biosensors development.
2.5. Impinger System Performance
The impinger system was employed as a volatile compound collection method to introduce selected VOCs (1-pentanol, 1-octen-3-ol and 2-butanone) into a controlled aqueous environment, this solution containing the VOC was used to monitor the interaction with OBPs using Förster Resonance Energy Transfer (FRET) fluorescence assays.
The experimental setup includes a bubbler-based impinger mechanism (Figure 14), wherein a controlled nitrogen gas flow facilitated the volatile metabolite transfer from the gas phase into a Milli-Q water solution. To confirm that bubbling had occurred and the presence of VOCs in solution, competitive FRET assays were conducted. The captured VOC in the liquid was added to a solution containing pOBP saturated with 1-AMA.
The observed fluorescence variation after the addition of 3 and 6 µL of 1-pentanol (Figure 15) supports the hypothesis that VOC binding induced structural changes in OBP, leading to altered a fluorescence emission. The concentration of 1-pentanol in the aqueous solution after bubbling was estimated at 2 mM ± 0.4, in line with the expected partitioning behavior of alcohol-based VOCs. The introduction of VOCs into the aqueous phase resulted in a measurable decrease in fluorescence intensity at 481 nm, indicative of OBP-ligand interactions.
A similar experiment conducted with 1-octen-3-ol (Figure 16) showed a corresponding fluorescence decrease at 481 nm, confirming its successful capture. The estimated concentration in the aqueous solution was 1 mM ± 0.3, a value lower than of 1-pentanol, probably due to differences in volatility and solubility of the different compounds.
The competitive FRET fluorescence experiment demonstrated a strong correlation between VOC concentration and fluorescence signal reduction. The progressive quenching of the emission peak at 481 nm upon increasing VOC concentration validated the efficiency of the impinger system in VOC detection. The Hill curve analysis confirmed that the FRET-based sensor was able to detect VOCs at micromolar concentrations, with detection thresholds aligning with previous GC-MS results.
The comparison of fluorescence spectra across different VOCs revealed specific binding affinities for pOBP, confirming its role as a molecular recognition element for volatile compounds considered markers in milk quality assessment.
The results suggest that the impinger system, in combination with OBP-based biosensors, can offer a rapid and cost-effective approach for VOCs detection in food matrices. The integration of this technique with machine learning-based predictive models could further enhance VOCs monitoring capabilities.
3. Materials and Methods
3.1. Materials
2-butanone, 1-pentanol, 2-methyl-3-pentanone, 1-octen-3-ol, 1-aminoanthracene (1-AMA) were purchased from Sigma-Aldrich. All solutions were prepared using Milli-Q water. All materials used for protein electrophoresis were purchased from Bio-Rad. Glutathione Sepharose 4 Fast Flow (GE Healthcare) and HisTrap HP (GE Healthcare) resins were used to purify the proteins. Water for mass spectrometry was purchased from Carlo Erba. All other chemicals were commercial samples of the best available quality.
3.2. Molecular Docking Studies
Molecular docking simulations were performed using the open-source software MGLTools. The process began with the preparation of protein and ligand structures using AutoDockTools (ADT) 1.5.6. The structures of bOBP (PDB ID: 2HLV) and pOBP (PDB ID: 1DZK) were retrieved from the Protein Data Bank, while ligand structures were sourced from PubChem in SDF format and subsequently converted to PDB format. The protein structures were refined by verifying their integrity and removing heteroatoms associated with co-crystallized ligands and water molecules. Hydrogen atoms, charges, and atom types were then assigned. The torsional degrees of freedom of the ligands were calculated, and partial charges were added, resulting in the generation of two distinct PDBQT files.
Docking simulations were conducted using a grid box of 60×60×60 points (spacing: 0.375 Å) for bOBP and 58×66×46 points (spacing: 0.375 Å) for pOBP. The AutoDock Lamarckian genetic algorithm was employed for docking, performing 100 independent runs while treating the protein as rigid and the ligand as flexible. A total of 30,000 binding poses were generated, with a maximum of 2,500,000 energy evaluations. The affinity maps, computed using AutoGrid, were saved in GLG format to facilitate binding free energy calculations.
3.3. Expression and Purification of OPBs
3.4. Fluorescence Spectroscopy and FRET Assays
Steady-state fluorescence measurements were conducted using an ISS K2 Frequency-Domain Fluorometer with a 1.0 cm path length quartz cuvette. Fluorescence spectra of bOBP and pOBP samples were recorded, ensuring optical densities below 0.1 OD at 295 nm to prevent inner filter effects. Tryptophan (Trp) residues were excited at 295 nm, and fluorescence emission spectra were collected from 320 nm to 600 nm at 1 nm intervals, with a scan speed of 100 nm/min, and excitation and emission slit widths set at 1.0 nm. The lamp power was maintained at 17.5 A. Assays were performed in 500 μL of phosphate saline buffer (PBS) at pH 7.4. The OBPs-VOCs interactions were studied by a fluorescence titration approach. For this purpose, the protein (12 μM, saturated with 1-AMA) was titrated with increasing concentrations of the tested VOC. The measurements were carried out in triplicate, and the obtained experimental data were processed by OriginPro 2021b software.
For the fluorometric competitive assay, the ability of OBPs to bind VOCs and 1-AMA was utilized to develop a FRET-based assay. The competition between VOCs and 1-AMA for the binding to the OBPs active site was studied by monitoring the fluorescence emission decrease consequently to the VOCs displaced of 1-AMA from the OBPs active site. The VOCs tested included 1-pentanol (1 µM–50 mM), 1-octen-3-ol (1 µM–5 mM), and 2-butanone (1 µM–10 mM), with ethanol solutions added to bOBP and pOBP samples until the fluorescence emission was stabilized. The measurements were carried out in triplicate, and the data were analyzed using the OriginPro 2021b software.
3.5. Thermal Stability Studies
To analyze the thermal proteins stability, studies on temperature-induced denaturation were conducted of the chosen OBPs in absence and in presence of the selected VOCs. The emission spectra were recorded at an excitation wavelength of 295 nm to focus only on the contribution of tryptophan residues with a 12 μM pOBP sample, with an optical density around 0.1 OD at 295 nm.
Fluorescence intensity variation was recorded in the temperature range from 25 to 95 °C and the emission spectra acquired in the wavelength range 320-410 nm. Measurements were performed in triplicate after 10 min of incubation at define temperatures. The spectra were first recorded for both proteins (bOBP and pOBP) in absence and in presence of odor molecules (1-pentanol 50 mM, 1-octen-3-ol 5 mM, and 2-butanone 10 mM). To analyze the thermal denaturation data, the OriginPro 2021b software was used.
3.6. Fluorescence Quenching Experiments
To evaluate the solvent accessibility of the OBP’s tryptophan residues, a fluorescence quenching assay was performed using acrylamide. A solution in water of acrylamide at 7 M was prepared, filtered through a 0.22 µm filter to remove particulates and stored in the dark at 4 °C, as acrylamide is light sensitive. Six different protein-quencher samples were prepared with increasing concentrations of acrylamide (0 M, 1 M, 2 M, 3 M, 4 M, 5 M) and incubated overnight. Fluorescence emission spectra were acquired using an excitation wavelength at 295 nm and emission range from 310 to 410 nm.
After completing the acrylamide quenching titration, protein-acrylamide samples were prepared with saturating concentrations of the selected VOCs (1-pentanol 50 mM, 1-octen-3-ol 5 mM, and 2-butanone 10 mM) and the acrylamide titration was repeated.
Quenching data were evaluated using the Stern-Volmer equation by plotting F0/F against [Q], where F0 represents the fluorescence intensity without quencher, F is the fluorescence intensity in the presence of quencher, and [Q] denotes the quencher concentration [Eq 2]:
Quenching assays involving only the protein-quencher complex were also performed at 50 °C, following the previously described method.
3.7. HS-SPME/GC-MS Analysis
The HS-SPME/GC-MS technique was used to evaluate the VOCs profiles of samples of raw cow milk and, successively, the ability of purified OBPs to bind selected VOCs in the gas phase. According to Sacchi et al, 5 mL of milk were introduced in a HS-SPME 20 mL glass vial with 5ul of a standard solution of 2-methyl-3-pentanone, used as internal standard (IS, 5 mM). Samples were equilibrated for 30 min at 55 °C to release volatile compounds. Afterwards, the fiber (DVB-Carboxen-PDMS, 2 cm length SUPELCO, Bellefonte, PA, USA) was automatically inserted in the vial for 60 min and then desorbed for 10 min at 250 °C in the injector port of a GC, model 7890A, Agilent (Agilent Technologies, Santa Clara, USA) coupled to a mass spectrometer, model 5975 C (Agilent), where VOCs were thermally released and directly transported to a capillary column HP-Innowax (30m×0.25mm×0.5µm Agilent J&W) for the analysis. The oven temperature was set as follows: 40 °C for 1 min, ramped to 160 °C at 6 °C min-1 then, after 1 min, increased at 10 °C min-1 to 210 °C and finally ramped to 230 °C at 15 °C min-1 and kept for 5 min. The temperatures of the ion source and the quadrupole were 230 °C and 150 °C, respectively and helium at a flow rate of 1.0 mL min-1 was the carrier gas. The analyses were carried out using the pulsed spitless mode and mass spectra were recorded at an ionization energy of 70 eV with mass selective detector operating in the mass range between 30 and 300 u. For each sample, three replicates were performed.
Linear retention indices (LRI) were calculated using the same chromatographic conditions, by injecting C8-C40 n-alkane series (Supelco, Bellefonte, PA, USA). VOCs were identified by comparing the mass spectra reported in the NIST-2014 and Wiley 7.0 libraries, by matching the calculated LRI with literature data and by valuating their retention times respect to those of pure standards, if available. The VOCs concentrations were expressed as the equivalent of the IS (percent ratio of the respective peak area relative to the IS area, RPA%) and areas were taken from the total ion chromatogram (TIC).
Using the same experimental parameters reported above, HS-SPME/GC-MS analysis was also performed on pOBP samples with and without the exposition to the HS of the selected VOCs. To enable pOBP and volatile binding, vials containing 1x PBS or pOBP (30 µM) were placed in sealed glass bottles with aqueous solutions (10 µM) of individual selected volatiles (1-pentanol, 1-octen-3-ol, or 2-butanone) containing 5ul of IS and incubated overnight at room temperature. The peak areas measured for PBS-only and pOBP-comprising samples were compared for each experiment. To confirm the binding specificity of each volatile, the same procedure was conducted replacing pOBP with Bovine Serum Albumin (BSA), as a negative control.
3.8. Impinger System for VOC Capture
The competitive FRET assay was repeated using the same method reported in paragraph 3, but with the addition of a bubbler. In brief, 2.5 mL of pure solutions of the three selected VOCs were placed in a glass Petri dish which was positioned inside a sealed container. A constant flow of nitrogen gas was passed through the container to maintain a controlled atmosphere. The apparatus was placed on a heating plate set to 100 °C, to facilitate the phase transition of the substances from liquid to gas. The resulting vapors were directed into bubblers containing 100 mL of Milli-Q water and bubbled for 2 hours. The Milli-Q water saturated with the VOC vapors was then used for the competitive FRET assay.
4. Conclusions
In this study a fluorescence-based biosensor utilizing OBPs as MRE for the detection of three different VOCs (1-pentanol, 1-octen-3-ol, and 2-butanone) involved in the discrimination of milk from intensive and extensive farming systems, was developed. According to our knowledge, the HS-SPME/GC-MS technique was used for the first time to explore the ability of pOBP to bind VOCs. Specifically, the integration of HS-SPME/GC-MS and FRET assays allowed the validation of OBP-VOC interaction, supporting the design of a selective biosensing approach. The impinger method for biosensor development demonstrated high sensitivity and specificity, enabling the differentiation of milk from intensive and extensive farming systems. The results obtained suggest the potential of this approach for real-time monitoring of VOCs in milk samples in food traceability and quality control. Future studies can improve the sensing capabilities of the sensors to both from a qualitative (enlarge the number detectable volatiles) and a quantitative point of view.
Supplementary Materials
The following supporting information can be downloaded at the website of this paper posted on Preprints.org.
Author Contributions
Conceptualization, S.D., R.C. and A.P.; methodology, S.D., A.P.; software, C.G.; validation, R.C., A.P. and C.G.; investigation, A.P.; resources, S.D.; data curation, A.P.; R.C. and C.G.; writing—original draft preparation, C.G.; R.C.; and A.P.; writing—review and editing, S.D.; R.C.; A.P.; and C.G.; supervision, A.P.; funding acquisition, S.D. All authors have read and agreed to the published version of the manuscript.
Funding
This research received no external funding.
Institutional Review Board Statement
Not applicable.
Informed Consent Statement
Not applicable.
Data Availability Statement
The original contributions presented in this study are included in the article and supplementary material. Further inquiries can be directed to the corresponding author.
Acknowledgments
This research was supported by the PhD program in Artificial Intelligence – Agrifood and Environment at the Università degli Studi di Napoli Federico II.
Conflicts of Interest
The authors declare no conflict of interest.
References
- Kamath, R. Food traceability on blockchain: Walmart’s pork and mango pilots with IBM. The Journal of the British Blockchain Association 2018, 1. [Google Scholar] [CrossRef] [PubMed]
- P. F. Fox (n.d.), Milk: An overview, Chapter 1.
- Alothman, M.; Hogan, S.A.; Hennessy, D.; Dillon, P.; Kilcawley, K.N.; O’Donovan, M.; Obin, J.; Fenelon, M.A. The “Grass-Fed” Milk Story: Understanding the Impact of Pasture Feeding on the Composition and Quality of Bovine Milk. Foods 2019, 8, 350. [Google Scholar] [CrossRef] [PubMed]
- Rooke, J.A.; Miller, G.A.; Flockhart, J.F.; McDowell, M.M.; MacLeod, M. Nutritional strategies to reduce enteric methane emissions, Scotland’s Rural College (SRUC) (2016).
- G. Natrella, G. Gambacorta, P. De Palo, A. Maggiolino, M. Faccia, Volatile organic compounds in milk and mozzarella: Comparison between two different farming systems. Running Title: Mozzarella VOC from different farming systems, (2020).
- J. Pawliszyn, Solid Phase Microextraction: Theory and Practice, Wiley-VCH (1997).
- Vilela, A.; et al. Development and application of GC-MS methodologies for volatile compound profiling in dairy products. Journal of Analytical Chemistry 2019, 74, 430–437. [Google Scholar]
- Prieto-Simòn, B.; Campàs, M. Molecular biosensors for monitoring environmental and biological systems. Sensors 2009, 9, 6763–6784. [Google Scholar]
- D’Auria, S.; Varriale, A. Recent Advances in Biosensors for Biomedical Applications. Current Medicinal Chemistry 2015, 22, 473–482. [Google Scholar]
- Camarca, A.; Varriale, A.; Capo, A.; Pennacchio, A.; Calabrese, A.; Giannattasio, C.; Almuzara, C.M.; D’Auria, S.; Staiano, M. Emergent biosensing technologies for analyses of high social interest. Sensors 2021, 21, 906. [Google Scholar] [CrossRef] [PubMed]
- Faulkner, H.; O’Callaghan, T.F.; McAuliffe, S.; Hennessy, D.; Stanton, C.; O’Sullivan, M.G.; Kilcawley, J.P. Effect of different forage types on the volatile and sensory properties of bovine milk. Journal of Dairy Science 2018. [Google Scholar] [CrossRef]
- Sacchi, R.; Boscaino, F.; Ghiretti, G.; Gallo, M.; Cappucci, A.; O’Sullivan, M.G.; Kilcawley, J.P. Effects of Inclusion of Fresh Forage in the Diet for Lactating Buffaloes on Volatile Organic Compounds of Milk and Mozzarella Cheese. Molecules 2020, 25, 1332. [Google Scholar] [CrossRef]
- Lakowicz, J.R. Principles of Fluorescence Spectroscopy. Springer Science & Business Media (2006).
- Marsili, R.T. SPME-MS-MVA as an electronic nose for the study of off-flavors in milk. Journal of Agricultural and Food Chemistry 2002, 50, 7323–7328. [Google Scholar] [CrossRef]
- Li, H.L.; Zhang, L.Y.; Zhuang, S.; Ni, C.S. Fluorescence Investigation on the Interaction of a Prevalent Competitive Fluorescent Probe with Entomic Odorant Binding Protein. Spectroscopy Letters 2013, 46, 540–545. [Google Scholar] [CrossRef]
- Clarke, H.J.; Fitzpatrick, E.; Hennessy, D.; O’Sullivan, M.G.; Kerry, J.P.; Kilcawley, K.N. The Influence of Pasture and Non-pasture-Based Feeding Systems on the Aroma of Raw Bovine Milk. Frontiers in Nutrition 2022. [Google Scholar] [CrossRef] [PubMed]
- Viallon, C.; Jurie, C.; Chilliard, Y.; Martin, B. Milk volatile organic compounds (VOCs) and fatty acid profile in cows fed timothy as hay, pasture, or silage. Journal of Dairy Science 2013, 96, 7083–7094. [Google Scholar]
- Kaskoutis, D.; Petridis, D.; Daskas, E.; Politis, I. Effects of Intensive and Semi-Intensive Production on Sheep Milk Chemical Composition, Physicochemical Characteristics, Fatty Acid Profile, and Nutritional Indices. Animals 2021, 11, 2472. [Google Scholar] [CrossRef] [PubMed]
- Capo, A.; Pennacchio, A.; Varriale, A.; D’Auria, S.; Staiano, M. The porcine odorant-binding protein as molecular probe for benzene detection. PLoS ONE 2018, 13. [Google Scholar] [CrossRef] [PubMed]
- Marabotti, A.; Scirè, A.; Staiano, M.; Crescenzo, R.; Aurilia, V.; Tanfani, F.; D’Auria, S. Wild-type and mutant bovine odorant-binding proteins to probe the role of the quaternary structure organization in the protein thermal stability. J Proteome Res 2008, 7, 5221–5229. [Google Scholar] [CrossRef] [PubMed]
Figure 1.
Binding site details in the β-barrel structure of pOBP (a) and bOBP (b) from docking simulations, showing the amino acid residues involved in interactions with 1-AMA.
Figure 1.
Binding site details in the β-barrel structure of pOBP (a) and bOBP (b) from docking simulations, showing the amino acid residues involved in interactions with 1-AMA.
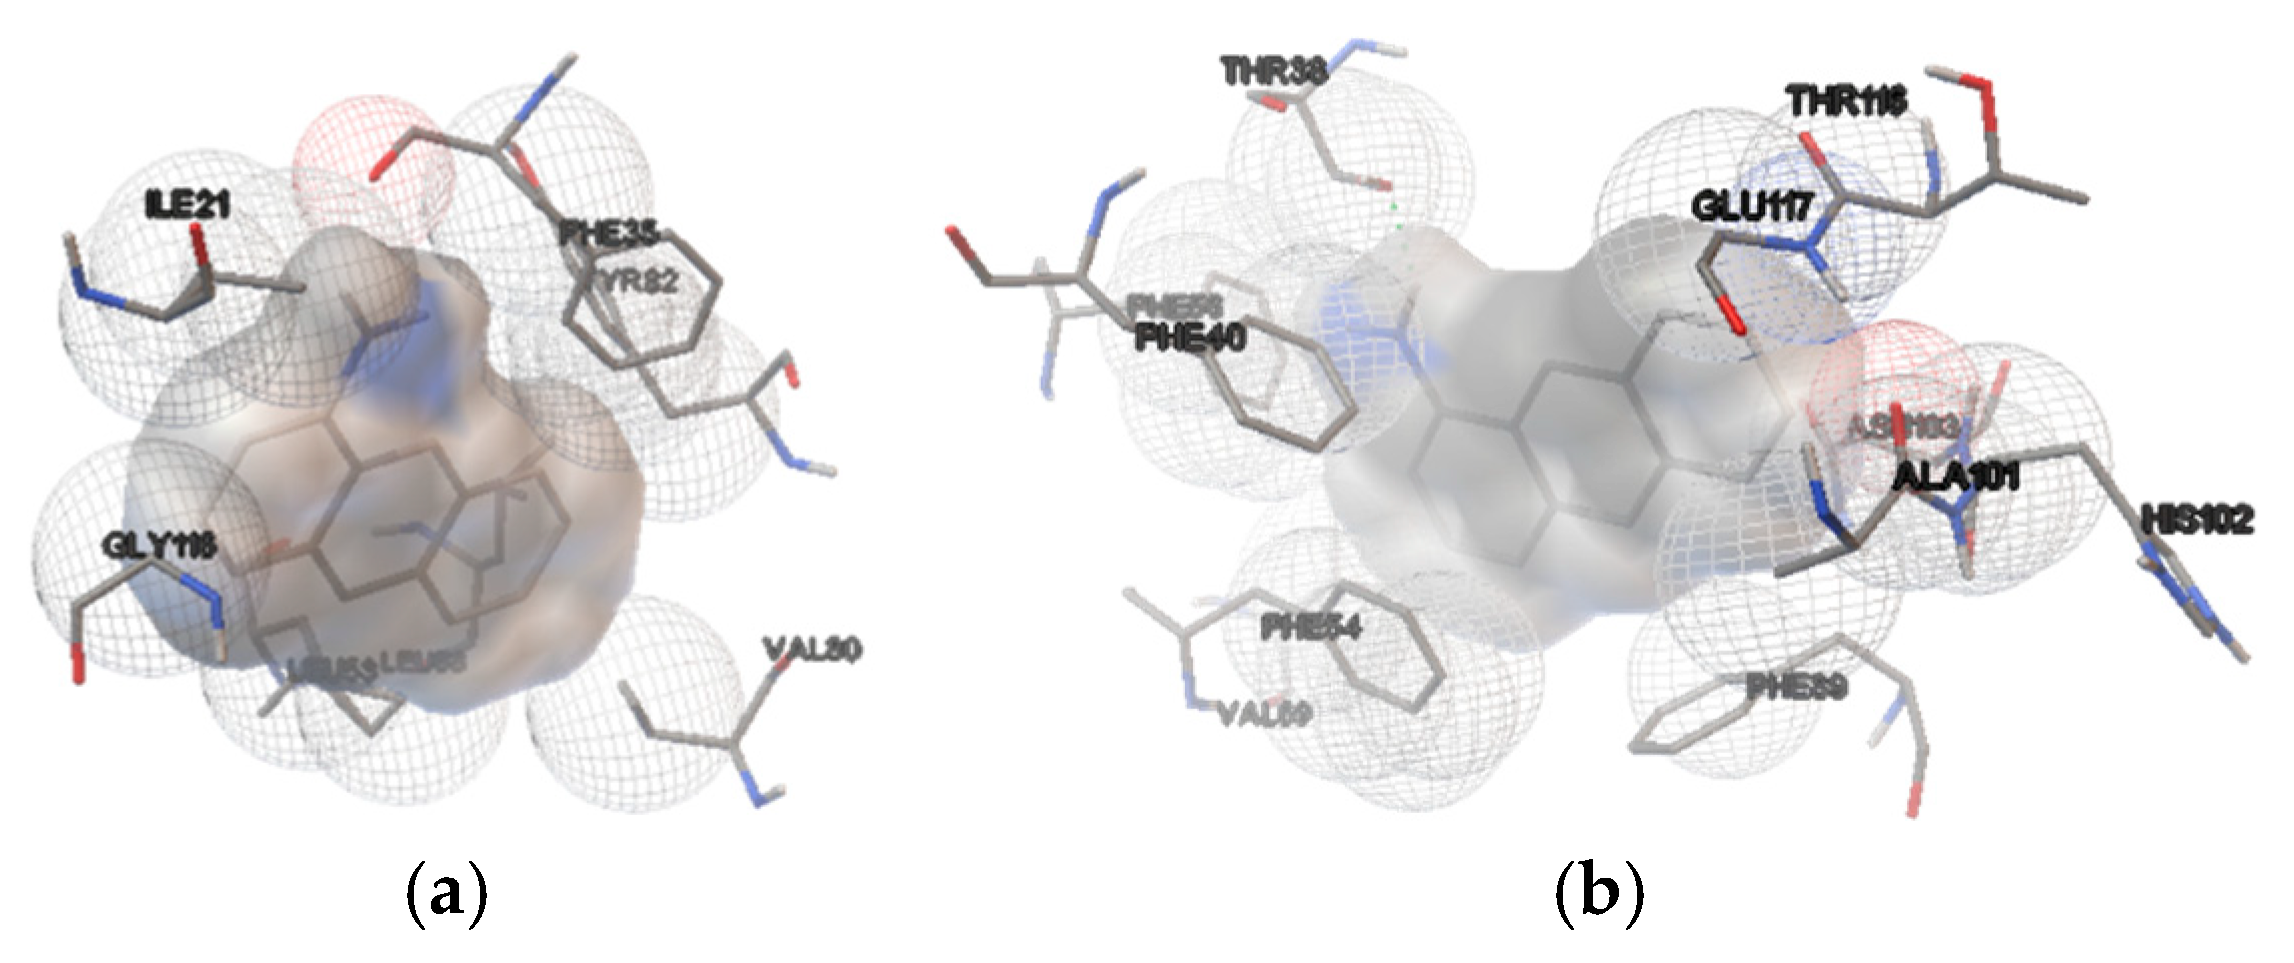
Figure 2.
(a) Fluorescence emission spectra of pOBP excited at 295 nm in the absence and in the presence of 1-AMA; (b) Fluorescence emission spectra of pOBP at 481 nm as a function of the concentration of 1-AMA.
Figure 2.
(a) Fluorescence emission spectra of pOBP excited at 295 nm in the absence and in the presence of 1-AMA; (b) Fluorescence emission spectra of pOBP at 481 nm as a function of the concentration of 1-AMA.
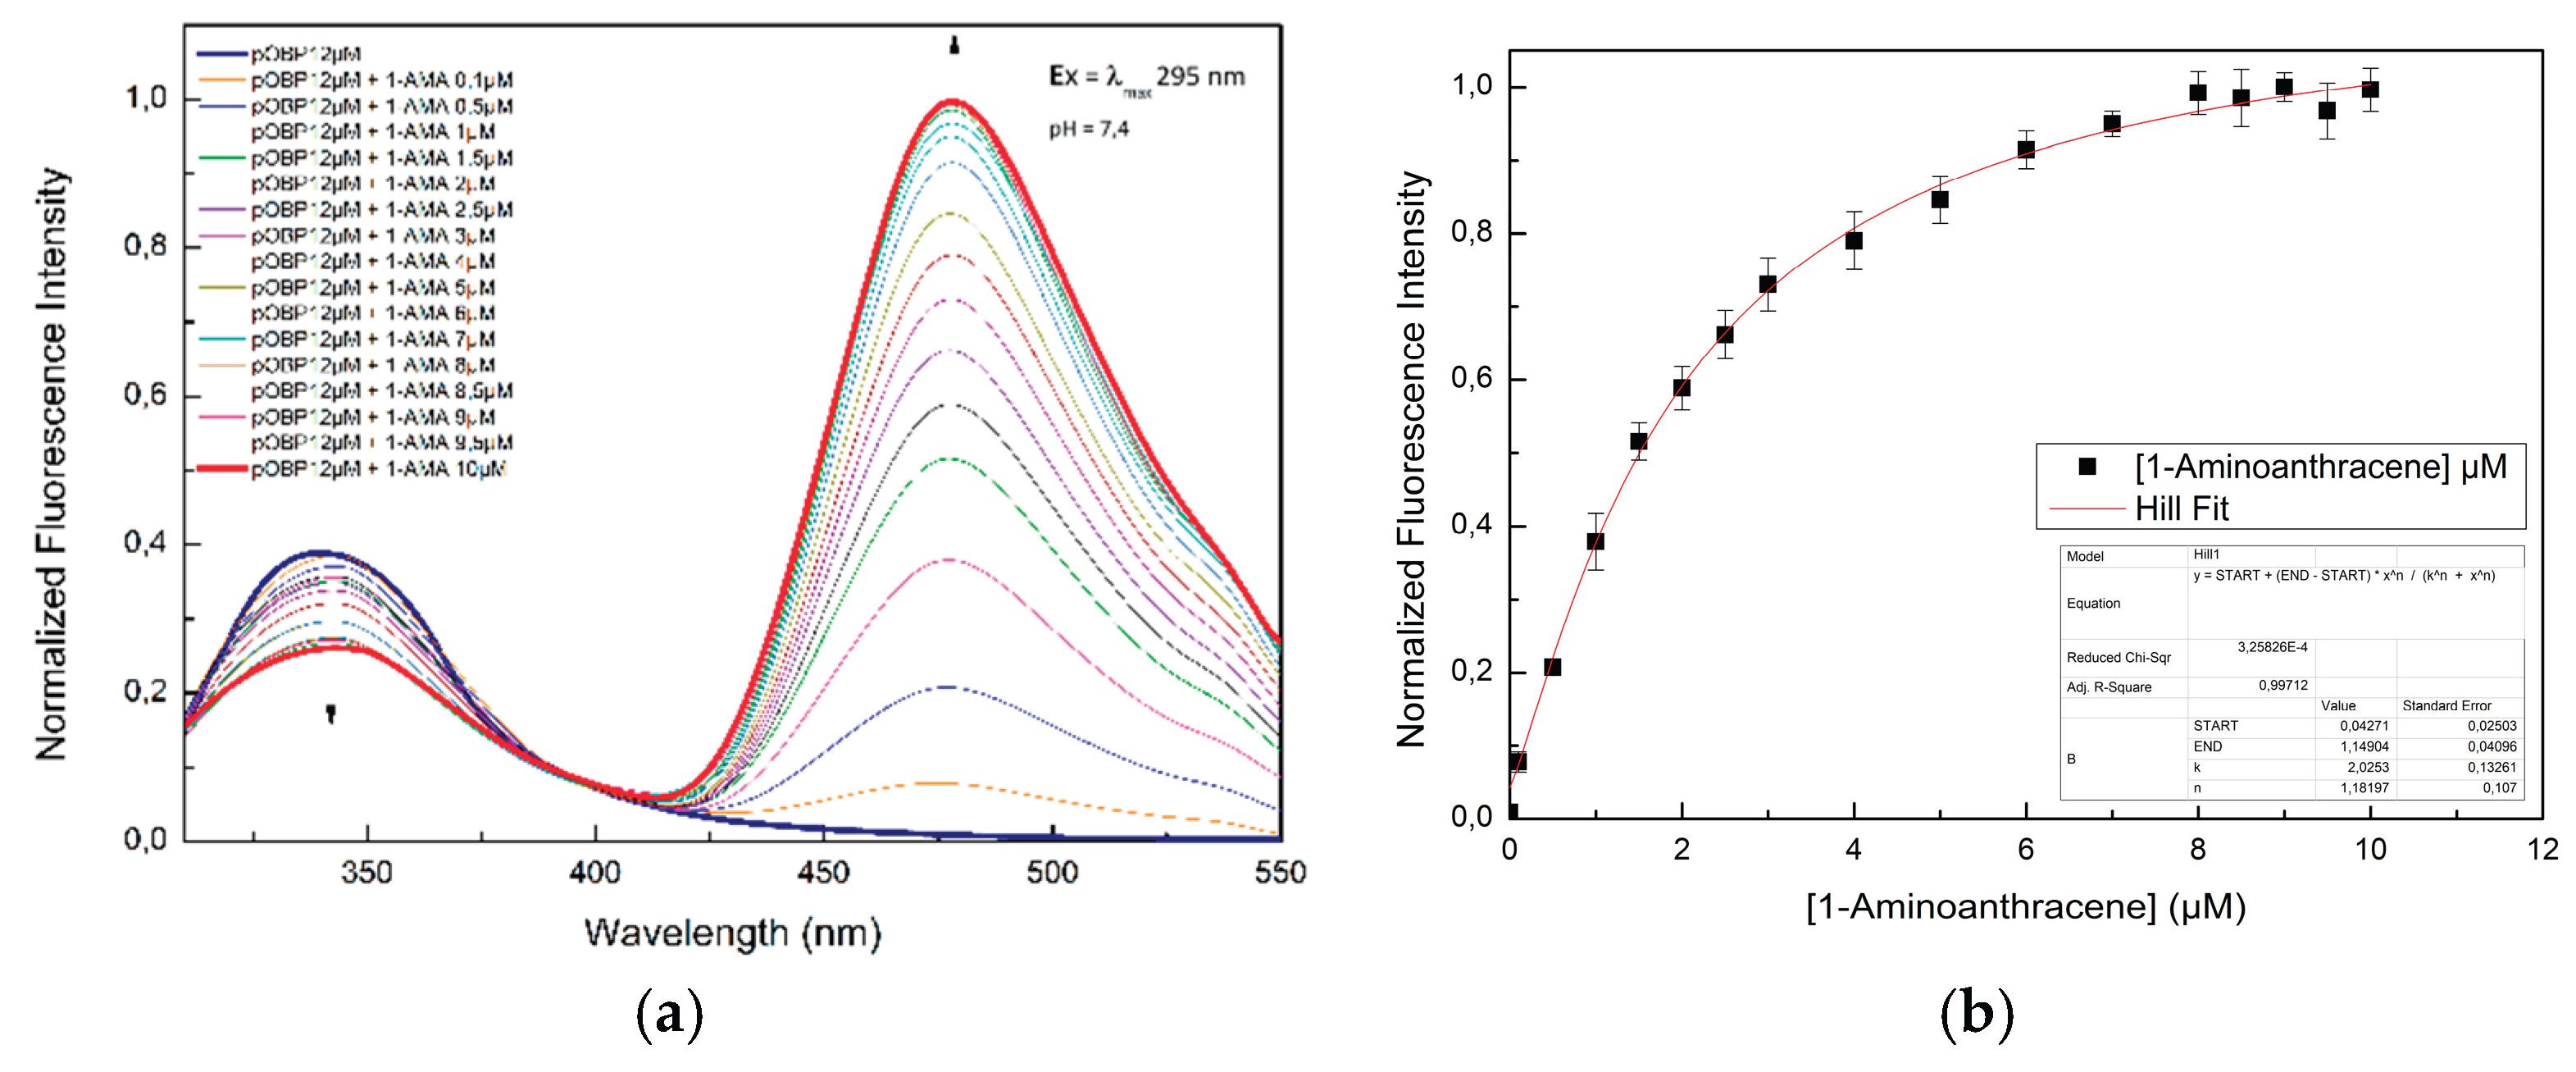
Figure 3.
(a) Fluorescence emission spectra of bOBP excited at 295 nm in the absence and in the presence of 1-AMA; (b) Fluorescence emission spectra of bOBP at 481 nm as a function of the concentration of 1-AMA.
Figure 3.
(a) Fluorescence emission spectra of bOBP excited at 295 nm in the absence and in the presence of 1-AMA; (b) Fluorescence emission spectra of bOBP at 481 nm as a function of the concentration of 1-AMA.
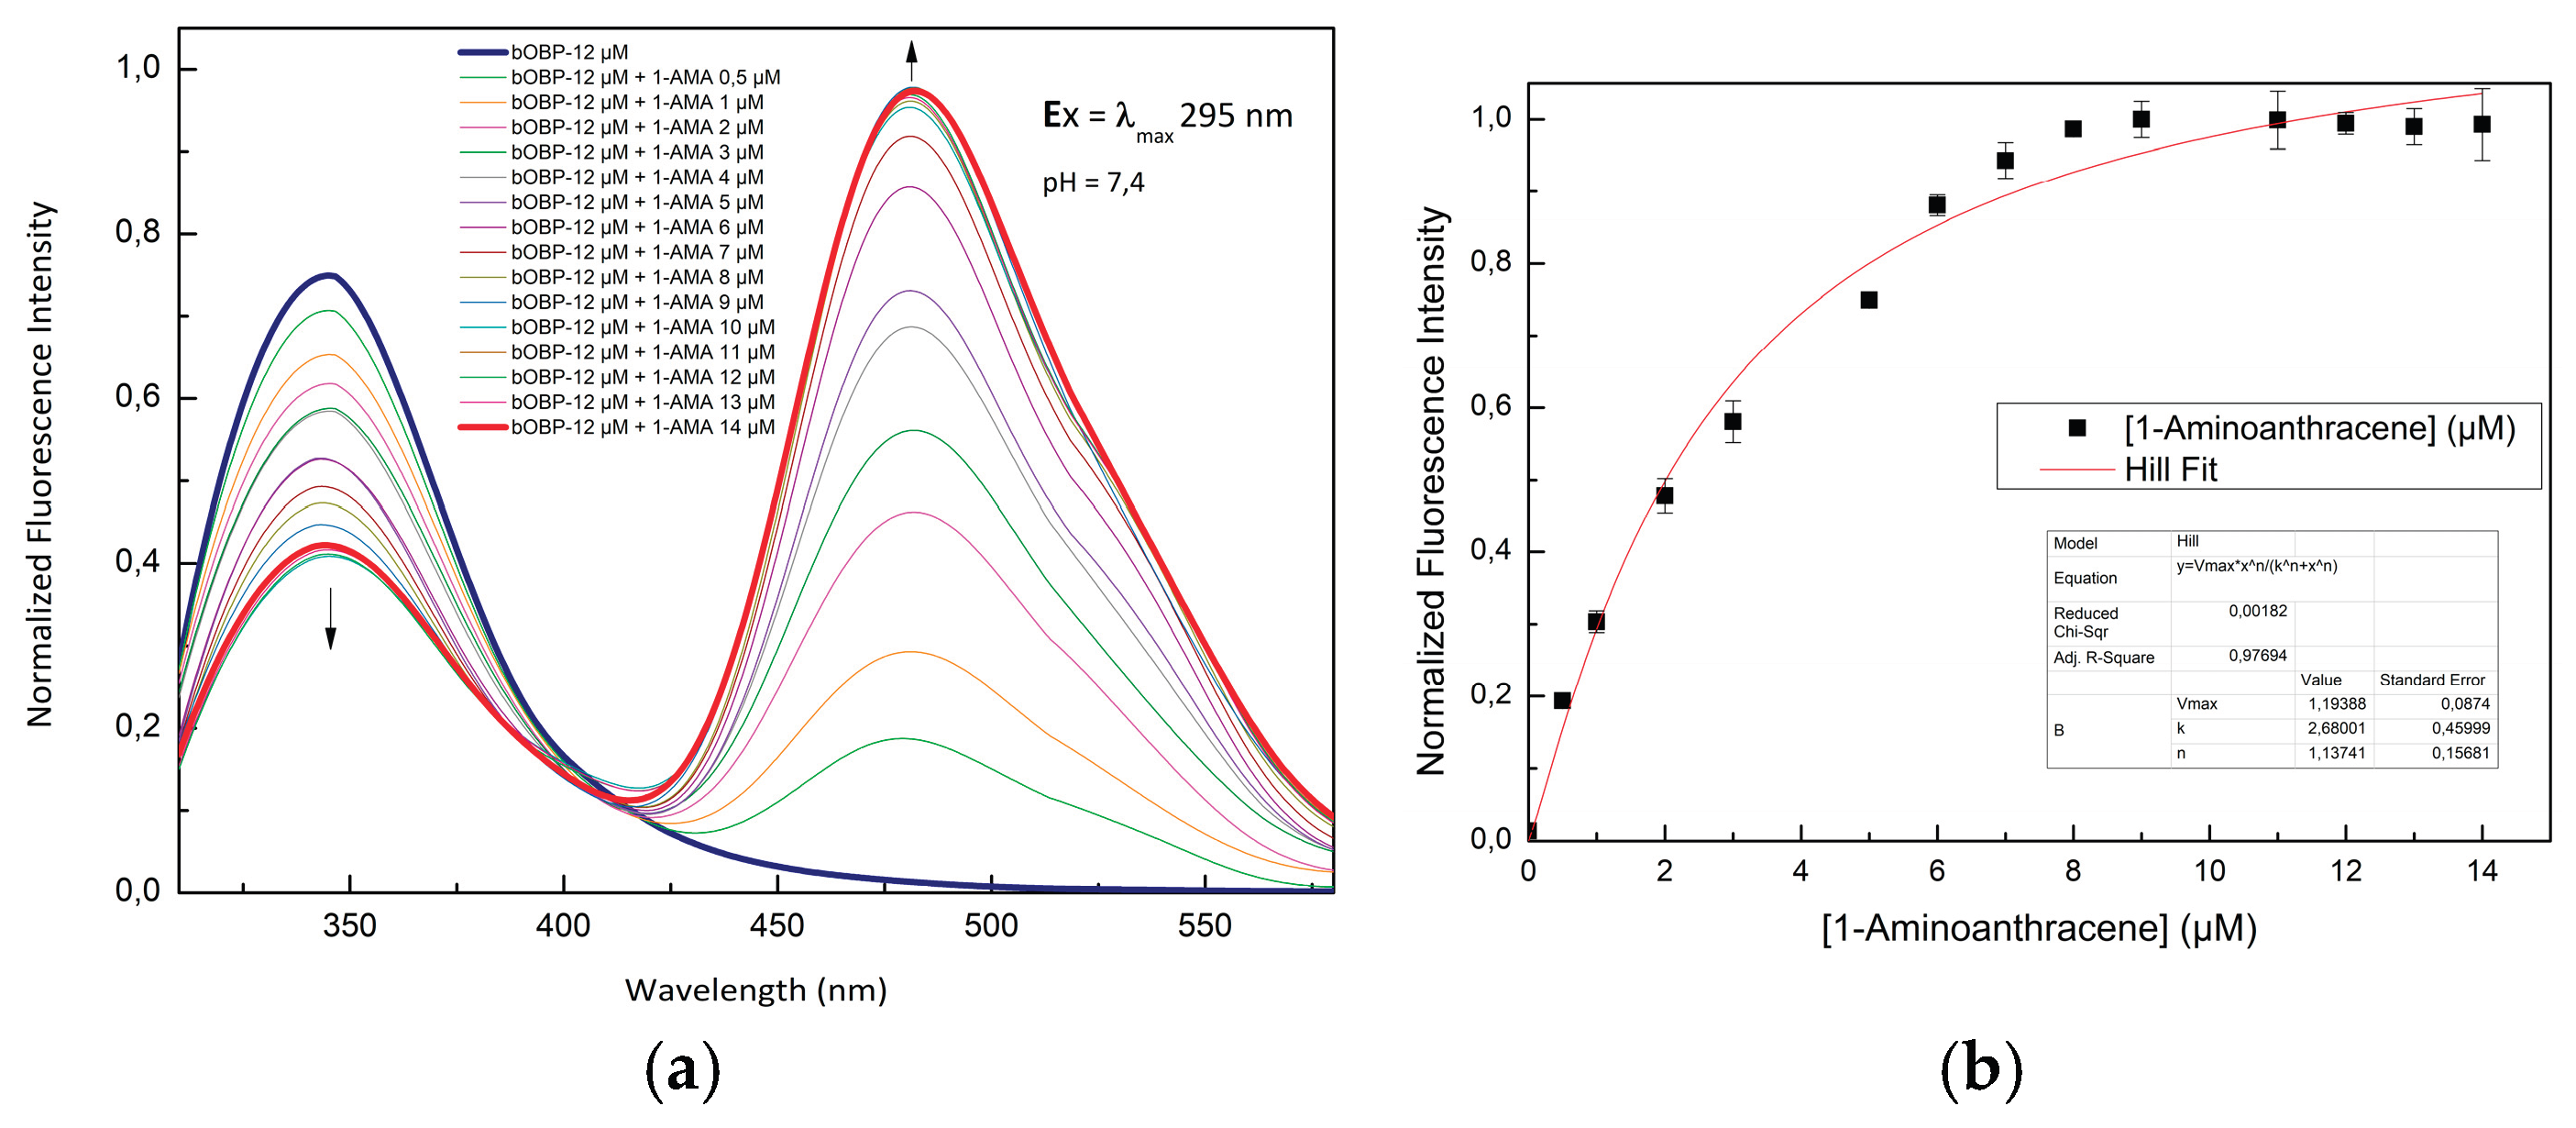
Figure 4.
Fluorescence emission spectra of pOBP at increasing concentrations of 1-pentanol (a), 1-octen-3-ol (c) and 2-butanone (e). 1-pentanol (b), 1-octen-3-ol (d) and 2-butanone (f) titration fitting curve. The curve indicates the decrease in intensity of 1-AMA fluorescence emission at 481 nm as a function of 1-pentanol, 1-octen-3-ol and 2-butanone concentration. The fitting curve obtained by a non-linear function is highlighted in red.
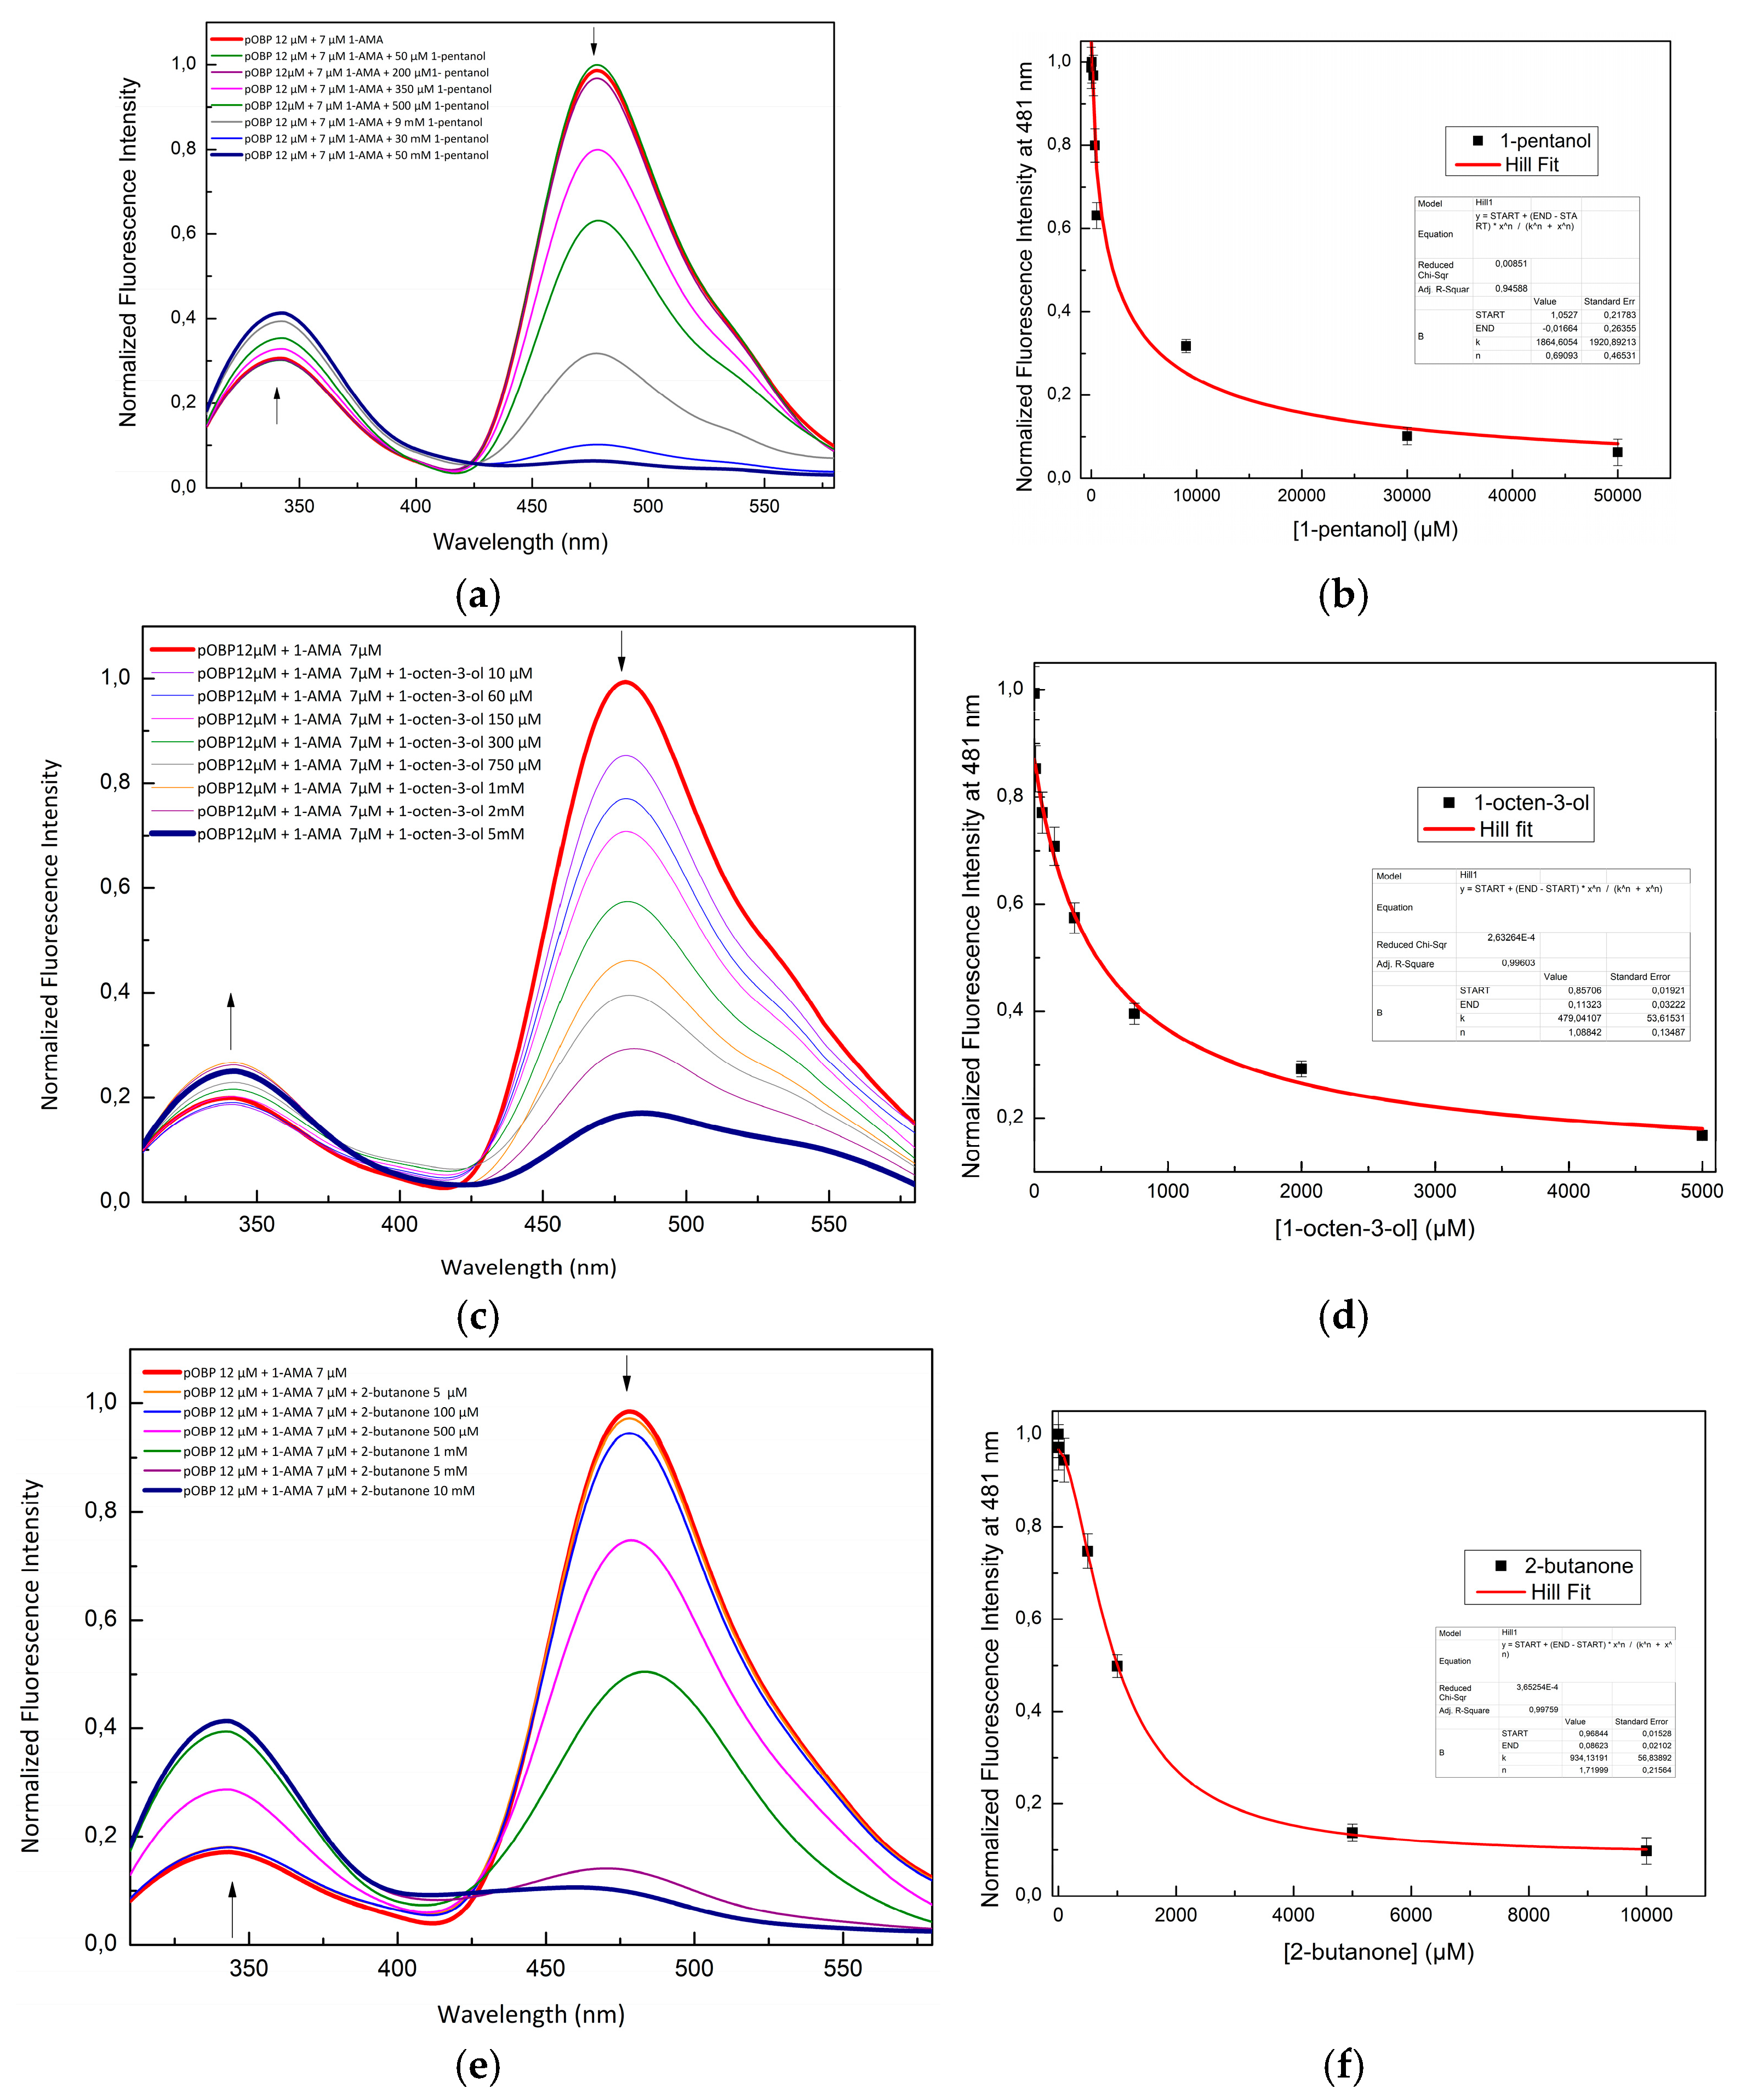
Figure 5.
Fluorescence emission spectra of bOBP at increasing concentrations of 1-pentanol (a), 1-octen-3-ol (c). 1-pentanol (b) and 1-octen-3-ol (d) titration fitting curve. The curve indicates the decrease in intensity of 1-AMA fluorescence emission at 481 nm as a function of 1-pentanol and 1-octen-3-ol concentration. The fitting curve obtained by a non-linear function is highlighted in red.
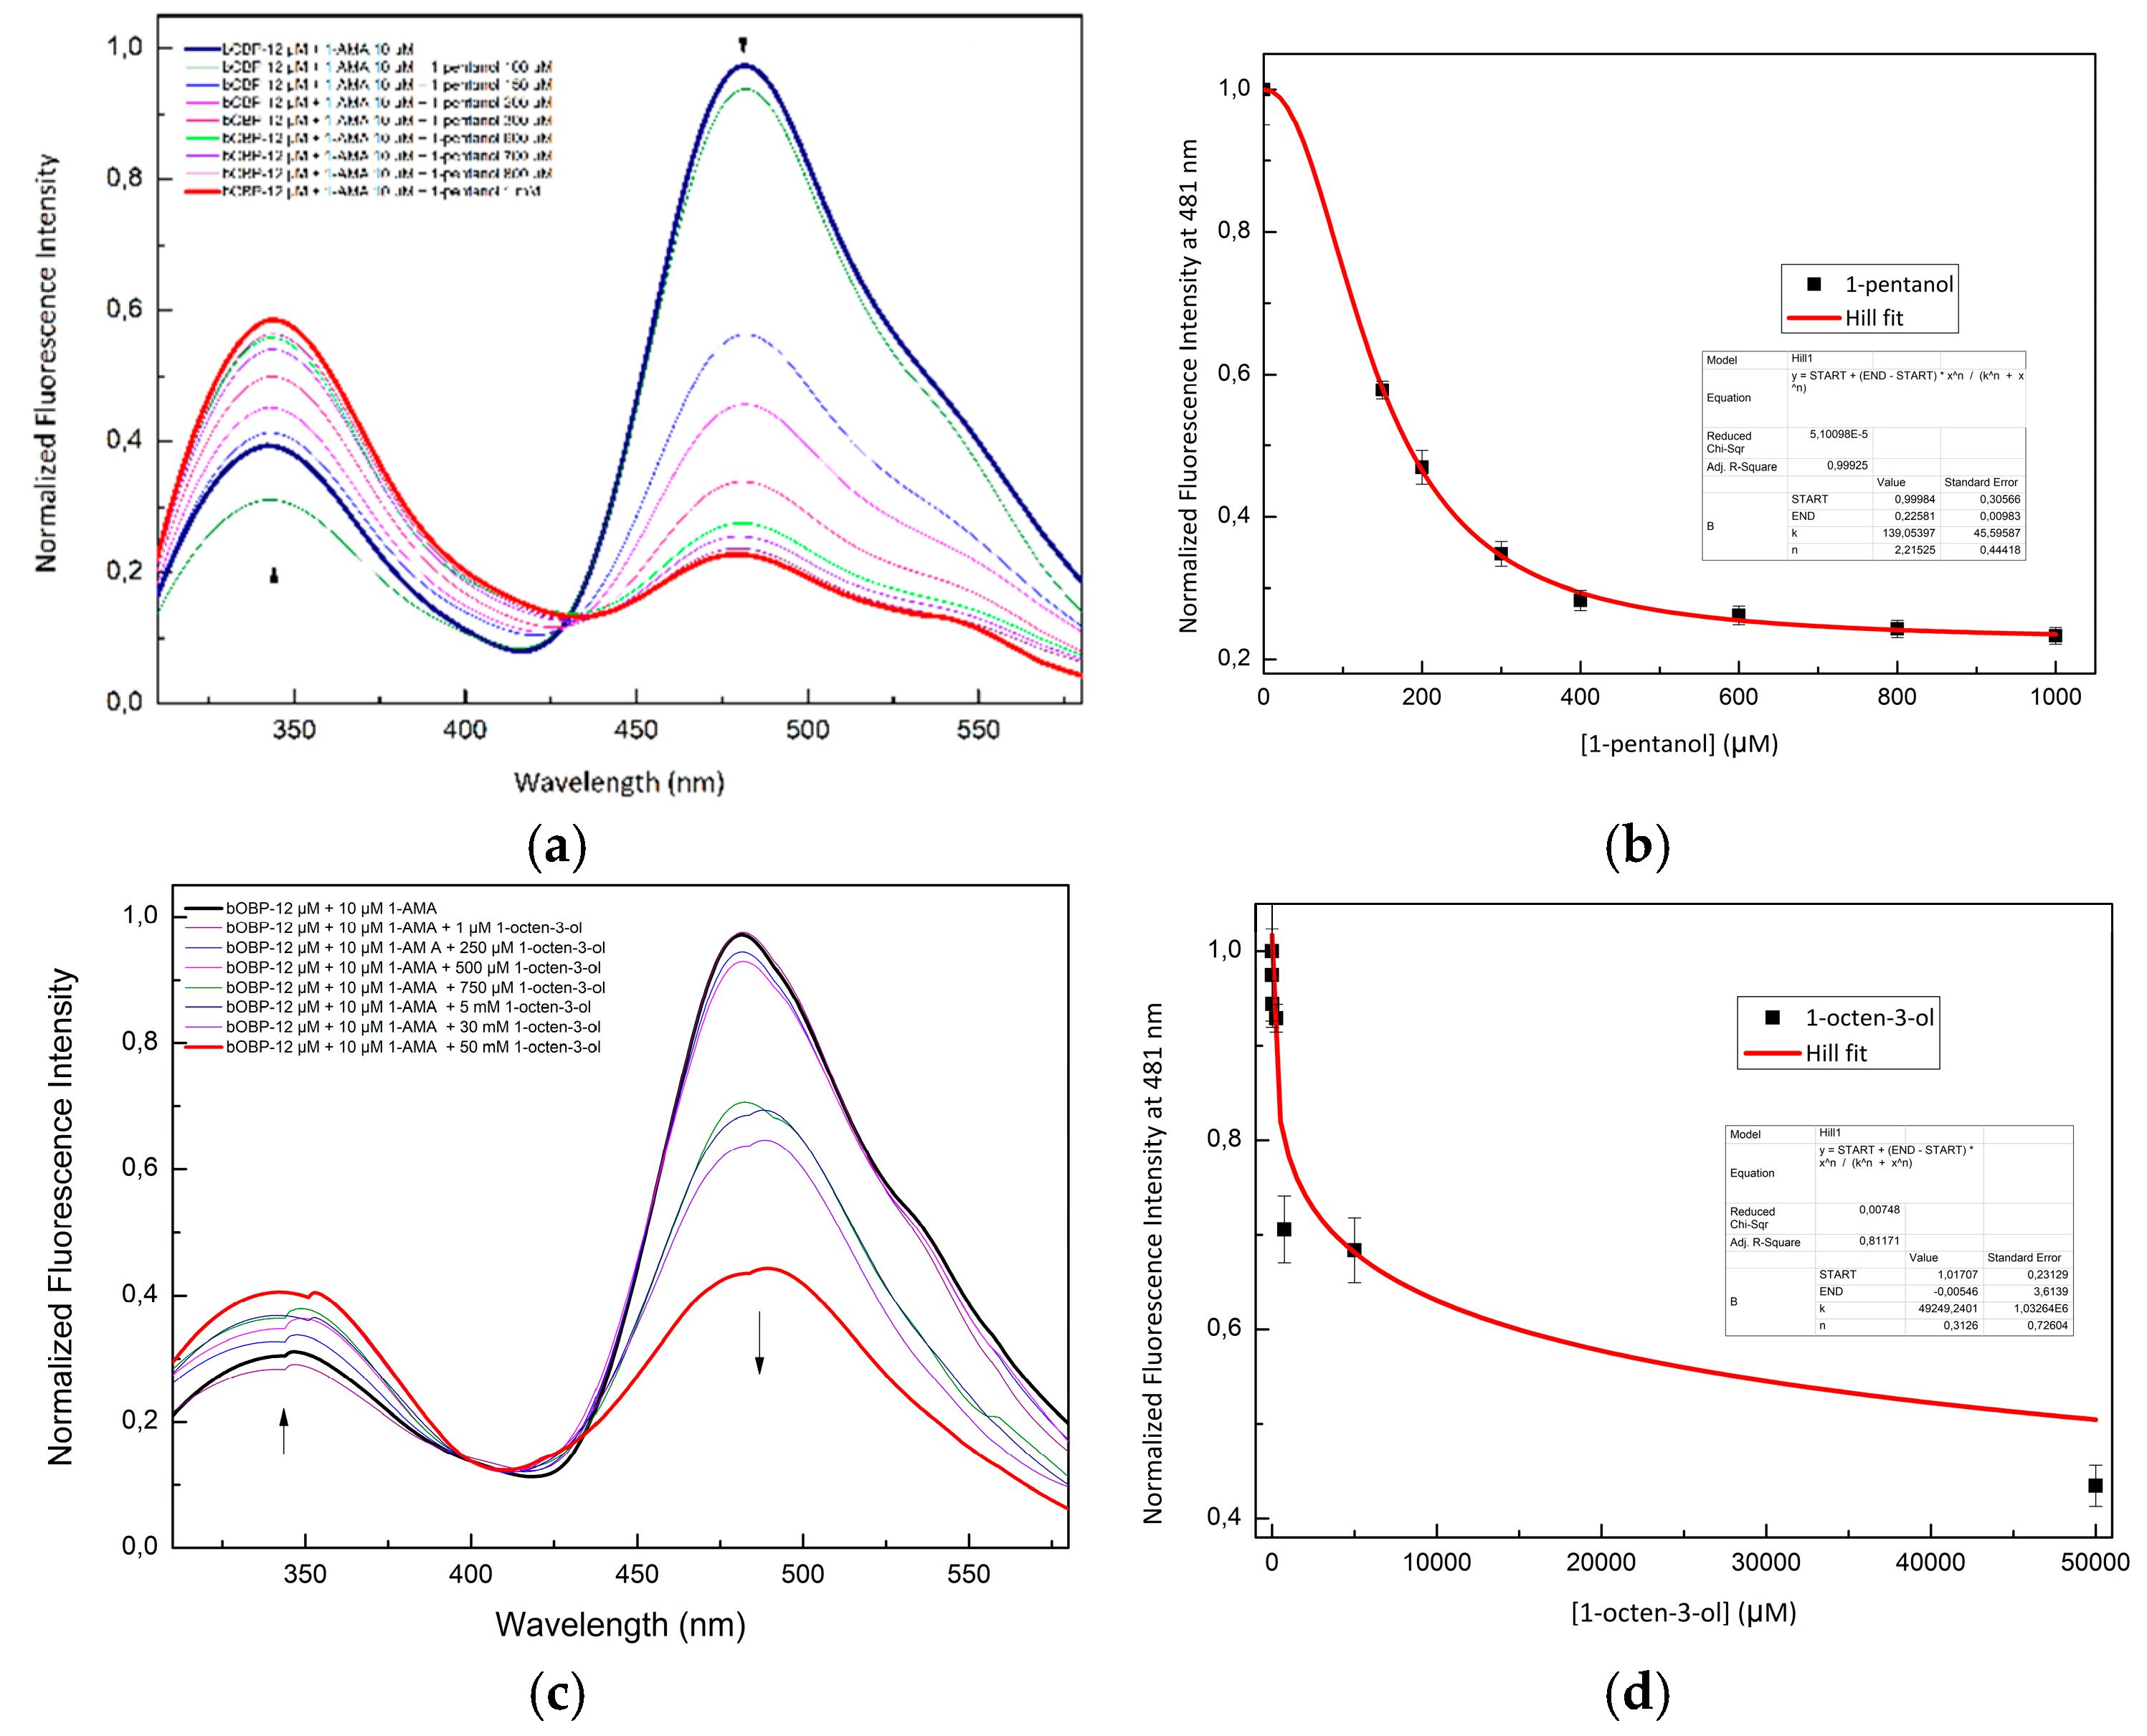
Figure 6.
(a) Fluorescence emission spectra of pOBP in the temperature range from 25 °C to 95 °C. (b) Fitting curve of fluorescence emission intensity at 340 nm as a function of thermal denaturation of pOBP between 25 °C and 95 °C.
Figure 6.
(a) Fluorescence emission spectra of pOBP in the temperature range from 25 °C to 95 °C. (b) Fitting curve of fluorescence emission intensity at 340 nm as a function of thermal denaturation of pOBP between 25 °C and 95 °C.
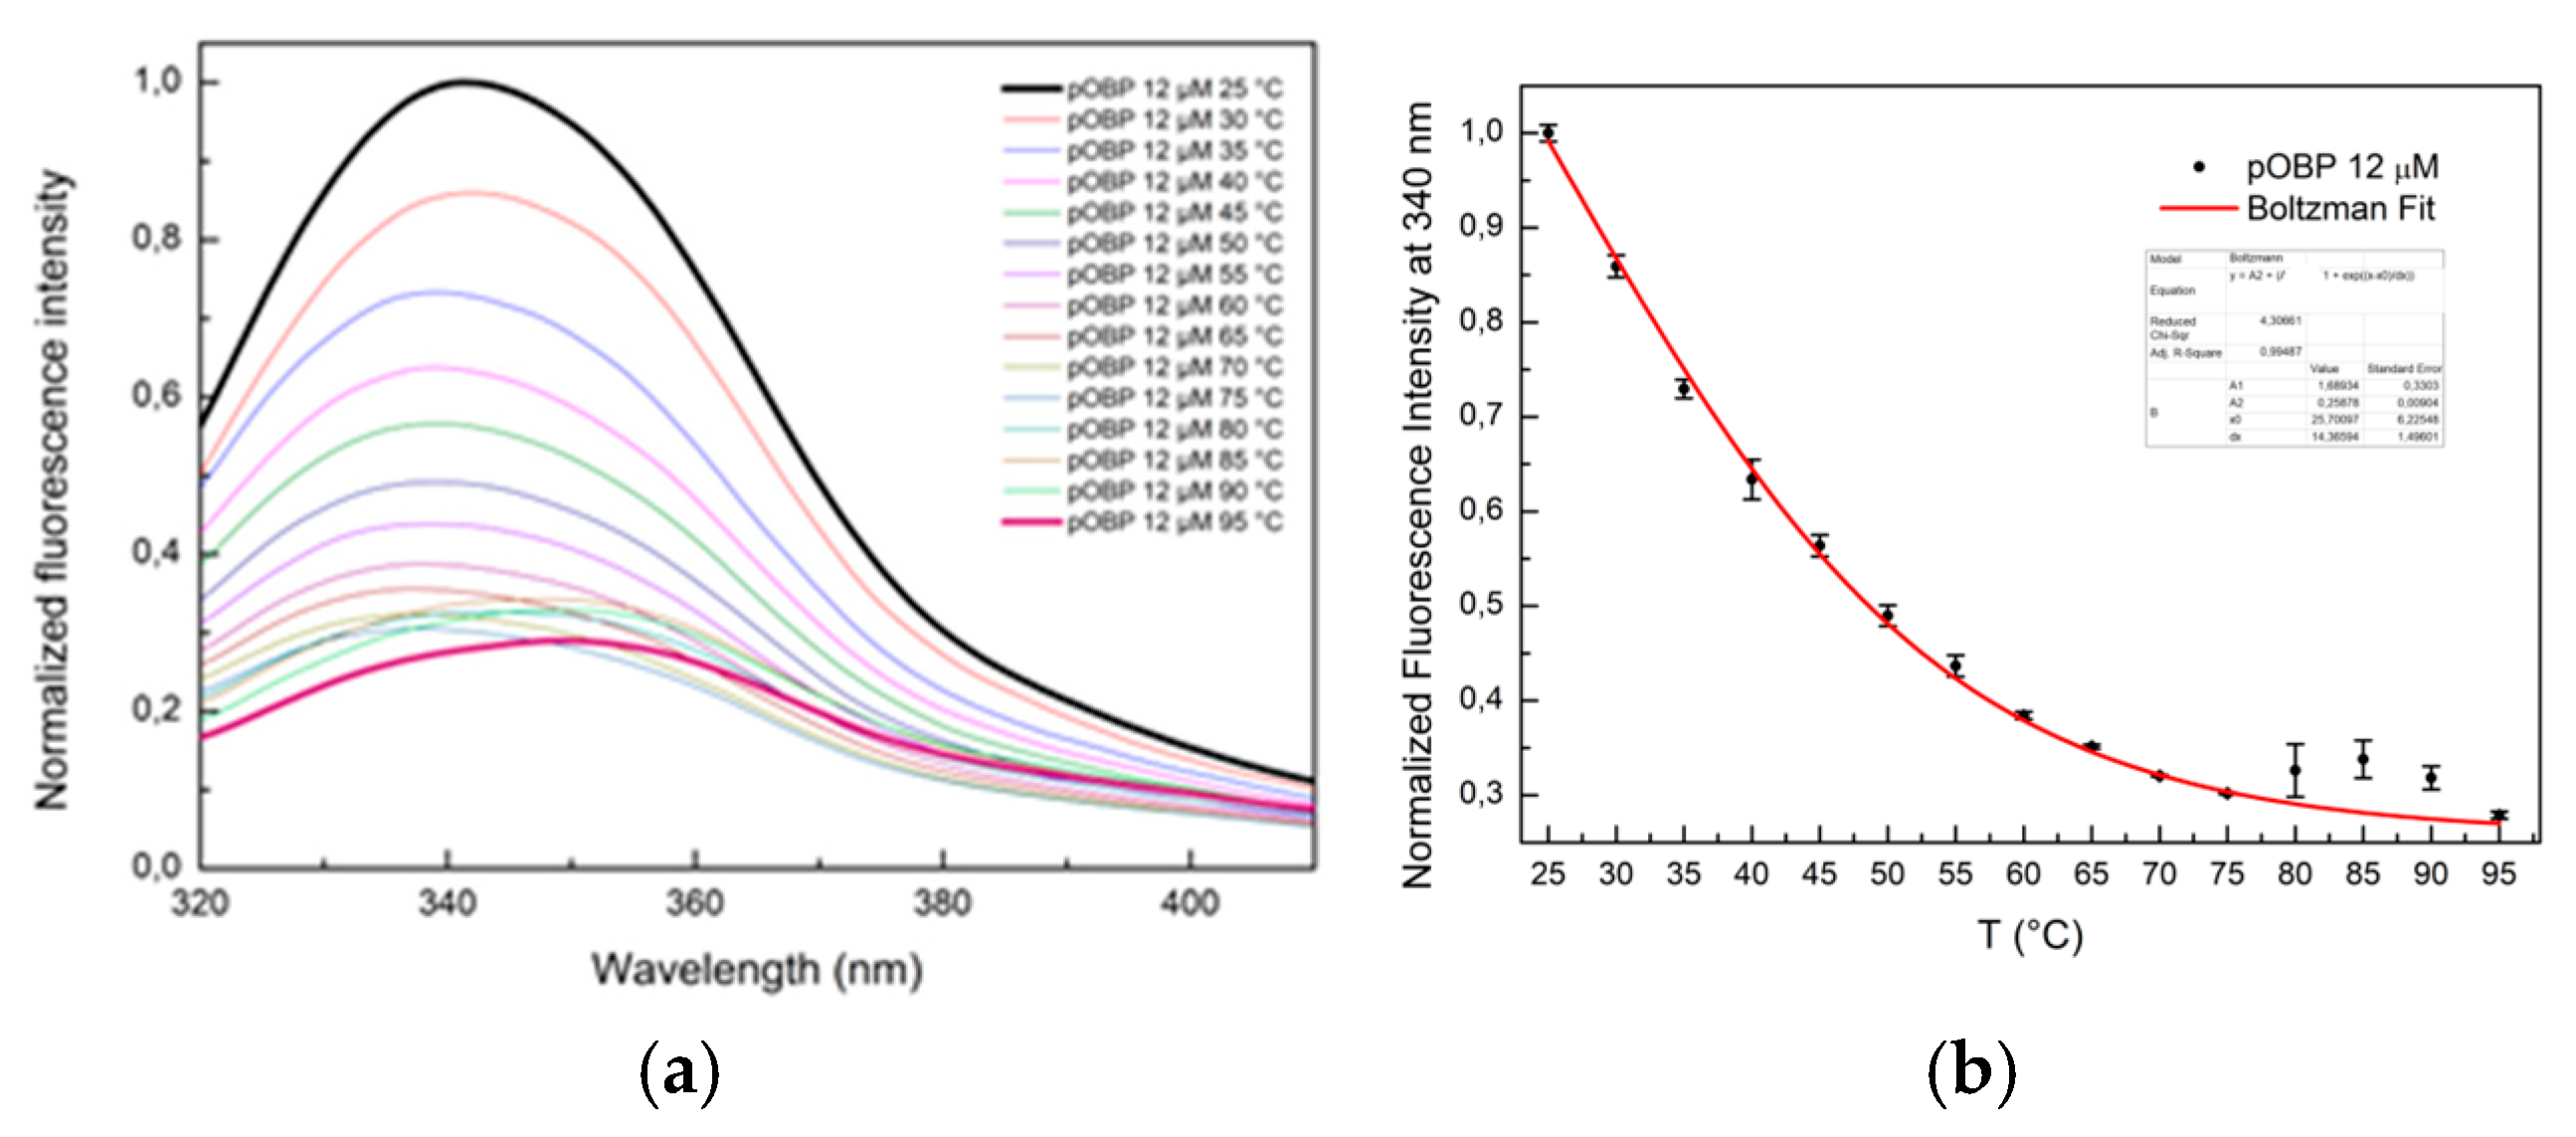
Figure 7.
(a) Fluorescence emission spectra of bOBP in the temperature range from 25 °C to 95 °C. (b) Fitting curve of fluorescence emission intensity at 340 nm.
Figure 7.
(a) Fluorescence emission spectra of bOBP in the temperature range from 25 °C to 95 °C. (b) Fitting curve of fluorescence emission intensity at 340 nm.
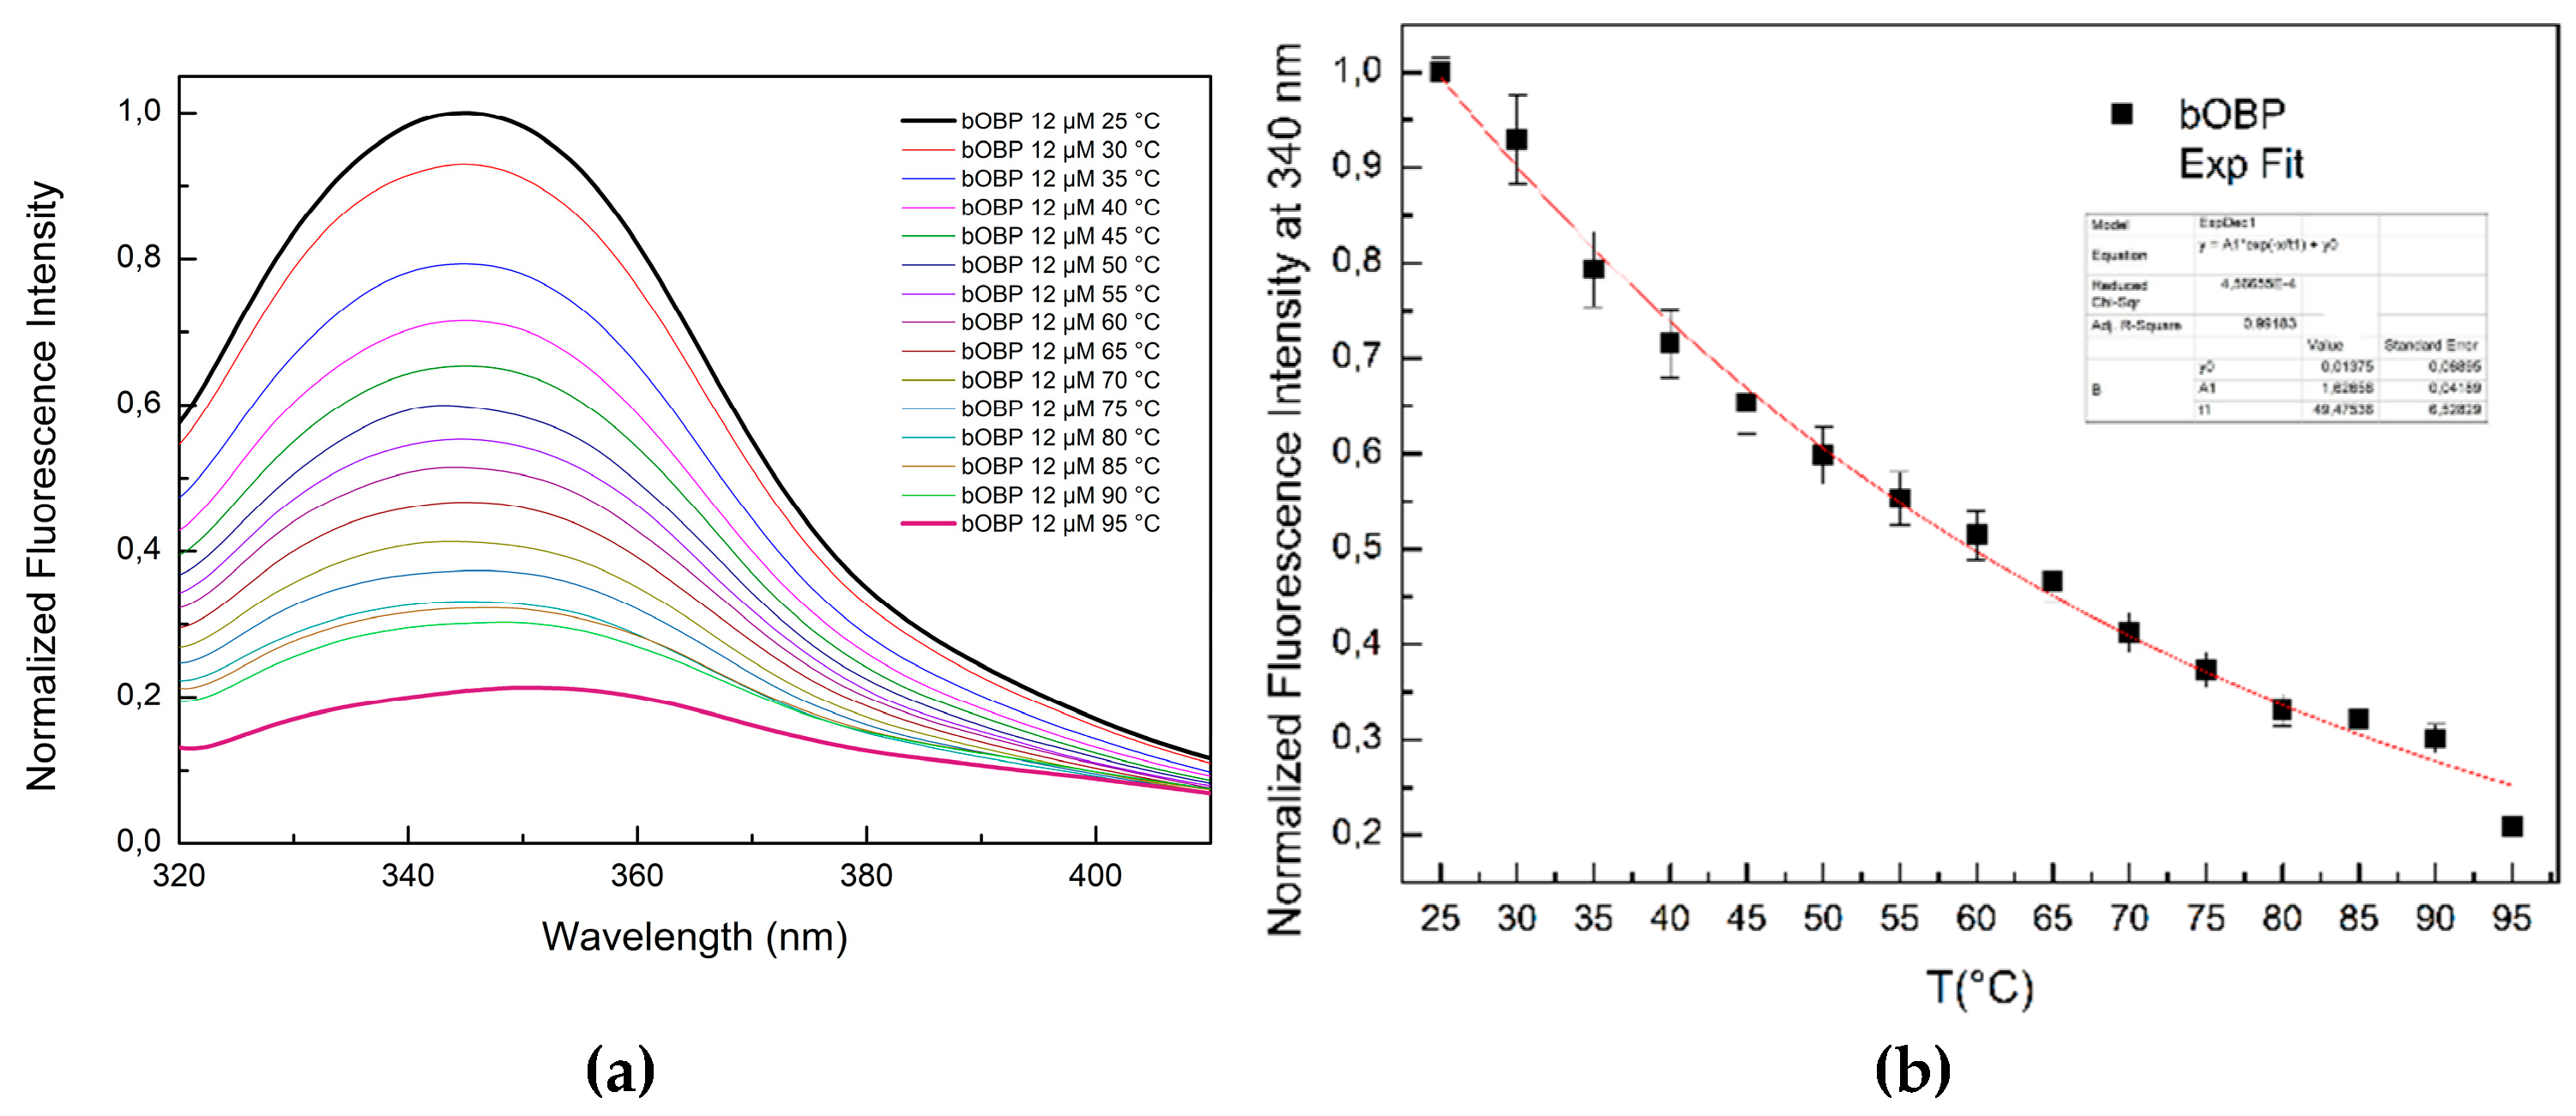
Figure 8.
Fitting curves of fluorescence emission intensity at 340 nm as a function of thermal de-naturation of pOBP (a) and bOBP (b) between 25 °C and 95 °C with saturating concentrations of 1-pentanol, 1-octen-3-ol and 2-butanone.
Figure 8.
Fitting curves of fluorescence emission intensity at 340 nm as a function of thermal de-naturation of pOBP (a) and bOBP (b) between 25 °C and 95 °C with saturating concentrations of 1-pentanol, 1-octen-3-ol and 2-butanone.
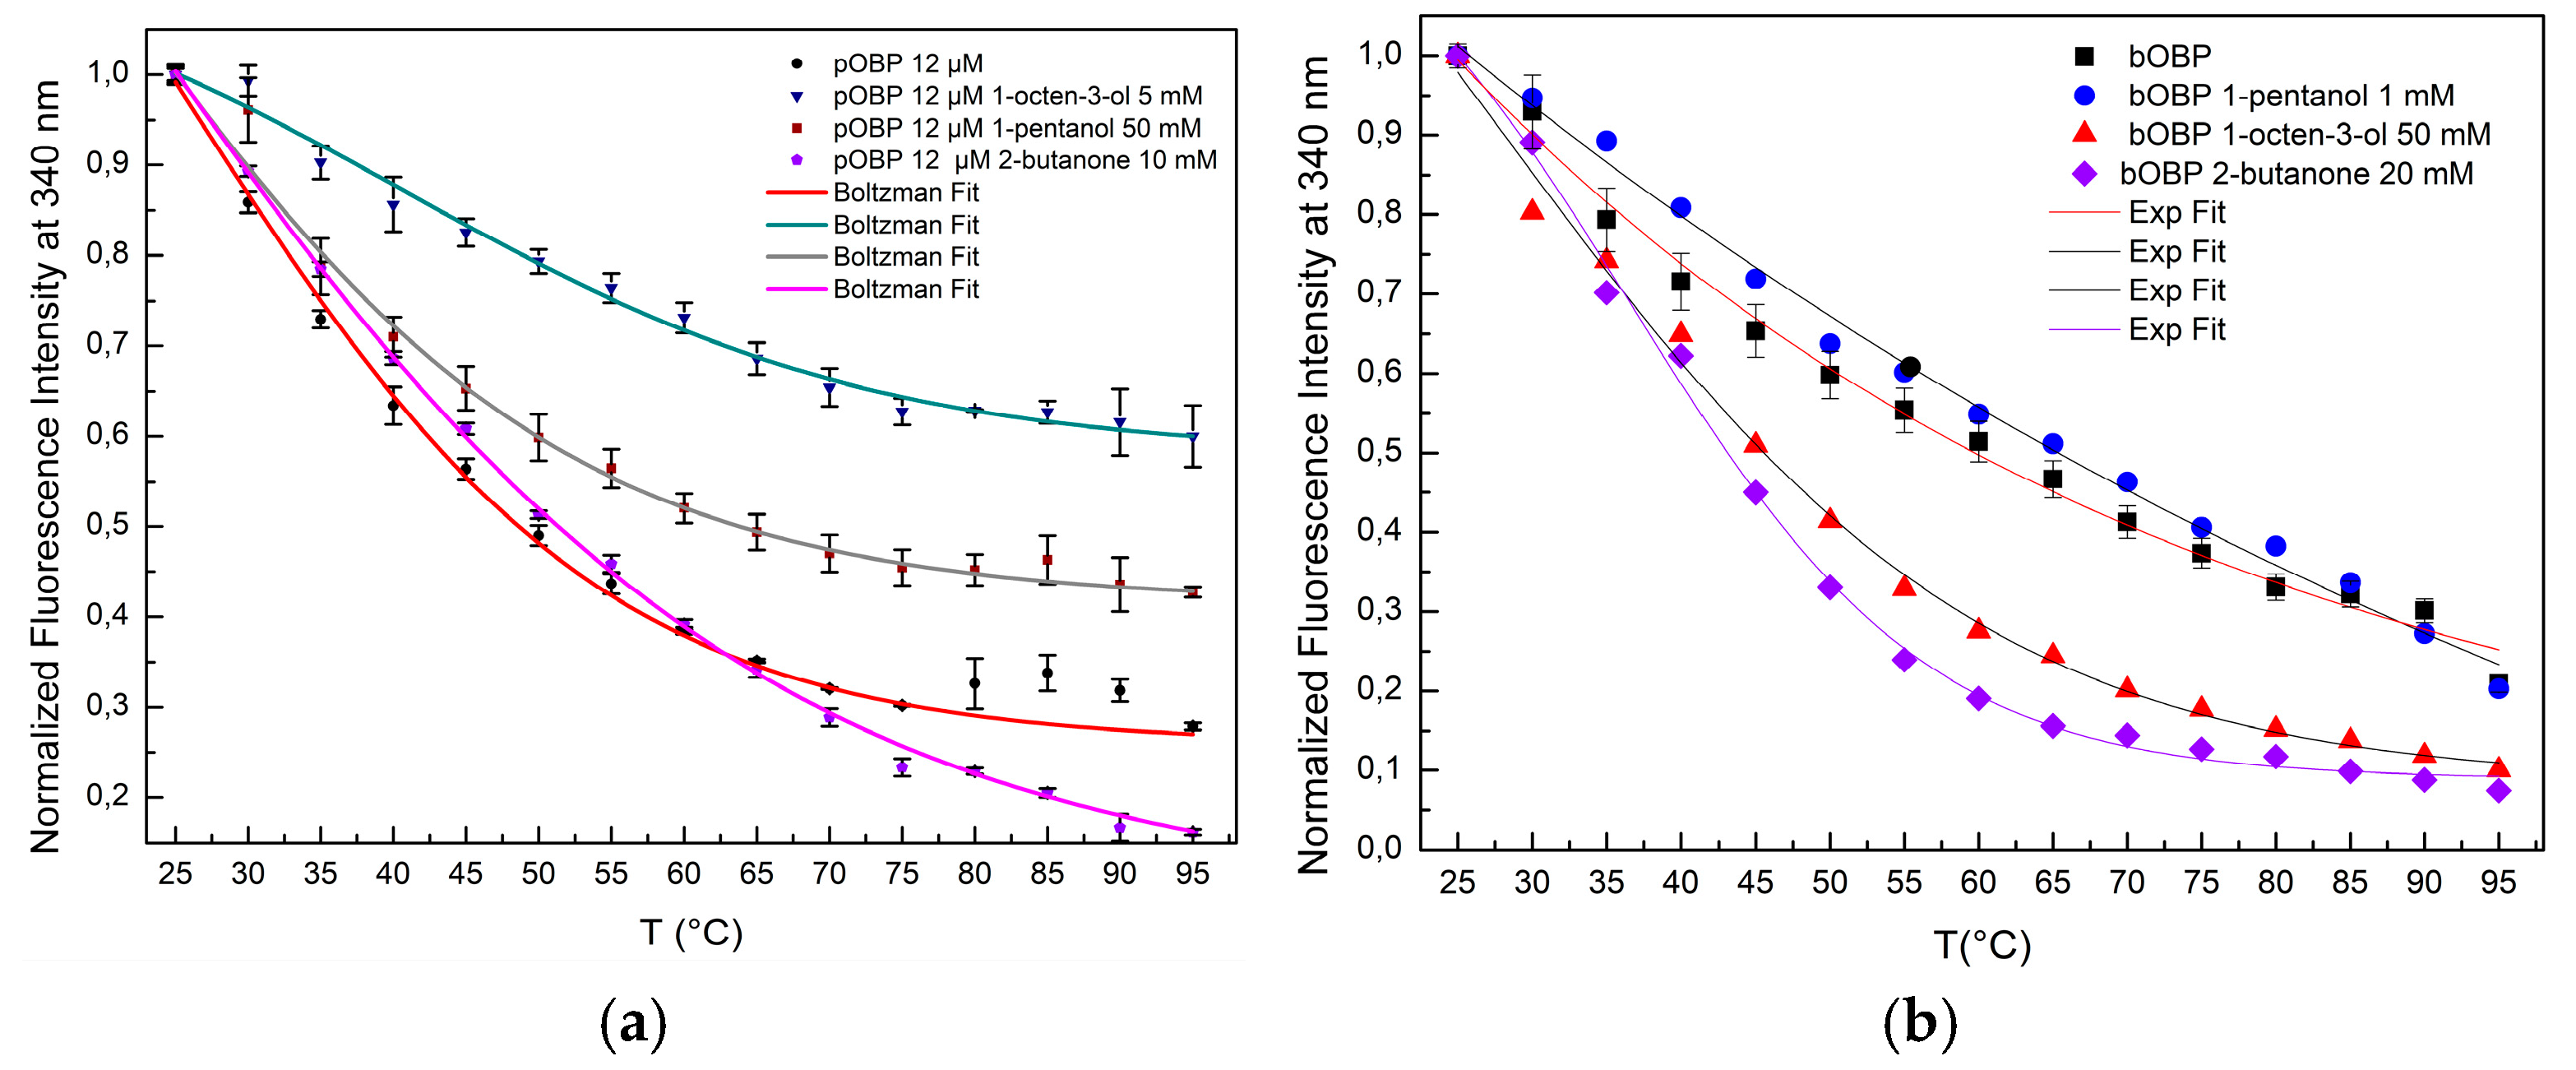
Figure 9.
(a) Fluorescence emission spectra of pOBP at increasing concentration of acrylamide (0,1 M, 0,2 M, 0,3 M, 0,4 M, 0,5 M); (b) Stern-Volmer plot of the fluorescence quenching of pOBP as a function of the increasing acrylamide concentration values.
Figure 9.
(a) Fluorescence emission spectra of pOBP at increasing concentration of acrylamide (0,1 M, 0,2 M, 0,3 M, 0,4 M, 0,5 M); (b) Stern-Volmer plot of the fluorescence quenching of pOBP as a function of the increasing acrylamide concentration values.
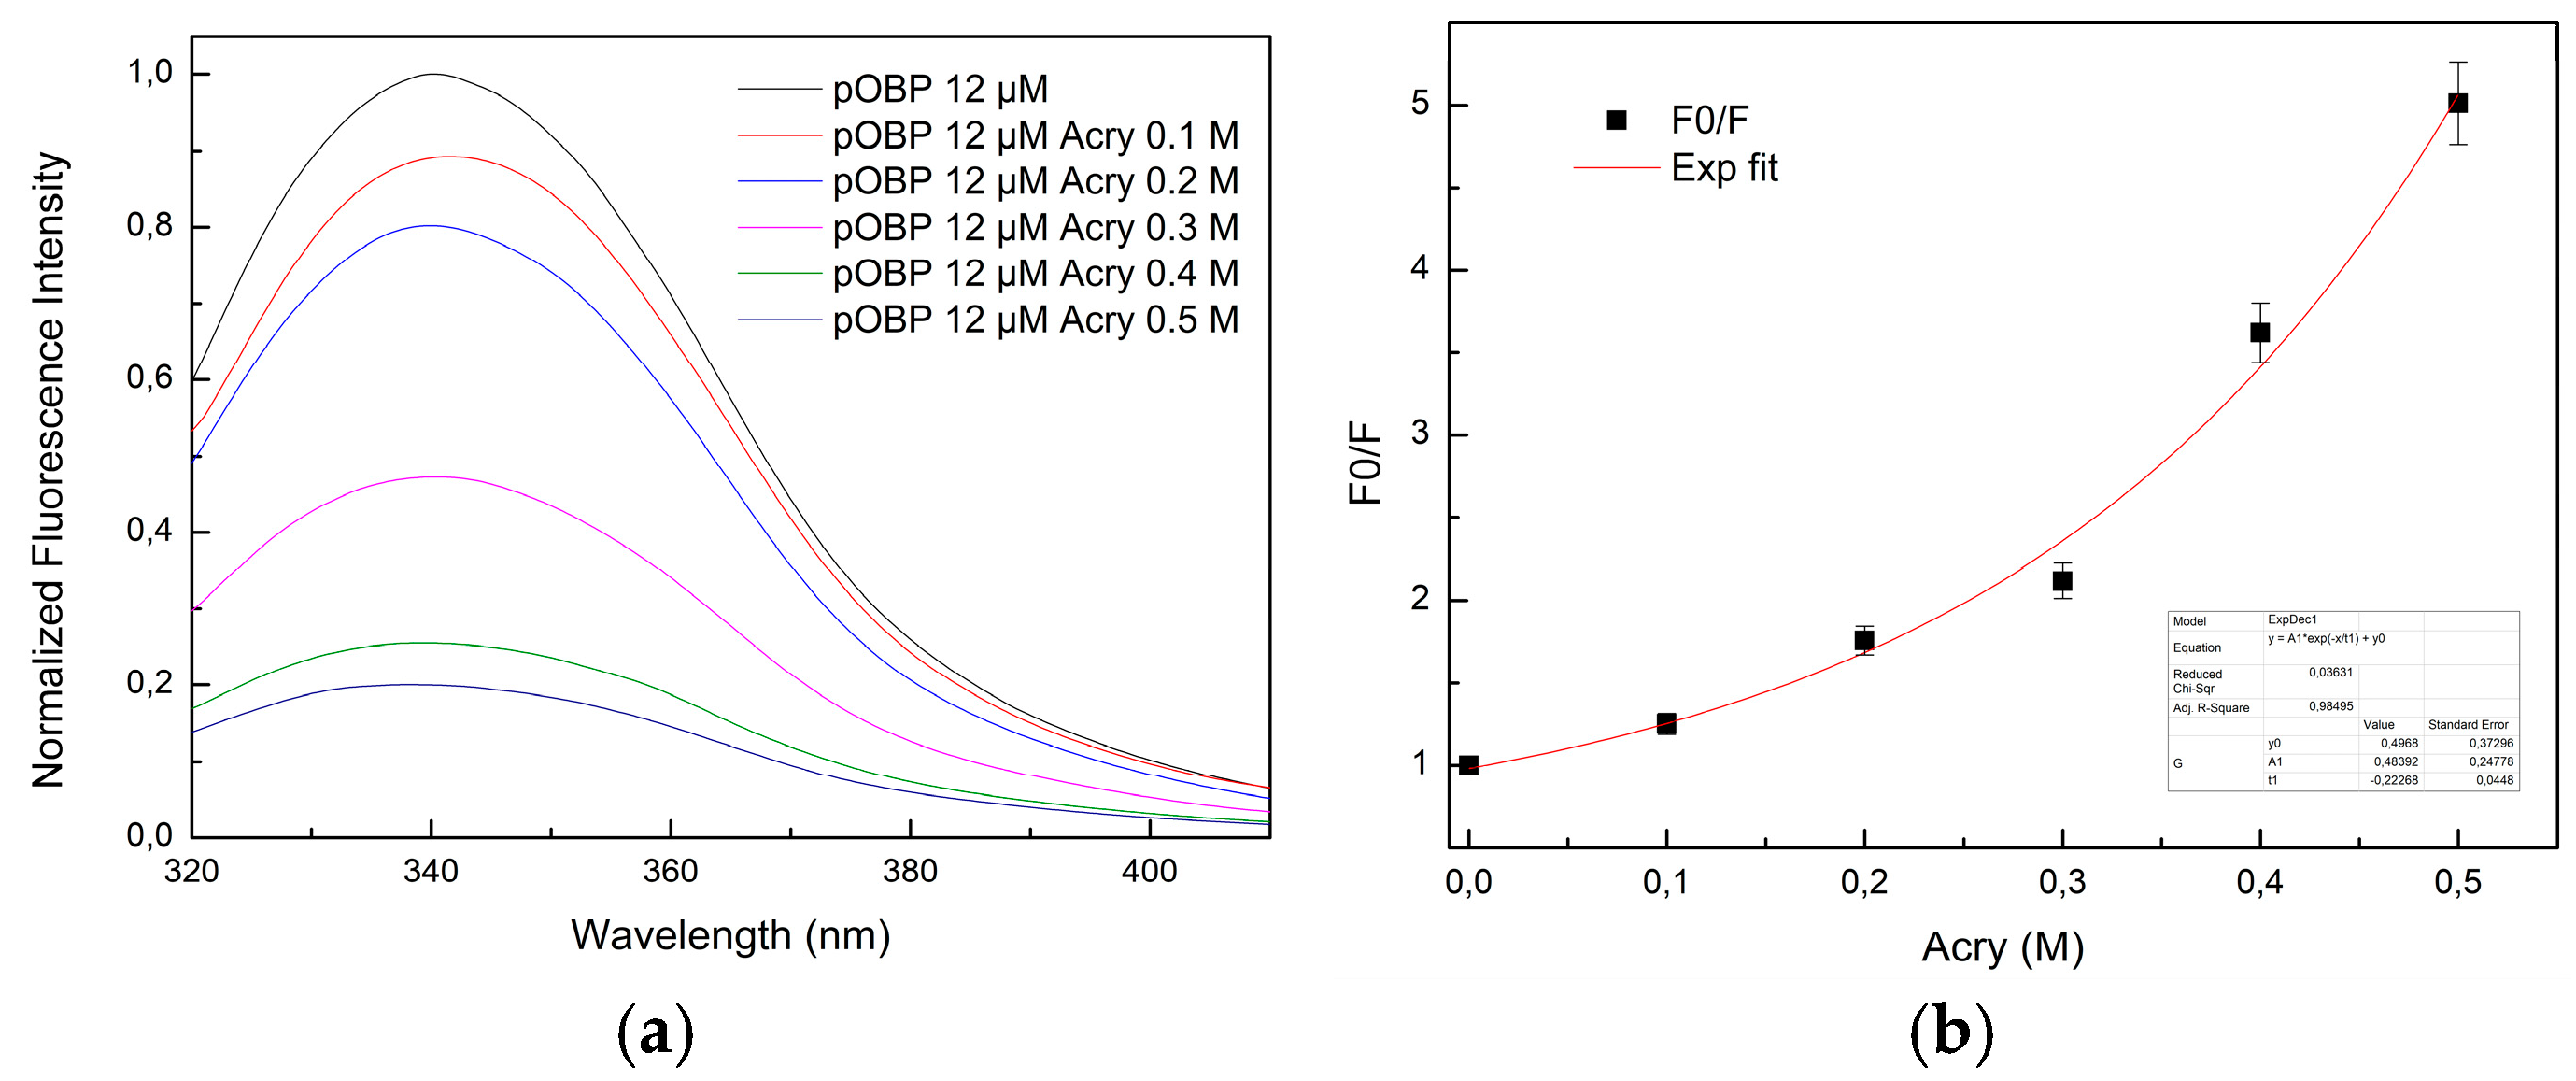
Figure 10.
(a) Fluorescence emission spectra of bOBP at increasing concentration of acrylamide (0,1 M, 0,2 M, 0,3 M, 0,4 M, 0,5 M); (b) Stern-Volmer plot of the fluorescence quenching of the bOBP as a function of increasing acrylamide concentration values.
Figure 10.
(a) Fluorescence emission spectra of bOBP at increasing concentration of acrylamide (0,1 M, 0,2 M, 0,3 M, 0,4 M, 0,5 M); (b) Stern-Volmer plot of the fluorescence quenching of the bOBP as a function of increasing acrylamide concentration values.
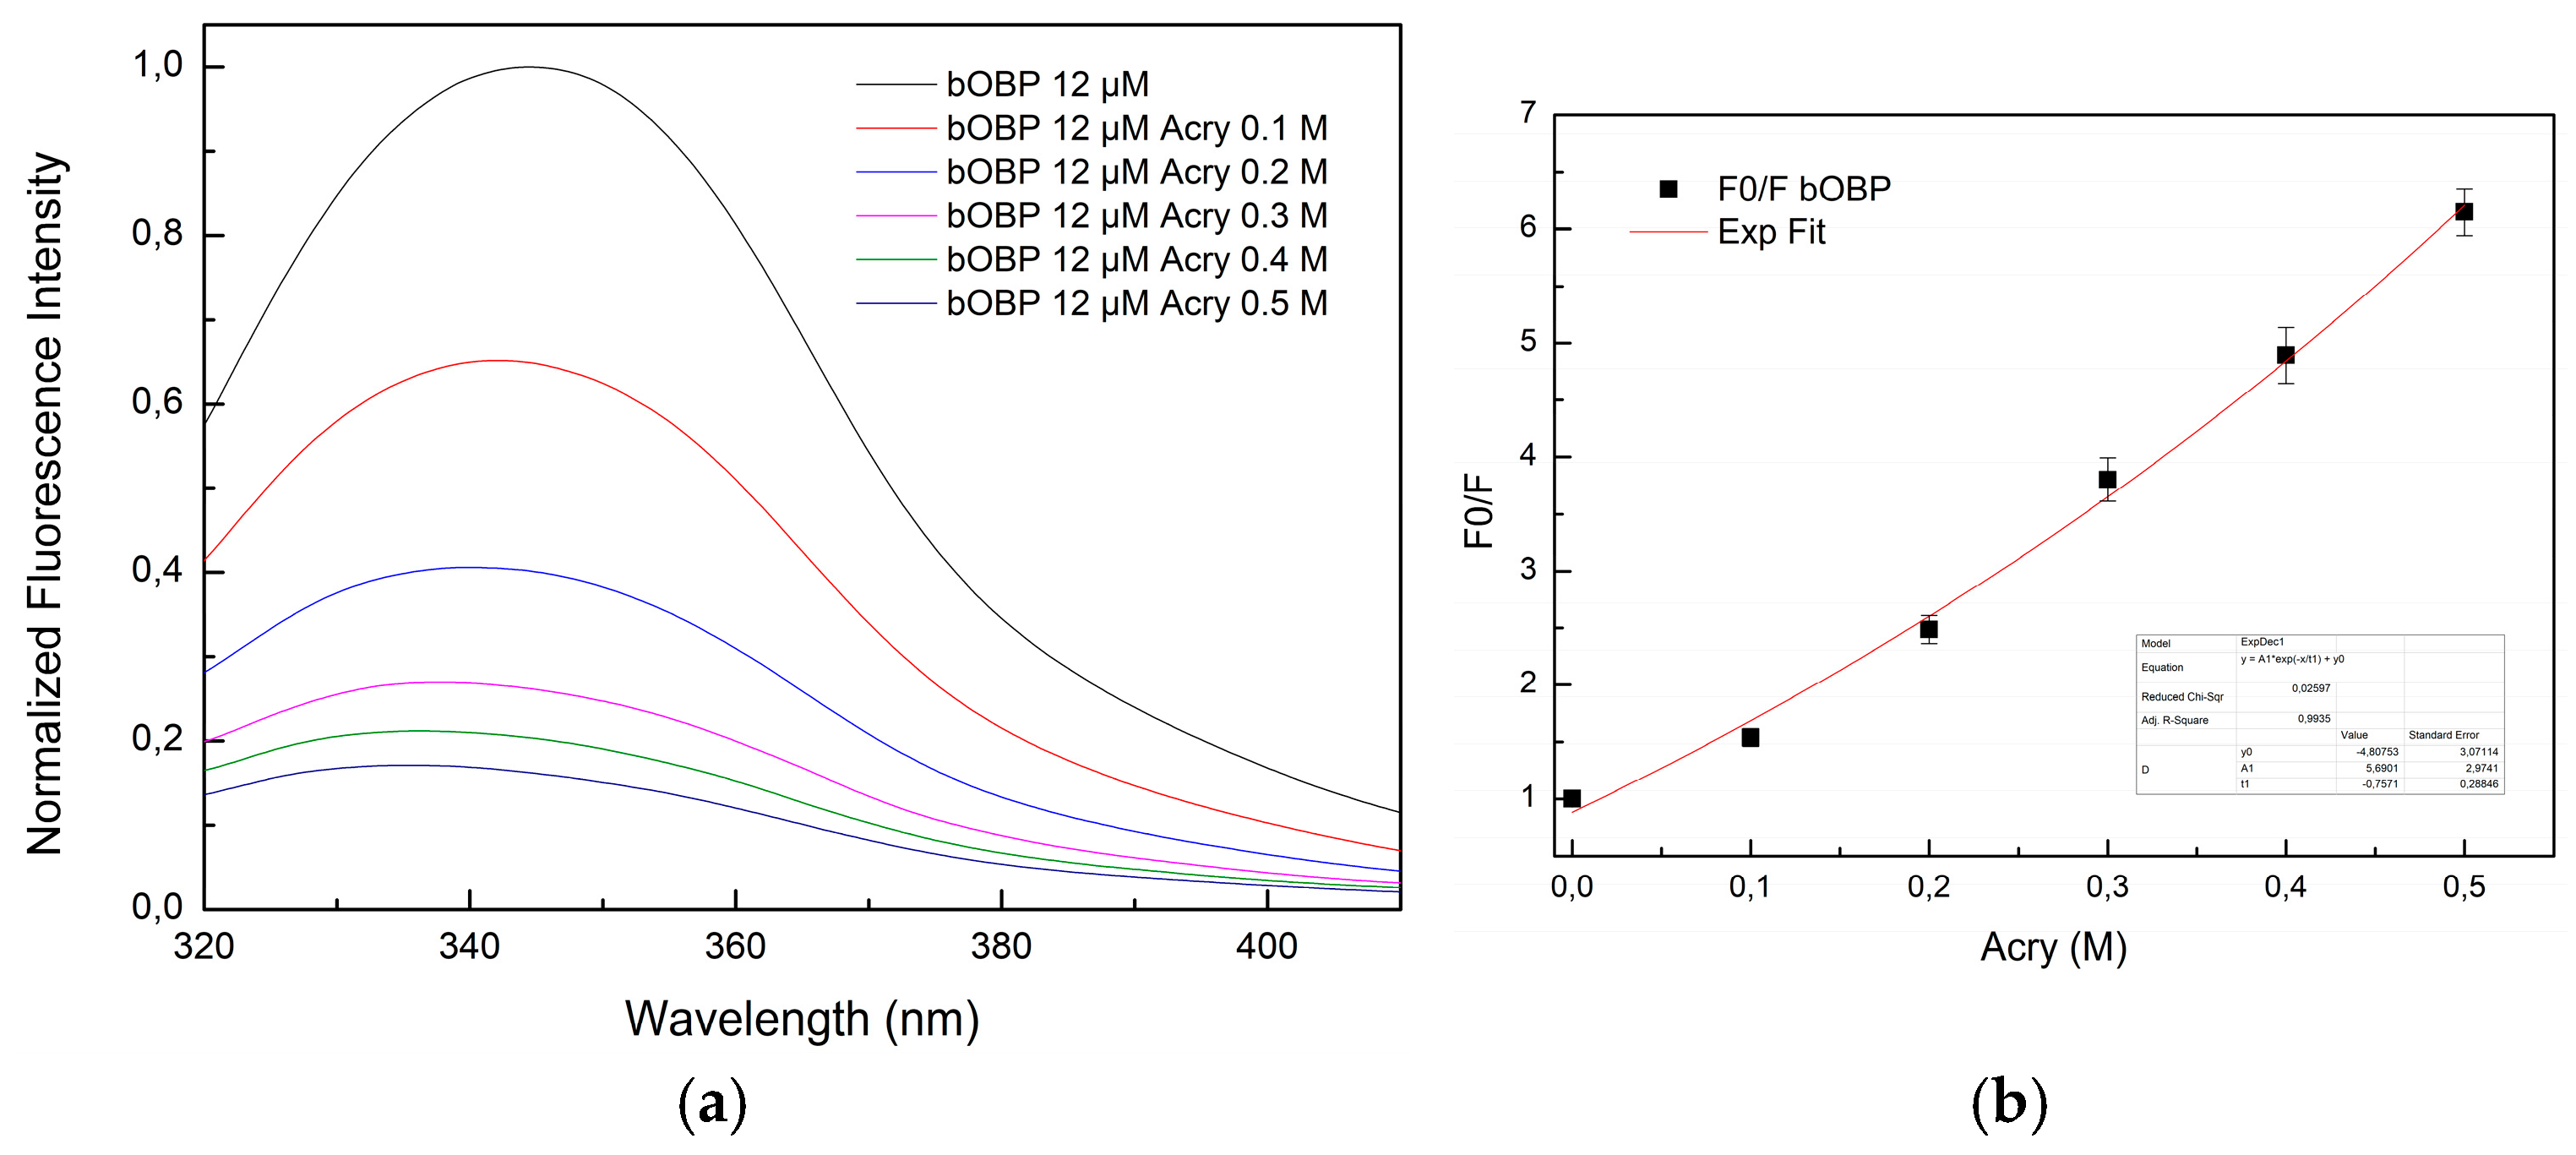
Figure 11.
Comparison of Total Ion Chromatograms (TICs) of 2-butanone in the presence of PBS (black line), pOBP (blue line), and BSA (red line), with the inclusion of an internal standard. The TICs highlight the differences in the binding affinities and interaction profiles of 2-butanone with each of the tested proteins, indicating the potential for enhanced sensitivity in detection with pOBP compared to BSA and PBS.
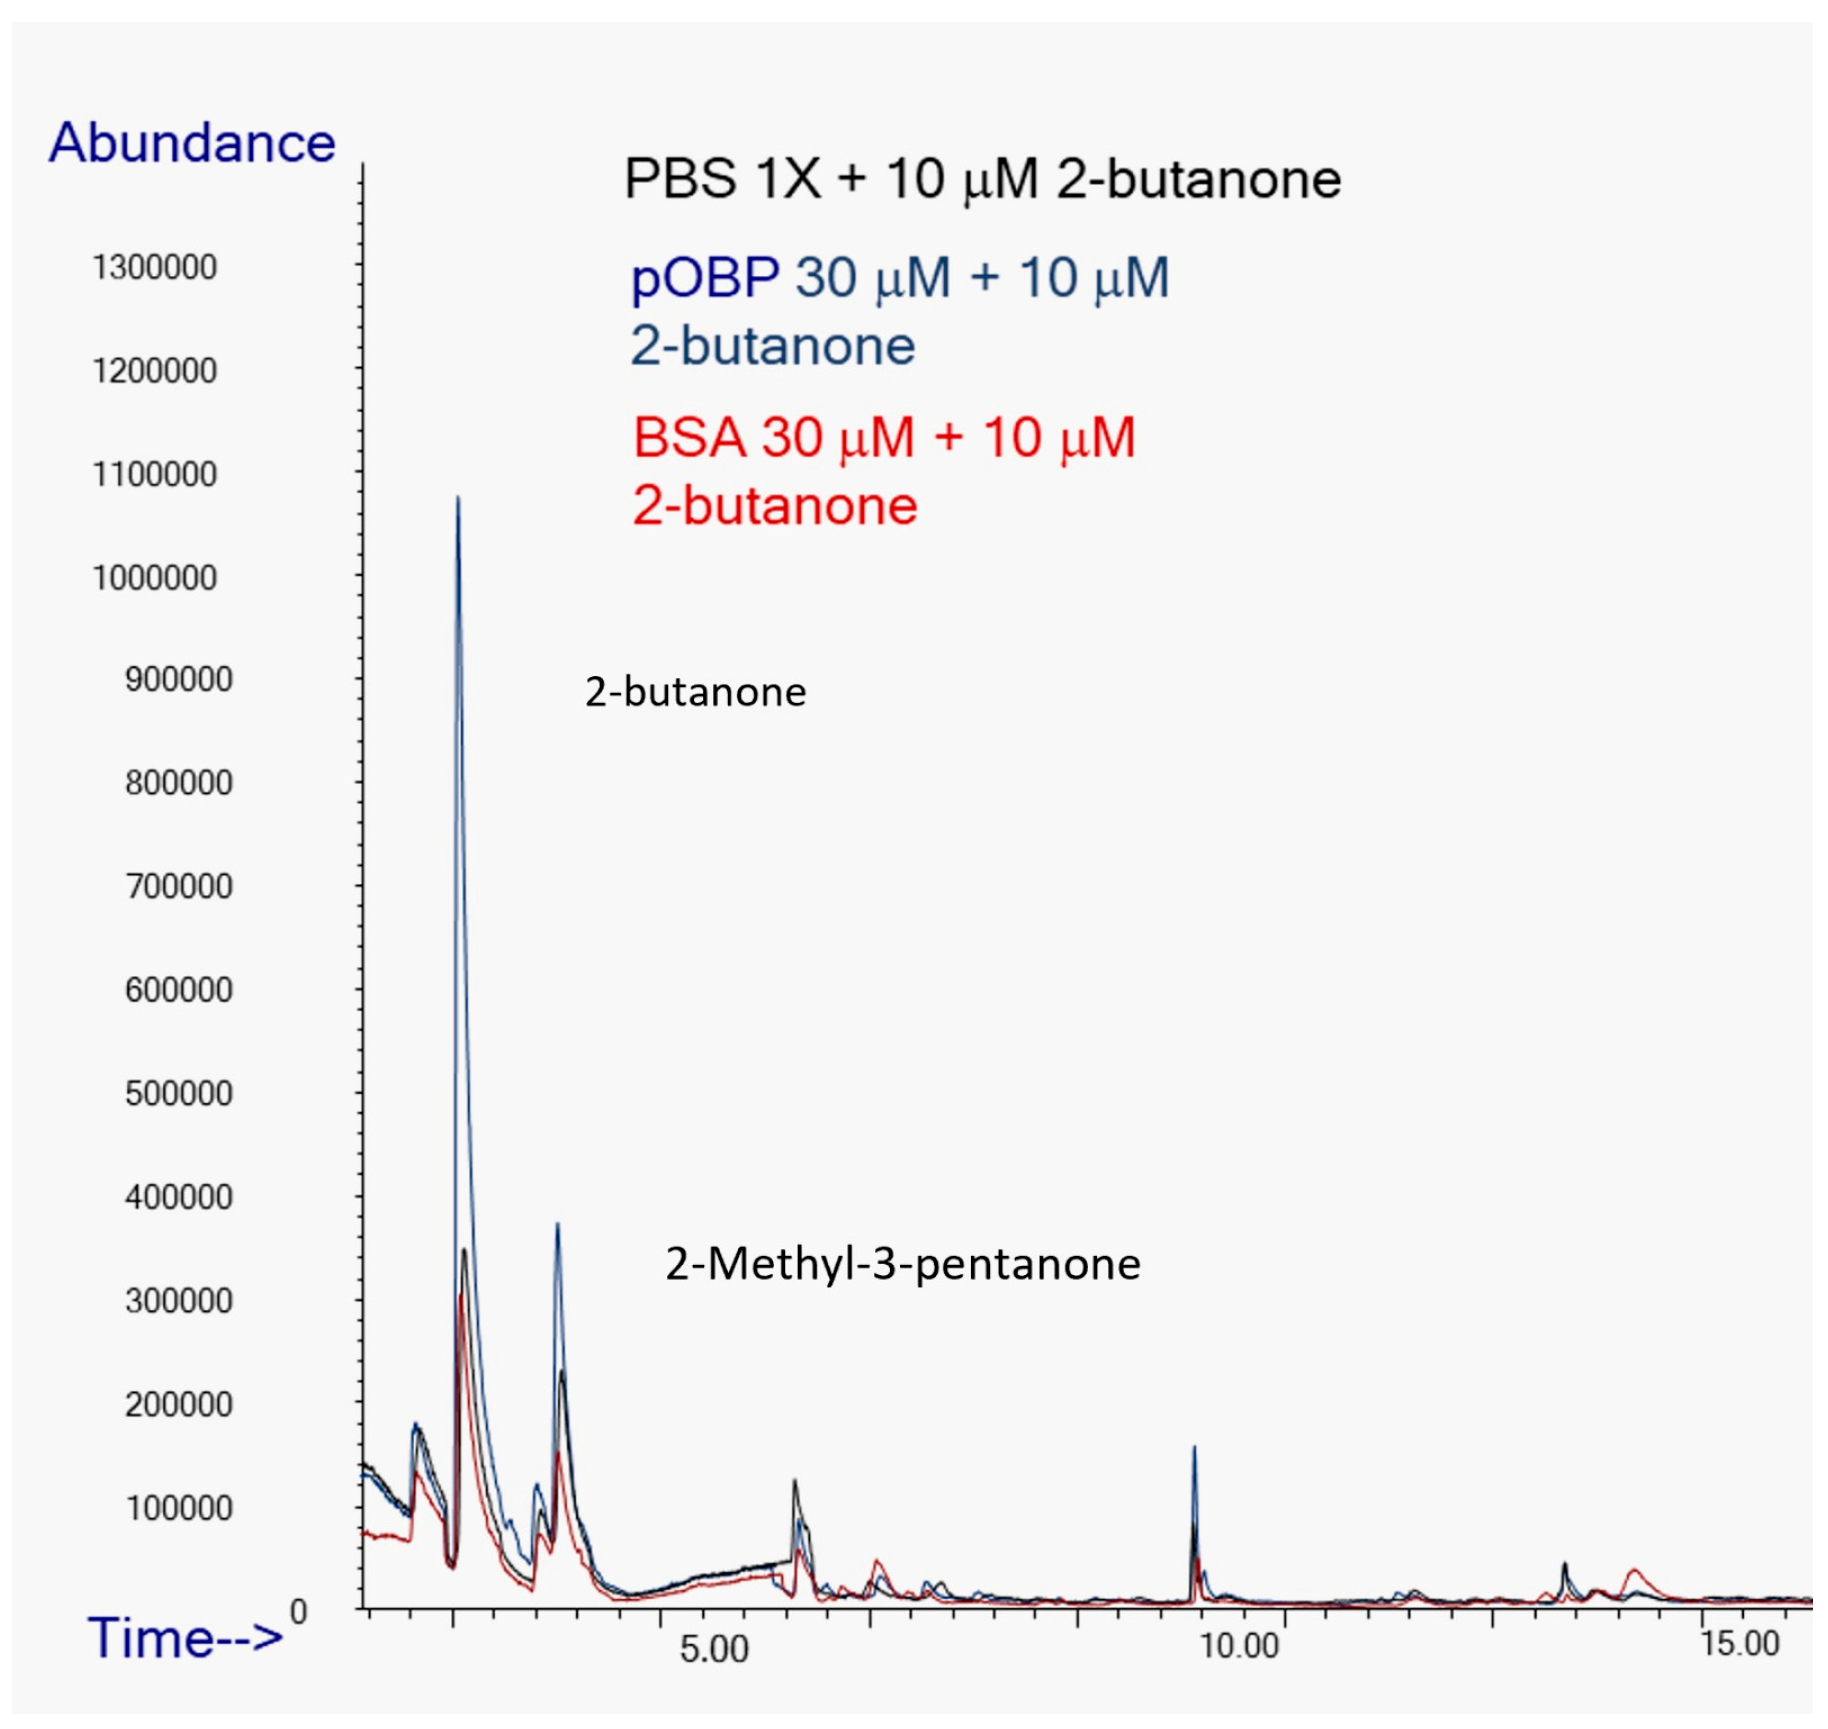
Figure 12.
Comparison of Total Ion Chromatograms (TICs) of 1-octen-3-ol in the presence of PBS (black line), pOBP (blue line), and BSA (red line), with the inclusion of an internal standard. The TICs highlight the differences in the binding affinities and interaction profiles of 1-octen-3-ol with each of the tested proteins, indicating the potential for enhanced sensitivity in detection with pOBP compared to BSA and PBS.
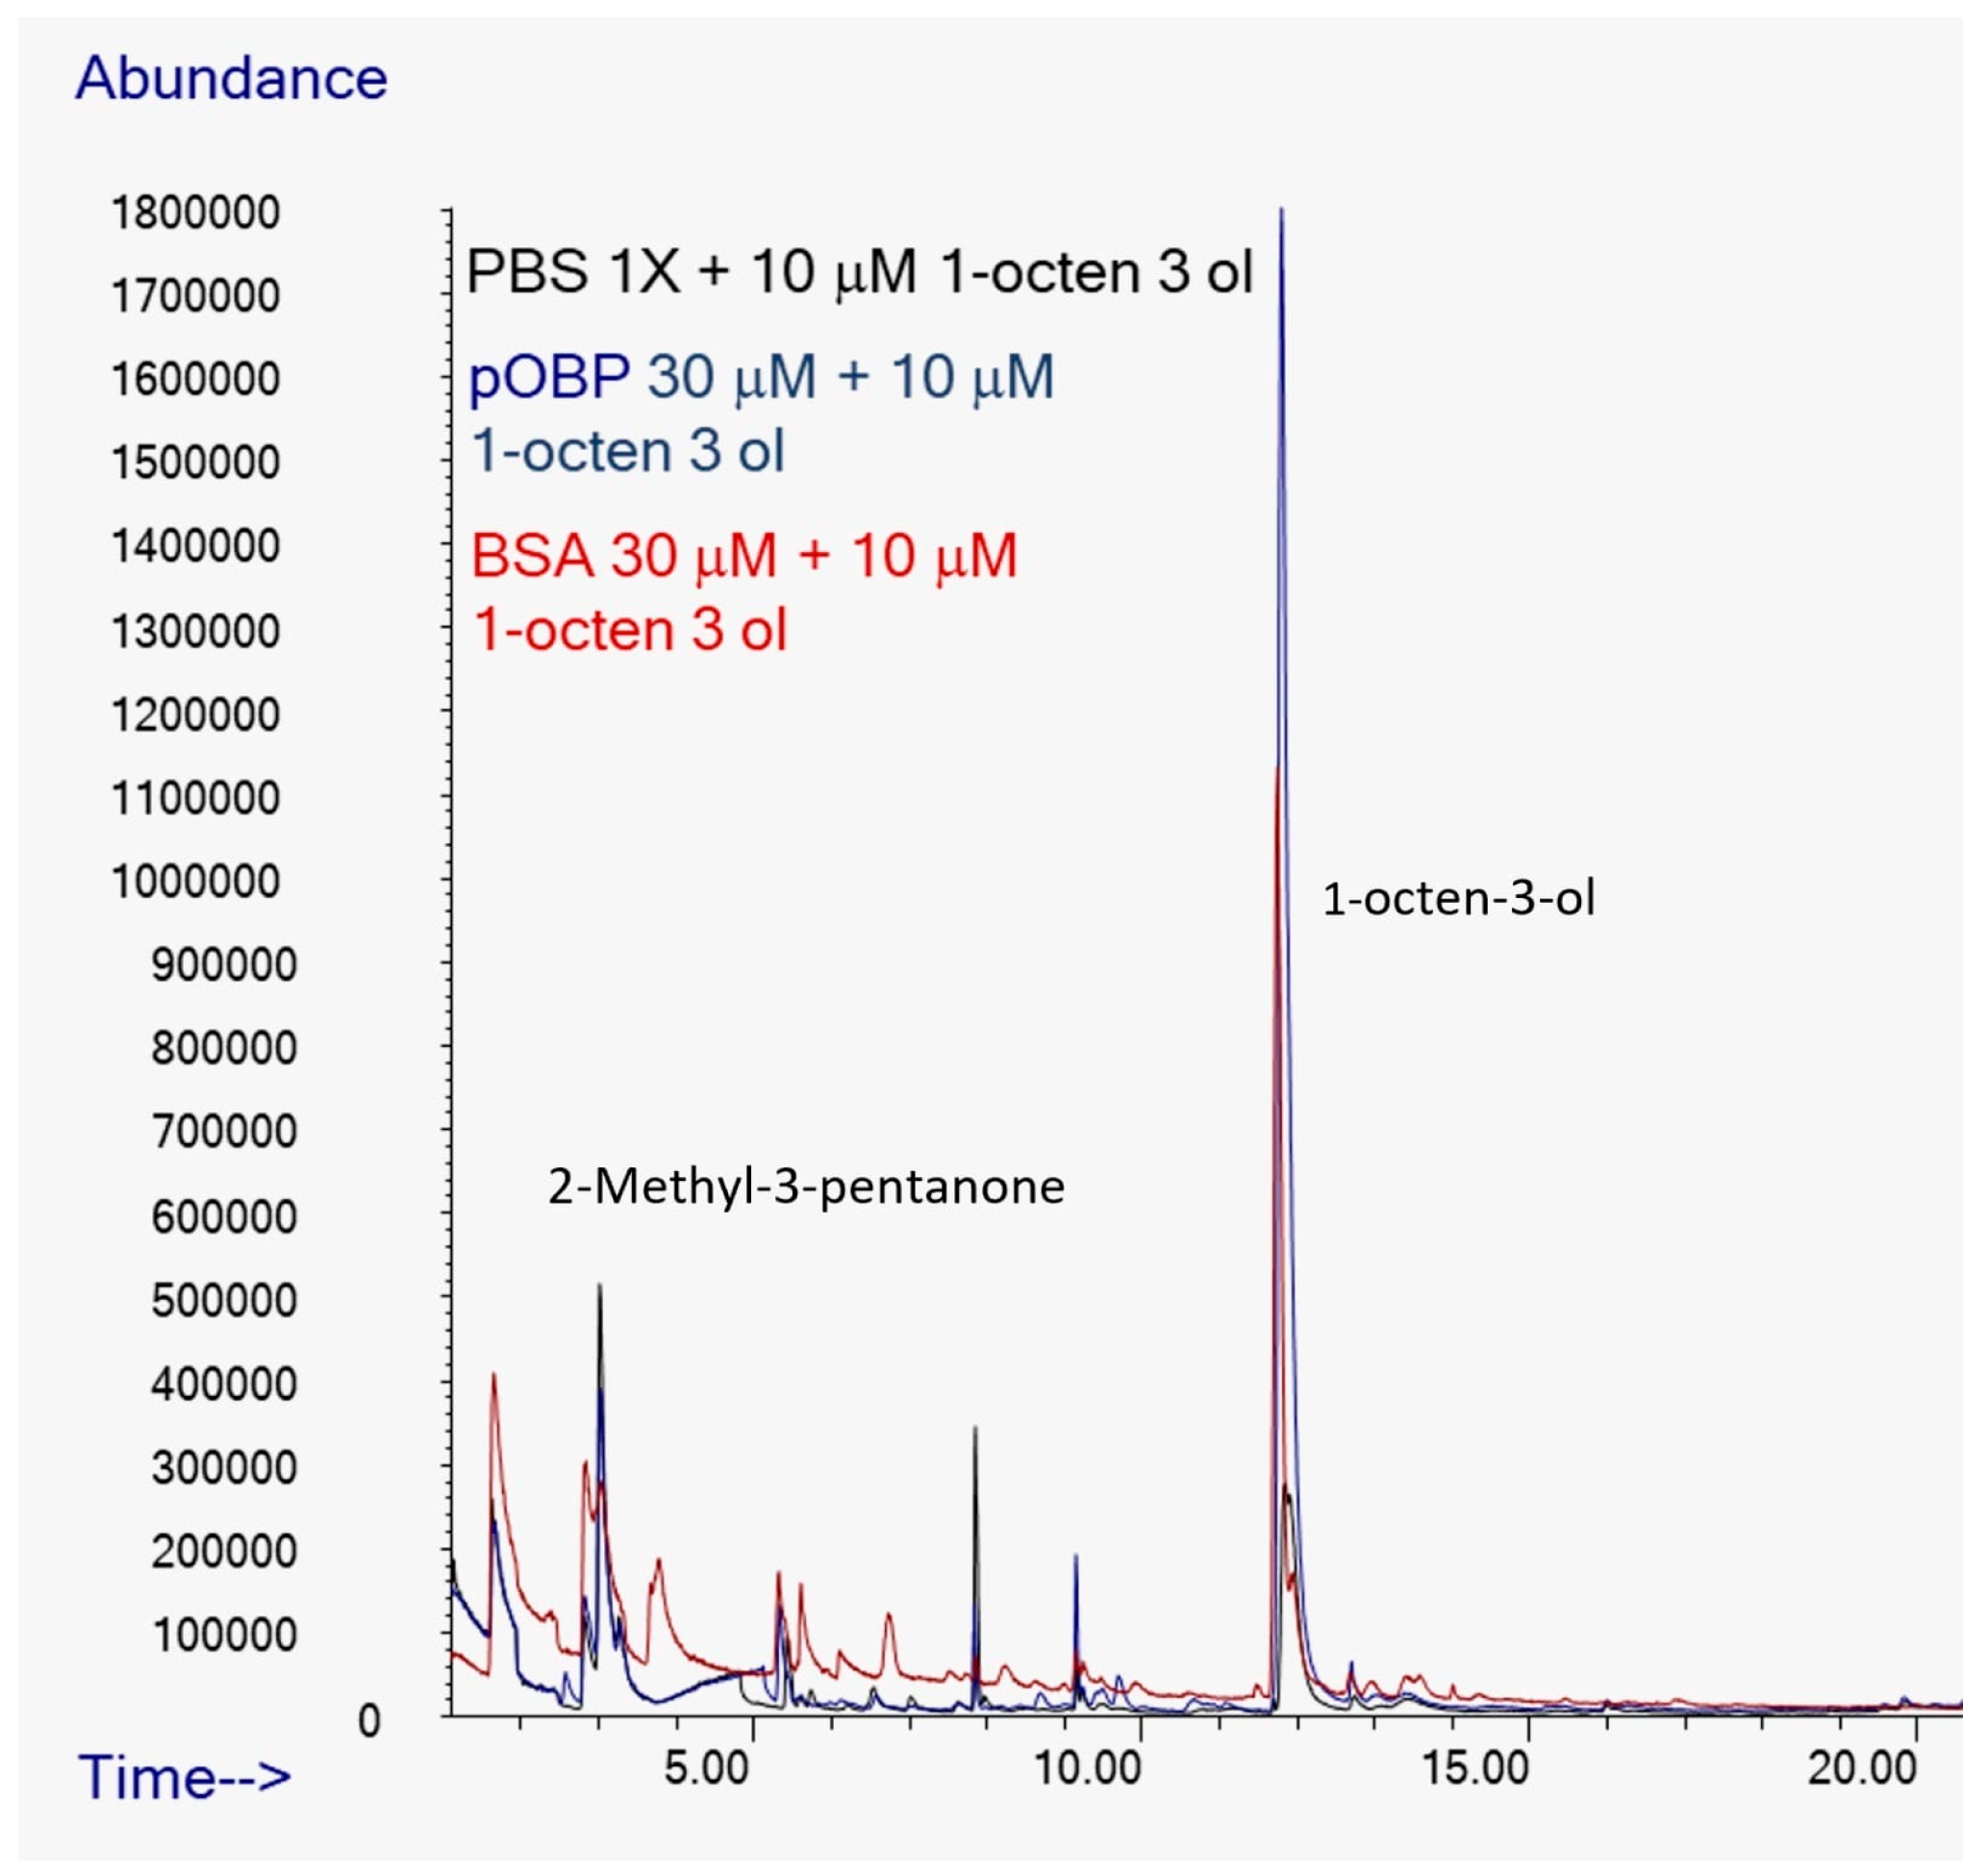
Figure 13.
Comparison of Total Ion Chromatograms (TICs) of 1-pentanol in the presence of PBS (black line), pOBP (blue line), and BSA (red line), with the inclusion of an internal standard. The TICs highlight the differences in the binding affinities and interaction profiles of 1-pentanol with each of the tested proteins, indicating the potential for enhanced sensitivity in detection with pOBP compared to BSA and PBS.
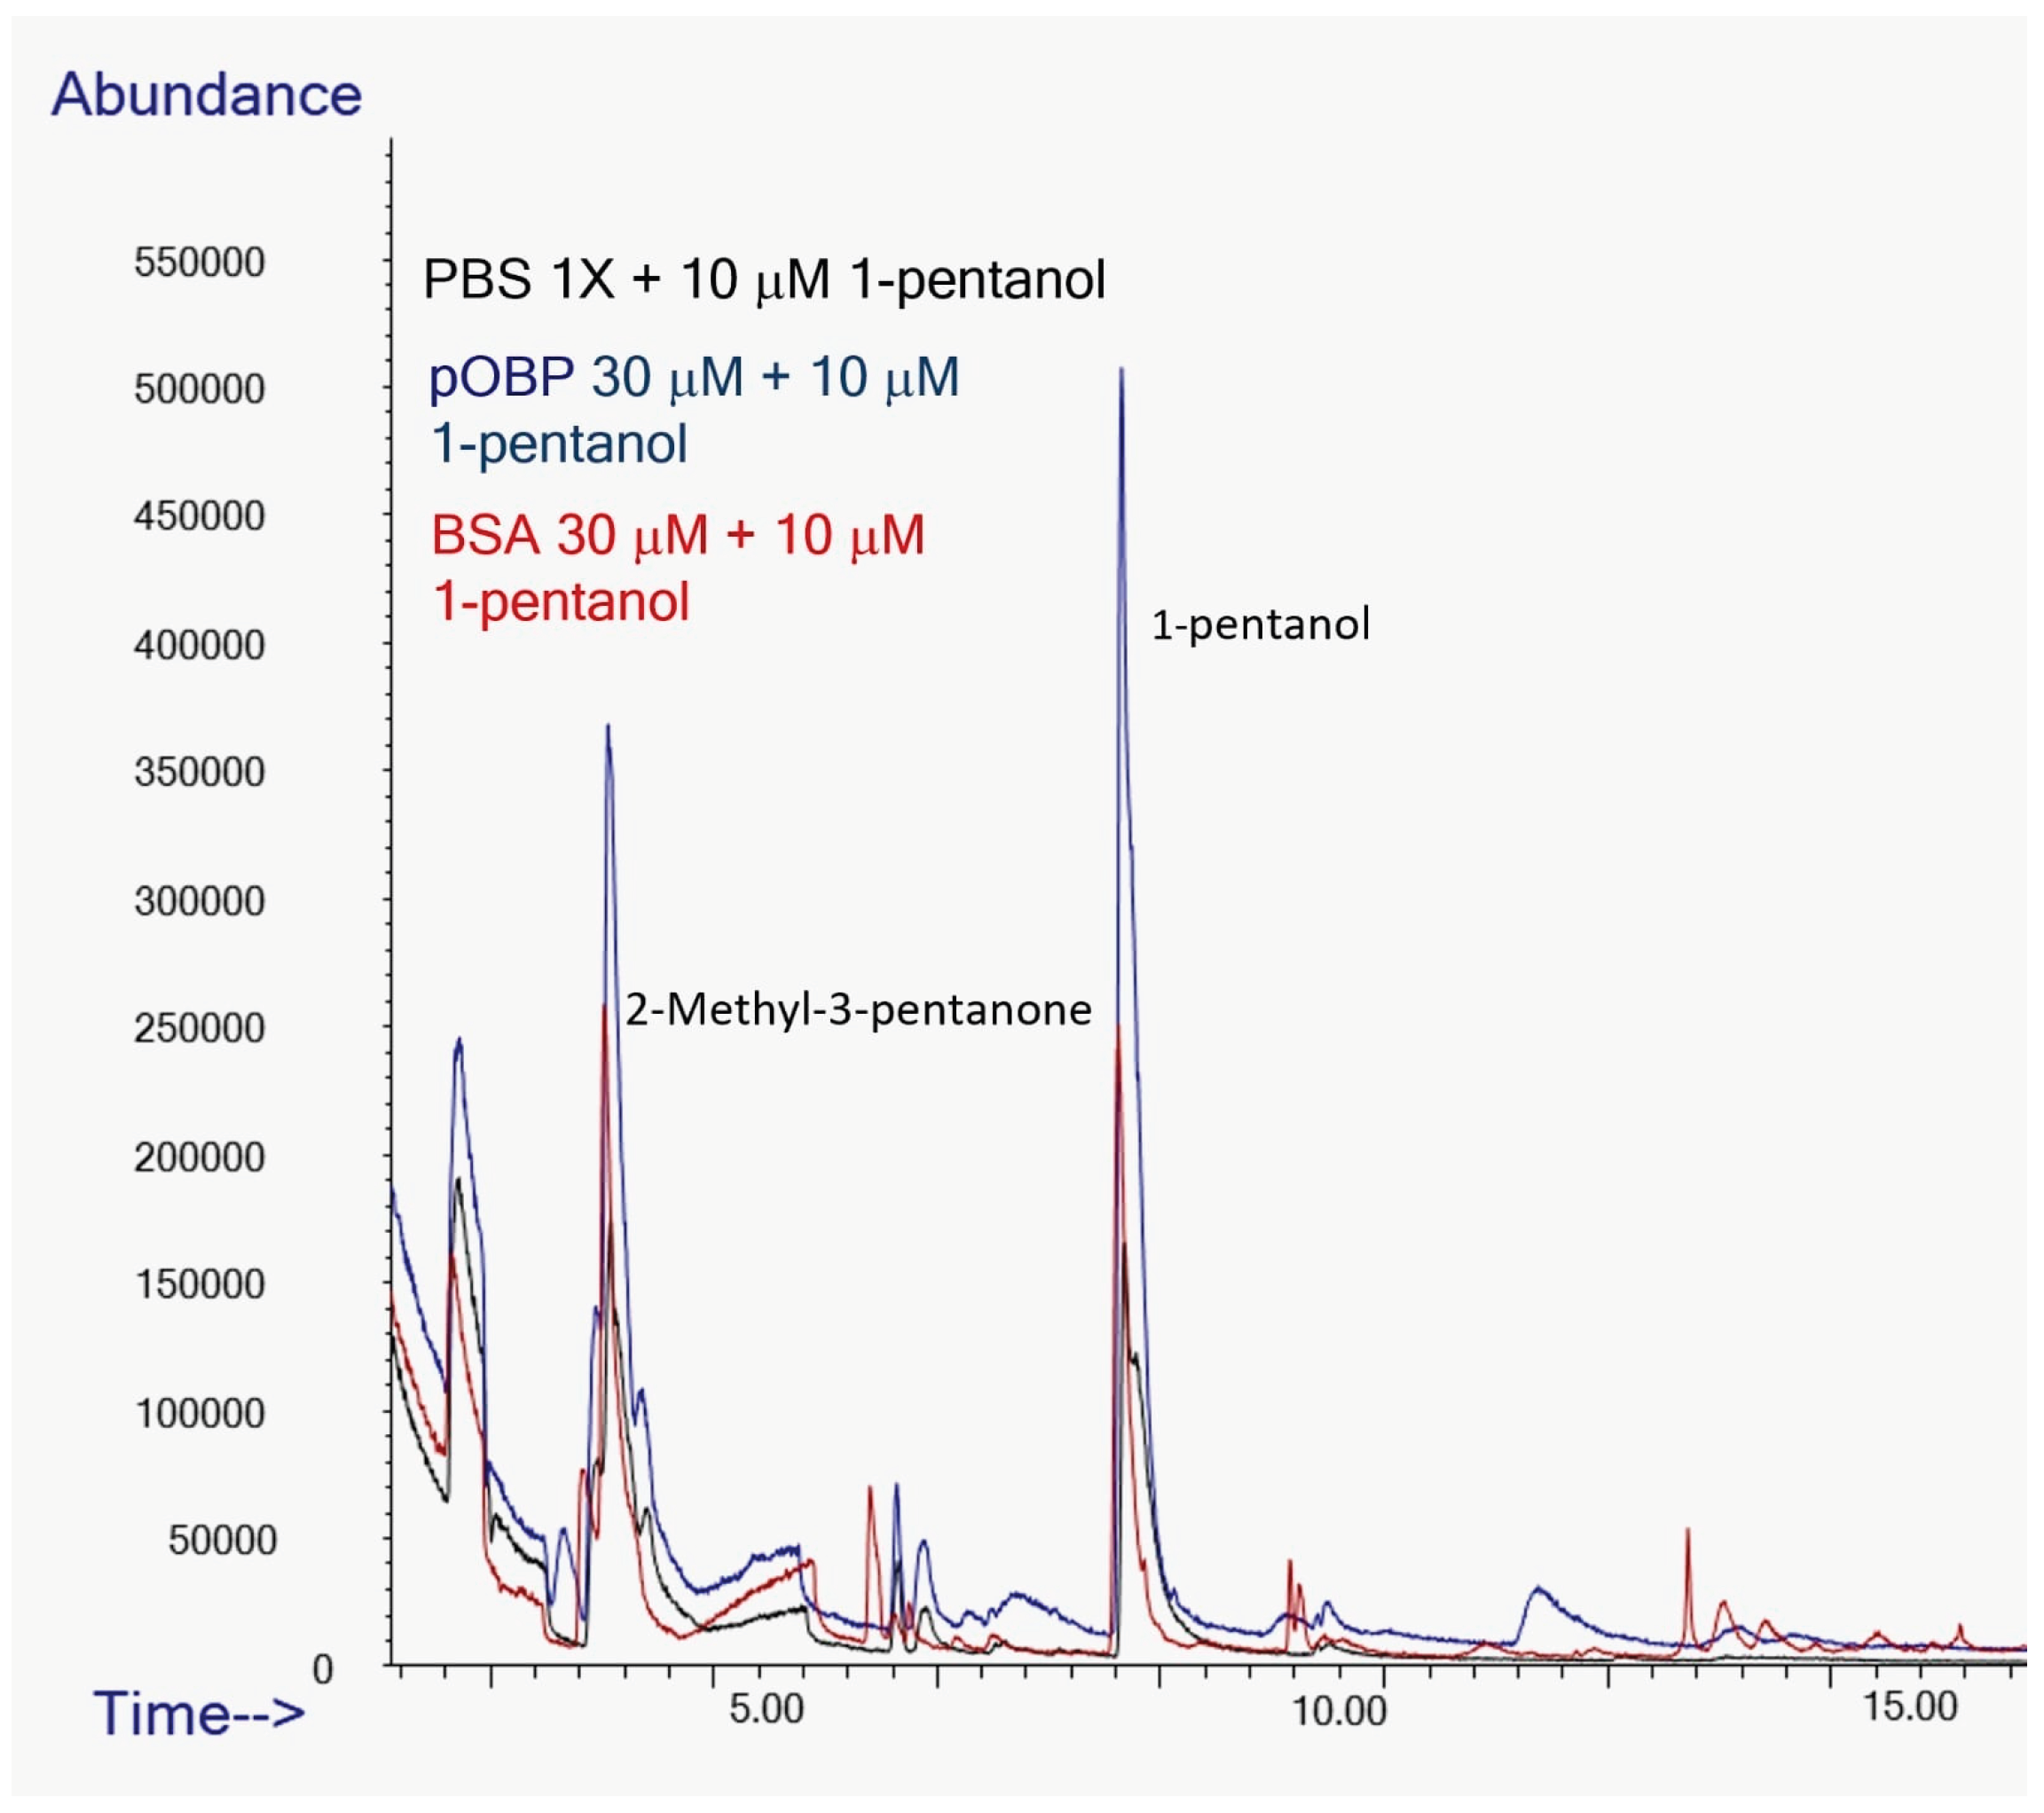
Figure 14.
The Impinger bubbling mechanism.
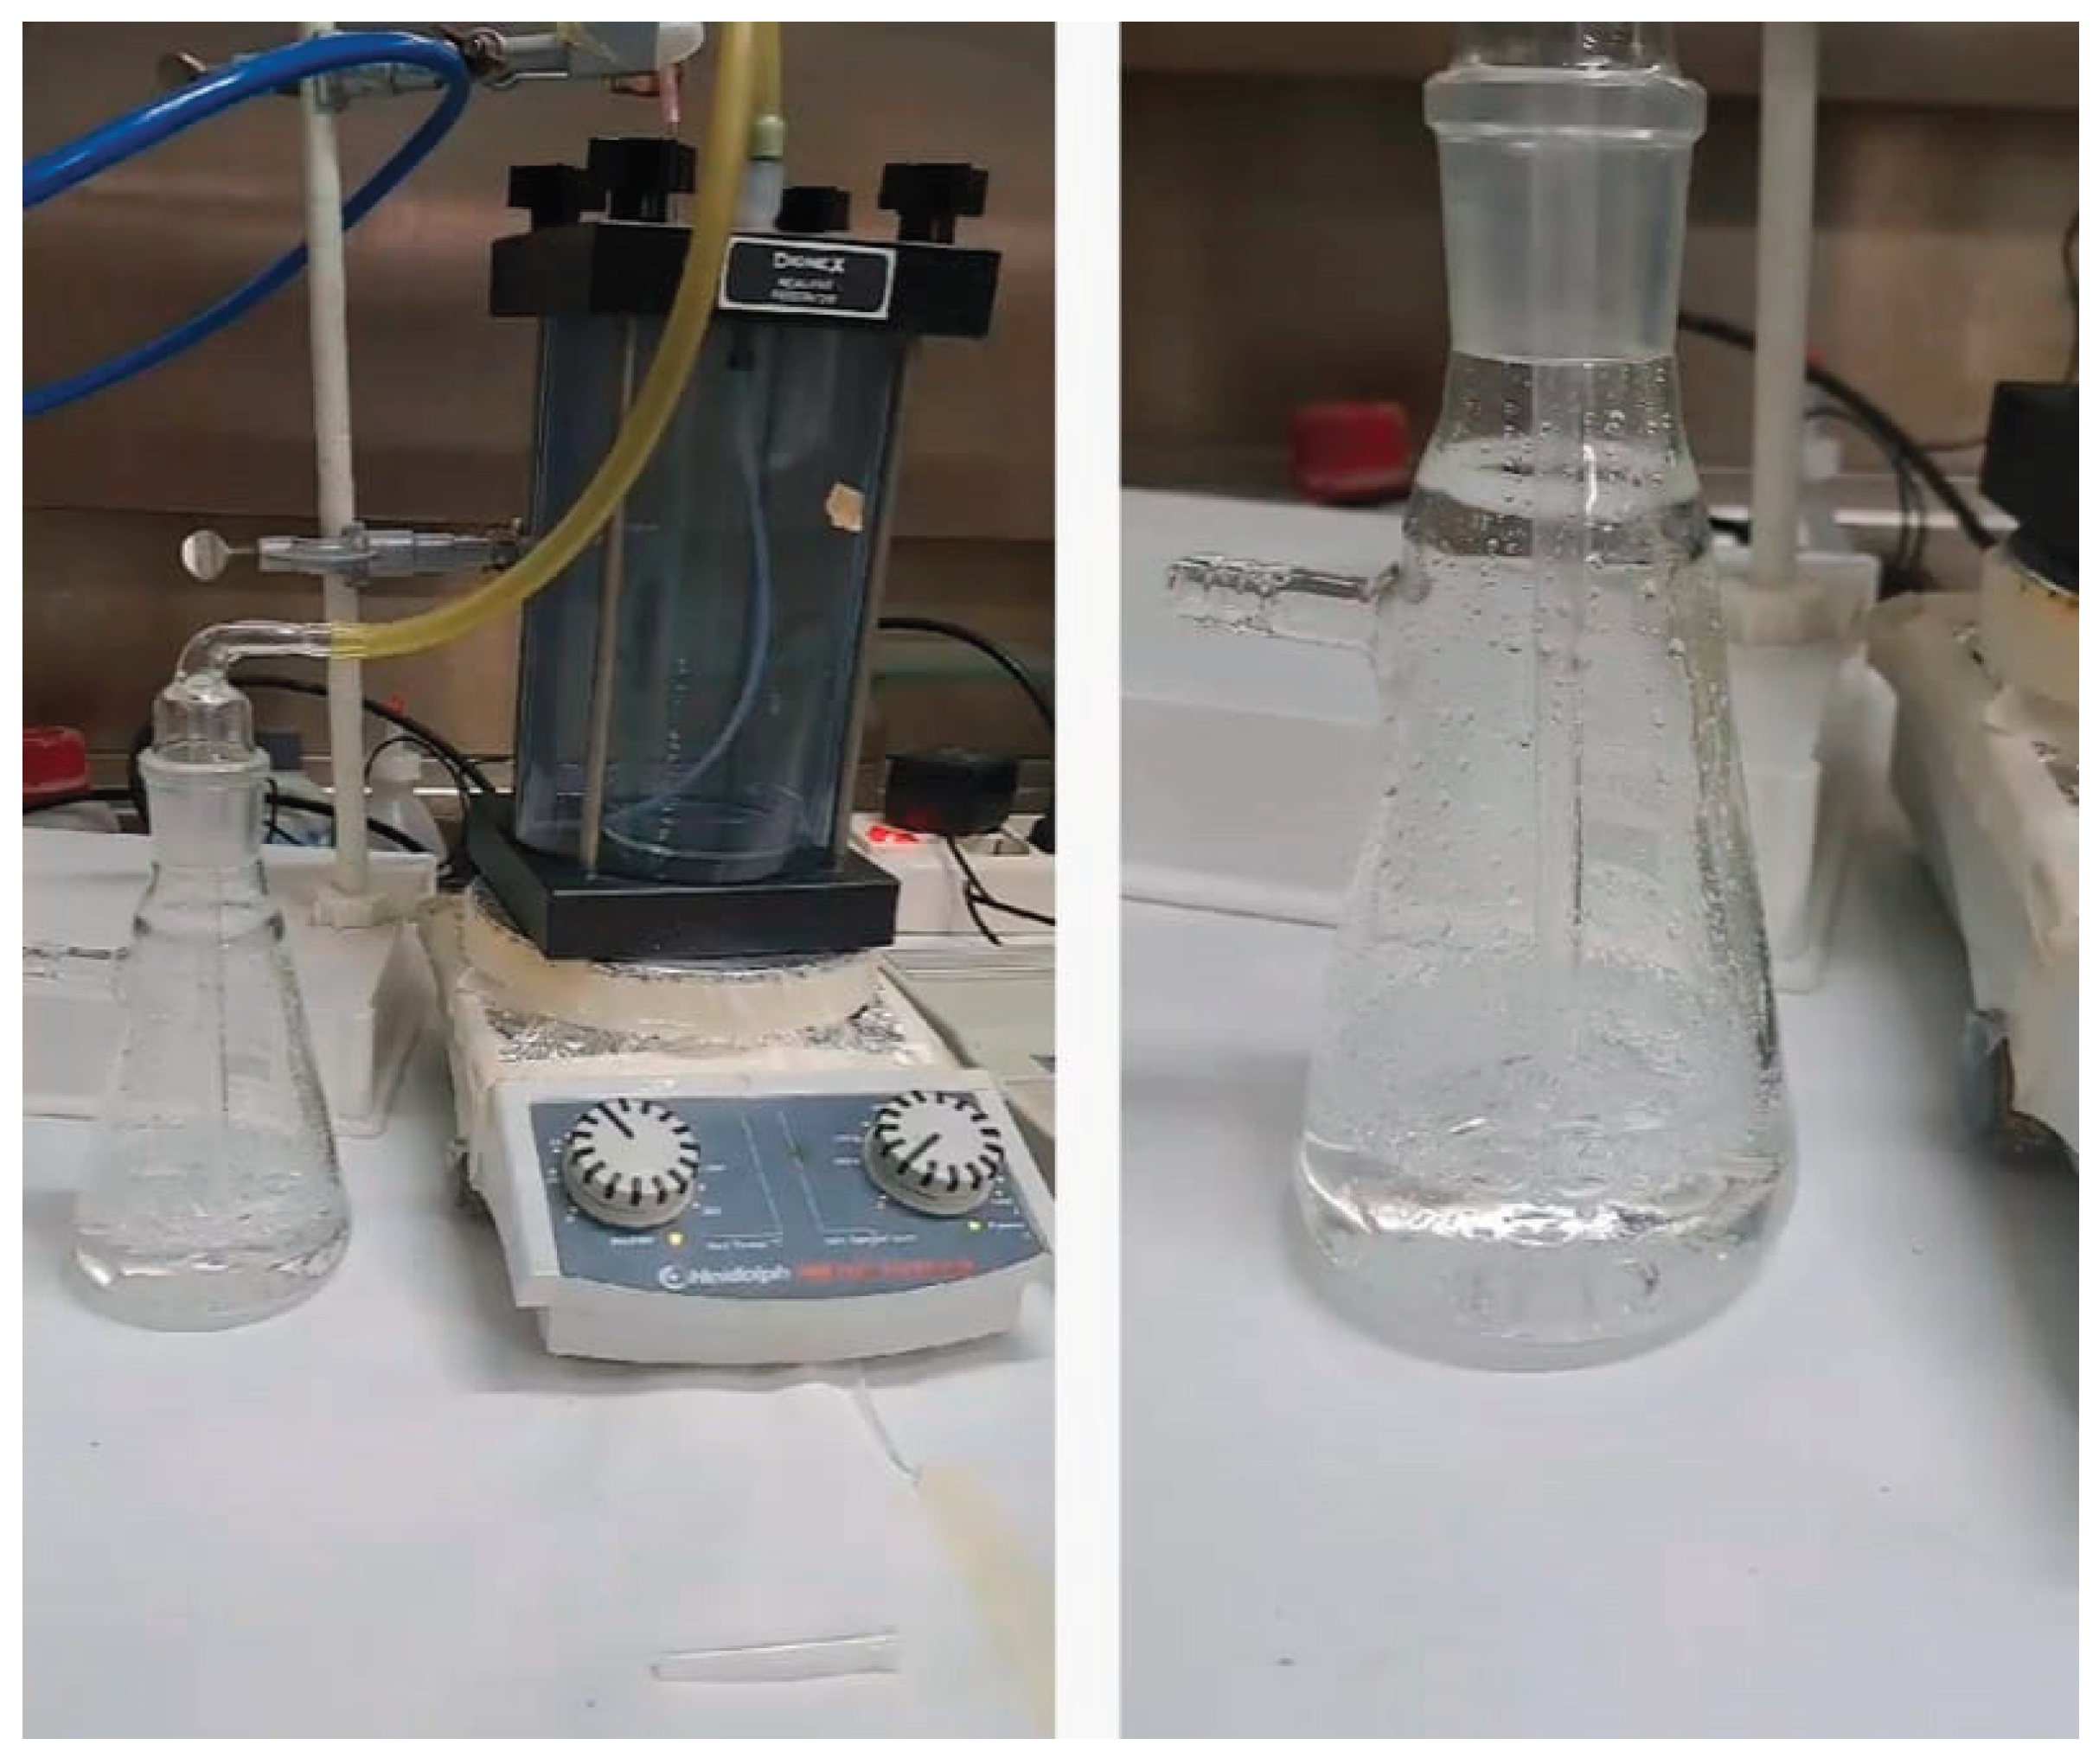
Figure 15.
Fluorescence emission spectra of pOBP saturated with 1-AMA at increasing concentration of 1-pentanol. The addition of 3-6 µL of 1-pentanol determines a decrease of the peak at 481 nm and an increase of the peak at 340 nm.
Figure 15.
Fluorescence emission spectra of pOBP saturated with 1-AMA at increasing concentration of 1-pentanol. The addition of 3-6 µL of 1-pentanol determines a decrease of the peak at 481 nm and an increase of the peak at 340 nm.
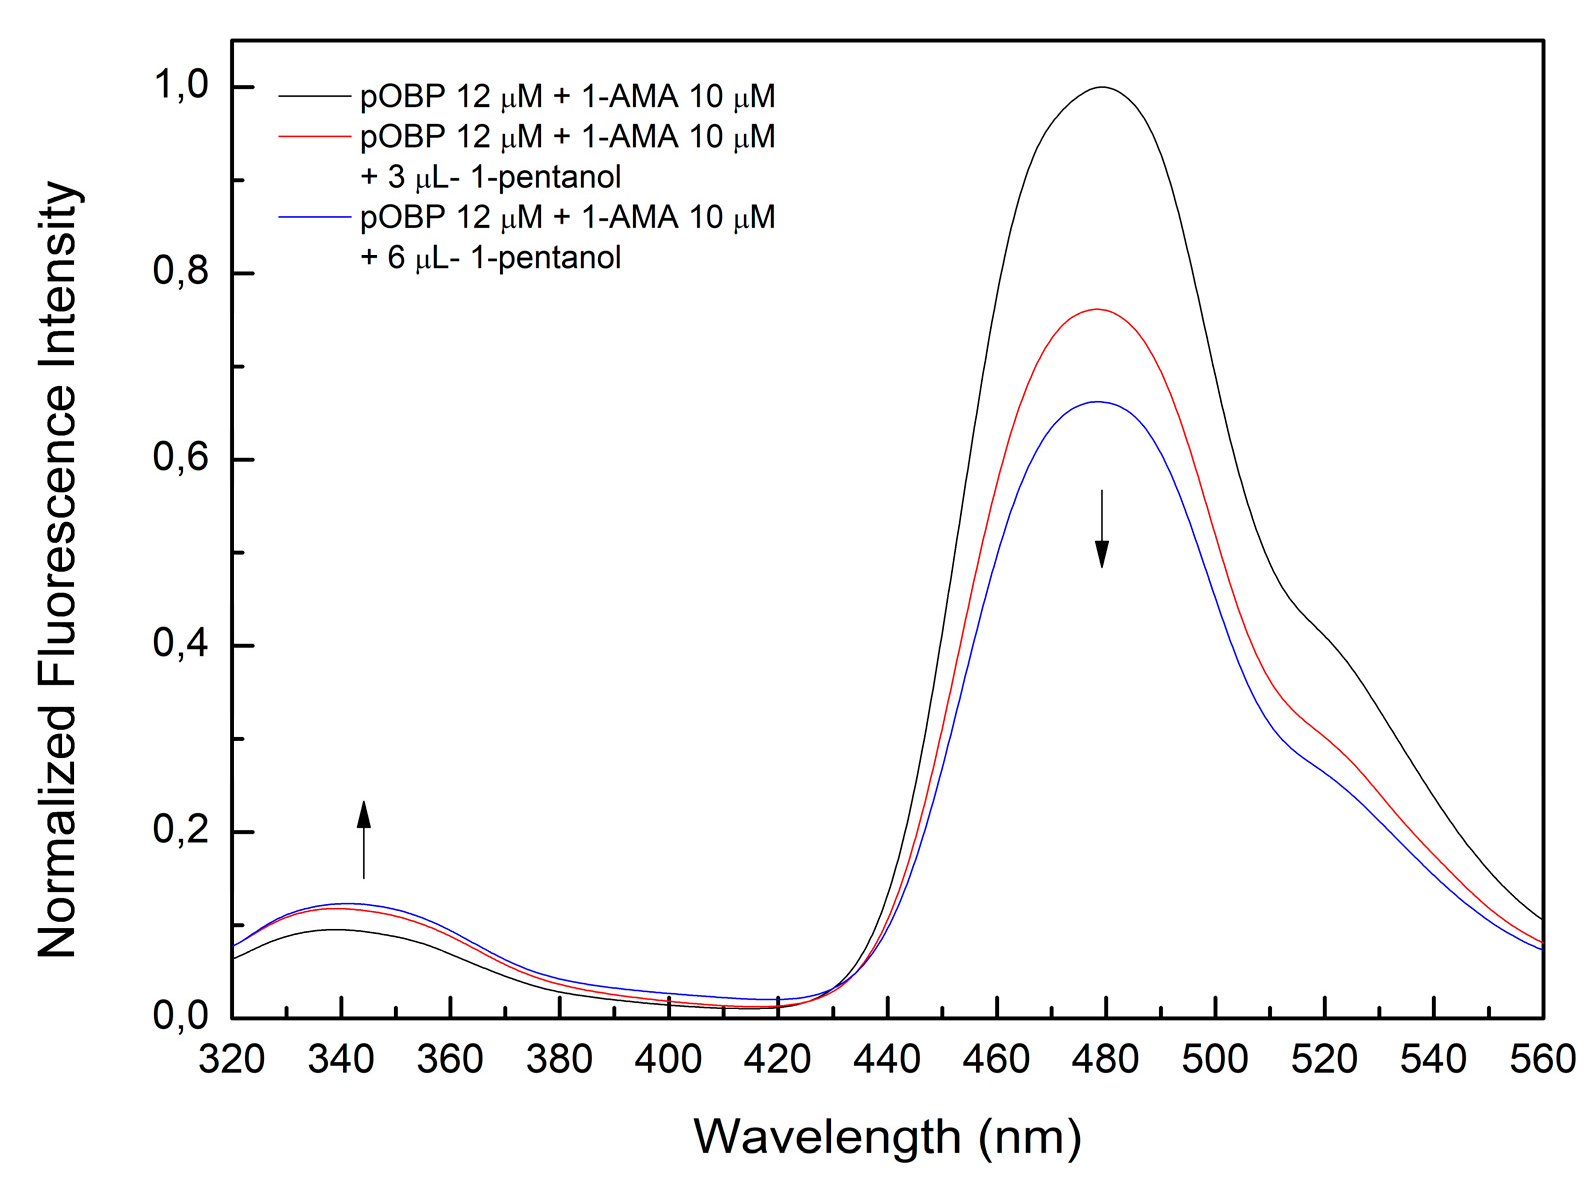
Figure 16.
Fluorescence emission spectra of pOBP saturated with 1-AMA at increasing concentration of 1-octen-3-ol. The addition of 3-6 µL of 1-octen-3-ol determines a decrease of the peak at 481 nm and an increase of the peak at 340 nm.
Figure 16.
Fluorescence emission spectra of pOBP saturated with 1-AMA at increasing concentration of 1-octen-3-ol. The addition of 3-6 µL of 1-octen-3-ol determines a decrease of the peak at 481 nm and an increase of the peak at 340 nm.
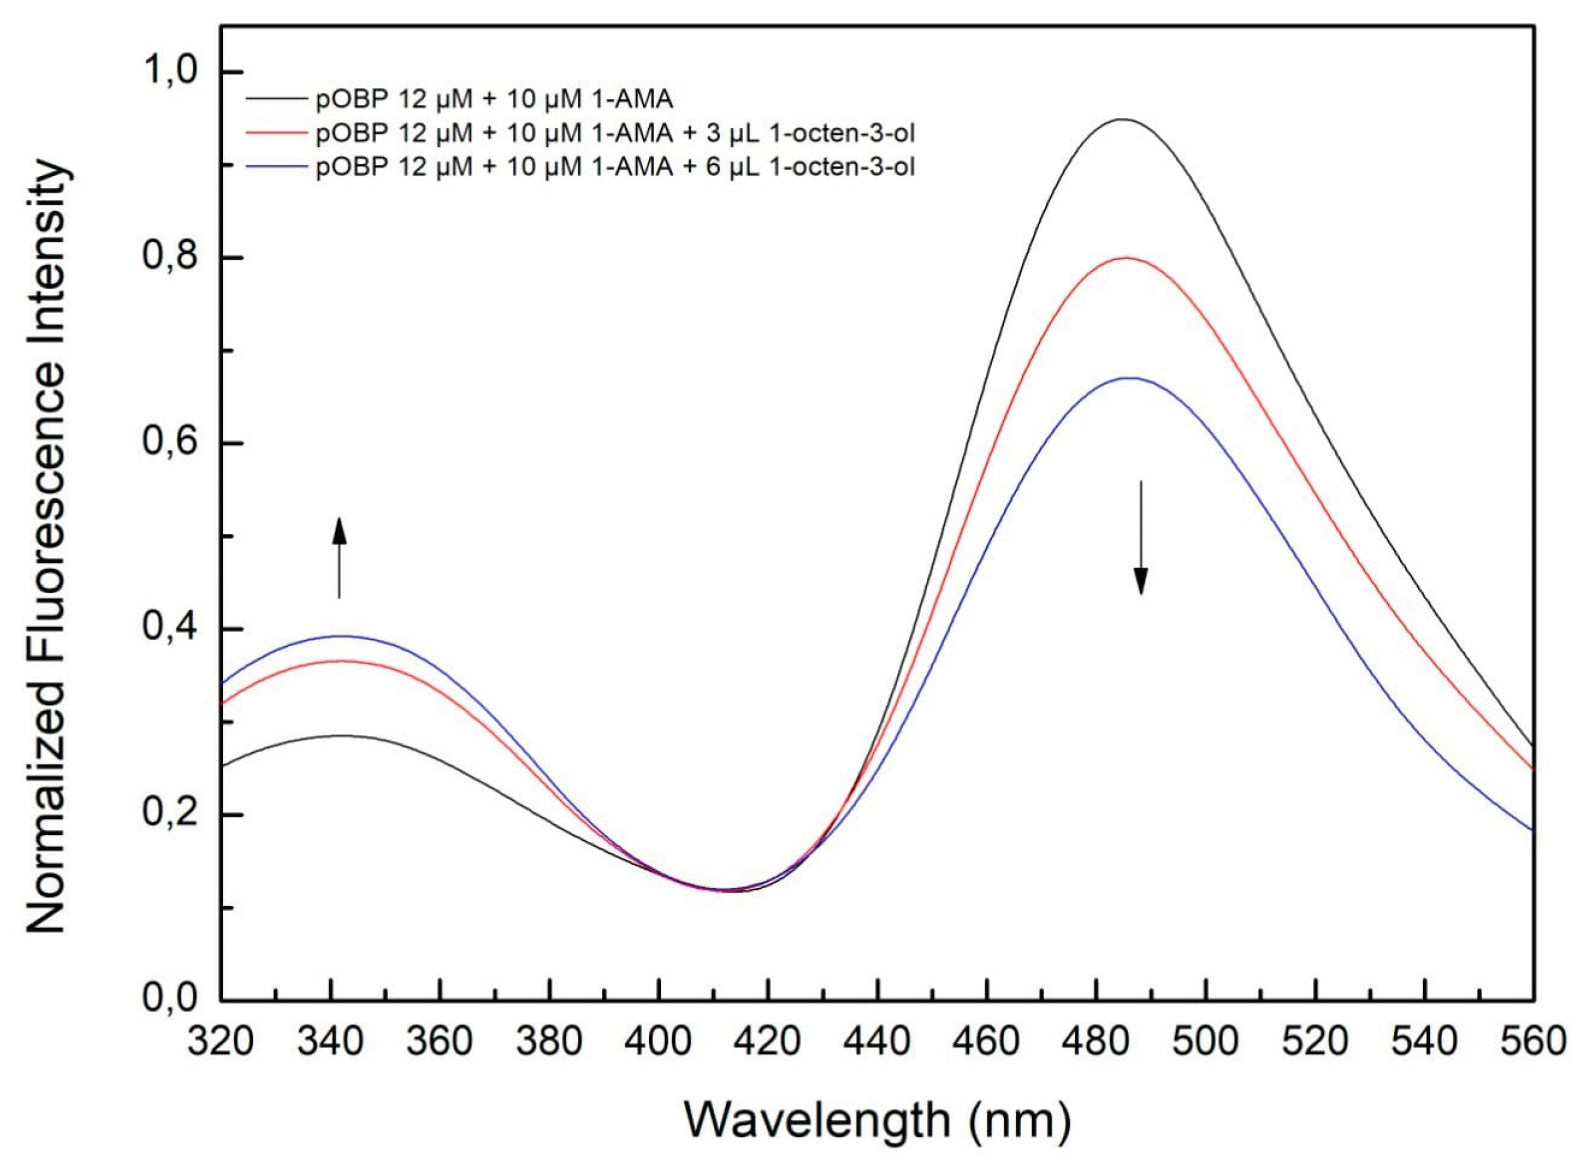

Table 1.
Direct docking simulation experiments results. (ΔG: Estimated Free Energy of Binding; Ki: Estimated Inhibition Constant; mM: millimolar; µM: micromolar).
Table 1.
Direct docking simulation experiments results. (ΔG: Estimated Free Energy of Binding; Ki: Estimated Inhibition Constant; mM: millimolar; µM: micromolar).
| VOC | bOBP | pOBP | Amino acid residues involved in interactions |
||
|---|---|---|---|---|---|
| ΔG | Ki | ΔG | Ki | ||
 l-Aminoanthracene |
-7.39 kcal/mol |
3.82 μM |
-7.64 kcal/mol |
2.50 μM |
Ile21-Val37-Gly116-Ile100- Phe88-Val80- Tyr82-Leu53- Met114-Asn102 |
 1-octen-3-ol |
-4.27 kcal/mol |
738.27 μM |
-4.84 kcal/mol |
284.95 μM |
Phe88-Val80-Tyr82-Leu53- Met114-Asn102-Phe35 |
 1-pentanol |
-2.80 kcal/mol |
8.92 μM |
-3.11 kcal/mol |
5.29 μM |
Phe35-Phe88-Ile21-Gly116-Thr115 |
 2-butanone |
-4.37 kcal/mol |
622.37 μM |
-4.27 kcal/mol |
746.84 μM |
Tyr82-Ile100-Met114-Asn102-Phe35-Gly116- Ile2l |
Table 2.
pOBP and bOBP dissociation constant (Kd) values of 1-octen-3-ol, 1-pentanol and 2-butanone.
Table 2.
pOBP and bOBP dissociation constant (Kd) values of 1-octen-3-ol, 1-pentanol and 2-butanone.
| Ligand | pOBP (Kd ± SD, μM) | bOBP (Kd ± SD, μM) |
|---|---|---|
| 1-octen-3-ol | 479 ± 53 | 139 ± 45 |
| 1-pentanol | 1800 ± 1200 | 40000 ± 1000 |
| 2-butanone | 934 ± 56 | / |
Disclaimer/Publisher’s Note: The statements, opinions and data contained in all publications are solely those of the individual author(s) and contributor(s) and not of MDPI and/or the editor(s). MDPI and/or the editor(s) disclaim responsibility for any injury to people or property resulting from any ideas, methods, instructions or products referred to in the content. |
© 2025 by the authors. Licensee MDPI, Basel, Switzerland. This article is an open access article distributed under the terms and conditions of the Creative Commons Attribution (CC BY) license (http://creativecommons.org/licenses/by/4.0/).
Copyright: This open access article is published under a Creative Commons CC BY 4.0 license, which permit the free download, distribution, and reuse, provided that the author and preprint are cited in any reuse.


