
Submitted:
17 November 2025
Posted:
20 November 2025
You are already at the latest version
Abstract
Allergic rhinitis (AR) is a widespread allergic reaction that has been shown to be impacted by the function of the immune system as well as environment and socioeconomic factors. This research is to explore the best predictive model among penalized logistic regression, random forest classifier, and XGBoost classifier, to gain insight into subjects who are susceptible to allergic rhinitis by taking advantage of the integrated data NHANES provides. The random forest model demonstrated the most stable performance. SHAP analysis provided interpretable insights at both group and individual levels, revealing that immune-related markers, including total IgE, eosinophil percentage, and the neutrophil-to-lymphocyte ratio were the strongest predictors of AR susceptibility. Environmental and socioeconomic exposures, such as cotinine levels, housing conditions, and income, also contributed substantially to the predicted risk. Overall, the findings highlighted that AR susceptibility arises from the combined influence of immunologic dysregulation and environmental stressors, underscoring the need for targeted preventive strategies.
Keywords:
allergic rhinitis
; random forest
; SHAP
; immune-environment interaction
; socioeconomic determinants
; public health
Allergic Rhinitis Prediction Through Machine Learning: Integrating Environmental, Immunologic, and Demographic Factors
Allergic rhinitis (AR) is one such common inflammatory disorder that affects the passage in one’s nose due to various allergens present in pollen, dust mites, and pet hair. (Bousquet et al., 2008; Larenas-Linnemann et al., 2023). It is now estimated that between 10% and 30% of the global population experiences AR symptoms, with many cases remaining undiagnosed or undertreated, especially in low-income and middle-income countries (Pang et al., 2022; Ozdoganoglu & Songu, 2011). Although AR is often perceived as a mild and seasonal disorder, its long-term health and economic burden are far from trivial. Repeated congestion of the nose, which affects sleep, as well as fatigue, may limit the level of productive work as well as learning in schools. AR may co-occur with other conditions like asthma, sinusitis, atopic dermatitis, and conjunctivitis also affect the well-being of an individual and could make diagnosis more complex and bring more challenges to therapies (Pang et al., 2022; Yavuz et al. 2021).
The presentation of allergic rhinitis varies among individuals, and the factors that contribute to this variation may be various. Recent studies have clarified the variation in allergic presentations as being due to the interaction of genetic influences, environment, lifestyle, and geographic position (Malizia et al., 2022). The traditional ways to classify these factors in relation to AR are seasonal and perennial rhinitis. However, these are only fractions that overlook the complexities that constitute the underlying principles. Modern research has shown that there is an underlying complex interplay between immunobiological factors, such as lifestyle habits and socioeconomic aspects, that perpetuate the underlying development and severity levels of AR. For example, genetic polymorphisms among loci that encode IL-4 and IL-13 signal transduction components interacted synergistically with environment-elicited tobacco smoke and indoor allergens to various endpoint endotypes (Ramratnam et al., 2024; Zhang et al., 2021). Furthermore, there are also interactions between socioeconomic issues and the housing environment that moderate either the quantity of allergens received or healthcare utilization (Pang et al., 2022). Apart from those listed above, most studies, which originally aimed to include those factors, have in fact overlooked them lightly. Therefore, there are some gaps in our understanding of these areas.
Despite past studies utilizing clustering techniques and latent class analysis to gain critical conceptual models offering classifications of the phenotype in AR (Yavuz et al., 2021; Kowalczyk and Krogulska, 2024), these studies are more qualitative rather than quantitative in understanding the joint effect of the dimensions of biology, environment, and demographic factors underlying the risk of the disease. Furthermore, models that prioritize making reliable predictive outcomes in the case of AR are likely to be less interpretable in terms of making the predictive outcome executable by artificial intelligence models such as Shapley Additive explanations (SHAP), which are promising approaches that break down challenging predictive outcomes generated by models such that there is an understanding of the magnitude and direction represented by each feature that has the potential to improve the models’ explanatory capabilities.
Building upon these methodological advances, the present study leverages comprehensive clinical, immunologic, environmental, and sociodemographic data from the National Health and Nutrition Examination Survey (NHANES) to derive and explore models of risk associated with allergic rhinitis risk using interpretable machine learning approaches. Using the Random Forest algorithm, XGBoost, and Elastic Net logistic regression models, the critical predictors and interactions that influence the risk of AR are identified. The application of SHAP analysis facilitates the explanation and understanding of the results obtained in determining how each variable influences the increase and decreases in the prediction probability of the appearance of the disease. The results are expected to enhance current understanding about underlying mechanisms that lead to the development of allergic rhinitis while formulating population and patient-tailored preventive and therapeutic measures.
Literature Review
Global Prevalence and Public Health Significance of Allergic Rhinitis
Allergic rhinitis (AR) is known as one of the most common chronic diseases affecting the respiratory tract. The number of people affected has increased to hundreds of millions and is continuing to rise in prevalence every decade. A total of 10% to 30% of people in the worldwide community suffer from symptoms of AR, but many of them remain undiagnosed and untreated, particularly in low to middle-class countries (Ozdoganoglu & Songu, 2011). Even in countries where AR is viewed as a benign condition, which only affects people during certain seasons, its long-term implications are significant, as it impacts people’s productive capabilities by causing them to lose work time due to conditions such as conjunctivitis, sinusitis, and asthma, among others.
Recent research shows that the prevalence of AR is being affected by the environment. Some research indicates that air pollution from PM₂.₅, NO₂, and O₃ is likely to increase the risk of airway inflammation and allergic sensitization. Additionally, global climate change is expected to exacerbate allergic rhinitis, as higher temperatures will stimulate the growth of pollen, resulting in an extended allergic season. In this case, those exposed will develop symptoms regularly (Tran et al., 2023). Additionally, indoor air pollution is another significant source, particularly for vulnerable groups such as children, the elderly, and individuals living in crowded or impoverished communities.
From the point of view of public health, AR shows how susceptibility and environmental exposure interact and intersect as influences on disease risk. While this increasingly common issue is more than just a pharmacologic issue, but also a prevention issue, understanding the complex, multifactorial nature of AR presents an important chance to create informed, data-based approaches to minimize this burden of allergic disease in society for those at risk.
Understanding Different Types of Allergic Rhinitis
Recent studies are increasingly appreciative of the concept that allergic rhinitis (AR) should be viewed as a complex condition, rather than a simple seasonal or perennial condition as traditionally perceived (Yavuz et al., 2021; Kowalczyk & Krogulska, 2024). The clustering and latent class approaches have identified various phenotypes within AR, according to differing patterns of sensitization to allergens, symptom duration, and co-existing conditions, including asthma (Yavuz et al., 2021; Kowalczyk & Krogulska, 2024). Although initial observations largely remain the domain of children and adolescents, recent population-based and clinical studies are increasingly proving that substantial heterogeneity exists even among adults manifesting various types of AR symptoms as well. The various manifestations among adults are primarily influenced by long-term environmental interactions, occupation, and lifestyle, which may exert divergent effects on their systemic immunologic patterns, resulting in varied pathways leading to systemic inflammation (Bousquet et al., 2020; Savouré et al., 2023; Dramburg et al., 2024). Such appreciations are increasingly leading towards an integrated approach that perceives various environments, as well as immunologic patterns, as essential components to define AR types more accurately, thereby presenting a uniform predictive approach to prevention and treatment. Some national surveys are increasingly providing predictive insights into this intellectual ambiguity.
Genetic, Immunologic, and Epigenetic Contributions
Despite the classic perception of allergic rhinitis (AR) as an IgE-mediated disease, existing evidence points to the presence of far more complex immunologic mechanisms involved in the pathology of AR, which can be attributed to both systemic as well as local immune dysregulations. The presence of elevated levels of total and antigen-specific IgE, eosinophilia, as well as elevated inflammatory mediators like C-reactive protein (CRP) levels, provides comprehensive evidence of the increased levels of type 2 inflammation as well as the level of immune activation (Zhang et al. 2021, Espada-Sánchez et al. 2023). However, genetic predispositions cannot account for an individual’s susceptibility to AR alone. Variations in genes related to Th2 cells, such as IL-4, IL-13, or FCER1A, could account for atopic phenotypic predispositions, although this is commonly subject to environmental influences (Wang et al., 2005; Zhang et al., 2021; Ramratnam et al., 2024).
There is a growing indication that epigenetics provides a key connection between environmental stress factors and the regulation of the immune response (Sharma et al., 2022; Clausing & Bennett, 2023). “Epigenetics” is a term that encompasses a multitude of changes to the epigenome that include but are not limited to, the methylation of DNA, histones, and the expression of microRNA molecules that have been found to be epigenetic marks of individuals exposed to the environment through pollution, the psychosocial environment, and the socioeconomic condition (Clausing & Bennett, 2023). These biomolecular changes could play a role in the differentiation of the immune response and the inflammatory reaction (Sharma et al., 2022).
Taken together, these findings argue for a model of allergic sensitization that emerges not purely through genetic factors but rather through complex interplays between the regulation of molecules, biomarkers of the immune system, and experiences of the larger societal and environmental surroundings. This model of complex interplay and the complexity of the issues presented argue for a much more integrative and data-driven approach than the current common practices.
Environmental and Social Effects on Allergic Rhinitis
Nitrogen dioxide (NO₂), fine particulate matter (PM₂.₅), and second-hand smoke have all been demonstrated to alter airway epithelial barriers and influence the degree of immune polarization, including Th2-type inflammation (Lu et al., 2022; Pang et al., 2022). Nitrogen dioxide (NO₂), fine particulate matter (PM₂.₅), and second-hand smoke have all been demonstrated to alter airway epithelial barriers and influence the degree of immune polarization, including Th2-type inflammation (Lu et al., 2022; Pang et al., 2022). Aside from the well-recognized outdoor environmental determinants of allergies, other important indoor determinants that have emerged in recent research include increased moisture, poor ventilation, and the use of specific cleaners, among other factors that affect the indoor environment (Huang et al., 2023; Wang et al., 2023). Moreover, the influence of the socioeconomic climate, through factors such as income, educational level, and the standard of accessible medical care, continues to emerge regarding the relationship between these determinants and the risk of allergies (Perry et al., 2024).
There is growing recognition that environmental and social factors work together rather than in isolation in shaping the burden of allergic rhinitis (AR) (Wu et al., 2021; Perry et al., 2023). People living in poor economic neighborhoods can also be highly vulnerable to the onset of AR. They could live in an environment filled with air pollution, in poor housing conditions, in rooms with mildew, as well as have remote access to healthcare facilities (Wu et al., 2021; Perry et al., 2023). This also raises the susceptibility of individuals to allergies, as well as increased sensitivity towards the persistence of the disease. The same trends are also observed in other conditions of the upper airway, including chronic rhinosinusitis with nasal polyps, where air pollution and socioeconomic inequality contribute jointly to the prediction of the condition's intensity and the inequity of access to healthcare (Peterson et al., 2023). These studies suggest that allergic rhinitis cannot be attributed solely to environmental influences.
Climate Change and Environmental Risk Factors
More and more allergic problems like allergic rhinitis are caused by climate change, and now it has become the most important environmental cause. Global warming and rainfall changes are altering the time, length, and intensity of pollen release by plants. Warming weather makes plants bloom earlier, so we spend more time in contact with pollen, and more CO2 will make pollen yield bigger and more powerful (Damialis et al., 2025). These changes lead to a longer allergic season. People with allergic rhinitis may have more severe, lasting symptoms, especially for individuals residing in areas with significant air pollution or inadequate ventilation.
Harmful substances such as fine particles (PM₂.₅), ozone and nitrogen oxides (NOx) may combine with allergens to damage the inner lining of the respiratory tract and amplify immune responses (Urrutia-Pereira et al., 2022). These pollutants can carry pollen fragments and microorganisms deeper into the lungs, exacerbating inflammation and allergic reactions. Children are at greater risk because their immune system is still developing, and they spend more time outdoors, which may lead them to become sensitive prematurely and get asthma more easily when they grow up.
Besides the effects directly brought by the increase in temperature and air pollutants, climate change is also known to play an important role in other ecological and social shifts, ultimately affecting the distribution of allergic diseases. The loss of biodiversity and fast-paced urbanization are known to have significantly decreased human exposure to various microbes found in the environment, which are crucial for creating and sustaining immune tolerance. This can be associated with the biodiversity hypothesis, where it has been proposed that the lack of exposure to natural microbes could potentially induce immune dysfunction, thereby contributing to the rise in susceptibility to allergic disorders (Haahtela, 2019; Agache et al., 2024). In the modern, more urbanized life, there would be less exposure to protective microbes but greater exposure to air pollutants, which could trigger immune dysfunction, thereby raising the potential susceptibility to allergic rhinitis, along with other atopic conditions.
These results make it clear that allergic rhinitis should no longer be viewed as a personal issue, but rather as a condition that should be considered in the context of environmental and ecological factors. Climate change, pollution, and the modern lifestyle create the conditions for the development of allergies, particularly in children and people in poor economic conditions. Therefore, to effectively solve the problem, we must take public health measures that can cope with climate change, turn to cleaner energy, and implement better urban planning, to reduce the harm brought by the environment and help us build a healthier community.
Advances in Technology and Precision Medicine
Recent progress in artificial intelligence (AI) and machine learning (ML) has reshaped the landscape of allergy and immunology research by enabling the integration of complex, multidimensional data to uncover hidden disease mechanisms. In allergic rhinitis (AR), ML models have demonstrated a strong ability to capture nonlinear relationships among environmental exposures, immune biomarkers, and sociodemographic characteristics that are often undetectable by traditional regression models (Fu et al., 2024; Kong, 2026). These data-driven methodologies present considerable opportunities for precision medicine, as they enable researchers and clinicians to shift their attention from the averages to insights on an individual basis. Applications of artificial intelligence on large datasets, including NHANES and national biorepositories, have enabled the accurate prediction of disease risk and understanding of mechanisms common to AR, asthma, and chronic rhinosinusitis (Fan et al., 2025; Fu et al., 2024).
Nevertheless, despite the promise shown by Machine Learning for prediction, the applications of Machine Learning within the research field of allergies remain challenged by significant issues associated with interpretability, replicability, and translation into clinical settings (Sadeghi, 2024; Saarela et al., 2024). “Black-box” models, including complex ones such as deep learning, are known to provide high accuracy yet may fail to provide insights into feature contribution at the outcome level. In light of this, Explainable Artificial Intelligence approaches, especially those focusing on Shapley Additive Explanations, have been explored as techniques leveraging the capability to provide measurements quantifying feature contribution to the outcome of the mathematical models, thus bridging the intelligence gap and enabling the understanding of immune, social, and other influences on allergic outcome within both individuals and groups (Sadeghi, 2024; Saarela et al., 2024).
Moreover, the integration of interpretable machine learning models and epidemiologic information has also brought about novel avenues within the field of precision public health. In this regard, for instance, the SHAP visualization technique gives health practitioners the opportunity to understand how various critical predictors, including the concentration of IgE and exposure to tobacco, influence the risk in distinct groups, thereby enabling identification of those groups most likely to benefit from early preventive interventions (Fan et al., 2025).
Current Challenges and Limitations in Allergic Rhinitis Research
Despite advancements in understanding allergic rhinitis, several challenges remain in study methodologies and concepts. Mostly, current studies revolve around a single domain of analysis, such as symptoms, biological markers, and environmental factors, which do not result in comprehensive insights into multifaceted conditions of allergic rhinitis as they interact across biological, social, and ecological domains together in complex ways. Currently, most population-level analyses remain reliant on either patient reporting or region-specific data, which is a limitation in terms of the generalizability of results, contributing to discrepancies in definitions of study conditions as well.
Another major limitation is the insufficient integration of social determinants of health into allergy epidemiology. Issues of socioeconomic status, housing, healthcare, and environmental justice have been established as affecting exposure as well as an individual’s response but have generally not been explored in models for predictions. In addition, although machine learning algorithms provide opportunities for exploring complex interactions between different types of data, machine learning in AR research is an area of much underexplored potential. Current applications of machine learning have essentially been focused on classification rather than addressing issues of interpretability, which have adverse impacts upon adoptability in a real-world, reproducible manner for AR.
To surmount these challenges, an integrated and interpretable modeling framework is imperative. An appropriate modeling strategy should integrate environmental, immunologic, and demographic variables to identify biologically interpretable AR subtypes as well as efficiently provide predictions of at-risk individuals for precision medicine in an interpretable manner. A combination of standard modeling approaches for tackling allergic diseases, along with an interpretable machine learning strategy like using SHAP values for feature attributions, would enable scientific investigators to gain a deeper understanding of biological processes, progressing from prediction to understanding of allergic conditions for precision medicine.
Methods
Data Source and Study Population
We used data from the National Health and Nutrition Examination Survey (NHANES) in the 2005–2006 period, which was conducted by the U.S. Centers for Disease Control and Prevention (CDC). NHANES collects information for participants through surveys, including physical examinations and laboratory tests. Only the period 2005-2006 data were chosen because this was the only year in the NHANES database with the allergy module, which contained detailed questions about individuals' allergies, symptoms, and environmental exposure.
This data set combines questionnaires from NHANES, including demographics information, medical histories, laboratory test data, health insurance, living conditions and habits. For individuals' environmental exposure information, questions are recorded regarding house characteristics, housing conditions, keeping pets, and smoking status. Biomarkers such as immunoglobulin E (Ig), eosinophil counts, and C-reactive protein (CRP), which are general and allergen-specific, provide us with an objective measure of whether the immune system is activated or not and whether the body is inflamed or not.
We restricted our analysis to individuals aged 20 and above, ensuring that there is a basis for biological comparability. Furthermore, as the mechanism of allergy is variable in somatic systems with differing intensities in the data among adults and children, analyses on adults are more rational. The merging process proceeded according to CDC file format requirements. Data with unreasonable codes and those that were missing were set to missing values. Abnormal values in the continuous data set were standardized.
Variables
We combined various components within NHANES to construct our dataset, which integrated demographic, socioeconomic, clinical, immunologic, and environmental variables. The merging was conducted using the study participant ID according to the CDC documentation guidelines. The variables utilized were designed to capture the various areas that impact allergic rhinitis.
Demographics and socioeconomic variables include age, sex, race/ethnicity, education level, family income, and family size. These are markers that identify the structure of the population as well as the social context that influences health. Other variables include body mass index (BMI), the presence or absence of asthma and eczema, and family history of allergies. The immunologic variables include levels of total and allergen-specific IgE (immunoglobulin E), eosinophils, C-reactive proteins (CRP), as well as derived NLR values such as the neutrophil to lymphocyte ratio.
Exposures that accounted for environmental and behavioral factors are smoking status, blood levels of cotinine (a marker of smoking), mold/mildew in the home, owning a pet, housing type, and age of home. The measures that reflect healthcare access are current health insurance status and rates of routine healthcare visits. “Whether the patient has Allergic Rhinitis (AR)” was the target response variable. This was operationalized with data collected from the ‘Allergy Module’ section. AR was present if one or more of the following criteria were met: (1) The patient had hay fever/nasal allergies diagnosed by a doctor within the past 12 months, and (2) the patient had had sneezing/congestion in the past 12 months.
This definition captured all the potential cases of allergic rhinitis. Participants with missing values for the AR definition were retained in the dataset but marked as missing, and these cases were later excluded during model training.
To enhance data quality and comparability, the categorical variables were harmonized based on the NHANES codebooks, and implausible data values in continuous variables were screened. Missing data values were retained during preprocessing to maintain the sample size. Highly correlated continuous predictors with Spearman’s ρ ≥ 0.8 were identified and removed to ensure model stability. The final analytic dataset included 4978 adults with complete outcome information and corresponding predictor data.
Data Analytic Plan
The study applied three types of machine learning models to predict allergic rhinitis and identify the most significant factors that impact the response variable. The models included the use of Elastic Net Logistic Regression, the Random Forest model, and the Extreme Gradient Boosting model (XGBoost), which are commonly used in biomedical analysis and capable of establishing both linear and non-linear relationships between different factors.
In each model, repeated stratified cross-validation was used to obtain robust and unbiased estimates. The hyperparameters in each model were searched through grid search to get the best possible results. The classification thresholds were set after extensive testing to ensure that the optimal values of recall were achieved. Each model was trained and tested with ten different seeds to ensure that the results were robust and reliable. The results were obtained with average values to ensure that variability is considered. Different criteria were also used to ensure that each model performs well. These criteria included AUC values, precision, recall, and F1-score.
Shapley Additive Explanation (SHAP) provides further clarity in interpreting the results of the model. The values were calculated to determine the contribution of each variable to the predictive probability of allergic rhinitis. Then averaged over ten random seeds to obtain accurate results. The results can be interpreted through interactive visualizations to compare different predictors.
This modeling methodology includes statistical accuracy as well as interpretability, where the results can be traced back to the meaning behind the prediction. By connecting reliable outcomes to clear algorithms, this modeling methodology made it possible to predict the relationship between lifestyle factors and the immune systems that influence the chances of allergic rhinitis in U.S. adults.
Results and Discussion
Model Comparison and Selection
We used three supervised learning models to train and compare, aiming to identify the best model for predicting whether a participant can be diagnosed with allergic rhinitis or not, utilizing integrated demographic, environmental, and immunologic features, including penalized logistic regression, random forest, and XGBoost. Nonlinear ensemble models like random forest model and XGBoost model provide advantages in capturing complex interactions among environmental, immunologic, and demographic variables, while the logistic regression model remains valuable for its transparency and sensitivity in detecting true positives. Each model was built and tested on the same processed data set with class balance adjustment and standardized predictors. Ten different random seeds were employed to assess model reproducibility.
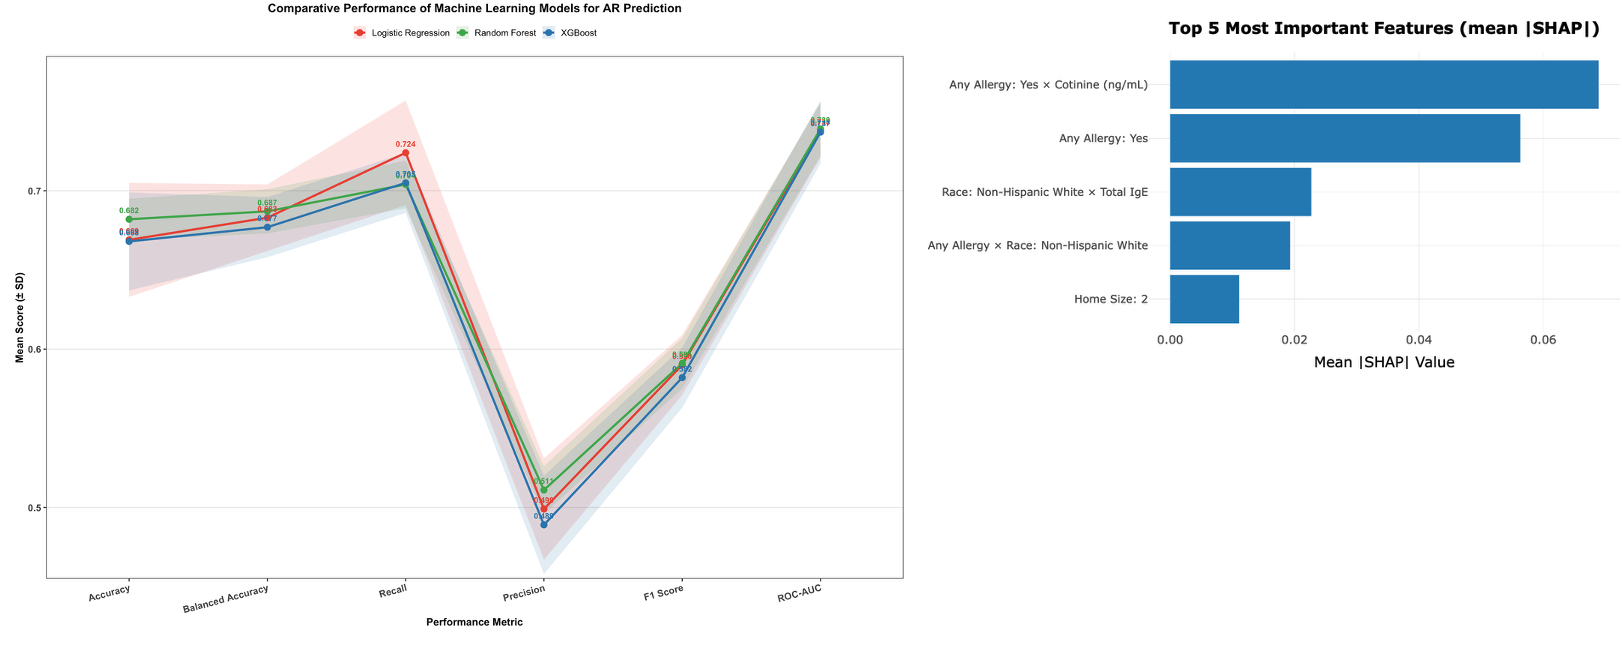
In general, all three models have relatively equivalent predictive accuracy, with a moderate difference between accuracy, balanced accuracy, recall, and ROC-AUC values. The logistic regression model produced the highest recall, indicating that a greater number of actual positive cases are detected, making this model suitable as a screening or risk identification purposes. Random forest model was the one with the best overall results, performing in high precision, F1 score, and the lowest variability among random seeds. The model with a relatively better ROC-AUC and recall was the XGBoost model, implying that this model performed better at handling complex patterns, as seen by the relatively high variability among iterations.
Logistic regression is a linear model that facilitates the detection of a clear direction of relationship between the predictors and the risk of allergic rhinitis. Conversely, random forest and XGBoost models are more effective for detecting complex interrelationships among various biological, environmental, and socioeconomic factors that may not be detected using standard regression models. These models combine multiple decision trees, thereby enhancing accuracy but compromising interpretability. This is because the interpretability of these models has been enabled by the rise of various explainable models in machine learning, such as the SHAP model (Lundberg & Lee, 2017; Rajkomar et al., 2019), which have been very useful in attributing complex model outputs to feature contributions.
Taking both robustness and interpretability into account, the random forest model was chosen as the central model approach that will later be interpreted via the SHAP approach. It both yields strong predictive accuracy and is well-suited to a variety of explanations, making it an ideal model with which to examine the complex risk profile seen among the general population and manifested by AR.
Figure 1.
Comparative performance of machine learning models for AR prediction. Note: Mean scores (±SD) across ten random seeds are presented for accuracy, balanced accuracy, recall, precision, F1, and ROC-AUC. The random forest model achieved the most stable and balanced performance, logistic regression showed the highest recall, and XGBoost achieved slightly higher discrimination but less stability.
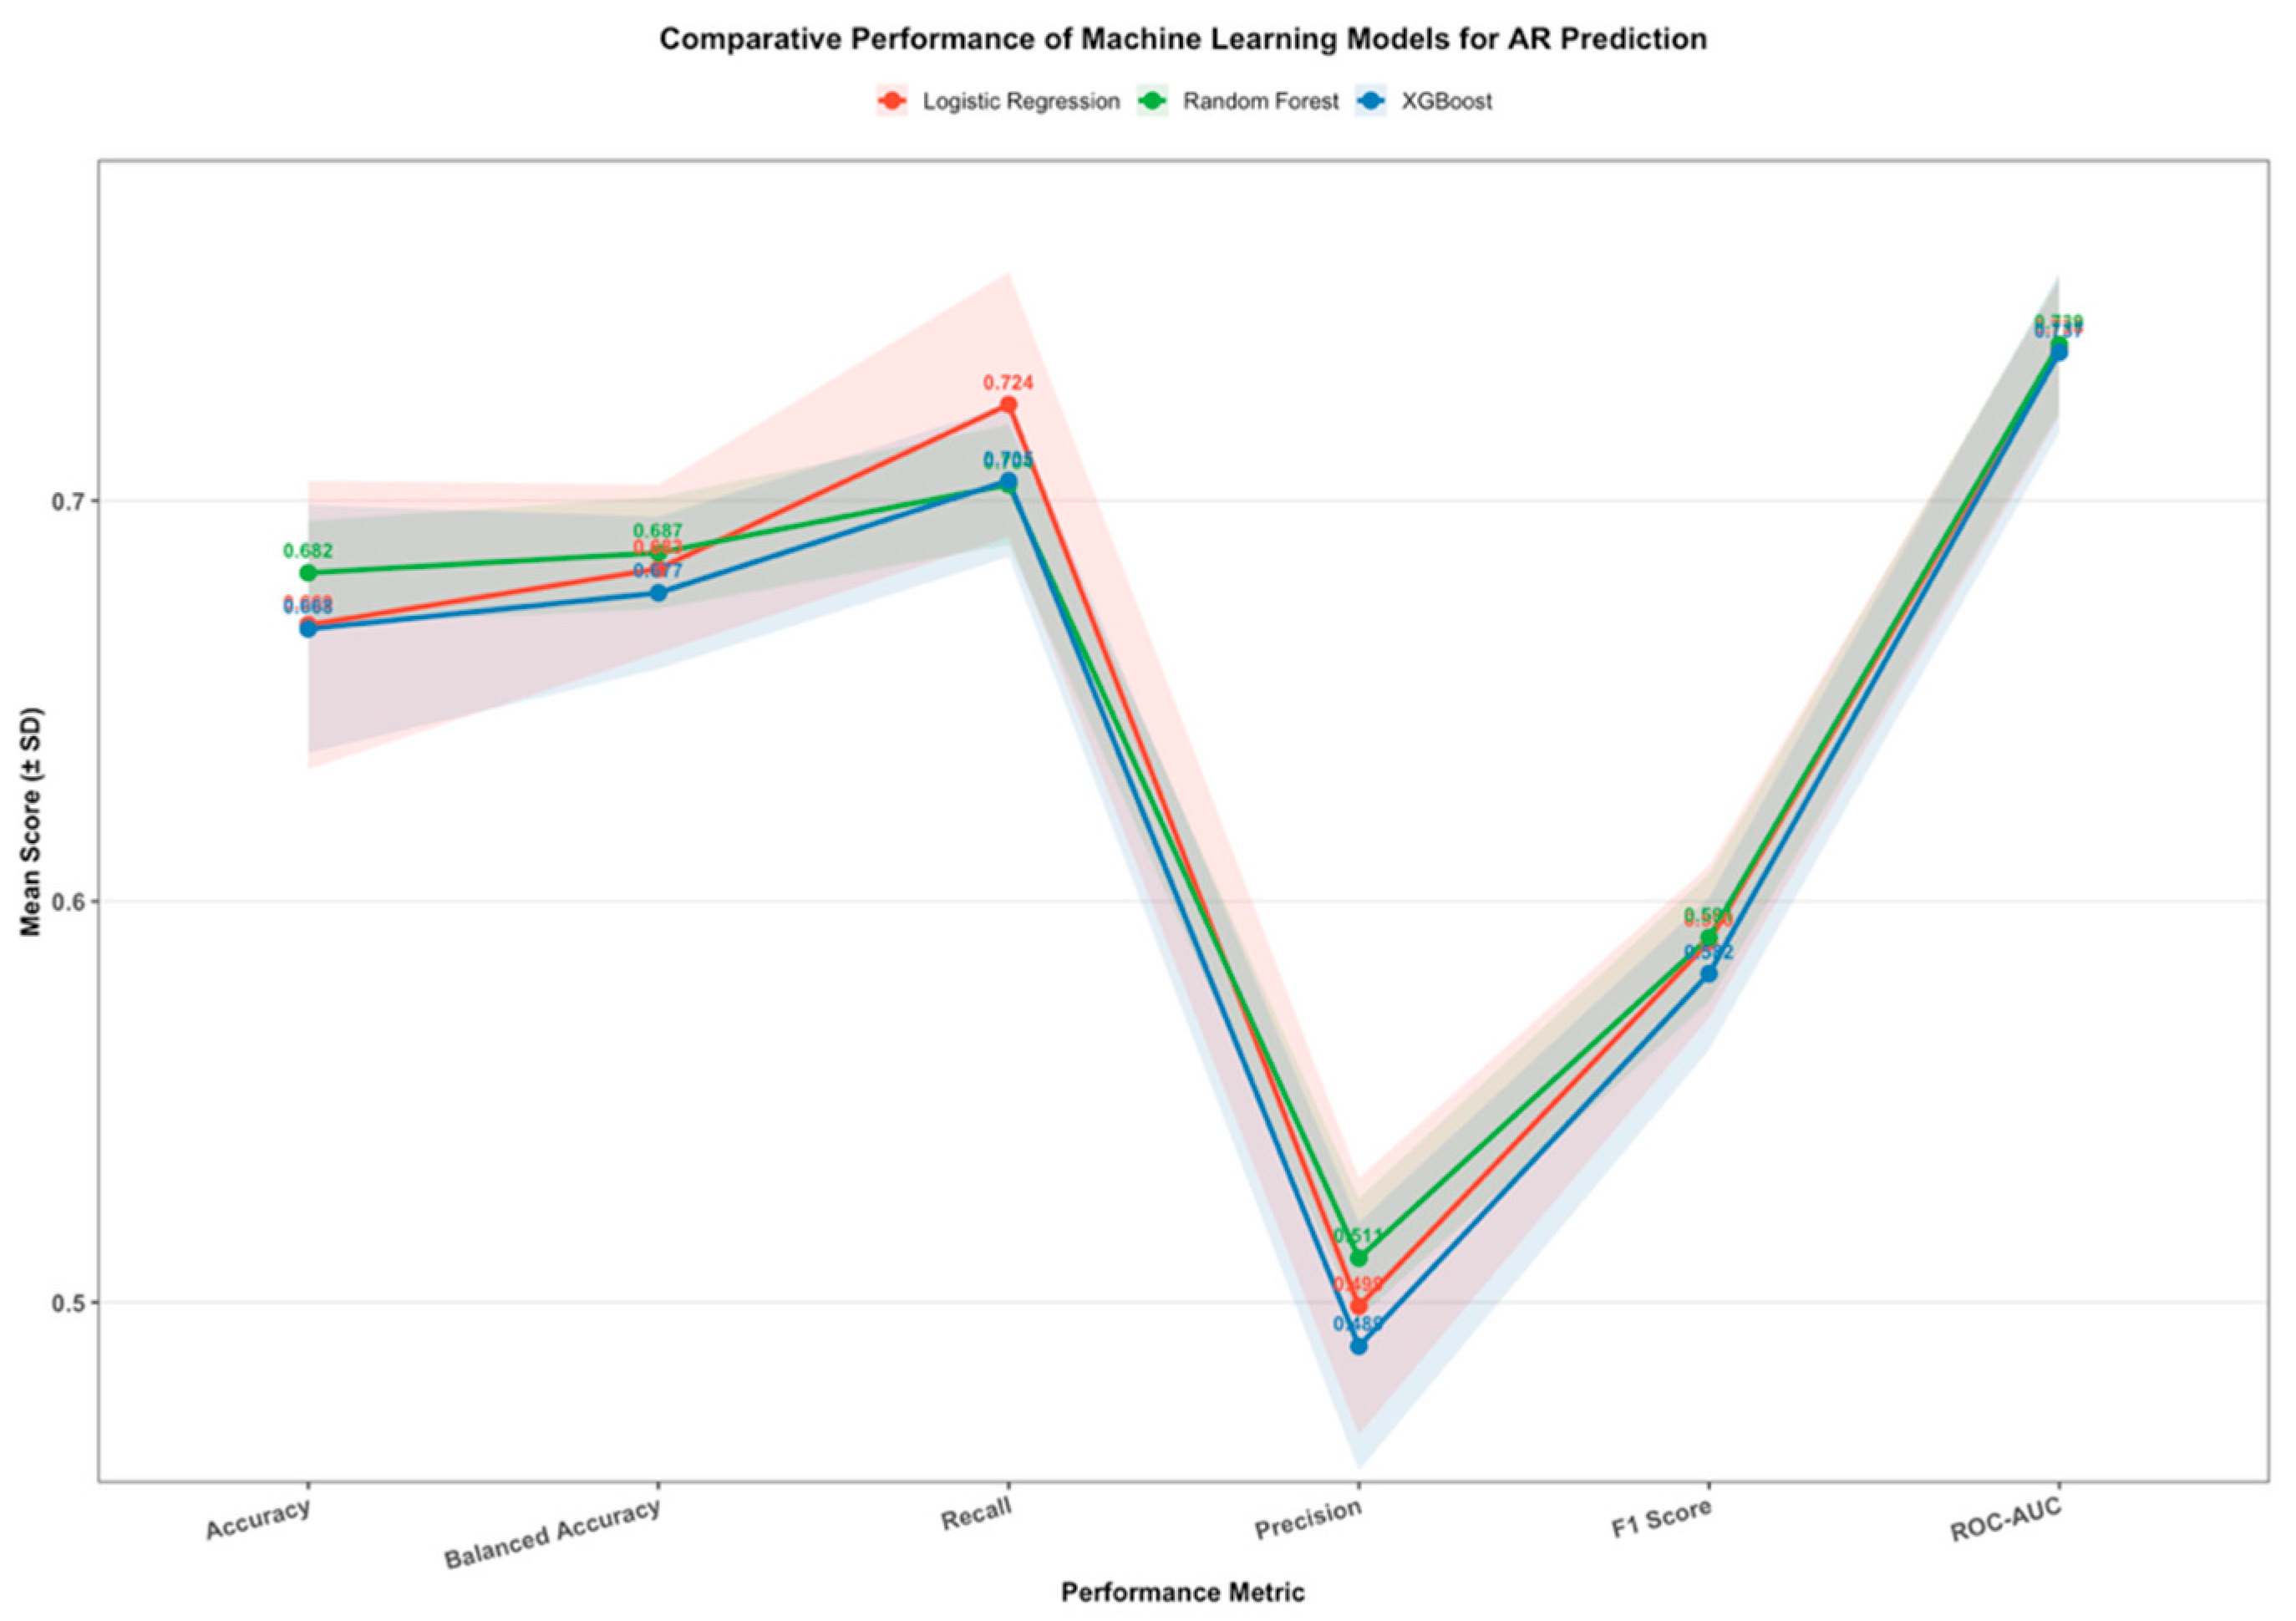
Across repeated runs with different random seeds, the ranking of important features and overall performance patterns remained consistent, suggesting that the model captured stable and biologically meaningful relationships rather than noise-driven associations. The slight variance of standard deviations for the essential metrics, such as ROC-AUC, F1 score, accuracy, and recall, further supported the reproducibility of the model. Moreover, the fact that the training and validation curves were closely aligned also showed that the model did not overfit and that the analytical framework used was robust and accurate.
Feature Importance and Interpretability
The contributions to feature values were assessed by analyzing the SHAP values, which are estimated by the Shapley Additive explanations approach, based on a random forest model developed for the prediction of allergic rhinitis cases. To avoid any random seed bias and achieve reproducible results, the values are estimated by ten different random seeds, each simulated by a Monte Carlo approach with 20 simulations per seed, yielding an averaged SHAP matrix that represents the influence of the feature as an average value over all simulated states.
The ranking of predictors was based on the mean absolute SHAP values, which represented the average magnitude of each feature’s influence on the model output, regardless of whether that effect increased or decreased predicted AR risk. This measure provides a robust summary of how strongly each variable contributes to the overall prediction across participants. Figure 2 presents the top 25 features with the highest mean absolute SHAP values, illustrating how both immune and environmental indicators dominate the model’s predictive structure.
Among the most influential factors, three patterns were apparent. The first pattern is about immunologic features, including total immunoglobulin E (IgE), eosinophil percentage, C-reactive protein (CRP), and the neutrophil-to-lymphocyte ratio (NLR). These biomarkers captured systemic and local inflammatory responses that were closely related to allergic sensitization. Their consistent importance suggested that the model accurately recognized the biological foundation of AR as a disease driven by immune dysregulation and inflammation.
The second group of key predictors represented environmental and exposure-related variables. Cotinine concentration and its interaction with self-reported allergy history were particularly notable. The role of tobacco-related exposure is amplifying allergic risk among sensitized individuals. Other environmental indicators, such as mildew exposure and the year of home construction, also appeared among the influential features, implying that older or damp living environments may heighten allergen exposure and promote chronic airway irritation.
The third category involves socioeconomic factors, including participants' education levels, household sizes, and income-to-poverty ratios. These factors were considered to indirectly influence the risk of allergies. The inclusion of these factors among the leading predictors suggests that the risk of susceptibility to allergies does not depend only on the biological aspects but also on other factors. Taken collectively, the SHAP analysis across the globe illustrated that both the immunologic and contextual variables play a crucial role in contributing toward the risk of allergic rhinitis. The presence of multiple interaction terms within the list of dominant variables suggested that the random forest model accurately identified and quantified the complex, non-additive interactions within the diverse groups. This essentially implies that the variables of immune activation, environmental challenges, and socioeconomic factors do not act independently but rather mutually combine and strengthen each other to influence the risk of allergies.
Although some immunologic predictors, such as total IgE and eosinophil percentage, showed moderate correlations with each other, the combination of the random forest model and SHAP analysis enabled the separation of their overlapping influences. This approach clarified the unique contribution of each variable and reduced the likelihood that the importance patterns were driven by shared variance rather than meaningful biological differences.
Interaction and Cross-Factor Effects
Beyond the effects of individual predictors, the SHAP interaction analysis revealed several meaningful cross-factor relationships that highlight how immunologic, environmental, and demographic determinants interact to shape the risk of allergic rhinitis. Among the most significant interactions were the relationship between allergic history and cotinine level, as well as the relationship between race and level of total immunoglobulin E. Both are shown in Figure 3 and Figure 4. These interactions can be seen as key in understanding the joint impact of the various variables in determining the chances of developing allergic rhinitis.
The first interaction in Figure 3 revealed a large difference in the magnitude of the predicted risk of AR attributable to allergic history across various levels of cotinine, a biomarker of nicotine exposure. The risk of AR significantly increased with escalating levels of cotinine among subjects who previously had allergies. This could imply that the presence of tobacco-associated chemicals could further heighten the risk of AR among those who are already prone to allergies. The risk of AR did not change much across the various levels of the biomarker among subjects who never had allergies. This trend suggests that environmental factors may serve as a potential risk amplifier, but not a risk factor only by itself. This trend also confirmed a previously observed risk contribution of tobacco exposure to the pathophysiology of allergies, such that tobacco induces the dysfunction of the epithelial barrier and the polarization of the Th2 type of immunity.
The second important interaction in Figure 4 concerned race and the total concentration of IgE. In this instance, the SHAP results revealed that the model used IgE differently depending on the race of the subjects. That is, for the non-Hispanic whites, a high level of IgE made a considerable contribution to a person’s risk of AR, whereas for the non-Hispanic blacks, a high level of IgE made a less considerable contribution to a person’s predicted probability of AR. This difference suggests that a given biomarker could have different meanings within a predictive model of allergies. The difference could be due to genetic factors, the environment, and the level of healthcare resources within a population.
Overall, these interaction patterns attested that the risk of allergic rhinitis cannot be attributed simply to the action of isolated predictors. Instead, the random forest model accurately replicated a variety of non-additive interactions wherein the effect of a biological risk factor, such as IgE/eosinophils, itself varied depending upon lifestyle and demographic circumstances. These patterns suggest that models with the comprehensive, multidimensional data can reflect not only statistical associations but also the underlying biological and social processes that come together to shape disease risk.
Individual SHAP Interactions Dashboard
Individual SHAP analysis was performed to understand how the random forest model combines demographic, environmental, and immunologic information to estimate the allergic rhinitis (AR) risk for each participant. This approach broke down the model’s prediction into feature-level contributions, showing how each variable increases or decreases an individual’s predicted probability compared with the overall population baseline. In doing so, it provided an intuitive view of how the model reasons at the individual level rather than at the group level. The dashboard that includes 996 individuals analysis results is discussed in the code availability part.
In this regard, to demonstrate the process involved in the interpretation, the selected example participants were #8 and #55, as highlighted in the figures below (Figure 5 & Figure 6). In the case of participant #8, the model showed a high predicted probability due to elevated levels of Total IgE, eosinophil percentage, and cotinine levels, which contributed to the prediction in relation to allergic rhinitis. Participants #55, on the other hand, were predicted to show a low possibility based on the values revealed, which were within the normal range, with no exposure to molds in the home, and no allergies.
In each force plot, the base value represented the average predicted risk across the dataset. At the same time, red and blue segments respectively showed features that increase or decrease the individual’s risk prediction. The length of each bar corresponded to the strength of the feature’s contribution. By visualizing the contribution of each variable, these plots enable the identification of which biological or environmental characteristics most strongly influence an individual’s predicted allergic risk.
The examples also indicated that SHAP analysis might be capable of identifying complex patterns that could not be observed using regression models. The combination of high IgE levels, eosinophilic activity, and nicotine sensitization for subject #8 suggested a viable biological mechanism of sensitization supported by the presence of environmental irritants. Subject #55 illustrated a well-regulated immune profile and a low-exposure environment, both of which were consistent with low predicted risk for AR. Both illustrate that model predictions are supported within the realm of biological knowledge and lend good face validity to the methodology.
The examples also indicated that SHAP analysis might be capable of identifying complex patterns that could not be observed using regression models. The combination of high IgE levels, eosinophilic activity, and nicotine sensitization for subject #8 suggested a viable biological mechanism of sensitization supported by the presence of environmental irritants. Subject #55 illustrated a well-regulated immune profile and a low-exposure environment, both of which were consistent with low predicted risk for AR. Both illustrate that model predictions are supported within the realm of biological knowledge and lend good face validity to the methodology.
Beyond illustrating how predictions were made, the individual SHAP interpretation provided potential value for clinical and public health applications. At the clinical level, such individualized explanations could support physicians in identifying people whose allergic risk arises mainly from environmental exposure versus immune dysregulation, allowing more targeted preventive measures. At the population level, visualizing thousands of these individualized contributions could help highlight subgroups most affected by certain exposures, informing community-level interventions such as indoor air quality improvement or anti-smoking campaigns.
Overall, the individual SHAP analysis provides a clear and understandable link between the model’s predictions and their practical meaning. It makes the model’s reasoning visible at the level of each participant, which supports more personalized and fair assessments of allergy risk. Additional examples of SHAP force plots for other participants are explained in the code availability part.
Grouped SHAP Interaction Dashboard
To better capture the complex structure of allergic risk, grouped SHAP analyses were conducted to aggregate individual feature contributions across immunologic, environmental, and socioeconomic dimensions. This approach moves beyond subject-level interpretation and allows a broader understanding of how systematic dependencies and cross-domain interactions collectively influence the probability of allergic rhinitis (AR) in the model. The dashboard saves all the combination of predictors towards mean SHAP effect contributions is discussed in the code availability part.
Immune-Related Effects. Immune-related predictors influenced AR risk in nonlinear and context-dependent ways rather than through simple additive relationships. The contribution of total IgE increased sharply under moderate systemic inflammation, as reflected by the neutrophil-to-lymphocyte ratio (NLR), but declined when inflammation became excessive. This pattern suggests a biological threshold where balanced immune activation enhances allergic sensitization, while severe inflammation suppresses Th2-dominant pathways. Eosinophil activity showed a strong positive synergy with IgE, consistent with Th2-mediated allergic inflammation, whereas its interaction with cotinine was negative, indicating that tobacco exposure may suppress eosinophil-related immune responses.
Additionally, the combined pattern of C-reactive protein (CRP) and body mass index (BMI) revealed that mild metabolic inflammation appeared to amplify allergic risk, while prolonged metabolic imbalance in severe obesity weakened this effect. Together, these findings suggested that allergic rhinitis susceptibility is shaped by a delicate homeostatic balance among immune, inflammatory, and metabolic factors. Moderate activation tends to enhance the likelihood of allergic sensitization, but excessive or chronic inflammation can lead to immune desensitization or suppression. Supplementary SHAP plots that visualize these nonlinear patterns will be explained in the code avalibility part.
Environmental and socioeconomic effects. The grouped SHAP analysis of environmental and socioeconomic factors revealed that the broader living context plays a significant role in shaping the risk of allergic rhinitis. This influence appeared through both direct effects and more subtle indirect pathways. One notable pattern was about the poverty–income ratio. Participants in the lowest income ranges tended to have higher SHAP values, indicating a greater predicted susceptibility to allergic rhinitis. This association gradually diminished among individuals with higher socioeconomic status.
The interaction between PIR and race further showed that economic disadvantage disproportionately affects non-Hispanic Black and Hispanic participants, indicating that structural and social inequalities magnify biological vulnerability to allergic diseases. Housing-related indicators, such as the year of home construction and the presence of mildew, were also positively associated with model predictions. These findings suggested that older dwellings and damp living environments may increase allergen accumulation and sustain chronic exposure to irritants, reinforcing inflammatory responses.
However, having pets appeared to be a small protective effect. One possible explanation is that for individuals consistently exposed to pet-related allergens, it may help them develop a stronger immune system than those who are not. As for household settings, individuals living in lower-income areas or homes with poorer ventilation and maintenance often face a higher risk of sensitization, while those in cleaner and more stable living environments tend to experience fewer allergic symptoms.
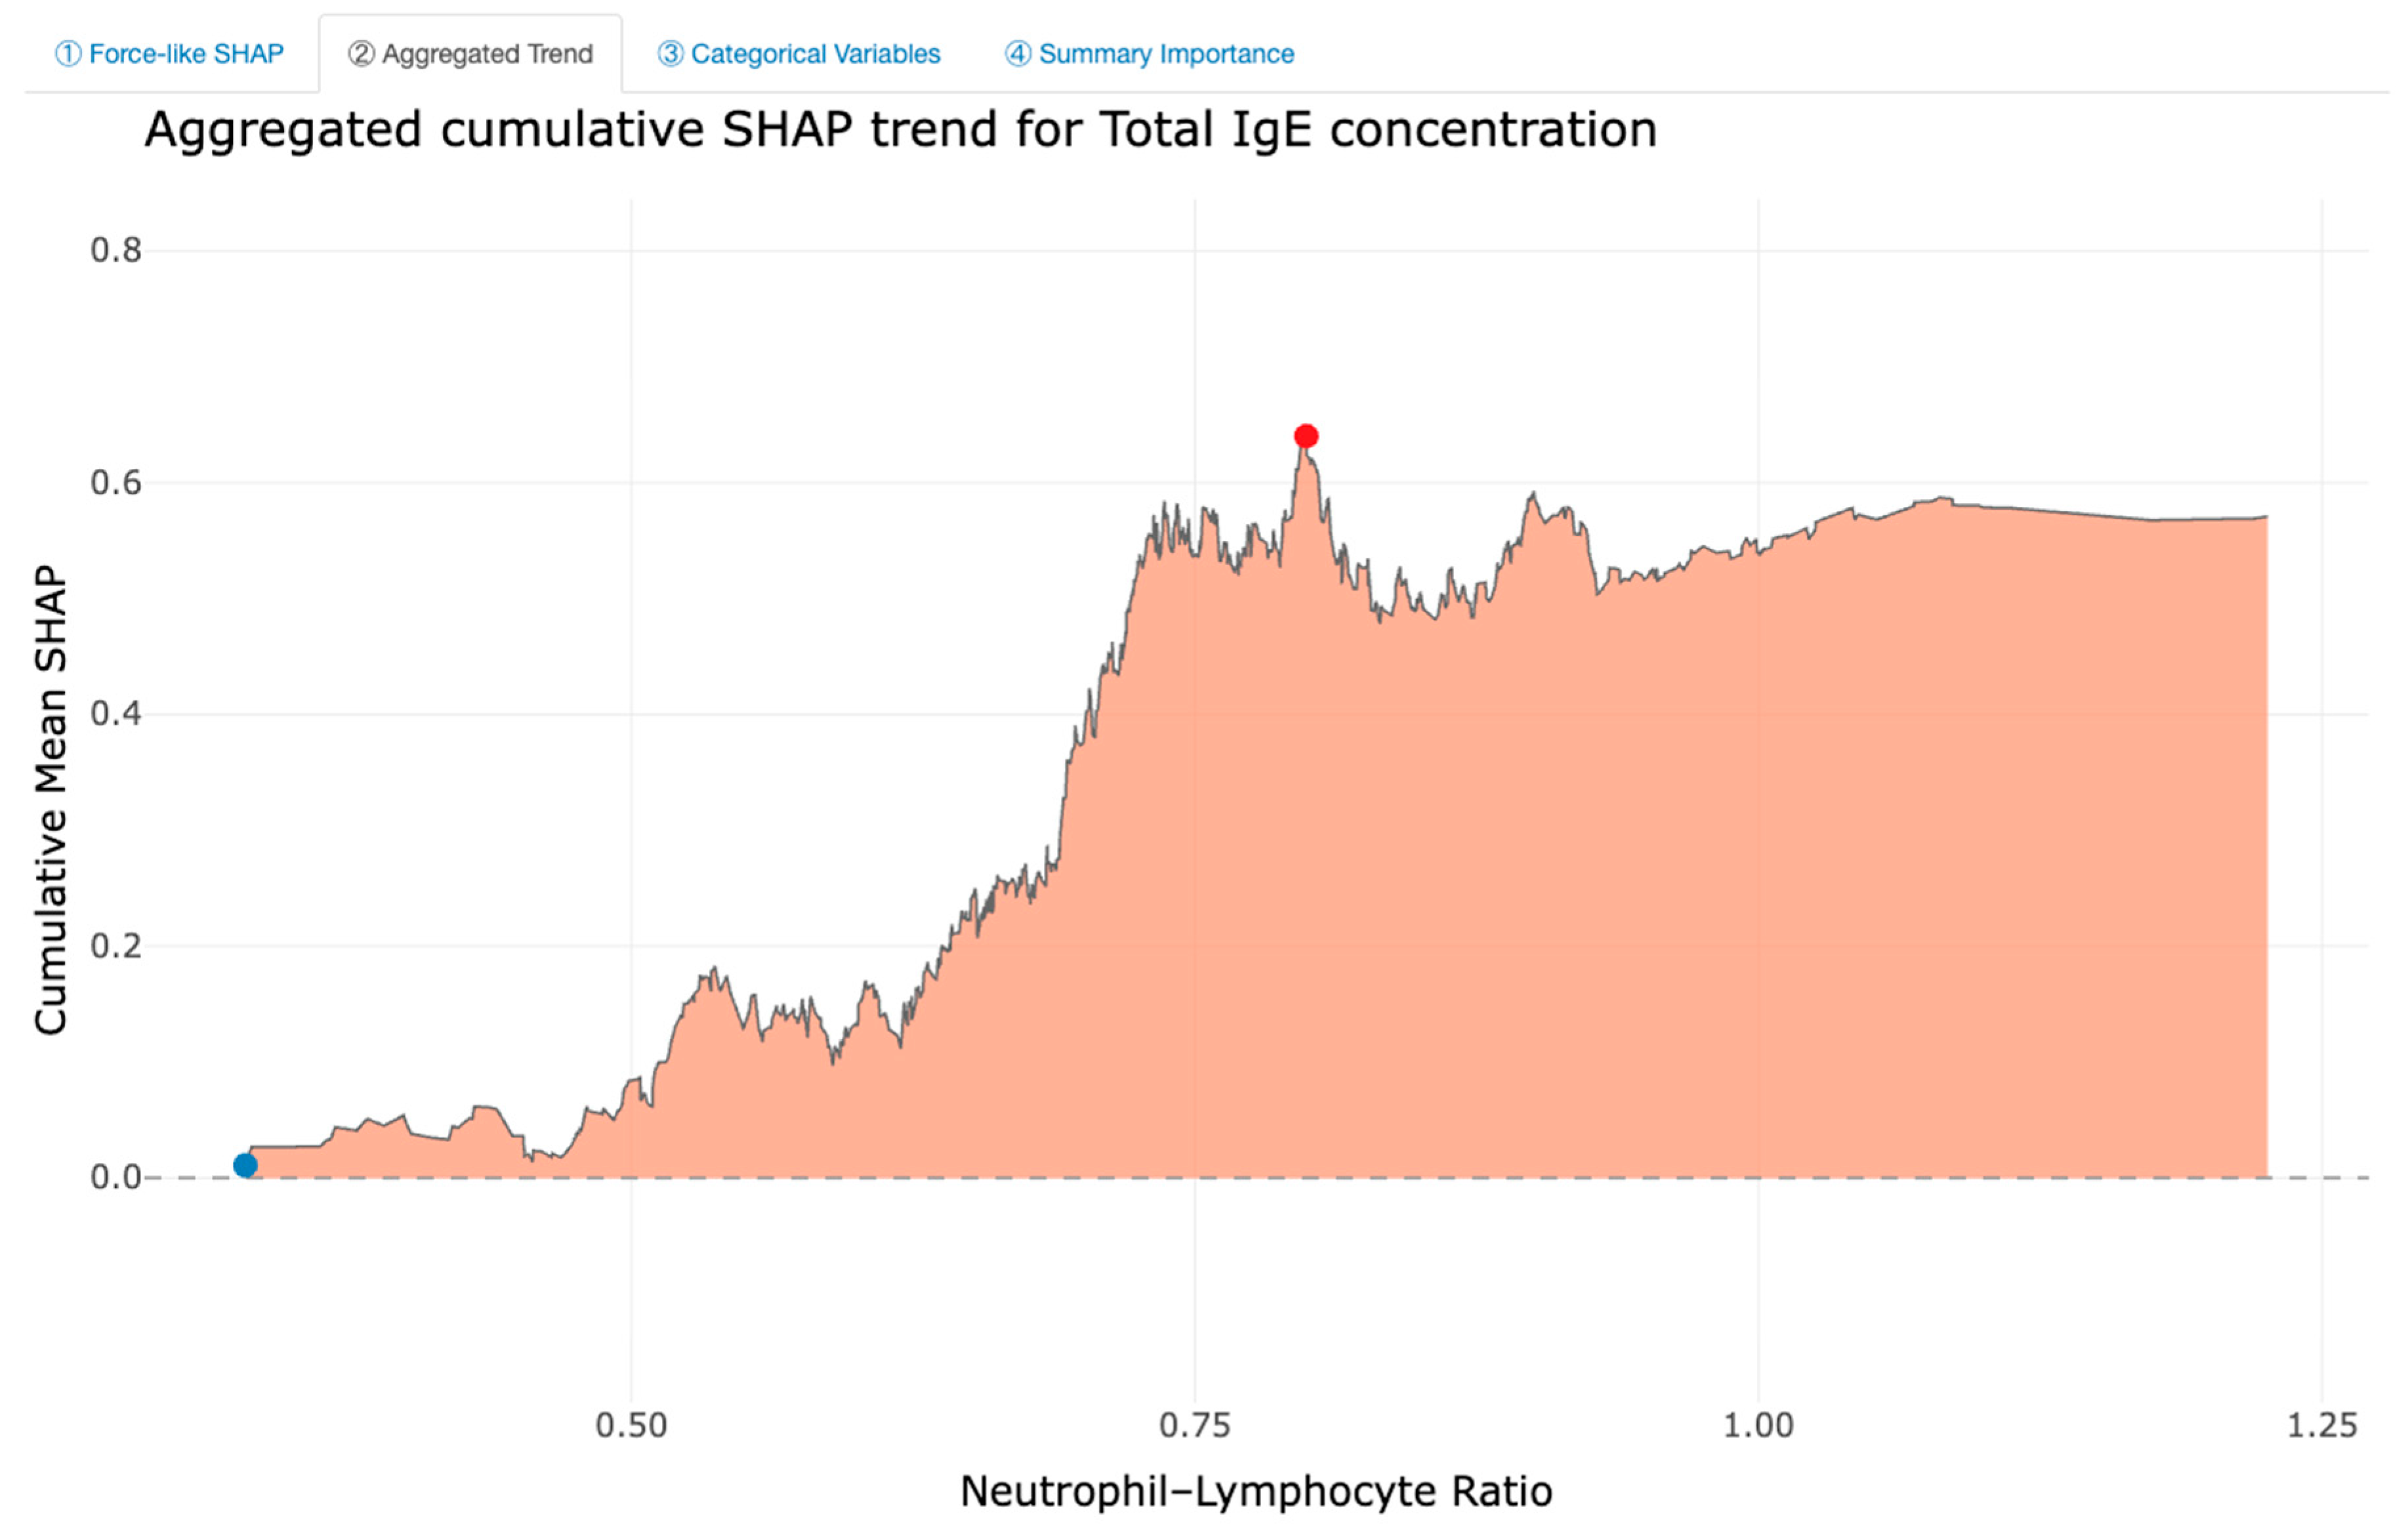
Integrated interpretation and implications. To show how grouped SHAP analysis connects individual patterns with population-wide trends, Figure 7 and Figure 8 use total IgE and the neutrophil-to-lymphocyte ratio (NLR) as an example. In Figure 7, the force-like plot is constructed by first sorting all observations from low to high NLR and then cumulatively summing the SHAP contributions of IgE along this ordered sequence. The vertical axis, therefore, reflects the cumulative IgE SHAP effect rather than the NLR effect. This format makes it easier to see how IgE’s influence on the prediction grows, plateaus, or reverses at different points in the NLR distribution, revealing fine-scale fluctuations that highlight individual variability. By contrast, Figure 8 averages the IgE SHAP contributions within small NLR intervals, producing a smoother curve that emphasizes the overall trend at the population level. The aggregated version removes the noise of case-to-case differences and reveals the general shape of the interaction between IgE and NLR. Together, the two plots illustrate how grouped SHAP can be interpreted: the cumulative force plot highlights local, individual-level changes in IgE’s contribution as NLR increases, while the aggregated plot summarizes these changes into an interpretable mean effect across the population.
In summary, Figure 7 and Figure 8 suggest that the influence of total IgE on the model’s predictions is not constant across the NLR range. IgE contributes most strongly when NLR is in a moderate zone, while its effect becomes weaker at both low and high levels of inflammation. This pattern suggests that the model considers IgE to be most informative when immune activation is neither minimal nor extreme, indicating a nonlinear interaction in which moderate systemic inflammation enhances the predictive value of IgE. Although this interpretation reflects model behavior rather than direct biology, it aligns with the idea that allergic sensitization often emerges under intermediate immune reactivity rather than during intense inflammatory states.
Group SHAP plots serve as the interpretive bridges between case-level SHAP results and population-level conclusions. They help explain how grouped SHAP relationships across immunologic, environmental, and socioeconomic domains exhibit similar threshold or nonlinear behaviors. In this study, these visualizations were not used as a methodological innovation, but rather as an explanatory tool to clarify how model-derived feature effects can be understood biologically and socially. Furthermore, subgroup-level patterns revealed that the direction and strength of feature effects varied across different population segments. Immune markers such as IgE and eosinophil percentage consistently contributed to AR risk, yet their SHAP impact differed by race, income, and educational background. Participants from socioeconomically disadvantaged or minority groups tended to show stronger combined effects of environmental and immunologic variables, suggesting that biological sensitivity may be amplified under cumulative social stressors. Recognizing this heterogeneity is essential for developing equitable public health strategies, since uniform prevention or intervention approaches may overlook high-risk subgroups facing both biological vulnerability and environmental disadvantage. Additional grouped SHAP plots for other variable combinations will be explained in code availability part.
Public Health Implications. The implications of this study extend beyond model accuracy. Incorporating demographic, environmental, and immunologic information allows the analysis to reflect the real-world conditions in which allergic rhinitis develops. The SHAP patterns also indicate several risk factors that can be realistically modified. Reducing tobacco smoke, improving household ventilation, and addressing indoor dampness or mold may help lower the chance of developing allergic symptoms, particularly for people who already show a heightened immune response. The comparisons across different subgroups further show that clinical indicators alone do not fully explain who is most vulnerable. Social and environmental conditions play a meaningful role, and they should be considered when planning community-level prevention efforts. Interpretable machine-learning results can support this process by helping local health programs notice emerging issues earlier and tailor interventions to the needs of specific neighborhoods or populations. In this way, the insights gained from the model can contribute to more equitable and practical strategies for reducing the burden of allergic rhinitis.
Conclusions
This work developed and explained machine learning models to predict allergic rhinitis (AR) using a combination of demographic, environmental, and immunological factors within a nationally representative population sample from NHANES. The random forest model provided the most stable performance accuracy and was used for SHAP explanation. The study indicated that the vulnerability to AR risk is not a result of a single biomarker or environmental factor, but rather a complex interplay of various factors. The results also showed that essential factors influencing AR risk are biomarkers for the Th2 response of the immune system; however, these factors do not have a linear effect. The impact of these variables operates in tandem with other environmental variables, thus suggesting that the risk of AR has a multifaceted relationship between the living conditions and the immune system function.
Interaction analyses provided a clearer understanding of how these relationships unfold across the population. For example, the risk associated with individuals reporting a history of allergies, as well as greater exposure to nicotine, helps to highlight the potential role of a combination of vulnerability and environmental exposure in the exacerbation of risk. The differences in the predictive odds of IgE by race help to highlight the role of potential differences in genetic, social, and exposure profiles, as these might influence the interpretation of immune measures in the presence of this particular disease marker. Overall, these observations are consistent with the idea that the risk of allergic rhinitis has a multifaceted profile, in terms of variation both between and within groups in the population.
The grouped SHAP analyses further contextualized these interactions by summarizing how immunologic, environmental, and socioeconomic gradients jointly shape AR probability. The results identified a nonlinear “threshold zone” of susceptibility, in which moderate systemic inflammation and intermediate immune activation were most predictive of allergic outcomes, whereas either very low or excessive inflammatory activity reduced model-attributed risk. This homeostatic pattern aligns with biological evidence suggesting that balanced immune activation promotes sensitization, while chronic or overwhelming inflammation can suppress Th2 pathways. Importantly, the model also indicated that socioeconomic disadvantage and poor housing conditions intensified these immune effects, pointing to a compounded risk pathway in which social stressors and environmental exposures interact with biological sensitivity.
Collectively, these findings suggested that allergic rhinitis should be viewed as a systems-level condition influenced by a complex interplay of determinants. The combination of the factors above within the framework of a transparent and understandable machine learning model fosters a more inclusive perspective on heterogeneity that encompasses both mechanistic and population-driven aspects. The interweaving of the relationship between the balance of the immune response and contextual adversities illustrated the ways through which intervention and prevention strategies might be applied. The reduction of tobacco smoke, the control of indoor allergens such as mold, and the improvement of low-income dwelling quality could be beneficial in reducing the burden of AR. Individual and aggregate model explanations might also serve the purpose of prioritized screening and educational programs.
Finally, the research work that has been presented throughout this study has demonstrated the role that explainable AI can play in terms of forming a link between mechanistic modeling efforts of the immune system, as well as population modeling. The research work not only represents the advancement made in terms of the precision offered in the management of the population through the use of AI models based on the mechanisms pertaining to the immune systems but also aims to demonstrate the importance of interactions between the variables that affect the mechanisms of the immune systems in the existing environmental conditions.
Data Availability
The data used in this research were all extracted from the National Health and Nutrition Examination Survey, which can be accessed freely in the form of a public database through https://www.cdc.gov/nchs/nhanes/. The data set used in this research is the 2005-2006 cycles, including demographic, environmental, immunologic variables, etc. For more details, please visit the NHANES official website.
Code Availability
All codes and processed data required to reproduce the analyses are openly available on GitHub at https://github.com/WenxiaoZhou/NHANES-AR-Prediction. This repository contains all R scripts performed for model training and testing, SHAP interpretation, and dashboards, as well as documentation for reproducibility. Two Interactive visualization dashboards developed in R Shiny to support for both individual and group SHAP interpretation are also available online, allowing exploration of both individual-level interpretations of allergic rhinitis risk at https://wenxiaozh-datalearner.shinyapps.io/ANLY699_AR_SHAP_Individual_Dashboard/, and group-level SHAP interpretations of allergic rhinitis risk at https://wenxiaozh-datalearner.shinyapps.io/ANLY699_AR_SHAP_Group_Dashboard/.
Conflicts of Interest
No known conflict of interest to disclose.
References
- Agache, I.; Akdis, C.; Akdis, M.; Al-Hemoud, A.; Annesi-Maesano, I.; Balmes, J.; Cecchi, L.; Damialis, A.; Haahtela, T.; Haber, A. L.; Hart, J. E.; Jutel, M.; Mitamura, Y.; Mmbaga, B. T.; Oh, J.-W.; Ostadtaghizadeh, A.; Pawankar, R.; Johnson, M.; …Nadeau, K. C. Climate change and allergic diseases: A scoping review. The Journal of Climate Change and Health 2024, 20, 100350. [Google Scholar] [CrossRef]
- Bousquet, J.; Khaltaev, N.; Cruz, A. A.; Denburg, J.; Fokkens, W. J.; Togias, A.; Zuberbier, T.; Baena-Cagnani, C. E.; Canonica, G. W.; van Weel, C.; Agache, I.; Aït-Khaled, N.; Bachert, C.; Blaiss, M. S.; Bonini, S.; Boulet, L. P.; Bousquet, P. J.; Camargos, P.; Carlsen, K. H.; …Williams, D. Allergic Rhinitis and its Impact on Asthma (ARIA) 2008 update. Allergy 2008, 63(s86), 8–160. [Google Scholar] [CrossRef]
- Bousquet, J.; Schünemann, H. J.; Togias, A.; Bachert, C.; Erhola, M.; Hellings, P. W.; Klimek, L.; Pfaar, O.; Wallace, D.; Ansotegui, I.; Agache, I.; Bedbrook, A.; Bergmann, K.-C.; Bewick, M.; Bonniaud, P.; Bosnic-Anticevich, S.; Bossé, I.; Bouchard, J.; Boulet, L.-P.; …Zuberbier, T. Next-generation Allergic Rhinitis and Its Impact on Asthma (ARIA) guidelines for allergic rhinitis based on Grading of Recommendations Assessment, Development and Evaluation (GRADE) and real-world evidence. Journal of Allergy and Clinical Immunology 2020, 145(1), 70–80.e3. [Google Scholar] [CrossRef]
- Clausing, E. S.; Tomlinson, C. J.; Non, A. L. Epigenetics and social inequalities in asthma and allergy. Journal of Allergy and Clinical Immunology 2023, 151(6), 1468–1470. [Google Scholar] [CrossRef]
- Damialis, A.; Gilles, S. Air quality in the era of climate change: Bioaerosols, multi-exposures, and the emerging threats of respiratory allergies and infectious diseases. Current Opinion in Environmental Science & Health 46 2025, 100634. [Google Scholar] [CrossRef]
- Dramburg, S.; Grittner, U.; Potapova, E.; Travaglini, A.; Tripodi, S.; Arasi, S.; Pelosi, S.; Acar Şahin, A.; Aggelidis, X.; Barbalace, A.; Bourgojn, A.; Bregu, M.; Brighetti, M. A.; Caeiro, E.; Caminiti, L.; Charpin, D.; Couto, M.; Delgado, L.; …Matricardi, P. M. Heterogeneity of sensitization profiles and clinical phenotypes among patients with seasonal allergic rhinitis in Southern European countries—The @IT.2020 multicenter study. Allergy 2024, 79(4), 908–923. [Google Scholar] [CrossRef] [PubMed]
- Espada-Sánchez, M.; Sáenz de Santa María, R.; Martín-Astorga, M. C.; Lebrón-Martín, C.; Delgado, M. J.; Eguiluz-Gracia, I.; Rondón, C.; Mayorga, C.; Torres, M. J.; Aranda, C. J.; Cañas, J. A. Diagnosis and treatment in asthma and allergic rhinitis: Past, present, and future. Applied Sciences 2023, 13(3), 1273. [Google Scholar] [CrossRef]
- Fu, D.; Zhao, C.; Yang, J.; Meng, Y.; Tian, S.; Qian, Y.; Yu, S. Artificial intelligence applications in allergic rhinitis diagnosis: Focus on ensemble learning. Asia Pacific Allergy 2024, 14(2), 56–62. [Google Scholar] [CrossRef]
- Haahtela, T. A biodiversity hypothesis. Allergy 2019, 74(8), 1445–1456. [Google Scholar] [CrossRef]
- Huang, H.-C.; Zou, M.-L.; Chen, Y.-H.; Jiang, C.-B.; Wu, C.-D.; Lung, S.-C. C.; Chien, L.-C.; Lo, Y.-C.; Chao, H. J. Effects of indoor air quality and home environmental characteristics on allergic diseases among preschool children in the Greater Taipei Area. Science of the Total Environment 897 2023, 165392. [Google Scholar] [CrossRef] [PubMed]
- Kong, E.; Cucco, A.; Custovic, A.; Fontanella, S. Machine learning in allergy research: A bibliometric review. Immunology Letters 277 2026, 107088. [Google Scholar] [CrossRef]
- Kothalawala, D. M.; Murray, C. S.; Simpson, A.; Custovic, A.; Tapper, W. J.; Arshad, S. H.; Holloway, J. W.; Rezwan; F. I; on behalf of STELAR/UNICORN investigators. Development of childhood asthma prediction models using machine learning approaches. Clinical and Translational Allergy 2021, 11(10), e12076. [Google Scholar] [CrossRef]
- Kowalczyk, A.; Krogulska, A. Clinical relevance of cluster analysis in phenotyping allergic rhinitis in the paediatric population of the Kuyavian Pomeranian voivodeship, Poland. Postępy Dermatologii i Alergologii 2024, 41(1), 56–65. [Google Scholar] [CrossRef]
- Larenas-Linnemann, D. E. S.; Mayorga-Bustamante, J. L.; Patrón, J. L.; Maza-Solano, J.; Emelyanov, A. V.; Dolci, R. L.; Miyake, M. M.; Okamoto, Y.; …Okamoto, Y. Global expert views on the diagnosis, classification and pharmacotherapy of allergic rhinitis in clinical practice using a modified Delphi panel technique. World Allergy Organization Journal 2023, 16(7), 100800. [Google Scholar] [CrossRef]
- Lu, C.; Liu, Z.; Liao, H.; Yang, W.; Li, Q.; Liu, Q. Effects of early life exposure to home environmental factors on childhood allergic rhinitis: Modifications by outdoor air pollution and temperature. Ecotoxicology and Environmental Safety 244 2022, 114076. [Google Scholar] [CrossRef]
- Malizia, V.; Cilluffo, G.; Fasola, S.; Ferrante, G.; Landi, M.; Montalbano, L.; Licari, A.; La Grutta, S. Endotyping allergic rhinitis in children: A machine learning approach. Pediatric Allergy and Immunology 2022, 33(S27), 18–21. [Google Scholar] [CrossRef] [PubMed]
- Ozdoganoglu, T.; Songu, M. The burden of allergic rhinitis and asthma. Therapeutic Advances in Respiratory Disease 2011, 6(1), 11–23. [Google Scholar] [CrossRef] [PubMed]
- Pang, K.; Li, G.; Li, M.; Zhang, L.; Fu, Q.; Liu, K.; Zheng, W.; Wang, Z.; Zhong, J.; Lu, L.; Li, P.; Zhou, Y.; Zhang, W.; Zhang, Q. Prevalence and risk factors for allergic rhinitis in China: A systematic review and meta-analysis. Evidence-Based Complementary and Alternative Medicine 2022, 7165627. [Google Scholar] [CrossRef] [PubMed]
- Perry, T. T.; Grant, T. L.; Dantzer, J. A.; Udemgba, C.; Jefferson, A. A. Impact of socioeconomic factors on allergic diseases. Journal of Allergy and Clinical Immunology 2024, 153(2), 368–377. [Google Scholar] [CrossRef]
- Peterson, R.; Keswani, A. The impact of social determinants and air pollution on healthcare disparities in chronic rhinosinusitis with nasal polyps. American Journal of Rhinology & Allergy 2023, 37(2), 147–152. [Google Scholar] [CrossRef]
- Ramratnam, S. K.; Johnson, M.; Visness, C. M.; Calatroni, A.; Altman, M. C.; Janczyk, T.; …Gern, J. E. Clinical and molecular analysis of longitudinal rhinitis phenotypes in an urban birth cohort. Journal of Allergy and Clinical Immunology 2024, 155(2), 547–556. [Google Scholar] [CrossRef]
- Saarela, M.; Podgorelec, V. Recent applications of explainable AI (XAI): A systematic literature review. Applied Sciences 2024, 14(19), 8884. [Google Scholar] [CrossRef]
- Sadeghi, Z.; Alizadehsani, R.; Cifci, M. A.; Kausar, S.; Rehman, R.; Mahanta, P.; Bora, P. K.; Almasri, A.; Alkhawaldeh, R. S.; Hussain, S.; Alatas, B.; Shoeibi, A.; Moosaei, H.; Hladík, M.; Nahavandi, S.; Pardalos, P. M. A review of explainable artificial intelligence in healthcare. Computers and Electrical Engineering 118 2024, 109370. [Google Scholar] [CrossRef]
- Savouré, M.; Bousquet, J.; Leynaert, B.; Renuy, A.; Siroux, V.; Goldberg, M.; Zins, M.; Jacquemin, B.; Nadif, R. Rhinitis phenotypes and multimorbidities in the general population: The CONSTANCES cohort. European Respiratory Journal 2023, 61(6), 2200943. [Google Scholar] [CrossRef]
- Sharma, S.; Yang, I. V.; Schwartz, D. A. Epigenetic regulation of immune function in asthma. Journal of Allergy and Clinical Immunology 2022, 150(2), 259–265. [Google Scholar] [CrossRef]
- Tran, H. M.; Tsai, F.-J.; Lee, Y.-L.; Chang, J.-H.; Chang, L.-T.; Chang, T.-Y.; Chung, K. F.; Kuo, H.-P.; Lee, K.-Y.; Chuang, K.-J.; Chuang, H.-C. The impact of air pollution on respiratory diseases in an era of climate change: A review of the current evidence. Science of the Total Environment 898 2023, 166340. [Google Scholar] [CrossRef]
- Urrutia-Pereira, M.; Guidos-Fogelbach, G.; Solé, D. Climate changes, air pollution and allergic diseases in childhood and adolescence. Jornal de Pediatria 2021, 98(S1), S47–S54. [Google Scholar] [CrossRef]
- Wang, D. Y. Risk factors of allergic rhinitis: genetic or environmental? Therapeutics and clinical risk management 2005, 1(2), 115–123. [Google Scholar] [CrossRef] [PubMed]
- Wang, J.; Zhang, Y.; Li, B.; Zhao, Z.; Huang, C.; Zhang, X.; Deng, Q.; Lu, C.; Qian, H.; Yang, X.; Sun, Y.; Norbäck, D. Effects of mold, water damage and window pane condensation on adult rhinitis and asthma partly mediated by different odors. Building and Environment 227 2023, 109814. [Google Scholar] [CrossRef]
- Wu, A. C.; Dahlin, A.; Wang, A. L. The role of environmental risk factors on the development of childhood allergic rhinitis. Children 2021, 8(8), 708. [Google Scholar] [CrossRef] [PubMed]
- Yavuz, S. T.; Oksel Karakus, C.; Custovic, A.; Kalayci, Ö. Four subtypes of childhood allergic rhinitis identified by latent class analysis. Pediatric Allergy and Immunology 2021, 32(8), 1691–1699. [Google Scholar] [CrossRef] [PubMed]
- Zhang, Y.; Lan, F.; Zhang, L. Advances and highlights in allergic rhinitis. Allergy 2021, 76(11), 3383–3389. [Google Scholar] [CrossRef] [PubMed]
Figure 2.
Top 25 Most Important Features with Absolute SHAP values.
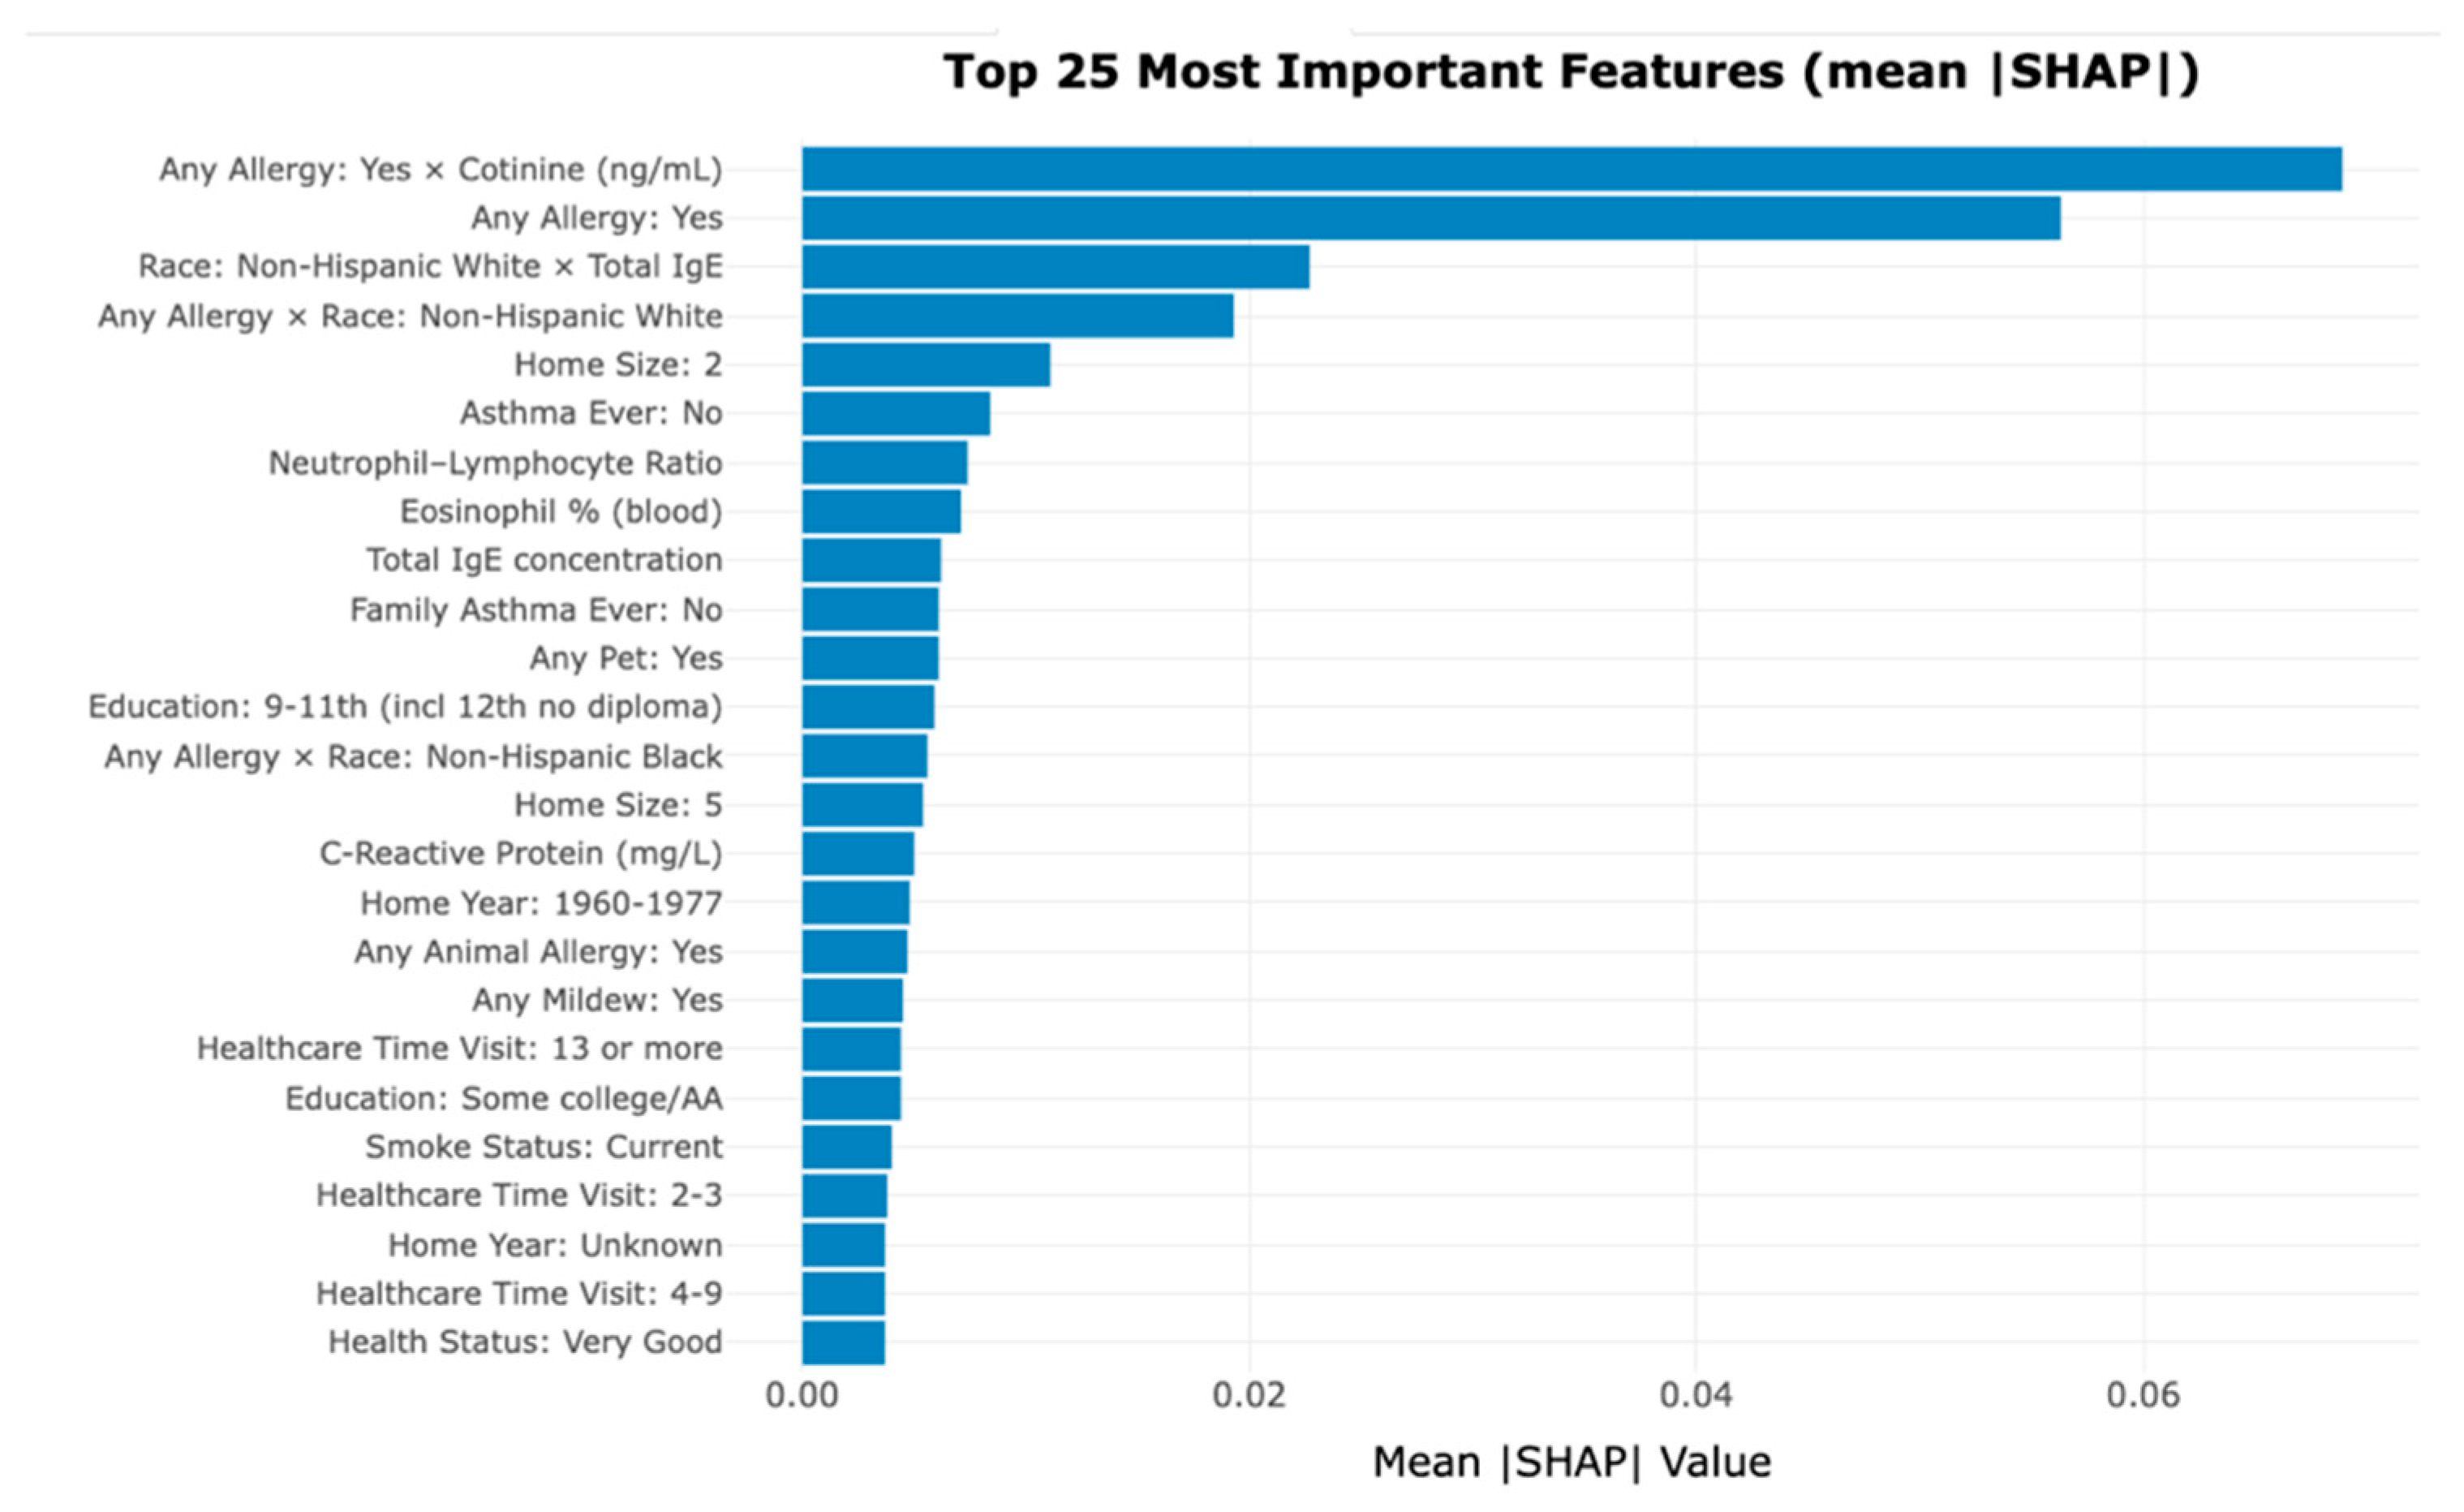
Figure 3.
Mean SHAP Values Illustrating the Interaction Between Allergy Status as Yes and Cotinine Exposure Level by Race.
Figure 3.
Mean SHAP Values Illustrating the Interaction Between Allergy Status as Yes and Cotinine Exposure Level by Race.
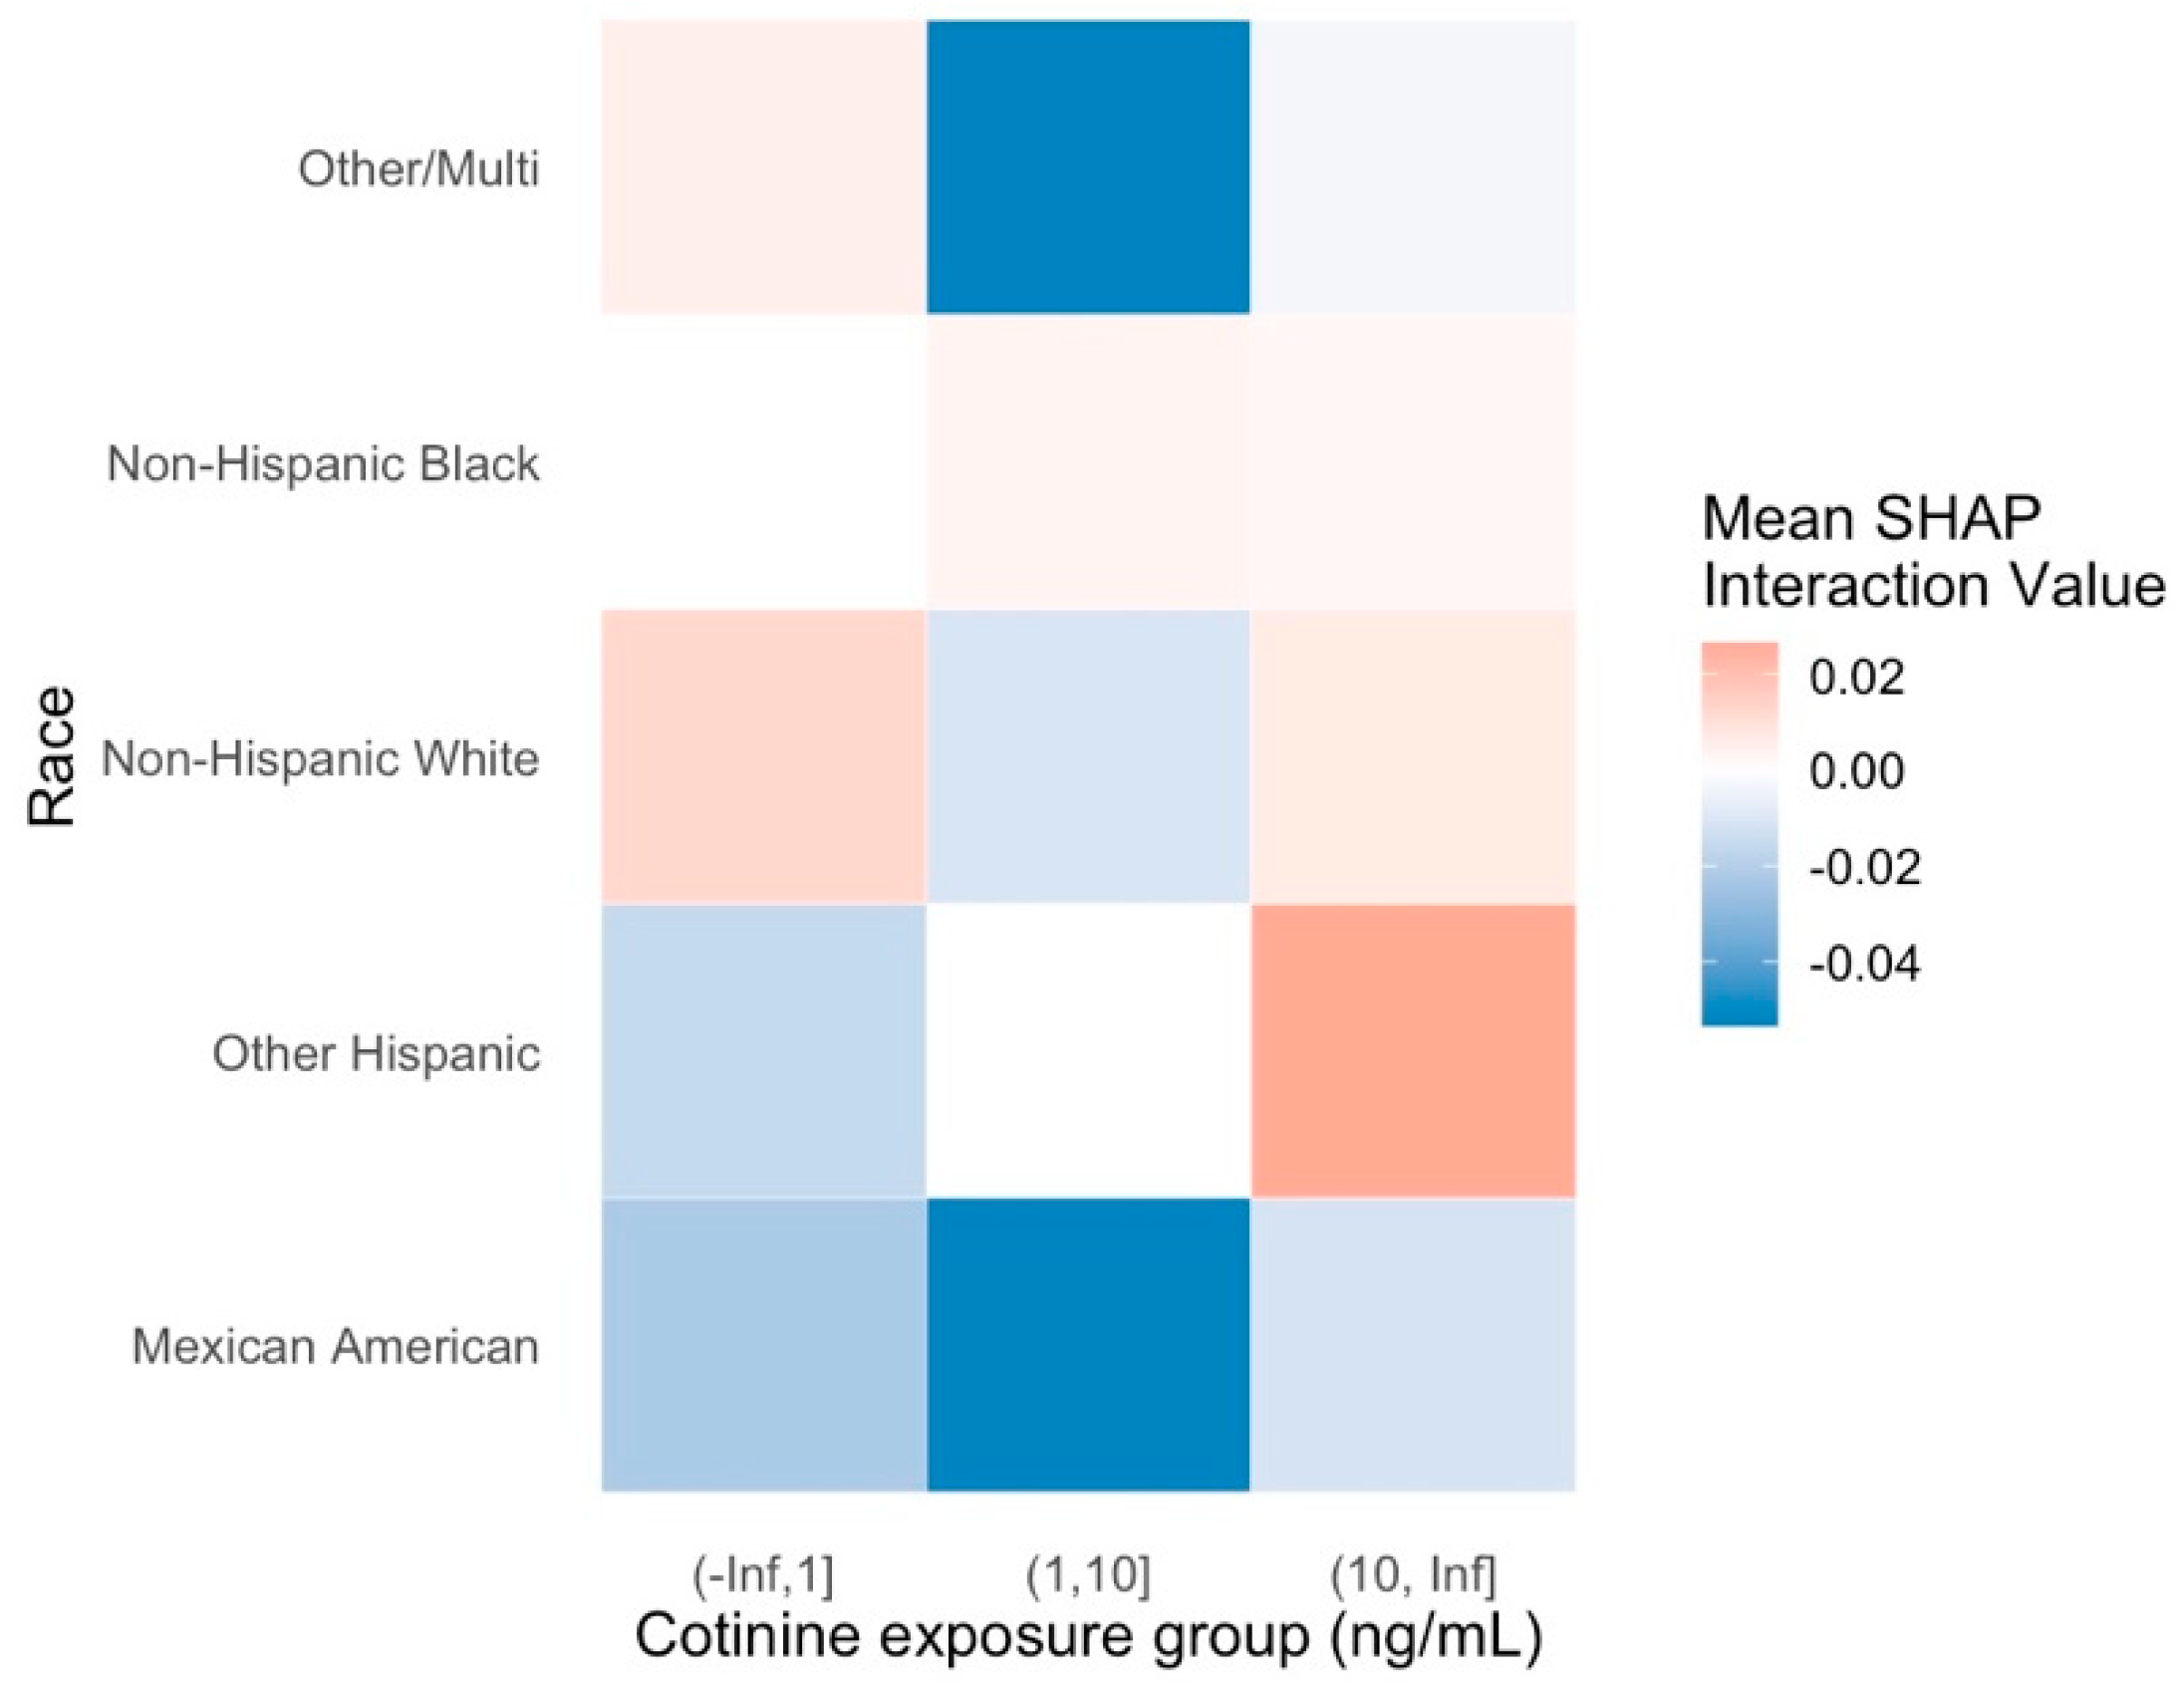
Figure 4.
SHAP Interaction Effect of Race and Total IgE Group on Predicted AR Risk.
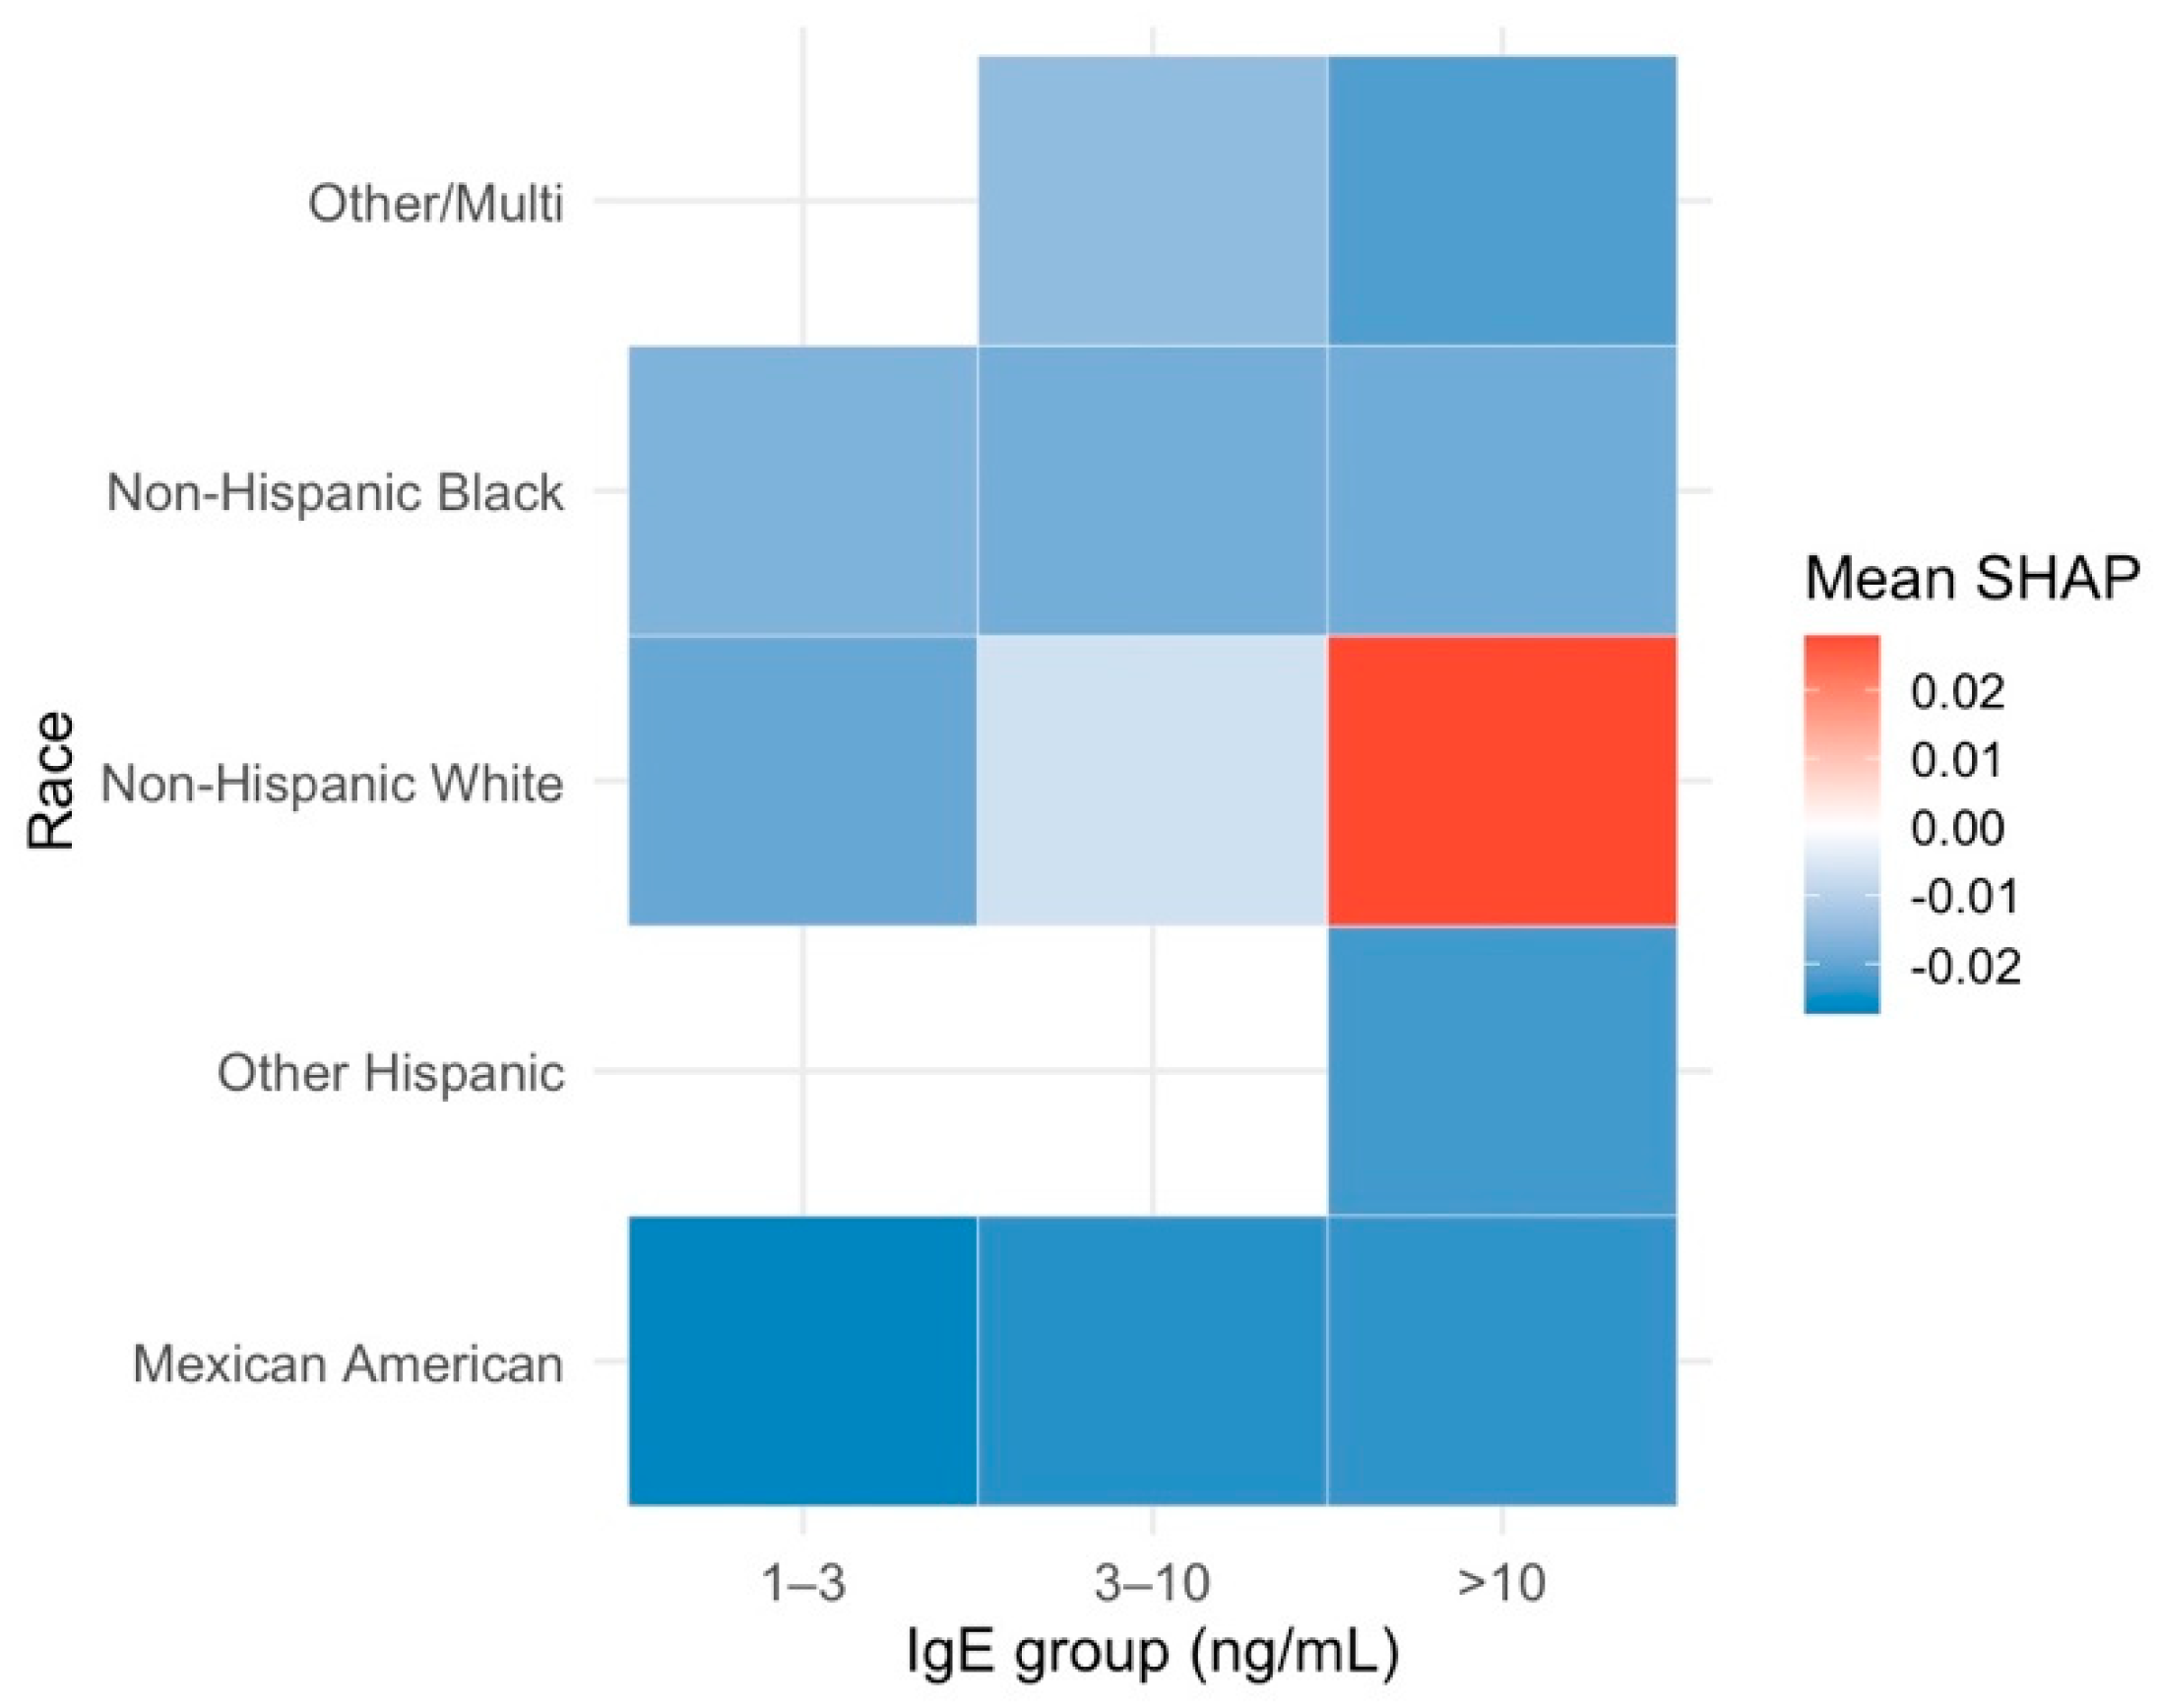
Figure 5.
Interactive Top SHAP Features for Participant #8.
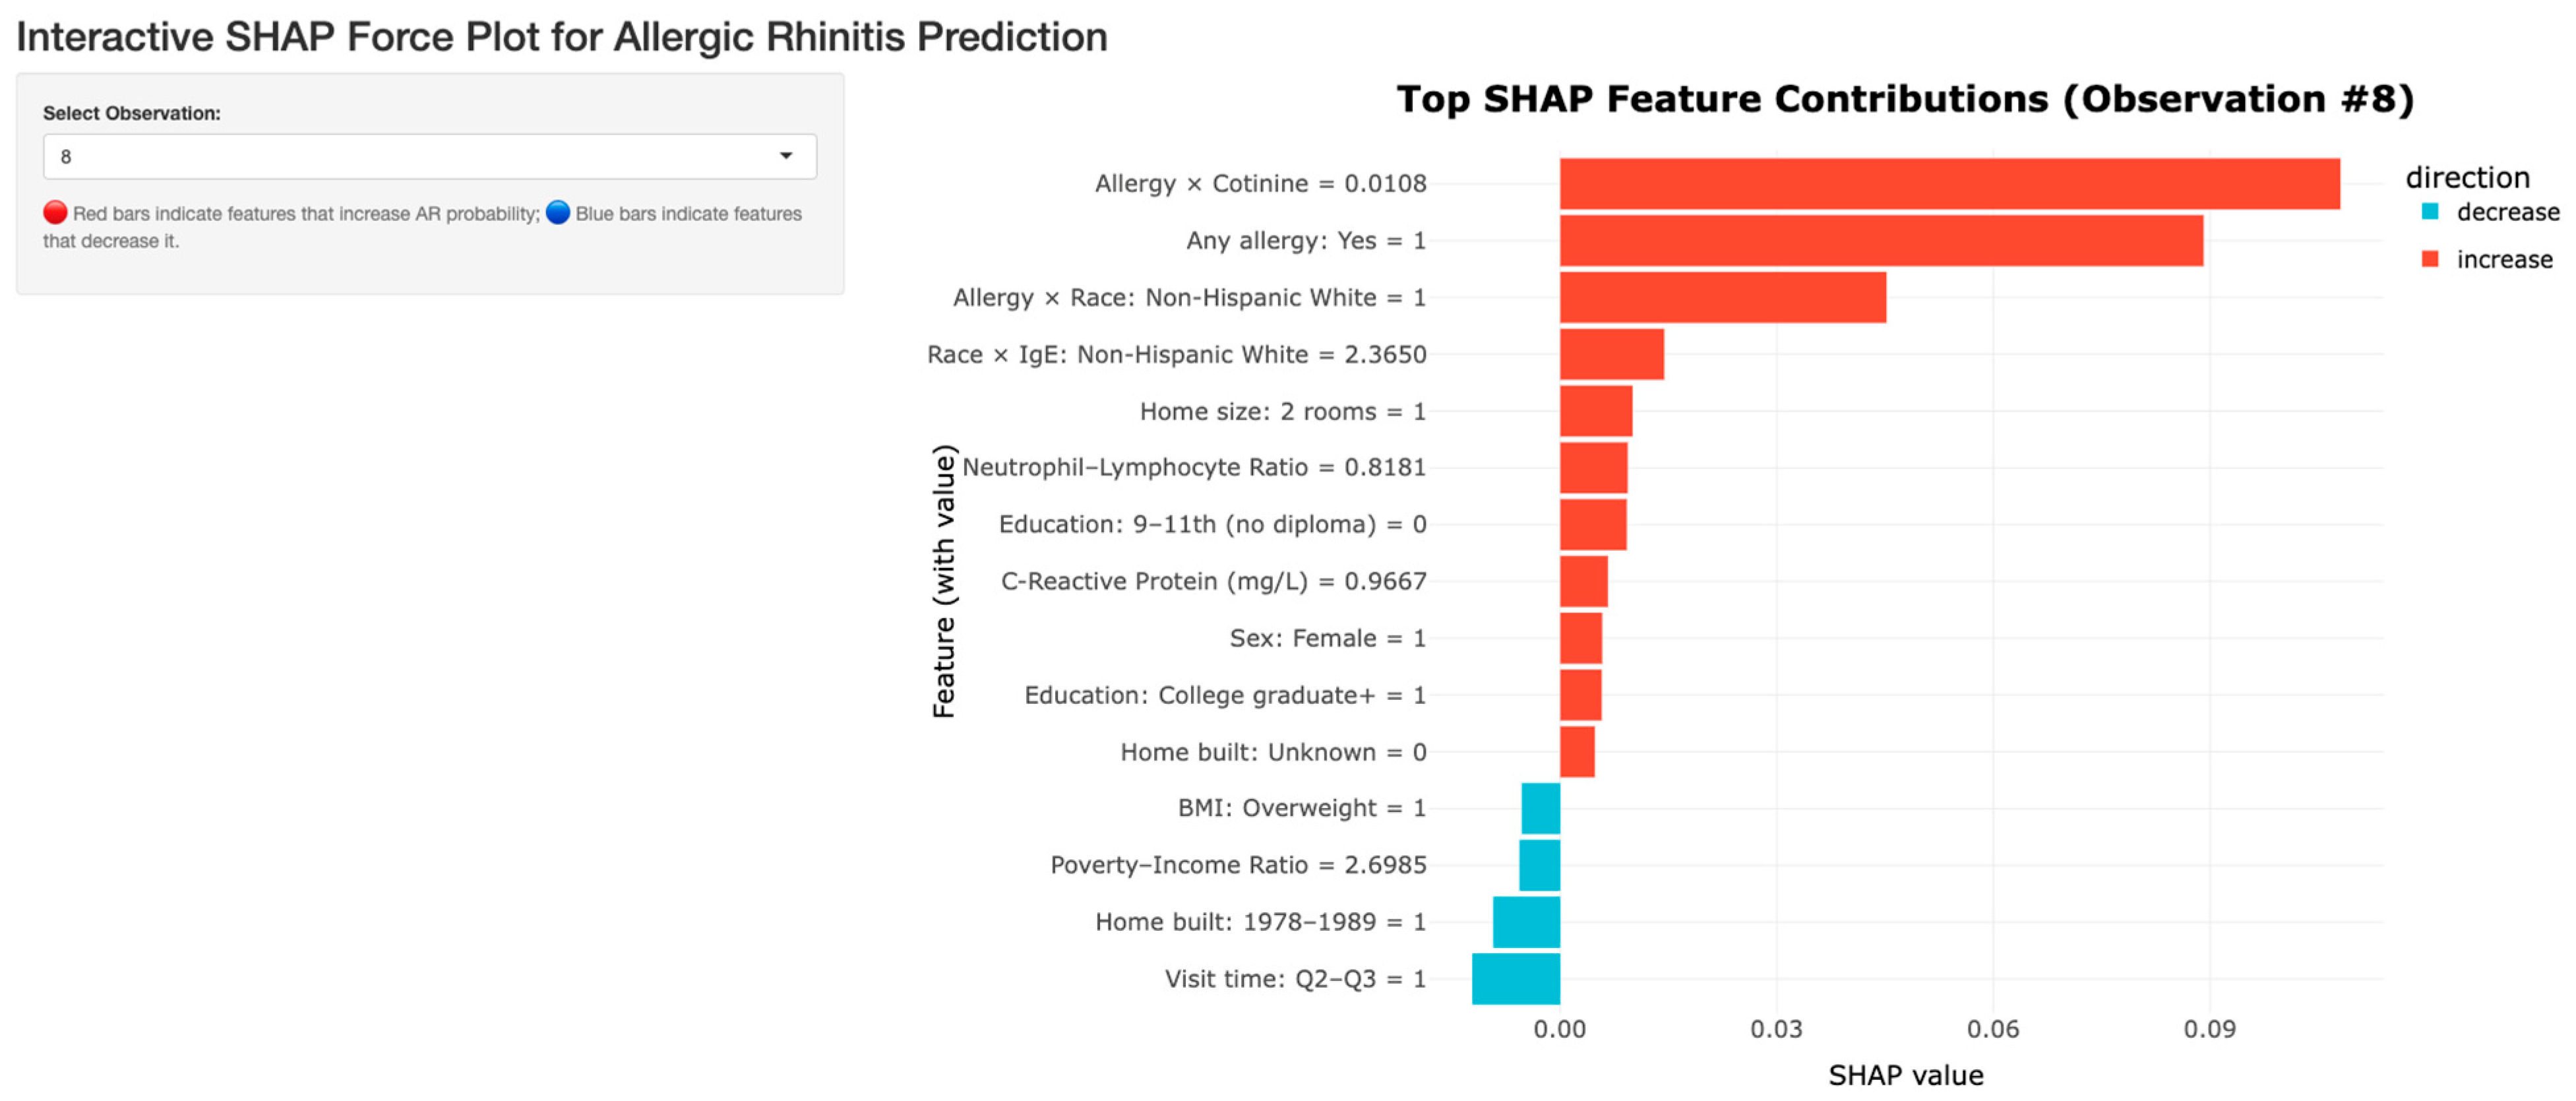
Figure 6.
Interactive Top SHAP Features for Participant #55.
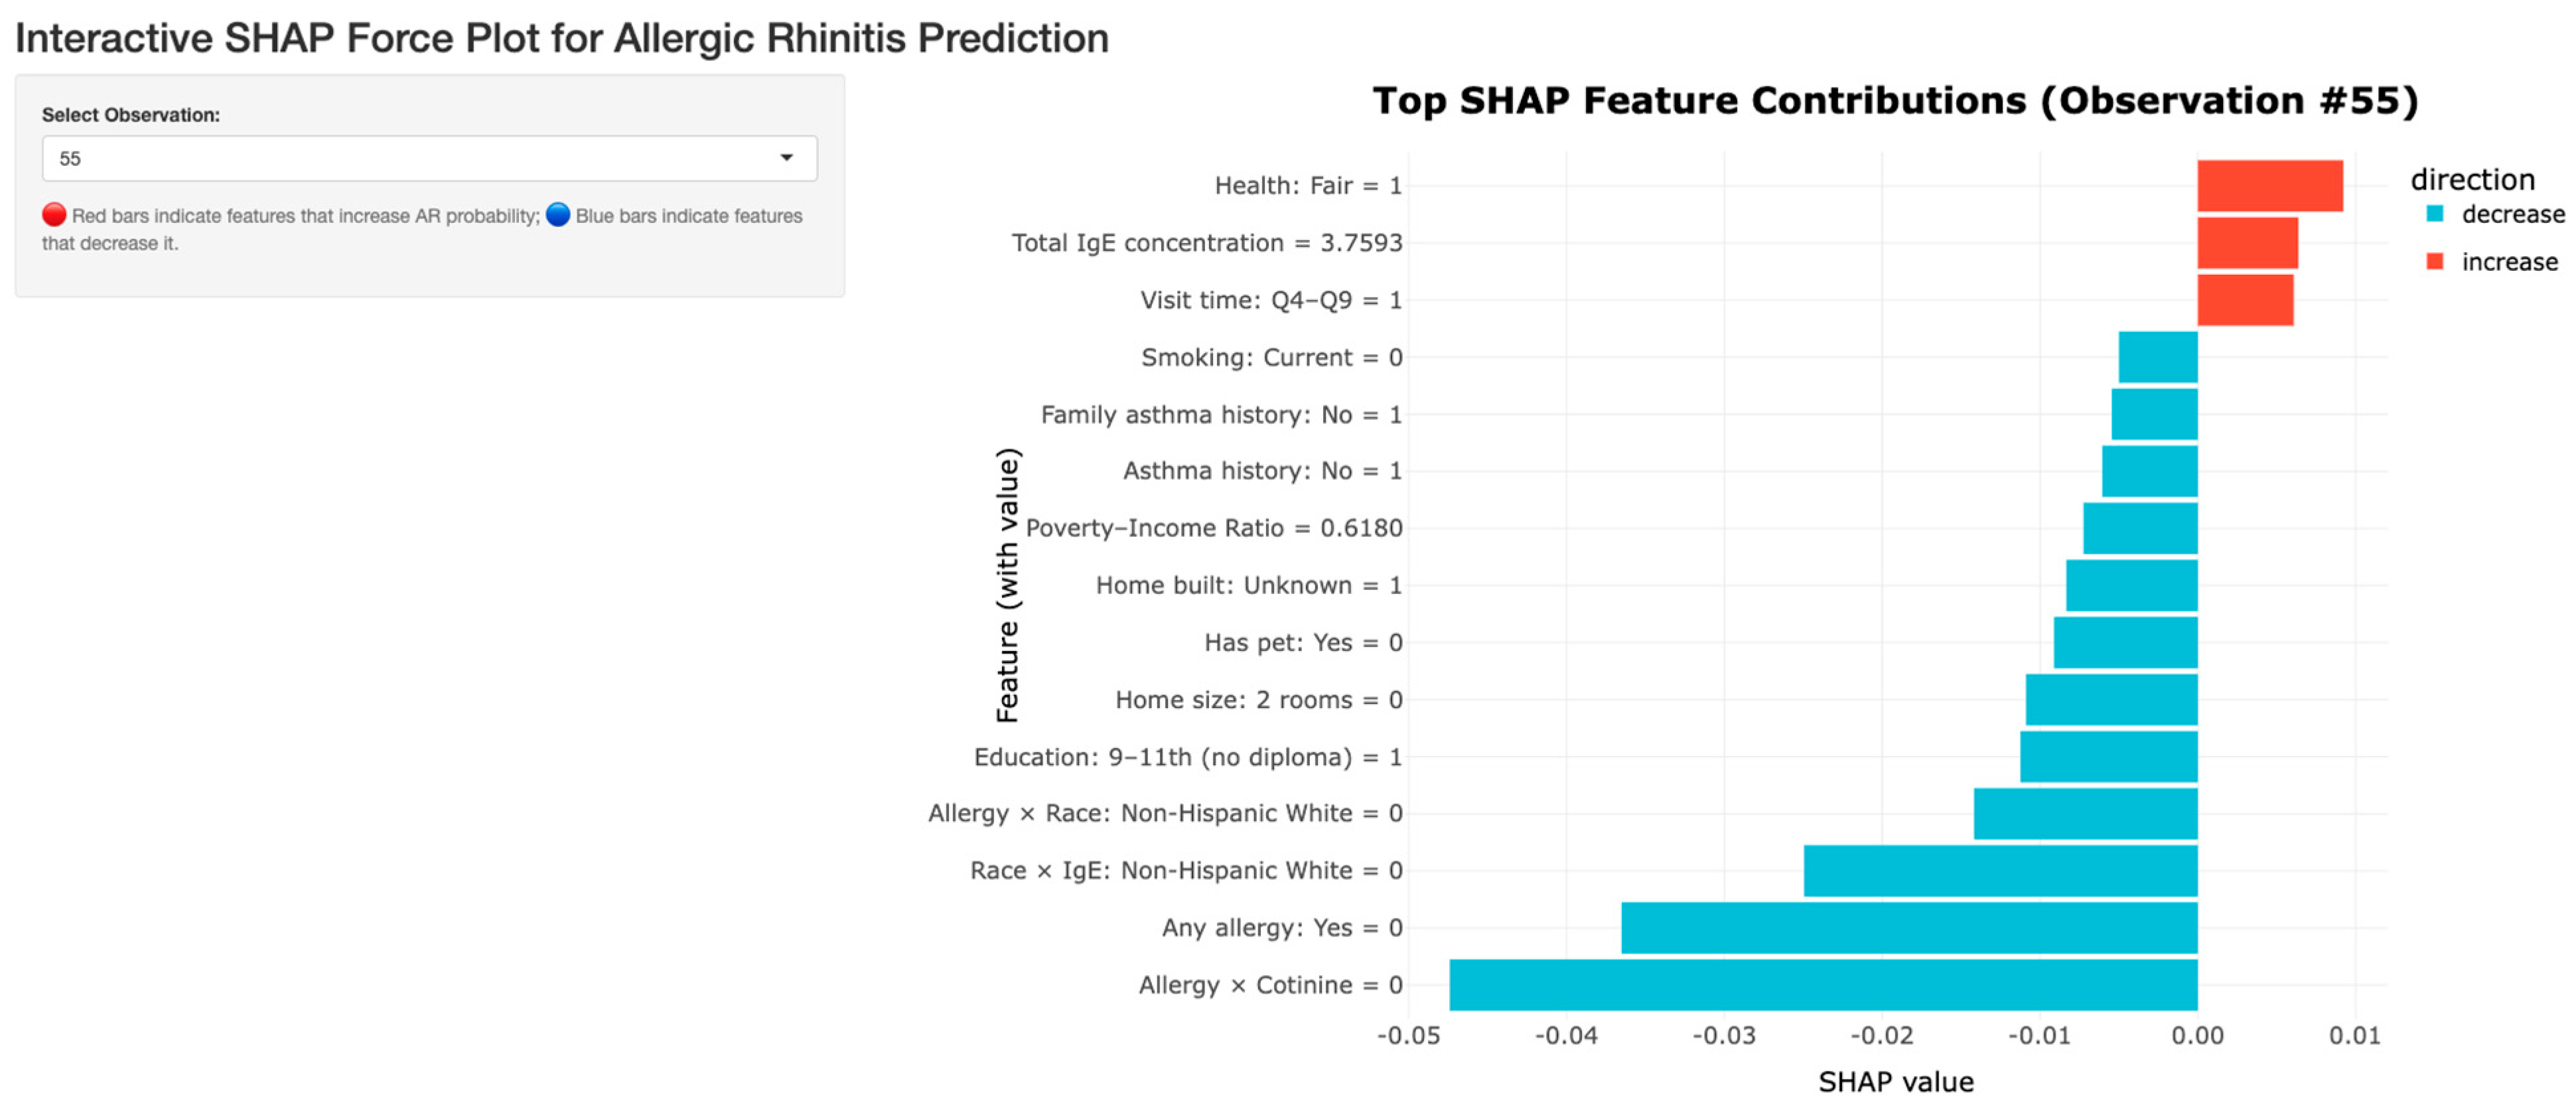
Figure 7.
SHAP Force plot for total IgE concentration effect by cumulative Neutrophil-Lymphocyte Ratio.
Figure 7.
SHAP Force plot for total IgE concentration effect by cumulative Neutrophil-Lymphocyte Ratio.
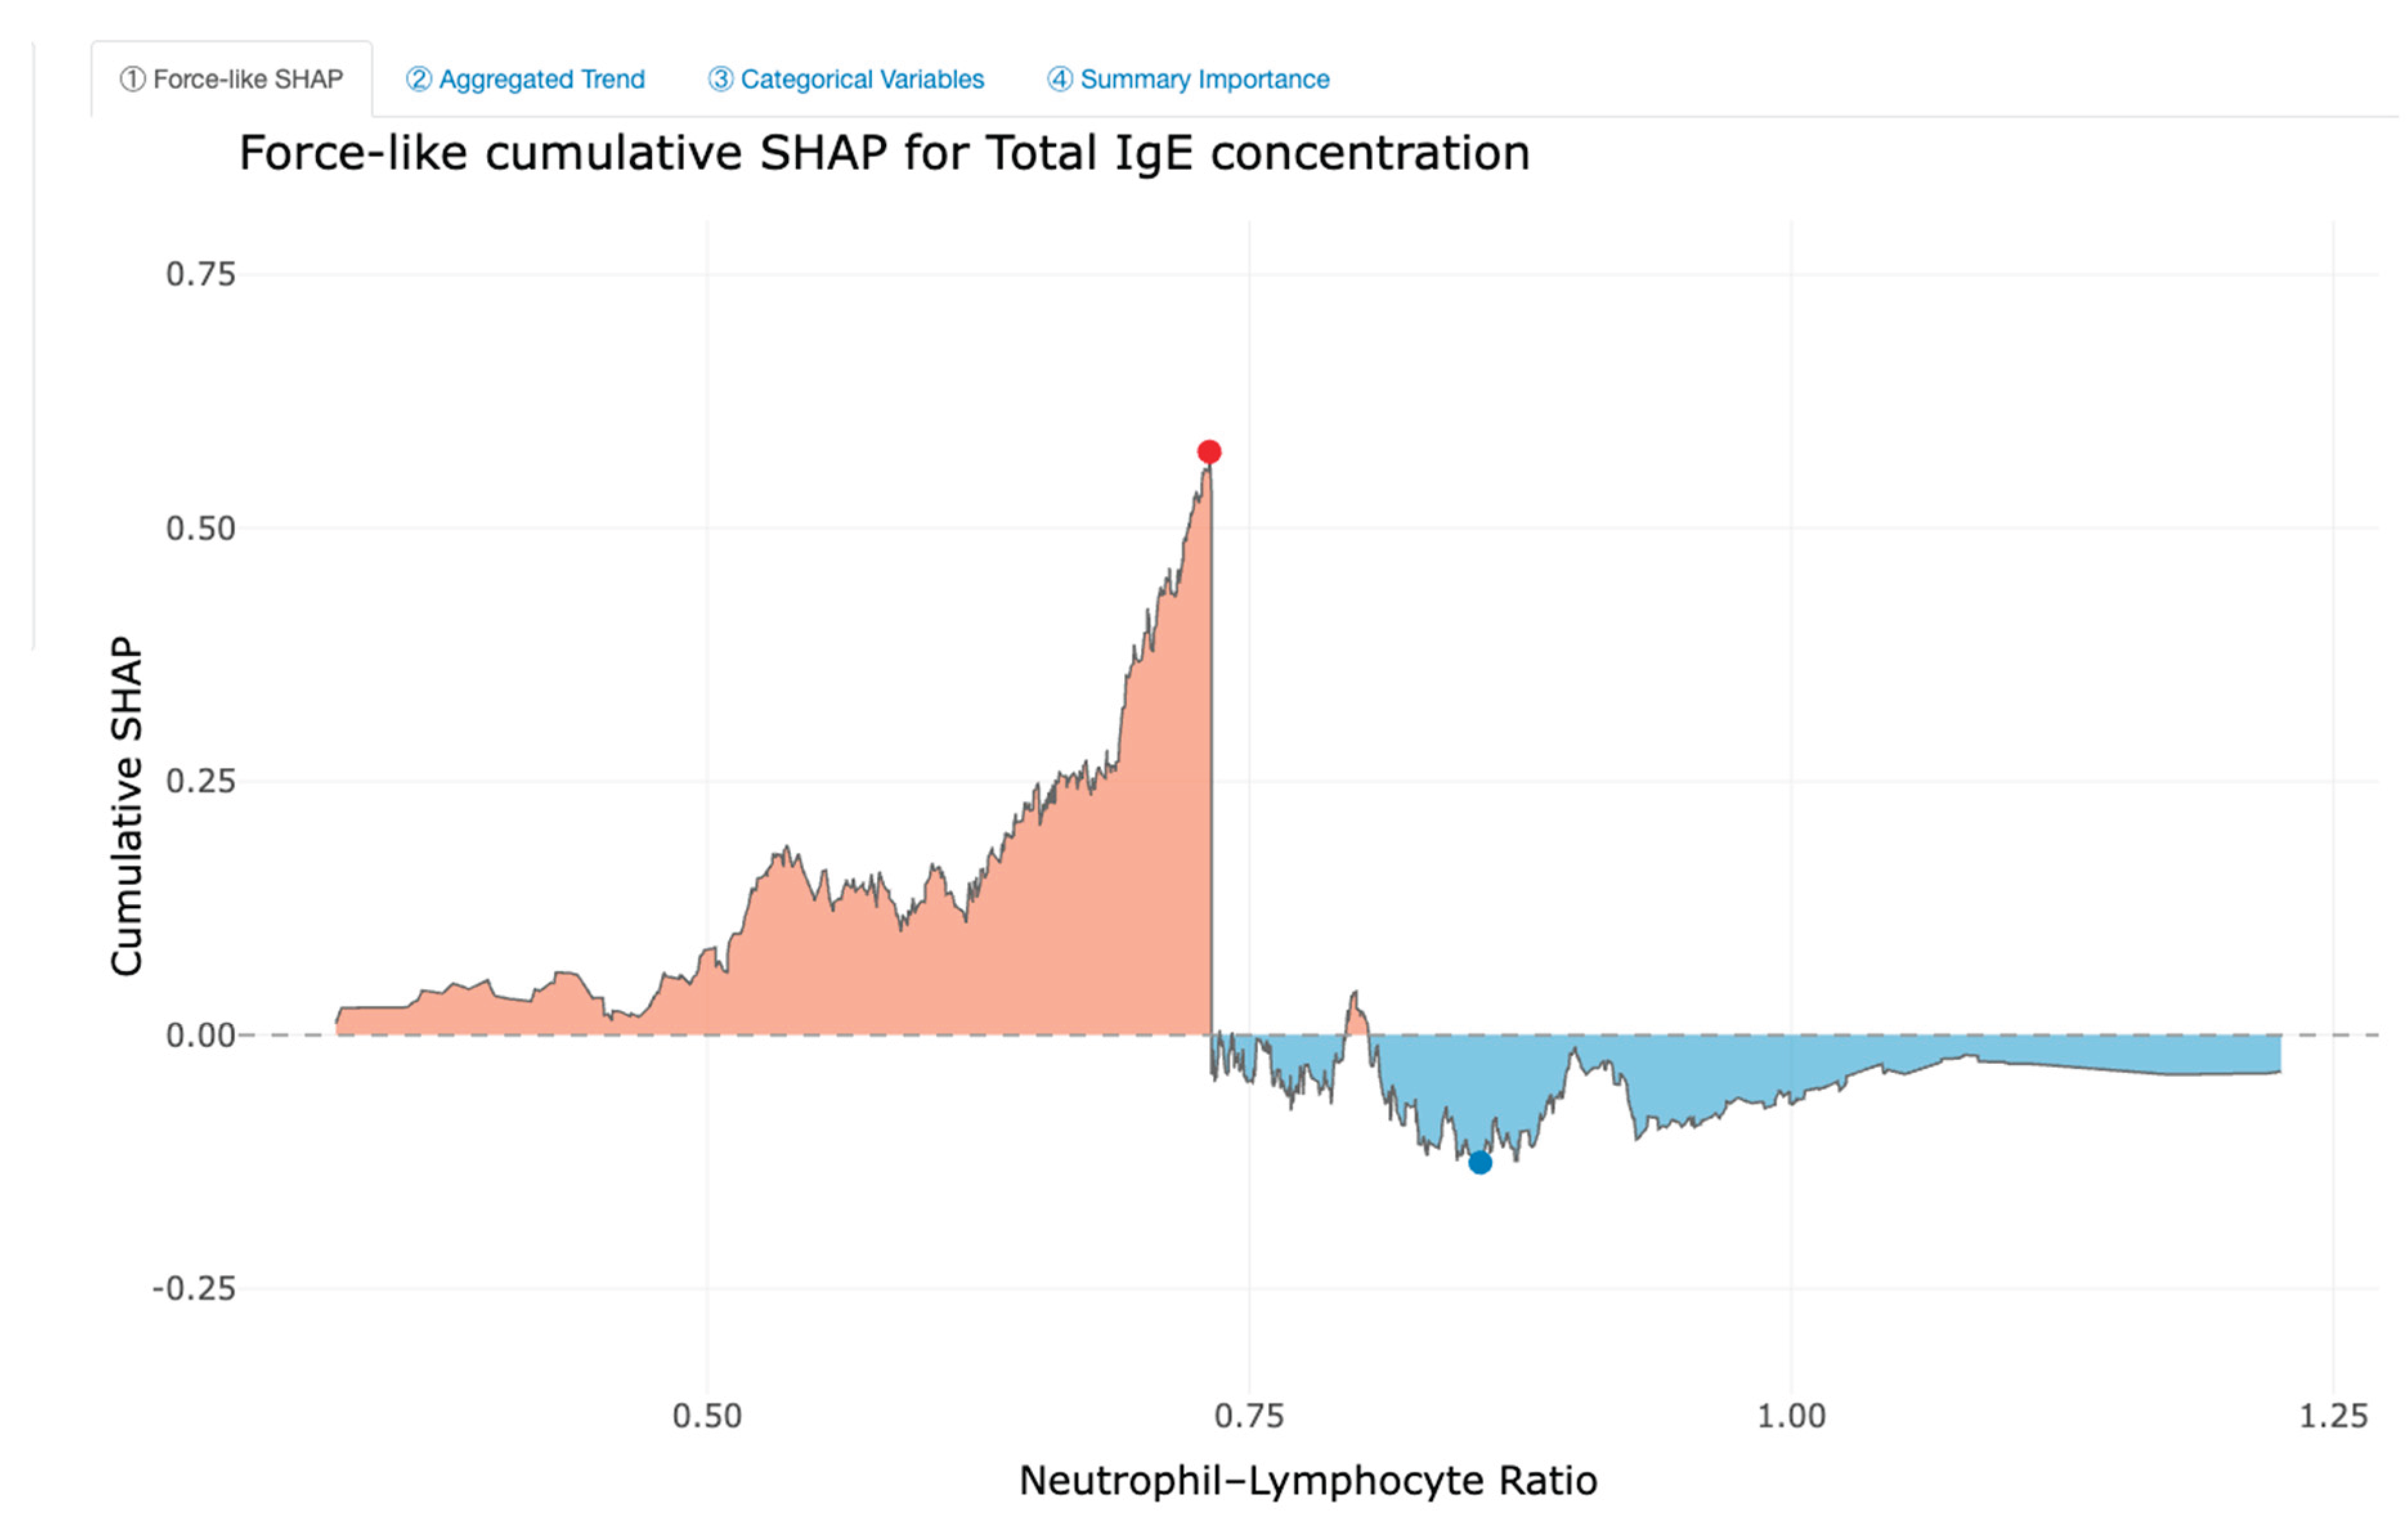
Figure 8.
SHAP Aggregated plot for total IgE concentration effect by Neutrophil-Lymphocyte Ratio.
Disclaimer/Publisher’s Note: The statements, opinions and data contained in all publications are solely those of the individual author(s) and contributor(s) and not of MDPI and/or the editor(s). MDPI and/or the editor(s) disclaim responsibility for any injury to people or property resulting from any ideas, methods, instructions or products referred to in the content. |
© 2025 by the authors. Licensee MDPI, Basel, Switzerland. This article is an open access article distributed under the terms and conditions of the Creative Commons Attribution (CC BY) license (http://creativecommons.org/licenses/by/4.0/).
Copyright: This open access article is published under a Creative Commons CC BY 4.0 license, which permit the free download, distribution, and reuse, provided that the author and preprint are cited in any reuse.


