Submitted:
19 November 2025
Posted:
19 November 2025
You are already at the latest version
Abstract
Analyzing smartphone usage and behavior across different demographics, this study examines both self-reported and objective data from a dataset of 100 participants. Key variables such as total app usage, daily screen time, social media engagement, age, and gender were analyzed. The analysis reveals that social media contributes a significant portion of daily screen time, especially among the younger generation. The link between productivity and social media usage was also explored, revealing distinct behavioral patterns. Limitations of the study include a reliance on self-reported data and the static nature of the dataset. Future research should focus on longitudinal data to better understand the long-term effects of smartphone usage.
Keywords:
smartphone usage
; prediction model
; artificial intelligence
1. Introduction
The widespread adoption of smartphones has significantly transformed how individuals communicate, work, and interact with their surroundings. Several studies have examined both the positive and negative consequences of smartphone use, including effects on mental health, behavioral changes, and social well-being [1,2]. Recent literature has explored areas such as smartphone addiction, academic performance, and usage patterns across different demographics [2,3,4]. Age and gender have emerged as key variables influencing total app usage, daily screen time, and social media engagement [3,4]. Understanding these behavioral patterns is crucial for assessing the broader societal impacts of smartphone technology.
Figure 1 shows smartphone usage patterns vary significantly across age groups. Teenagers and young adults exhibit the highest average daily screen time, with teens reaching up to 7.5 hours per day. This extensive usage correlates with a higher proportion of time spent on social media, particularly among the younger demographics, where nearly 45% of screen time is attributed to social media platforms. In contrast, older adults demonstrate lower overall screen time and social media engagement. These trends suggest a generational shift in smartphone reliance and highlight the need to consider age when assessing digital well-being and productivity impacts. The statistics are consistent with findings reported by Andone et al. [3] and Montag et al. [4].
2. Literature Review
Recent research has explored various dimensions of smartphone usage, particularly its behavioral implications and the application of machine learning in prediction and monitoring. Montag et al. [4] examined patterns of smartphone usage in the 21st century, highlighting WhatsApp as a dominant platform and noting demographic trends in communication habits. Expanding on predictive modeling, Sarker et al. [5] analyzed the effectiveness of machine learning classification models in forecasting personalized, context-aware smartphone usage, showing promising accuracy in adapting to user behavior.
Lee and Kim [6,10] applied ML models to predict problematic smartphone use, emphasizing behavioral traits that signal addiction risk. Aboujaoude et al. [7] combined survey data with machine learning[21,22,23,24] to assess the popularity and perceived effectiveness of smartphone tools designed to track and limit usage, revealing mixed user perceptions. Guinness [8] explored mobility patterns using smartphone sensors, proposing a machine learning framework to detect real-time context from sensor data.
Recently Likhith et al. [9] developed a ML model[25,26,27] specifically to prepredictphone addiction, contributing to digital well-being tools for early intervention. Walelgne et al. [11] investigated mobile data usage across diverse geographical regions using clustering and predictive techniques, offering insights into user segmentation and network optimization. To further understand the relationship between smartphone usage and its behavioral consequences, the conceptual framework illustrated in Figure 2 summarizes key elements including types of use, contributing factors, contextual settings, evaluation measures, and possible consequences[29,30]. This diagram provides a structured overview of how smartphone use can evolve into problematic behavior and highlights the roles of actors, settings, and evaluation in influencing outcomes. Table 1 presents a summary of recent studies investigating various aspects of smartphone usage, including behavioral predictors, usage accuracy, and psychological impacts.
3. Methodology
The present study aimed to explore smartphone usage patterns across diverse demographic segments using both self-reported and objective behavioral data. The dataset included variables such as age, gender, location, total app usage, daily screen time, and specific categories like social media, productivity, and gaming. A total of 100 participants, aged between 18 and 65, were categorized based on demographic variables to identify meaningful trends[18,19,20]. The goal was to examine the relationship between smartphone use and behavioral outcomes, comparing findings with those from prior studies as discussed in the literature review.
Ethical procedures were followed throughout the study. All participants voluntarily consented to the use of their data, and any personally identifiable information was anonymized to ensure privacy. As the dataset was obtained from a secondary source, there was no direct participant interaction. Prior to analysis, the dataset underwent preprocessing to clean inconsistencies and remove outliers, ensuring reliable and accurate results. This clean dataset formed the basis for our in-depth analysis of app usage patterns across the selected demographic groups.
To model smartphone usage behaviors, machine learning classification techniques were applied, including k-nearest neighbors (k-NN), logistic regression, naive Bayes, gradient boosted trees, and decision trees. Among these, the decision tree model showed the best performance, achieving an accuracy of 92% in predicting smartphone usage behavior. Dependences were calculated to explore the influence of variables like social media usage and screen time on user productivity. The design and implementation of the decision tree model, performed using RapidMiner, are shown in Figure 3.
4. Results
Participants provided self-reported data on their daily screen time and categorized their app usage into various domains such as social media, productivity, and gaming. On average, participants reported approximately 6.8 hours of daily screen time, with the majority dedicated to social media applications. Notably, male participants reported slightly higher overall app usage than females, particularly in the gaming category.
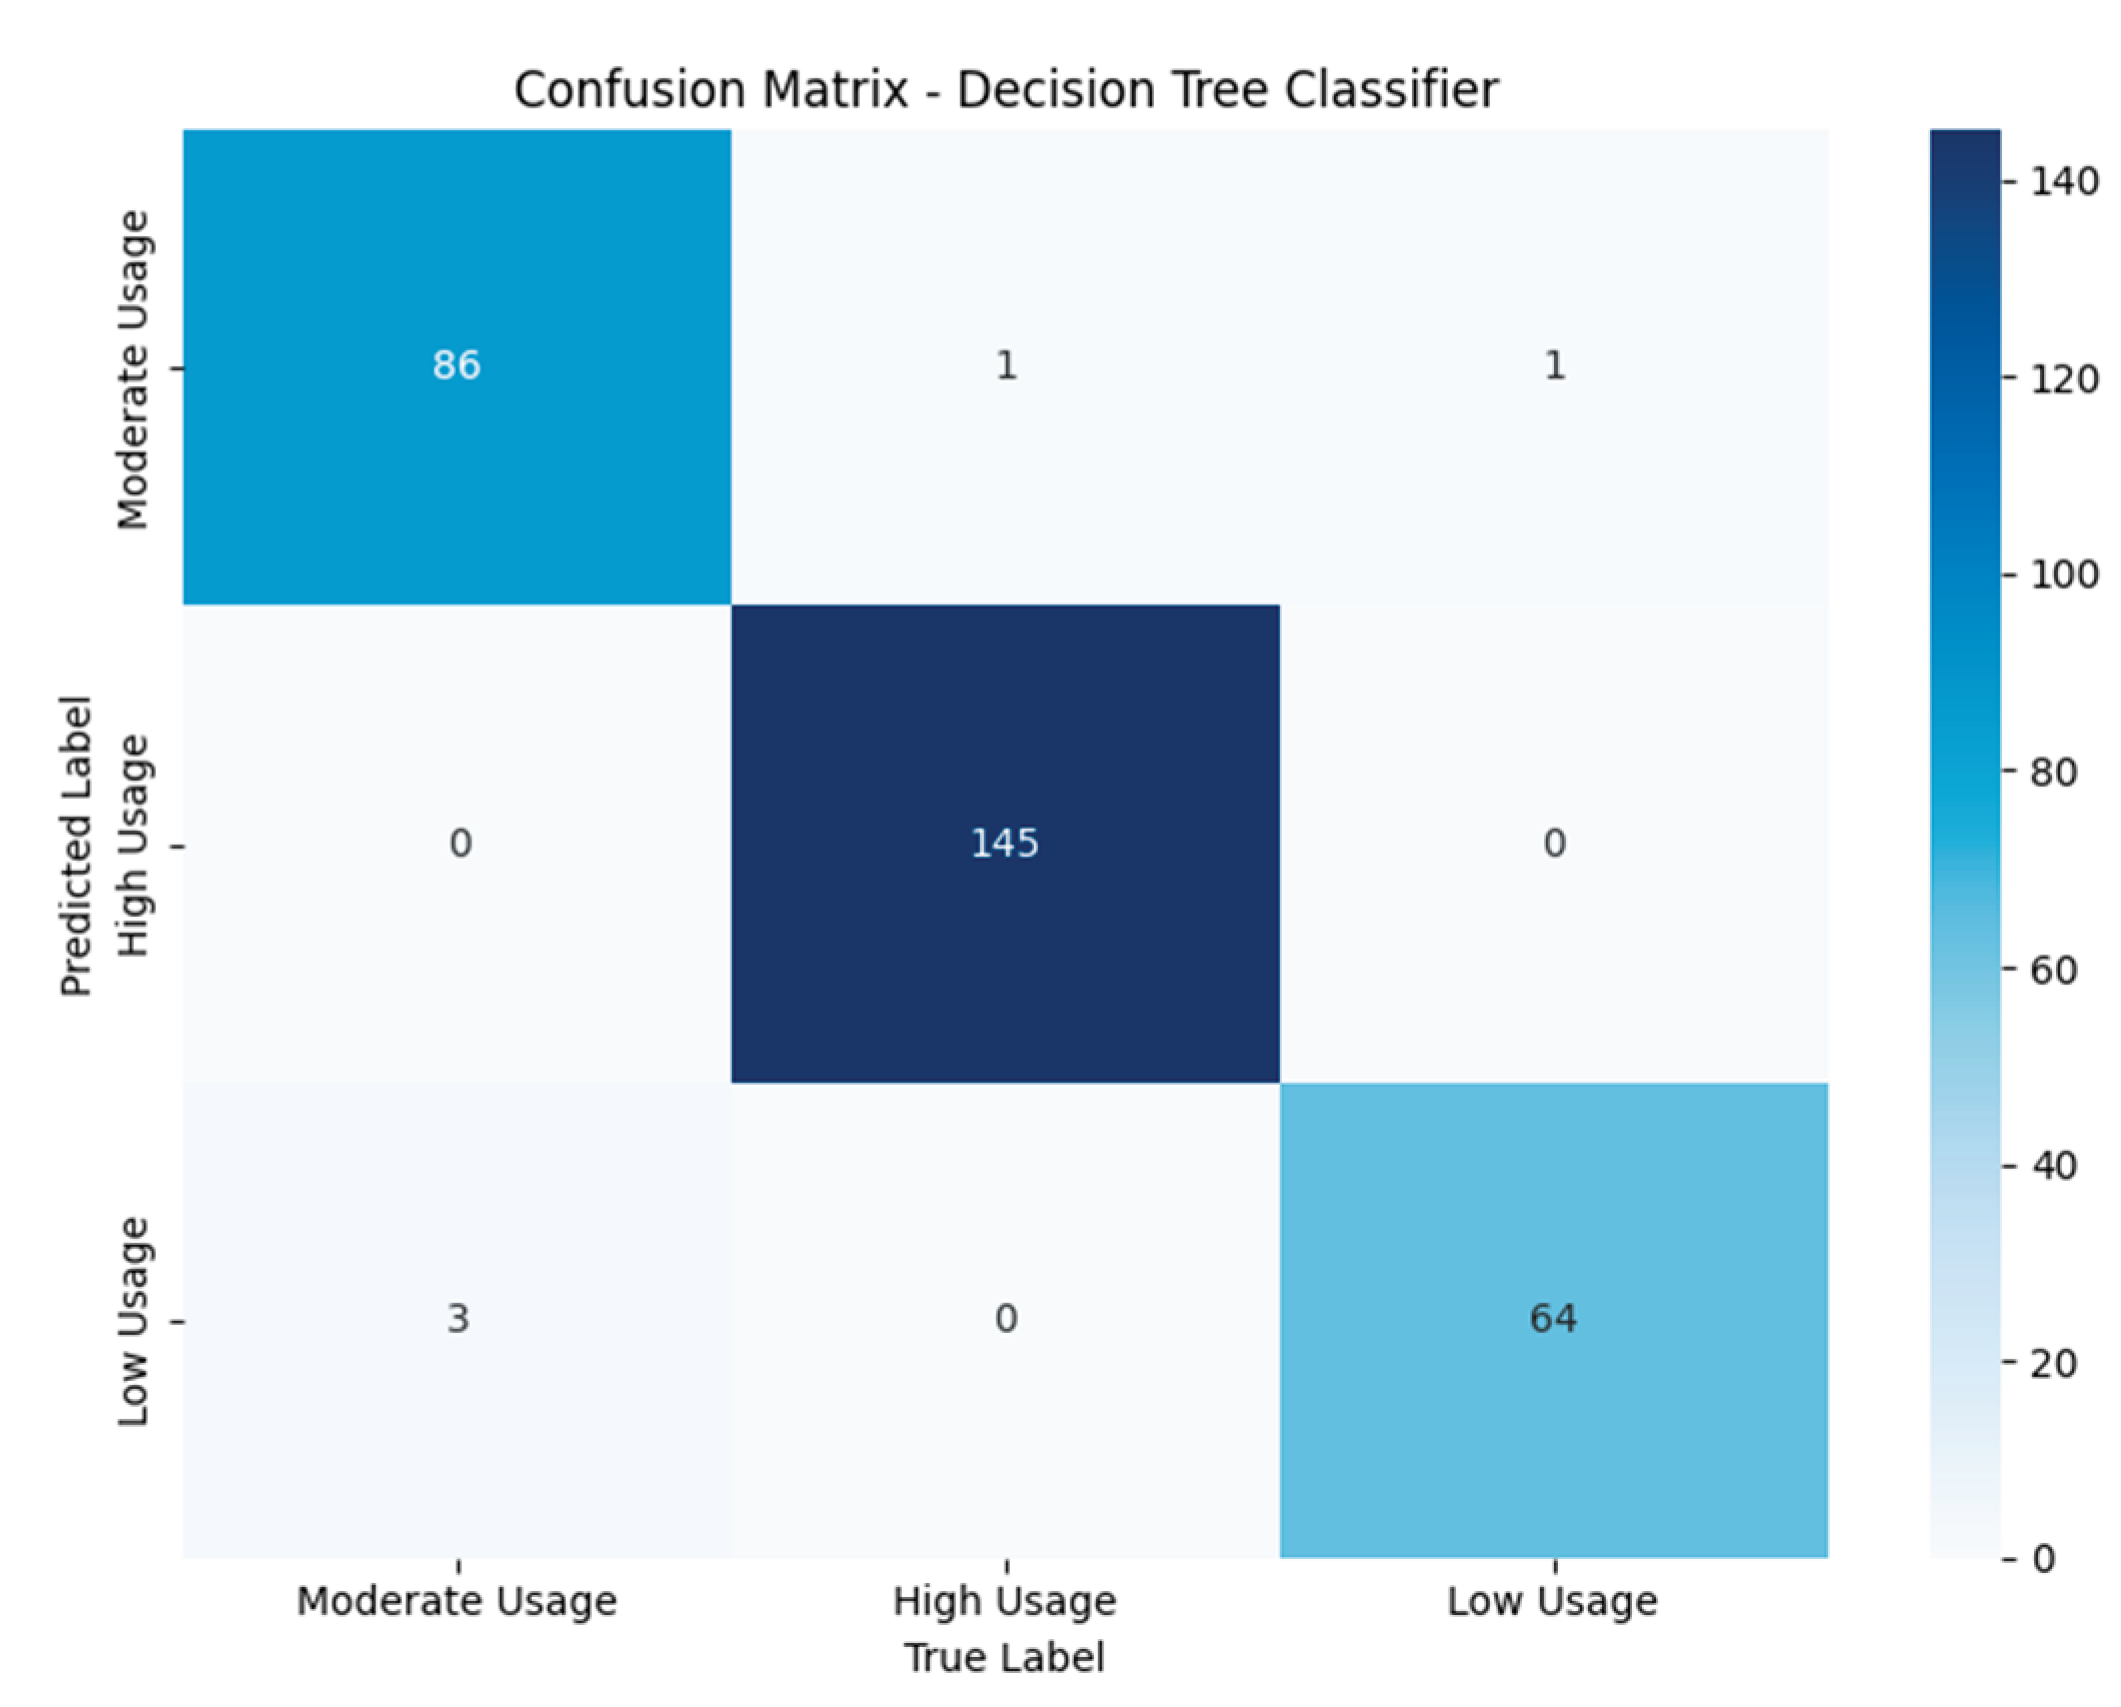
Several machine learning models were implemented to classify smartphone usage patterns, including k-NN, logistic regression, naïve Bayes, boosted tree, and decision tree. Among these, the decision tree model demonstrated the highest classification accuracy of 98.33%, outperforming all other models. Figure 4 presents the performance matrix (confusion matrix) of the decision tree classifier. The model achieved excellent performance in classifying participants into three smartphone usage categories: Moderate Usage, High Usage, and Low Usage. Table 2 summarizes the results.
The analysis highlights the prevalence of smartphone usage, particularly the extensive engagement with social media. This trend reflects an increasing dependence on digital platforms, especially among younger demographics. The high accuracy of the decision tree model in classifying gender-based usage patterns further emphasizes its capability in modeling behavioral data. These findings suggest that decision tree classifiers can effectively support digital well-being assessments by identifying critical patterns of smartphone overuse.
Figure 5.
Confusion Matrix.
5. Conclusions
This study provides a deep examination of smartphone usage patterns across various user segments by integrating both self-reported behaviors and ML classification. The fusion of subjective user input with objective analytical modeling offers a comprehensive view of how smartphones impact daily routines, communication trends, and productivity levels. The decision tree model emerged as the most effective classifier, achieving an overall accuracy of 98.33%, with precision and recall metrics above 95% across all usage categories. This strong performance reinforces the model’s robustness in recognizing nuanced behavioral distinctions in usage patterns, particularly in relation to gender-specific trends and app category preferences.
While the results present clear insights into user behavior, it’s important to recognize that the reliance on self-reported screen time data may introduce minor reporting inconsistencies, which could influence the interpretation of usage intensity. However, this aspect also reflects the real-world challenges of behavioral data collection and provides contextually rich information for analysis. The study results in open potential avenues for building more adaptive and personalized digital wellness interventions. Incorporating additional contextual variables like location data or time-of-day usage pattern could further enhance prediction accuracy and behavioral profiling in future iterations of this work.
References
- Falaki, H., Mahajan, R., Kandula, S., Lymberopoulos, D., Govindan, R., & Estrin, D. (2010, June). Diversity in smartphone usage. In Proceedings of the 8th international conference on Mobile systems, applications, and services (pp. 179-194).
- Amez, S., & Baert, S. (2020). Smartphone use and academic performance: A literature review. International journal of educational research, 103, 101618.
- Andone, I., Błaszkiewicz, K., Eibes, M., Trendafilov, B., Montag, C., & Markowetz, A. (2016, September). How age and gender affect smartphone usage. In Proceedings of the 2016 ACM international joint conference on pervasive and ubiquitous computing: adjunct (pp. 9-12).
- Montag, C., Błaszkiewicz, K., Sariyska, R., Lachmann, B., Andone, I., Trendafilov, B., ... & Markowetz, A. (2015). Smartphone usage in the 21st century: who is active on WhatsApp?. BMC research notes, 8(1), 331.
- Sarker, I. H., Kayes, A. S. M., & Watters, P. (2019). Effectiveness analysis of machine learning classification models for predicting personalized context-aware smartphone usage. Journal of Big Data, 6(1), 1-28.
- Lee, J. , & Kim, W. (2021). Prediction of problematic smartphone use: A machine learning approach. International journal of environmental research and public health, 18(12), 6458.
- Aboujaoude, E. , Vera Cruz, G., Rochat, L., Courtois, R., Ben Brahim, F., Khan, R., & Khazaal, Y. (2022). Assessment of the popularity and perceived effectiveness of smartphone tools that track and limit smartphone use: survey study and machine learning analysis. Journal of medical Internet research, 24(10), e38963.
- Guinness, R. E. (2015). Beyond where to how: A machine learning approach for sensing mobility contexts using smartphone sensors. Sensors, 15(5), 9962-9985.
- Likhith, S. , Chitteti, C., Dharani, M., Nivedhitha, V., Geethika, N. G., & Godwin, V. (2024, April). Machine Learning Model for Prediction of Smartphone Addiction. In 2024 International Conference on Expert Clouds and Applications (ICOECA) (pp. 924-929). IEEE.
- Lee, J. , & Kim, W. (2021). Prediction of problematic smartphone use: A machine learning approach. International journal of environmental research and public health, 18(12), 6458.
- Walelgne, E. A., Asrese, A. S., Manner, J., Bajpai, V., & Ott, J. (2021). Clustering and predicting the data usage patterns of geographically diverse mobile users. Computer Networks, 187, 107737.
- Neophytou, E. , Manwell, L. A., & Eikelboom, R. (2021). Effects of excessive screen time on neurodevelopment, learning, memory, mental health, and neurodegeneration: A scoping review. International Journal of Mental Health and Addiction, 19(3), 724-744.
- Noë, B., Turner, L. D., & Whitaker, R. M. (2019, September). Smartphone interaction and survey data as predictors of snapchat usage. In Adjunct Proceedings of the 2019 ACM International Joint Conference on Pervasive and Ubiquitous Computing and Proceedings of the 2019 ACM International Symposium on Wearable Computers (pp. 438-445).
- Ellis, D. A. , Davidson, B. I., Shaw, H., & Geyer, K. (2019). Do smartphone usage scales predict behavior?. International Journal of Human-Computer Studies, 130, 86-92.
- Stachl, C., Hilbert, S., Au, J. Q., Buschek, D., De Luca, A., Bischl, B., ... & Bühner, M. (2017). Personality traits predict smartphone usage. European Journal of Personality, 31(6), 701-722.
- Han, S. , & Yi, Y. J. (2019). How does the smartphone usage of college students affect academic performance?. Journal of Computer Assisted Learning, 35(1), 13-22.
- Deng, T. , Kanthawala, S., Meng, J., Peng, W., Kononova, A., Hao, Q.,... & David, P. (2019). Measuring smartphone usage and task switching with log tracking and self-reports. Mobile Media & Communication, 7(1), 3-23.
- Wilcockson, T. D. , Ellis, D. A., & Shaw, H. (2018). Determining typical smartphone usage: What data do we need?. Cyberpsychology, Behavior, and Social Networking, 21(6), 395-398.
- Ahmed, Q. W. , Garg, S., Rai, A., Ramachandran, M., Jhanjhi, N. Z., Masud, M., & Baz, M. (2022). Ai-based resource allocation techniques in wireless sensor internet of things networks in energy efficiency with data optimization. Electronics, 11(13), 2071.
- Khan, N. A. , Jhanjhi, N. Z., Brohi, S. N., Almazroi, A. A., & Almazroi, A. A. (2022). A secure communication protocol for unmanned aerial vehicles. CMC-Computers Materials & Continua, 70(1), 601-618.
- Muzafar, S. , & Jhanjhi, N. Z. (2020). Success stories of ICT implementation in Saudi Arabia. In Employing Recent Technologies for Improved Digital Governance (pp. 151-163). IGI Global Scientific Publishing.
- Jabeen, T., Jabeen, I., Ashraf, H., Jhanjhi, N. Z., Yassine, A., & Hossain, M. S. (2023). An intelligent healthcare system using IoT in wireless sensor network. Sensors, 23(11), 5055.
- Shah, I. A. , Jhanjhi, N. Z., & Laraib, A. (2023). Cybersecurity and blockchain usage in contemporary business. In Handbook of Research on Cybersecurity Issues and Challenges for Business and FinTech Applications (pp. 49-64). IGI Global.
- Hanif, M. , Ashraf, H., Jalil, Z., Jhanjhi, N. Z., Humayun, M., Saeed, S., & Almuhaideb, A. M. (2022). AI-based wormhole attack detection techniques in wireless sensor networks. Electronics, 11(15), 2324.
- Shah, I. A. , Jhanjhi, N. Z., Amsaad, F., & Razaque, A. (2022). The role of cutting-edge technologies in industry 4.0. In Cyber Security Applications for Industry 4.0 (pp. 97-109). Chapman and Hall/CRC.
- Humayun, M., Almufareh, M. F., & Jhanjhi, N. Z. (2022). Autonomous traffic system for emergency vehicles. Electronics, 11(4), 510.
- Muzammal, S. M. , Murugesan, R. K., Jhanjhi, N. Z., & Jung, L. T. (2020, October). SMTrust: Proposing trust-based secure routing protocol for RPL attacks for IoT applications. In 2020 International Conference on Computational Intelligence (ICCI) (pp. 305-310). IEEE.
- Brohi, S. N. , Jhanjhi, N. Z., Brohi, N. N., & Brohi, M. N. (2023). Key applications of state-of-the-art technologies to mitigate and eliminate COVID-19. Authorea Preprints.
- Khalil, M. I., Humayun, M., Jhanjhi, N. Z., Talib, M. N., & Tabbakh, T. A. (2021). Multi-class segmentation of organ at risk from abdominal ct images: A deep learning approach. In Intelligent Computing and Innovation on Data Science: Proceedings of ICTIDS 2021 (pp. 425-434). Singapore: Springer Nature Singapore.
- Humayun, M., Jhanjhi, N. Z., Niazi, M., Amsaad, F., & Masood, I. (2022). Securing drug distribution systems from tampering using blockchain. Electronics, 11(8), 1195.
Figure 1.
Average daily screen time by age group. [3,4] and Percentage of screen time spent on social media by age group. [3,4].
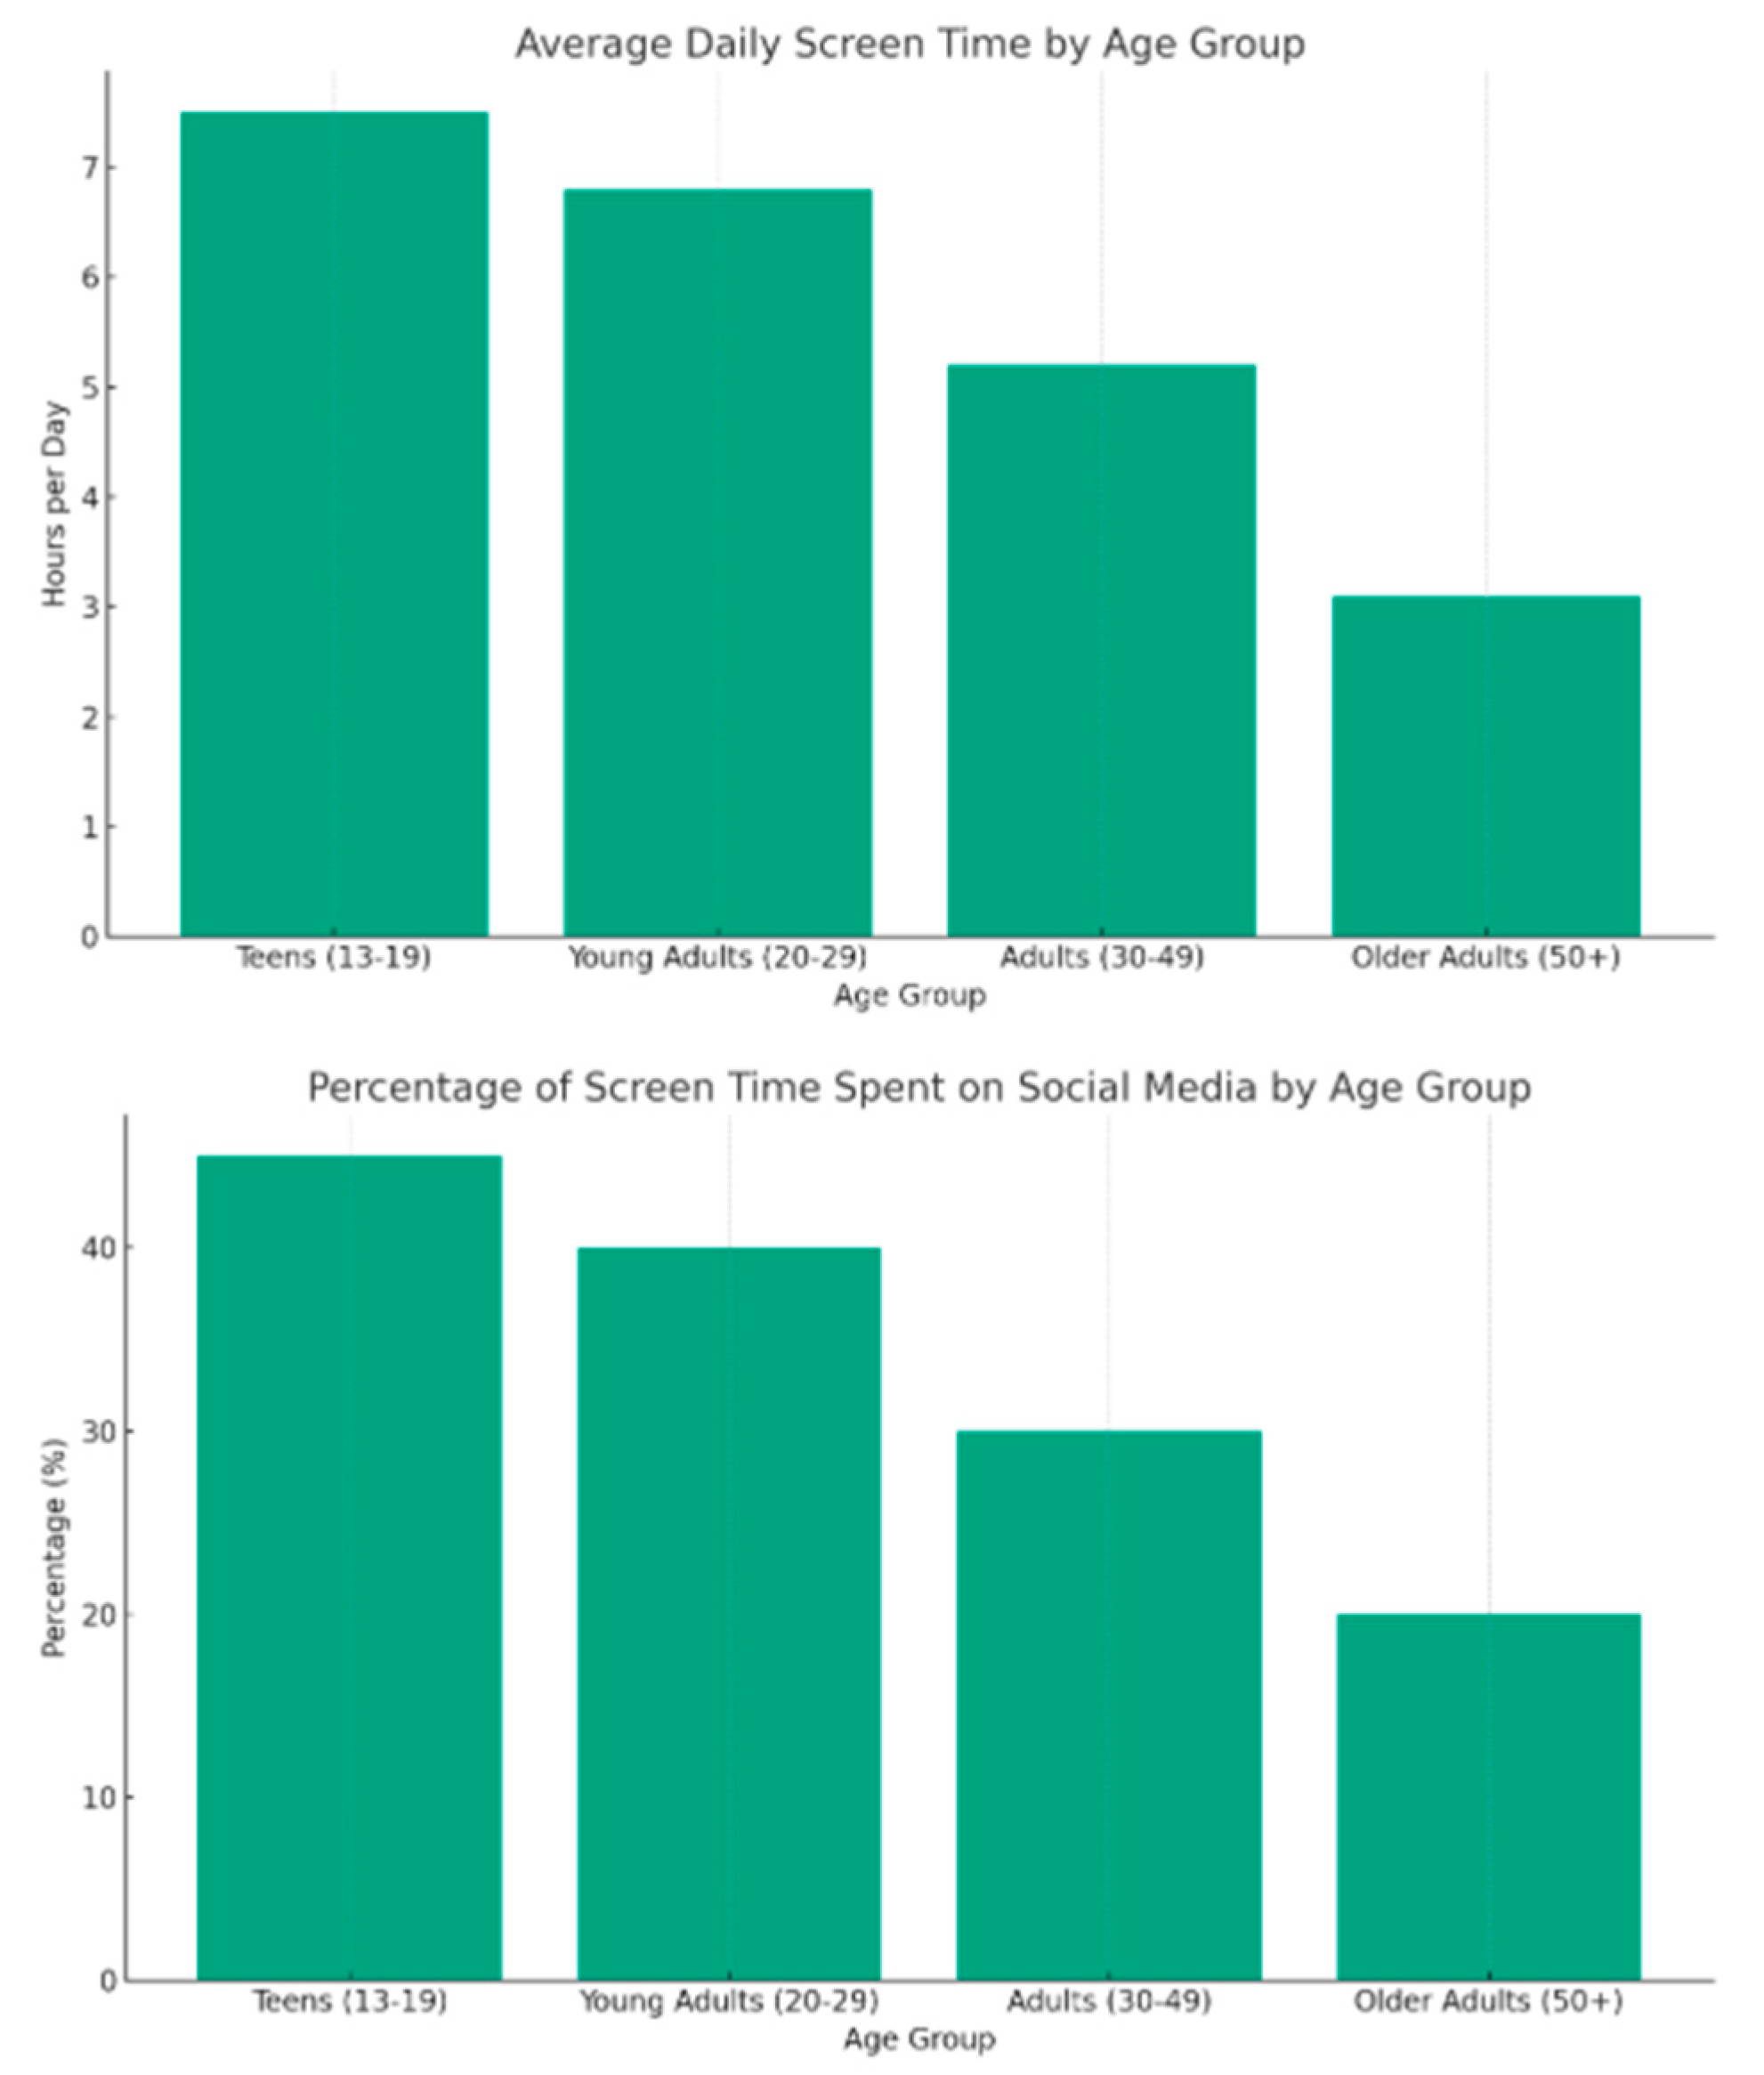
Figure 2.
Conceptual framework of smartphone uses and problematic use.
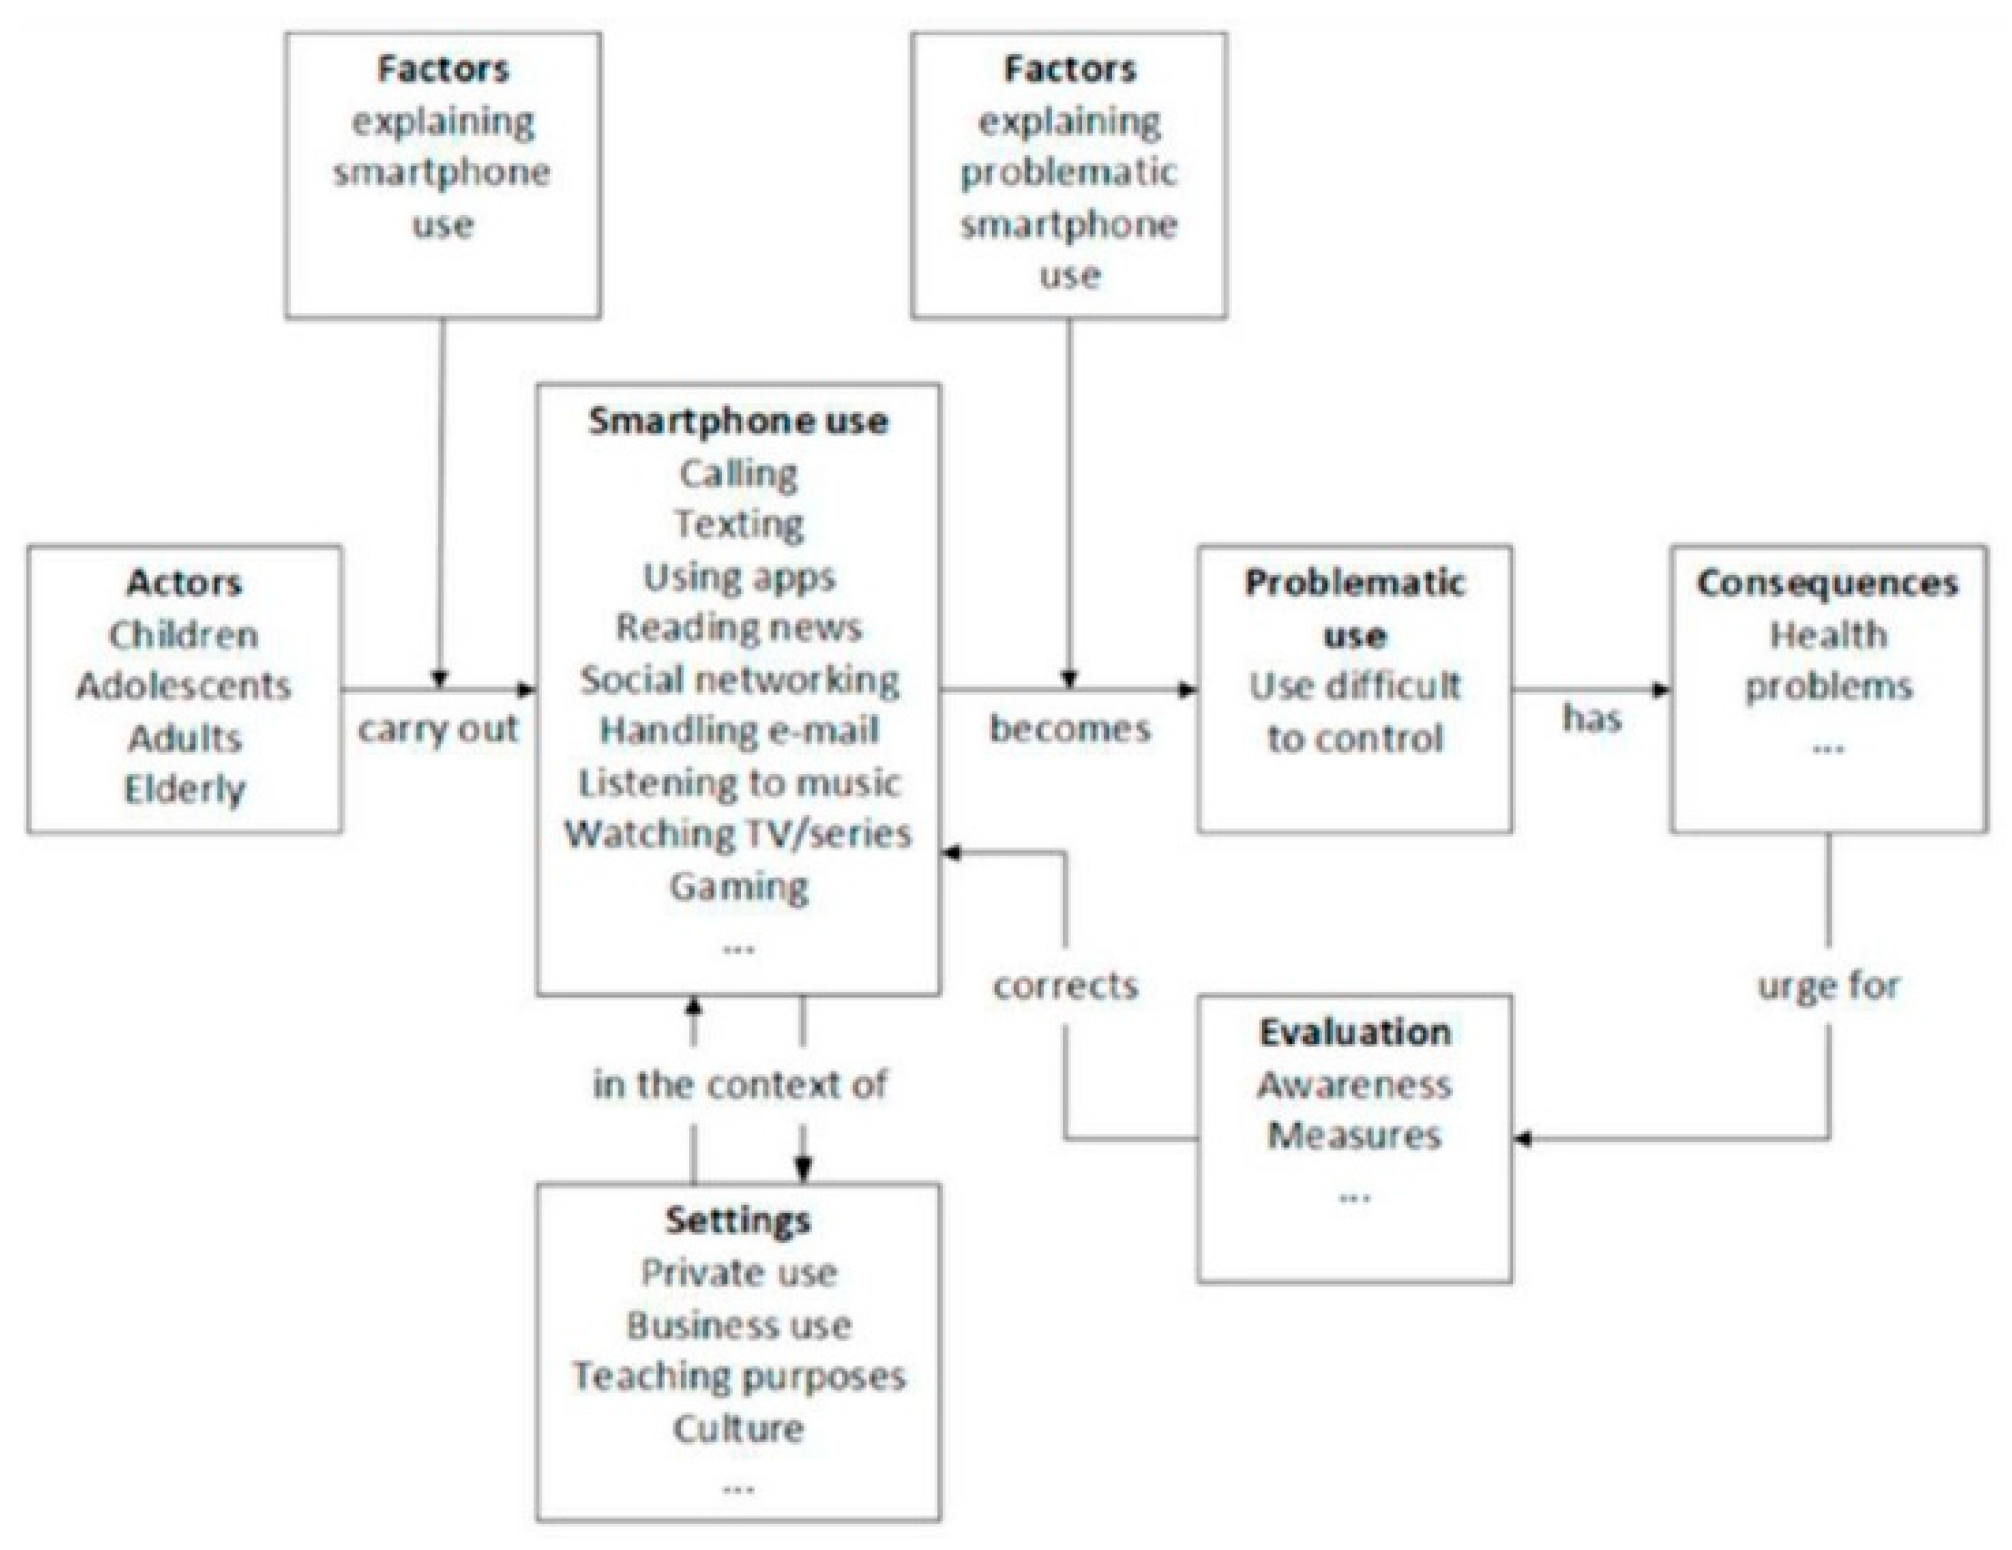
Figure 3.
Design of the Decision Tree Model in Rapid Miner.
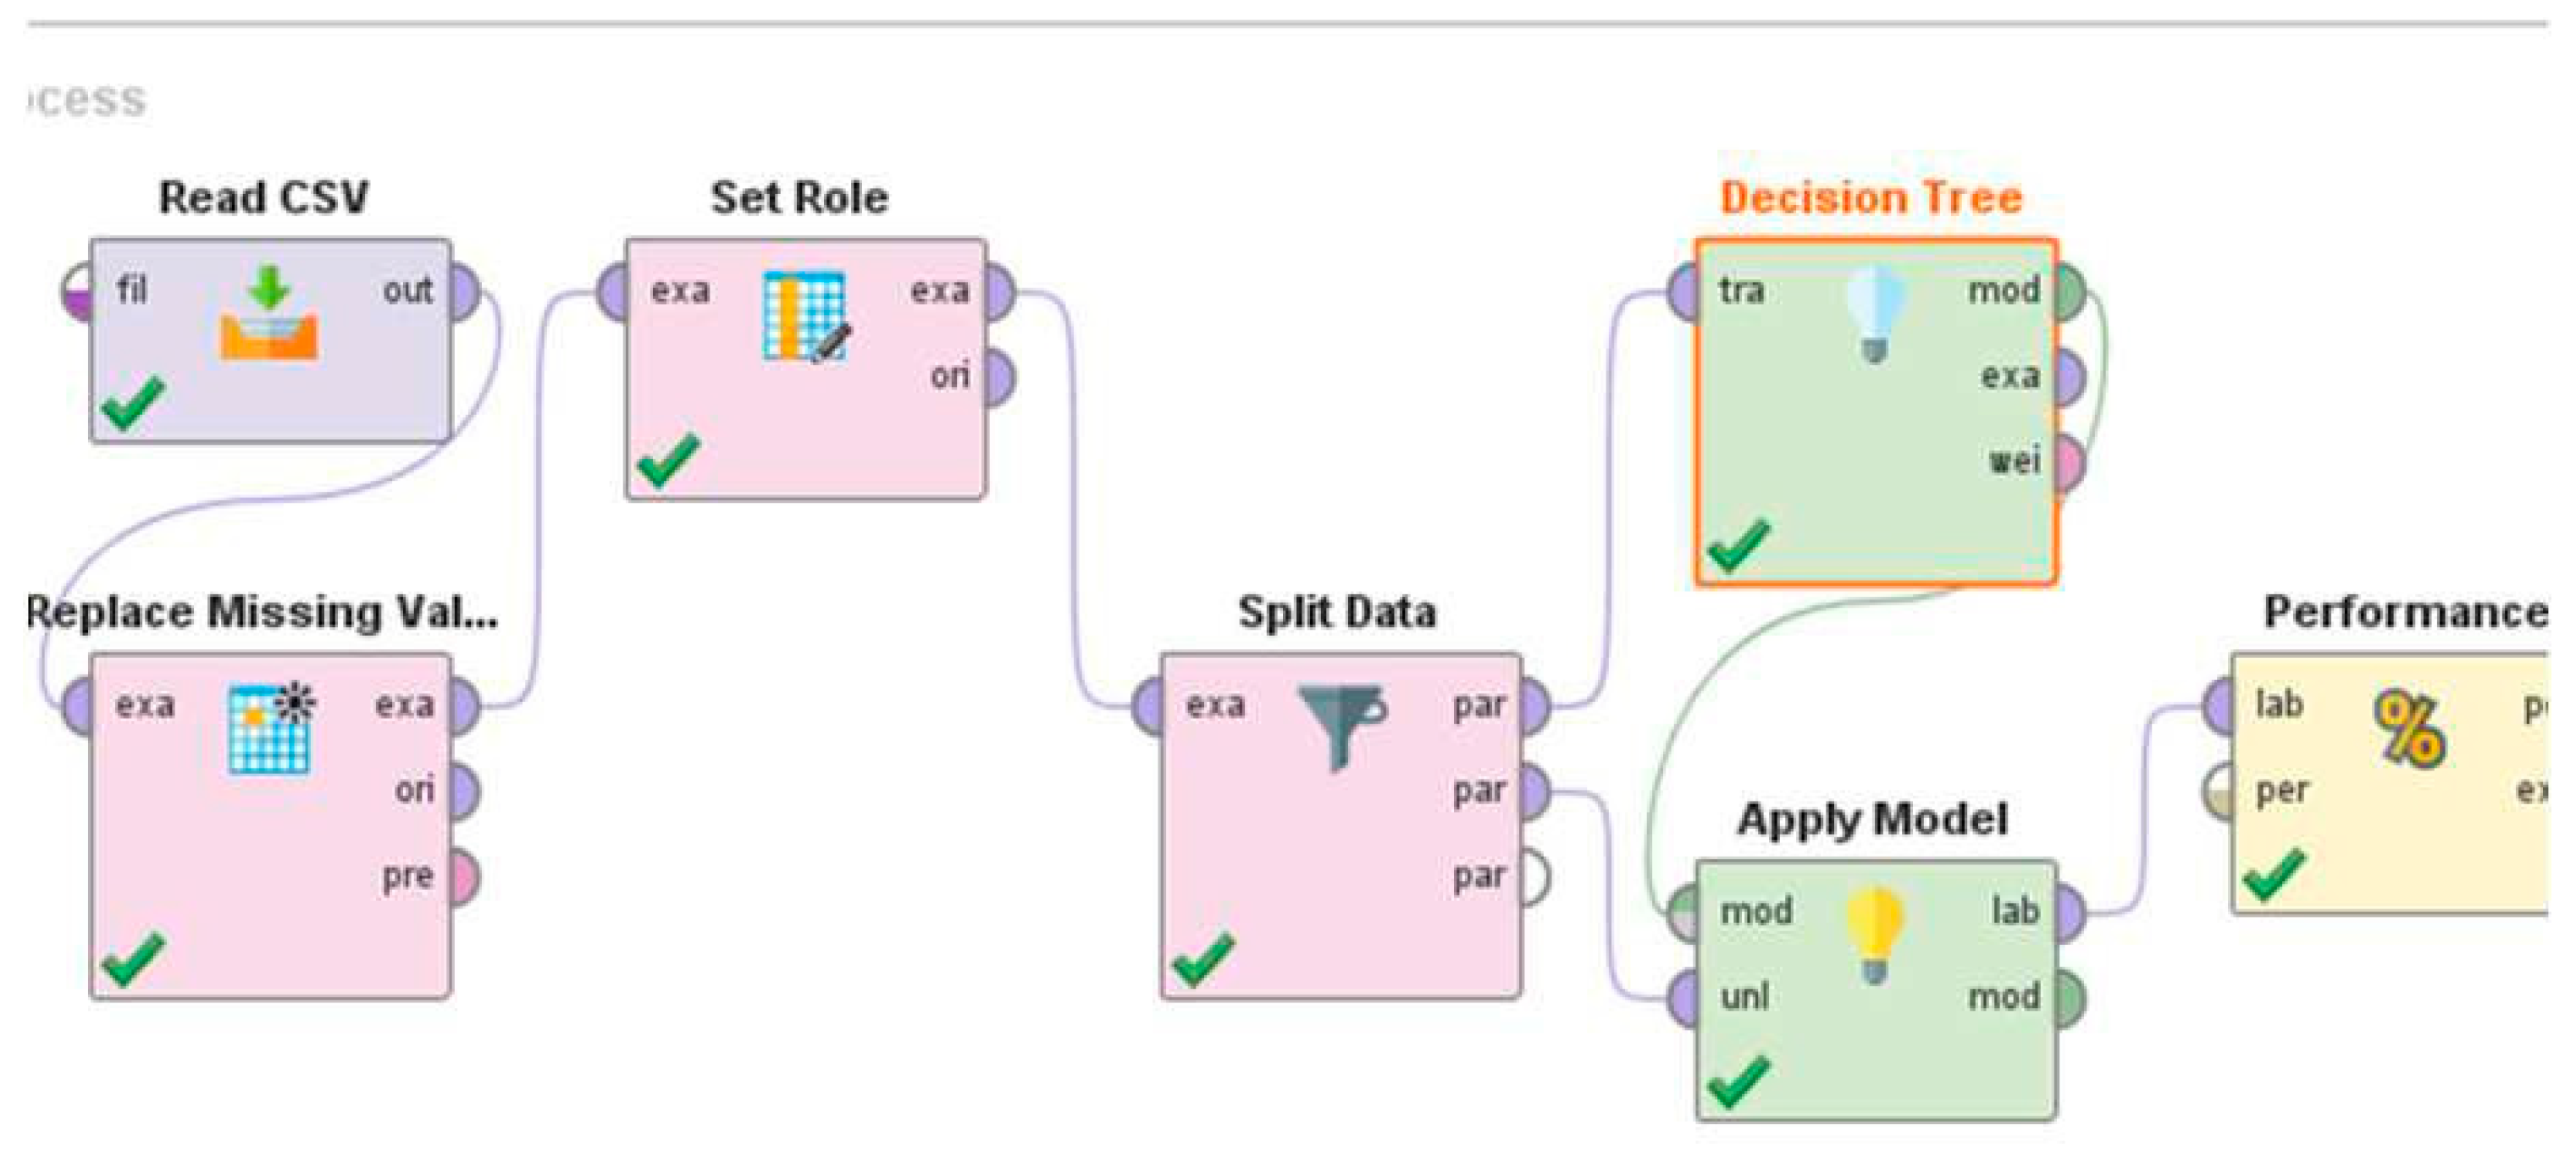
Figure 4.
Performance matrix of the decision tree model.
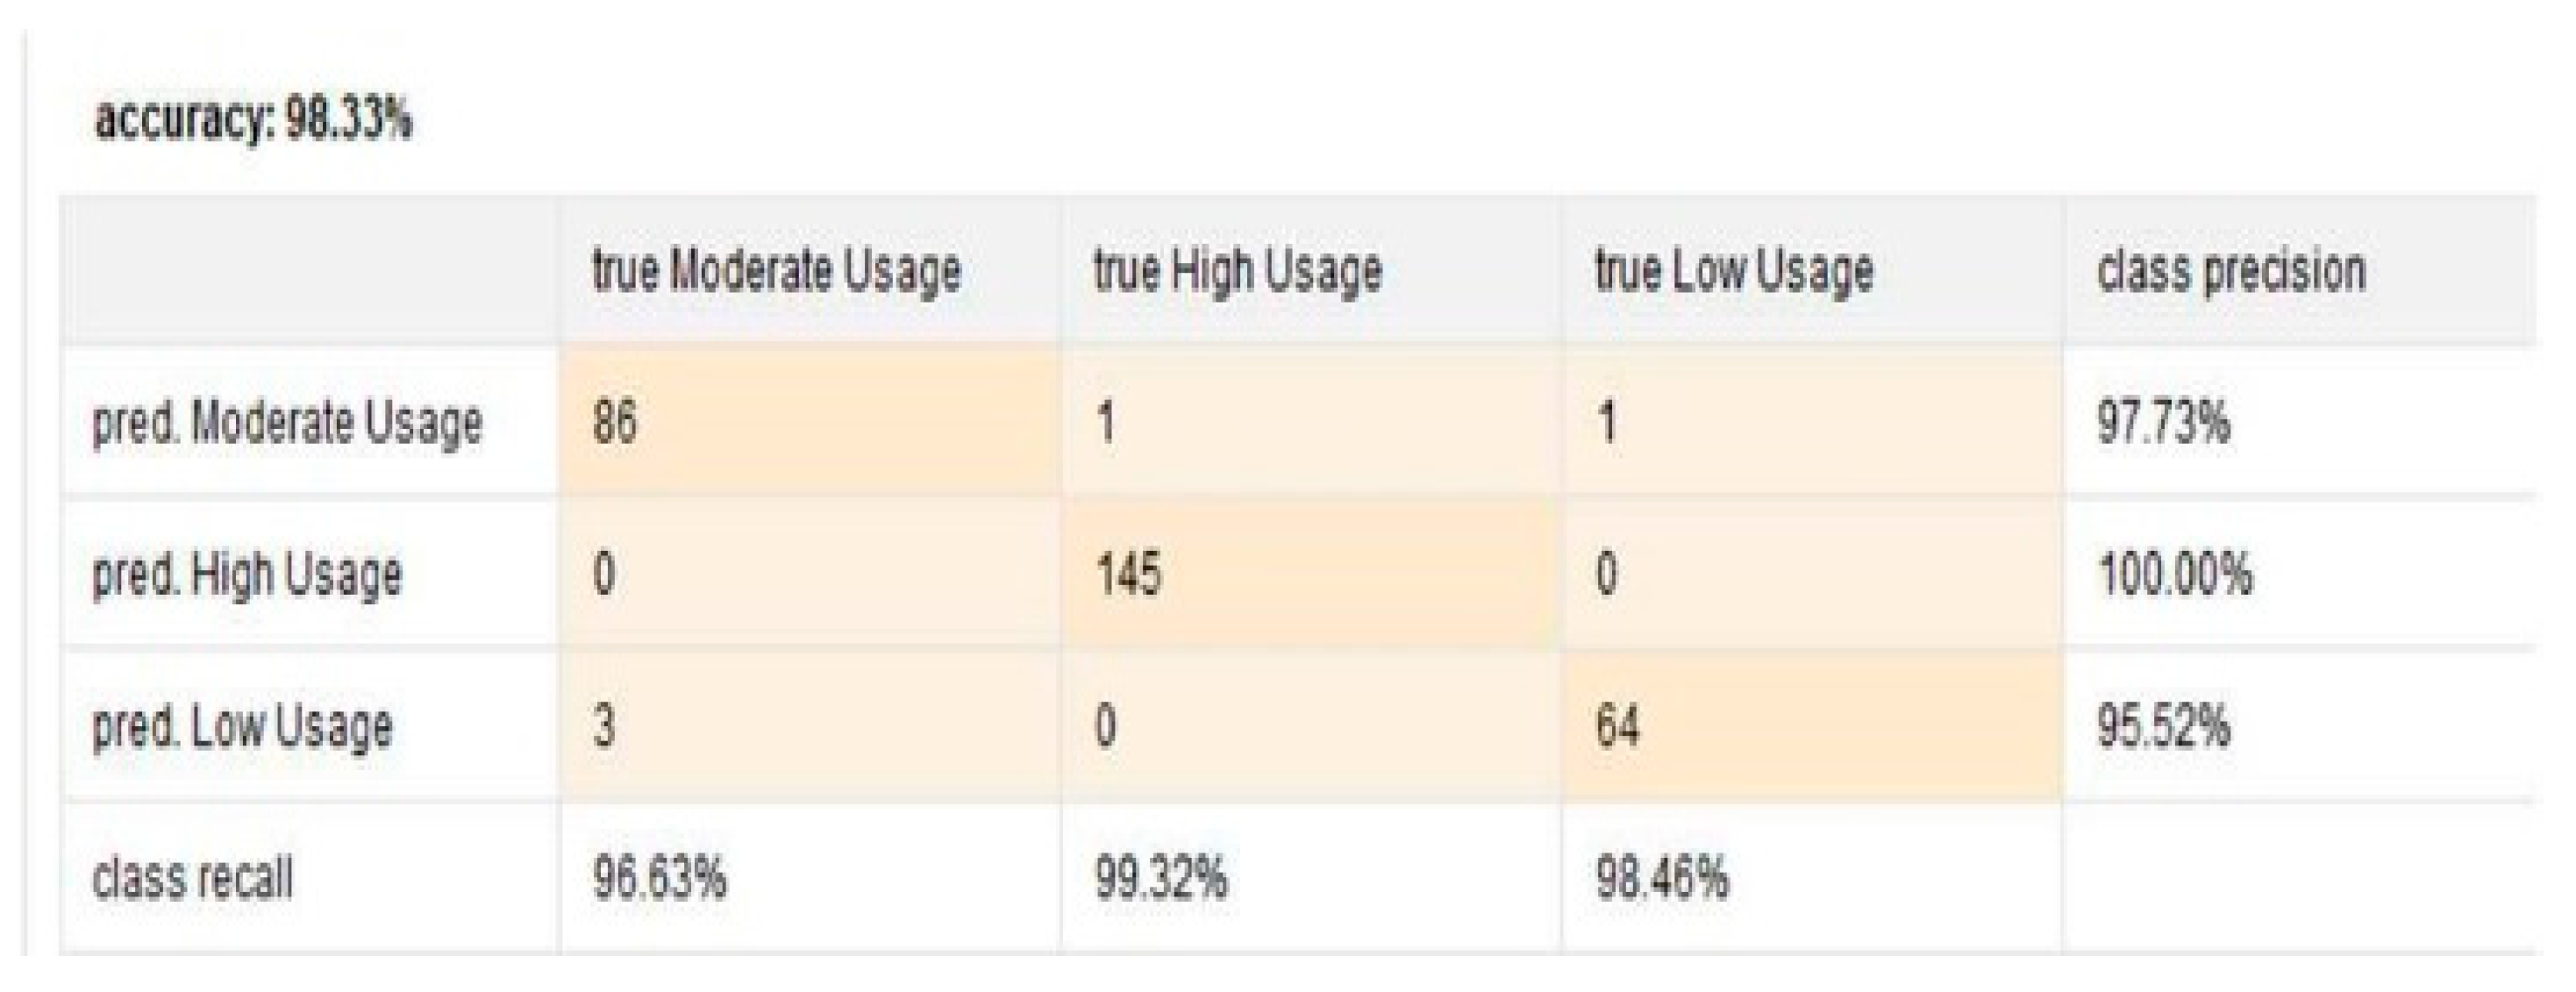

Table 1.
Summary of Smartphone Usage Studies.
| Study | Data Set Size | Key Outcomes | Findings | Accuracy |
| [12] | 44 articles from 16 countries | Examine effects of excessive screen time on: (i) neurodevelopment, (ii) learning & memory, (iii) mental health, (iv) substance use disorders, and (v) neurodegeneration | Excessive screen time linked to lower self-esteem, higher risk of mental health issues and addictions, slowed cognitive development, and potential early onset dementia | N/A |
| [13] | 64 participants over 8 weeks | Predictors of Snapchat usage using survey and smartphone interaction data | Age, smartphone addiction, happiness, and usage of WhatsApp and Facebook Messenger were significant predictors of Snapchat usage | High |
| [14] | 10 datasets | Evaluate whether smartphone usage self-report scales can accurately predict actual usage behavior | Self-reported scales correlate poorly with objective smartphone behavior; scales focused on habit (not addiction) showed slightly better predictive value | 85% |
| [15] | 624 users | Personality aspects are linked to specific phone habits | Random forest model | 91% prediction |
| [16] | College students | Balanced phone use improves academic performance | Structural equation modeling | 76% performance correlation |
| [17] | 50 users | Users overestimate usage; unique patterns identified | Mixed effects models | 82% usage accuracy |
| [18] | 5 days | Short periods reveal habitual phone checking behavior | Time-series analysis | 87% weekly usage pattern accuracy |
Table 2.
Results Summary.
| Class | Precision (%) | Recall (%) |
| Moderate Usage | 97.73 | 96.63 |
| High Usage | 100.00 | 99.32 |
| Low Usage | 95.52 | 98.46 |
Disclaimer/Publisher’s Note: The statements, opinions and data contained in all publications are solely those of the individual author(s) and contributor(s) and not of MDPI and/or the editor(s). MDPI and/or the editor(s) disclaim responsibility for any injury to people or property resulting from any ideas, methods, instructions or products referred to in the content. |
© 2025 by the authors. Licensee MDPI, Basel, Switzerland. This article is an open access article distributed under the terms and conditions of the Creative Commons Attribution (CC BY) license (http://creativecommons.org/licenses/by/4.0/).
Copyright: This open access article is published under a Creative Commons CC BY 4.0 license, which permit the free download, distribution, and reuse, provided that the author and preprint are cited in any reuse.


