Preprint
Article

This version is not peer-reviewed.

Association of Long COVID-Related inflammatory Processes in the Musculoskeletal System: 12-Month Longitudinal Cohort Feasibility Study

A peer-reviewed article of this preprint also exists.

Submitted:

07 November 2025

Posted:

17 November 2025

You are already at the latest version

Abstract

Background: A subset of individuals develops persistent symptoms following SARS-CoV-2 infection, including musculoskeletal (MSK) manifestations, a condition known as long COVID (LC). Emerging hypotheses suggest that chronic low-grade inflammation in LC may impair bone metabolism and compromise joint health. However, empirical evidence is limited, and the impact of LC on MSK health, particularly bone and joint integrity, is poorly understood. Aim: To determine the influence of LC on MSK function, including bone health, body composition, and joint integrity. Methods: A 12-month longitudinal prospective cohort feasibility study was conducted involving 45 adults with LC and 40 well-recovered (WR) post-COVID-19 controls. Baseline and follow-up assessments included dual-energy X-ray absorptiometry (DXA) for bone mineral density (BMD) and total body composition (TBC), alongside ultrasound of the hand and knee joints to evaluate intra-articular changes. Results: The LC group had more fat in the gynoid, android, and leg regions at each assessment point compared to the controls (p<0.01). LC showed a significantly lower synovial hypertrophy at the baseline, 13% compared to WR 45% (p=0.001), and a marginal improvement in hand synovial hypertrophy, over 12 months, from a median of 2 (IQR 1;5) to 1 (IQR 0;3) (p=0.012), as observed via MSK ultrasound. No notable differences were found between groups regarding BMD, either in the LC group compared to the control group or overtime. Conclusion: This cohort study of LC adults and controls found no evidence of rapid bone loss; however, adiposity and joint symptoms suggest the need for ongoing monitoring. Future research should focus on MSK markers, muscle function, advanced imaging, and improving MSK health.

Keywords: 
;  ;  ;  ;  ;  ;  

1. Introduction

In 2019, coronavirus disease 2019 (COVID-19) evolved into a global pandemic caused by the severe acute respiratory syndrome coronavirus 2 (SARS-CoV-2), resulting in widespread morbidity and mortality [1]. Although the majority of infected individuals recover from the acute phase within weeks or a month, an estimated 10% develop prolonged sequelae and complications in their physical health and well-being that last beyond 12 weeks, a condition collectively termed "long COVID" [2,3,4]. The World Health Organisation (WHO) and the National Institute for Health and Care Excellence (NICE) define LC as a multisystem disorder that can involve the respiratory, cardiovascular, neurological and musculoskeletal (MSK) systems [5,6].
Emerging evidence suggests that LC may have significant implications for MSK health, affecting bones, joints and body composition. Individuals experience pain in their spine, reporting pain that is in various locations along the back, or with lower back pain or neck pain, which significantly impacts their quality of life [7,8,9,10,11,12,13,14]. Previous research has reported post-viral MSK deterioration [15,16]. SARS-CoV-2 infection can dysregulate bone metabolism, impair osteoblast function and increase osteoclast-mediated bone degradation [17,18]. These mechanisms raise concerns about increased risk for osteopenia, osteoporosis and fragility fractures in LC patients. Moreover, changes in body composition have been observed following SARS-CoV-2 infection, with evidence suggesting a shift toward higher adiposity and decreased lean muscle mass [16,19].
Many individuals with LC report persistent myalgia, arthralgia and generalised fatigue, resembling post-viral syndromes [20,21,22]. Inflammatory mediators have been implicated in prolonged systemic inflammation, potentially contributing to bone resorption, reduced bone mineral density (BMD) and joint pathology [23]. Given that altered body composition is associated with both osteoporosis and sarcopenia, understanding these changes in LC patients is crucial for early intervention.
While previous studies have explored the respiratory, neuro, and cardiovascular sequelae of LC [24,25,26,27], research on its effects on bone and joint health remains limited. Findings from a recent systematic review indicate that COVID-19 may influence bone health, leading to increased bone regulatory markers, increased bone resorption, reduced bone formation, and decreased BMD. Furthermore, robust imaging studies examining MSK function in LC are not available [28]. This study aims to investigate the impact of LC on MSK function, encompassing bone health, total body composition, and joint integrity.

2. Materials and Methods

Study Design and Ethics Approval

The details of the study population with inclusion/exclusion criteria have been described previously in our earlier publication [29]

Data Collection and Assessments:

DXA Assessment

BMD and TBC were measured using DXA (Lunar Prodigy Advance 2005, GE, Milwaukee, WI, USA) with Encore 11.40.004 software, following the ISCD guidelines for scan acquisition [30]. Quality control (QC) scans were performed using the manufacturer's calibration phantom before participant assessment to ensure measurement accuracy and minimise precision error [31]. Scans were conducted in accordance with standard clinical positioning protocols [32], including the lumbar spine (L1-L4), femoral neck, and bilateral total hip. Vertebrae exhibiting structural abnormalities or a T-score deviation >1.0 compared to adjacent vertebrae were excluded from the analysis [33]. Osteopenia and osteoporosis were classified using WHO T-score thresholds.
Fracture Risk Assessment (FRAX®) and QFracture® tools were used to estimate the 10-year probability of fractures [34,35]. The measurements were based on the WHO osteoporosis T-score classification and the NICE guidelines for fragility fracture risk assessment, observing healing responses, and having a reliable reference range [36,37,38]. TBC included lean mass, fat mass, and fat%. A single operator (FA) conducted all DXA scans, and Prof. (KK) undertook reporting.

Ultrasound Assessment

MSK ultrasound scans of the hand and knee joints were performed using a high-resolution system (Canon Medical System Co., Apilo α I900) equipped with an 18L7 MHz multi-frequency linear array transducer. Grey-scale images were acquired at a scan frequency of 14 MHz, with frame rates of 32 fps for the hand and 26 fps for the knee, and a gain setting of 85. PD signal was assessed using a colour frequency of 7.2 MHz at 16 fps, a pulse repetition rate of 10.7 kHz, and a colour gain of 43. The focal zone was aligned with the region of interest (ROI) for all scans, and the lower end of the Doppler box was positioned as close to the ROI as possible when assessing the PD signal.
For hand ultrasound, the 2nd–5th metacarpophalangeal joints (MCPJs) and proximal interphalangeal joints (PIPJs) (8 joints per participant) were scanned using a modified protocol based on the European Alliance of Associations for Rheumatology (EULAR) guidelines for standardised MSK ultrasound in Rheumatology [39]. A minimum of three images per joint were captured for scoring: longitudinal midline, cross-sectional, and one Power Doppler (PD) signal view. All ultrasound scans were performed and images evaluated at least one month post study visit by one of the authors (FA) under the guidance of ADO, an experienced MSK sonographer [40].
Inter-rater reliability was assessed using greyscale images from 10 randomly selected participants. Two trained assessors (FA and OA), both trained by the same person (ADO), independently scored the images consecutively on the same day. Semi-quantitative grading reliability was assessed using weighted kappa (kw) statistics, while binary outcomes were evaluated using unweighted kappa statistics.
Reliability analysis [Supplementary 1] demonstrated substantial to almost perfect agreement across ultrasound features: synovial hypertrophy, synovial effusion, PD signal based on Landis and Koch classification (k: 0=poor; 0.01-0.2=slight; 0.21-0.4=fair; 0.41-0.6=moderate; 0.61-0.8=substantial; 0.81-1.0=almost perfect) [41].
Joint abnormalities were graded based on the Outcome Measures in Rheumatology (OMERACT-7) criteria and definitions [42,43]:
  • Synovial hypertrophy: Abnormal hypoechoic intra-articular tissue that is non-displaceable and poorly compressible, and which may exhibit a Doppler signal.
  • Synovial effusion: Abnormal hypoechoic or anechoic intraarticular material that is displaceable and compressible but does not exhibit a Doppler signal.
  • PD signal intensity: Area of colour signal within the joint capsule in the absence of background noise. Only when there is hypoechoic synovial hypertrophy.
Each feature was graded on a scale from 0 (none) to 3 (severe) [44]. Then the sum scores for each feature were calculated by summing the individual scores from the scanned joints. For each participant, the scores ranged from 0 to 24, where a score of 0 indicated a complete absence of the feature across all joints, and a score of 24 reflected grade 3 severity in all assessed joints for that feature. All acquired images were viewed for scoring using MicroDicom DICOM Viewer 2024.2 (64-bit), which is unlicensed for commercial use and utilises a window-level preset (WL77/ WW160).
For the knee joint, the participant lay supine, and the suprapatellar recess was scanned with the knee in flexion of approximately 30º (on either the dominant or most painful side). Ultrasound-detected synovial changes were defined using the OMERACT-7 definitions [42]. Synovial hypertrophy and effusion were measured at their maximum diameter in millimetres using the longitudinal axis. Synovial effusion and hypertrophy were assessed along a longitudinal axis, with an abnormality threshold set at ≥4 mm as recommended by EULAR [45]. PD assessments were conducted in a longitudinal plane, and these pathological phenotypes were scored binary based on whether it was present or absent. The examination protocol adhered to the MSK Ultrasound Technical Guidelines for the knee developed by the European Society of MSK Radiology (ESSR) [46].

Statistical Analysis

Data were analysed using Stata v18.0 (StataCorp, College Station, TX, USA). Given the exploratory nature and small sample size, the analysis focused on group comparisons and within-group changes over 12 months. Independent t-tests (or Mann-Whitney U tests for non-parametric data) were used for between-group comparisons, and paired t-tests (or Wilcoxon signed-rank tests) for within-group changes. Continuous data were expressed as mean +/- standard deviation (SD) or median with interquartile range (IQR), depending on the distribution.
DXA-derived BMD parameters are assumed to follow a normal distribution [47,48]. For this purpose, a t-test was conducted to compare the groups, using paired t-tests for only the completed records within each group (LC or WR) to assess changes from baseline to follow-up. For the DXA TBC, normality was checked. For normally distributed variables, the difference between the means of two groups was compared using a t-test. For non-normally distributed variables, the Mann-Whitney U test was used to compare the difference in medians. A Wilcoxon signed-rank test by group (LC or WR) was used to compare the change within the groups after follow-up, based on only the completed records.
Sum scores of individual ultrasound features (hypertrophy, effusion, and Power Doppler) were treated as continuous data for statistical analysis. Mann-Whitney U-tests were used for non-parametric comparisons. knee ultrasound data were analysed using Chi-square (χ²) tests for binary outcomes. Within-group changes were assessed using Wilcoxon rank sum tests for hand joints and McNemar tests for the Knee, reporting the number of participants with discordant changes [positive-to-negative (improved) and negative-to-positive (worsened)].
A significance threshold of p < 0.01 was applied to reduce Type I error risk due to multiple comparisons. No formal correction for multiple testing was performed, as analyses were exploratory. Effect sizes and 95% confidence intervals were reported where applicable to indicate the magnitude and precision of observed differences.

3. Results

Demographics and Characteristics

The participants’ characteristics have been described in detail in our previous paper [29].

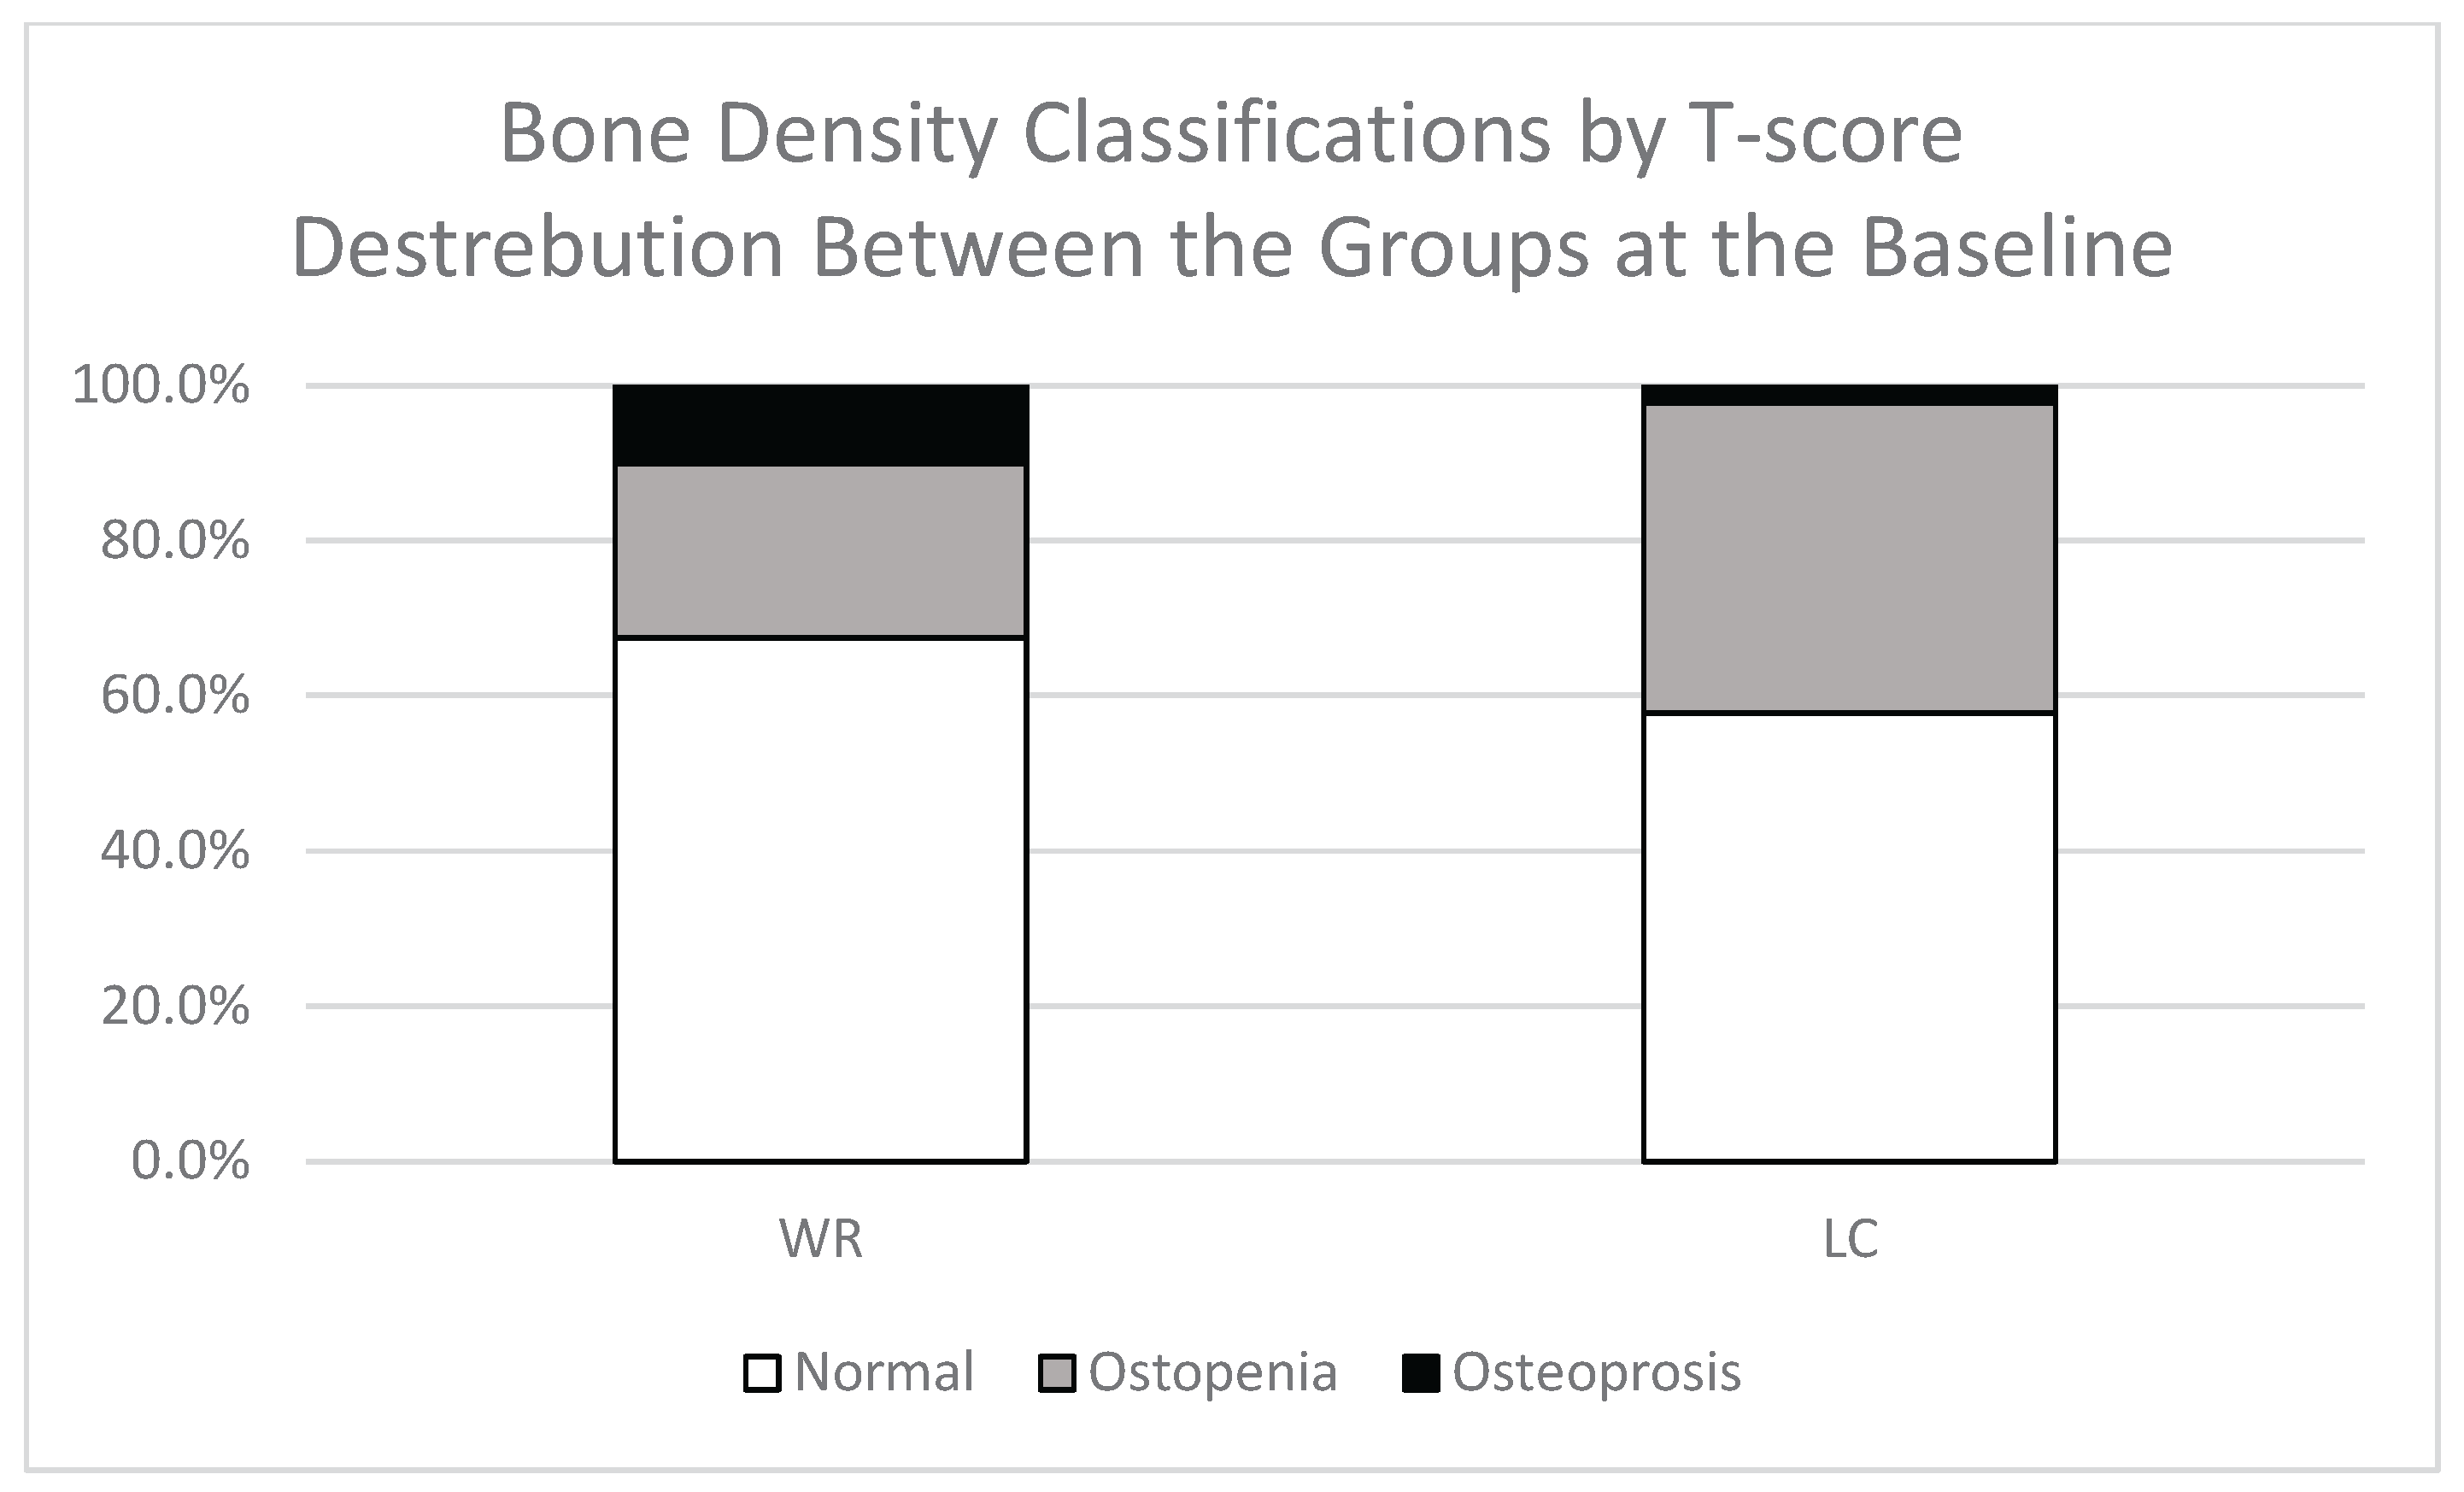
Comparison of BMD between LC and WR groups

The BMD measurements at baseline based on the T-score were slightly higher for the LC group for the total body, but slightly lower for the lumbar spine and hips compared to the WR group. However, the difference was not significant. Additionally, based on the fracture risk assessment questionnaire, no significant differences have been observed between the groups at baseline, neither in the Major osteoporotic nor hip fracture risk, as shown in Table 1. However, participants with a T-score below -2.5 (osteoporotic range) constituted 2% of the LC group and 10% of the WR group. Additionally, 40% of participants in the LC group and 23% in the WR group were osteopenic (T-score between -1.0 and -2.5), while 58% of the LC group and 68% of the WR group had normal bone density (T-score above -1.0) at the baseline (p=0.103), as shown in Figure 1.
No notable differences were observed between the LC and WR groups at both the start and after 12 months in Total Body, Lumbar Spine (L1-L4), and Hip region BMD [Table 2]. A trend towards lower L1-L4 BMD was observed in LC compared to WR, driven mainly by LC males after gender-stratified subgroup analysis. In L1-L4 BMD, LC males had baseline values of 1.224 ± 0.06 versus 1.298 ± 0.257 g/cm² in WR males (p=0.51), and follow-up values of 1.250±0.119vs 1.315±0.3 g/cm² (p=0.651) [Supplementary S.2]. However, a notable but insignificant decrease in total body BMD over 12 months was seen in the LC male subgroup, decreasing from 1.302 ± 0.075 to 1.285 ± 0.077 g/cm² (p=0.0130) [Supplementary S.3]. Conversely, the LC female subgroup showed slightly higher L1-L4 BMD compared to WR at both time points: baseline (1.200 ± 0.028 vs 1.146 ± 0.034 g/cm², p=0.2482) and follow-up (1.184±0.157 vs 1.127±0.144 g/cm², p=0.336), respectively [Supplementary S.2]. Furthermore, the WR group experienced a small but statistically insignificant increase in right total hip BMD (from 1.016±0.171 to 1.023±0.175 g/cm², p=0.0256) as shown in Table 3, primarily due to the WR males (p=0.0241) [Supplementary S.3].

Total Body Composition

Gynoid Region

LC participants exhibit a significantly higher percentage of fat tissue and fat mass in the gynoid region compared to WR at both time points. At baseline, the median gynoid fat was 50.3% in LC vs. 40.3% in WR (p=0.0008), and the difference remained significant at follow-up (p=0.0015). The median gynoid fat mass was also higher in the LC compared to the WR groups (6202 g vs. 4619 g; p=0.0099), with these differences persisting at follow-up (p=0.0089) [Table 2]. Gender analysis revealed that females primarily drove the differences in fat percentage and mass [Supplementary S.4]. Although the LC group had lower gynoid lean mass compared to the WR group at both baseline (6111g vs 6714g, p=0.088) and follow-up (6147g vs 6601g, p=0.221), the difference was not significant, as shown in Table 2. No significant longitudinal changes in fat or lean mass were observed. However, LC showed a slight, insignificant increase in gynoid fat mass (p=0.029) [Table 2], primarily attributed to males, as shown in Supplementary S.5.

Android Region

In the Android region, LC participants had significantly higher fat percentages than WR at both baseline and follow-up. The median at baseline was 49.5% in LC compared to 43.5% in WR (p=0.0068), and this difference remained significant at follow-up (p=0.0065) [Table 2]. These elevated values in LC were primarily due to females, as indicated by gender analyses, as shown in Supplementary S.5. There were no substantial changes in android fat percentage or fat mass over time within or between groups, as shown in Table 3.

Leg Region and Total Lean Mass

Analysis showed that the LC group had a higher leg fat percentage than the WR participants at both points, primarily due to the female participants. At baseline, LC median was 43.8%, WR 36.1% (p=0.0013); at follow-up, the difference persisted (p=0.0029) [Table 2]. Leg lean mass was lower in the LC group but only marginally significant at baseline, median 13545g vs 15504g in the WR group (p=0.026), and not at follow-up, the LC group 13394g vs 14680g for the WR group (p=0.132) [Table 2]. No significant longitudinal changes within groups, though LC showed a borderline increase in leg fat percentages median from 43.4% to 44.6% (p=0.0155) [Table 3].
Total lean mass was lower in LC than in WR participants, but the difference was not significant at either baseline or follow-up [Table 2]. No significant changes occurred within groups over time [Table 3].

Intra-Articular Changes

Ultrasound assessment of the hand joints showed no significant differences in synovial hypertrophy scores between LC and WR groups at either baseline or follow-up. However, both groups demonstrated a reduction in synovial hypertrophy scores over 12 months. Despite LC having higher median scores initially, the difference was not statistically significant [Table 2]. Longitudinal changes within-group revealed a marginal reduction in synovial hypertrophy scores in the LC group over 12 months, with the median score decreasing from 2 (IQR 1–5) to 1 (IQR 0–3) (p=0.012), indicating improved intra-articular inflammatory features. Furthermore, there was a non-significant reduction in synovial effusion in the LC group over 12 months (p=0.085) [Table 3].
Ultrasound assessment of the knee joints revealed that, at baseline, the LC group exhibited significantly less suprapatellar effusion compared to the WR group (13.3% vs 45.0%, p=0.001) and non-significantly lower synovial hypertrophy (11.1% vs 32.5%, p=0.016), as shown in Table 2. However, these differences were no longer significant at follow-up (p>0.01). Over time, effusion non-significantly increased in LC from 13.3% to 30.6% (p=0.023), indicating potential changes in the progression of suprapatellar effusion [Table 3].

4. Discussion

To address the knowledge gap regarding LC, a longitudinal cohort study was conducted by following adults with LC and WR controls over 12 months. Furthermore, our recent findings suggest that LC is associated with poorer HRQoL, particularly in terms of physical health, and increased joint pain [29]. This also relates to a decline in exercise capacity, which can be partly seen as the natural deconditioning that occurs when someone has been ill. COVID-19 and LC have emerged as significant catalysts for the generalised deterioration of skeletal muscle [49]. This study aimed to investigate whether LC influences MSK function, including bone health, body composition, and joint integrity. This study found significant differences in two strands: between the two groups, LC had increased gynoid, android, and legs fat at baseline compared to WR. Within 12 months, there was an improvement in hand joints synovial hypertrophy in the LC group. Furthermore, no significant differences were observed in BMD.
This suggests that factors beyond visible musculoskeletal inflammation, such as deconditioning, metabolic changes, autonomic dysfunction, or central pain mechanisms, may contribute to the persistence of symptoms. Notably, the study provides a 12-month longitudinal perspective, which is limited in the current literature and was identified as a gap by our previous systematic review [28].

Long COVID Associated with Increased Total Body Composition in Both Android and Gynoid Areas:

Participants in the LC group exhibited significantly higher fat mass, particularly in the android and gynoid regions, and a trend toward reduced lean mass in the lower limbs compared to the WR controls. These differences persisted after 12 months, likely reflecting reduced physical activity and deconditioning driven by fatigue and pain [50,51]. The combination of increased fat and decreased lean mass may lead to MSK functional decline and elevated metabolic risk, providing a plausible link to poorer HRQoL.
Previous studies have demonstrated decreased muscle mass and elevated visceral adipose tissue in both acute and post-COVID-19 phases [16,19,52]. A cross-sectional study revealed that individuals suffering from LC exhibited significantly reduced levels of total and appendicular lean mass [53], which is consistent with the current findings. Mechanistically, elevated inflammatory markers may accelerate protein breakdown, leading to a reduction in muscle mass, or the MSK tissue becomes an easy target for viruses caused by Angiotensin-converting enzyme two expression, leading to tissue damage [53,54,55]. Similar patterns are observed in other chronic inflammatory diseases, where excess fat and reduced muscle mass are associated with adverse health outcomes and increased mortality [54,56].
Persistent fatigue and inactivity in LC likely contribute to muscle deconditioning and fat accumulation. Peripheral mechanisms, including both structural and functional muscle damage, have been linked to LC pathophysiology [57,58]. These findings emphasise the importance of targeted rehabilitation strategies to mitigate muscle loss and restore function.
Body composition is a modifiable factor in LC. Interventions such as symptom-based physical activity, progressive resistance training, and nutritional support may help reverse adverse changes. However, post-exertional malaise remains a challenge, as increased activity can exacerbate symptoms in some individuals. Further trials are needed to identify safe and effective strategies for preserving MSK integrity in LC populations.

No Association of Bone Mineral Density or Bone Turnover Markers in Long COVID:

No significant differences in BMD were observed between LC and WR participants, with no notable decline in either group over 12 months. These findings suggest that LC did not induce detectable bone loss or disrupt bone remodelling during the study period.
A recent systematic review highlighted adverse bone effects in acute and post-acute COVID-19, including elevated bone turnover markers and reduced BMD. However, LC-specific data remain scarce [28]. This study is among the first to evaluate bone health in a clearly defined LC cohort. The contrast between the bone loss observed in acute or post-acute COVID-19 cases and the stability seen in the LC participants suggests that skeletal effects may be transient, phenotype-dependent, or driven by acute-phase factors such as inflammation, immobilisation, or corticosteroid use, none of which were applied in this sample.
Mean total body BMD (~1.22 g/cm²) remained nearly unchanged after 12 months. Both groups experienced minor total body BMD decline, with LC males showing slightly greater reductions than WR males. Bone health remained stable in the LC sample, which had a prolonged decline in quality of life from the chronic condition and did not receive ongoing high-dose steroids. However, while fracture risk in this specific LC population may be lower than initially thought, continued vigilance is essential over the long term.
The lumbar spine (L1-L4) and hip area are more sensitive sites for metabolic or mechanical changes, respectively. BMD values were similar between groups and did not significantly change over time. Despite this, subgroup trends indicated that overall spine BMD was slightly lower in the LC group, primarily due to the influence of males. Over time, females in both groups experienced a slight decrease in BMD at L1-L4. Additionally, LC males showed a slight reduction in the LT femoral neck. In contrast, WR showed virtually no bone loss on average, with insignificant increases in RT total hip BMD.
An early prediction is that individuals who have contracted COVID-19, as well as the safety measures or lockdown, may face an effect on bone health [59]. Furthermore, some studies found that non-human models infected with SARS-CoV-2 harm trabecular bone acutely via alterations in bone structure and an increase in osteoclast numbers [60,61,62,63]. While this study did not find a significant difference in BMD between LC and WR individuals, the observed trend of lower values in LC participants merits further exploration in future research.
It has been suggested that the use of corticosteroids in COVID-19 patients may contribute to these physiological changes. When comparing BMD reduction between non-COVID-19 corticosteroid patients and COVID-19 corticosteroid patients, it was observed that the group with SARS-CoV-2 had lower BMD [64]. In this study population, there were no participants who were on high-dose corticosteroid (over 5 mg of prednisolone or equivalent daily).
These findings are reassuring for LC patients without osteoporosis risk factors, highlighting the importance of longer-term follow-up over one year and targeted studies on higher-risk LC subgroups, such as post-hospitalisation patients, steroid users, and older adults.

Long COVID Linked to Persistent Joints Pain With 12-Month Reduction in Hand Synovial Hypertrophy

Ultrasound findings revealed minor subclinical intra-articular changes in LC participants. Despite this, joint pain scores remained elevated and unresolved after 12 months. Exploratory scans of the dominant or most symptomatic side showed an insignificant but noticeable decrease in hand synovial hypertrophy in the LC group, though no differences were detected compared with the WR group. Synovial effusion or active synovitis, as PD signals remain minimal. Notably, the longitudinal reduction in hypertrophy was consistent with the longitudinal changes in IL-6 observed in our previous results [29]. A cytokine known to be linked with synovial inflammation [65].
At baseline, fewer LC participants exhibited knee effusion compared to the WR group. However, the LC group showed a non-significant increase in knee effusion at follow-up. Yet, many isolated case reports and very few studies include sonographic assessment. Gasparotto et al. case report found that a unilateral articular change in the ankle and knee [66]. Also, Mukarram et al. case series report involving five post-COVID-19 patients who exhibited clinical features resembling rheumatoid arthritis, including grade 2 synovitis in their metacarpophalangeal joints, consistent with rheumatoid arthritis like presentations [67].
This may reflect incidental or transient findings rather than persistent pathology. Viral infections such as hepatitis B or C, Epstein-Barr virus, and HIV are known to affect joints [68,69,70,71], and widespread joint and muscle pain has been reported in acute COVID-19 [72]. Similar patterns were seen in SARS-CoV-1, where persistent joint pain lasted up to four years despite negative MRI findings, suggesting neurogenic pain or undetectable low-grade synovitis [73].
Most cases of SARS-CoV-2 arthritis cases lack viral presence in synovial fluid, nor in deceased COVID-19 patients [74], though one study identified viral nucleic acids in the joints of moderately ill outpatients [75]. However, evidence for direct viral invasion of synovial tissue remains limited [76,77,78].
Two main theories exist: one suggests viral arthritis driven by viremia or cytokine storm [78]; the other suggests reactive arthritis triggered by systemic inflammation [79].
Knee joint effusion with synovitis often causes knee pain in older adults, especially in the suprapatellar compartment [80]. As LC patients are more prone to a sedentary lifestyle due to the related symptoms [81], this may contribute to muscle weakness and altered joint mechanics. Some participants attempted to cope through increased physical activity; however, the transition from inactivity to activity, combined with underlying muscle deconditioning and a higher BMI, may have predisposed them to knee effusion. Prolonged inactivity in LC can lead to muscle weakness and deconditioning, while a high BMI adds mechanical stress. Together, these factors increase the risk of knee effusion and synovitis, especially when transitioning from inactivity to activity [82,83].
In this LC cohort, objective signs of synovial changes were present despite persistent joint pain, and ultrasound revealed only minor alterations. This suggests that LC MSK pain may not stem from obvious arthritis, but rather from neural mechanisms or subtle inflammation, which guides treatment options such as pain management or rehabilitation.
Knee effusion trends may be associated with weight gain, deconditioning of the lower limbs, or resumption of activity after a period of inactivity. These changes are likely driven more by mechanical aspects than by inflammation. Clinically, this suggests that emphasis should be placed on rehabilitation strategies such as strengthening exercises and load management, rather than relying on disease-modifying anti-inflammatory treatments for similar LC profiles, unless there are red flags suggesting an alternative approach.

Limitations

The statistical approach using only paired and independent t-tests is limited as it doesn't account for repeated measures or group-by-time interactions. It used only complete records, risking bias if attrition isn't random. Mixed models or multiple imputation could use all data for more reliable estimates. T-tests can't model group X time effects or missing data, so linear mixed-effects or generalised mixed models are needed to handle these. Larger multicentre studies should adopt these models. Also, FDR or Bonferroni corrections for multiple outcomes should be considered. This feasibility study wasn't powered for full data analysis and used many uncorrected univariate tests, increasing false positives. A p<0.01 threshold was used to reduce this risk, but future studies should use formal adjustments or focus on pre-specified hypotheses [84]. Second, the small sample size may limit the detection of subtle parameter differences. Participation was voluntary, possibly attracting more motivated individuals with severe symptoms, leading to recruitment bias. About 22% withdrew during the year, risking attrition bias. Most participants were from semi-urban South-West UK, mainly Caucasian, with females more prominent in the LC group. Thus, findings may not generalise to diverse populations and may overrepresent females, missing male differences. Third, causal inferences are limited by the observational cohort design, which highlights difficulties where baseline behaviours and treatments may be unmeasured or confounders, restricting causal conclusions. Improvements or declines might result from natural recovery or external factors rather than being directly caused by LC. Fourth, a one-year BMD assessment via DXA may miss significant changes due to slow bone turnover and limited sensitivity, hiding subtle changes [37,85]. A longer follow-up, at least 2 years, is recommended to detect true changes and distinguish them from measurement variability reliably [86]. Some participants started new treatments, such as osteoporosis medications and vitamin D, which affected BMD and bone markers and masked differences from other LC factors. Five, results offer insights into subclinical conditions, but without a rheumatologist's evaluation or autoantibody testing, distinguishing inflammatory from degenerative changes is difficult. Six seasonal recruitment events, mostly in winter, may have influenced symptoms, activity, and responses. Additionally, lifestyle habits like diet and exercise, not fully controlled, could have affected body composition results. Finally, although data don't allow definitive conclusions on SARS-CoV-2 causative effects on MSK development in LC populations, they provide a compelling foundation for future systematic studies on the underlying mechanisms.

5. Conclusions

This study found that over 12 months, LC was associated with higher TBC in both the android and gynoid regions, and ultrasound showed only slight improvement in hand synovial hypertrophy over time. No significant changes were observed between LC and BMD. These findings suggest that MSK sequelae in LC may develop more subtly and require longer follow-up for detection. While LC does not seem to induce rapid or significant changes in bone density within one year, it has a noticeable effect on fat distribution and joint symptoms. While no definitive evidence was found for accelerated bone loss within the study period, the observed changes in adiposity and joint symptoms underscore the need for ongoing monitoring and care in this population. This study lays the groundwork for future studies incorporating rheumatological biomarkers, muscle function assessments, and advanced imaging to better understand and mitigate the long-term MSK effects of LC.

Supplementary Materials

The following supporting information can be downloaded at: Preprints.Org.

Author Contributions

Investigation, Methodology, Formal Analysis, Data curation, Writing (Original draft preparation), Visualisation, FA; Supervision, Methodology KK, WDS, RM and OAD; Conceptualisation, Project Administration KK, WDS; Reliability Assessment OA; Writing, Review and Editing KM, OAD. All authors have read and agreed to the published version of the manuscript.

Funding

This paper is funded by a PhD scholarship from Qassim University, Saudi Arabia.

Conflicts of Interest

The authors declare that they have no conflicts of interest.

Abbreviations

The following abbreviations are used in this manuscript:
BMD Bone Mineral Density
DXA Dual-Energy X-Ray Absorptiometry
LC Long COVID
MSK Musculoskeletal
PD Power Doppler
TBC Total Body Composition
WR Well Recovered

References

  1. Li, G.; Hilgenfeld, R.; Whitley, R.; De Clercq, E. Therapeutic strategies for COVID-19: progress and lessons learned. Nature Reviews Drug Discovery 2023, 22, 449-475. [CrossRef]
  2. Service, N.H. COVID recovery (long COVID). Available online: https://www.nhshighland.scot.nhs.uk/your-services/all-services-a-z/covid-recovery-long-covid/ (accessed on 08/01).
  3. Mahase, E. Covid-19: What do we know about "long covid"? BMJ 2020, 370, m2815, . [CrossRef]
  4. Malkova, A.; Kudryavtsev, I.; Starshinova, A.; Kudlay, D.; Zinchenko, Y.; Glushkova, A.; Yablonskiy, P.; Shoenfeld, Y. Post COVID-19 syndrome in patients with asymptomatic/mild form. Pathogens 2021, 10, 1408. [CrossRef]
  5. National Institute for Health and Care Excellence (NICE). Long-term effects of coronavirus (long COVID): What is it? Available online: https://cks.nice.org.uk/topics/long-term-effects-of-coronavirus-long-covid/background-information/definition/ (accessed on 09 September).
  6. World Health Organization (WHO). Post COVID-19 condition (Long COVID). Available online: https://www.who.int/europe/news-room/fact-sheets/item/post-covid-19-condition (accessed on 31/05).
  7. Nabavi, N. Long covid: How to define it and how to manage it. BMJ 2020, 370, m3489. [CrossRef]
  8. Bakılan, F.; Gökmen, İ.G.; Ortanca, B.; Uçan, A.; Eker Güvenç, Ş.; Şahin Mutlu, F.; Gökmen, H.M.; Ekim, A. Musculoskeletal symptoms and related factors in postacute COVID-19 patients. International journal of clinical practice 2021, 75, e14734. [CrossRef]
  9. Karaarslan, F.; Demircioğlu Güneri, F.; Kardeş, S. Postdischarge rheumatic and musculoskeletal symptoms following hospitalization for COVID-19: prospective follow-up by phone interviews. Rheumatology international 2021, 41, 1263-1271. [CrossRef]
  10. Sykes, D.L.; Holdsworth, L.; Jawad, N.; Gunasekera, P.; Morice, A.H.; Crooks, M.G. Post-COVID-19 Symptom Burden: What is Long-COVID and How Should We Manage It? Lung 2021, 199, 113-119. [CrossRef]
  11. Karaarslan, F.; Guneri, F.D.; Kardes, S. Long COVID: rheumatologic/musculoskeletal symptoms in hospitalized COVID-19 survivors at 3 and 6 months. Clin Rheumatol 2022, 41, 289-296. [CrossRef]
  12. Peghin, M.; Palese, A.; Venturini, M.; De Martino, M.; Gerussi, V.; Graziano, E.; Bontempo, G.; Marrella, F.; Tommasini, A.; Fabris, M. Post-COVID-19 symptoms 6 months after acute infection among hospitalized and non-hospitalized patients. Clinical Microbiology and Infection 2021, 27, 1507-1513. [CrossRef]
  13. Ghosn, J.; Piroth, L.; Epaulard, O.; Le Turnier, P.; Mentré, F.; Bachelet, D.; Laouénan, C. Persistent COVID-19 symptoms are highly prevalent 6 months after hospitalization: results from a large prospective cohort. Clinical Microbiology and Infection 2021, 27, 1041. e1041-1041. e1044, . [CrossRef]
  14. Vaishya, R.; Jain, V.K.; Iyengar, K.P. Musculoskeletal manifestations of COVID-19. Journal of Clinical Orthopaedics & Trauma 2021, 17, 280-281. [CrossRef]
  15. Greenhalgh, T.; Sivan, M.; Perlowski, A.; Nikolich, J.Ž. Long COVID: a clinical update. The Lancet 2024, 404, 707-724. [CrossRef]
  16. Montes-Ibarra, M.; Orsso, C.E.; Limon-Miro, A.T.; Gonzalez, M.C.; Marzetti, E.; Landi, F.; Heymsfield, S.B.; Barazzoni, R.; Prado, C.M. Prevalence and clinical implications of abnormal body composition phenotypes in patients with COVID-19: a systematic review. The American Journal of Clinical Nutrition 2023, 117, 1288-1305. [CrossRef]
  17. Kerschan-Schindl, K.; Dovjak, P.; Butylina, M.; Rainer, A.; Mayr, B.; Röggla, V.; Haslacher, H.; Weber, M.; Jordakieva, G.; Pietschmann, P. Moderate COVID-19 disease is associated with reduced bone turnover. Journal of Bone and Mineral Research 2023. [CrossRef]
  18. Al-Azzawi, I.S.; Mohammed, N.S.; Saad, I. The impact of angiotensin converting enzyme-2 (ACE-2) on bone remodeling marker osteoprotegerin (OPG) in post-COVID-19 Iraqi patients. Cureus 2022, 14. [CrossRef]
  19. Atieh, O.; Durieux, J.C.; Baissary, J.; Mouchati, C.; Labbato, D.; Thomas, A.; Merheb, A.; Ailstock, K.; Funderburg, N.; McComsey, G.A. The Long-Term Effect of COVID-19 Infection on Body Composition. Nutrients 2024, 16, 1364. [CrossRef]
  20. Fedorchenko, Y.; Zimba, O. Long COVID in autoimmune rheumatic diseases. Rheumatology International 2023, 43, 1197-1207. [CrossRef]
  21. Shah, S.; Danda, D.; Kavadichanda, C.; Das, S.; Adarsh, M.B.; Negi, V.S. Autoimmune and rheumatic musculoskeletal diseases as a consequence of SARS-CoV-2 infection and its treatment. Rheumatology International 2020, 40, 1539-1554. [CrossRef]
  22. Jaladhar, P.; S, C.; Salanke, M.; Kori, D. The Pattern of Post-viral Arthritis in COVID Pandemic State: An Experience of Tertiary Care Centre. J Assoc Physicians India 2021, 69, 11-12.
  23. Gulzar, R.; Rasheed, A.; Riaz, S.; Adnan, W.A.; Hafeez, U.; Malik, A.M. Musculoskeletal Symptoms in Patients Recovering from COVID-19. Muscles, Ligaments & Tendons Journal (MLTJ) 2022, 12. [CrossRef]
  24. Visco, V.; Vitale, C.; Rispoli, A.; Izzo, C.; Virtuoso, N.; Ferruzzi, G.J.; Santopietro, M.; Melfi, A.; Rusciano, M.R.; Maglio, A. Post-COVID-19 syndrome: involvement and interactions between respiratory, cardiovascular and nervous systems. Journal of clinical medicine 2022, 11, 524. [CrossRef]
  25. Michelen, M.; Manoharan, L.; Elkheir, N.; Cheng, V.; Dagens, A.; Hastie, C.; O'Hara, M.; Suett, J.; Dahmash, D.; Bugaeva, P. Characterising long COVID: a living systematic review. BMJ global health 2021, 6, e005427. [CrossRef]
  26. Bakalets, O.; Dzyha, S.; Behosh, N. Functional diagnostics of the respiratory system in patients with Long COVID. Bull Med Biol Res 2023, 16, 60-66. [CrossRef]
  27. Jutant, E.-M.; Meyrignac, O.; Beurnier, A.; Jaïs, X.; Pham, T.; Morin, L.; Boucly, A.; Bulifon, S.; Figueiredo, S.; Harrois, A. Respiratory symptoms and radiological findings in post-acute COVID-19 syndrome. ERJ open research 2022, 8. [CrossRef]
  28. Alghamdi, F.; Mokbel, K.; Meertens, R.; Obotiba, A.D.; Alharbi, M.; Knapp, K.M.; Strain, W.D. Bone Mineral Density, Bone Biomarkers, and Joints in Acute, Post, and Long COVID-19: A Systematic Review. Viruses 2024, 16, 1694. [CrossRef]
  29. Alghamdi, F.; Meertens, R.; Obotiba, A.D.; Harries, L.W.; Appleby, S.; Mokbel, K.; Knapp, K.M.; Strain, W.D. Long COVID-Related Musculoskeletal Inflammation: A 12-Month Longitudinal Feasibility Cohort. Preprints 2025. [CrossRef]
  30. Lewiecki, E.M.; Binkley, N.; Morgan, S.L.; Shuhart, C.R.; Camargos, B.M.; Carey, J.J.; Gordon, C.M.; Jankowski, L.G.; Lee, J.-K.; Leslie, W.D. Best practices for dual-energy X-ray absorptiometry measurement and reporting: International Society for Clinical Densitometry Guidance. Journal of clinical densitometry 2016, 19, 127-140. [CrossRef]
  31. Knapp, K.; GJ, B.G. Dual energy x-ray absorptiometry: quality assurance and governance. Osteoporosis Review 2014, 22, 1-6.
  32. Control, C.f.D.; Prevention. Dual energy X-ray absorptiometry (DXA) procedures manual. National Health and Nutrition Examination Survey 2007.
  33. Shuhart, C.; Cheung, A.; Gill, R.; Gani, L.; Goel, H.; Szalat, A. Executive Summary of the 2023 Adult Position Development Conference of the International Society for Clinical Densitometry: DXA reporting, follow-up BMD testing and trabecular bone score application and reporting. Journal of Clinical Densitometry 2024, 27, 101435. [CrossRef]
  34. Sheffield, U.o. FRAX® tool. Available online: https://frax.shef.ac.uk/FRAX/tool.aspx?country=9 (accessed on 1/5).
  35. Hippisley-Cox, J., & Coupland, C. QFracture® risk calculator. Available online: https://www.qfracture.org/ (accessed on 1/5).
  36. National Institute for Health and Care Excellence. Osteoporosis - prevention of fragility fractures. Available online: https://cks.nice.org.uk/topics/osteoporosis-prevention-of-fragility-fractures/ (accessed on March, 15).
  37. Blake, G.M.; Fogelman, I. The role of DXA bone density scans in the diagnosis and treatment of osteoporosis. Postgraduate medical journal 2007, 83, 509-517. [CrossRef]
  38. Cosman, F.; de Beur, S.J.; LeBoff, M.; Lewiecki, E.; Tanner, B.; Randall, S.; Lindsay, R. Clinician’s guide to prevention and treatment of osteoporosis. Osteoporosis international 2014, 25, 2359-2381. [CrossRef]
  39. Backhaus, M.; Burmester, G.; Gerber, T.; Grassi, W.; Machold, K.; Swen, W.; Wakefield, R.; Manger, B. Guidelines for musculoskeletal ultrasound in rheumatology. Annals of the rheumatic diseases 2001, 60, 641-649. [CrossRef]
  40. Filippucci, E.; Unlu, Z.; Farina, A.; Grassi, W. Sonographic training in rheumatology: a self teaching approach. Annals of the rheumatic diseases 2003, 62, 565-567. [CrossRef]
  41. Landis, J.R.; Koch, G.G. The measurement of observer agreement for categorical data. biometrics 1977, 159-174. [CrossRef]
  42. Wakefield, R.J.; Balint, P.V.; Szkudlarek, M.; Filippucci, E.; Backhaus, M.; D'Agostino, M.-A.; Sanchez, E.N.; Iagnocco, A.; Schmidt, W.A.; Bruyn, G.A. Musculoskeletal ultrasound including definitions for ultrasonographic pathology. The Journal of rheumatology 2005, 32, 2485-2487.
  43. Bruyn, G.A.; Iagnocco, A.; Naredo, E.; Balint, P.V.; Gutierrez, M.; Hammer, H.B.; Collado, P.; Filippou, G.; Schmidt, W.A.; Jousse-Joulin, S. OMERACT definitions for ultrasonographic pathologies and elementary lesions of rheumatic disorders 15 years on. The Journal of rheumatology 2019, 46, 1388-1393. [CrossRef]
  44. Szkudlarek, M.; Court-Payen, M.; Jacobsen, S.; Klarlund, M.; Thomsen, H.S.; Østergaard, M. Interobserver agreement in ultrasonography of the finger and toe joints in rheumatoid arthritis. Arthritis & Rheumatism: Official Journal of the American College of Rheumatology 2003, 48, 955-962. [CrossRef]
  45. D’Agostino, M.A.; Conaghan, P.; Le Bars, M.; Baron, G.; Grassi, W.; Martin-Mola, E.; Wakefield, R.; Brasseur, J.-L.; So, A.; Backhaus, M. EULAR report on the use of ultrasonography in painful knee osteoarthritis. Part 1: prevalence of inflammation in osteoarthritis. Annals of the rheumatic diseases 2005, 64, 1703-1709. [CrossRef]
  46. Martinoli, C. Musculoskeletal ultrasound: technical guidelines. Insights into imaging 2010, 1, 99. [CrossRef]
  47. Kanis, J.A.; Burlet, N.; Cooper, C.; Delmas, P.D.; Reginster, J.Y.; Borgstrom, F.; Rizzoli, R. European guidance for the diagnosis and management of osteoporosis in postmenopausal women. Osteoporos Int 2008, 19, 399-428. [CrossRef]
  48. Sebro, R.; Ashok, S.S. A Statistical Approach Regarding the Diagnosis of Osteoporosis and Osteopenia From DXA: Are We Underdiagnosing Osteoporosis? JBMR Plus 2021, 5, e10444. [CrossRef]
  49. Xu, Y.; Xu, J.-W.; Wu, Y.; Rong, L.-J.; Ye, L.; Franco, O.H.; Chien, C.-W.; Feng, X.-R.; Chen, J.-Y.; Tung, T.-H. Prevalence and prognosis of sarcopenia in acute COVID-19 and long COVID: a systematic review and meta-analysis. Annals of medicine 2025, 57, 2519678. [CrossRef]
  50. Appelman, B.; Charlton, B.T.; Goulding, R.P.; Kerkhoff, T.J.; Breedveld, E.A.; Noort, W.; Offringa, C.; Bloemers, F.W.; van Weeghel, M.; Schomakers, B.V. Muscle abnormalities worsen after post-exertional malaise in long COVID. Nature communications 2024, 15, 17. [CrossRef]
  51. Colosio, M.; Brocca, L.; Gatti, M.F.; Neri, M.; Crea, E.; Cadile, F.; Canepari, M.; Pellegrino, M.A.; Polla, B.; Porcelli, S. Structural and functional impairments of skeletal muscle in patients with postacute sequelae of SARS-CoV-2 infection. Journal of Applied Physiology 2023. [CrossRef]
  52. López-Sampalo, A.; Cobos-Palacios, L.; Vilches-Pérez, A.; Sanz-Cánovas, J.; Vargas-Candela, A.; Mancebo-Sevilla, J.J.; Hernández-Negrín, H.; Gómez-Huelgas, R.; Bernal-López, M.R. COVID-19 in Older Patients: Assessment of Post-COVID-19 Sarcopenia. Biomedicines 2023, 11, 733. [CrossRef]
  53. Ramírez-Vélez, R.; Legarra-Gorgoñon, G.; Oscoz-Ochandorena, S.; García-Alonso, Y.; García-Alonso, N.; Oteiza, J.; Ernaga Lorea, A.; Correa-Rodríguez, M.; Izquierdo, M. Reduced muscle strength in patients with long-COVID-19 syndrome is mediated by limb muscle mass. Journal of Applied Physiology 2023, 134, 50-58. [CrossRef]
  54. Londhe, P.; Guttridge, D.C. Inflammation induced loss of skeletal muscle. Bone 2015, 80, 131-142. [CrossRef]
  55. Disser, N.P.; De Micheli, A.J.; Schonk, M.M.; Konnaris, M.A.; Piacentini, A.N.; Edon, D.L.; Toresdahl, B.G.; Rodeo, S.A.; Casey, E.K.; Mendias, C.L. Musculoskeletal consequences of COVID-19. The Journal of bone and joint surgery. American volume 2020, 102, 1197.
  56. Donini, L.M.; Busetto, L.; Bischoff, S.C.; Cederholm, T.; Ballesteros-Pomar, M.D.; Batsis, J.A.; Bauer, J.M.; Boirie, Y.; Cruz-Jentoft, A.J.; Dicker, D. Definition and diagnostic criteria for sarcopenic obesity: ESPEN and EASO consensus statement. Obesity facts 2022, 15, 321-335. [CrossRef]
  57. Hejbøl, E.K.; Harbo, T.; Agergaard, J.; Madsen, L.B.; Pedersen, T.H.; Østergaard, L.J.; Andersen, H.; Schrøder, H.D.; Tankisi, H. Myopathy as a cause of fatigue in long-term post-COVID-19 symptoms: Evidence of skeletal muscle histopathology. European Journal of Neurology 2022, 29, 2832-2841. [CrossRef]
  58. Agergaard, J.; Leth, S.; Pedersen, T.; Harbo, T.; Blicher, J.; Karlsson, P.; Østergaard, L.; Andersen, H.; Tankisi, H. Myopathic changes in patients with long-term fatigue after COVID-19. Clin. Neurophysiol. 2021, 132, 1974-1981. [CrossRef]
  59. Nurkovic, J. COVID-19 impact on bone mineral density. In Proceedings of the OSTEOPOROSIS INTERNATIONAL, 2021; pp. S209-S209.
  60. Haudenschild, A.K.; Christiansen, B.A.; Orr, S.; Ball, E.E.; Weiss, C.M.; Liu, H.; Fyhrie, D.P.; Yik, J.H.; Coffey, L.L.; Haudenschild, D.R. Acute bone loss following SARS-CoV-2 infection in mice. Journal of Orthopaedic Research® 2023, 41, 1945-1952.
  61. Qiao, W.; Lau, H.E.; Xie, H.; Poon, V.K.-M.; Chan, C.C.-S.; Chu, H.; Yuan, S.; Yuen, T.T.-T.; Chik, K.K.-H.; Tsang, J.O.-L. SARS-CoV-2 infection induces inflammatory bone loss in golden Syrian hamsters. Nature communications 2022, 13, 2539. [CrossRef]
  62. Awosanya, O.D.; Dalloul, C.E.; Blosser, R.J.; Dadwal, U.C.; Carozza, M.; Boschen, K.; Klemsz, M.J.; Johnston, N.A.; Bruzzaniti, A.; Robinson, C.M. Osteoclast-mediated bone loss observed in a COVID-19 mouse model. Bone 2022, 154, 116227. [CrossRef]
  63. Queiroz-Junior, C.M.; Santos, A.C.; Gonçalves, M.R.; Brito, C.B.; Barrioni, B.; Almeida, P.J.; Gonçalves-Pereira, M.H.; Silva, T.; Oliveira, S.R.; Pereira, M.M. Acute coronavirus infection triggers a TNF-dependent osteoporotic phenotype in mice. Life Sci. 2023, 324, 121750. [CrossRef]
  64. Elmedany, S.H.; Badr, O.I.; Abu-Zaid, M.H.; Tabra, S.A.A. Bone mineral density changes in osteoporotic and osteopenic patients after COVID-19 infection. Egyptian Rheumatology and Rehabilitation 2022, 49, 1-8. [CrossRef]
  65. Kondo, Y.; Suzuki, K.; Inoue, Y.; Sakata, K.; Takahashi, C.; Takeshita, M.; Kassai, Y.; Miyazaki, T.; Morita, R.; Niki, Y.; et al. Significant association between joint ultrasonographic parameters and synovial inflammatory factors in rheumatoid arthritis. Arthritis Research & Therapy 2019, 21, 14. [CrossRef]
  66. Gasparotto, M.; Framba, V.; Piovella, C.; Doria, A.; Iaccarino, L. Post-COVID-19 arthritis: a case report and literature review. Clinical rheumatology 2021, 40, 3357-3362. [CrossRef]
  67. Mukarram, M.S.; Ishaq Ghauri, M.; Sethar, S.; Afsar, N.; Riaz, A.; Ishaq, K. COVID-19: an emerging culprit of inflammatory arthritis. Case reports in rheumatology 2021, 2021. [CrossRef]
  68. Selmi, C.; Gershwin, M.E. Diagnosis and classification of reactive arthritis. Autoimmunity reviews 2014, 13, 546-549. [CrossRef]
  69. Siva, C.; Velazquez, C.; Mody, A.; Brasington, R. Diagnosing acute monoarthritis in adults: a practical approach for the family physician. American family physician 2003, 68, 83-90.
  70. Parisi, S.; Borrelli, R.; Bianchi, S.; Fusaro, E. Viral arthritis and COVID-19. The Lancet Rheumatology 2020, 2, e655-e657. [CrossRef]
  71. Vassilopoulos, D.; Calabrese, L.H. Virally associated arthritis 2008: clinical, epidemiologic, and pathophysiologic considerations. Arthritis research & therapy 2008, 10, 215. [CrossRef]
  72. Baimukhamedov, C.; Barskova, T.; Matucci-Cerinic, M. Arthritis after SARS-CoV-2 infection. The Lancet Rheumatology 2021, 3, e324-e325.
  73. Griffith, J.F. Musculoskeletal complications of severe acute respiratory syndrome. In Proceedings of the Seminars in musculoskeletal radiology, 2011; pp. 554-560. [CrossRef]
  74. Grassi, M.; Giorgi, V.; Nebuloni, M.; Zerbi, P.; Gismondo, M.R.; Salaffi, F.; Sarzi-Puttini, P.; Rimoldi, S.G.; Manzotti, A. SARS-CoV-2 in the knee joint: A cadaver study. Clin. Exp. Rheumatol 2022, 40, 34665699. [CrossRef]
  75. Kuschner, Z.; Ortega, A.; Mukherji, P. A case of SARS-CoV-2-associated arthritis with detection of viral RNA in synovial fluid. Journal of the American College of Emergency Physicians Open 2021, 2, e12452. [CrossRef]
  76. Grassi, M.; Giorgi, V.; Nebuloni, M.; Zerbi, P.; Gismondo, M.R.; Salaffi, F.; Sarzi-Puttini, P.; Rimoldi, S.G.; Manzotti, A. SARS-CoV-2 in the knee joint: A cadaver study. Clin. Exp. Rheumatol 2021. [CrossRef]
  77. Liew, I.Y.; Mak, T.M.; Cui, L.; Vasoo, S.; Lim, X.R. A Case of Reactive Arthritis Secondary to Coronavirus Disease 2019 Infection. JCR: Journal of Clinical Rheumatology 2020, 26, 233. [CrossRef]
  78. Yokogawa, N.; Minematsu, N.; Katano, H.; Suzuki, T. Case of acute arthritis following SARS-CoV-2 infection. Annals of the Rheumatic Diseases 2021, 80, e101. [CrossRef]
  79. Ono, K.; Kishimoto, M.; Shimasaki, T.; Uchida, H.; Kurai, D.; Deshpande, G.A.; Komagata, Y.; Kaname, S. Reactive arthritis after COVID-19 infection. RMD Open 2020, 6, e001350. [CrossRef]
  80. Grozier, C.D.; Genoese, F.; Collins, K.; Parmar, A.; Tolzman, J.; Kuenze, C.; Harkey, M.S. Knee Effusion-Synovitis Is Not Associated With Self-Reported Knee Pain in Division I Female Athletes. Sports Health 2025, 19417381251323902. [CrossRef]
  81. Zheng, C.; Huang, W.Y.-J.; Sun, F.-H.; Wong, M.C.-S.; Siu, P.M.-F.; Chen, X.-K.; Wong, S.H.-S. Association of sedentary lifestyle with risk of acute and post-acute COVID-19 sequelae: a retrospective cohort study. The American Journal of Medicine 2023. [CrossRef]
  82. de Zwart, A.H.; Dekker, J.; Lems, W.F.; Roorda, L.D.; Van Der Esch, M.; Van Der Leeden, M. Factors associated with upper leg muscle strength in knee osteoarthritis: a scoping review. Journal of rehabilitation medicine 2018, 50, 140-150. [CrossRef]
  83. Hao, K.; Wang, J.; Niu, Y.; Wang, F. Obesity and hyperlipidemia were associated with more severe synovitis and structural abnormalities as well as inferior functional outcomes in knee osteoarthritis: a retrospective comparative study. Journal of Orthopaedic Surgery and Research 2024, 19, 845. [CrossRef]
  84. Andrade, C. Multiple Testing and Protection Against a Type 1 (False Positive) Error Using the Bonferroni and Hochberg Corrections. Indian J Psychol Med 2019, 41, 99-100. [CrossRef]
  85. Baim, S.; Wilson, C.R.; Lewiecki, E.M.; Luckey, M.M.; Downs Jr, R.W.; Lentle, B.C. Precision assessment and radiation safety for dual-energy X-ray absorptiometry: position paper of the International Society for Clinical Densitometry. Journal of Clinical Densitometry 2005, 8, 371-378.
  86. Washington, K.F.H.P.o. Osteoporosis Screening, Diagnosis, and Treatment Guideline. Available online: https://wa.kaiserpermanente.org/static/pdf/public/guidelines/osteoporosis.pdf (accessed on 17/08).
Figure 1. Proportion of participants within each bone mineral density category (normal, osteopenia, and osteoporosis) based on T-scores in the LC (Long COVID) and WR (Well-Recovered) groups.
Preprints 184213 g001
Table 1. T-score: compares a participant's bone density to the normal range observed in young healthy adults; WR: Well-recovered; LC: long COVID; (n): participants number at baseline; p-values using independent t-tests with ± SD for fracture risk Mann–Whitney was used for as not normally distribution with (IQR); Data are presented as mean ± standard deviation (SD); * Statistically significant at p<0.01.
DXA T-score Baseline Results Between the Study Group WR and LC Participants.
T-score n=(WR/LC) WR LC p
Total Body (39/45) 0.534±1.379 1.037±1.161 0.073
L1-L4 (32/33) 0.244 ± 1.789 0.138 ± 1.184 0.780
Total Hip RT (36/37) -0.247 ± 1.099 0.015 ± 1.036 0.263
LT (39/44) -0.273 ± 1.174 -0.033 ± 1.043 0.326
Fracture Risk (%)
Major osteoporotic (27/40) 5.7 (3.3;11.8) 4.85 (2.85;8.4) 0.165
Hip 0.5 (0.2;2.5) 0.45 (0.1;0.9) 0.221
Table 2. BMD: bone mineral density (g/cm2); L1-L4: lumbar spine; Rt: Right; Lt: Left; WR: Well-recovered; LC: long COVID; (n): participants number completed DXA scan at each timepoints; p-values based using appropriate tests (Mann–Whitney U or independent t-tests) based on data normality; Data are presented as median with interquartile range (IQR) or mean ± standard deviation (SD) as appropriate; for Ultrasound: Mann-Whitney U for hand, and Chi² for the knee; values are presented as medians (IQR) or n (%) respectively; (₽): t-tests; (‡): Mann–Whitney U; (X): X2 test; * Statistically significant at p<0.01.
Musculoskeletal Imaging Results Comparing WR and LC Participants.
Region Baseline Follow-up
Side (n) WR LC p (n) WR LC p
BMD Total body(₽) - (39/45) 1.219±0.127 1.223±0.099 0.876 (30/36) 1.215±0.143 1.219±0.104 0.909
L1-L4(₽) - (32/33) 1.232±0.221 1.204±0.142 0.547 (23/28) 1.233±0.258 1.195±0.151 0.519
Femoral neck(₽) Rt (39/45) 0.967±0.144 0.974±0.134 0.819 (30/36) 0.961±0.144 0.98±0.143 0.605
Lt (39/45) 0.969±0.154 0.976±0.152 0.843 (30/36) 0.965±0.157 0.997±0.223 0.519
Total hip(₽) Rt (39/45) 1.026±0.160 1.024±0.138 0.959 (30/36) 1.023±0.176 1.029±0.152 0.885
Lt (39/44) 1.023±0.173 1.017±0.135 0.876 (30/34) 1.021±0.188 1.018±0.149 0.938
TBC Gynoid Region Fat (%)(‡) (39/45) 0.396 (0.322;0.46) 0.492 (0.405;0.551) 0.0008* (30/36) 0.382 (0.321;0.471) 0.482 (0.410;0.541) 0.0015*
Gynoid Tissue Fat (%)(‡) 0.403 (0.331;0.470) 0.503 (0.412;0.562) 0.0008* 0.382 (0.321;0.471) 0.482 (0.410;0.541) 0.0015*
Gynoid Fat Mass (g)(‡) 4619 (3502;6739) 6202 (4356;7733) 0.0099* 4564 (3583;6308) 6238 (4599;7518) 0.0089*
Gynoid Lean Mass (g)(‡) 6714 (5812;8161) 6111 (5631;7430) 0.088 6601 (5705;8929) 6147 (5509;7727) 0.221
Android Region Fat (%)(‡) 0.431 (0.358;0.503) 0.490 (0.428;0.561) 0.0063* 0.418±0.094 0.483±0.092 0.0065*
Android Tissue Fat (%)(‡) 0.435 (0.362;0.507) 0.495 (0.432;0.564) 0.0068* 0.422±0.094 0.472±0.077 0.0065*
Android Region Fat Mass (g)(‡) 2569 (1971;3619) 3054 (2284;4544) 0.067 2425 (1861;3219) 3198 (2008;4857) 0.064
Legs Tissue Fat (%)(‡) 0.361 (0.281;0.43) 0.438 (0.349;0.524) 0.0013* 0.360±0.106 0.437±0.095 0.0029*
Legs Lean Mass (g)(‡) 15504 (13112;18933) 13545 (12009;16863) 0.026 14680 (13170;19137) 13394 (12181;16794) 0.132
Total Lean Mass (g)(‡) 47058 (39960;55681) 40649 (38494;50502) 0.054 45326 (39627;55925) 40774 (37743;53367) 0.236
Intra-Articular Hand Synovial Hypertrophy(‡) (40/45) 2 (1;4) 3 (1;5) 0.502 (30/36) 1.5 (0;3) 1 (0;3) 0.742
Hand Synovial Effusion(‡) 0 (0;1) 0 (0;1) 0.684 0 (0;1) 0 (0;0) 0.212
Hand Power Doppler(‡) 1 (0;3) 1 (0;4) 0.274 1 (0;2) 0.5 (0;2) 0.695
Knee Synovial Hypertrophy(X) 13 (32.5) 5 (11.1) 0.016 7 (23.3) 4 (11.1) 0.185
Knee Synovial Effusion(X) 18 (45) 6 (13.3) 0.001* 14 (46.7) 13 (36.1) 0.385
Knee Power Doppler(X) (32/42) 0 (0) 0 (0) 1.000 (30/33) 2 (6.67) 2 (6.06) 0.922
Table 3. BMD: bone mineral density (g/cm2); L1-L4: lumbar spine; Rt: Right; Lt: Left; WR: Well-recovered; LC: long COVID; (n): participants number completed assessments at both timepoints; p-values based on normality for continuous variables as appropriate [paired t-test; BMD values reported as mean ± standard deviation(SD), or Wilcoxon signed-rank; values reported median with interquartile range (IQR); Suprapatella recess Knee Joint Statistical tests used McNemar test, with data presented as numbers with (% change) of discordant pairs relative to participants change positive finding to negative finding and negative finding to positive finding; * Statistically significant at p<0.01.
Within the LC and WR Group, Changes in Musculoskeletal Imaging Results.
Region Side (n) WR (n) LC
Baseline Follow-up p Baseline Follow-up p
BMD Total body - 30 1.216±0.142 1.215±0.143 0.837 36 1.224±0.106 1.219±0.104 0.068
L1-L4 - 23 1.235±0.251 1.233±0.258 0.812 24 1.197±0.144 1.183±0.148 0.173
Femoral neck Rt 30 0.958±0.148 0.961±0.144 0.513 36 0.984±0.144 0.98±.143 0.463
Lt 0.97±0.16 0.965±0.157 0.310 0.976±0.164 0.997±0.223 0.158
Total hip Rt 1.016±0.171 1.023±0.175 0.026 1.028±0.146 1.029±0.152 0.779
Lt 1.018±0.185 1.021±0.188 0.307 34 1.016±0.146 1.018±0.149 0.494
TBC Gynoid Region Fat (%) 0.394 (0.355;0.454) 0.382 (0.321;0.471) 0.926 36 0.478 (0.392;0.548) 0.482 (0.410;0.541) 0.055
Gynoid Tissue Fat (%) 0.401 (0.363;0.464) 0.382 (0.321;0.471) 0.066 0.49 (0.402;0.557) 0.482 (0.410;0.541) 0.271
Gynoid Fat Mass (g) 4576 (3682;6192) 4564 (3583;6308) 0.517 6176 (4231;7642) 6238 (4599;7518) 0.029
Gynoid Lean Mass (g) 6751 (5664;8986) 6601 (5705;8929) 0.416 6235 (5589;7702) 6147 (5509;7727) 0.851
Android Region Fat (%) 0.431 (0.371;0.501) 0.415 (0.350;0.472) 0.228 0.488 (0.425;0.562) 0.489 (0.423;0.568) 0.087
Android Region Fat Mass (g) 2483 (1971;3334) 2425 (1861;3219) 0.428 3187 (2164;4618) 3198 (2008;4857) 0.307
Android Tissue Fat (%) 0.435 (0.376;0.506) 0.420 (0.356;0.478) 0.229 0.493 (0.429;0.566) 0.494 (0.429;0.571) 0.102
Legs Tissue Fat (%) 0.359 (0.293;0.43) 0.334 (0.277;0.433) 0.585 0.434 (0.347;0.522) 0.446 (0.361;0.511) 0.016
Legs Lean Mass (g) 14615 (12927;19471) 14680 (13170;19137) 0.236 13673 (11646;17561) 13394 (12181;16794) 0.489
Total Lean Mass (g) 45176 (39722;58679) 45326 (39627;55925) 0.089 41080 (37904;54043) 40774 (37743;53367) 0.441
Intra-Articular Hand Synovial Hypertrophy 2 (1;4) 1.5 (0;3) 0.123 2 (1;5) 1 (0;3) 0.012
Hand Synovial Effusion 0 (0;1) 0 (0;1) 0.702 0 (0;0) 0 (0;0) 0.139
Hand Power Doppler 1.5 (0;4) 1 (0;3) 0.481 1 (0;2) 0.5 (0;2) 0.228
Knee Synovial Hypertrophy 4 (66.7) 2 (33.3) 0.687 1 (33.3) 2 (66.7) 1.000
Knee Synovial Effusion 4 (50) 4 (50) 1.000 2 (15.4) 11 (84.6) 0.023
Knee Power Doppler 26 0 (0) 2 (100) 0.500 31 0 (0) 2 (100) 0.500
Disclaimer/Publisher’s Note: The statements, opinions and data contained in all publications are solely those of the individual author(s) and contributor(s) and not of MDPI and/or the editor(s). MDPI and/or the editor(s) disclaim responsibility for any injury to people or property resulting from any ideas, methods, instructions or products referred to in the content.
Copyright: This open access article is published under a Creative Commons CC BY 4.0 license, which permit the free download, distribution, and reuse, provided that the author and preprint are cited in any reuse.
Prerpints.org logo

Preprints.org is a free preprint server supported by MDPI in Basel, Switzerland.

Subscribe

Disclaimer

Terms of Use

Privacy Policy

Privacy Settings

© 2025 MDPI (Basel, Switzerland) unless otherwise stated