Submitted:
14 November 2025
Posted:
18 November 2025
You are already at the latest version
Abstract
To address the challenges of fragmented user behavior and delayed strategy response in digital sales of fast-moving consumer goods (FMCG), this study proposes a consumer behavior modeling and sales path optimization model that integrates a generative adversarial mechanism. Based on unified encoding of multi-source data, the model incorporates a multi-head attention mechanism and feature interaction strategy to extract user preference features, and employs a Generative Adversarial Network (GAN) to dynamically generate sales strategies. Experiments conducted on 18 months of behavioral data from an e-commerce platform in East China demonstrate that the model achieves AUC, NDCG@10, and HitRate@10 scores of 0.8642, 0.6798, and 0.451 respectively, showing significant improvements over GRU and Transformer-based structures. The results indicate superior strategy coverage and ranking accuracy.
Keywords:
FMCG sales
; consumer behavior modeling
; generative adversarial networks
; digital conversion strategy
; personalized recommendation
1. Introduction
The FMCG industry faces challenges in the digital transformation context, including fragmented consumer demand, complex sales pathways, and delayed behavioral responses. Traditional sales strategies based on static profiles struggle to support precise conversion and efficient outreach. Addressing the optimization challenge of "transitioning from consumer insights to action," this study constructs a digital sales experience reconstruction mechanism centered on behavioral modeling, strategy generation, and multi-source data fusion. By employing sequence modeling and generative adversarial networks, it achieves personalized sales path prediction and strategy optimization, focusing on resolving core issues like untimely strategy responses and low recommendation relevance. The aim is to enhance the consistency and agility of sales efficiency and user experience.
2. Challenges in FMCG Digital Sales
In FMCG digital sales scenarios, data silos and disjointed data chains are particularly pronounced. Cross-platform consumer behavior trajectories are difficult to model uniformly, directly impacting the accuracy and timeliness of user profiling. The lack of unified coding interfaces for conversion data between mobile and offline channels results in data delays of up to 2.3 seconds between CRM and CDP systems, reducing user identification accuracy by approximately 18%1 . Furthermore, delays exceeding 1.5 seconds in data feedback between promotional strategies and personalized recommendations often cause missed golden conversion windows, creating a structural barrier of "high-frequency interference—low-frequency conversion." Regarding multi-platform collaboration and heterogeneous data integration, existing systems lack unified feature extraction standards, hindering iterative optimization of subsequent sales models. To address these issues, a more consistent data modeling and consumer behavior recognition mechanism must be established to provide high-quality inputs for strategy generation.
3. Digital-Based FMCG Sales Experience Reconstruction Model
3.1. Data Preprocessing and Feature Extraction
To achieve intelligent reconstruction of FMCG sales experiences, multi-source consumer behavior data must first undergo unified preprocessing and structured encoding2 . During data cleansing, events such as browsing, clicking, and adding to cart are normalized using timestamps to eliminate redundant behavior sequences and abnormal jump records. In the feature extraction phase, a sliding-window-based user behavior aggregation strategy is introduced to construct a multi-scale sequence feature matrix. To enhance the temporal correlation of behavioral representations, a feature weighting function is defined:
where represents the weight of feature at time , denotes the center point of the behavior sequence, and is the temporal decay coefficient controlling the amplification effect of recent behaviors. Embedding encoding is concurrently applied to perform low-dimensional mapping on discrete features such as user ID, product category, and terminal device, uniformly outputting a dimension of 32. The processed feature vector matrix serves as the foundational input for subsequent GAN strategy optimization modules and personalized sales path models, ensuring data consistency and structural adaptability in sales experience reconstruction algorithms.
3.2. Consumer Behavior Digital Model Construction
Following data preprocessing and vectorization encoding, the consumer behavior digital model abstracts multidimensional interactions through sequence modeling and fusion mechanisms. First, the user behavior state matrix is constructed, where denotes the time window length, and represents the single-step behavioral feature dimension 3 . A multi-head attention mechanism models the temporal patterns of user clicks, favorites, and adds-to-cart actions, generating context-dependent representations calculated as follows:
where and denote the key vector dimensions. To enhance user decision path modeling, a behavior scoring function incorporating preference factors is introduced:
Where represents user 's preference score for product , denotes the th behavioral feature function, and is its weight. A feature interaction module is further introduced to perform multi-order feature combinations on behavioral labels, page dwell time, purchase history, etc., constructing the final embedded representation for prediction and strategy generation. As shown in Figure 1, the model structure comprises an input layer, feature fusion layer, attention representation layer, and decision output layer, forming a closed-loop path learning mechanism. The distribution of relevant features and model dimension configuration are detailed in Table 1. Upon completion, this model will serve as the foundational input structure for subsequent strategy optimization modules and support the dynamic feedback mechanism of generative algorithms.
3.3. Sales Strategy Optimization Based on Generative Adversarial Networks
To dynamically generate sales strategies tailored to diverse consumer behavior paths, a strategy optimization model based on Generative Adversarial Networks (GANs) is constructed. The generator ( ) generates candidate strategy sequences, while the discriminator ( ) evaluates their consistency with the distribution of actual sales paths. During the strategy generation phase, the input noise vector ( ) is transformed into latent behavioral trajectories ( ) via embedding mapping. The generator weights are optimized through the following objective function:
Among these, represents the generator loss function, while denotes the discriminator's probability prediction for samples generated as "real paths." The discriminator employs a multi-layer fully connected structure with residual modules, whose loss function is defined as follows:
where represents the true user path data, and denotes the true policy distribution. During training, the generated policy dynamically adjusts its weighted modeling for conversion rate, page click weight, and temporal continuity. The configuration of its policy control factors is shown in Table 2. After multiple training rounds, the generator progressively learns nested patterns of high-frequency purchasing behavior Error! Reference source not found. , as illustrated in Figure 2. Early training stages exhibit scattered distributions across broad areas with limited strategy coverage, while later stages concentrate generated trajectories within high-conversion intervals. The optimized GAN module will serve as the foundational training basis for subsequent parameter tuning phases.
3.4. Model Training and Parameter Tuning
After constructing the generative adversarial model, we combine the alternating training mechanism of the discriminator and generator with an adaptive gradient adjustment strategy to ensure stable convergence within the non-convex space. Initial training employs the Adam optimizer for joint training of both modules, with learning rate , batch size 64, discriminator update frequency , and parameter normalization triggered after each generator iteration4 . To ensure model convergence under non-convex optimization, we incorporate a smoothing loss function with a gradient regularization term:
where represents the model's predicted path strategy score, denotes the actual behavior data feedback score, is the network parameter, and is the regularization coefficient controlling the smoothness of gradient changes. The training progresses through a warm-up phase and a convergence phase, as shown in Figure 3. During the initial 30 epochs, generator loss fluctuates while the discriminator accuracy steadily improves. After epoch 40, convergence stabilizes, and the training error approaches saturation, reflecting the benefit of regularization in maintaining training robustness.
4. Experiments and Results Analysis
4.1. Experimental Dataset and Evaluation Metrics
The experiment utilizes 18 months of transaction and behavioral data from an e-commerce platform in a province in East China. The dataset comprises 489,732 records covering user IDs, behavioral sequences, product attributes, and order histories, with 27 data dimensions updated daily. Evaluation metrics include AUC, Precision@10, Recall, and NDCG@10, assessing both recommendation accuracy and ranking capabilities. (1) Behavioral sequence data (2) Product metadata (3) User basic information (4) Historical conversion paths. This dataset serves as input for the parameter tuning phase, supporting subsequent experimental setup and comparative validation5 .
4.2. Model Hyperparameter Optimization
To optimize the convergence performance and ranking capability of the policy generation model under large-scale behavioral data, grid search was employed to adjust key parameters such as learning rate, embedding dimension, and batch size while keeping the network architecture constant. All combinations were evaluated on the validation set using AUC, NDCG@10, and HitRate@10 to measure the balance between preference learning and target click sequence fitting capabilities. Parameter configurations and corresponding metric results are shown in Table 3.
As shown in Table 3, increasing the embedding dimension from 64 to 128 yields a significant improvement in ranking accuracy (with NDCG@10 rising from 0.6614 to 0.6798); however, further expansion to 256 leads to diminishing returns. A learning rate of 0.0002 achieves better convergence stability, with AUC fluctuations remaining below 0.015. While enlarging the batch size improves HitRate, it provides limited gains in overall ranking performance. The tuning configuration above will serve as the baseline input parameters for the comparative experiments in the following section6 .
4.3. Comparative Results of Sales Strategy Experiments
After hyperparameter optimization, to validate the sales path modeling capabilities of strategy generation models under different architectures, three mainstream models were selected: the standard GRU sequence model, the Transformer-based behavioral modeling model, and the aforementioned GAN-based strategy generation framework. Their performance across dimensions including click-through rate prediction, conversion rate estimation, and ranking accuracy was tested under unified training and validation set divisions7 . The evaluation results for each metric are shown in Table 4, with heatmaps (Figure 4) visually illustrating the multidimensional performance differences in strategy response quality.
As shown in Table 4, the Transformer model with attention mechanism outperforms the GRU model by +0.0129 on the ranking metric (NDCG@10). Meanwhile, the GAN model demonstrates improved performance across all five metrics. Specifically, the average strategy path length increased from 4.92 to 5.34, which was statistically significant under a two-tailed paired t-test (t = 4.51, p < 0.001). This result reflects the model's capacity to more effectively capture diverse behavioral preferences through extended recommendation sequences.
4.4. Model Robustness Analysis
To systematically evaluate model robustness under real-world scenarios involving abnormal inputs, user cold starts, and behavior loss, three typical perturbation scenarios were defined10. The magnitude of changes in key metrics before and after perturbations was compared ( ), with the GAN policy model as the evaluation subject. Under a unified test set structure, three performance metrics—AUC, NDCG@10, and HitRate@10—were recorded along with their deviations from the baseline state12. The experimental results are shown in Table 5, with data variations covering common proportions of behavior missing (30%), cold-start users (20%), and access delay interference (5-second window) in real-world scenarios.
Table 5 shows that behavioral missing data has the most significant impact on NDCG@10, with a deviation of -0.0356, indicating high ranking sensitivity. Meanwhile, AUC exhibits smaller fluctuations under cold-start and delay conditions, with the maximum decline not exceeding 0.0261, suggesting the backbone structure possesses a certain buffering capacity against sample imbalance. HitRate remains generally stable, with average deviations from single-point perturbations not exceeding 0.02, indicating high output consistency in strategy recommendations despite user behavior fluctuations. Subsequent work will further explore the model's deployment adaptability in dynamic scenarios by integrating these perturbation behaviors8 .
5. Conclusions
For FMCG digital sales scenarios, we constructed a multi-level modeling framework spanning behavioral data preprocessing to strategy generation, integrating generative adversarial mechanisms to achieve personalized sales path optimization. The proposed model demonstrates superior ranking capabilities and path coverage efficiency across multi-dimensional metrics, exhibiting robust performance and strong generalization. The innovation lies in introducing behavioral cross-modeling and GAN-based feedback generation, effectively mitigating data chain disconnects and recommendation failures. However, the model still faces challenges such as insufficient understanding of cold-start users and limitations in cross-platform data integration. Future work could incorporate large language models for deep semantic decoding of behaviors and explore real-time update mechanisms to enhance strategy responsiveness and effectiveness.
References
- Arvind K N, Mutegi F K. Product Innovation Strategy and Its Influence on Growth of Fast-Moving Consumer Goods Manufacturing Firms in Nairobi County, Kenya[J]. Equivalent: Journal of Economic, Accounting and Management, 2025, 3, 447–459. [Google Scholar] [CrossRef]
- Bansah P F, Gaffar V, Disman H, et al. Online environmental influencers and pro-environmental purchase intentions: examining the interplay of green brand attitude and green brand associations in green fast-moving consumer goods[J]. International Journal of Business Forecasting and Marketing Intelligence, 2025, 10, 486–506. [Google Scholar] [CrossRef]
- Wu Z, Ono K, Wu Y. Dynamic Expectation–Satisfaction Relationship in Sustainable Experiences with Product: A Comparative Study of Durable Goods, FMCG, and Digital Products[J]. Sustainability, 2025, 17, 7045. [Google Scholar] [CrossRef]
- Effendy A S, Lestari M T. Analysis of organizational culture and climate for fast moving consumer goods in company X Bandung branch[J]. Bricolage: Jurnal Magister Ilmu Komunikasi, 2025, 11, 371–386. [Google Scholar] [CrossRef]
- Yadav A, Singh S K, Dash M K. Digital Marketing and Consumer Behavior: Analyzing Purchase Intentions of Generation X and Y in the FMCG Sector[J]. Journal of Advanced Management Studies, 2025, 2, 29–41. [Google Scholar]
- Adani N I, Okoli I E N, Nuel-Okoli C M. Market Segmentation and Product Sustainability of Fast Moving Consumer Goods (FMCG): A Study of Nestle Product in South-East Nigeria[J]. Innovation Business Management and Accounting Journal, 2025, 4, 34–52. [Google Scholar] [CrossRef]
- Attih O, B. Branding and consumer purchase decision of fast-moving consumer goods (FMCG) in Akwa Ibom State, Nigeria[J]. International Journal of Research and Innovation in Social Science, 2025, 9, 968–974. [Google Scholar] [CrossRef]
- Zia A, Alotaibi A. Navigating the Customer Experience Landscape: Unraveling the Dynamics of AI-driven Chatbot Services for FMCG Retailers[J]. Journal of Comprehensive Business Administration Research, 2024, 1, 113–123. [Google Scholar] [CrossRef]
- Kumaresan R C, Chandramohan S. Analyzing the impact of brand resonance on consumer purchase intentions for fast moving consumer goods: an empirical study[J]. Salud, Ciencia y Tecnología-Serie de Conferencias, 2024, 912. [Google Scholar]
- Yang J, Wu Y, Yuan Y, et al. Llm-ae-mp: Web attack detection using a large language model with autoencoder and multilayer perceptron[J]. Expert Systems with Applications, 2025, 274, 126982. [Google Scholar] [CrossRef]
- Yuan Y, Xue H. Cross-Media Data Fusion and Intelligent Analytics Framework for Comprehensive Information Extraction and Value Mining[J]. 2025.
- Goodfellow I J, Pouget-Abadie J, Mirza M, et al. Generative adversarial nets[J]. Advances in neural information processing systems 2014, 27. [Google Scholar]
- Wang J, Yu L, Zhang W, et al. Irgan: A minimax game for unifying generative and discriminative information retrieval models[C]//Proceedings of the 40th International ACM SIGIR conference on Research and Development in Information Retrieval. 2017, 515-524.
- Yu L, Zhang W, Wang J, et al. Seqgan: Sequence generative adversarial nets with policy gradient[C]//Proceedings of the AAAI conference on artificial intelligence. 2017, 31(1).
Figure 1.
Consumer Behavior Digital Modeling Architecture.
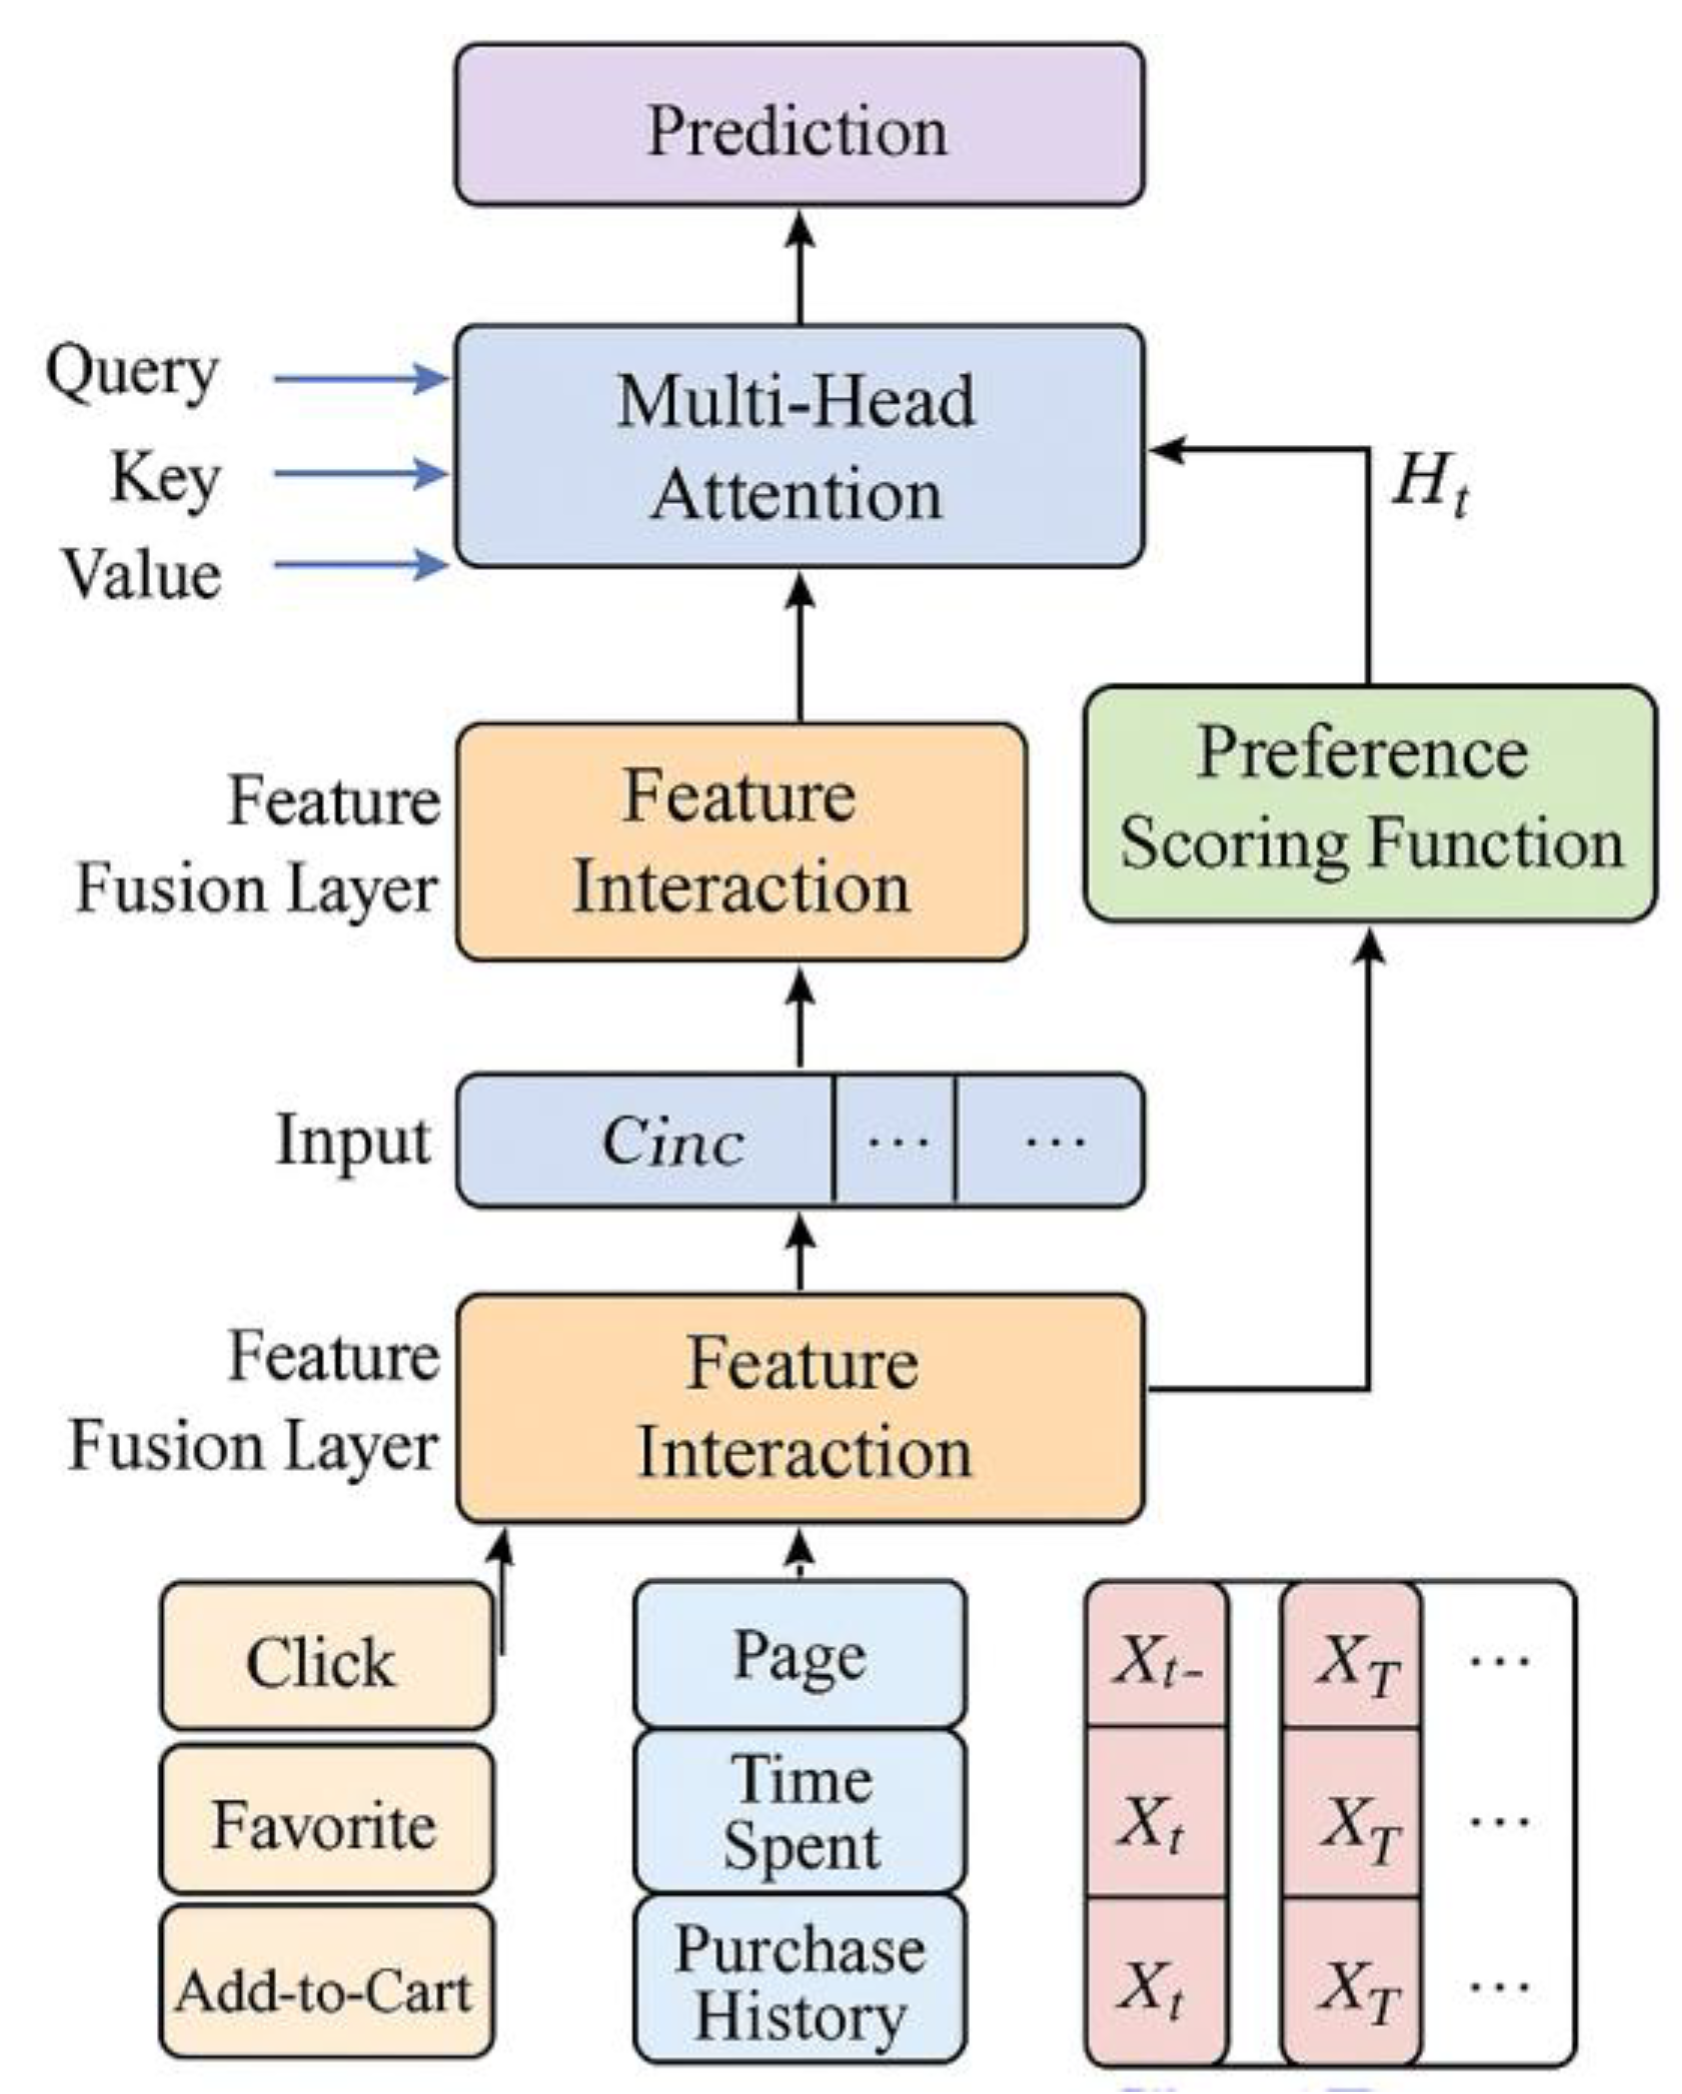
Figure 2.
Area plot of sales strategy generation distribution.
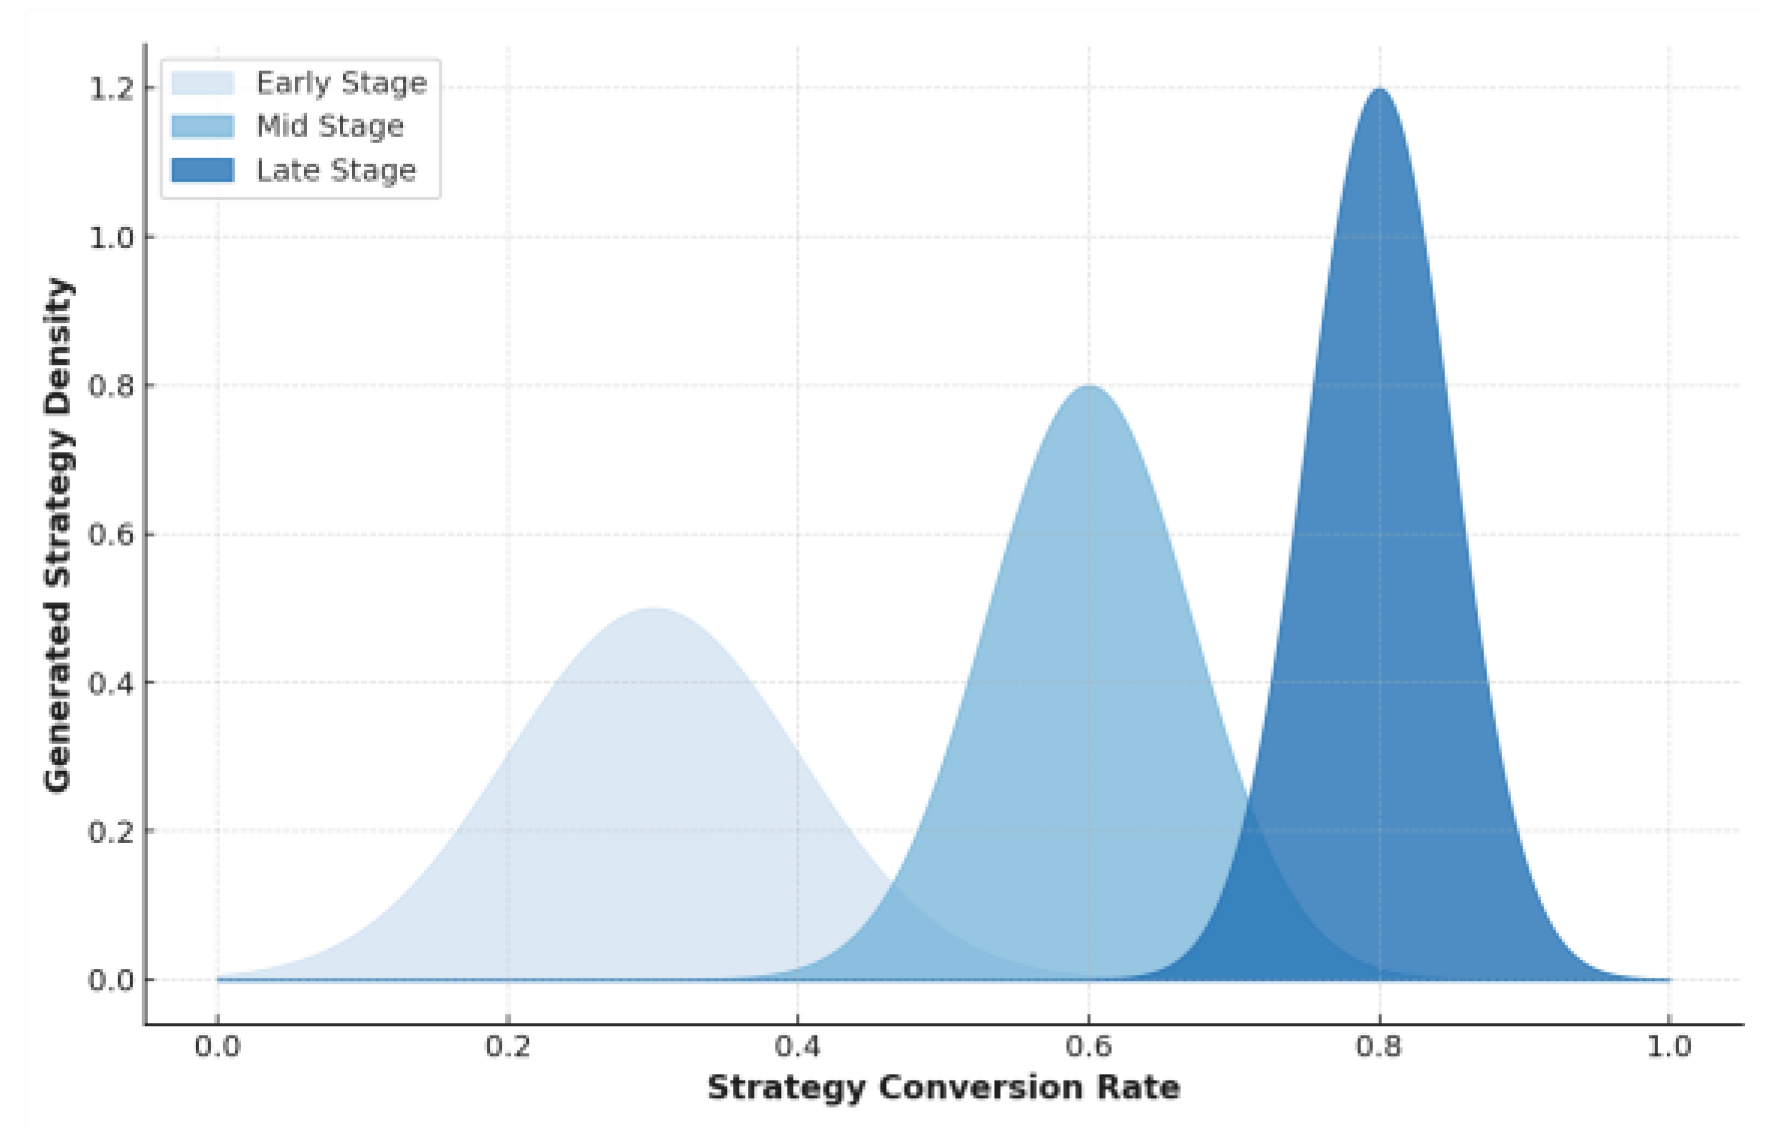
Figure 3.
Curve diagram of loss and discriminator accuracy changes during model training.
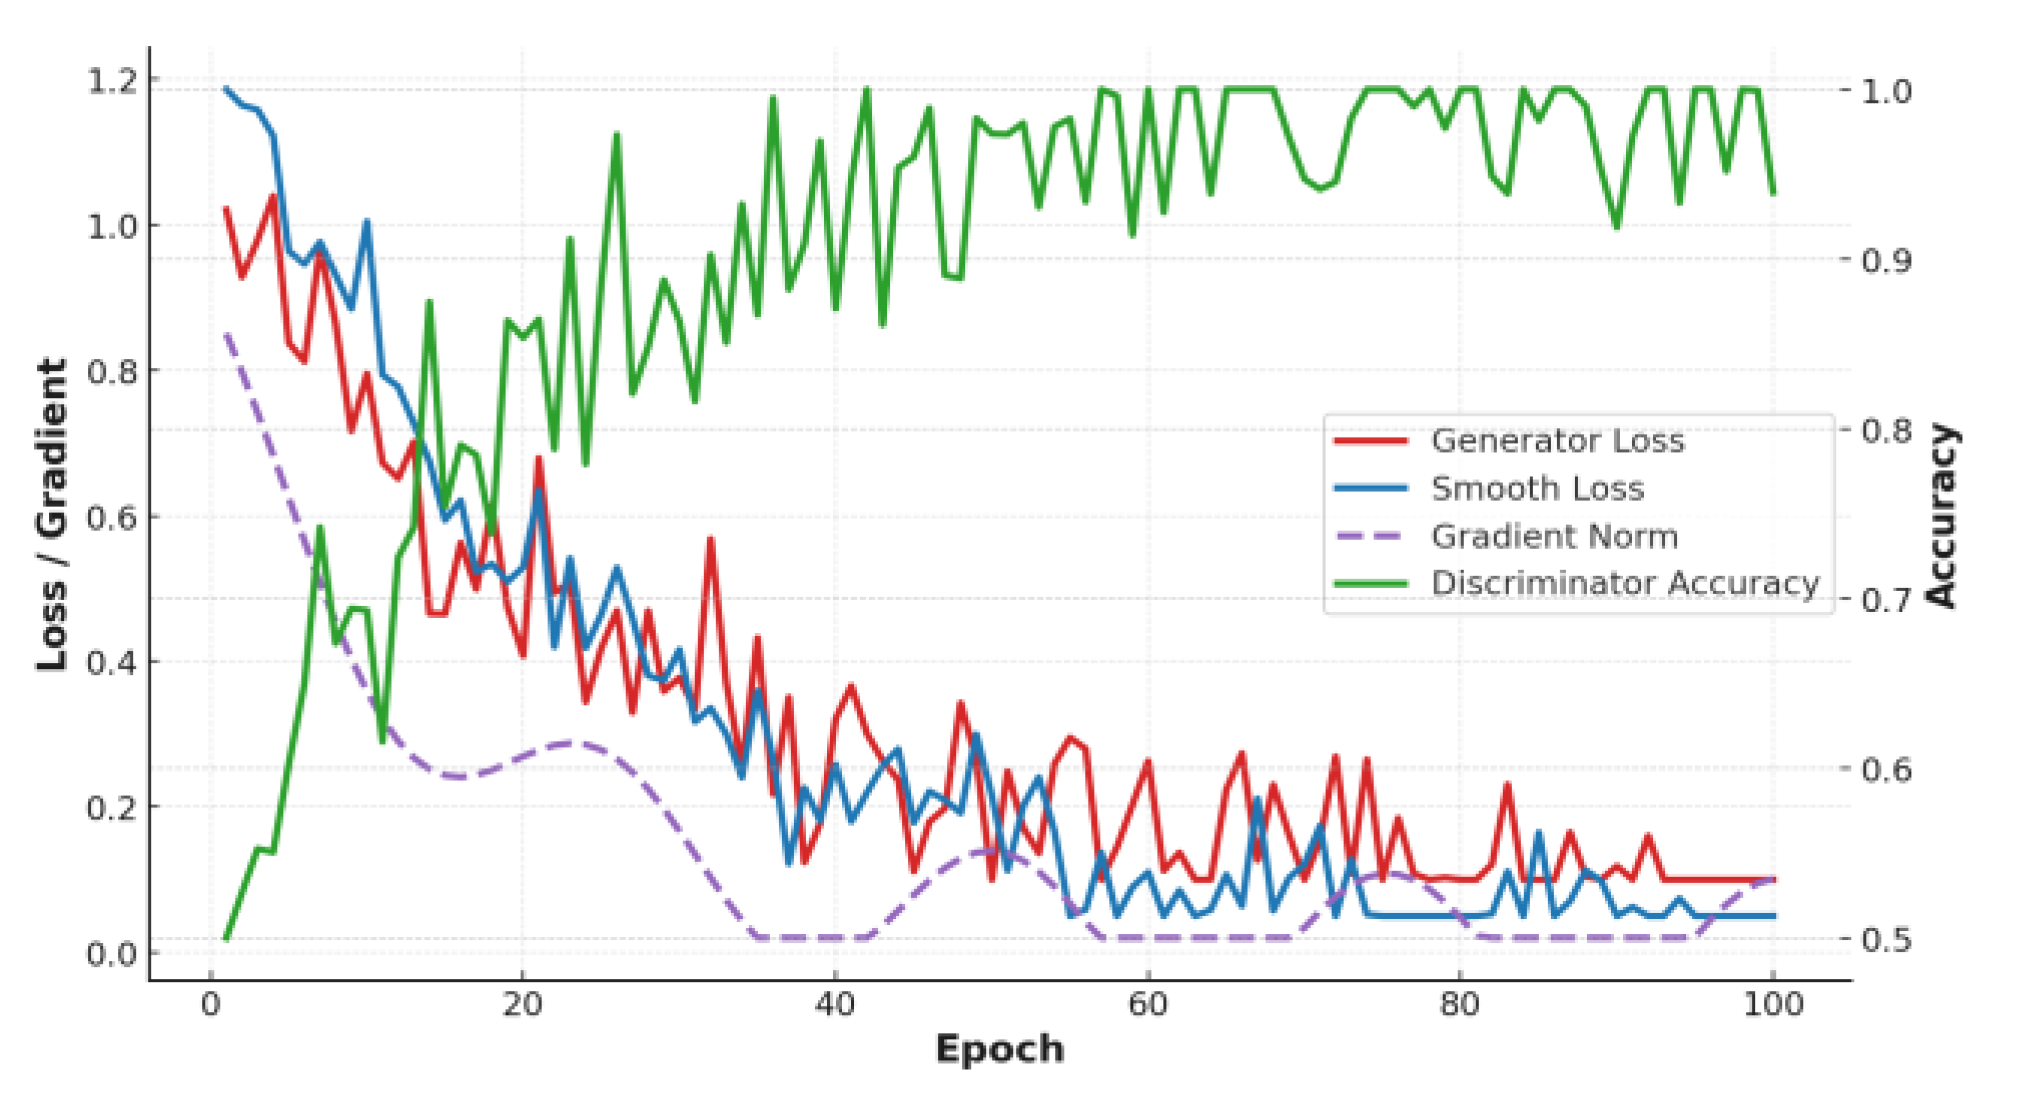
Figure 4.
Performance Heatmap of Different Models Under Strategy Metrics.
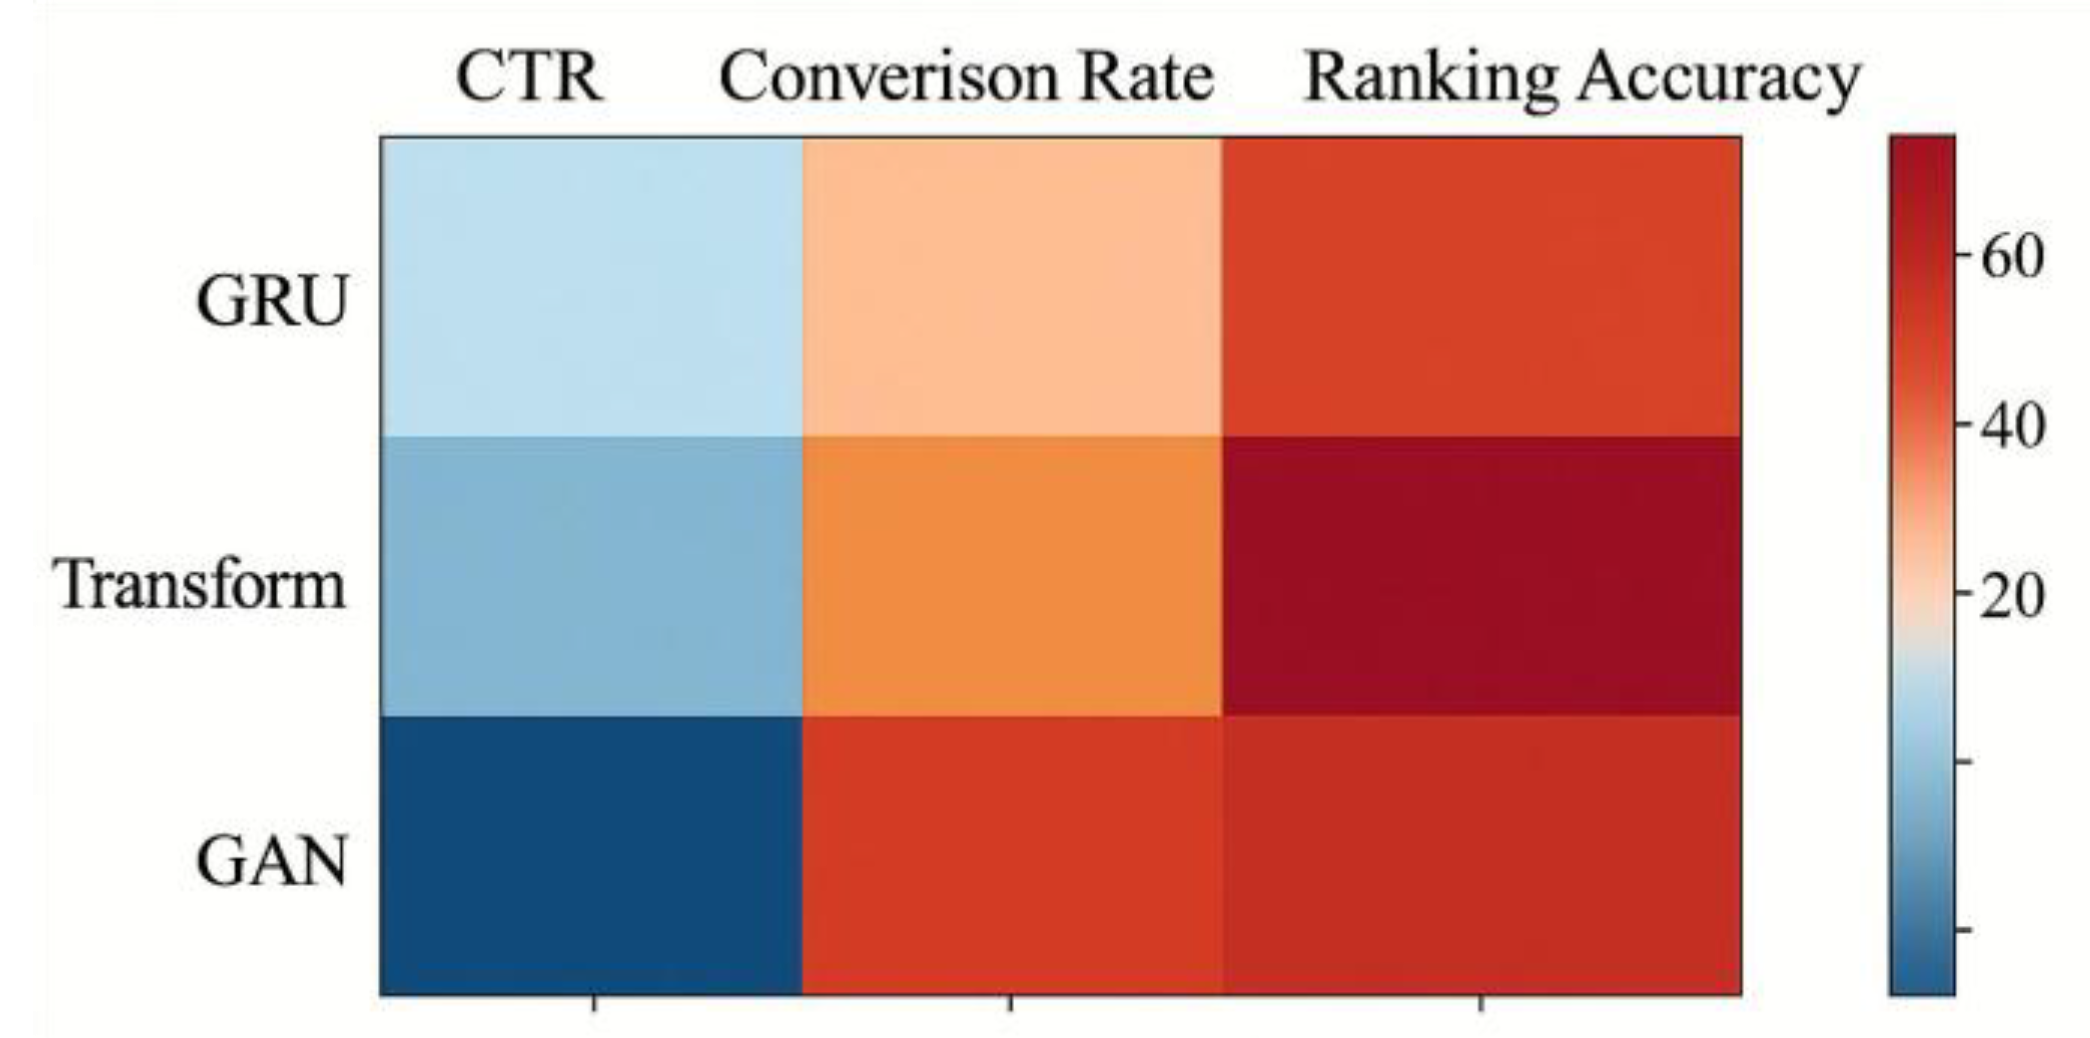

Table 1.
Key Feature Configuration for Consumer Behavior Modeling.
| Feature Type | Feature Name | Data Type | Feature Dimension | Feature Description |
| Behavioral Sequence Type | Click/Favorite/Add to Cart | Numeric | 3 | User Behavior Tag Triplet |
| Temporal Category | Dwell Duration/Interval | Continuous | 2 | Average Page Dwell Time and Event Interval |
| User Attributes Category | Gender/Age/Device | Category Type | 3 | Represented by embeddings after discretization |
| Product Attribute Category | Category/Price Range | Category Type | 2 | Categories are multi-level classifications; price ranges are discretized |
| Tag Category | Activity Level/Conversion Frequency | Numeric Type | 2 | User behavior statistics features |
Table 2.
Sales Strategy Optimization Parameter Configuration.
| Parameter Category | Parameter Name | Numeric Type | Description |
| Loss Function Configuration | 0.7 | Conversion Rate Weighting Factor | |
| Path Continuity Factor | 1.2 | Control Behavior Jump Probability | |
| Noise vector dimension | 128 | Input Latent Vector Dimension | |
| Learning Rate | 0.0002 | Adam optimizer initial learning rate | |
| Discriminator iteration frequency | 5 | Number of discriminator updates before each generator update |
Table 3.
Comparison of Hyperparameter Combinations and Evaluation Metrics.
| Learning Rate | Embedding Dimension | Batch Size | AUC | NDCG@10 | Hit Rate@10 |
| 0.0001 | 64 | 128 | 0.8421 | 0.6542 | 0.4331 |
| 0.0002 | 64 | 128 | 0.8517 | 0.6614 | 0.4397 |
| 0.0002 | 128 | 128 | 0.8642 | 0.6798 | 0.451 |
| 0.0005 | 128 | 128 | 0.859 | 0.6635 | 0.4456 |
| 0.0002 | 256 | 128 | 0.8624 | 0.6721 | 0.4502 |
| 0.0002 | 128 | 256 | 0.8601 | 0.6703 | 0.4483 |
Table 4.
Comparison Results of Sales Strategy Generation Models.
| Model Type | AUC | Precision@10 | NDCG@10 | Hit Rate@10 | Average Path Length |
| GRU Sequence Model | 0.8415 | 0.4032 | 0.6583 | 0.4214 | 4.92 |
| Transformer Architecture | 0.8598 | 0.4195 | 0.6712 | 0.4378 | 5.07 |
| GAN Strategy Generation Model | 0.8642 | 0.4281 | 0.6798 | 0.451 | 5.34 |
Table 5.
Model Robustness Performance Under Different Perturbation Conditions.
| Disturbance Scenario | AUC | ΔAUC | NDCG@10 | ΔNDCG | Hit Rate@10 | ΔHitRate |
| No Disturbance (Baseline) | 0.8642 | – | 0.6798 | – | 0.451 | – |
| Cold Start User Injection | 0.8467 | -0.0175 | 0.6583 | -0.0215 | 0.4335 | -0.0175 |
| 30% missing behavioral sequence | 0.8381 | -0.0261 | 0.6442 | -0.0356 | 0.4193 | -0.0317 |
| Delay Perturbation Window 5s | 0.8546 | -0.0096 | 0.6662 | -0.0136 | 0.4401 | -0.0109 |
Disclaimer/Publisher’s Note: The statements, opinions and data contained in all publications are solely those of the individual author(s) and contributor(s) and not of MDPI and/or the editor(s). MDPI and/or the editor(s) disclaim responsibility for any injury to people or property resulting from any ideas, methods, instructions or products referred to in the content. |
© 2025 by the authors. Licensee MDPI, Basel, Switzerland. This article is an open access article distributed under the terms and conditions of the Creative Commons Attribution (CC BY) license (http://creativecommons.org/licenses/by/4.0/).
Copyright: This open access article is published under a Creative Commons CC BY 4.0 license, which permit the free download, distribution, and reuse, provided that the author and preprint are cited in any reuse.


