
Submitted:
13 November 2025
Posted:
17 November 2025
You are already at the latest version
Abstract
Lung cancer is the leading cause of cancer-related mortality globally. Early detection via low-dose computed tomography (LDCT) can reduce mortality, but its implementation is challenged by the absence of objective diagnostic criteria and the necessity for extensive manual interpretation. Public datasets like the Lung Image Database Consortium often lack pathology-confirmed diagnoses, which can lead to inaccuracies in ground truth labels. Variability in voxel sizes across these datasets also complicates feature extraction, undermining model reliability. Many existing methods for integrating nodule boundary annotations use deep learning models such as generative adversarial networks, which often lack interpretability. This study assesses the effect of voxel normalization on pulmonary nodule classification and introduces a Fast Fourier Transform-based contour fusion method as a more interpretable alternative. Utilizing pathology-confirmed LDCT data from 415 patients across two medical centers, both machine learning and deep learning models were developed using voxel-normalized images and attention mechanisms, including transformers. The results demonstrated that voxel normalization significantly improved the overlap of features between datasets from two different centers by 64\%, resulting in enhanced selection stability. The top-performing machine-learning model achieved an impressive accuracy of 92.6\%, while the best deep-learning models reached an accuracy of 98.5\%. Notably, the FFT-based method provided a clinically interpretable integration of expert annotations, effectively addressing a major limitation of generative adversarial networks. In conclusion, voxel normalization enhances reliability in pulmonary nodule classification while the FFT-based method offers a viable path toward interpretability in deep learning applications. Future research should explore its implications further in multi-center contexts.
Keywords:
lung nodule
; machine learning
; deep learning
; auto contouring fusion
; computer-aided diagnosis
1. Introduction
In recent years, advancements in medical technology and oncology have contributed to a decline in annual mortality rates associated with cancer. Nevertheless, lung cancer (LC) remains a significant public health challenge, consistently reporting the highest incidence and mortality rates as indicated in the 2024 World Cancer Statistics (1). In Taiwan, LC has been the leading cause of cancer-related fatalities for over the past decade (2). Projections for 2024 anticipate that mortality from LC will be approximately threefold more significant than that from colorectal cancer, which ranks third, underscoring the considerable lethality of this malignancy (1).
LC can be roughly classified into two primary histological subtypes: Non-Small Cell Lung Cancer (NSCLC) and Small Cell Lung Cancer (SCLC) [3]. NSCLC comprises approximately 85% of all lung cancer cases and is further categorized into some subtypes, including Adenocarcinoma (AC) and Squamous Cell Carcinoma (SCC) (3). Accurate differentiation among these subtypes is critical, as it influences the selection of specialized therapeutic approaches to optimize patient outcomes (3). The significance of early detection and treatment in enhancing the survival rates of LC patients cannot be underestimated. Consequently, there is a global consensus on the importance of large-scale screening programs, primarily targeting individuals who are at an elevated risk due to factors such as family history or smoking habits (4).
One widely utilized lung cancer screening modality is low-dose computed tomography (LDCT) (5). Lung nodules are typically detected in LDCT images when more significant than 3 mm in diameter. Nodules of this size and, more important, are generally visible and can be evaluated for further assessment, although smaller nodules may also be detected under optimal imaging conditions. For precise clinical contexts, guidelines may vary, and follow-up imaging may be recommended for nodules below this size.
In lung cancer studies, the "nodule spectrum" refers to the variety of lung nodules identified in imaging studies. This spectrum includes differences in size, shape, margins, and density. Nodules can range from very small to large and may exhibit smooth or irregular edges, from soft to complex in density. The growth patterns of nodules over time are also important for evaluation. Understanding this spectrum helps clinicians assess the risk of lung cancer and determine appropriate management strategies. For instance, one of the spectra can be classified into solid, part-solid, and ground-glass nodules (GGN) (6).
Several critical factors are assessed in the evaluation of lung nodules for potential malignancy. Nodule size is paramount; those exceeding 3 cm in diameter exhibit a higher probability of being malignant. Margin characteristics are also significant, as smooth, well-defined edges generally indicate benign lesions, while spiculated or irregular margins heighten suspicion of malignancy. The growth rate of the nodule is a crucial consideration; rapid enlargement is typically associated with malignancy, whereas stable nodules are often benign. Additionally, the density of the nodule plays a role, with solid nodules generally carrying a greater risk of cancer compared to ground-glass opacities. The pattern of calcification can aid in risk stratification, and patient-specific factors—including age, smoking history, and the presence of symptoms such as cough or weight loss—further inform the diagnostic process (6). However, it is non-trivial to summarize these factors as a likelihood in cancer malignancy classification.
Despite the recognized utility of these biomarkers, a notable limitation exists regarding their effectiveness in enabling radiologists to reach unequivocal diagnostic conclusions (7). Additionally, the diagnostic process is considerably impacted by the subjective interpretation of radiologists, leading to variability in diagnostic outcomes among practitioners with varying experience levels. Such diagnostic ambiguity often leads radiologists to recommend a biopsy to obtain definitive results. However, this approach carries the drawback of a significant false positive rate, increasing unnecessary invasive procedures (8,9). However, with ongoing advancements in research, there is optimism for developing more reliable and precise diagnostic tools that may enhance diagnostic accuracy and consistency.
Significant research has been conducted on developing computer-aided diagnosis (CAD) systems, aiming to improve the accuracy of diagnosis in two main areas of lung cancer screening: nodule detection (10) and malignancy classification. Since this study focuses on nodule malignancy classification, we do not discuss nodule detection here.
The LIDC-IDRI dataset (11) is a popular dataset that primarily includes detailed annotations related to lung nodules, including their presence, size, and characteristics as assessed by radiologists. While it provides some information regarding the assessment of nodules, it does not explicitly label them as malignant or benign. Instead, the dataset includes radiologist assessments of the likelihood of malignancy, which is often based on subjective interpretations and consensus ratings but may not definitively classify each nodule's malignancy status. Researchers typically use this information to develop and evaluate predictive models for nodule malignancy, such as (12-16). We summarize their results in Table 1.
Relying exclusively on the LIDC-IDRI dataset for diagnosing nodule malignancy presents certain limitations. This dataset lacks biopsy-confirmed pathological verification; instead, malignancy labels are derived from subjective assessments by radiologists, which may introduce bias in the training and evaluation of CAD models. To overcome this challenge, our study gathers LDCT data from patients with suspected lung cancer at local institutions, ensuring that all subjects have undergone biopsies for definitive pathological confirmation.
Another common challenge in relevant research utilizing open datasets is the reliance on unprocessed CT images for developing CAD systems. In real-world clinical settings (17), CT scans encounter variability in equipment settings, resulting in discrepancies in pixel spacing and slice thickness among patients. This variability results in non-uniform voxel sizes, which can negatively affect the comparability of extracted radiomic features and the generalization ability of machine learning (ML) models. To enhance the applicability and effectiveness of these systems, regardless of whether deep learning (DL) or ML techniques are employed, it is crucial to use normalized images with uniform parameters. Previous studies have addressed this issue, reaching a consensus on the importance of geometrically normalizing images before their utilization (18-21).
Moreover, the studies utilizing the LIDC-IDRI database for nodule classification face another challenge in managing contours delineated by four radiologists. Some studies only use contours from one radiologist (22), potentially missing insights from others. In contrast, others employ Generative Adversarial Networks (GANs) (23) to integrate all four, which can make models less interpretable and reduce clinical trust. This affects the consistency of classification outcomes. In this study, we will tackle this issue and demonstrate our solution to the problem.
In summary, this study has four primary objectives:
- To collect two-center data with pathological verification for a reliable CAD system to differentiate between benign and malignant nodules.
- To examine how voxel normalization affects nodule classification.
- To create an intuitive contour fusion method for clinicians to merge contours from different radiologists.
- To investigate various machine learning and deep learning methods, including traditional CNNs and self-attention models, as the basis for the CAD system.
2. Materials and Methods
LDCT image data and their corresponding pathological confirmations are collected from two local centers: (a) Kaohsiung Veterans General Hospital (KVGH) and (b) Chia-Yi Christian Hospital (CYCH).
- The dataset includes 160 malignant and 81 benign pulmonary nodules (PNs) from 241 patients approved by the hospital's Institutional Review Board (IRB number VGHKS18-CT5-09, date: 2018/01/03). Each nodule's malignancy status was confirmed through pathological biopsy. Imaging was conducted using modalities from TOSHIBA, SIEMENS, GE MEDICAL SYSTEMS, and Philips. LifeX software (version 6.2.0, 2018, [25]) facilitated DICOM image reading and annotation in various planes. The recorded ROIs were saved as near-raw raster data (NRRD) files. Due to technical issues, 16 cases with annotation errors (3 benign and 13 malignant) were excluded. Feature extraction was performed on reconstructed images rather than raw scans. (20)
- The dataset comprises 174 patients, including 78 benign cases (101 benign nodules) and 96 malignant cases (120 malignant nodules), approved by the hospital's Institutional Review Board (IRB number IRB2022096, date: 2022/11/16). Each nodule's malignancy status was confirmed through pathological biopsy. Imaging was conducted using various modalities: 104 patients with Siemens, 8 with GE Medical Systems, 11 with Toshiba, 2 with Canon Medical Systems, and 49 with Philips. All participants underwent imaging in Helical mode at 120 KVP. 122 patients received iodine-based contrast media, while 52 were scanned without contrast agents. LIFEx software (Version 6.2.0, 2018) was used to annotate regions of interest (ROIs), delineated independently by a skilled radiologist and a radiographer. The recorded ROIs were saved as NRRD files, with original CT files converted to NRRD format using SimpleITK.
The data formats are outlined: CT images are in int16 format, computations are in float64, and masks are binary. In radiomics, each bin contains 25 CT numbers. In deep learning, each CT image is transformed into a positive integer format within the range of [0, 255] using a lung window (window width: 1500, window level: -600).
2.1. General Frameworks For Dataset (a).
We illustrate a flowchart above for analyzing LDCT images and extracting radiomics features. Here is a detail of the steps:
Flowchart (a)
- Raw LDCT Data: Collect LDCT images from KVGH.
- Voxel Reconstruction for Geometric Normalization: Standardize images to defined isotropic voxel sizes (side-length 1.5 mm).
- Radiomics Features Extraction: Obtain various features from the LDCT images while excluding shape-based features.
- Statistical Testing:
- a. Conduct tests for Gaussian distribution and equal variances.
- b. If the criteria are met, perform an independent t-test; otherwise, use the Wilcoxon rank-sum test.
- c. Determine statistical significance with a p-value threshold of less than (1020).
- Feature Selection with LASSO: Apply LASSO (Least Absolute Shrinkage and Selection Operator) for feature selection on the dataset (a).
Figure 1.
: Flowchart(a) for LDCT Image Analysis and Radiomics Feature Extraction (Dataset A).

This methodology allows for efficient processing of LDCT data, with a focus on rigorous statistical validation and feature selection.
2.2. General Frameworks For Dataset (b).
- Raw LDCT Data: Collect LDCT images from CYCH.
- Voxel Reconstruction for Geometric Normalization: Standardize images to defined isotropic voxel sizes (side-length 1.5 mm).
- Radiomics Features Extraction: Obtain various features from the LDCT images while excluding shape-based features. Before feature extraction, some filters and transformations are applied to generate comprehensive images, details of which are described in Section 3.5.
- Feature Selection and Classification
- a. With LightGBM: Apply Light Gradient Boosting Machine (LightGBM) for feature selection on radiomics features of dataset (b), followed by different ML classifiers.
- b. With neural networks: Apply different NNs.
Figure 2.
: Flowchart(b) for LDCT Image Analysis and Radiomics Feature Extraction (Dataset B).
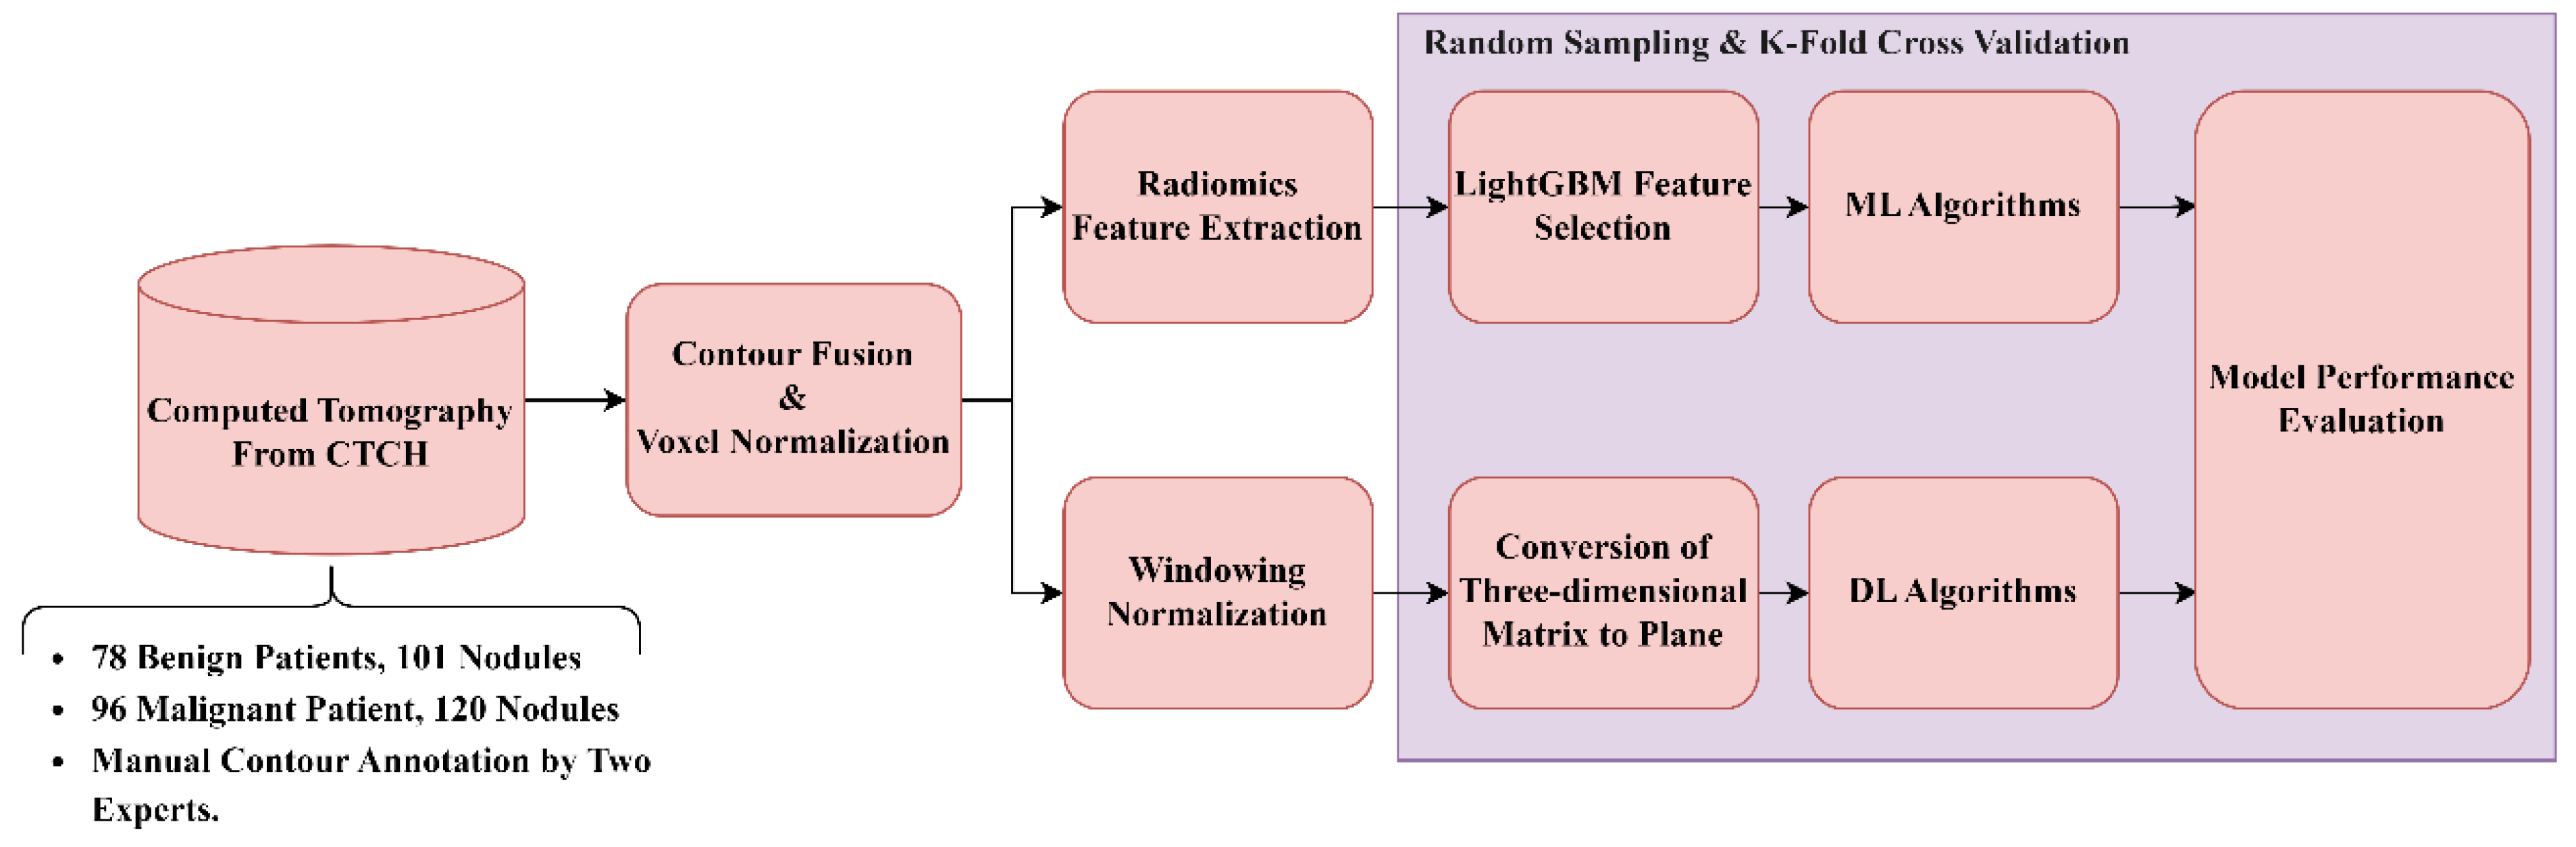
Note: 4.1 and 4.2 are independent; they generate different results.
2.3. Isotropic Voxel Normalization on CT Images
To improve the consistency and effectiveness of machine learning models for identifying the malignancy of PNs, the study standardizes pixel size (PS) and slice thickness (ST) across all LDCT images. This is done using isotropic voxel normalization with bicubic interpolation (24), ensuring uniform spatial resolution and achieving three-dimensional isotropy. This research also examines the effects of different voxel sizes (side lengths from 0.5 to 2 mm) on model performance and the characteristics of extracted features by adjusting the images accordingly.
2.4. Nodule Contour Fusion
The Fast Fourier Transform (FFT) is crucial for contour fusion of nodules from different expert annotations. This process is conducted on 2D binary images (0 for absence and 1 for presence of a nodule). The 2D FFT converts these binary images into their spectral forms, which are then averaged to create a merged spectrum. The inverse Fast Fourier Transform (IFFT) reverts the average spectrum to the spatial domain. Finally, the absolute values of the reversed images are processed, with a threshold of 0.7 applied to finalize the fusion. The contour fusion process is detailed in Equations 1 and 2 for the case of two experts.
The fused contour is then used for feature extraction. Notably, this process can also be conducted in 1D form, where the coordinates of nodule contours are the inputs and outputs.
2.5. Feature Extraction and Selection
Radiomics (25) is a well-known technique focused on extracting diverse features from medical images, encompassing first-order, shape-based, and texture features. Our study employs the pyradiomics library (26) to extract these features from contour-defined ROIs. Before the extraction process, we apply various filters to the raw ROIs, including Wavelet filters (27), the Laplacian of Gaussian filter (28), and several transformations such as Square, Square Root, Logarithm, Exponential, and Gradient, along with the Local Binary Pattern technique (29). These preprocessing steps aim to enhance the dataset by generating additional images for more comprehensive feature extraction.
The extensive process results in 2,120 features. To address the challenges of high dimensionality, we utilize the LightGBM (30) for feature selection, which differs from our previous method (20). LightGBM is an efficient gradient-boosting framework known for its speed and effectiveness in handling large datasets, making it ideal for balancing limited computational resources and training time. Another significant advantage of LightGBM is its ability to rank features by their importance during training, based on each feature's contribution to decision tree construction and its effect on model accuracy. Specifically, we first employ Spearman's test to evaluate linear relationships among all features, removing those with collinearity exceeding 0.9. The remaining features are then used to train the LightGBM model, allowing us to identify and select the 38 most effective features for further model development.
2.6. Classifiers in Machine Learning (ML)
Six ML algorithms are investigated, including Logistic Regression, Multilayer Perceptron (MLP), Random Forest, Linear Discriminant Analysis (LDA), LightGBM, and CatBoost(31).
2.7. CT Image Preparation for Neural Networks
To prepare input images for convolutional neural networks (CNNs), we employ a windowing technique on all CT images using a lung window (32), characterized by a window width of 1500 and a window level of -600. This adjustment normalizes the CT image values to the range of [0, 255], enhancing lung nodular visibility. The transformation function is illustrated in Equation 3. Subsequently, we extract patches with dimensions of 64 × 64x9 from each CT image sequence, ensuring that the nodules are centered within these patches. These nine patches are then flattened into a single image with dimensions of 192x192x1, serving as the input to the 2D neural networks
where WW=Window Width, WL=Window Level
We utilize 2D input rather than 3D input in our deep learning models. This decision is based on the fact that 3D input requires significantly higher computational resources than its 2D counterparts (33). The 3D format entails longer training time and necessitates a larger memory capacity for the model. Consequently, this research does not employ 3D images as the input. However, we test 3D deep learning models to compare performance between 2D and 3D inputs. For the 3D model, we use a matrix of dimensions 9x64x64x1 as the input, and the model is ‘3D ResNet101’, which is described in section 3.9.
2.82. D Neural Networks and DL Algorithms
In our research, we employ various DL algorithms, exploring a range of CNN architectures, including VGG16(34), ResNet101(35), InceptionNet(36), and ConvNeXt(37). Additionally, we investigate two multi-modal models: EVA02 (38) and Meta Transformer (39). Furthermore, we comprehensively evaluate six contemporary self-attention models, which include the Dual Attention Vision Transformers (DaViTs) (40), Vision Outlooker for Visual Recognition (VOLO) (41), Swin Transformer V2 (42), Phase-Aware Vision MLP (Wave-MLP) (43), LeViT (44), Dilated Neighborhood Attention Transformer (DINAT) (45), and Masked Image Modeling with Vector-Quantized Visual Tokenizers (BEIT v2) (46). These models have been selected for their innovative contributions to processing complex visual data through advanced attention mechanisms and architectural designs. Our objective in testing such a diverse set of self-attention models is to assess their efficacy in classifying lung nodule malignancy.
Each DL model is initially pre-trained on the ImageNet1000 dataset (47) and subsequently fine-tuned through transfer learning (48) using our in-house dataset. All training processes adhere to the same early stopping criterion (49), which halts training if the validation loss does not improve for more than ten epochs, indicating model convergence. All models utilize the Adadelta optimizer (50), maintain a cyclic learning rate (51) (with a maximum learning rate of 0.1 and a minimum learning rate of 0.00001), and employ Binary Focal Loss with an alpha value of 2 (52). Our experimentation with all models proceeds using the configuration of an RTX 3090 alongside an i9-7900X, with a setup that includes PyTorch 2.1.0 and Ultralytics 8.2.8.
2.9. 3D ResNet101
The 3D ResNet101 (53,54) represents an evolution of the traditional ResNet architecture, tailored explicitly for processing 3D data. In contrast to the standard 2D ResNet, the 3D ResNet101 is optimized for handling volumetric data such as video frames or medical imaging scans (53). This model maintains the deep residual network structure, connecting layers with identity mappings to address the vanishing gradient problem that often occurs in intense networks. The "101" denotes the network's depth, which comprises 101 layers. In the 3D variant, the 2D convolutional layers are replaced with 3D convolutions, allowing the model to capture three-dimensional information. This feature makes it particularly effective for tasks such as action recognition in videos, 3D object recognition, and volumetric medical image analysis. We selected this model for comparison instead of others because it is also used for pulmonary micronodule malignancy risk classification (53).
2.10. Model Performance Validation
We implement ten-fold cross-validation to rigorously assess the performance of the various models explored in this study. This method divides the dataset into ten subsets, using nine subsets for training and reserving one subset for testing in each iteration. The model employs transfer learning on the nine subsets, and the performance is then evaluated on the corresponding test subset. This process is repeated ten times, each subset serving once as the test dataset. The final performance of the model is the average of all 10 test datasets. We demonstrate the performance using metrics that include Balanced Accuracy, Weighted Sensitivity, Weighted Precision, Weighted F-score, and Weighted AUC, as defined in Equations (4)–(7). We aim to ensure robust validation and comprehensively assess model effectiveness across various evaluation criteria.
where TP, FP, and FN denote true positive, false positive, and false negative, respectively.
2.11. Understanding Object Recognition: Model Interpretability and Visibility
Gradient-weighted Class Activation Mapping (Grad-CAM) (55) is a prominent technique designed to enhance the interpretability of deep learning models by generating heatmaps that illustrate the regions of an input image that most influence the model's class predictions. This method involves computing the gradients of the class score concerning the input image, which is then backpropagated to the model's final convolutional layer. By weighting and combining these gradients, Grad-CAM produces a feature map that indicates the model's focus areas within the input. This visual representation can be overlaid on the original image to highlight regions that capture the model's attention, thereby facilitating an understanding of whether it relies on relevant image features for classification. This increases transparency and not only assists in validating the model's decision-making process but exposes potential biases or shortcomings. In this study, Grad-CAM is effectively utilized to elucidate the model's attention mechanisms, confirming its accurate identification of nodule characteristics in medical imaging.
3. Results
3.1. Nodule Contour Fusion
Four expert contours exist in the LIDC-IDRI dataset and two in the dataset (b). Four qualitative contour fusion results are demonstrated in Figure 3. Three contours are superimposed on the raw patch. The blue and green colors represent two manual contours, while the red color indicates the fusion result. Minor inconsistencies are observable. Notably, there is a manual error in Fig. 3(a), represented in green, where an extra point is erroneously included. However, the fusion result does not reflect this mistake. The proposed contour fusion technique effectively mitigates sharp variations exhibited by both experts, such as protrusions or indentations, thereby addressing the gaps left by incomplete annotations.
3.2. Feature Extraction and Selection
A total of 2,120 features are extracted using Radiomics. After feature selection with LightGBM, only the 38 most compelling features are retained, as illustrated in Figure 4. From the table, we can observe that there are 12 statistical features, 2 shape features, and 24 texture features, with eight statistical features ranked at the top.
Compared to the results of our previous study published in [20], there are 11 features selected by LASSO. We have created a table that reveals the feature intersection between dataset (a) and dataset (b) based on the same voxel normalization but with different feature selection methods, as shown in Table 2. We found that 7 out of 11 features appear again, resulting in a ratio of 63.6%.
3.3. Classifiers in Machine Learning
The performance of the selected six machine learning classifiers is demonstrated in Figure 5. The ROC analysis and Precision-Recall curves are shown, where the CatBoost model achieves an AUC of 0.97 in ROCAUC, making it comparable to state-of-the-art models in machine learning. In contrast, the Logistic Regression model is the worst classifier, with a ROCAUC of only 0.85. Table 3. shows the quantitative results of model performance using different metrics.
We are interested in investigating the impact of contour fusion on nodule malignancy classification. An additional experiment is conducted to compare the model's performance using contours from two experts with the fused contour, employing ROC analysis and Precision-Recall curves. The results are promising, as illustrated in Figure 6. The performance comparison between the fused contour and the experts' contours is depicted in the ROC and Precision-Recall curves. These curves demonstrate the performance of the fused contour (magenta) alongside the contours provided by the two experts (blue and purple). This visualization highlights the effectiveness of the fused contour in terms of actual positive rates and precision, showing its potential advantages in the classification of nodule malignancy.
3.4. CT image Preparation for Neural Networks
Figure 7. demonstrates the input for 2D NN. As described in the methods section, each CT image has been transformed into uint8 (unsigned integer 8-bit) format using a lung window. The nodule is positioned at the center of a patch with a dimension of 64×64. Nine such patches are flattened to form an input image with a dimension of 192×192 for the 2D neural network, while for the 3D neural network, they are stacked into a dimension of 9×64×64.
Table 4 compares various neural network models using deep learning. Three models achieve superior performance: 3D ResNet101, DaViT, and BEIT v2. DaViT and BEIT v2 incorporate attention mechanisms, allowing them to focus on relevant parts of the input data and improving their understanding of context and relationships within that data. This attention feature enhances their capability to process complex information compared to traditional convolutional networks. In contrast, 3D ResNet101 utilizes residual connections to mitigate the vanishing gradient problem, enabling the construction of deeper architectures. While DaViT and BEIT v2 employ different mechanisms, they both include designs that facilitate improved information flow. If we take the number of model parameters into consideration, where 3D ResNet101 (approximately 11 million), DaViT (base model contains approximately 50 million parameters), and BEIT v2 (base model contains around 86 million parameters), then we may come to conclude that 3D ResNet101 outperforms. However, based on our experience, 3D ResNet101 requires more computational resources than 2D models.
Table 5 presents a performance comparison of the proposed models relative to other models published in recent years, highlighting various metrics, including accuracy, sensitivity, precision, F1-score, and AUC. The results indicate that the models developed in this study, specifically 3D ResNet101, DaViT, and BEIT v2, each achieved an accuracy of 0.985, with impressive sensitivity and precision scores of 0.972 and 1.000, respectively. Additionally, these models achieved F1-scores of 0.986 and AUC values ranging from 0.998 to 0.999, showcasing their strong performance in nodule malignancy classification. In comparison, CatBoost, while not the top performer, still demonstrates solid effectiveness with an accuracy of 0.926, a sensitivity of 0.925, and a precision of 0.927, alongside an F1-score and AUC of 0.926 and 0.968, respectively.
Among other recent studies, Kang et al. [12] and Saihood et al.[14] exhibit high accuracy, with the former achieving an accuracy of 0.984 and the latter reaching 0.987. However, the AUC values for Saihood et al. are not reported. Conversely, Halder et al. [13] yield an AUC of 0.993, demonstrating competitive performance. Overall, this table illustrates the competitive positioning of the proposed models against both historical and contemporary benchmarks in nodule malignancy classification.
3.5. Model Interpretability and Visibility
Figure 8 illustrates the Grad-CAM results of the BEIT v2 model, providing insights into its attention mechanisms. Fig. 8 (A) and (B) display attention maps corresponding to cases where the model's predictions are correct. In these examples, the model effectively identifies significant features within the nodule regions, demonstrating a focused approach by allocating minimal attention to non-relevant areas of the images.
In contrast, Fig. 8(C) and (D) present attention maps for instances where the model's diagnoses are incorrect. Despite the model concentrating on specific regions, the highlighted areas are inaccurate. Fig. 8(C) reveals that the model disproportionately focuses on vessels located near the lung's peripheral region, contributing to its erroneous diagnosis. Similarly, Fig. 8(D) shows that the model allocates excessive attention to areas affected by emphysema within the lung, leading to an incorrect classification.
Overall, this figure underscores the model's capability to accurately direct attention when making correct predictions and its pitfalls in misdiagnoses where the focus shifts to irrelevant anatomical features.
4. Discussion
Figure 9 illustrates the differences in nodule size distribution between KVGH and CYCH, revealing that KVGH nodules are generally larger, while those from CYCH are smaller. Additionally, the benign and malignant nodules in CYCH exhibit a greater degree of overlap in size, further complicating classification. Nevertheless, 64% of the selected features overlap between the two datasets, underscoring the significance of voxel normalization in achieving consistent feature selection across varying distributions. This discrepancy also helps explain why the ML models in this study performed slightly less effectively than our previous research[20]. Since CYCH serves as the primary dataset and contains smaller nodules and more significant overlap between benign and malignant cases, the classification task is inherently more challenging, resulting in more incredible difficulty distinguishing between benign and malignant cases.
Furthermore, Fig. 9 emphasizes the limitations of using the LIDC-IDRI dataset for training nodule classification models. Although the nodules in LIDC-IDRI exhibit considerable diameter overlap with those in CYCH and KVGH, they lack pathology-proven diagnoses and rely solely on the subjective malignancy ratings provided by radiologists. This reliance increases the risk of erroneous ground truth labels, which could lead to unreliable model performance when applied to datasets with confirmed diagnoses.
In this study, we deliberately chose to exclude geometric features such as volume, size, and boundary length, despite their clinical relevance, to concentrate on texture-based analysis. As highlighted in Table 5, our CatBoost model did not achieve optimal performance, partly due to the omission of 14 geometric features and the bin configuration employed in our radiomics calculations. We applied 25 bins for non-overlapping CT numbers, whereas prior studies typically utilized 64 bins, which may not have been optimal for texture extraction. In contrast, DL models utilize 256 grayscale levels, providing a broader spectrum of information.
Numerous studies have employed 3D ResNet for nodule classification; however, we propose that 2D attention-based networks can effectively diagnose nodules in 2D images by harnessing attention mechanisms, thus eliminating the necessity for 3D input. In contrast, traditional CNNs struggle to achieve this due to their sliding window architecture, which hampers their ability to capture long-range dependencies within 2D images. This limitation complicates the analysis of nodules located across different slices of a scan. This is why attention-based models, such as DaViT and BEiT v2, outperformed conventional CNN architectures in our experiments. The advantage of transformers lies in their capacity to capture spatial dependencies throughout the entire image, rather than being confined to local receptive fields, which is crucial for nodule malignancy classification. Furthermore, 2D models require significantly lower computational resources compared to 3D networks, making them more practical for real-world clinical applications.
The challenges associated with ML-based approaches are evident. Manual contour delineation of nodules is time-consuming, and the feature selection can vary between different runs, leading to inconsistencies among researchers. Our findings emphasize that voxel normalization is essential in processing LDCT data, as 64% of the features selected in a previous study reemerged in this research, highlighting its significance in maintaining feature stability. However, we did not assess the impact of voxel normalization on deep learning models, which represents a limitation of our study.
One limitation of this research is the relatively small dataset, comprising only 415 patients from two medical centers. While utilizing pathology-confirmed LDCT data represents a significant strength, a more extensive dataset obtained from multiple centers would validate the findings more robustly. Additionally, merging annotations from various experts for nodule boundaries poses a considerable challenge. Some studies have explored using GANs for contour fusion; however, these models can be complex for clinicians to interpret. As an alternative, we propose an approach based on the FFT that mathematically integrates boundaries while preserving shape details. This method achieves performance comparable to that of GANs while being more interpretable. Furthermore, the computational speed of FFT is significantly greater than that of GANs, and it does not require expensive hardware such as GPUs, making it a more cost-effective solution that is better suited for clinical applications.
Our findings underscore the pivotal role of voxel normalization, emphasize the limitations of the LIDC-IDRI dataset, and illustrate the effectiveness of FFT-based annotation fusion. Future research should investigate voxel normalization's impact on deep learning models and compare various contour integration techniques to refine pulmonary nodule classification further.
5. Conclusions
This study delved into the impact of voxel normalization and an automatic contour fusion CAD system. Our experimental findings revealed that normalizing the voxel size to 1.5mm resulted in optimal CAD performance. We observed a high level of consistency in the texture features extracted and selected from data obtained from different centers. Using only 11 features and SVM, we achieved an impressive accuracy of 0.9596 and an AUC of 0.9855 among 241 patients. Furthermore, by employing the Fast Fourier Transform to fuse contours drawn by different experts and leveraging the BEIT V2 model, we attained an accuracy of 0.9848 and an AUC of 0.9994 on a dataset of 221 nodules. It is worth noting that all nodules utilized in this study were pathologically verified as the gold standard, underpinning the development of a robust and reliable CAD system for clinical practitioners.
Author Contributions
Conceptualization, D.-C.C.; Methodology, D.-C.C., C.-H.P.; Software, C.-H.P.; Validation, C.-H.P. and J.-F.W.; Formal Analysis, D.-C.C. and C.-H.P.; Investigation, D.-C.C. and C.-H.P.; Resources, C.-J.K.; Data Curation, C.-J.K. and J.-F.W.; Writing—original draft preparation, D.-C.C. and C.-H.P.; Writing—review and editing, D.-C.C. and C.-J.K; Visualization, C.-H.P.; Supervision, D.-C.C. and C.-J.K.; Project Administration, D.-C.C. and C.-J.K.; Funding Acquisition, C.-J.K. All authors have read and agreed to the published version of the manuscript..
Funding
This work was supported by Ditmanson Medical Foundation Chia-Yi Christian Hospital (Project No. R111-51).
Institutional Review Board Statement
This study was approved by the Institutional Review Board (IRB) of Ditmanson Medical Foundation Chia-Yi Christian Hospital on November 16, 2022 (IRB number: IRB2022096). All participant procedures were conducted according to the relevant guidelines and regulations.
Informed Consent Statement
Patient consent was waived due to the retrospective nature of the study and the use of de-identified clinical and imaging data.
Data Availability Statement
The data presented in this study are available on request from the corresponding author. The data are not publicly available due to privacy and ethical restrictions imposed by the Institutional Review Board of Ditmanson Medical Foundation Chia-Yi Christian Hospital.
Acknowledgments
We thank to National Center for High-performance Computing (NCHC) for providing computational and storage resources.
Conflicts of Interest
The authors declare that they have no known competing financial interests or personal relationships that could have appeared to influence the work reported in this paper.
Abbreviations
The following abbreviations are used in this manuscript:
| LDCT | Low-Dose Computed Tomography |
| PN | Pulmonary Nodule |
| NSCLC | Non-Small Cell Lung Cancer |
| SCLC | Small Cell Lung Cancer |
| AC | Adenocarcinoma |
| SCC | Squamous Cell Carcinoma |
| GGN | Ground-Glass Nodule |
| CAD | Computer-Aided Diagnosis |
| ML | Machine Learning |
| DL | Deep Learning |
| CNN | Convolutional Neural Network |
| FFT | Fast Fourier Transform |
| ROI | Region of Interest |
| LASSO | Least Absolute Shrinkage and Selection Operator |
| LIFEx | Local Image Feature Extraction (software) |
| LightGBM | Light Gradient Boosting Machine |
| MLP | Multilayer Perceptron |
| LDA | Linear Discriminant Analysis |
| AUC | Area Under the Curve |
| ROC | Receiver Operating Characteristic |
| Grad-CAM | Gradient-weighted Class Activation Mapping |
| BEiT | Bidirectional Encoder Representation from Image Transformers |
| DaViT | Dual Attention Vision Transformer |
| VOLO | Vision Outlooker |
| DINAT | Dilated Neighborhood Attention Transformer |
| VGG | Visual Geometry Group |
| ResNet | Residual Network |
| MetaFormer | Meta Transformer |
| EVA | Enhanced Visual Attention |
| NCHC | National Center for High-performance Computing |
| KVGH | Kaohsiung Veterans General Hospital |
| CYCH | Chia-Yi Christian Hospital |
| IRB | Institutional Review Board |
References
- Siegel, R.L. , Giaquinto, A.N. and Jemal, A. Cancer statistics, 2024. CA: a cancer journal for clinicians 2024, 74, 12–49. [Google Scholar]
- Welfare. M.o.H.a. 2024 National Cause of Death Statistics. 2024.
- Herbst, R.S. , Morgensztern, D. and Boshoff, C. The biology and management of non-small cell lung cancer. Nature 2018, 553, 446–454. [Google Scholar] [CrossRef] [PubMed]
- Roberts, H. , Walker-Dilks, C., Sivjee, K., Ung, Y., Yasufuku, K., Hey, A., Lewis, N. and Group, L.C.S.G.D. Screening high-risk populations for lung cancer: guideline recommendations. Journal of Thoracic Oncology 2013, 8, 1232–1237. [Google Scholar] [CrossRef] [PubMed]
- Jemal, A. and Fedewa, S.A. Lung cancer screening with low-dose computed tomography in the United States—2010 to 2015. JAMA oncology 2017, 3, 1278–1281. [Google Scholar] [CrossRef] [PubMed]
- Swensen, S.J. , Viggiano, R.W., Midthun, D.E., Müller, N.L., Sherrick, A., Yamashita, K., Naidich, D.P., Patz, E.F., Hartman, T.E. and Muhm, J.R. Lung nodule enhancement at CT: multicenter study. Radiology 2000, 214, 73–80. [Google Scholar] [CrossRef]
- Rubin, G.D. Lung nodule and cancer detection in computed tomography screening. Journal of thoracic imaging 2015, 30, 130–138. [Google Scholar] [CrossRef]
- Khan, T. , Usman, Y., Abdo, T., Chaudry, F., Keddissi, J.I. and Youness, H.A. Diagnosis and management of peripheral lung nodule. Annals of Translational Medicine 2019 7.
- Swensen, S.J. , Silverstein, M.D., Edell, E.S., Trastek, V.F., Aughenbaugh, G.L., Ilstrup, D.M. and Schleck, C.D. Mayo Clinic Proceedings, 1999; 74. [Google Scholar]
- Lo, S.-C. , Lou, S.-L., Lin, J.-S., Freedman, M.T., Chien, M.V. and Mun, S.K. Artificial convolution neural network techniques and applications for lung nodule detection. IEEE transactions on medical imaging 1995, 14, 711–718. [Google Scholar] [CrossRef]
- Armato III, S.G. , McLennan, G., Bidaut, L., McNitt-Gray, M.F., Meyer, C.R., Reeves, A.P., Zhao, B., Aberle, D.R., Henschke, C.I. and Hoffman, E.A. The lung image database consortium (LIDC) and image database resource initiative (IDRI): a completed reference database of lung nodules on CT scans. Medical physics 2011, 38, 915–931. [Google Scholar]
- Kang, G. , Liu, K., Hou, B. and Zhang, N. 3D multi-view convolutional neural networks for lung nodule classification. PloS one 2017, 12, e0188290. [Google Scholar] [CrossRef]
- Halder, A. , Chatterjee, S. and Dey, D. Adaptive morphology aided 2-pathway convolutional neural network for lung nodule classification. Biomedical Signal Processing and Control 2022, 72, 103347. [Google Scholar] [CrossRef]
- Saihood, A. , Karshenas, H. and Nilchi, A.R.N. Deep fusion of gray level co-occurrence matrices for lung nodule classification. Plos one 2022, 17, e0274516. [Google Scholar] [CrossRef] [PubMed]
- Dey, R. , Lu, Z. and Hong, Y. 2018 IEEE 15th international symposium on biomedical imaging (ISBI 2018). IEEE: 2018; pp. 774–778.
- Mehta, K. , Jain, A., Mangalagiri, J., Menon, S., Nguyen, P. and Chapman, D.R. Lung nodule classification using biomarkers, volumetric radiomics, and 3D CNNs. Journal of Digital Imaging.
- Rampinelli, C. , Origgi, D. and Bellomi, M. Low-dose CT: technique, reading methods and image interpretation. Cancer imaging 2013, 12, 548. [Google Scholar] [CrossRef] [PubMed]
- Escudero Sanchez, L. , Rundo, L., Gill, A.B., Hoare, M., Mendes Serrao, E. and Sala, E. Robustness of radiomic features in CT images with different slice thickness, comparing liver tumour and muscle. Scientific reports 2021, 11, 8262. [Google Scholar] [CrossRef]
- Huang, K. , Rhee, D.J., Ger, R., Layman, R., Yang, J., Cardenas, C.E. and Court, L.E. Impact of slice thickness, pixel size, and CT dose on the performance of automatic contouring algorithms. Journal of applied clinical medical physics 2021, 22, 168–174. [Google Scholar] [CrossRef]
- Hsiao, C.-C. , Peng, C.-H., Wu, F.-Z. and Cheng, D.-C. Impact of Voxel Normalization on a Machine Learning-Based Method: A Study on Pulmonary Nodule Malignancy Diagnosis Using Low-Dose Computed Tomography (LDCT). Diagnostics 2023, 13, 3690. [Google Scholar] [CrossRef]
- Paul, R. , Hassan, M.S.-u., Moros, E.G., Gillies, R.J., Hall, L.O. and Goldgof, D.B. Deep feature stability analysis using CT images of a physical phantom across scanner manufacturers, cartridges, pixel sizes, and slice thickness. Tomography 2020, 6, 250. [Google Scholar] [CrossRef]
- Jacobs, C. , van Rikxoort, E.M., Murphy, K., Prokop, M., Schaefer-Prokop, C.M. and van Ginneken, B. Computer-aided detection of pulmonary nodules: a comparative study using the public LIDC/IDRI database. European radiology 2016, 26, 2139–2147. [Google Scholar] [CrossRef]
- Shi, H. , Lu, J. and Zhou, Q. 2020 Chinese Control and Decision Conference (CCDC), 2020 IEEE, pp. 2486– 2491. [Google Scholar]
- Fritsch, F.N. and Carlson, R.E. Monotone piecewise cubic interpolation. SIAM Journal on Numerical Analysis 1980, 17, 238–246. [Google Scholar] [CrossRef]
- Gillies, R.J. , Kinahan, P.E. and Hricak, H. Radiomics: images are more than pictures, they are data. Radiology 2016, 278, 563–577. [Google Scholar] [CrossRef]
- Van Griethuysen, J.J. , Fedorov, A., Parmar, C., Hosny, A., Aucoin, N., Narayan, V., Beets-Tan, R.G., Fillion-Robin, J.-C., Pieper, S. and Aerts, H.J. Computational radiomics system to decode the radiographic phenotype. Cancer research 2017, 77, e104–e107. [Google Scholar] [CrossRef] [PubMed]
- ZHANG, D. (2019) FUNDAMENTALS OF IMAGE DATA MINING: Analysis, Features, Classification and Retrieval. SPRINGER NATURE.
- Kong, H. , Akakin, H.C. and Sarma, S.E. A generalized Laplacian of Gaussian filter for blob detection and its applications. IEEE transactions on cybernetics 2013, 43, 1719–1733. [Google Scholar] [CrossRef] [PubMed]
- Ke-Chen, S. , Yun-Hui, Y., Wen-Hui, C. and Zhang, X. Research and perspective on local binary pattern. Acta Automatica Sinica 2013, 39, 730–744. [Google Scholar]
- Ke, G. , Meng, Q., Finley, T., Wang, T., Chen, W., Ma, W., Ye, Q. and Liu, T.-Y. Lightgbm: A highly efficient gradient boosting decision tree. Advances in neural information processing systems 2017, 30. [Google Scholar]
- Prokhorenkova, L. , Gusev, G., Vorobev, A., Dorogush, A.V. and Gulin, A. CatBoost: unbiased boosting with categorical features. Advances in neural information processing systems.
- Hoeschen, C. , Reissberg, S. and Doehring, W. (2002), Medical Imaging 2002: Physics of Medical Imaging. SPIE, Vol. 4682, pp. 828–838.
- Singh, S.P. , Wang, L., Gupta, S., Gulyas, B. and Padmanabhan, P. Shallow 3D CNN for detecting acute brain hemorrhage from medical imaging sensors. IEEE Sensors Journal 2020, 21, 14290–14299. [Google Scholar] [CrossRef]
- Simonyan, K. and Zisserman, A. (2014) Very deep convolutional networks for large-scale image recognition. arXiv preprint arXiv:1409.1556, arXiv:1409.1556.
- Targ, S. , Almeida, D. and Lyman, K. (2016) Resnet in resnet: Generalizing residual architectures. arXiv preprint arXiv:1603.08029, arXiv:1603.08029.
- Szegedy, C. , Liu, W., Jia, Y., Sermanet, P., Reed, S.E., Anguelov, D., Erhan, D., Vanhoucke, V. and Rabinovich, A. (2014).
- Liu, Z. , Mao, H., Wu, C.-Y., Feichtenhofer, C., Darrell, T. and Xie, S. Proceedings of the IEEE/CVF conference on computer vision and pattern recognition, 1197 pp. 11976–11986. [Google Scholar]
- Fang, Y. , Sun, Q., Wang, X., Huang, T., Wang, X. and Cao, Y. Eva-02: A visual representation for neon genesis. arXiv 2023, arXiv:2303.11331. [Google Scholar]
- Zhang, Y. , Gong, K., Zhang, K., Li, H., Qiao, Y., Ouyang, W. and Yue, X. Meta-transformer: A unified framework for multimodal learning. arXiv 2023, arXiv:2307.10802. [Google Scholar]
- Ding, M. , Xiao, B., Codella, N., Luo, P., Wang, J. and Yuan, L. European conference on computer vision, 2022 Springer, pp. 74–92. [Google Scholar]
- Yuan, L. , Hou, Q., Jiang, Z., Feng, J. and Yan, S. Volo: Vision outlooker for visual recognition. IEEE transactions on pattern analysis and machine intelligence 2022, 45, 6575–6586. [Google Scholar]
- Liu, Z. , Hu, H., Lin, Y., Yao, Z., Xie, Z., Wei, Y., Ning, J., Cao, Y., Zhang, Z. and Dong, L. Proceedings of the IEEE/CVF conference on computer vision and pattern recognition, 1200 pp. 12009–12019. [Google Scholar]
- Tang, Y. , Han, K., Guo, J., Xu, C., Li, Y., Xu, C. and Wang, Y. Proceedings of the IEEE/CVF conference on computer vision and pattern recognition, 1093 pp. 10935–10944. [Google Scholar]
- Graham, B. , El-Nouby, A., Touvron, H., Stock, P., Joulin, A., Jégou, H. and Douze, M. Proceedings of the IEEE/CVF international conference on computer vision, 1225 pp. 12259–12269. [Google Scholar]
- Hassani, A. and Shi, H. Dilated neighborhood attention transformer. arXiv 2022, arXiv:2209.15001. [Google Scholar]
- Peng, Z. , Dong, L., Bao, H., Ye, Q. and Wei, F. Beit v2: Masked image modeling with vector-quantized visual tokenizers. arXiv 2022, arXiv:2208.06366. [Google Scholar]
- Deng, J. , Dong, W., Socher, R., Li, L.-J., Li, K. and Fei-Fei, L. 2009 IEEE conference on computer vision and pattern recognition, 2009 pp. 11976–11986. [Google Scholar]
- Weiss, K. , Khoshgoftaar, T.M. and Wang, D. A survey of transfer learning. Journal of Big data 2016, 3, 1–40. [Google Scholar] [CrossRef]
- Yao, Y. , Rosasco, L. and Caponnetto, A. On early stopping in gradient descent learning. Constructive Approximation 2007, 26, 289–315. [Google Scholar] [CrossRef]
- Zaheer, R. and Shaziya, H. 2019 third international conference on inventive systems and control (ICISC). IEEE: 2019; pp. 536–539.
- Smith, L.N. 2017 IEEE winter conference on applications of computer vision (WACV). IEEE: 2017; pp. 464–472.
- Lin, T.-Y. , Goyal, P., Girshick, R., He, K. and Dollár, P. Proceedings of the IEEE international conference on computer vision, 2980 pp. 2980–2988. [Google Scholar]
- Yang, Y. and Zhang, Q. Multiview framework using a 3D residual network for pulmonary micronodule malignancy risk classification. Bio-Medical Materials and Engineering 2020, 31, 253–267. [Google Scholar] [CrossRef]
- Ning, J. , Zhao, H., Lan, L., Sun, P. and Feng, Y. A computer-aided detection system for the detection of lung nodules based on 3D-ResNet. Applied Sciences 2019, 9, 5544. [Google Scholar] [CrossRef]
- Selvaraju, R.R. , Cogswell, M., Das, A., Vedantam, R., Parikh, D. and Batra, D. Grad-CAM: visual explanations from deep networks via gradient-based localization. International journal of computer vision 2020, 128, 336–359. [Google Scholar] [CrossRef]
Figure 3.
: Four contour fusion results. Three contours are superimposed on a raw patch. The blue and green lines illustrate contours meticulously delineated by two human experts. The red line represents the contour fusion, which aligns the nodule areas from the two experts, providing a refined depiction.
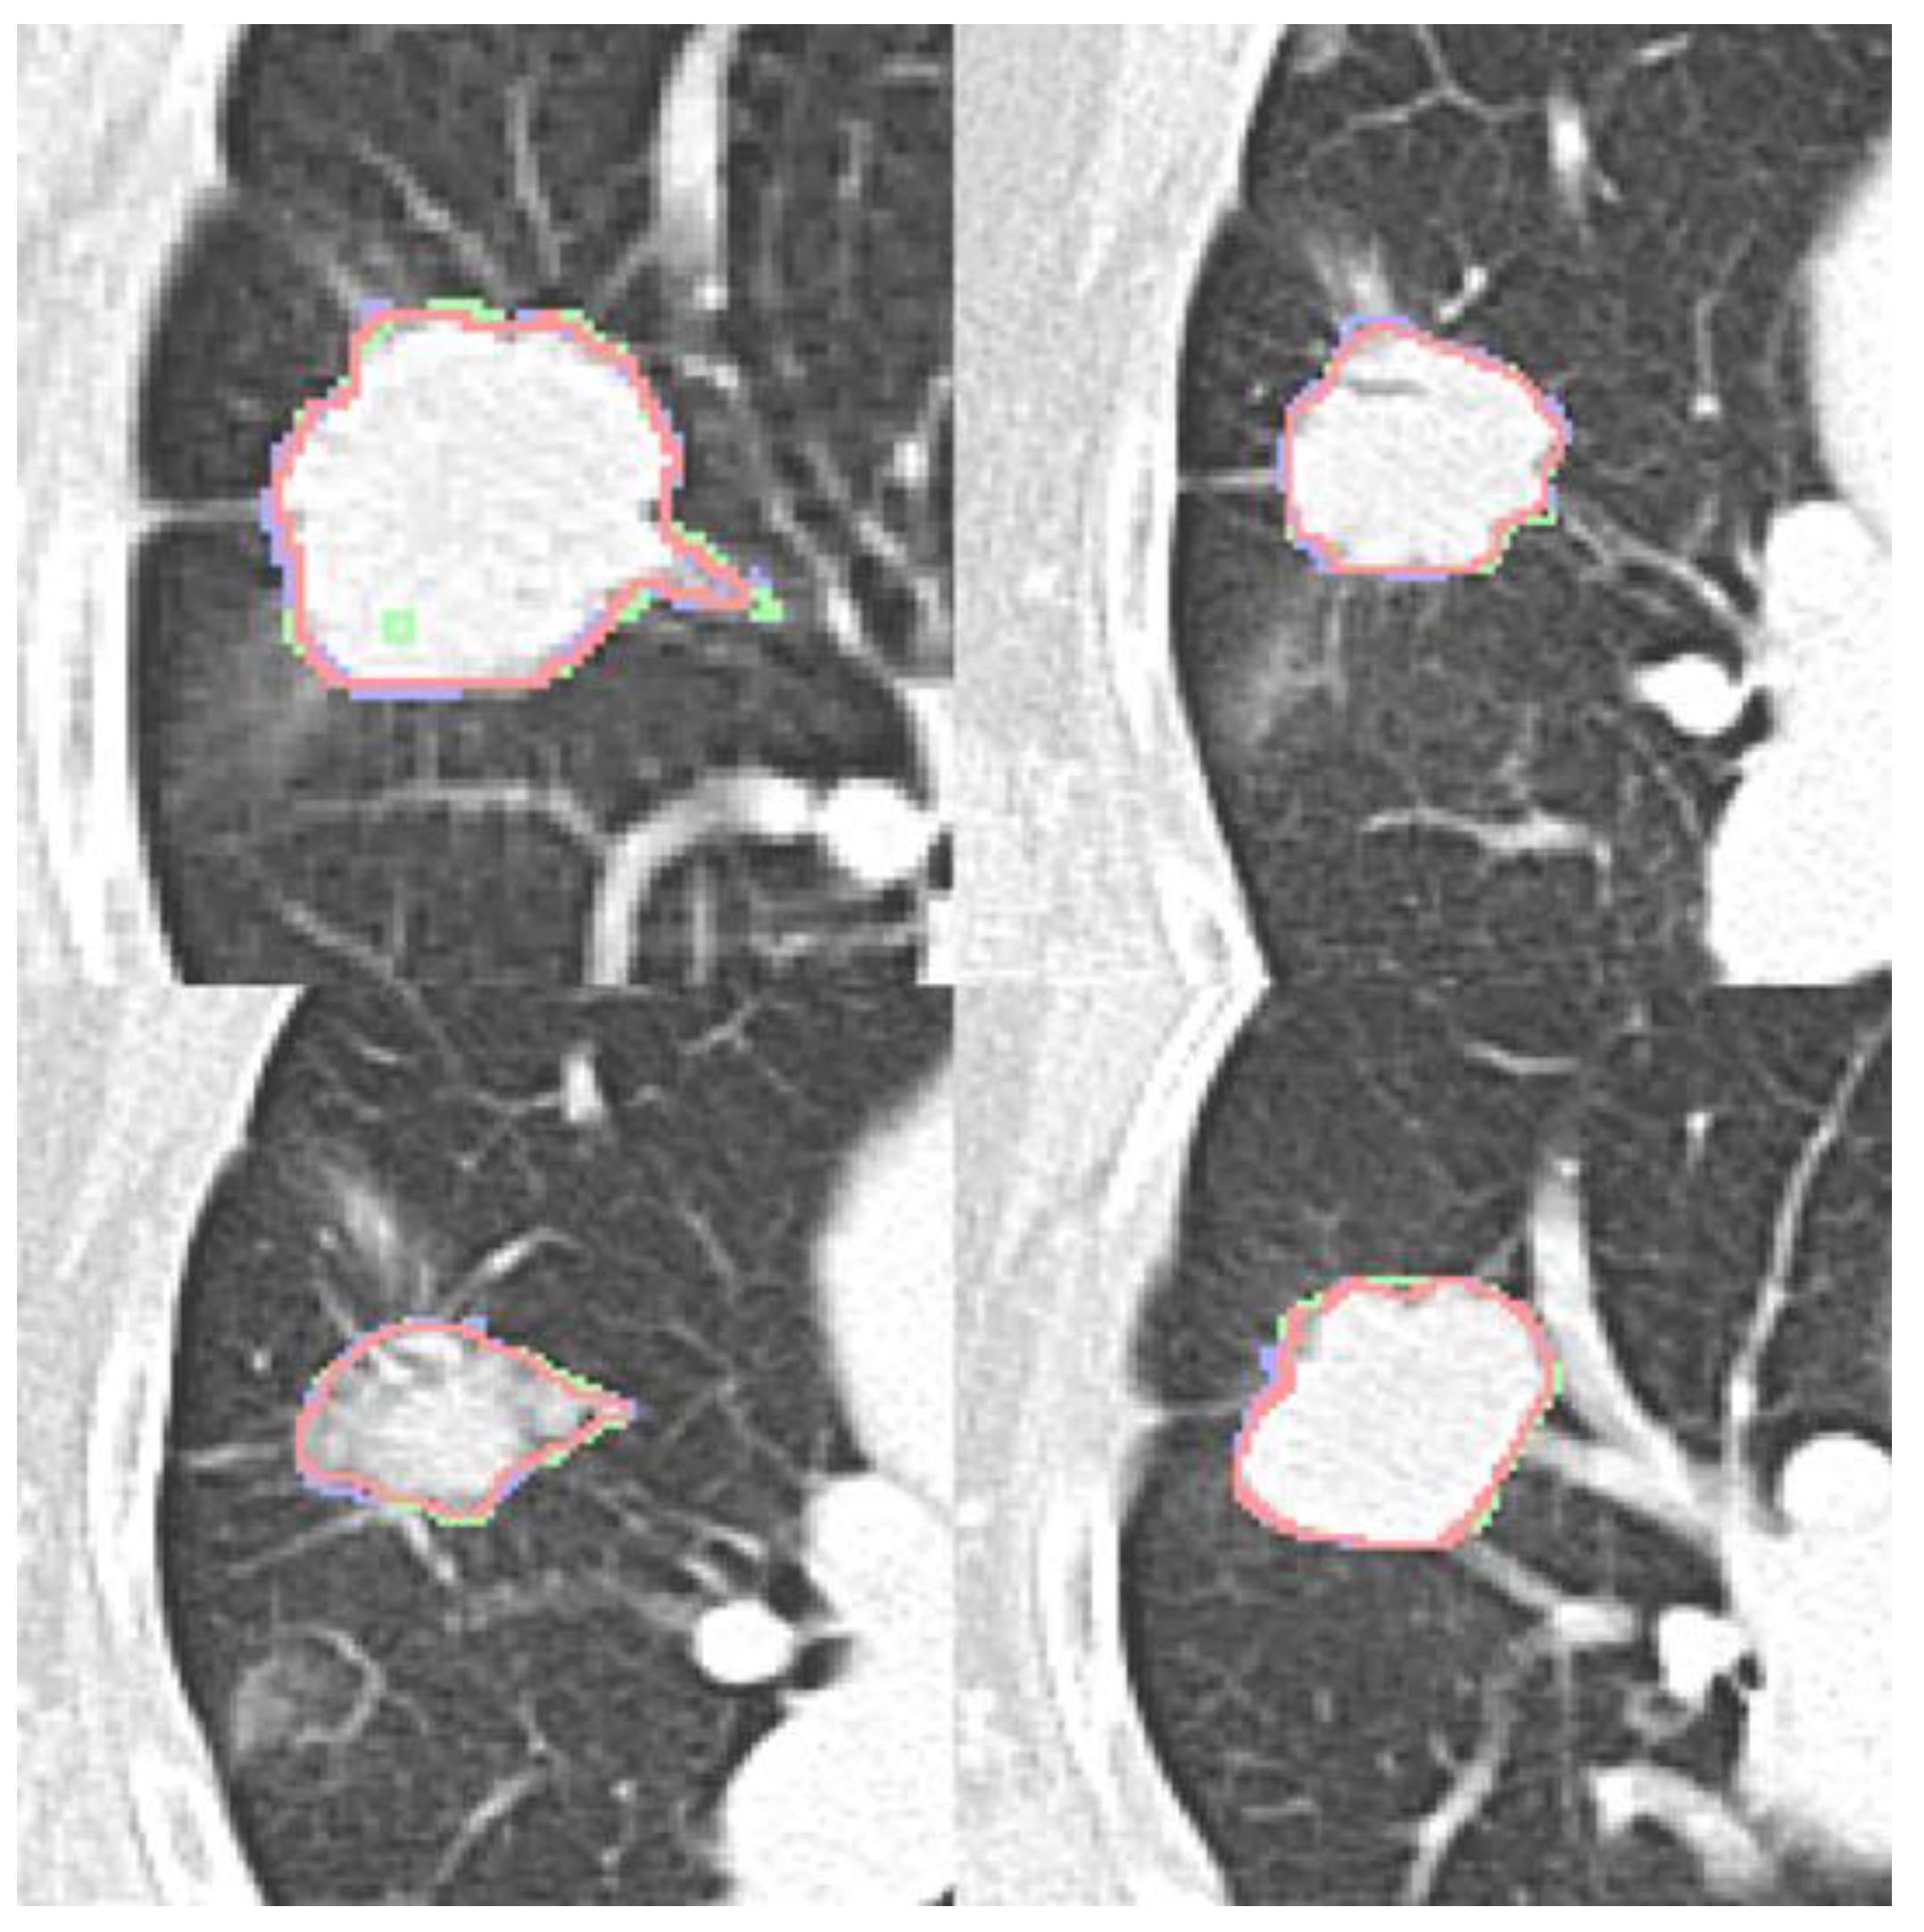
Figure 4.
Features selected by LightGBM and their corresponding importance to nodule malignancy classification.
Figure 4.
Features selected by LightGBM and their corresponding importance to nodule malignancy classification.
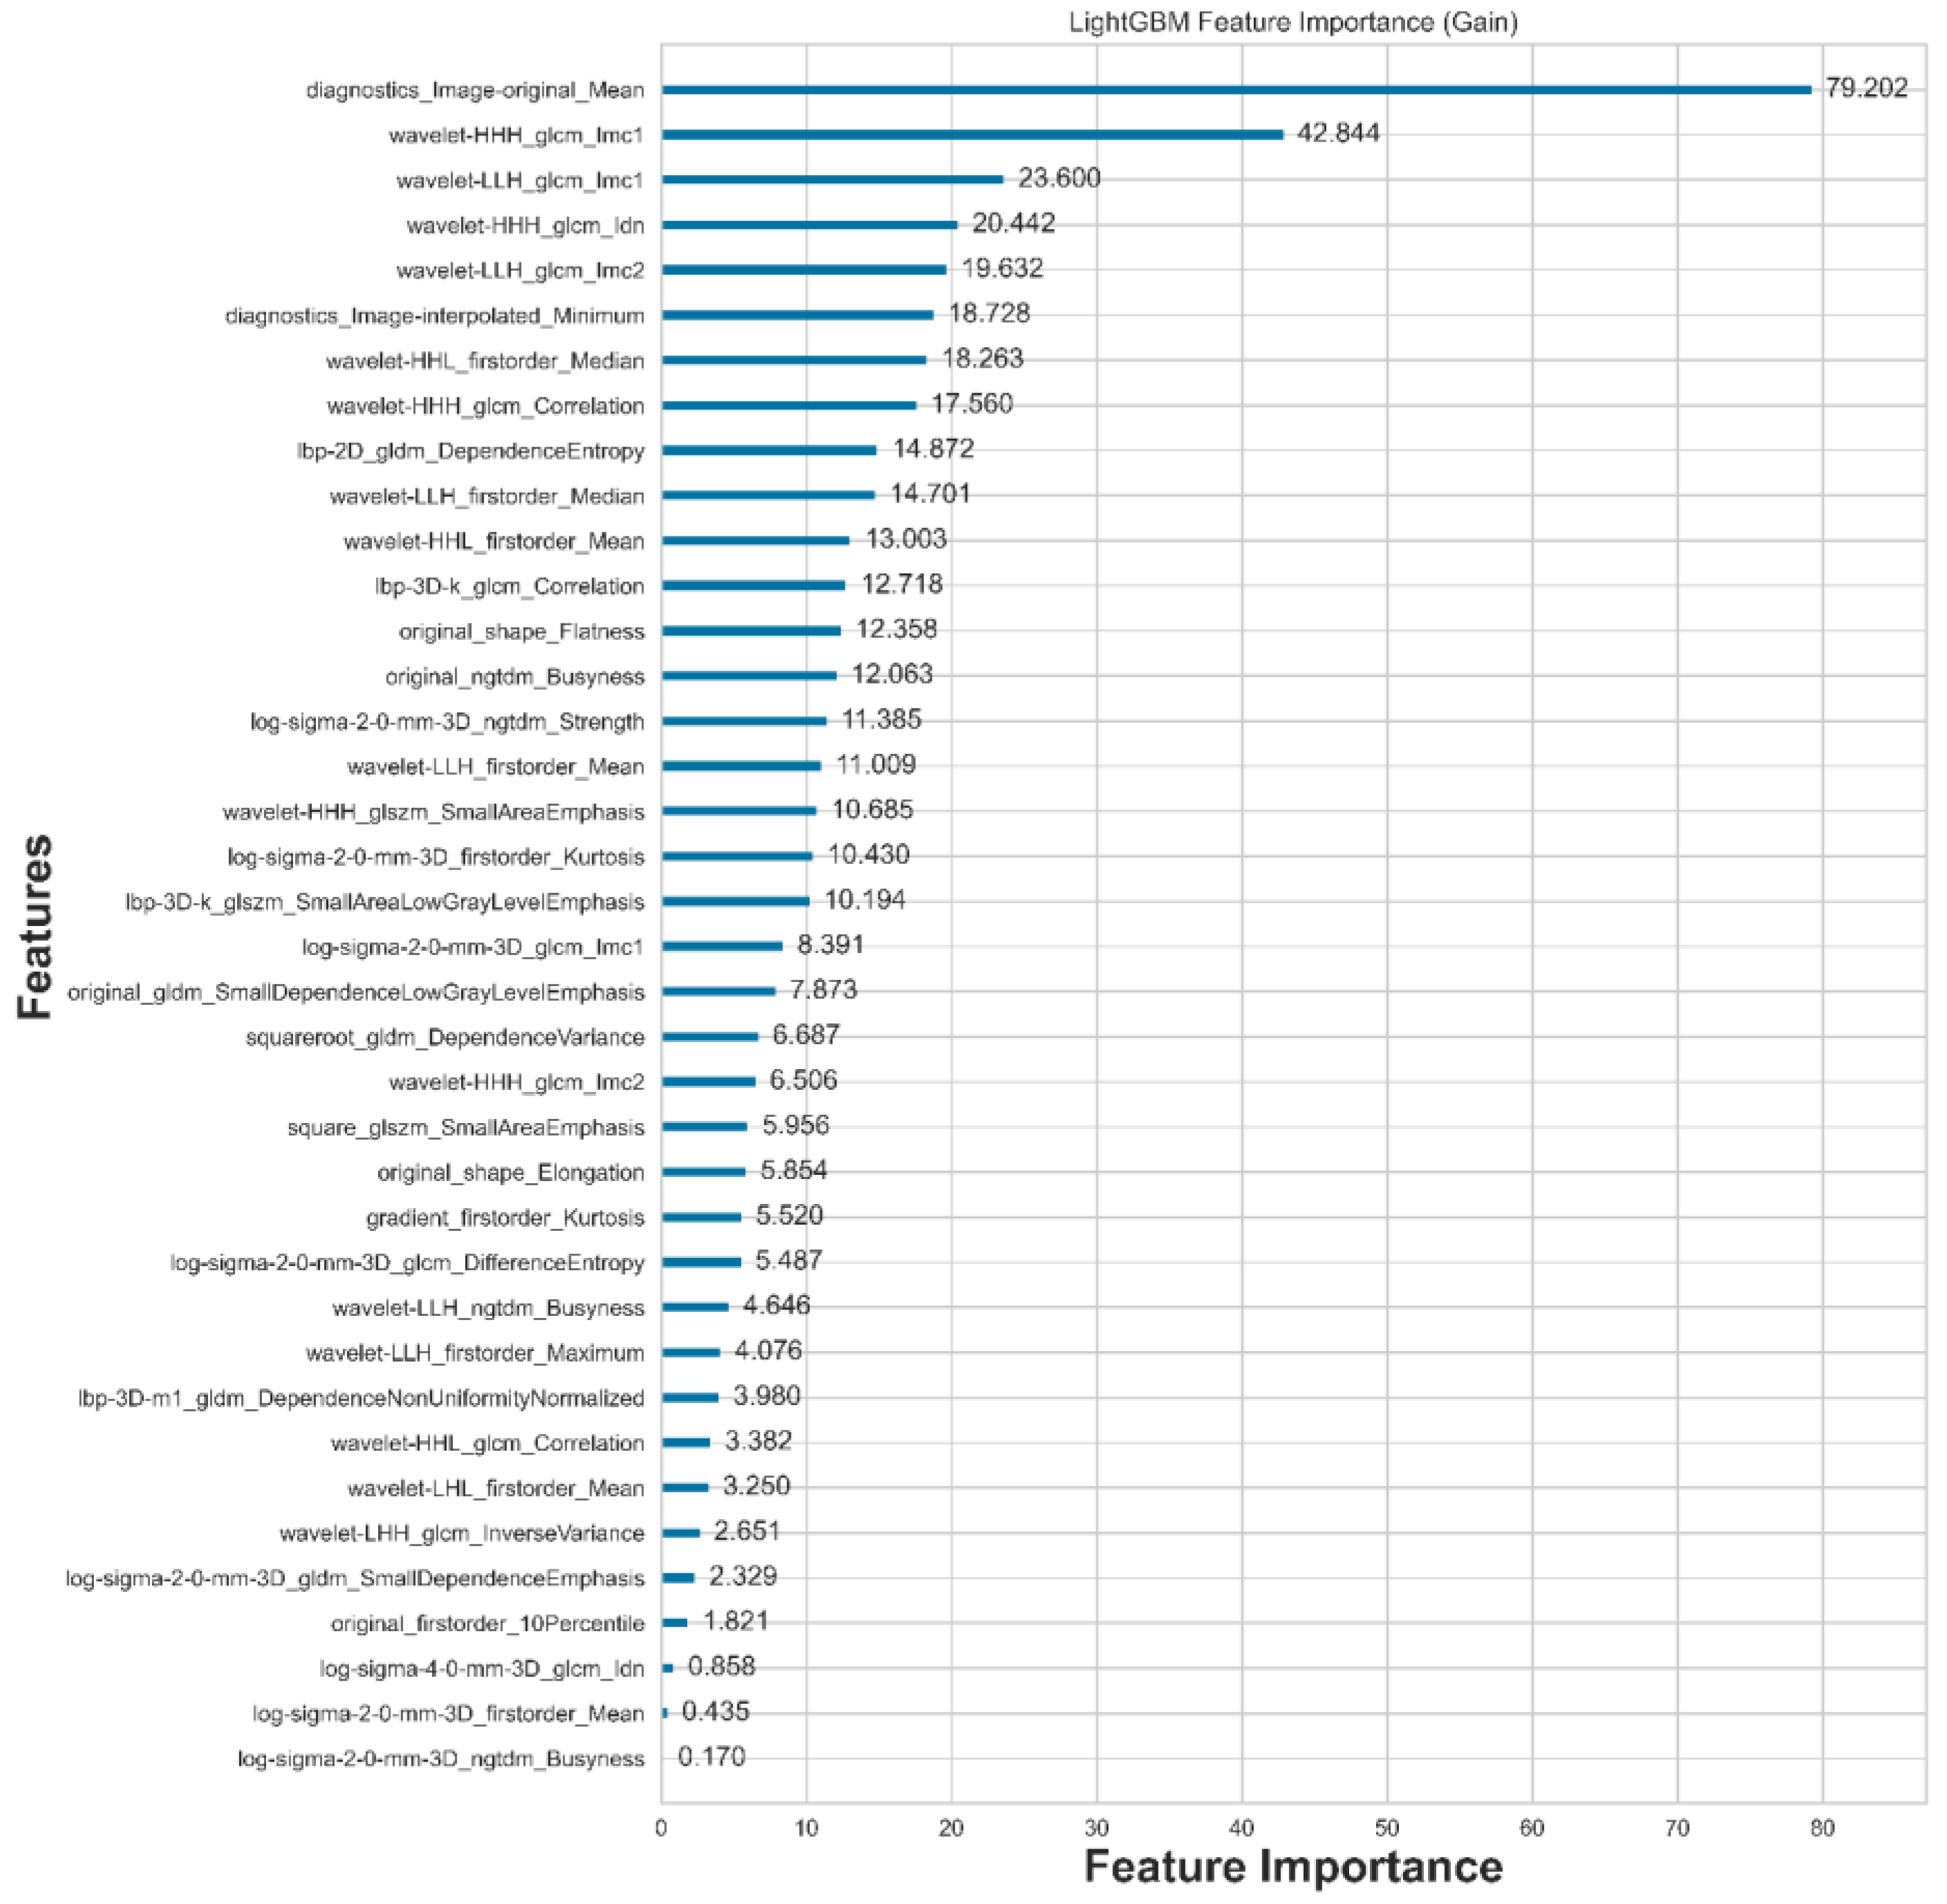
Figure 5.
The performance of six classifiers. CatBoost is the top classifier in the nodule malignancy classification using the dataset (b) in this study.
Figure 5.
The performance of six classifiers. CatBoost is the top classifier in the nodule malignancy classification using the dataset (b) in this study.
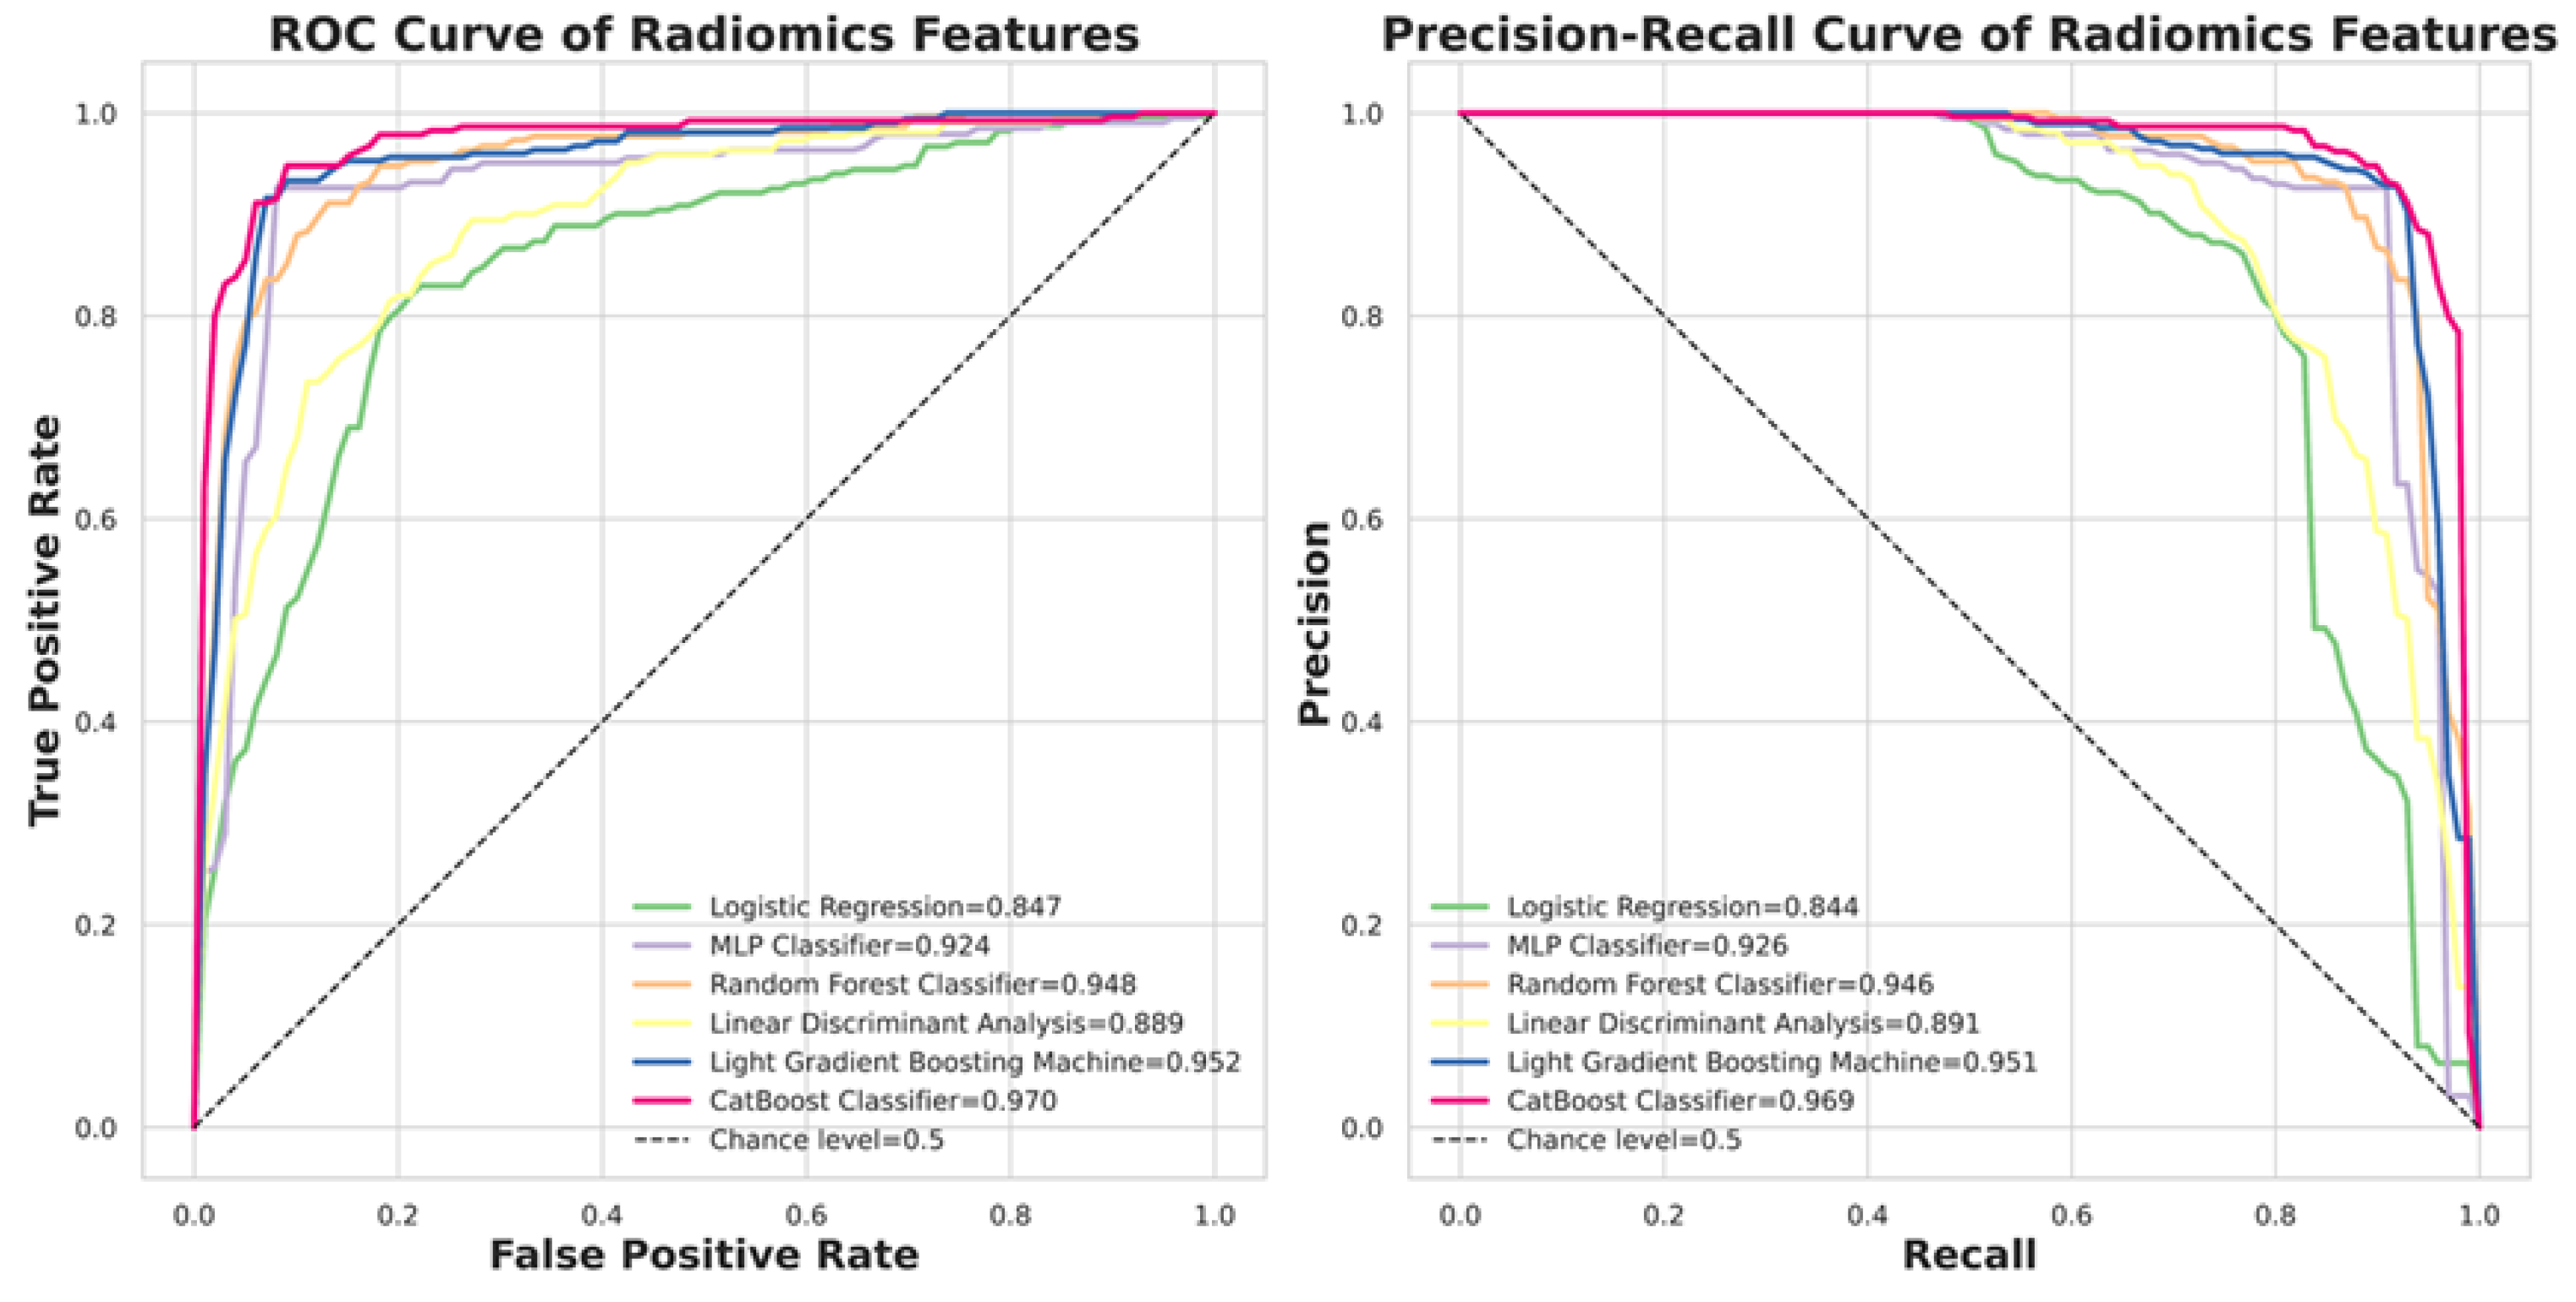
Figure 6.
: The model performance comparison between using the fused contour and using the experts’ contour.
Figure 6.
: The model performance comparison between using the fused contour and using the experts’ contour.
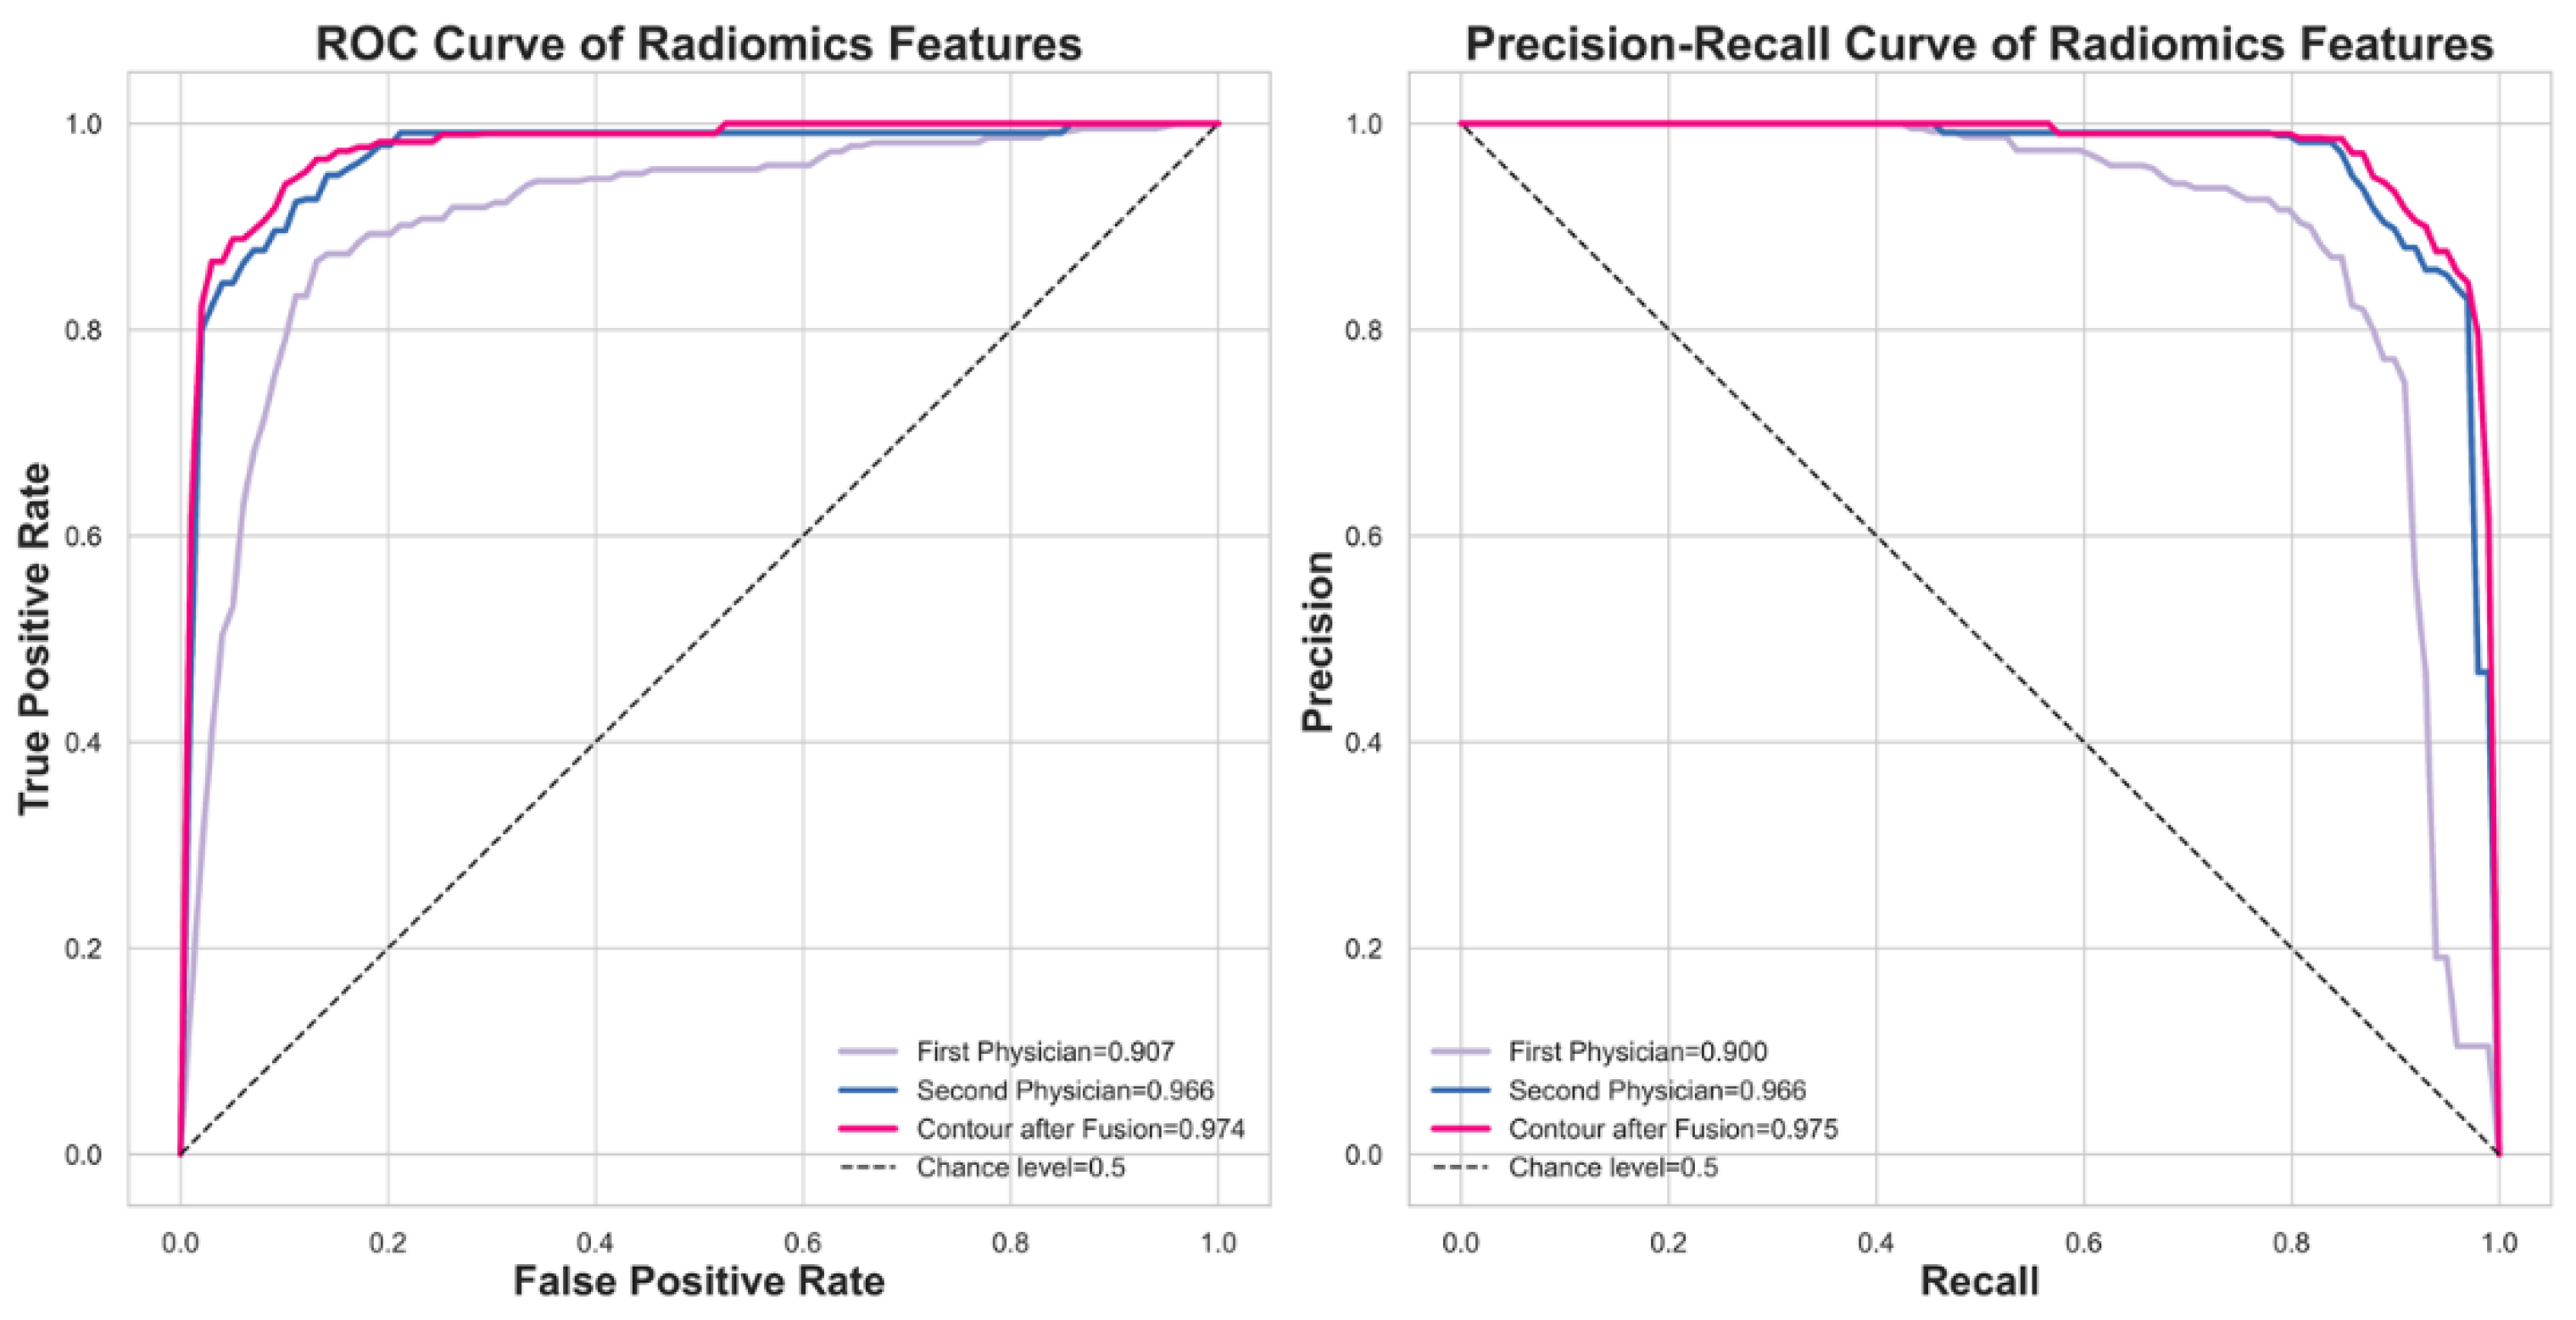
Figure 7.
: Nine patches are flattened to a dimension of 192×192 for the 2D neural network input. The data format is uint8.
Figure 7.
: Nine patches are flattened to a dimension of 192×192 for the 2D neural network input. The data format is uint8.
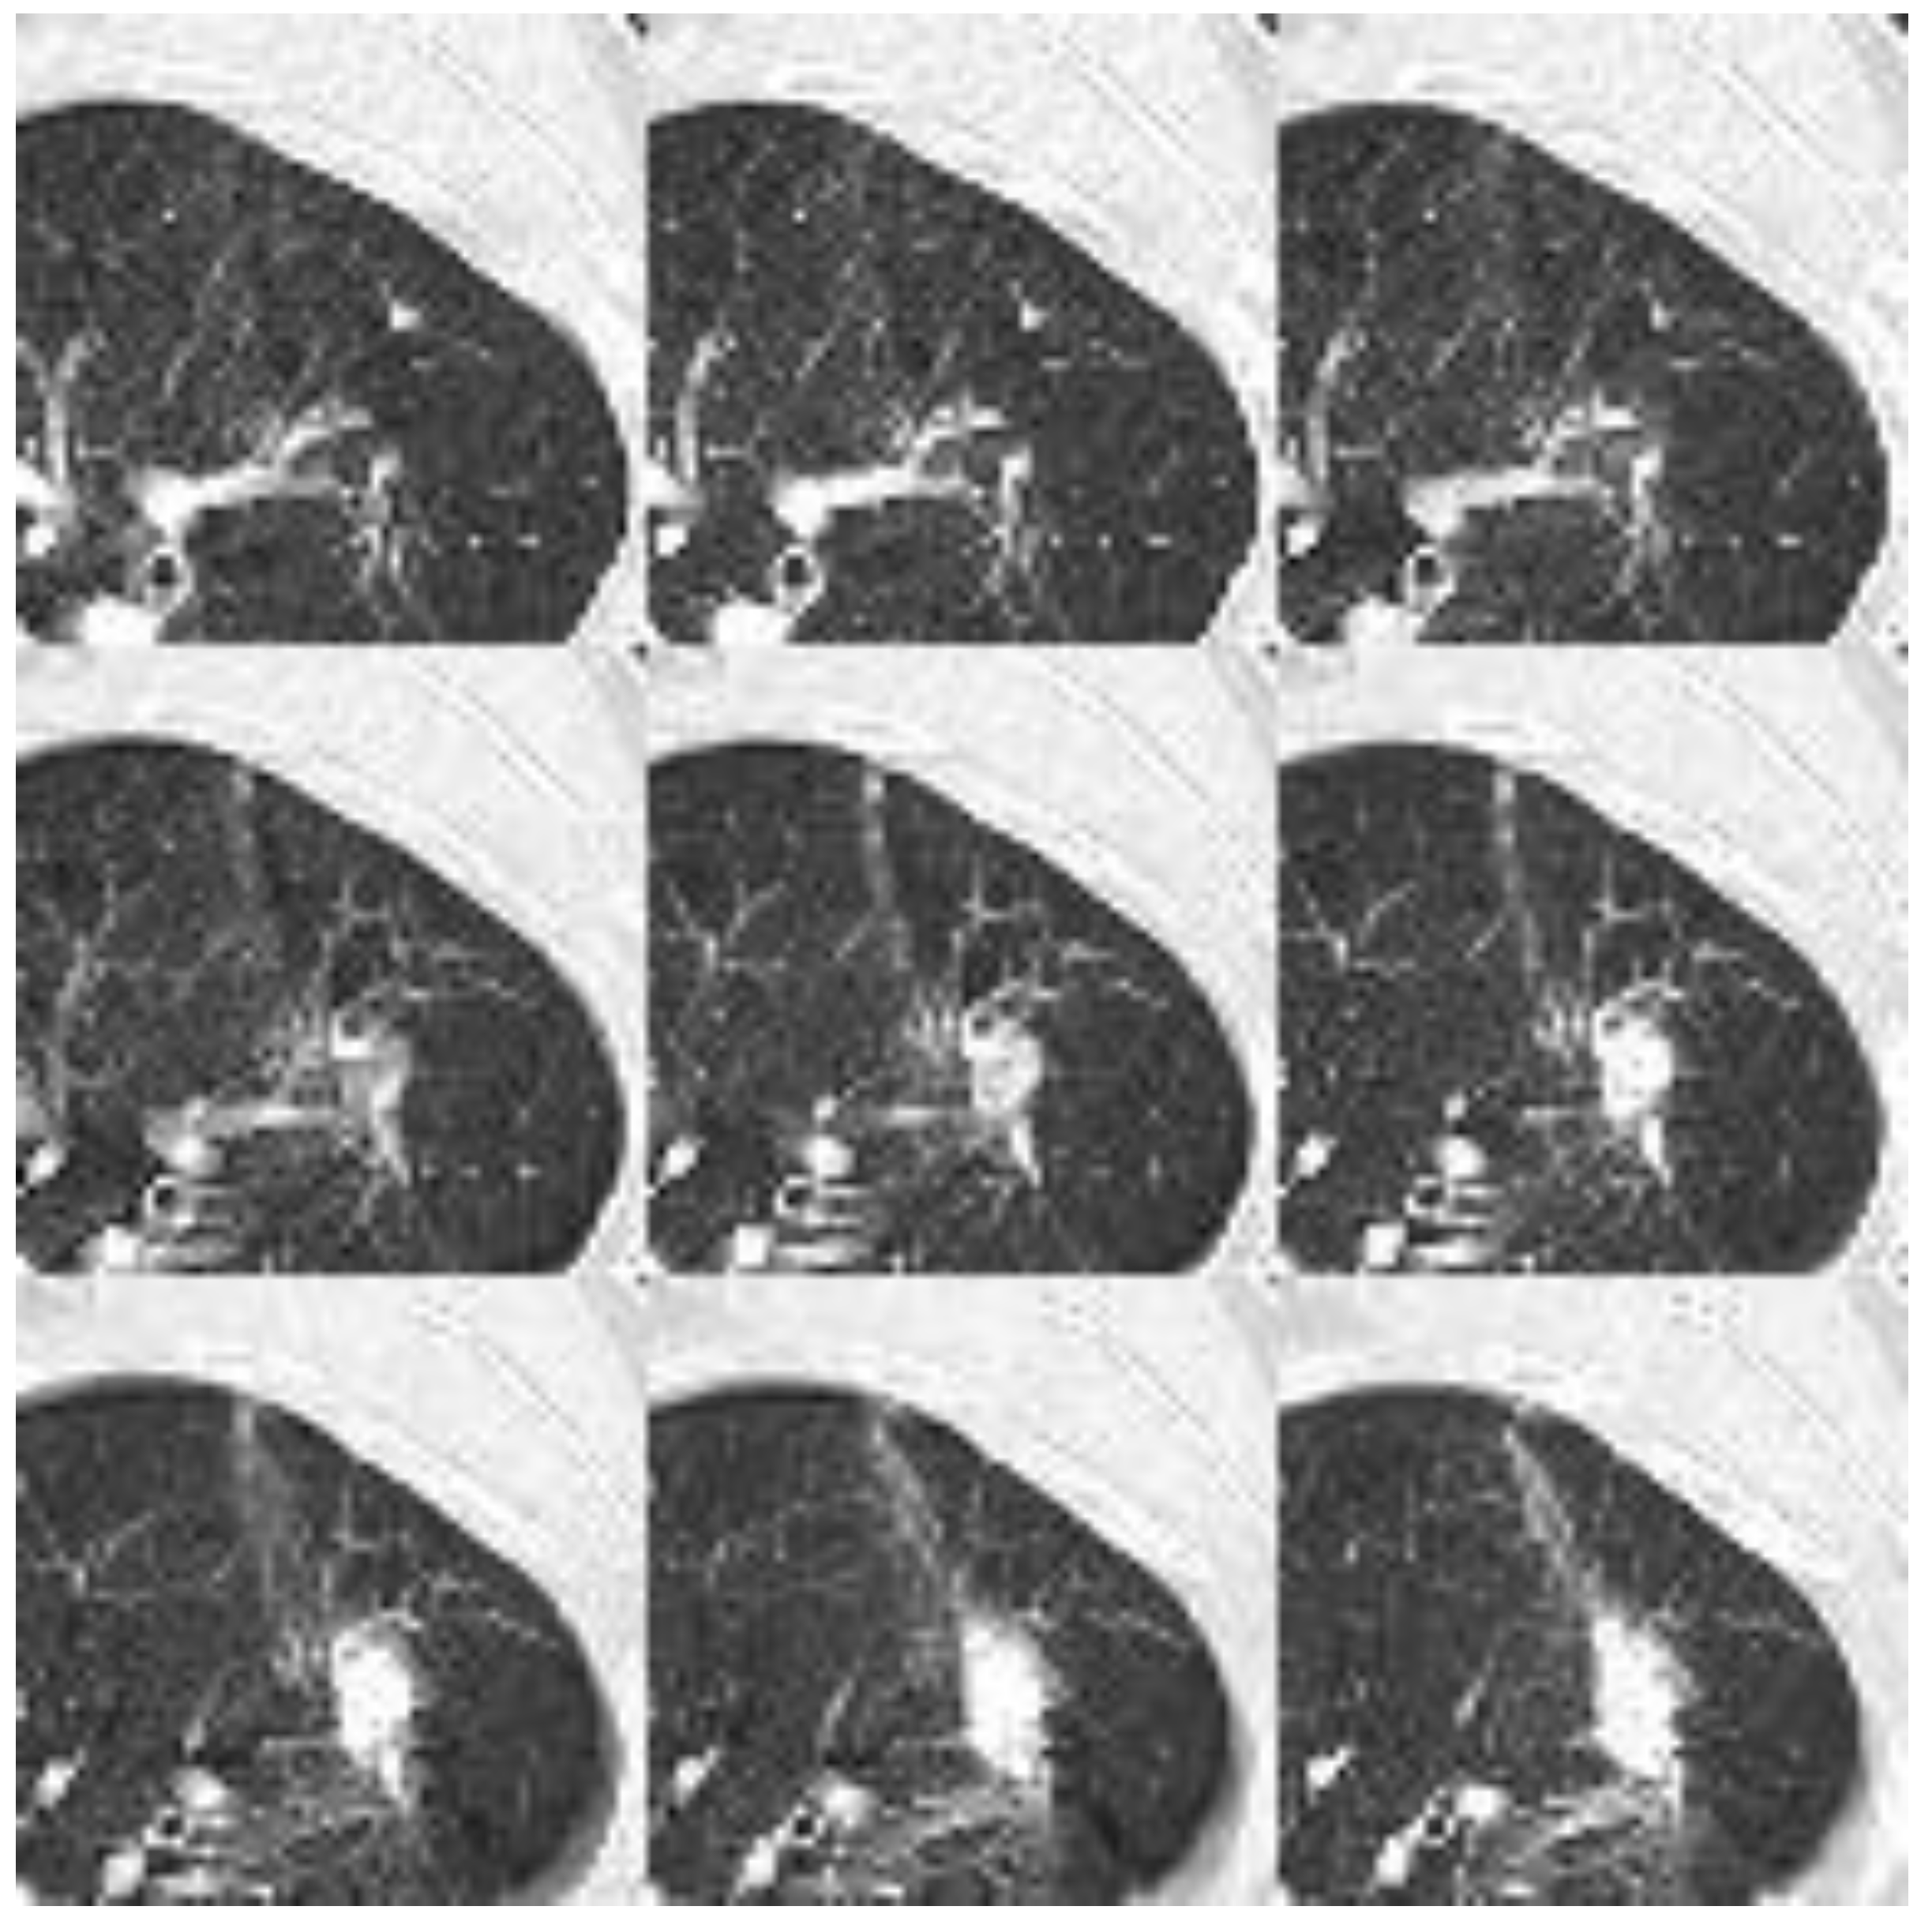
Figure 8.
: Grad-CAM results on flattened nodule patches: (a) and (b) represent correctly classified instances, while (c) and (d) indicate misclassified cases.
Figure 8.
: Grad-CAM results on flattened nodule patches: (a) and (b) represent correctly classified instances, while (c) and (d) indicate misclassified cases.
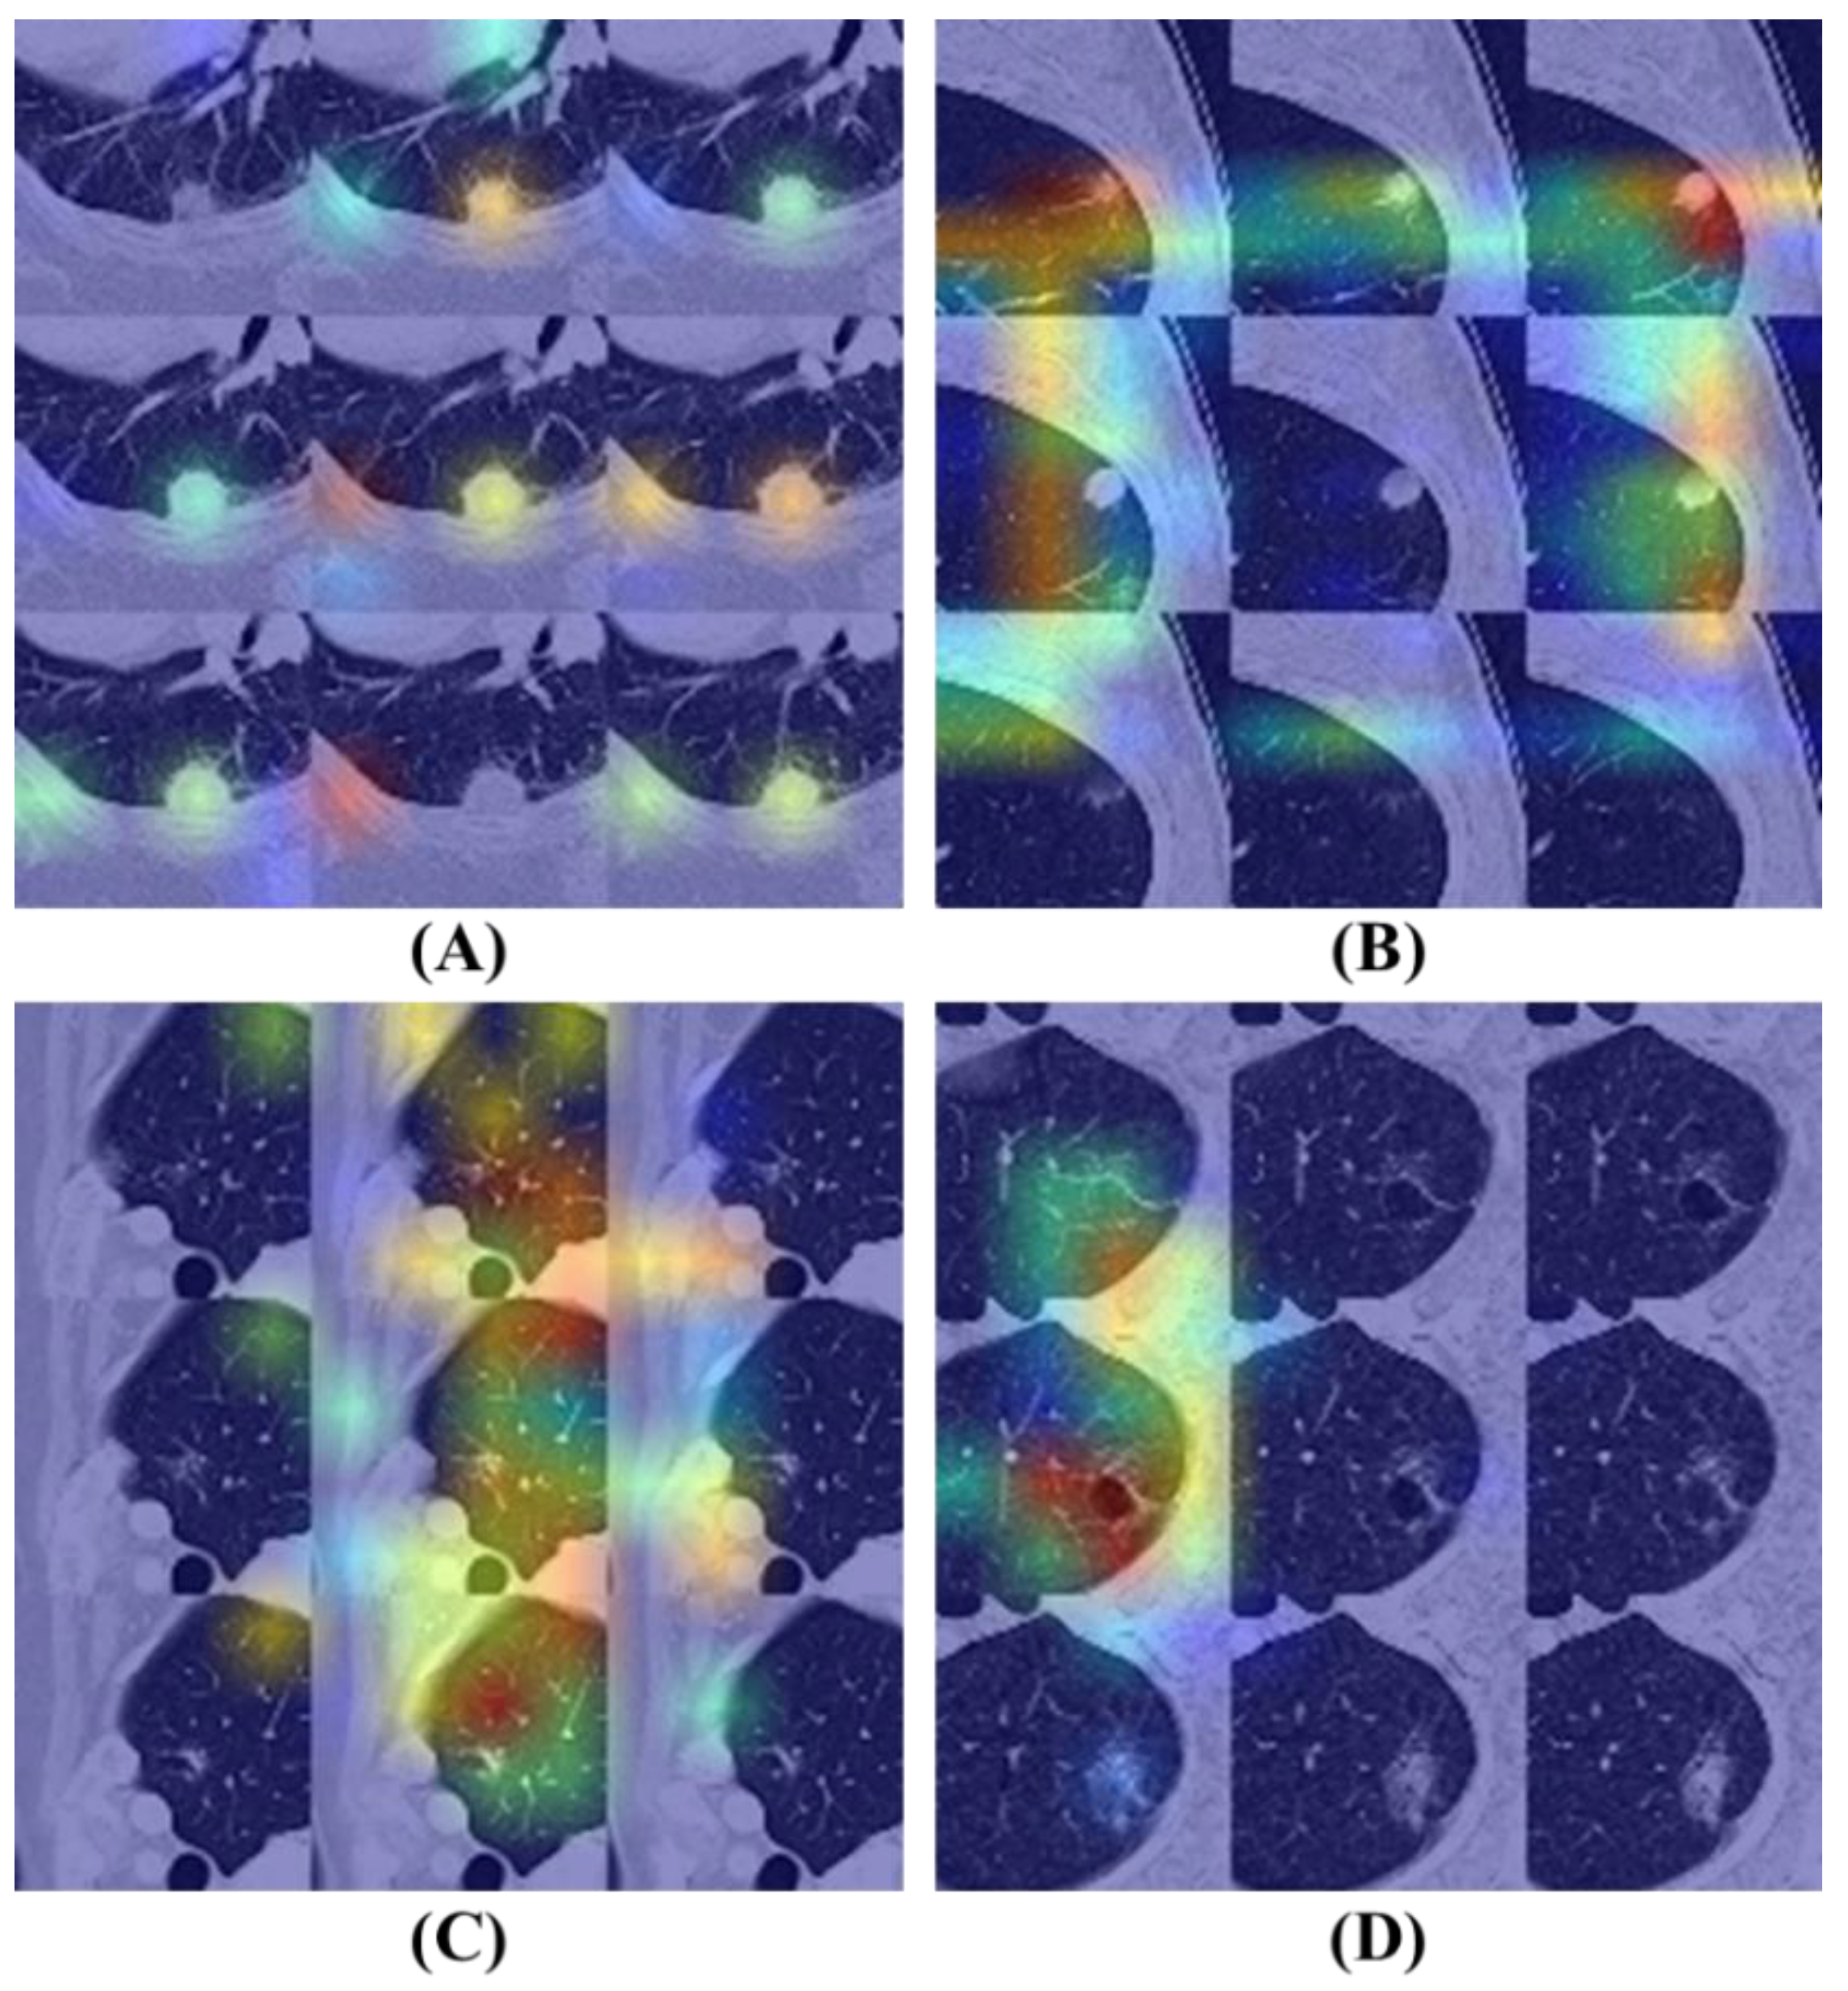
Figure 9.
: Nodule Diameter Distribution as Percentage by Source.
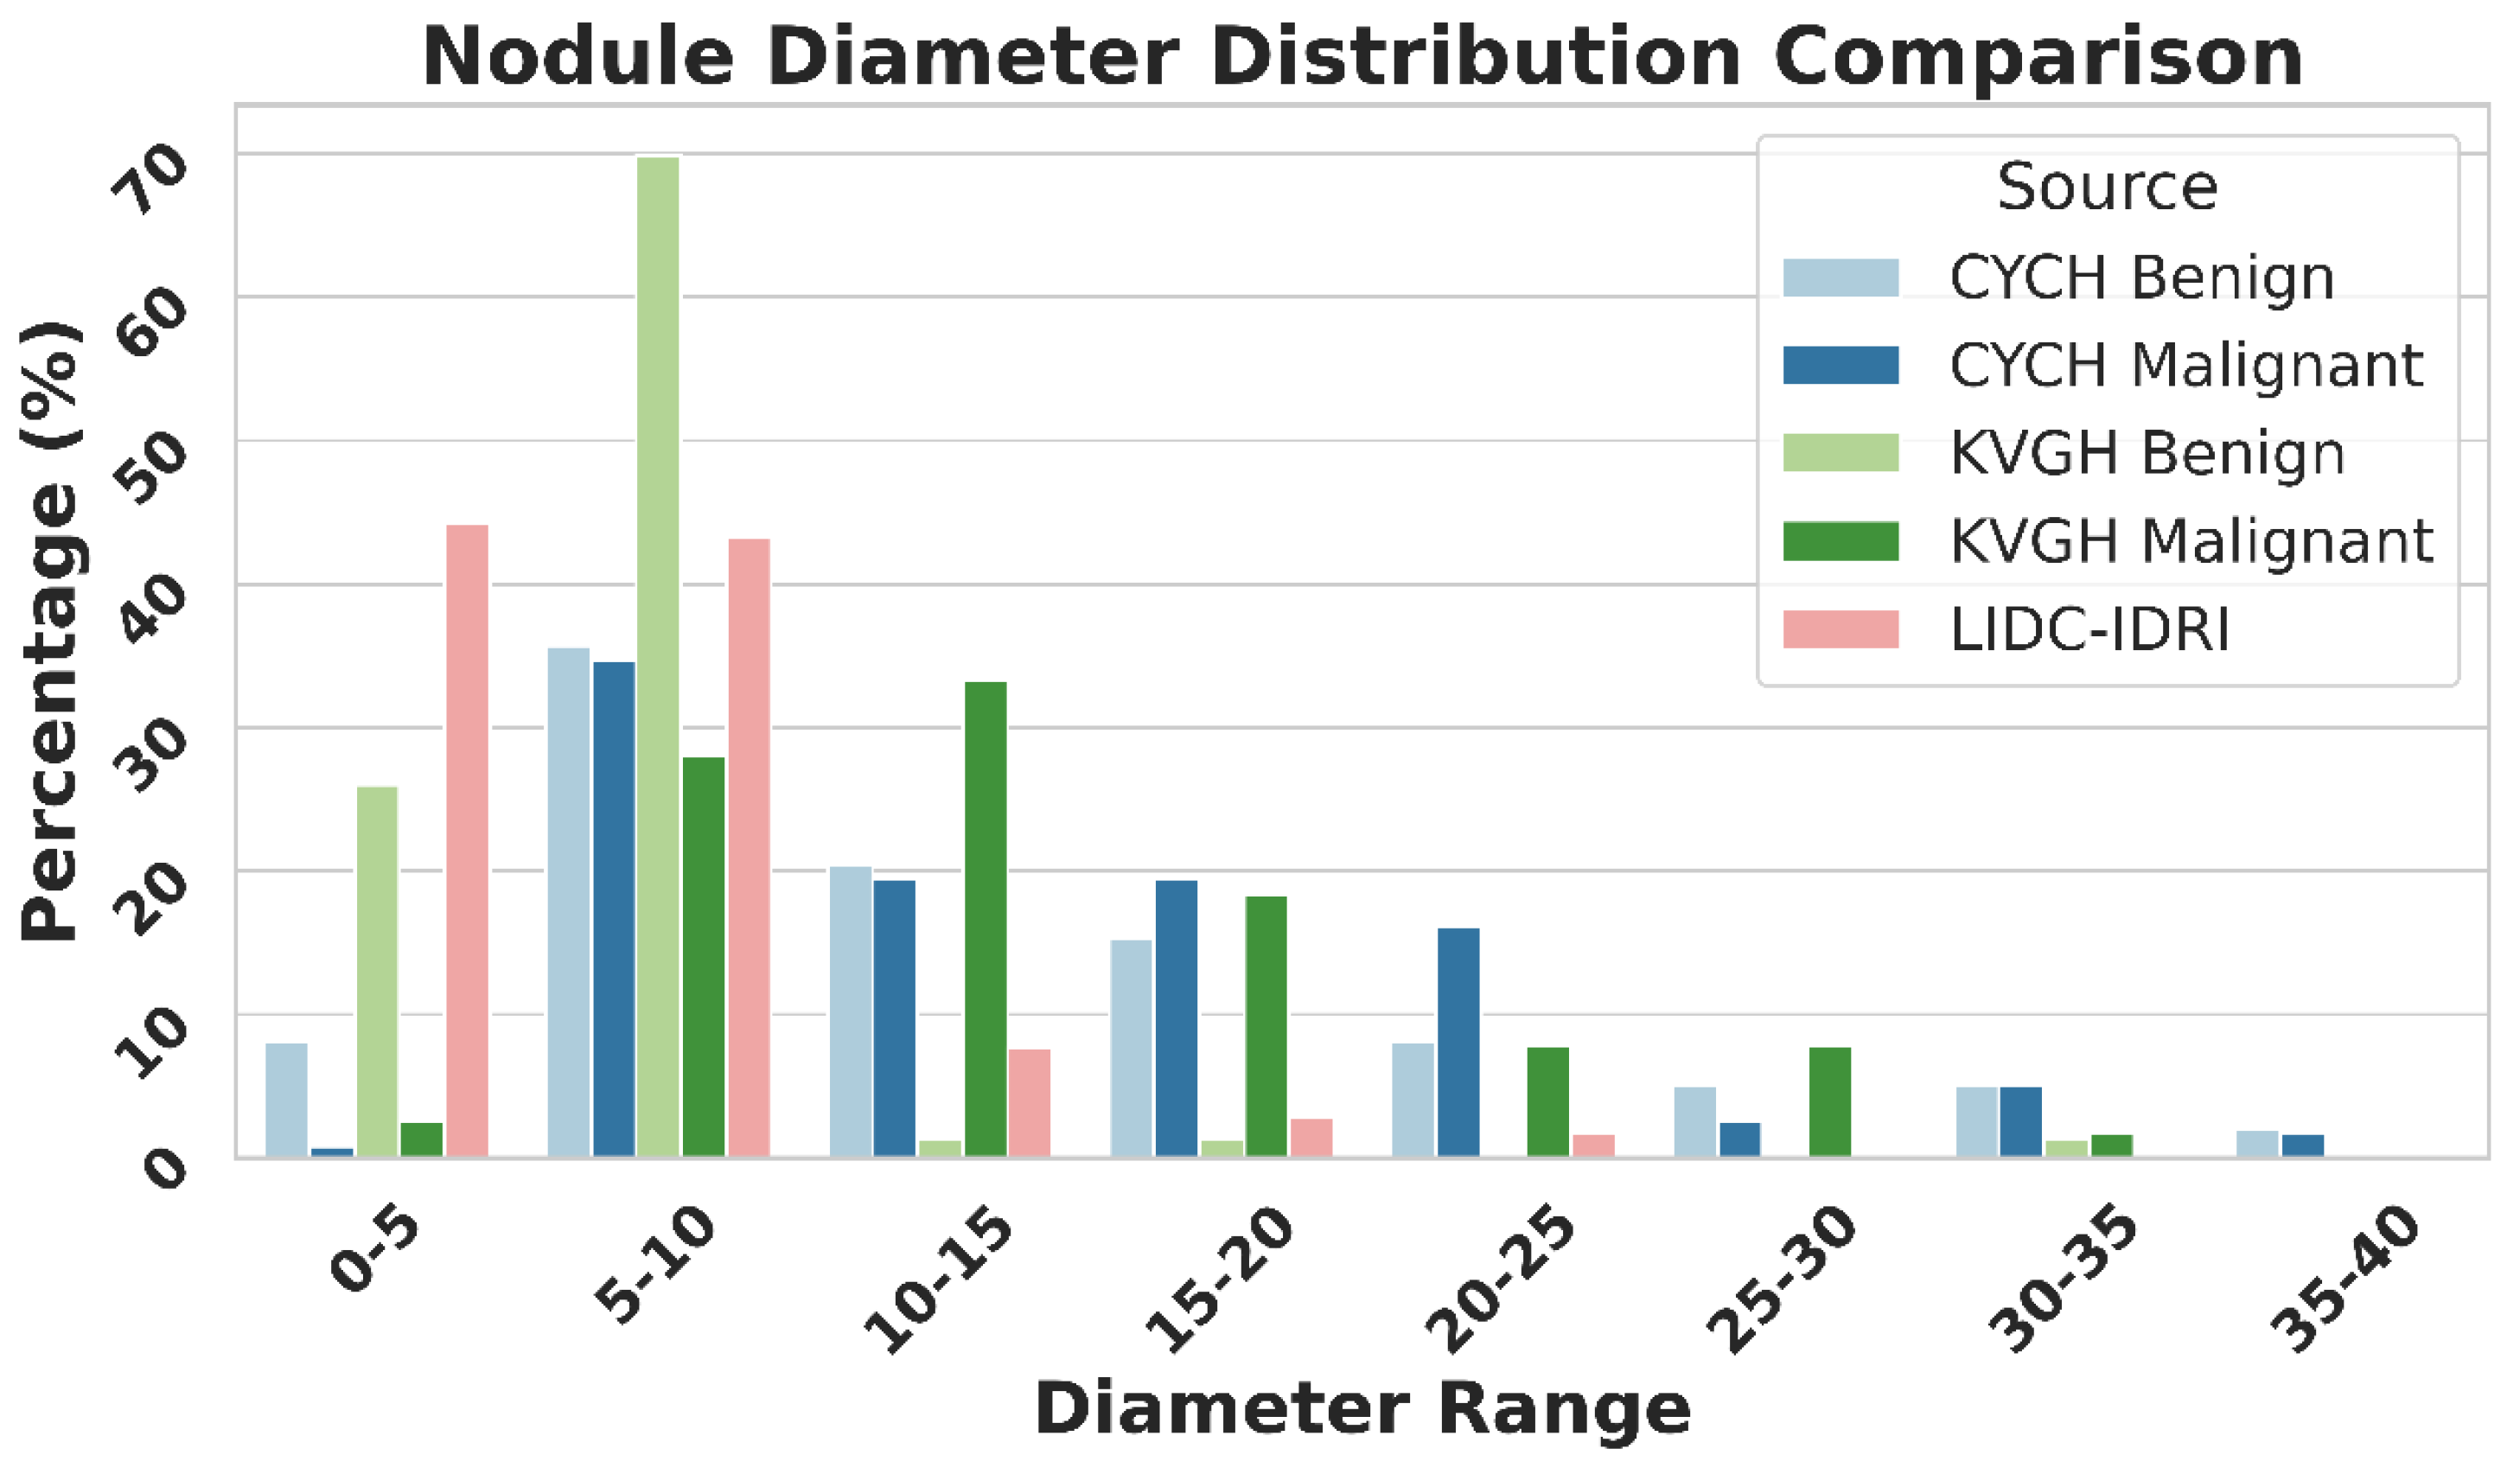

Table 1.
Summary of Studies Utilizing the LIDC-IDRI Dataset for Predictive Modeling of Nodule Malignancy.
Table 1.
Summary of Studies Utilizing the LIDC-IDRI Dataset for Predictive Modeling of Nodule Malignancy.
| Methodology | Accuracy | Sensitivity | Precision | F1-Score | AUC |
|---|---|---|---|---|---|
| Kang et al. 2017 (12) | - | 0.984 | - | - | 0.990 |
| Dey et al. 2018 (15) | 0.904 | - | - | - | 0.954 |
| Mehta et al. 2021 (16) | - | - | - | - | 0.939 |
| Saihood et al. 2022 (14) | 0.987 | 0.984 | - | - | - |
| Halder et al. 2022 (13) | 0.961 | 0.968 | - | - | 0.993 |
Table 2.
: 11 features LASSO [20] selected appear in the current study and their corresponding ranks.
Table 2.
: 11 features LASSO [20] selected appear in the current study and their corresponding ranks.
| Feature Name | Type | Rank |
|---|---|---|
| original_gldm_SmallDependenceLowGrayLevelEmphasis | Texture | Rank 21 |
| log-sigma-2-0-mm-3D_glcm_DifferenceEntropy | Texture | Rank 27 |
| log-sigma-2-0-mm-3D_gldm_SmallDependenceEmphasis | Texture | Rank 34 |
| log-sigma-3-0-mm-3D_glszm_ZonePercentage | Texture | X |
| lbp-2D_gldm_DependenceNonUniformityNormalized | Texture | X |
| lbp-3D-m1_gldm_DependenceNonUniformityNormalized | Texture | Rank 30 |
| lbp-3D-m2_gldm_DependenceNonUniformityNormalized | Texture | X |
| log-sigma-2-0-mm-3D_firstorder_Mean | First-order | Rank 37 |
| lbp-3D-m1_firstorder_Skewness | First-order | X |
| wavelet-LLH_firstorder_Mean | First-order | Rank 16 |
| wavelet-LHL_firstorder_Mean | First-order | Rank 32 |
| Where X means there is no match. | ||
Table 3.
Models performance using different evaluation metrics.
| Accuracy | Sensitivity | Precision | F1-Score | ROCAUC | |
|---|---|---|---|---|---|
| LR | 0.802 | 0.795 | 0.810 | 0.797 | 0.847 |
| RF | 0.887 | 0.887 | 0.886 | 0.887 | 0.949 |
| LDA | 0.817 | 0.811 | 0.823 | 0.813 | 0.890 |
| MLP | 0.907 | 0.906 | 0.908 | 0.907 | 0.924 |
| LightGBM | 0.919 | 0.919 | 0.918 | 0.919 | 0.953 |
| Catboost | 0.926 | 0.925 | 0.927 | 0.926 | 0.968 |
LR: Logistic Regression, RF: Random Forest, LDA: Linear Discriminant Analysis. Ten-fold cross-validation.
Table 4.
Comparison of NN Models’ performance using different evaluation metrics.
| Accuracy | Sensitivity | Precision | F1 Score | ROCAUC | |
|---|---|---|---|---|---|
| EVA02 | 0.531 | 0.778 | 0.550 | 0.645 | 0.607 |
| VGG16 | 0.924 | 0.973 | 0.897 | 0.934 | 0.950 |
| InceptionNet | 0.924 | 0.918 | 0.944 | 0.939 | 0.967 |
| Meta Transformer | 0.956 | 0.918 | 1.000 | 0.957 | 0.977 |
| LeViT | 0.924 | 0.861 | 1.000 | 0.926 | 0.978 |
| ResNet101 | 0.940 | 0.973 | 0.921 | 0.946 | 0.981 |
| Swin Transformer V2 | 0.955 | 0.944 | 0.972 | 0.959 | 0.989 |
| DINAT | 0.985 | 0.973 | 1.000 | 0.986 | 0.992 |
| Wave-MLP | 0.985 | 0.972 | 1.000 | 0.986 | 0.995 |
| ConvNeXt | 0.955 | 0.917 | 1.000 | 0.957 | 0.997 |
| VOLO | 0.939 | 1.000 | 0.900 | 0.947 | 0.998 |
| 3D ResNet101 * | 0.985 | 0.972 | 1.000 | 0.986 | 0.998 |
| DaViT | 0.985 | 0.972 | 1.000 | 0.986 | 0.999 |
| BEIT v2 | 0.985 | 0.972 | 1.000 | 0.986 | 0.999 |
Ten-fold cross-validation. * Only 3D ResNet101 has 3D patches input, the rest models have 2D patches input.
Table 5.
Performance comparison of the proposed models with other models published in recent years.
| Accuracy | Sensitivity | Precision | F1-Score | AUC | |
|---|---|---|---|---|---|
| Kang et al. 2017 | - | 0.984 | - | - | 0.990 |
| Dey et al. 2018 | 0.904 | - | - | - | 0.954 |
| Mehta et al. 2021 | - | - | - | - | 0.939 |
| Saihood et al. 2022 | 0.987 | 0.984 | - | - | - |
| Halder et al. 2022 | 0.961 | 0.968 | - | - | 0.993 |
| Hsiao et al. 2023 | 0.959 | 0.961 | 0.963 | 0.961 | 0.985 |
| CatBoost (ours) | 0.926 | 0.925 | 0.927 | 0.926 | 0.968 |
| 3D ResNet101 (ours) | 0.985 | 0.972 | 1.000 | 0.986 | 0.998 |
| DaViT (ours) | 0.985 | 0.972 | 1.000 | 0.986 | 0.999 |
| BEIT v2 (ours) | 0.985 | 0.972 | 1.000 | 0.986 | 0.999 |
Disclaimer/Publisher’s Note: The statements, opinions and data contained in all publications are solely those of the individual author(s) and contributor(s) and not of MDPI and/or the editor(s). MDPI and/or the editor(s) disclaim responsibility for any injury to people or property resulting from any ideas, methods, instructions or products referred to in the content. |
© 2025 by the authors. Licensee MDPI, Basel, Switzerland. This article is an open access article distributed under the terms and conditions of the Creative Commons Attribution (CC BY) license (http://creativecommons.org/licenses/by/4.0/).
Copyright: This open access article is published under a Creative Commons CC BY 4.0 license, which permit the free download, distribution, and reuse, provided that the author and preprint are cited in any reuse.


