Submitted:
15 November 2025
Posted:
18 November 2025
You are already at the latest version
Abstract
We have investigated the major- and trace-element composition of hydrothermal pyrite, magnetite, and titanomagnetite, and of the principal Cu-minerals chalcopy-rite and chalcocite, to constrain ore-forming processes in the northeastern Saveh district (central Urumieh–Dokhtar magmatic arc, Iran). Our data provide new con-straints on the magmatic–hydrothermal evolution and subsequent hydrothermal–supergene modification of the ore system. Titanomagnetites hosted in shallow monzo-dioritic intrusions are enriched in Ti–V–Al, plot below the magnetite–ulvöspinel join and record high crystallization temperatures (< ~500 °C) under rela-tively low oxygen fugacity. By contrast, magnetites from silica-rich hydrothermal veins are relatively Fe-rich, have very low TiO₂, formed at intermediate tempera-tures (~200–300 °C) under higher fO₂, and show pronounced depletion in Ti and V relative to monzo-dioritic oxides. Textures and oxide systematics (Al+Mn vs Ti+V; V/Ti–Fe) document repeated hydrothermal pulses, Fe²⁺ leaching and element redis-tribution during cooling and fluid–rock interaction. Geochemical trends indicate progressive evolution from a magmatic fluid to later meteoric water overprint, with decreasing As contents reflecting mixing with oxidizing meteoric waters. Vertical elemental zoning suggests that most samples represent mid- to deep-level sections of the epithermal system. Elevated Cu contents (up to 0.95 wt.%) highlight pyrite as a significant Cu host. Co/Ni ratios between 1 and 10 further corroborate a magmatic–hydrothermal origin. Chalcopyrite is the principal economic Cu carrier at Northeast Saveh. Replacement follows a temperature- and fluid-controlled pathway (chalco-pyrite → covellite → chalcocite/digenite). At lower temperatures (< ~200 °C) re-placement proceeds more slowly, producing chalcocite/digenite under prolonged reaction conditions. Chalcocite commonly occurs as thin replacement rims and fracture fills that concentrate remobilized copper. Collectively, the investigated oxide and sulfide proxies provide robust discriminants for separating magmatic versus hydrothermal domains and for vectoring toward higher-temperature feeders and zones of remobilized copper.
Keywords:
Urumieh–Dokhtar magmatic arc
; geochemistry
; U-Pb geochronology
; Lu-Hf isotopes
; mineral chemistry
; multi-stage magmatism
1. Introduction
The behavior and concentration of trace elements in sulfides/oxides, such as pyrite, chalcopyrite, chalcocite, magnetite, and titanomagnetite, within porphyry and epithermal systems are influenced by several factors, including the composition of mineralizing fluids, physicochemical conditions, and the stability of host sulfide and oxide minerals [1]. Variations in these factors often lead to significant changes in the trace element contents of these minerals, which serve as vital indicators of fluid evolution and ore formation processes.
Pyrite is the most abundant sulfide in the Earth's crust and a key host for trace elements in magmatic-hydrothermal systems [2,3]. Its chemical composition reflects conditions such as temperature, pH, and oxygen fugacity of the mineralizing fluids and plays a critical role in controlling the distribution of economically valuable elements like Au, Ag, As, and heavy metals [4,5].Pyrite accommodates trace elements through mechanisms like lattice substitution (e.g., Co, Ni, Cu, As) and the incorporation of nanoparticles or micro-scale inclusions [3,6]. These features make pyrite an excellent tracer for the evolution of hydrothermal systems.
On the other hand, chalcopyrite (CuFeS₂) is the most abundant copper sulfide, contributing to about 70% of global copper production [7]. Its trace element composition varies widely depending on deposit type, reflecting the physicochemical environment during mineralization [8]. Chalcopyrite often coexists with other sulfides, such as chalcocite and bornite, and serves as a primary host for elements like Ag, Bi, Cd, Zn, and Sb. However, its trace element capacity may increase in the absence of other sulfides, making it a valuable tool for understanding ore-forming processes [5,8,9,10].
As well, magnetite (Fe₃O₄) and titanomagnetite are ubiquitous in igneous and hydrothermal systems and serve as valuable indicators of mineralization. Magnetite, with its spinel structure, incorporates a range of trace elements that reflect the conditions of fluid or magma evolution [11,12,13]. Both magnetite and titanomagnetite form solid solutions with other spinel-group minerals, and their chemistry has been widely used to reconstruct physicochemical parameters such as temperature, oxygen fugacity, and sulfur fugacity during ore formation [14,15].
This study integrates the geochemical investigation of sulfides (pyrite, chalcopyrite, chalcocite) and oxides (magnetite, titanomagnetite) for first time to unravel the evolution of epithermal mineralization system in Northeast Saveh, in the central Urumieh-Dokhtar magmatic arc (UDMA). The results offer new insights into the evolution of epithermal/mineralization and magmatic processes in this region, which has received limited research attention despite its significant potential for Cu-Au-Ag mineralization.
2. Geological Background
Magmatic activity in the UDMA began in the Late Cretaceous and persisted intermittently until the Miocene (Figure 1A). The subduction and subsequent rollback of the Neo-Tethys slab during this time led to significant magmatic flare-ups, especially during the Eocene-Oligocene. This period marked a critical tectonic transition from extensional to compressional regimes, which is reflected in the structural and magmatic patterns observed across the arc. The UDMA hosts diverse intrusive and extrusive igneous rocks ranging from basaltic and andesitic volcanic flows to plutonic rocks such as diorites, monzonites, and granites, indicating multiple phases of magmatic evolution [16,17,18,19].
Structurally, the region shows a transition from an extensional regime during the Eocene to a compressional regime in the late Eocene-Oligocene, marked by the development of dextral shear zones and strike-slip faults. This tectonic evolution facilitated the emplacement of plutonic bodies in transtensional settings, with later brittle deformation shaping the observed structural trends. Overall, the magmatic and structural characteristics of the study area reflect its dynamic evolution within the broader context of the Neo-Tethys subduction and the tectonic processes of the Alpine-Himalayan orogenic system.
The study area (Figure 1B), located northeast of Saveh in the central UDMA and approximately 100 km southwest of Tehran, highlights this complex geological history. Field and petrographic studies reveal the presence of two dominant intrusive rock units: monzonite-monzo-diorite and gabbro-gabbro-diorite. These intrusions have interacted with acidic to basic volcanic rocks and are structurally controlled by major west-northwest to east-southeast trending faults associated with the Alpine orogeny [18,19].
The monzonite-monzodiorite unit (Figure 1C,D), forming prominent topographic highs, includes quartz monzonite, monzonite, and monzodiorite compositions. These rocks exhibit granoblastic and porphyritic textures, with primary minerals such as plagioclase, potassium feldspar, hornblende, and clinopyroxene, alongside accessory minerals like apatite, zircon, and chlorite. Intense alteration features, including sericitization and carbonatization, are evident, particularly in plagioclase crystals.
The gabbro-gabbro-diorite unit (Figure 1E,F)is characterized by dark-grey outcrops with hetero-granular textures. These rocks consist of plagioclase, pyroxene, and hornblende, with secondary alteration minerals such as chlorite, epidote, and carbonate. The presence of anti-rapakivi textures and chloritized mafic minerals reflects the influence of hydrothermal fluids during emplacement.
3. Mineralization and Mineralogy
3.1. Field Characteristics of Ore and Stages of Mineralization
Mineralization in the Northeast Saveh area primarily occurs within andesitic host rocks, with minor development in monzonitic and gabbroic units. The mineralized zones extend from several tens of meters up to approximately 1 km in length, with copper grades ranging from 0.1 to 5 wt.%. The predominant style of copper mineralization is of a vein and veinlet type, which is generally controlled by fault-related structures trending N–S and N40°W. Based on detailed field observations, six principal mineralized zones have been identified within the host rocks (Figure 2A).
Considering the structural and textural features of ore minerals, several distinct stages of mineralization can be recognized. During the pre-ore stage, pyrite and titanomagnetite were formed as disseminated grains within the groundmass of the monzonitic and monzodioritic units. These minerals occur as euhedral to anhedral crystals and, to a lesser extent, as vein or veinlet fillings within open spaces. This early mineralization is interpreted to be related to the development of a magmatic–hydrothermal system associated with the emplacement of quartz monzonitic intrusions in the area
The main mineralization stage is characterized by the deposition of quartz together with sulfide and oxide minerals, mainly chalcopyrite, pyrite, magnetite, and specular hematite. This assemblage represents the principal hydrothermal pulse responsible for copper enrichment and vein formation. During the supergene enrichment stage, secondary sulfides such as chalcocite, covellite, and minor native copper formed through the replacement of primary sulfides, reflecting descending oxidizing fluids and partial remobilization of copper. Finally, in the oxidation stage, supergene weathering processes led to the formation of various secondary copper oxides and carbonates, including malachite, azurite, cuprite, chrysocolla, hematite, goethite, and limonite. These minerals occur as surface coatings, earthy masses, or veinlet infillings, marking the latest phase of exogenic alteration. Overall, the mineralogical assemblages and textural characteristics suggest a polyphase hydrothermal system, in which early Fe–Ti oxide and sulfide deposition was followed by extensive oxidation and secondary enrichment under near-surface conditions [20,21].
3.2. Mineralogy and Textural Characteristics of sulfide Minerals (Pyrite, Chalcopyrite, Chalcocite)
Pyrite is the most abundant sulfide mineral in the Northeast Saveh area. Based on detailed mineralogical investigations of hand specimens and reflected-light microscopy, and considering its structural and textural characteristics, three distinct generations of pyrite can be identified in order of abundance.
The first-generation pyrite (Figure 3A) occurs as euhedral to subhedral grains, ranging from 100 µm to 1 mm in size, disseminated throughout the host rocks and commonly associated with minor chalcopyrite. These pyrites are interpreted to have formed during the early magmatic–hydrothermal stage, related to the emplacement of the monzonitic intrusion in the area. In some instances, the first-generation pyrite has been partially or completely altered to hematite and goethite while preserving the original cubic crystal morphology, indicating late-stage oxidation under supergene or hydrothermal conditions.
The second-generation pyrite (Figure 3B,C) occurs as vein- and veinlet-filling crystals, often forming lattice or network-like (framboidal to framework) textures, suggesting precipitation from later hydrothermal fluids that exploited pre-existing fractures and micro-fractures.
The third-generation pyrite (Figure 3D) is represented by fine-grained inclusions (5–20 µm) enclosed within chalcopyrite grains. These microscopic inclusions likely formed during the final stages of sulfide crystallization, reflecting exsolution or recrystallization processes during the cooling and evolution of the hydrothermal system.
Chalcopyrite is the dominant primary copper sulfide in the Northeast Saveh and constitutes the main copper host. It occurs chiefly as anhedral to subhedral grains disseminated in the groundmass and as vein/veinlet fills (Figure 3B-I). Texturally, chalcopyrite is found both in the matrix and along structural conduits, where it often forms the core of composite sulfide aggregates. Supergene and near-surface processes have extensively modified the primary chalcopyrite. Oxidative weathering has produced oxide–hydroxide alteration assemblages such as malachite, goethite and specular hematite, which commonly overprint or replace chalcopyrite (e.g., Figure 5E.F). In many samples the original chalcopyrite grains are rimmed or partially pseudomorphosed by these secondary oxides, documenting progressive oxidation and leaching of copper from the primary sulfide phase.
Chalcocite: Concomitant with oxidation, supergene enrichment produced a characteristic suite of secondary sulfides. Chalcocite is the most conspicuous product of this stage and defines the supergene sulfide zone in Northeast Saveh (Figure 3F-I). It commonly occurs as thin rimmed replacements and fracture-fillings around primary chalcopyrite and bornite, and locally as discrete aggregates in fractures and vein margins. Covellite and digenite to a lesser extent are also present as replacement phases, typically forming at the chalcopyrite margins or replacing thin rims of earlier-formed sulfides (Figure 3I). These textures indicate downward-percolating, oxidizing meteoric fluids mobilized copper from the upper parts of the system, followed by transport and re-precipitation as reduced Cu–S phases at or below the water table.
3.3. Mineralogy and Textural Characteristics of Oxide Ore Minerals (Magnetite- Titanomagnetite)
Iron-oxide minerals in the Northeast Saveh area occur in two principal settings. In the semi-deep monzodioritic intrusive bodies, titanomagnetite is the dominant syn-magmatic oxide, occurring mainly as disseminated grains within the groundmass (Figure 4A). In the silica veins that host or accompany Cu-sulfide mineralization, magnetite and specular hematite are predominant oxides, whereas titanomagnetite appear less commonly (Figure 4B–C). Overall, hypogene oxide mineralization is relatively limited in volume and typically appears as scattered grains or vein infillings (Figure 4D–F).
Titanomagnetite in the intrusive units commonly occurs as euhedral to subhedral fine to coarse crystals, and locally shows intimate intergrowths with ilmenite. These intergrowths point to complex Ti–Fe oxide fractionation and exsolution histories during cooling (Figure 5B,E). In some crystals, blade-like hematite lamellae or exsolved hematite pockets are observed, indicating late-stage hematite separation that formed during the final cooling of the oxide phase (Figure 5E–F).
Magnetite associated with the mineralized veins typically forms micron-sized crystals and occurs dominantly as veinlet infillings together with chalcopyrite or as disseminated crystals within the vein selvages (Figure 4A,D and Figure 5A). Titanomagnetite is also observed as dissemination within the intrusive, commonly accompanied by subordinate pyrite and chalcopyrite.
3. Analytical Methods
Seventy polished thin sections were prepared from representative outcrops and drill cores across the mineralized zones for petrographic, mineralogical and micro-analytical investigations. Twelve of these were selected for detailed textural study and BSE imaging of oxide and sulfide ore phases; all sections were carbon-coated prior to electron-beam work to ensure electrical conductivity.
Prior to quantitative microprobe work, samples were inspected by scanning electron microscopy (SEM) in back-scattered electron (BSE) mode to document textures, identify inclusions and intergrowths, and to guide microprobe spot selection. Quantitative wavelength-dispersive electron probe microanalysis (EPMA) was carried out on a CAMECA SX Five (field-emission cathode) at the Department of Lithospheric Research, University of Vienna. Operating conditions and analytical setup were as follows: 20 kV accelerating voltage, 25 nA beam current, and a defocused / rastered beam (nominal beam size 0 µm with a raster length of ~60 µm) to ensure representative sampling of oxide-rich domains and coarse sulfide aggregates. The instrumental configuration (spectrometers and analyzing crystals) and counting times were selected to optimize sensitivity for the targeted major and trace elements. WDS crystals used were LLIF, LTAP, PET and TAP as appropriate for each line.
Analyses were calibrated with certified/well-characterized standards matched to each analyte (e.g., FeS for Fe and S, GaAs for As, PbS for Pb, Zn metal/oxide for Zn, InSb for Sb, Sn metal for Sn, wollastonite for Si, etc.). Intensity-to-concentration calibrations were performed from these standards and all compositions were corrected for matrix effects using the ZAF routine implemented in the probe software.
Peak and background counting times were set individually for each element to maximize sensitivity while controlling analytical time. Repeat analyses of standards and internal consistency checks were performed routinely throughout each analytical run to monitor precision and accuracy; analytical drift was negligible after standard-normalization and repeatability of matrix-matched standards was typically better than ±2–5% for majors and within acceptable limits for trace elements.
Because some reported trace concentrations are low, limits of detection were determined empirically for each element under the exact analytical conditions used. LODs were estimated following the commonly used 3σ criterion on background counts (i.e., LOD = 3·σbg, converted to concentration using the measured sensitivity from the corresponding standard), and take into account the peak/background counting times, spectrometer/crystal combination and instrument sensitivity (cps per nA) logged for each line.
Where measured concentrations fell below the empirically determined LOD for a given element they are reported as below detection (n.d.) in the data tables and were excluded from log-scale plots or any statistical computations that assume a measured value.
Microprobe spot analyses for the main mineral groups are summarized in Supplementary Tables 1–5.
4. Results
4.1. Mineral Chemistry of Pyrite
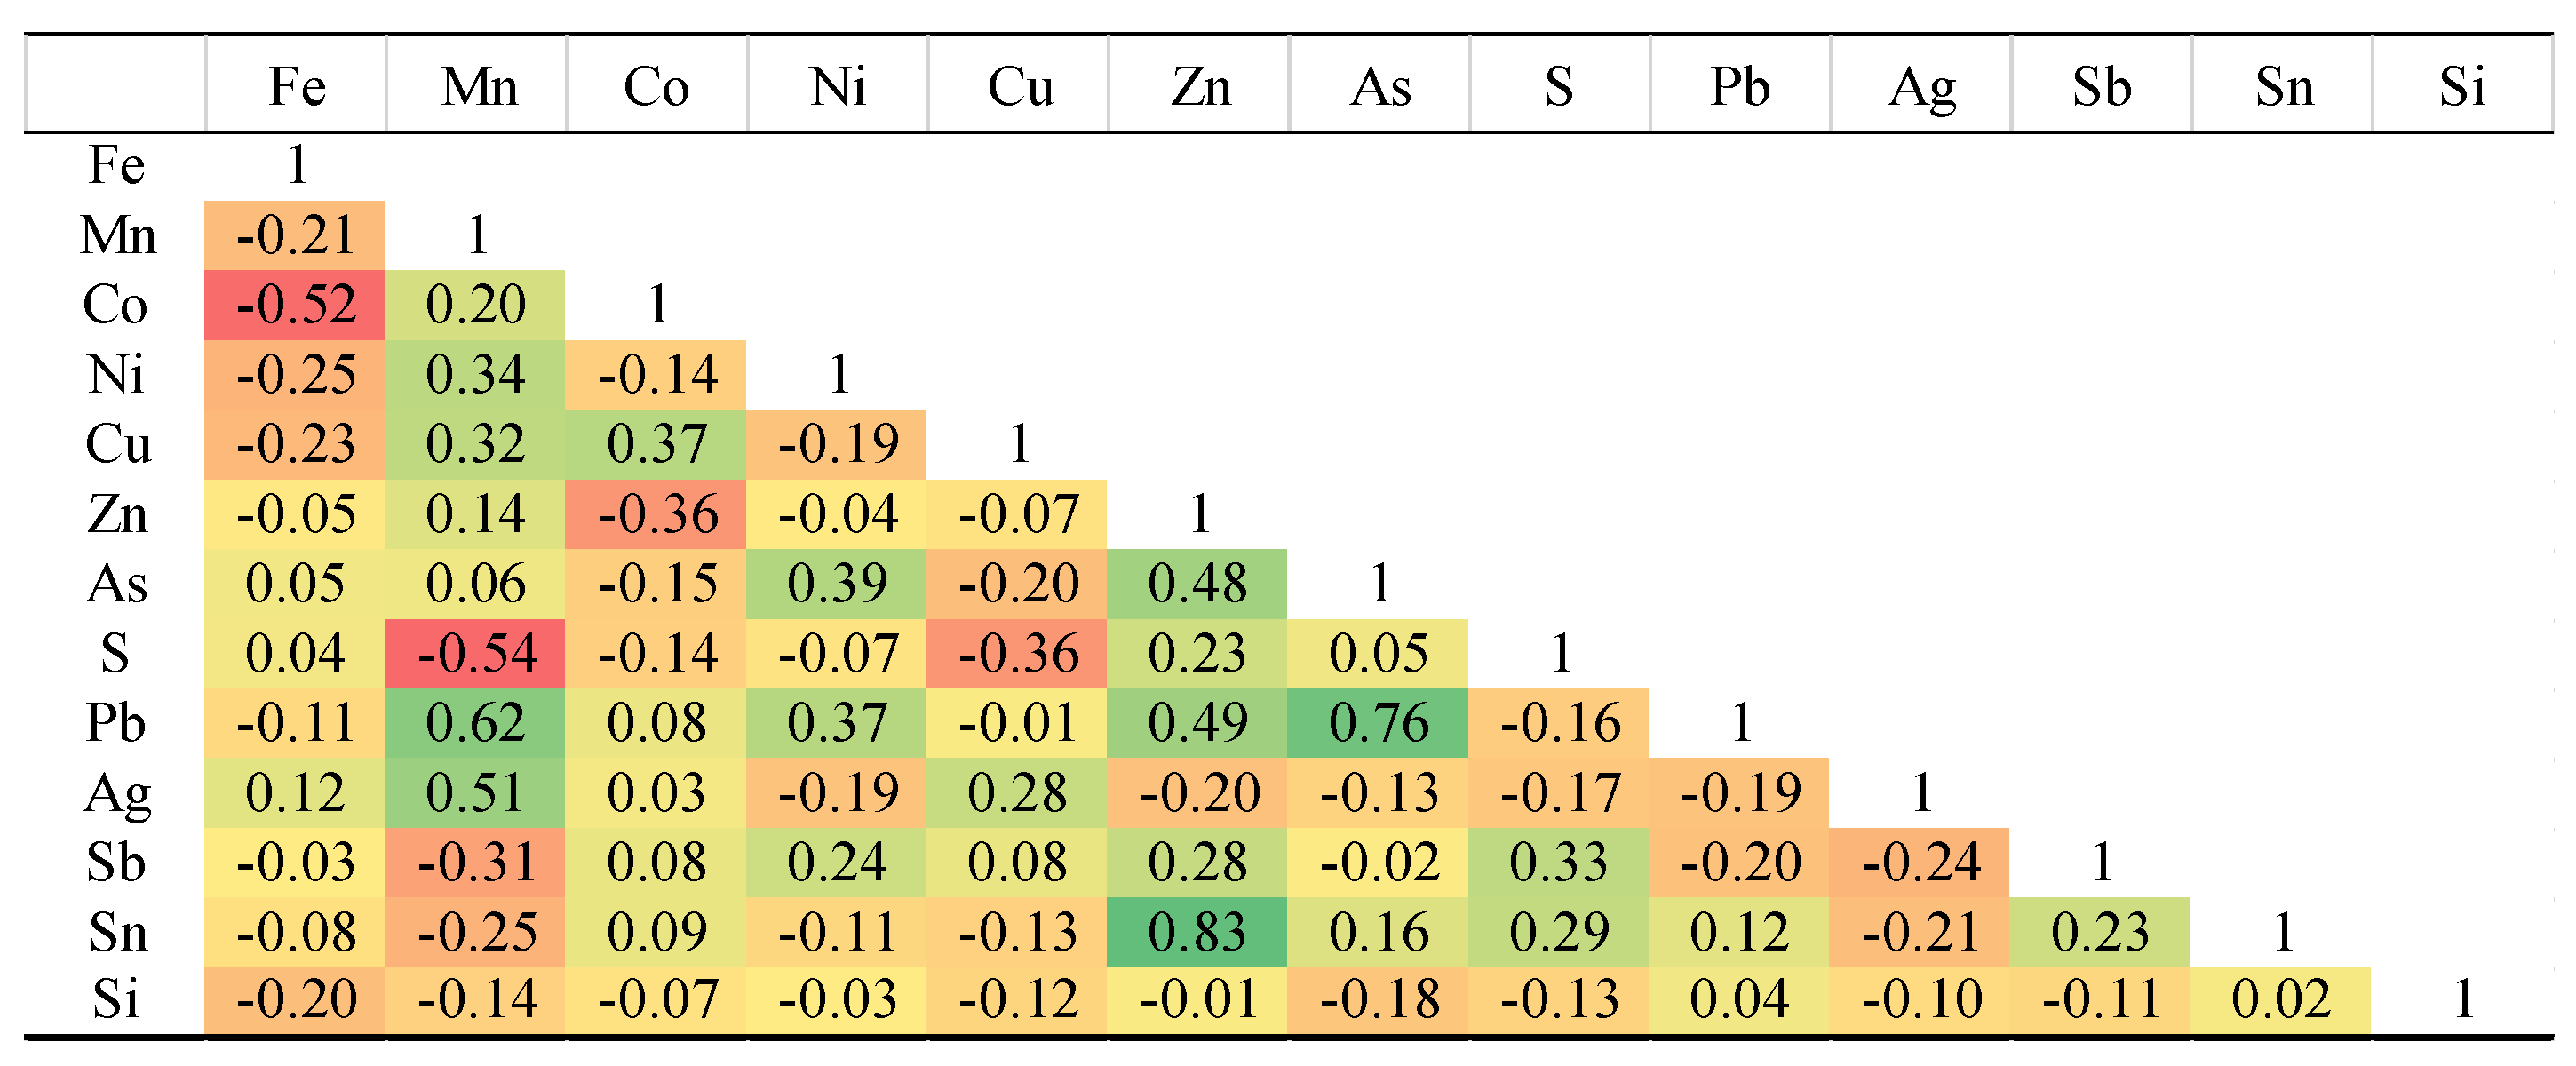
EPMA analyses were conducted on 43 points (in the 13 samples) of hydrothermal pyrite (Figure 4), and the results are presented in Supplementary Table 1. The highest measured concentrations for other elements were: As at 0.20 wt.%, Pb at 0.26 wt.%, Cu at 0.95 wt.%, Sb at 0.23 wt.%, Sn at 0.04 wt.%, Zn at 0.018 wt.%, Ni at 0.34 wt.%, and Co, the most abundant, at a maximum of 1.12 wt.%. Gold was not detected in the pyrite and Ag concentrations were low, with a maximum of 0.05 wt.%. The strongest positive elemental correlations in pyrite were observed between Zn-Sn, Pb-As, and Pb-Mn. The strongest negative elemental correlations in pyrite were observed between Fe-Co, S-Mn, Co-Zn, and S-Cu (Table 1).
BSE images of the pyrite mineral (Figure 5) show that pyrite occurs as individual grains in hydrothermal veins, as well as in association with chalcopyrite along its margins, and in some cases, as inclusions within the chalcopyrite host. Box-plots and violin plots diagrams displaying the distribution of trace elements in pyrites is shown in Figure 6 and elemental variation diagrams given in Figure 7. As observed, Fe and S contents do not exhibit significant variations with increasing As concentration, suggesting that As may be incorporated into pyrite through surface adsorption in the 3+ oxidation state. Cobalt content exhibits an increasing trend. Copper content in pyrite decreases as Fe concentration increases. The variation trends of Co and Ni are nearly constant when plotted against each other. Copper concentrations show an almost increasing trend with rising Zn levels. Silver content decreases with increasing As and An concentrations but exhibits a positive correlation with Sn.
Figure 5.
BSE images of hydrothermal pyrites associated with other oxide-sulfide minerals from the Northeast Saveh deposit. (A) Subhedral pyrite crystals alongside second-generation chalcopyrite. (B) Euhedral first-generation pyrite crystal. (C) Disseminated pyrite mineralization altered to iron oxides/hydroxides due to weathering. (D) Third-generation pyrites within a chalcopyrite matrix. (E) Second-generation well-faceted pyrites associated with chalcopyrite, covellite, and specularite. (F) Second- and third-generation pyrites embedded within a chalcopyrite matrix. Mineral abbreviations [22]: Ccp: chalcopyrite, Py: pyrite, Cct: Chalcocite.
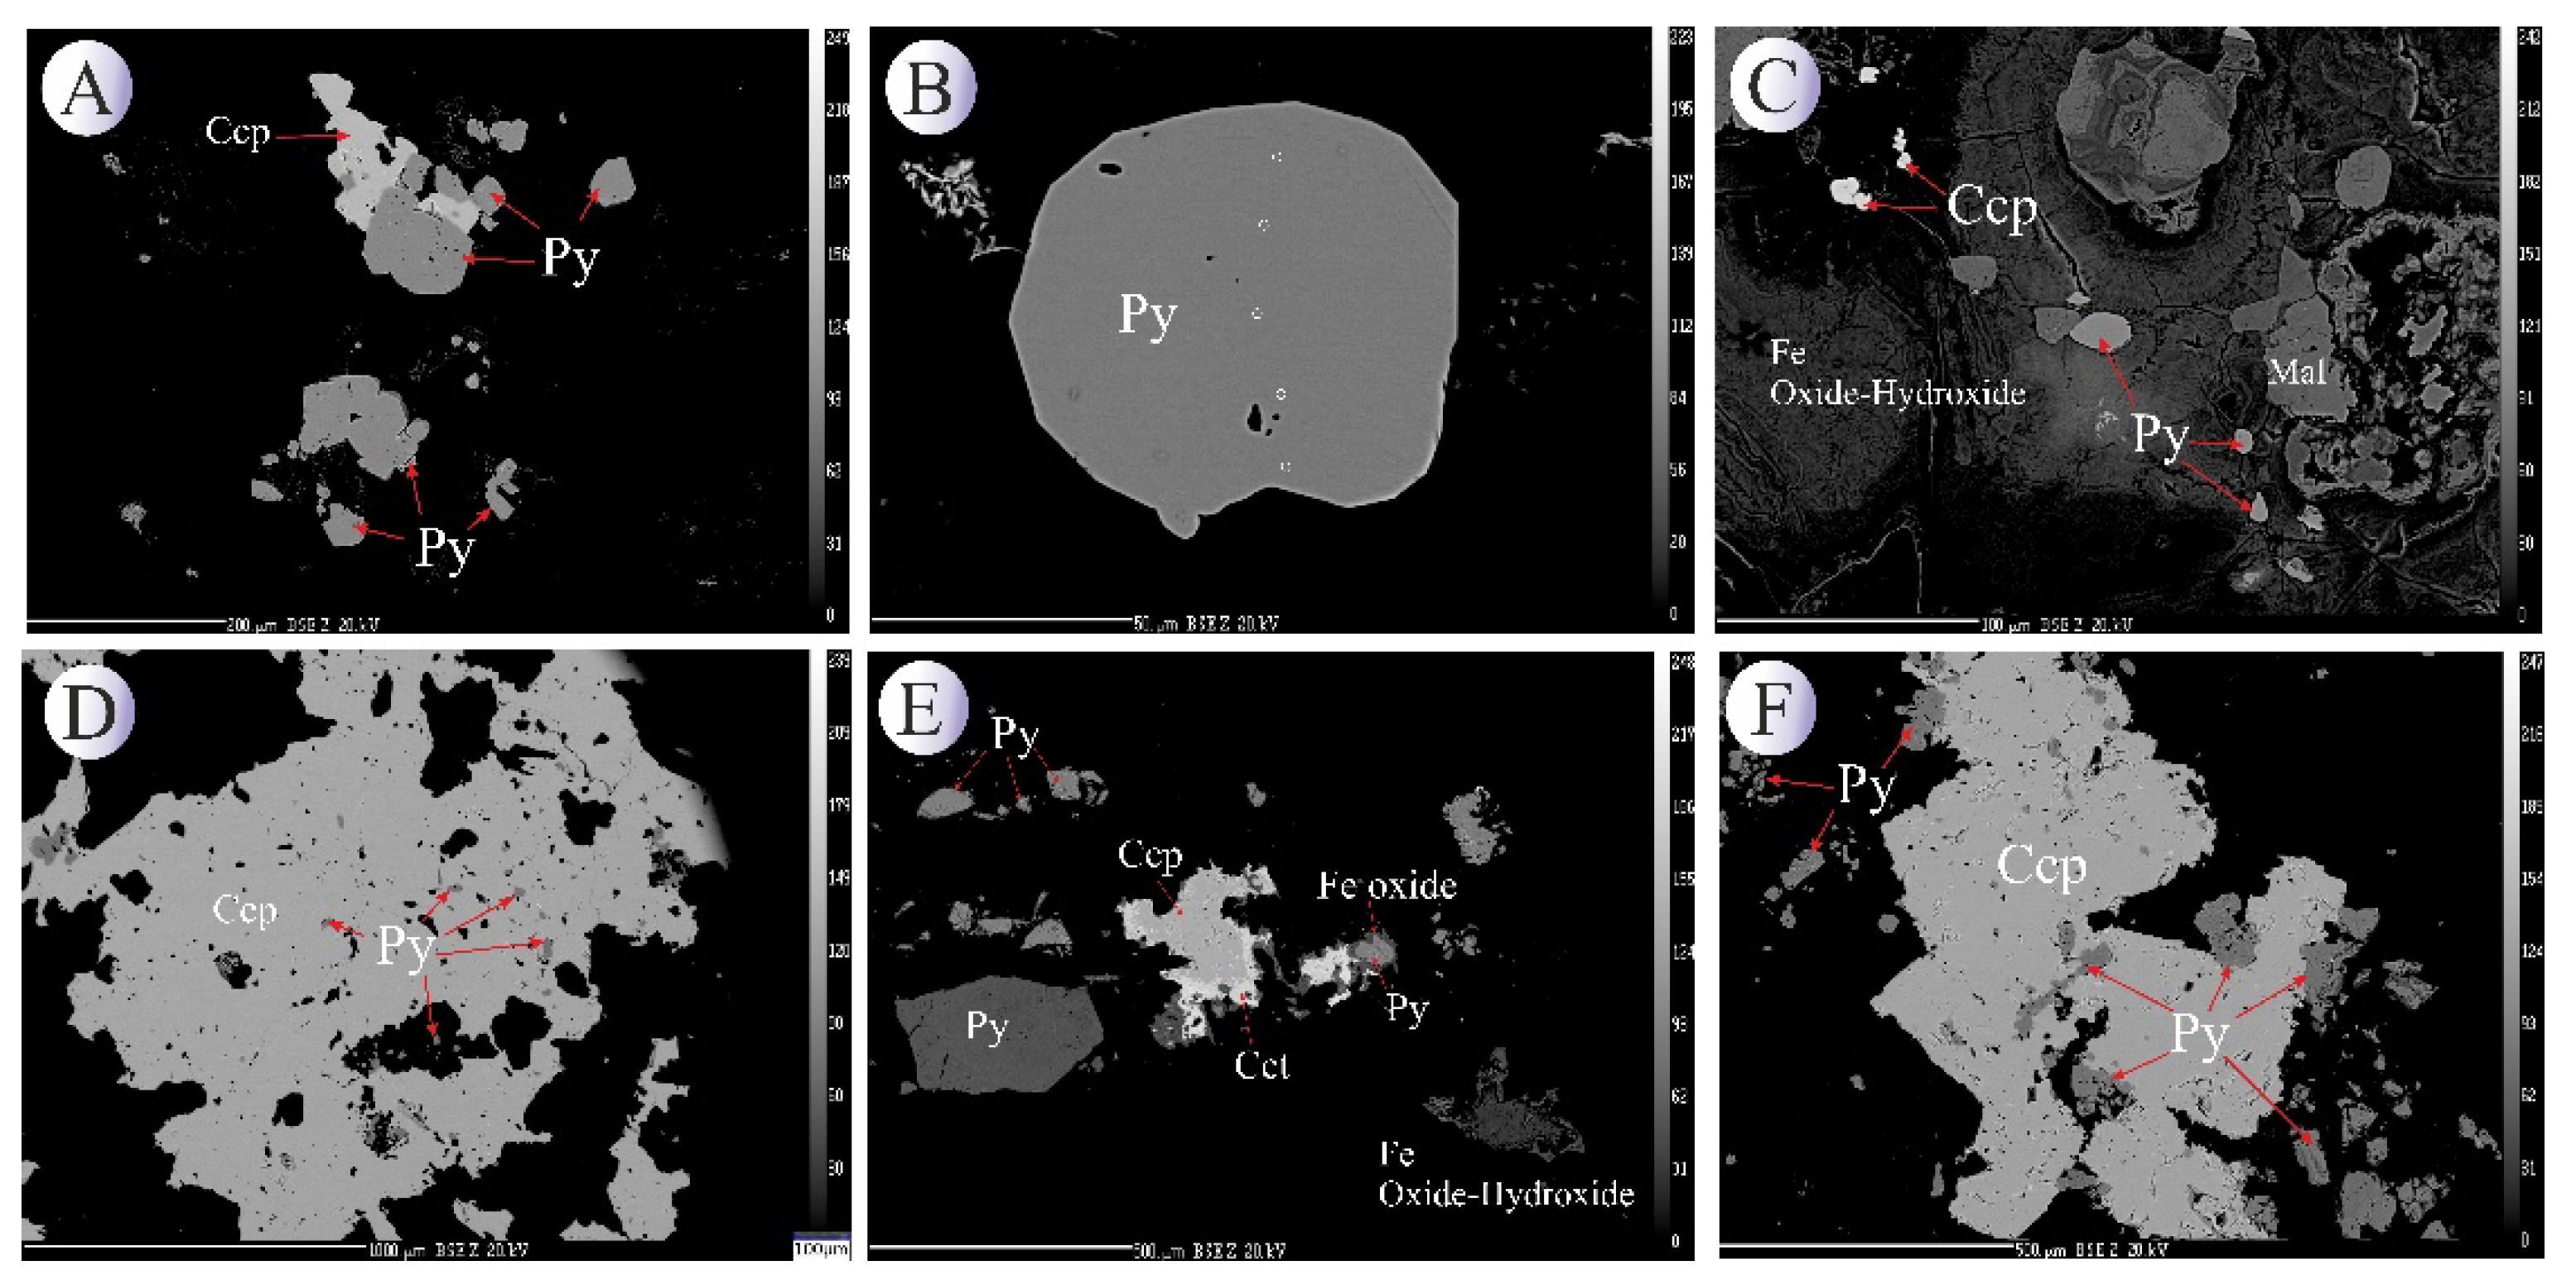
Figure 6.
(A) Boxplots showing the distribution of trace elements (wt.%) in the Northeast Saveh pyrites on a logarithmic scale. Each box represents the interquartile range, with the median line and whiskers corresponding to 1.5×IQR. Individual data points are plotted, and n values below each element indicate detected/total samples. (B) Violin plots illustrating the same data with kernel density distributions, highlighting the variability and skewness of elemental concentrations. Non-detected and zero values were excluded from the log-scale plots.
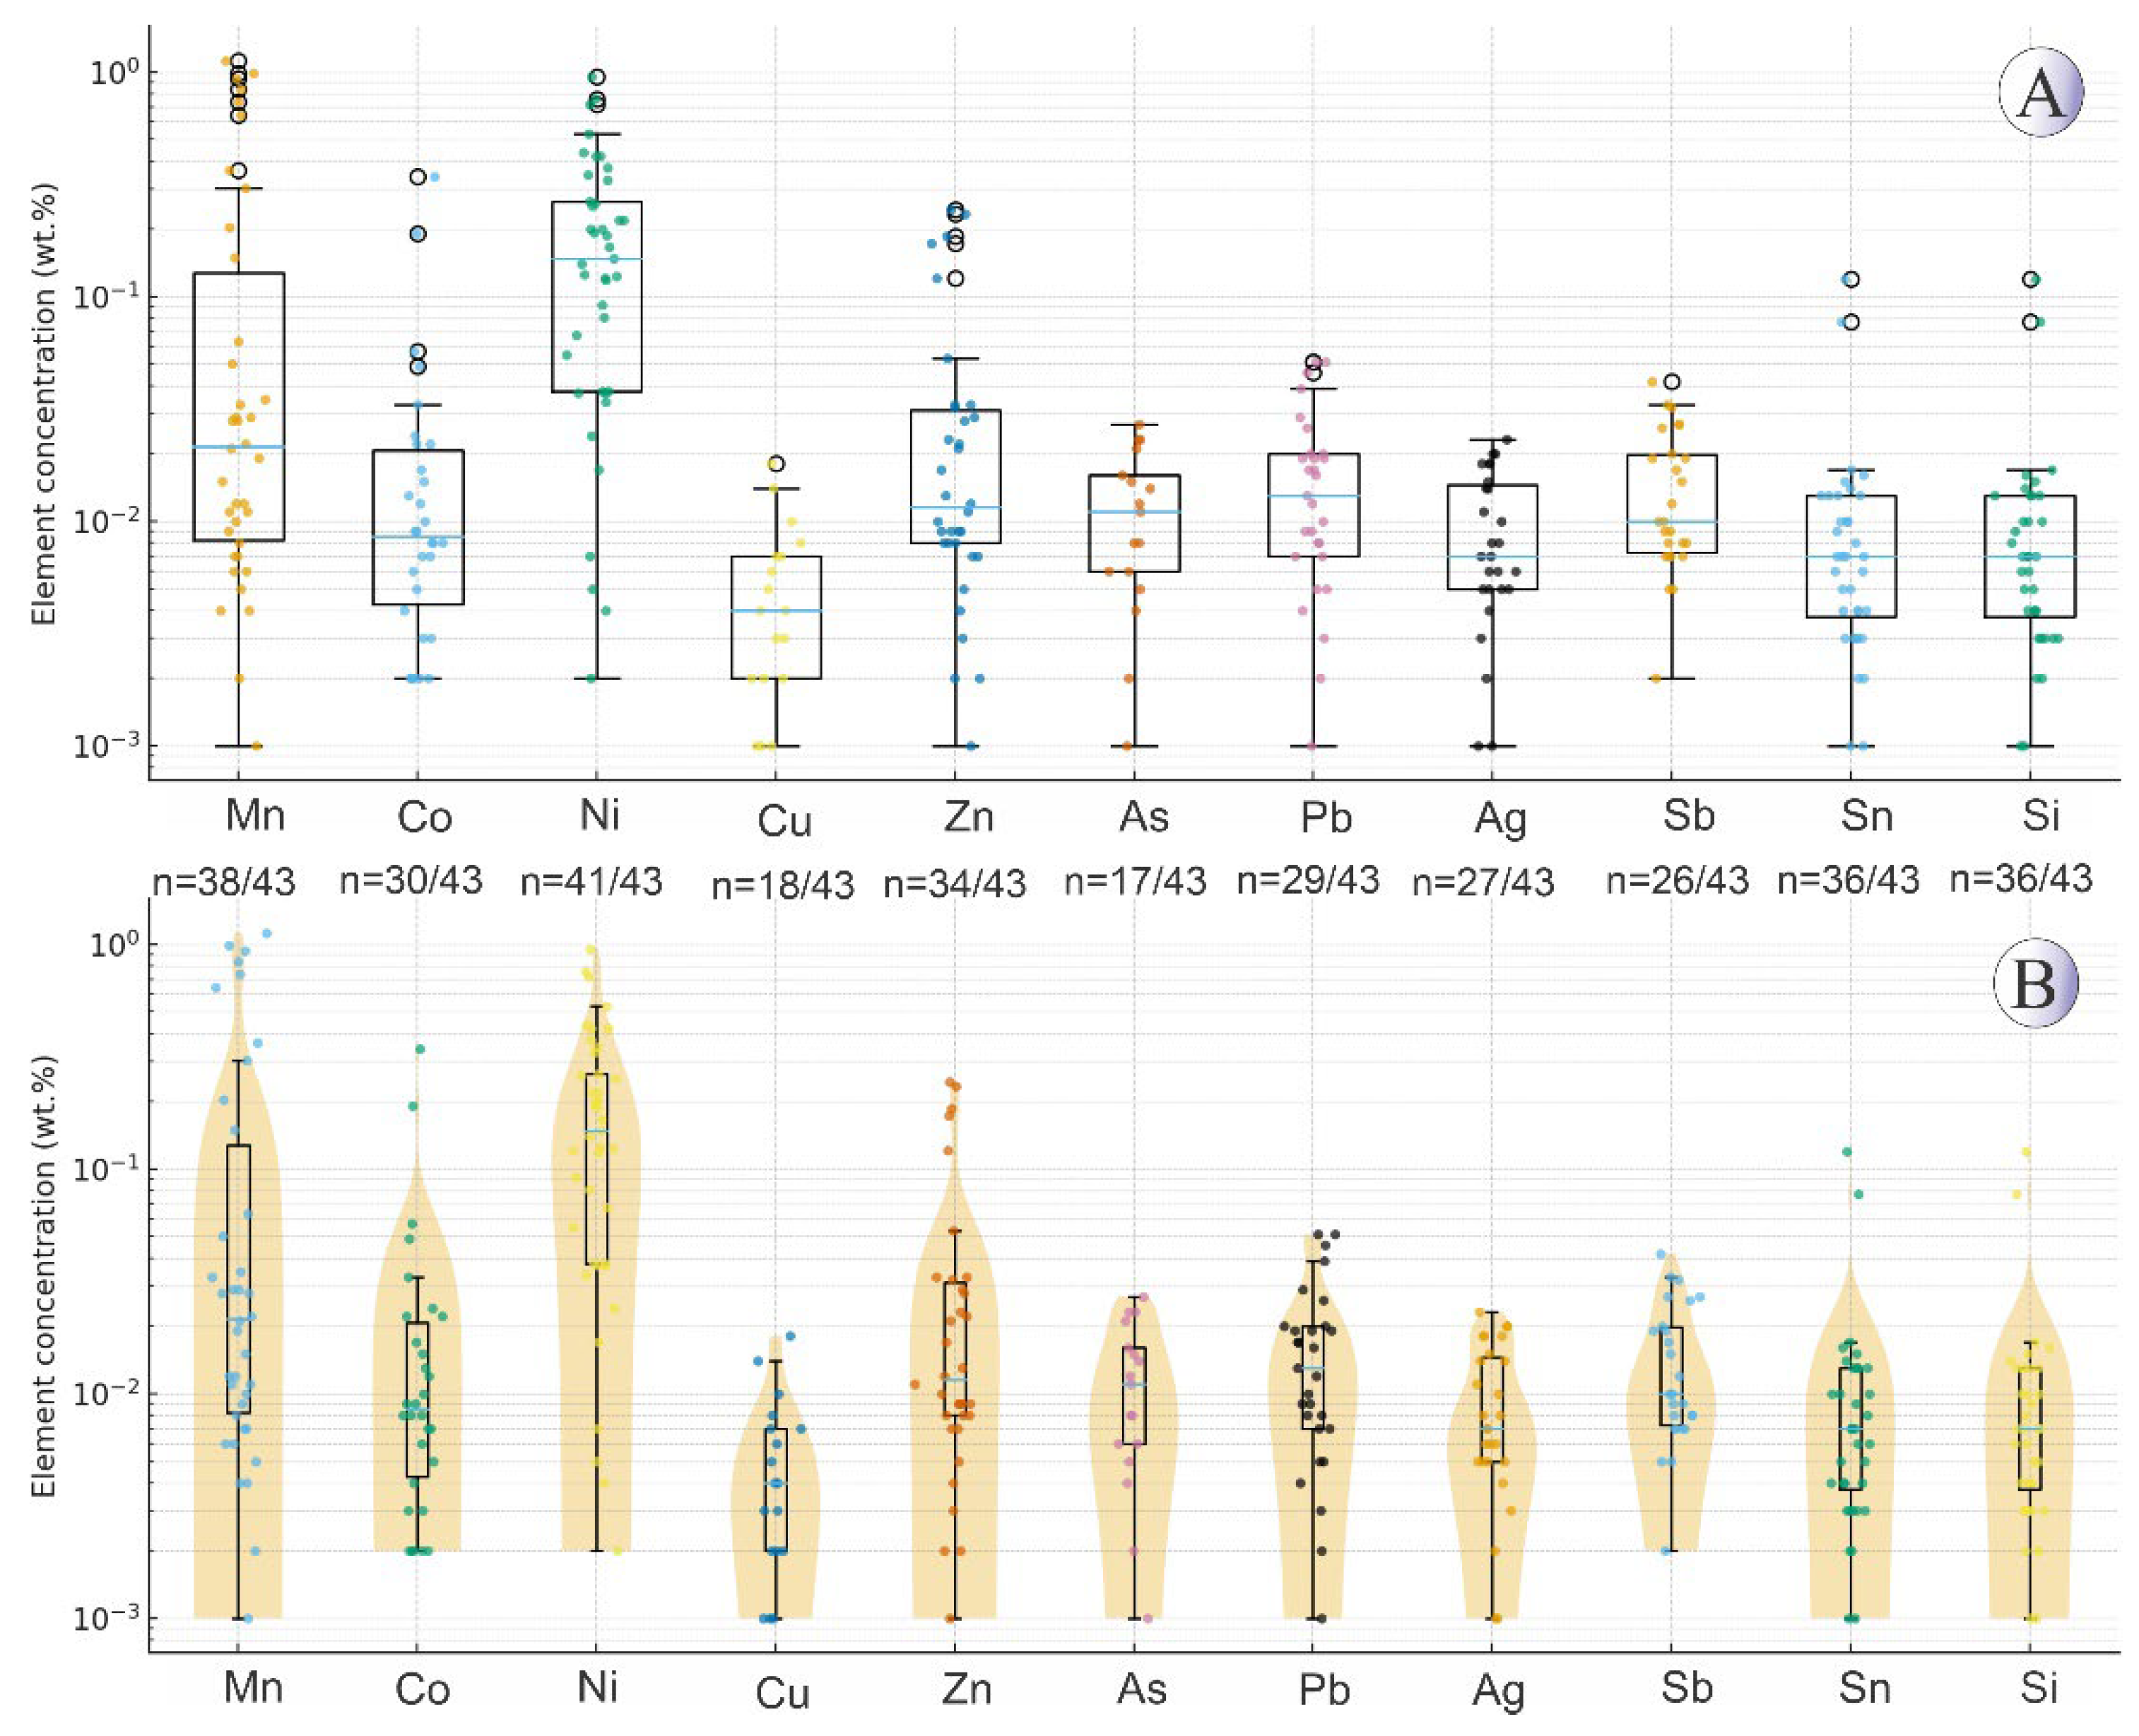
Figure 7.
Binary plots of the variations of trace elements in the Northeast Saveh pyrites.
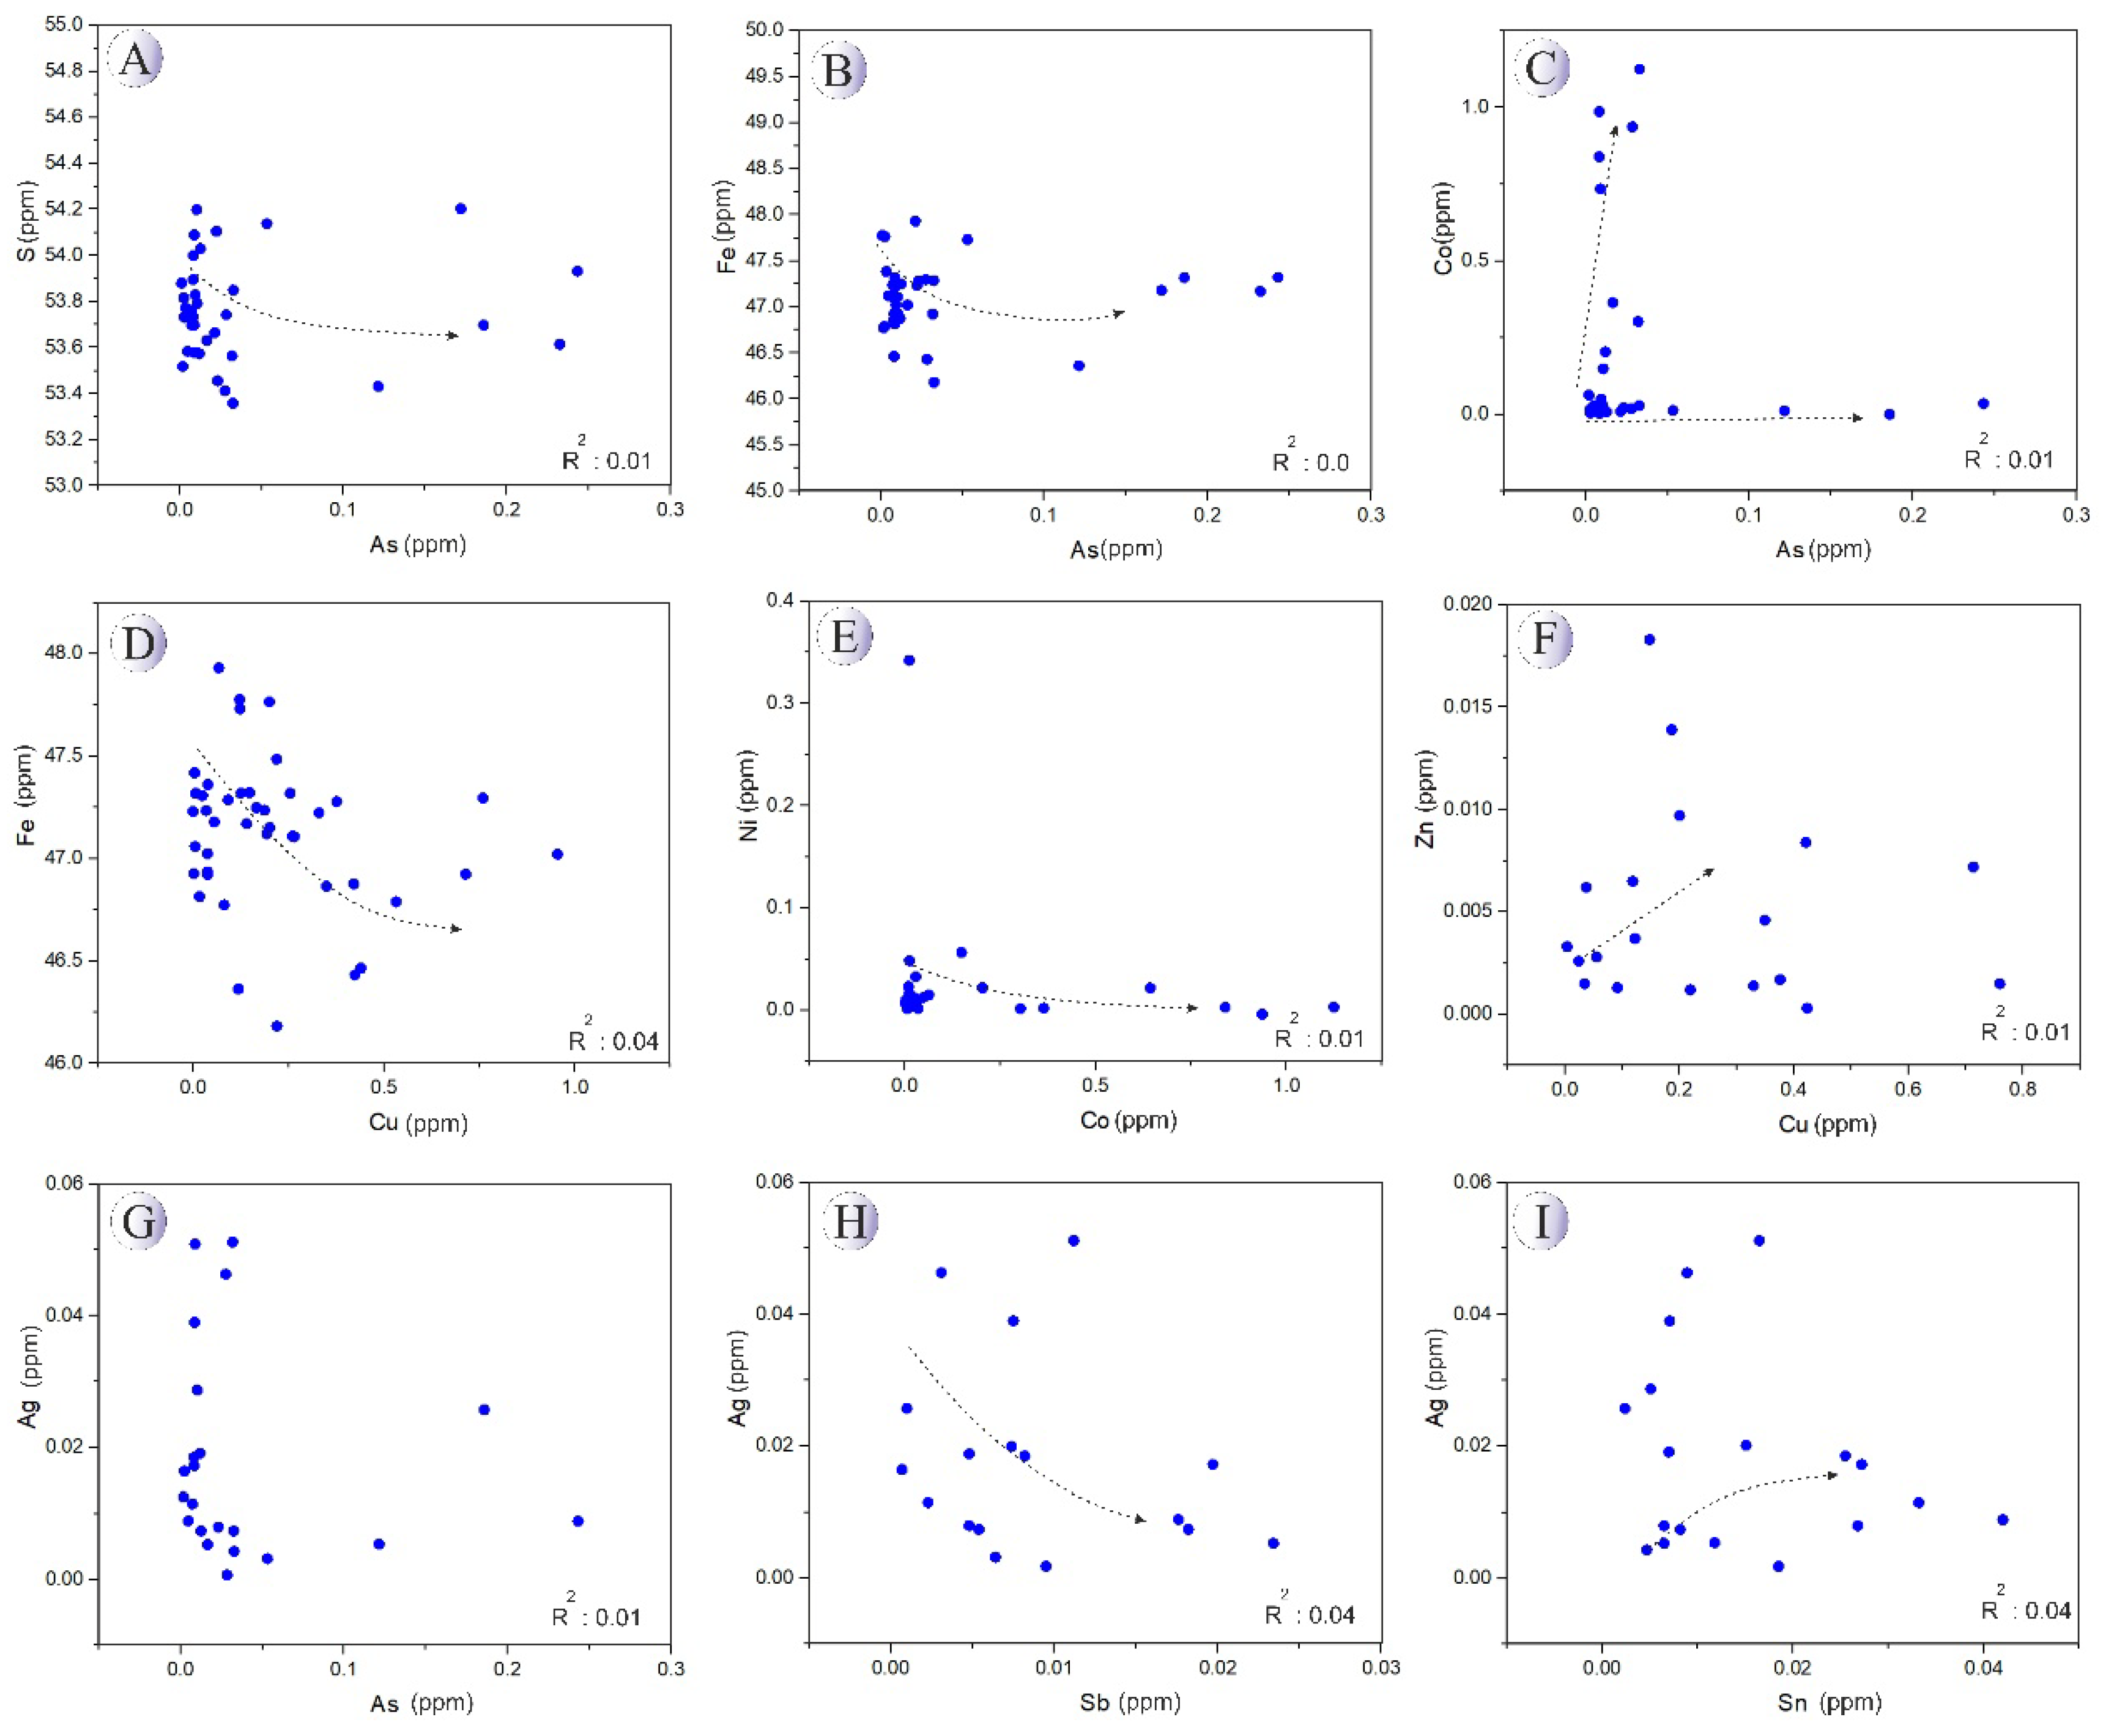

Table 1.
Pearson's correlation matrix for elements measured in Northeast Saveh pyrites.
4.2. Mineral Chemistry of Chalcopyrite and Chalcocite
Chalcopyrite EPMA analysis was performed on 97 points (Supplementary Table 2). The chalcopyrite contains Fe ranging from 30.2 to 31 wt.%, sulfur from 34 to 35.5 wt.%, and copper from 33.2 to 35.1 wt.%. The concentrations of other trace elements are as follows: zinc up to 0.4 wt.%, lead up to 0.19 wt.%, silver up to 0.05 wt.%, antimony up to 0.02 wt.%, tin up to 0.05 wt.%, arsenic up to 0.02 wt.%, cobalt up to 0.01 wt.%, and nickel up to 0.02 wt.%. The strongest elemental correlations in chalcopyrite are observed between S and Fe, Fe and Cu, Sb and Ni, Cu and S, as well as Mn and As (Table 2).
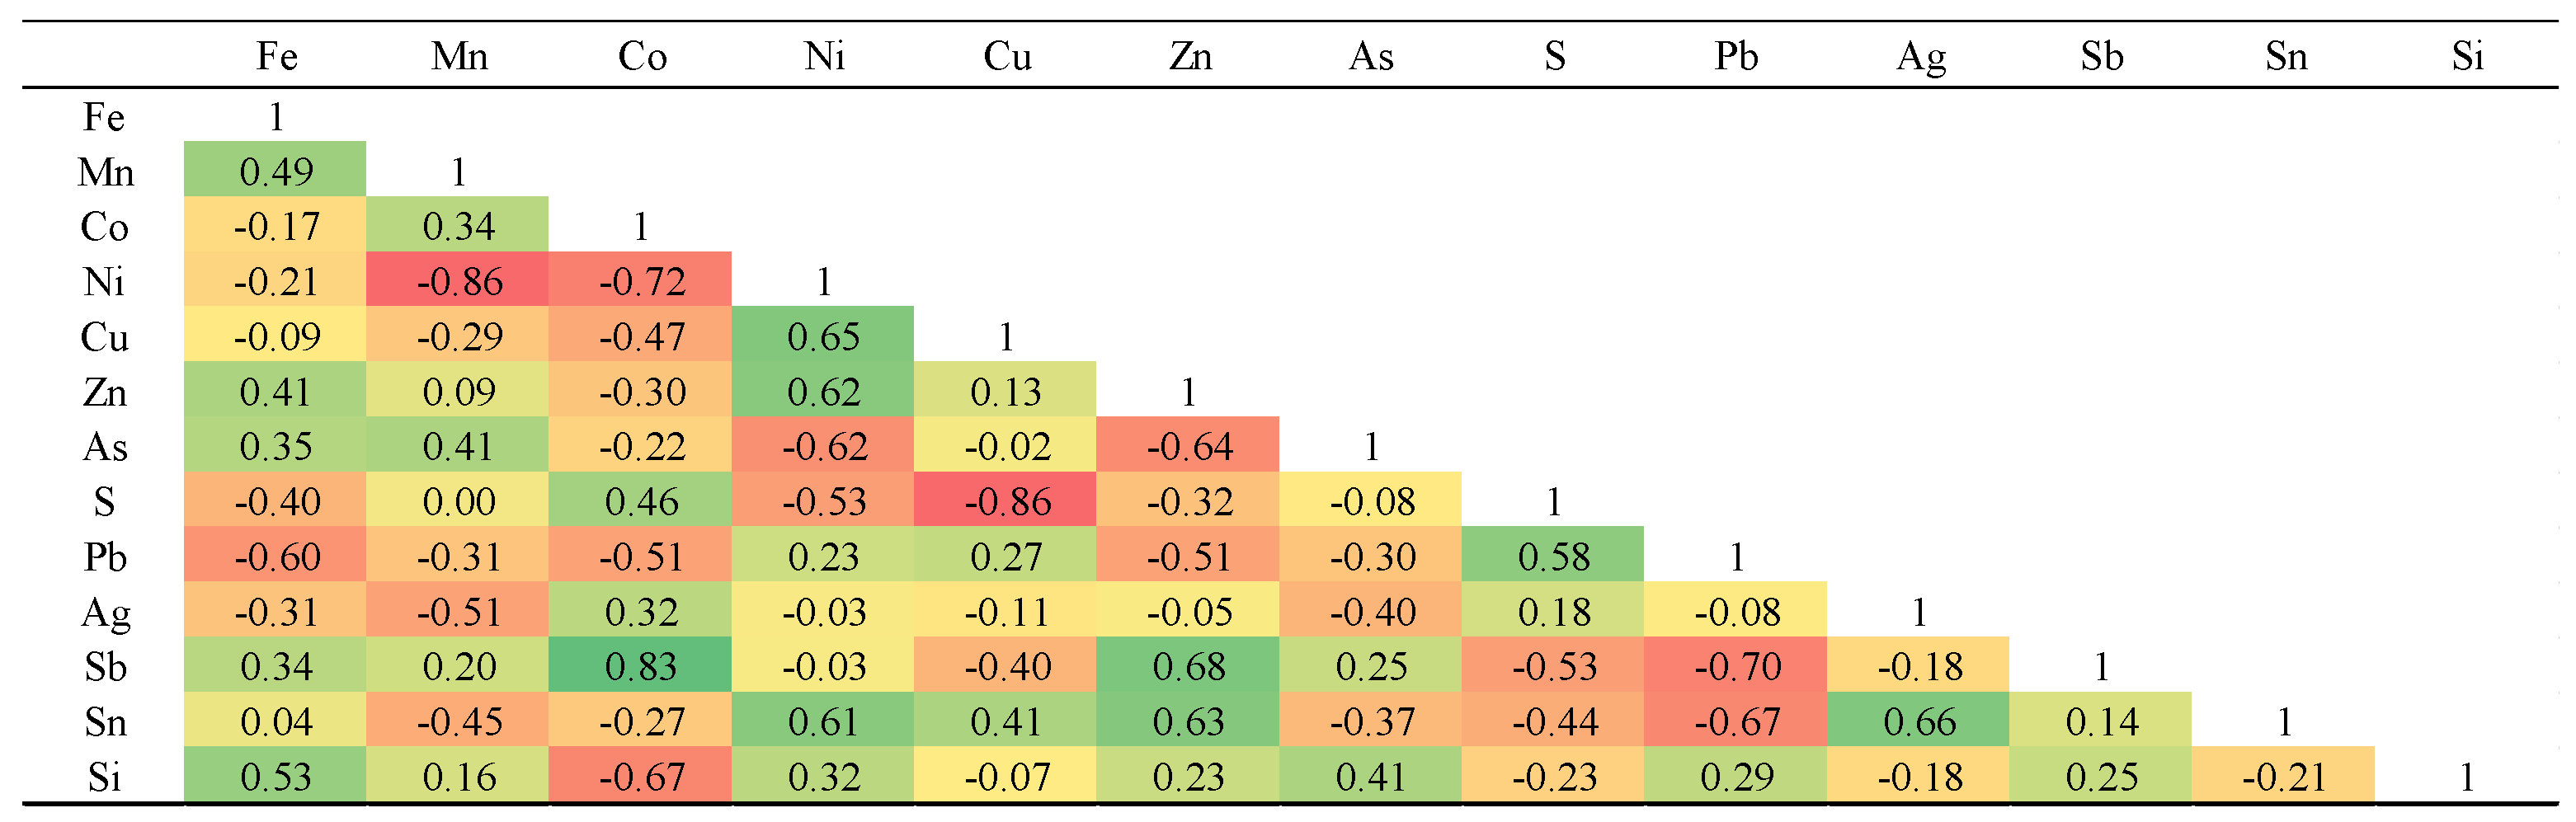
Chalcocite EPMA analysis was conducted on 17 points (Supplementary Table 3). Chalcocite contains an average of 75.6 wt.% copper and 22.2 wt.% sulfur. The concentrations of other trace elements in chalcocite are as follows: zinc up to 0.58 wt.%, Pb up to 0.43 wt.%, Ag up to 0.87 wt.%, Sb up to 0.02 wt.%, Sn up to 0.04 wt.% and Ni up to 0.01 wt.%. The strongest elemental correlations in Northeast Saveh chalcocite are observed between cobalt and nickel, nickel and copper, zinc and tin, silver and tin, antimony and cobalt, as well as sulfur with lead and cobalt (Table 3).
Overall, the distribution of trace elements in copper sulfides (chalcopyrite and chalcocite) does not show significant differences, with only minor variations. Zn, Pb, and Ag concentrations are slightly higher in chalcocite, whereas Sb, As, Co, and Ni are more enriched in chalcopyrite, suggesting that these elements preferentially incorporate into the chalcopyrite structure.
Figure 8.
BSE images of chalcopyrite and chalcocite from the Northeast Saveh. Mineral abbreviations [22]: Ccp: chalcopyrite, Cct: Chalcocite, Cv: Covellite, Py: Pyrite.
Figure 8.
BSE images of chalcopyrite and chalcocite from the Northeast Saveh. Mineral abbreviations [22]: Ccp: chalcopyrite, Cct: Chalcocite, Cv: Covellite, Py: Pyrite.
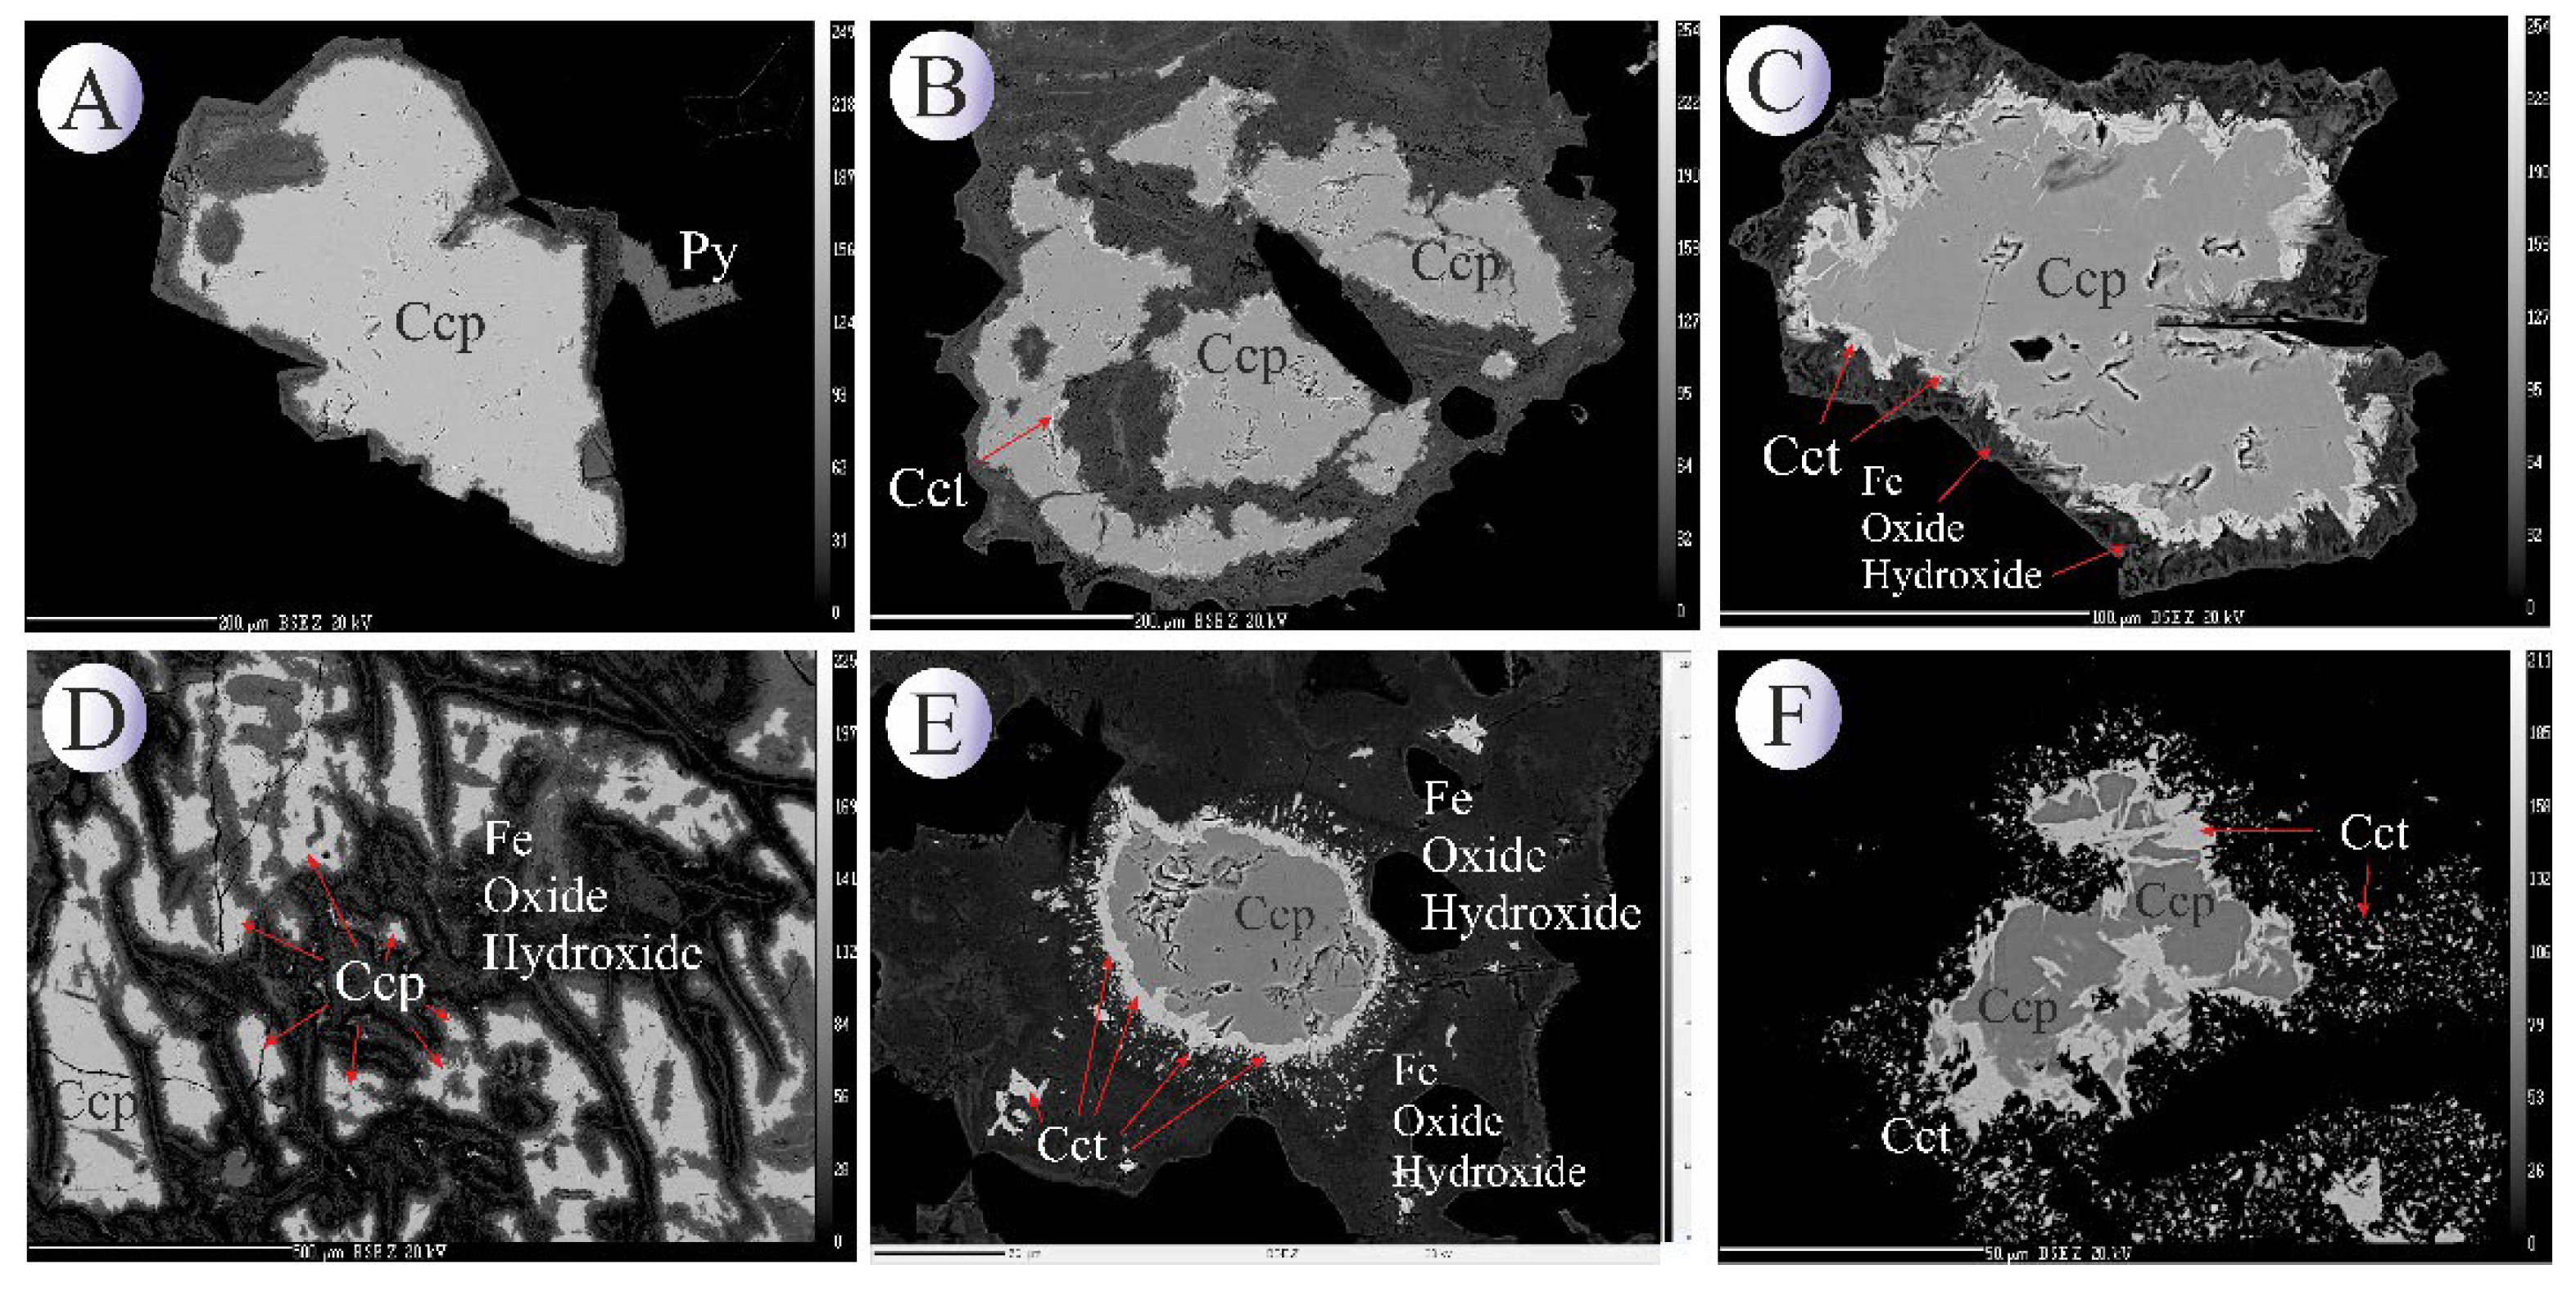
Table 2.
Pearson's correlation matrix for elements measured in Northeast Saveh chalcopyrites.
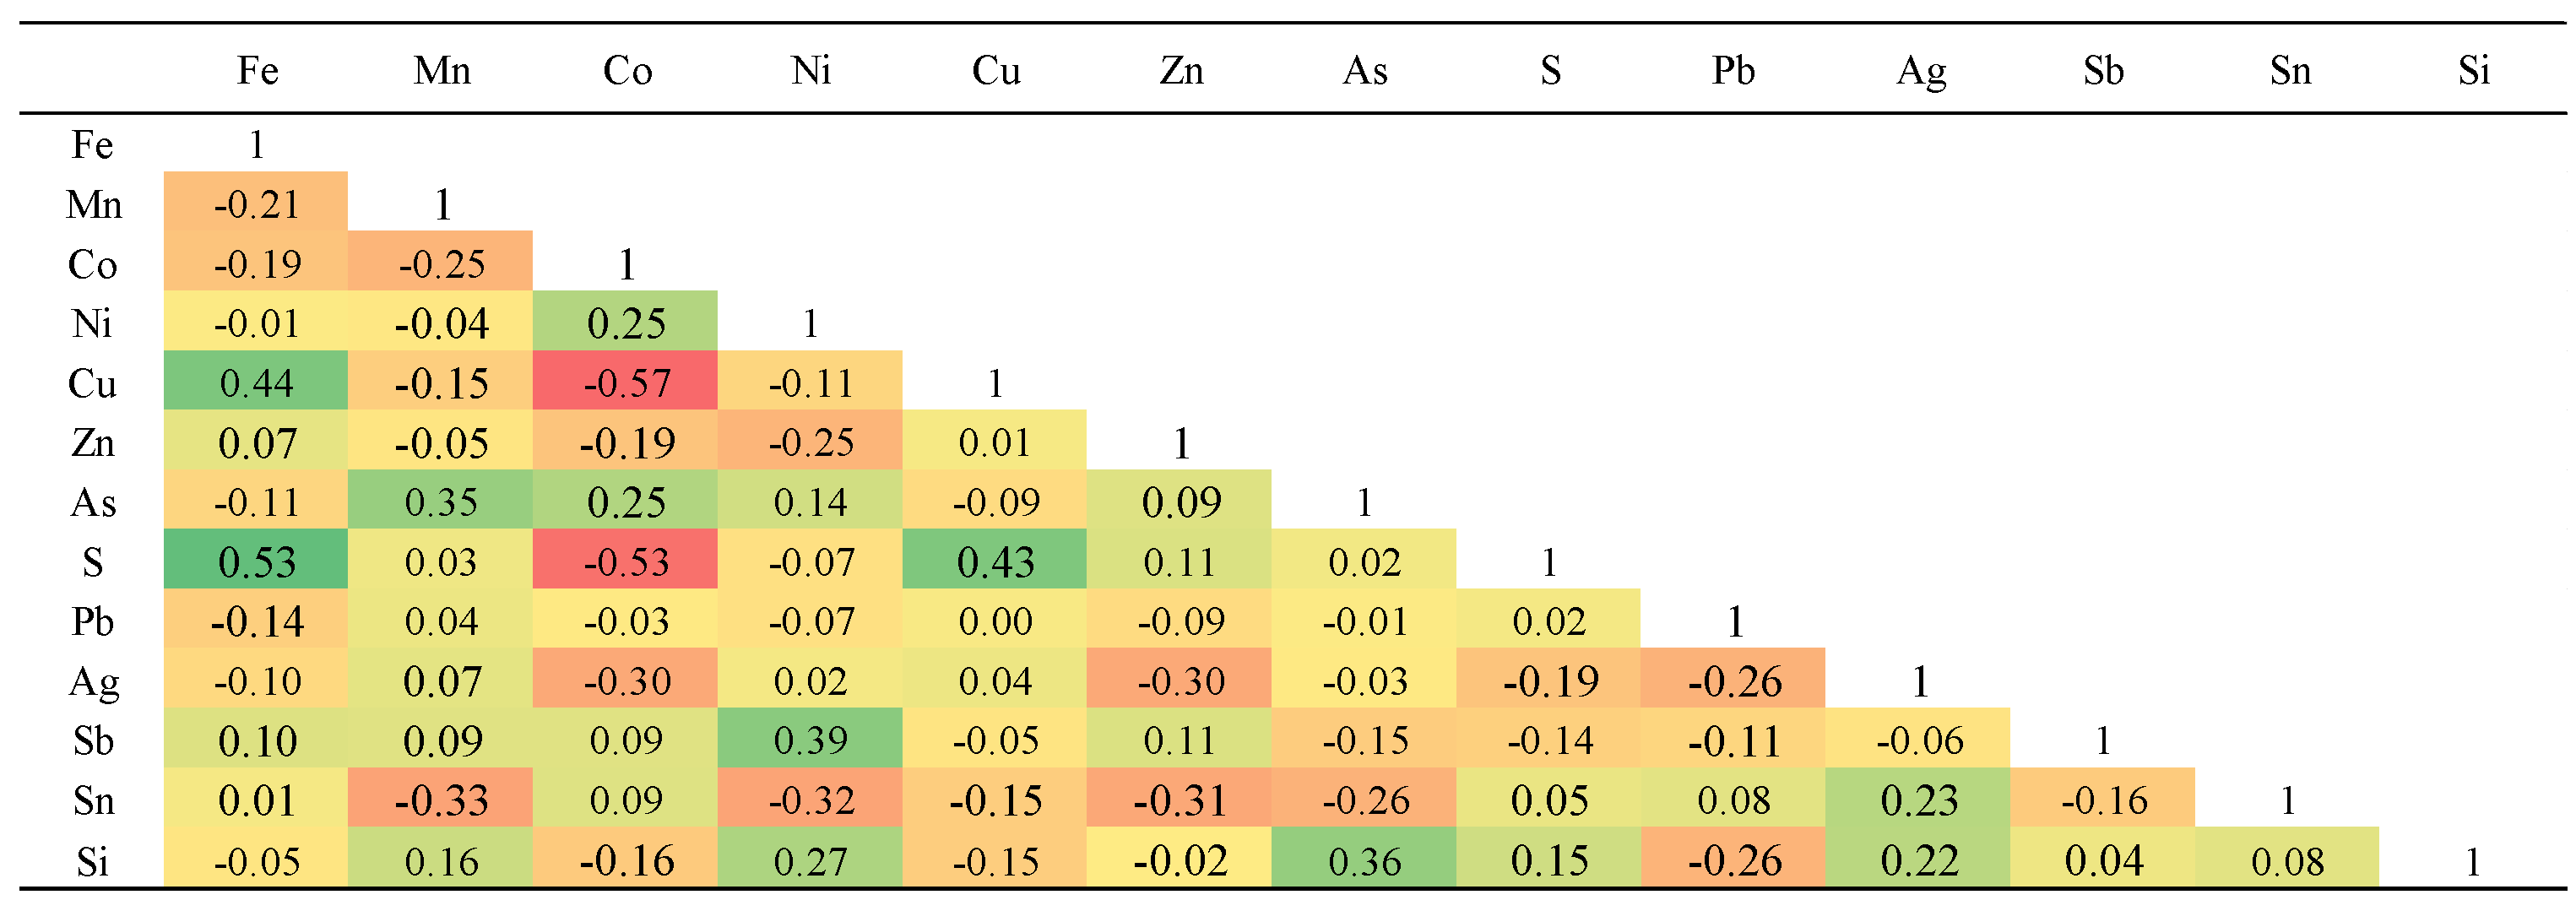
Table 3.
Pearson's correlation matrix for elements measured in Northeast Saveh chalcocite.
4.3. Mineral Chemistry of Magnetite and Titanomagnetite
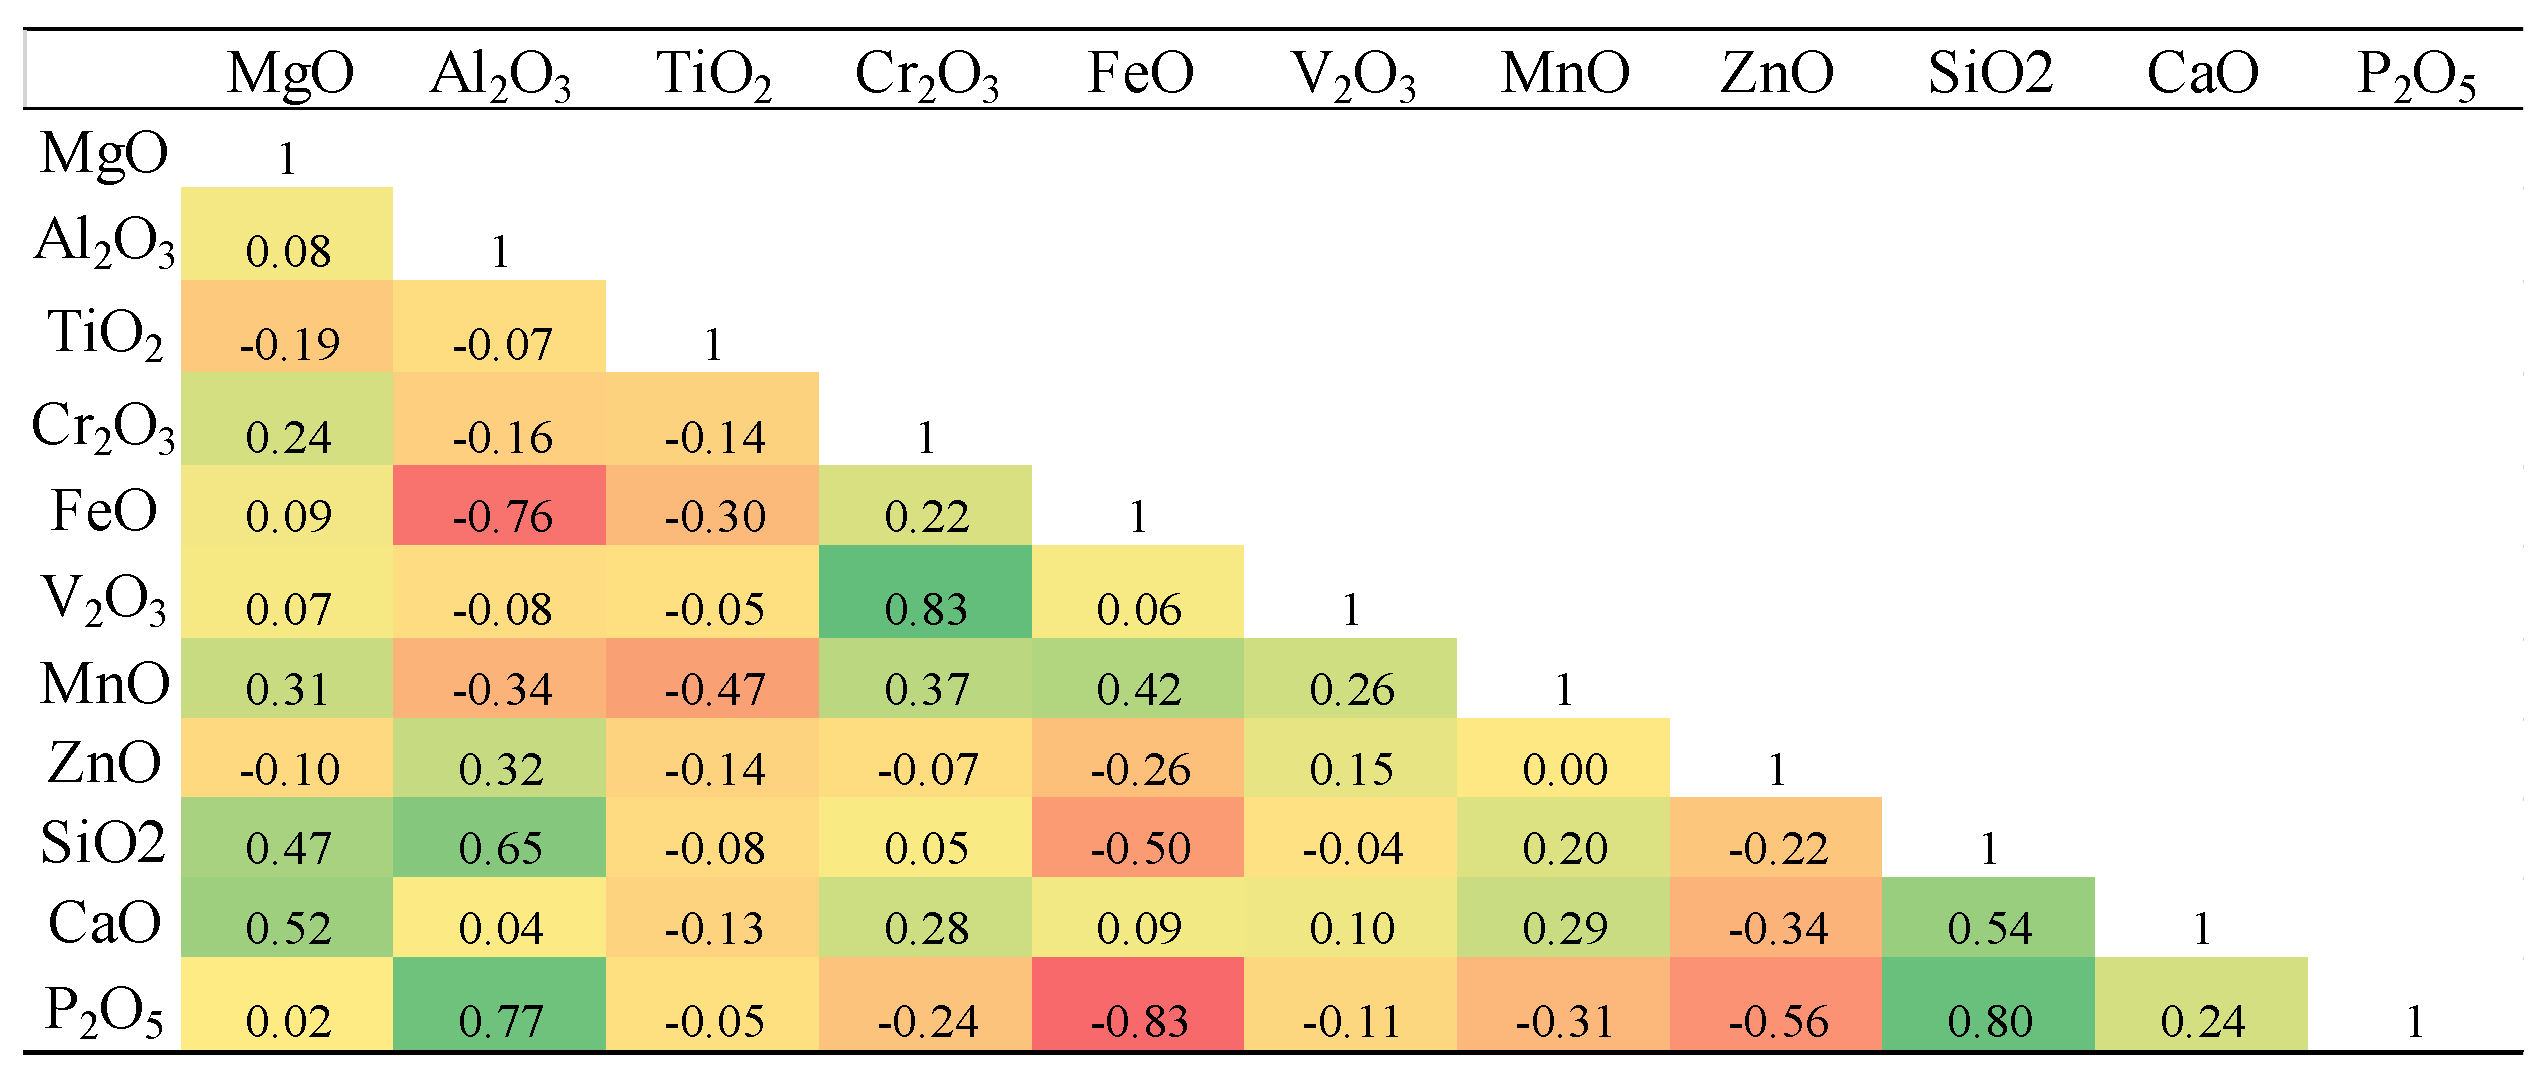
EMPA analyses were carried out on 44 points from primary titanomagnetite grains within the intrusive units, including monzonite, monzodiorite, and gabbro (Supplementary Table 4), and on 44 points from hydrothermal magnetite associated with mineralized veins (Supplementary Table 5). The chemical composition and inter-element correlations of magnetite and titanomagnetite indicate distinct geochemical signatures for intrusive rock and mineralized veins, respectively. The analytical results reveal that, in the intrusive rocks, Fe₂O₃ and TiO₂ contents range between 60–80 wt.% and 0–16.58 wt.%, respectively. In contrast, magnetite from the mineralized veins shows markedly higher Fe₂O₃ concentrations (80.6–91.4 wt.%) and significantly lower TiO₂ contents (0–0.12 wt.%) (Figure 10 and Figure 11).
In the intrusive bodies, Fe₂O₃ exhibits strong positive correlations with Cr₂O₃ and V₂O₃ (Table 3), suggesting their mutual enrichment during early magmatic crystallization under relatively oxidizing conditions. In the hydrothermal magnetites, however, Fe₂O₃ shows its highest positive correlation with MnO and, to a lesser extent, with Cr₂O₃ (Table 4), indicating partial re-equilibration and metasomatic modification during fluid–rock interaction. TiO₂ in the intrusive titanomagnetites shows the strongest correlations with Al₂O₃, V₂O₃, and MnO, implying a coupled substitution mechanism involving Ti⁴⁺ with Al³⁺ and V³⁺ in the spinel lattice. In contrast, in the hydrothermal samples, TiO₂ does not exhibit any notable negative correlation with Fe or Mn oxides.
Variation diagrams of major oxides versus TiO₂ and FeO were constructed for titanomagnetites from the intrusive bodies (Figure 10) and for magnetites from oxide–sulfide mineralized veins (Figure 11). As illustrated in Figure 10 and Figure 11, Al₂O₃, Cr₂O₃, and V₂O₃ contents in the Northeast Saveh intrusive titanomagnetites increase systematically with rising TiO₂ content, suggesting co-enrichment of these elements in early titanomagnetite during fractional crystallization. Conversely, FeO and MgO display inverse trends, decreasing with increasing TiO₂, while MnO exhibits a mildly increasing pattern. Furthermore, with increasing total Fe content, Al₂O₃ tends to decrease, whereas Cr₂O₃ and V₂O₃ show scattered to weakly positive trends, implying partial chemical heterogeneity and possible minor sub-solidus diffusion effects.
Based on Figure 12 and Figure 13 In the magnetite grains from the mineralized veins, increasing TiO₂ content is accompanied by nearly constant or slightly decreasing Al₂O₃ and FeO, an overall increase in Cr₂O₃, and initially increasing but subsequently decreasing MnO and MgO contents. With increasing Fe content, both Al₂O₃ and V₂O₃ decrease, whereas Cr₂O₃ shows a gradual increase, consistent with fluid-driven remobilization of Cr and V under moderately reducing conditions.
Figure 9.
(A) BSE image of subhedral magnetite along with bladed specularite. (B) BSE image of magnetite along with solid solution blades of ilmenite. (C) BSE image of bladed specularite. (D) BSE image of subhedral homogenous titanomagnetite crystals. (E) BSE image of titanomagnetite crystal with stockwork texture that contains solid solution blades of ilmenite. (F) Photomicrograph in reflected light image of ilmenite exsolution in magnetite crystal. Mineral abbreviations [22]: Hem: hematite, Mag: magnetite, Ilm: Ilmenite, Spc: Specularite.
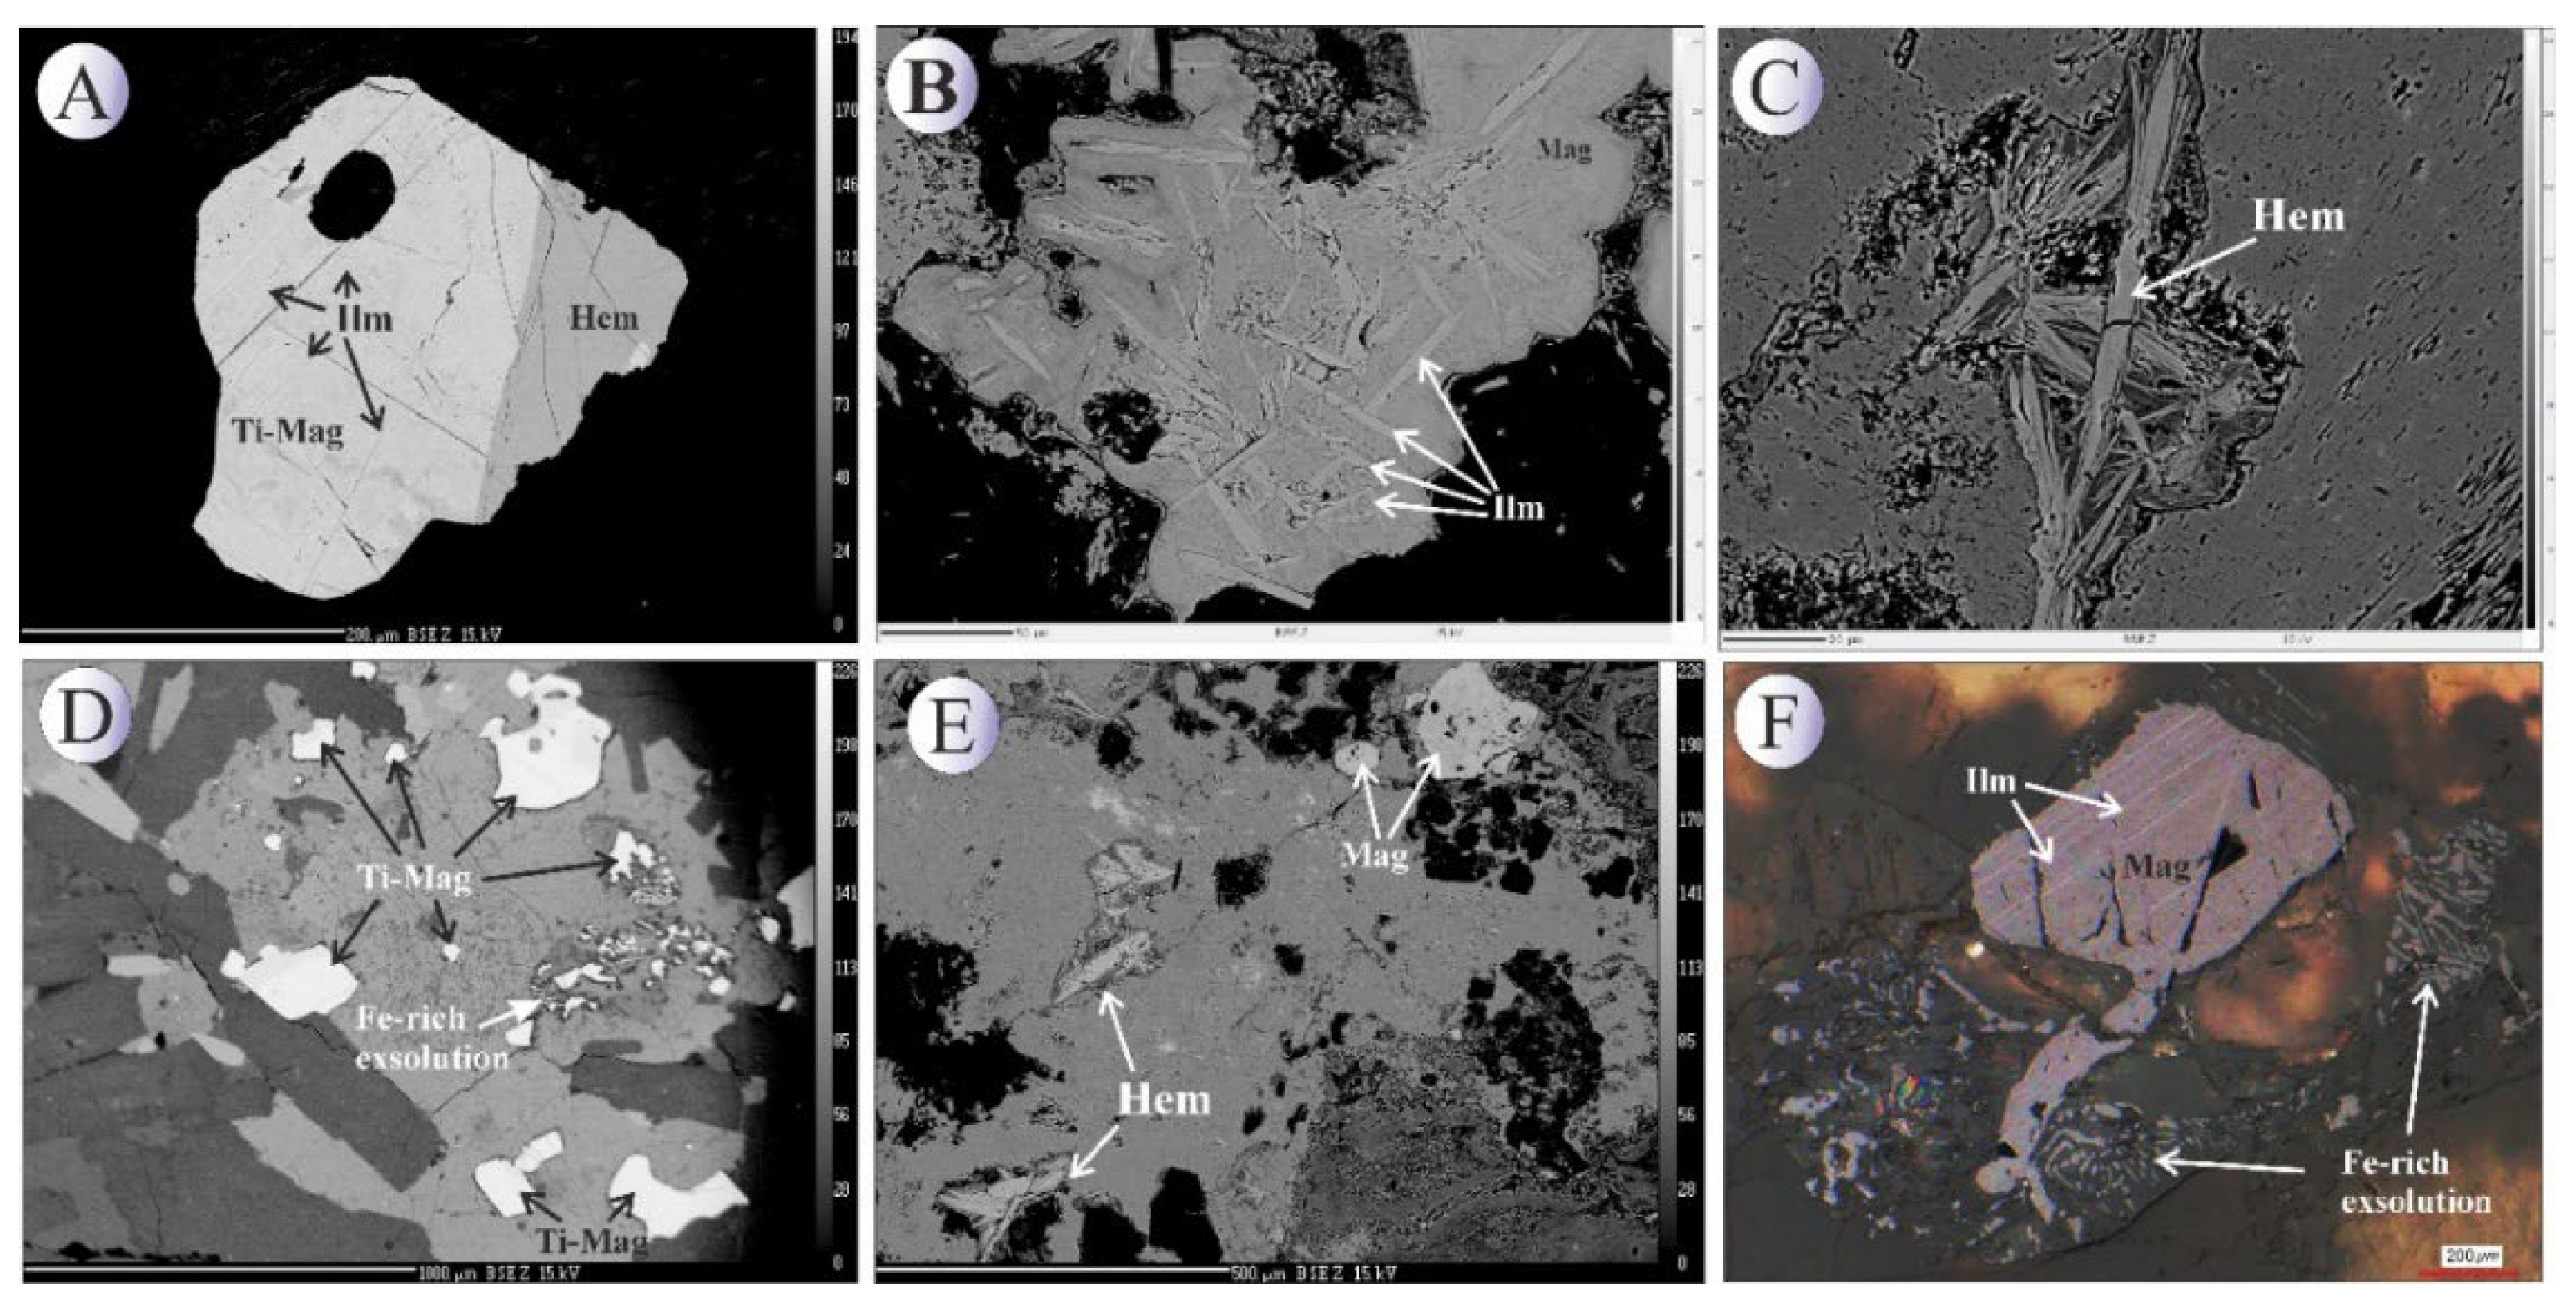
Figure 10.
(A) Boxplots showing the distribution of major oxides (wt.%)—except Fe₂O₃—in titanomagnetite from intrusive rocks of NE Saveh on a logarithmic scale. Boxes represent the interquartile range (IQR) with median lines and whiskers of 1.5×IQR; n values indicate detected/total analyses. (B) Violin plots of the same data showing kernel density distributions and compositional variability. Non-detected and zero values were excluded.
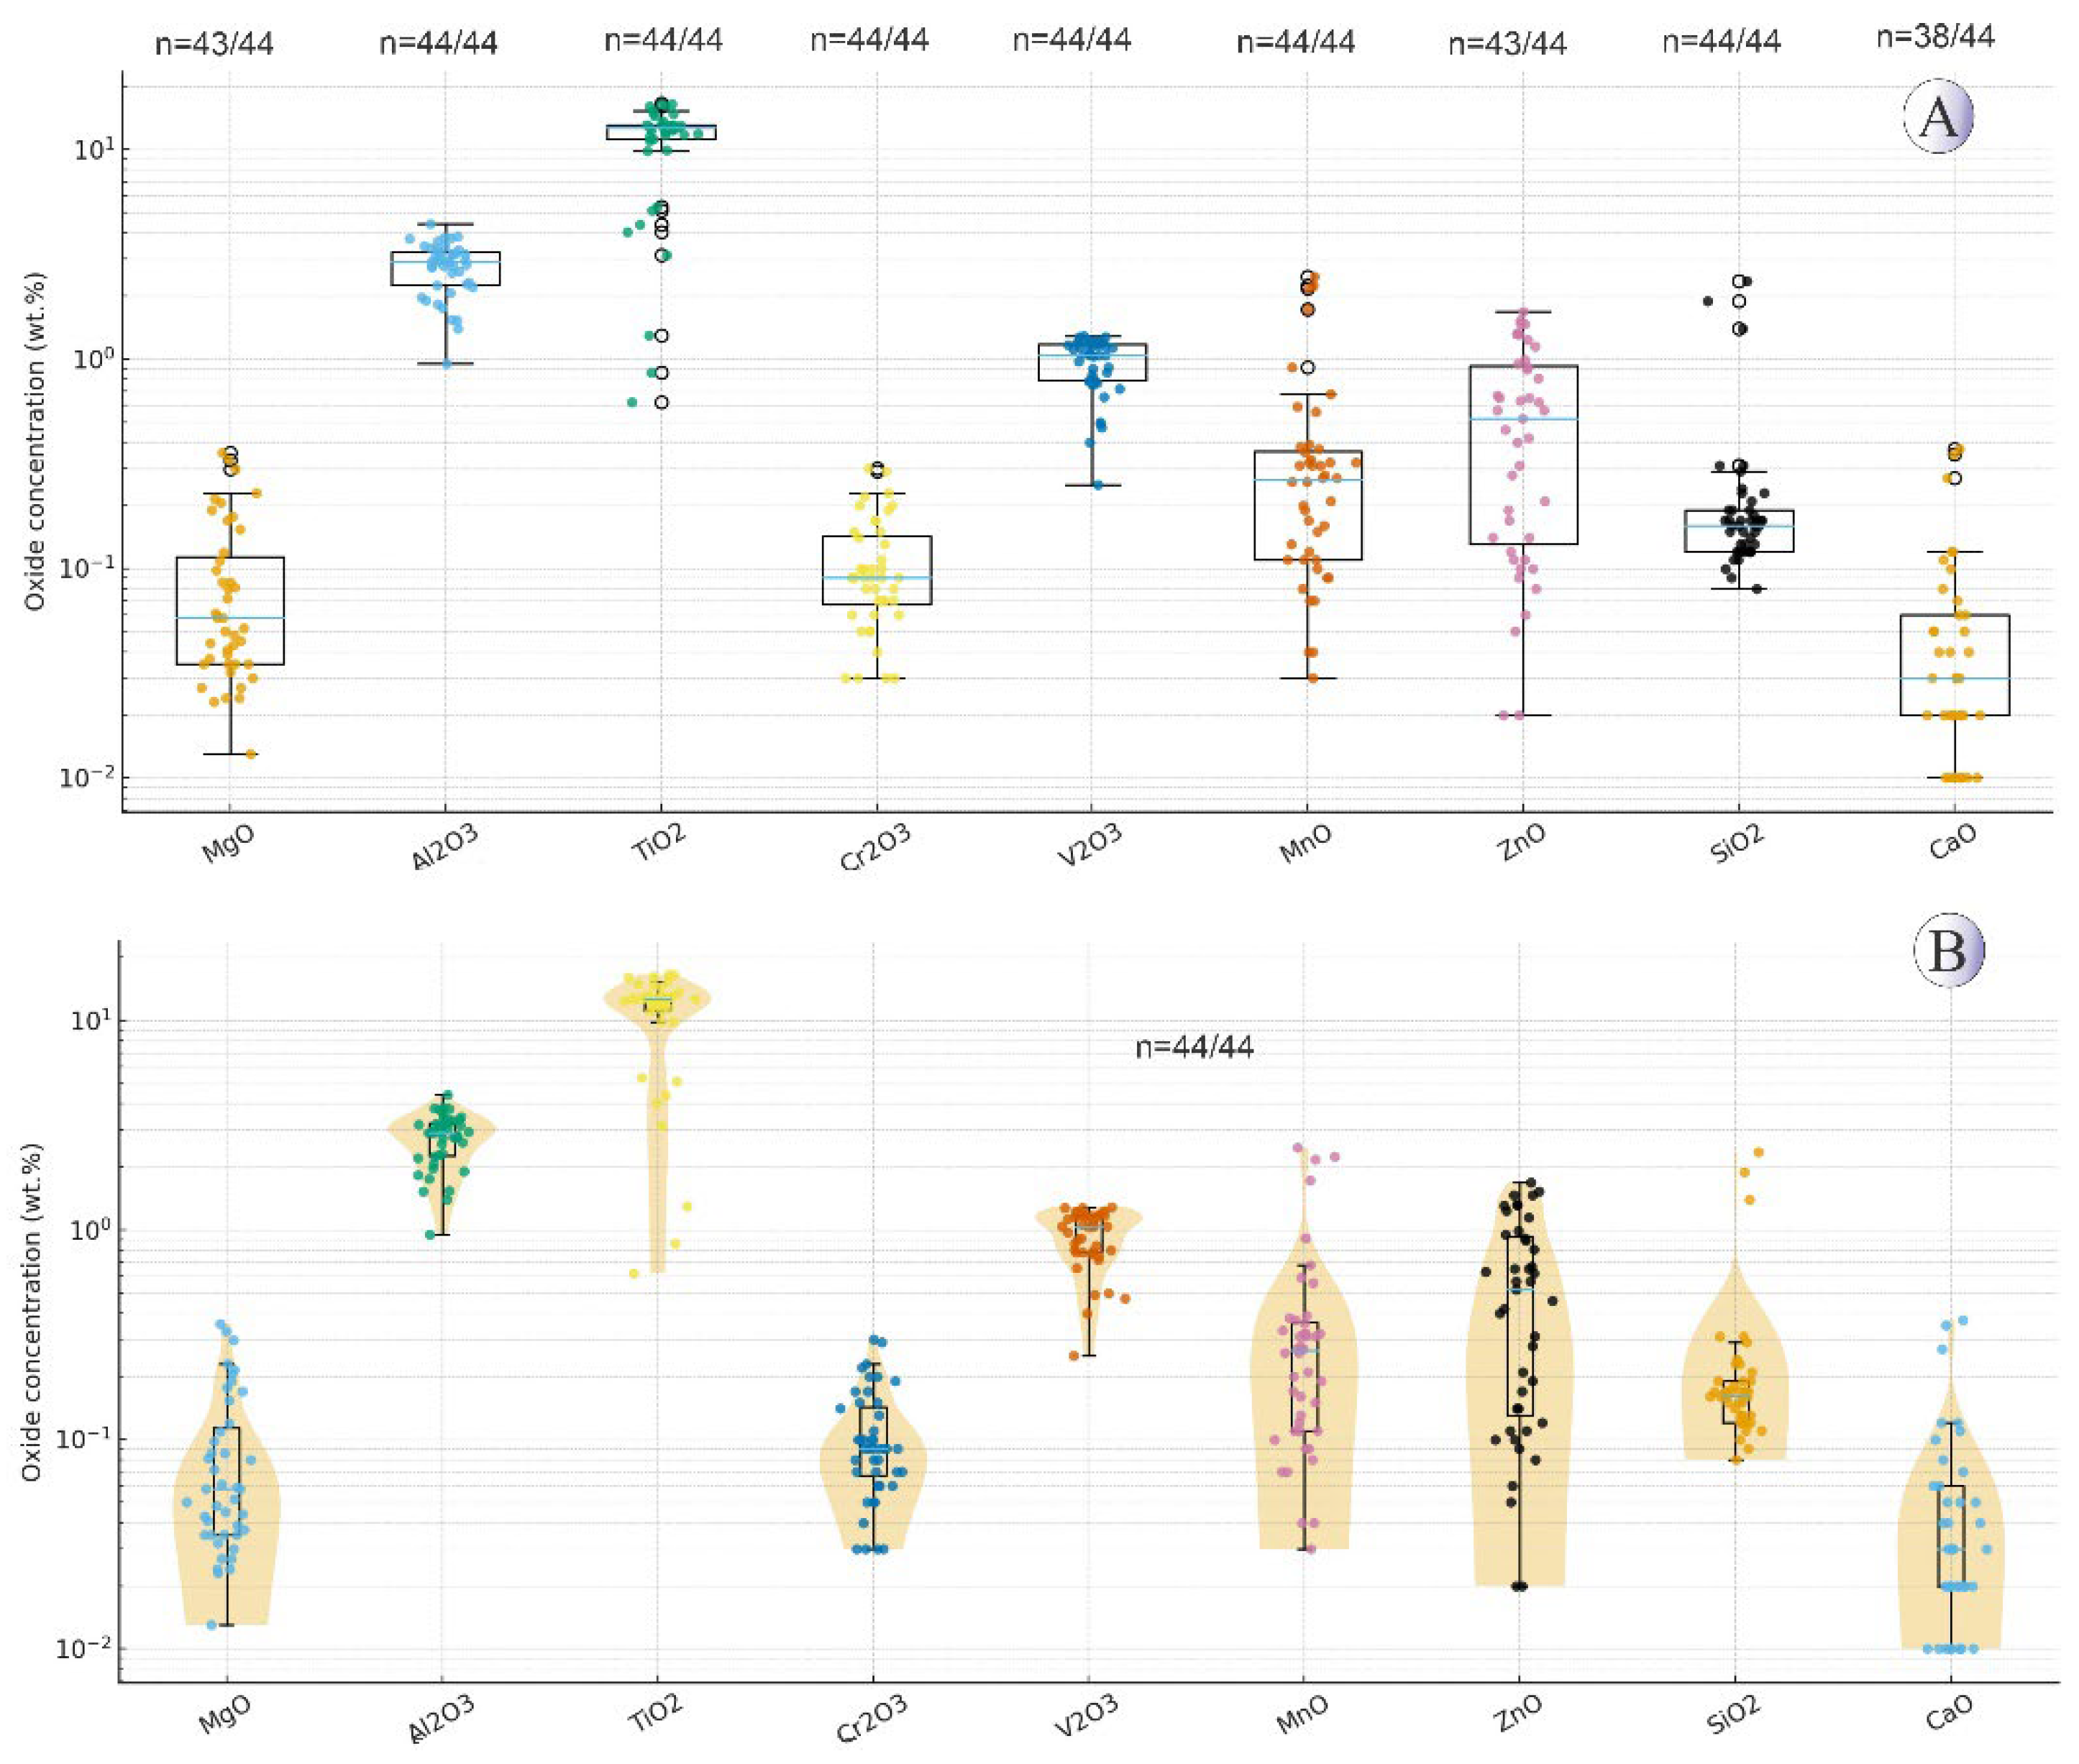
Figure 11.
(A) Boxplots illustrating major oxide variations (wt.%)—except Fe₂O₃—in magnetite from mineralized quartz veins of NE Saveh on a logarithmic scale. Boxes represent the IQR with median lines and whiskers of 1.5×IQR; n values indicate detected/total analyses. (B) Violin plots of the same dataset showing density distributions and compositional trends. Non-detected and zero values were excluded.
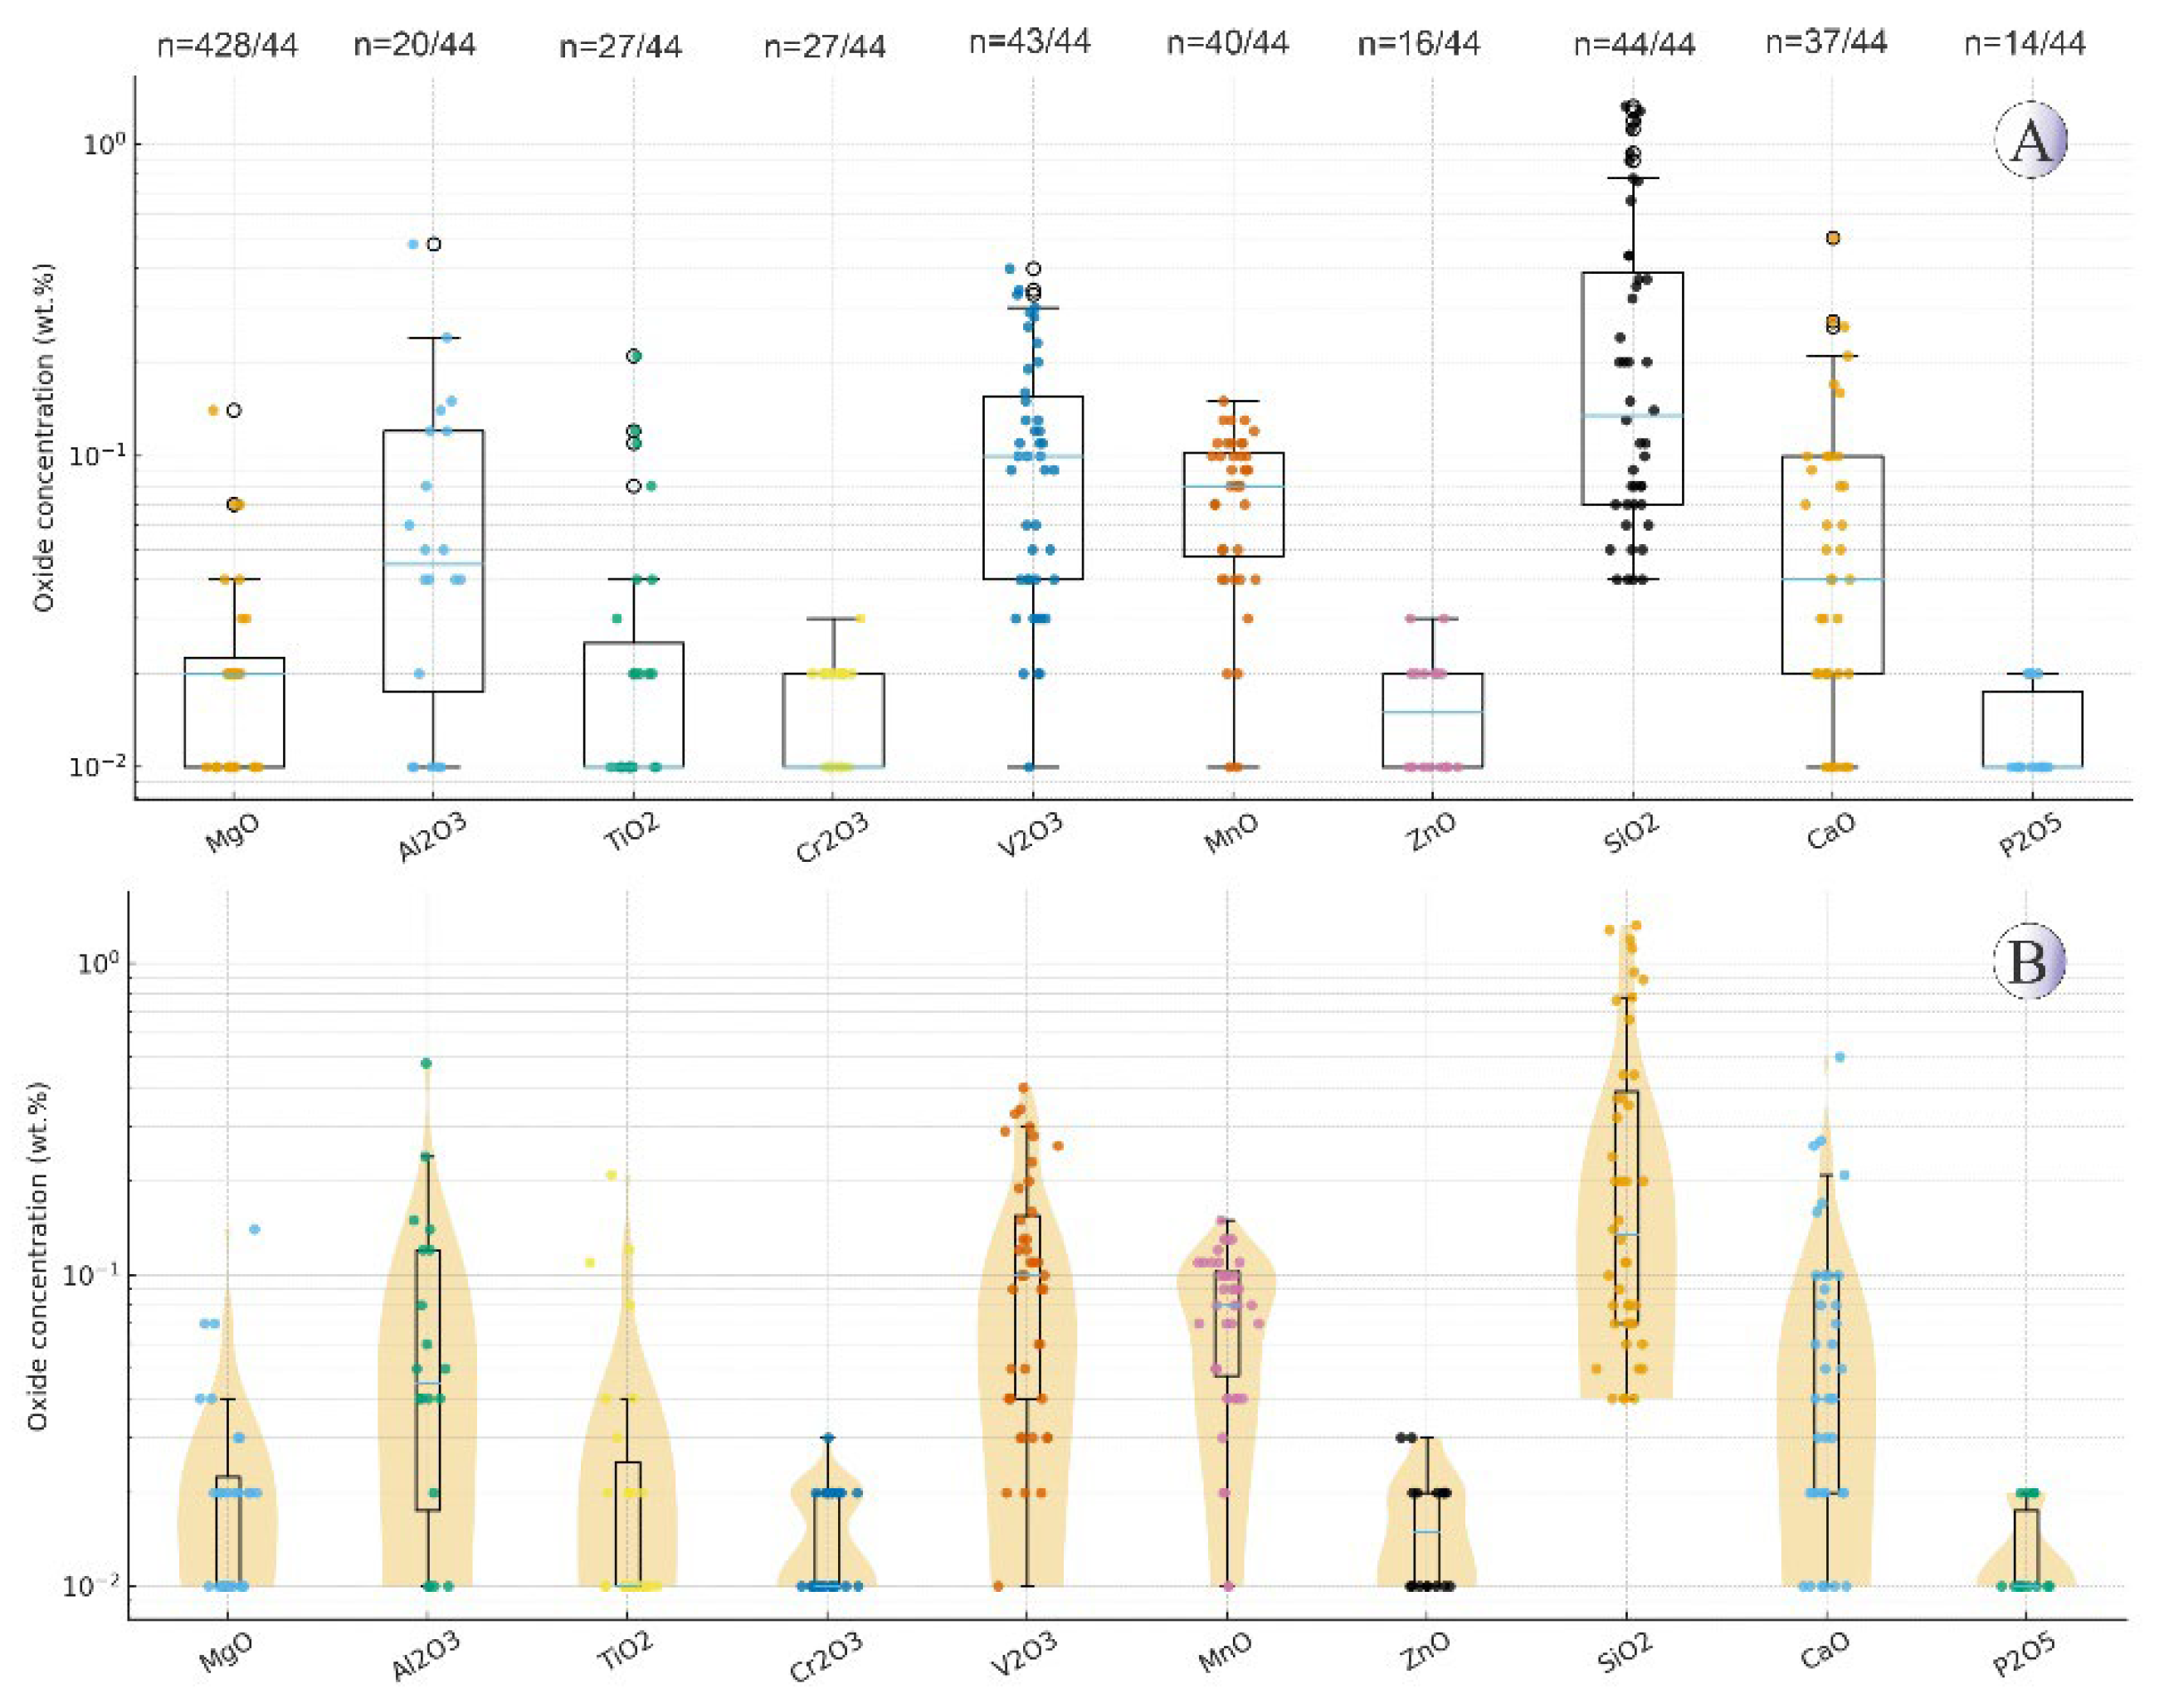
Figure 12.
Major oxides (wt.%) vs. TiO2 (wt.%) and FeO (wt.%) in titanomagnetite related to intrusive rocks in Northeast Saveh. A) TiO2 vs. Al2O3. B) TiO2 vs. Cr2O3. C) TiO2 vs. FeO. D) TiO2 vs. V2O3. E) TiO2 vs. MnO. F) TiO2 vs. MgO. G) FeO vs. Al2O3. H) FeO vs. V2O3. I) FeO vs. Cr2O3.
Figure 12.
Major oxides (wt.%) vs. TiO2 (wt.%) and FeO (wt.%) in titanomagnetite related to intrusive rocks in Northeast Saveh. A) TiO2 vs. Al2O3. B) TiO2 vs. Cr2O3. C) TiO2 vs. FeO. D) TiO2 vs. V2O3. E) TiO2 vs. MnO. F) TiO2 vs. MgO. G) FeO vs. Al2O3. H) FeO vs. V2O3. I) FeO vs. Cr2O3.
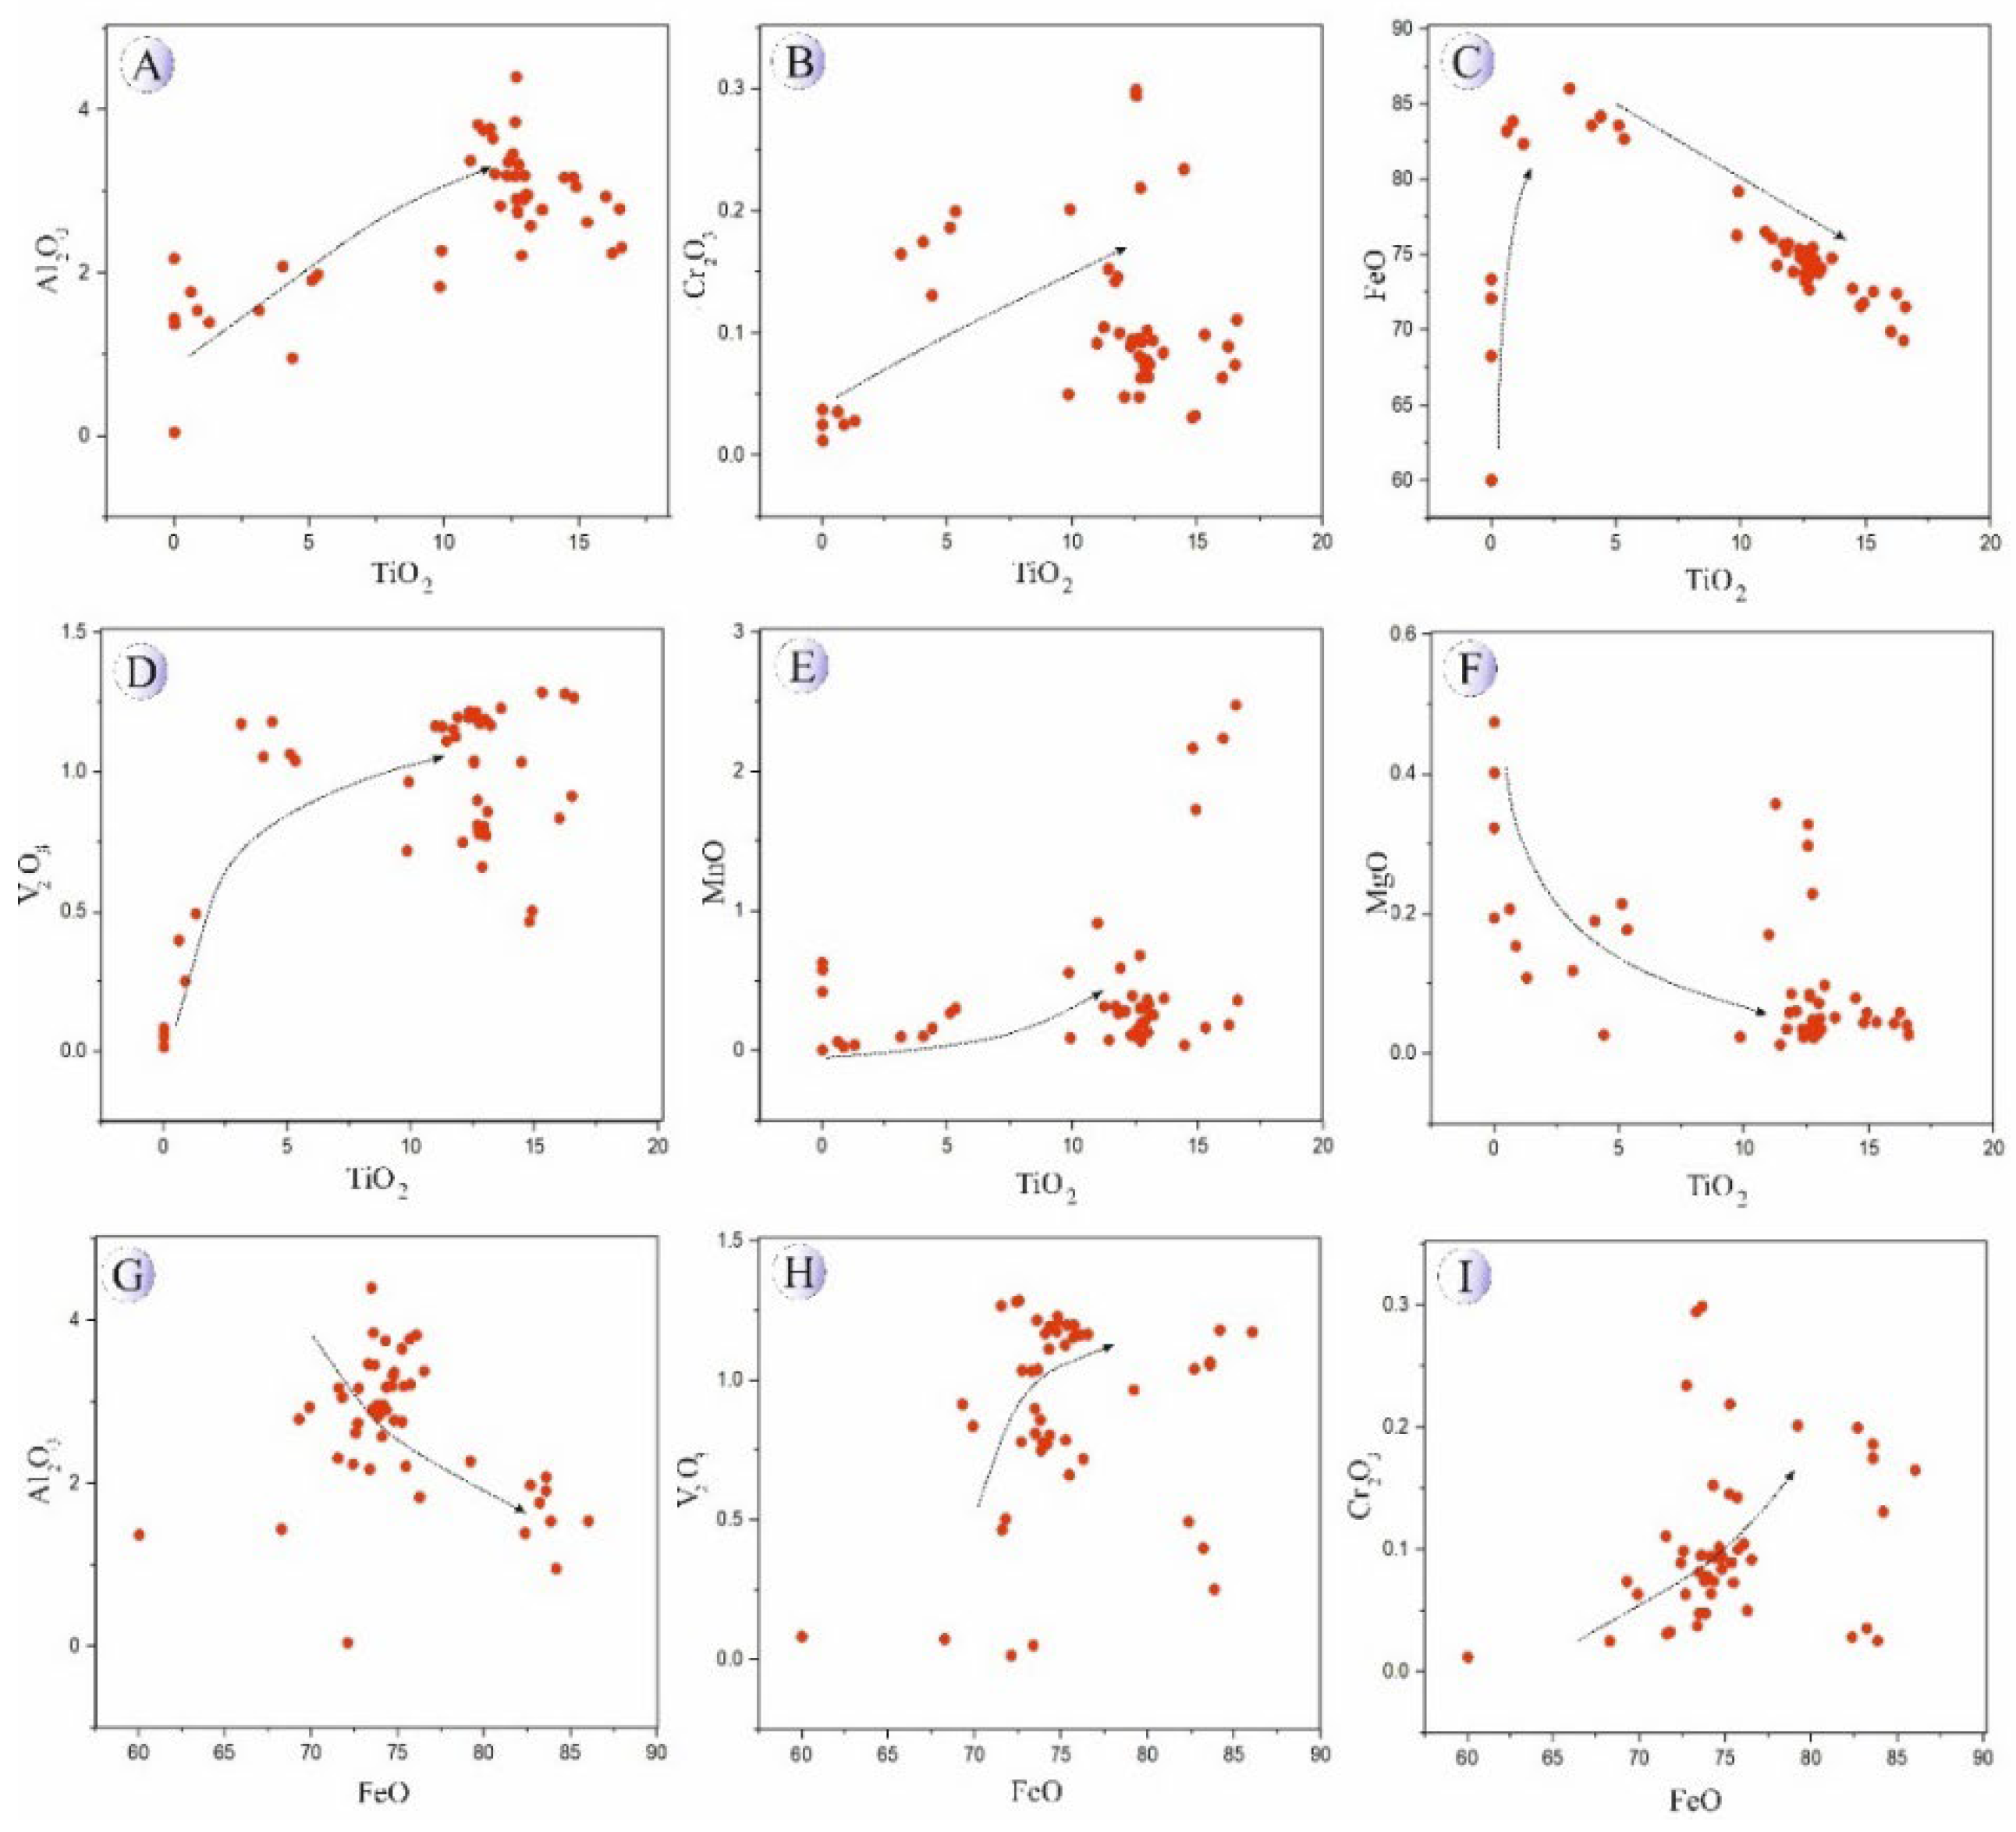
Figure 13.
Major oxides (wt.%) versus TiO2 (wt.%) and FeO (wt.%) in magnetites related to mineralized veins in Northeast Saveh. A) TiO2 vs. Al2O3. B) TiO2 vs. Cr2O3. C) TiO2 vs. FeO. D) TiO2 vs. V2O3. E) TiO2 vs. MnO. F) TiO2 vs. MgO. G) FeO vs. Al2O3. H) FeO vs. V2O3. I) FeO vs. Cr2O3.
Figure 13.
Major oxides (wt.%) versus TiO2 (wt.%) and FeO (wt.%) in magnetites related to mineralized veins in Northeast Saveh. A) TiO2 vs. Al2O3. B) TiO2 vs. Cr2O3. C) TiO2 vs. FeO. D) TiO2 vs. V2O3. E) TiO2 vs. MnO. F) TiO2 vs. MgO. G) FeO vs. Al2O3. H) FeO vs. V2O3. I) FeO vs. Cr2O3.
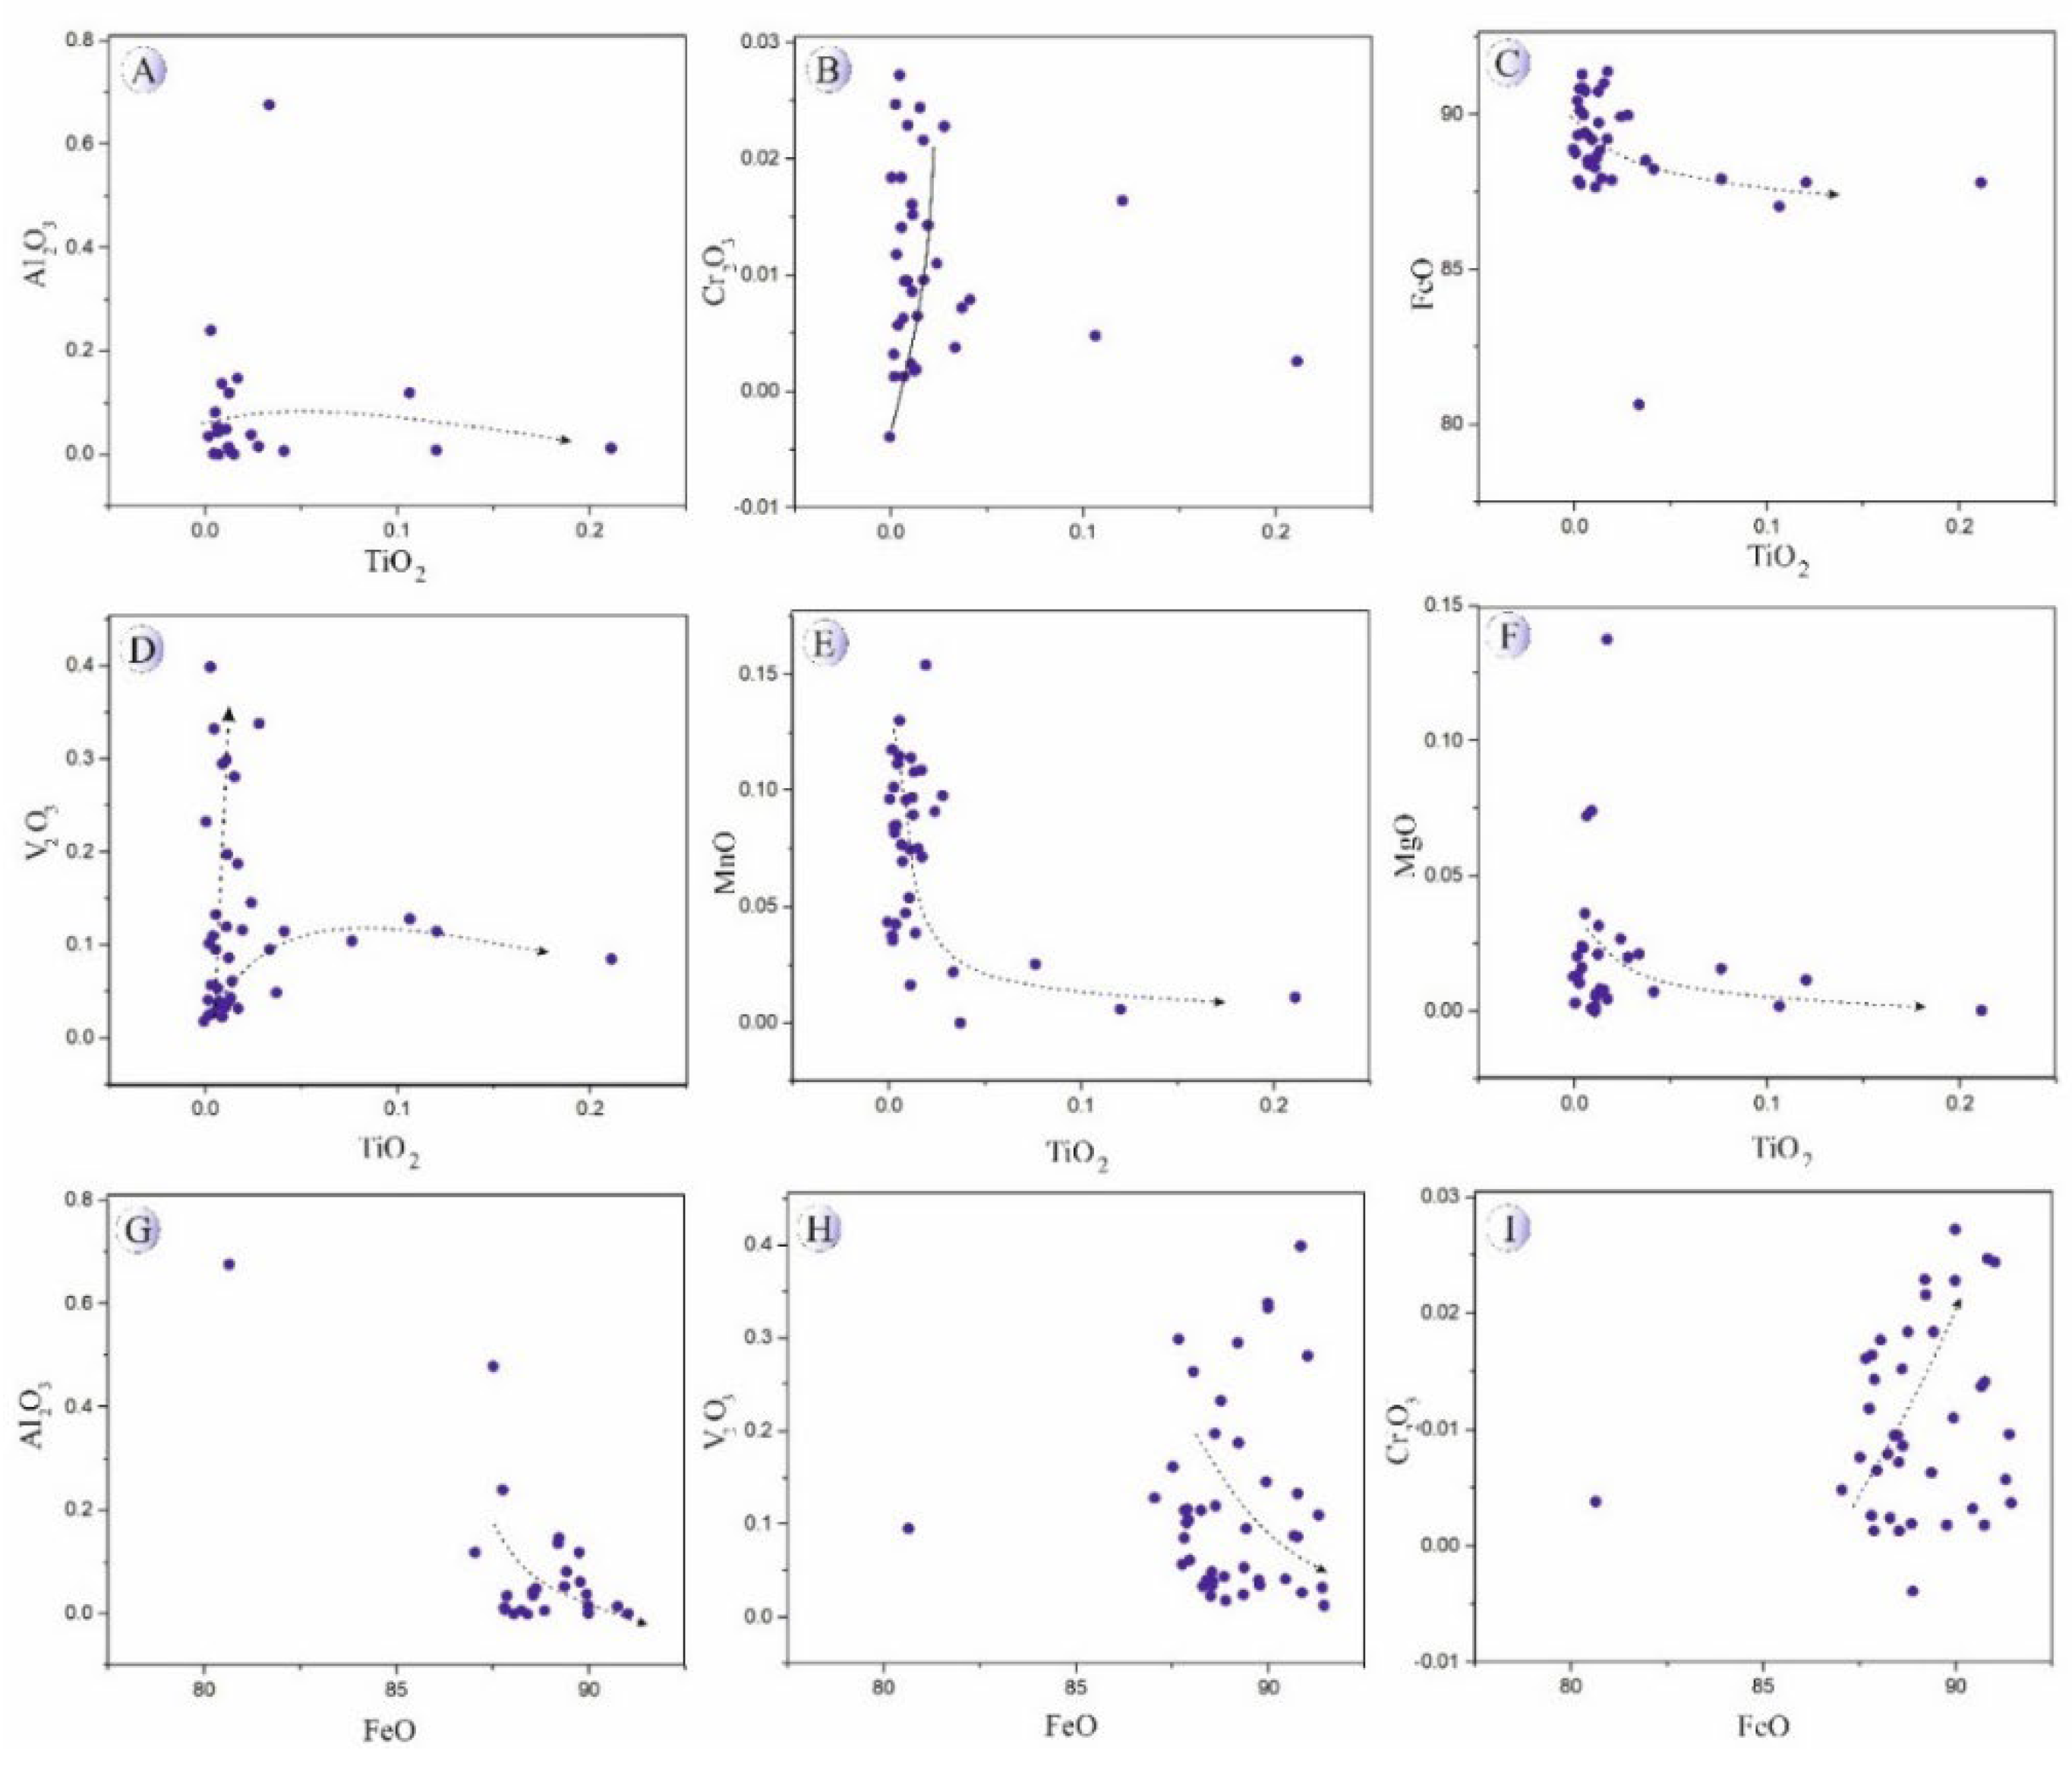
Table 3.
Pearson Product correlation coefficient matrix for elements measured in magnetites and titanomagnetites in the Northeast Saveh intrusive rocks.
Table 3.
Pearson Product correlation coefficient matrix for elements measured in magnetites and titanomagnetites in the Northeast Saveh intrusive rocks.
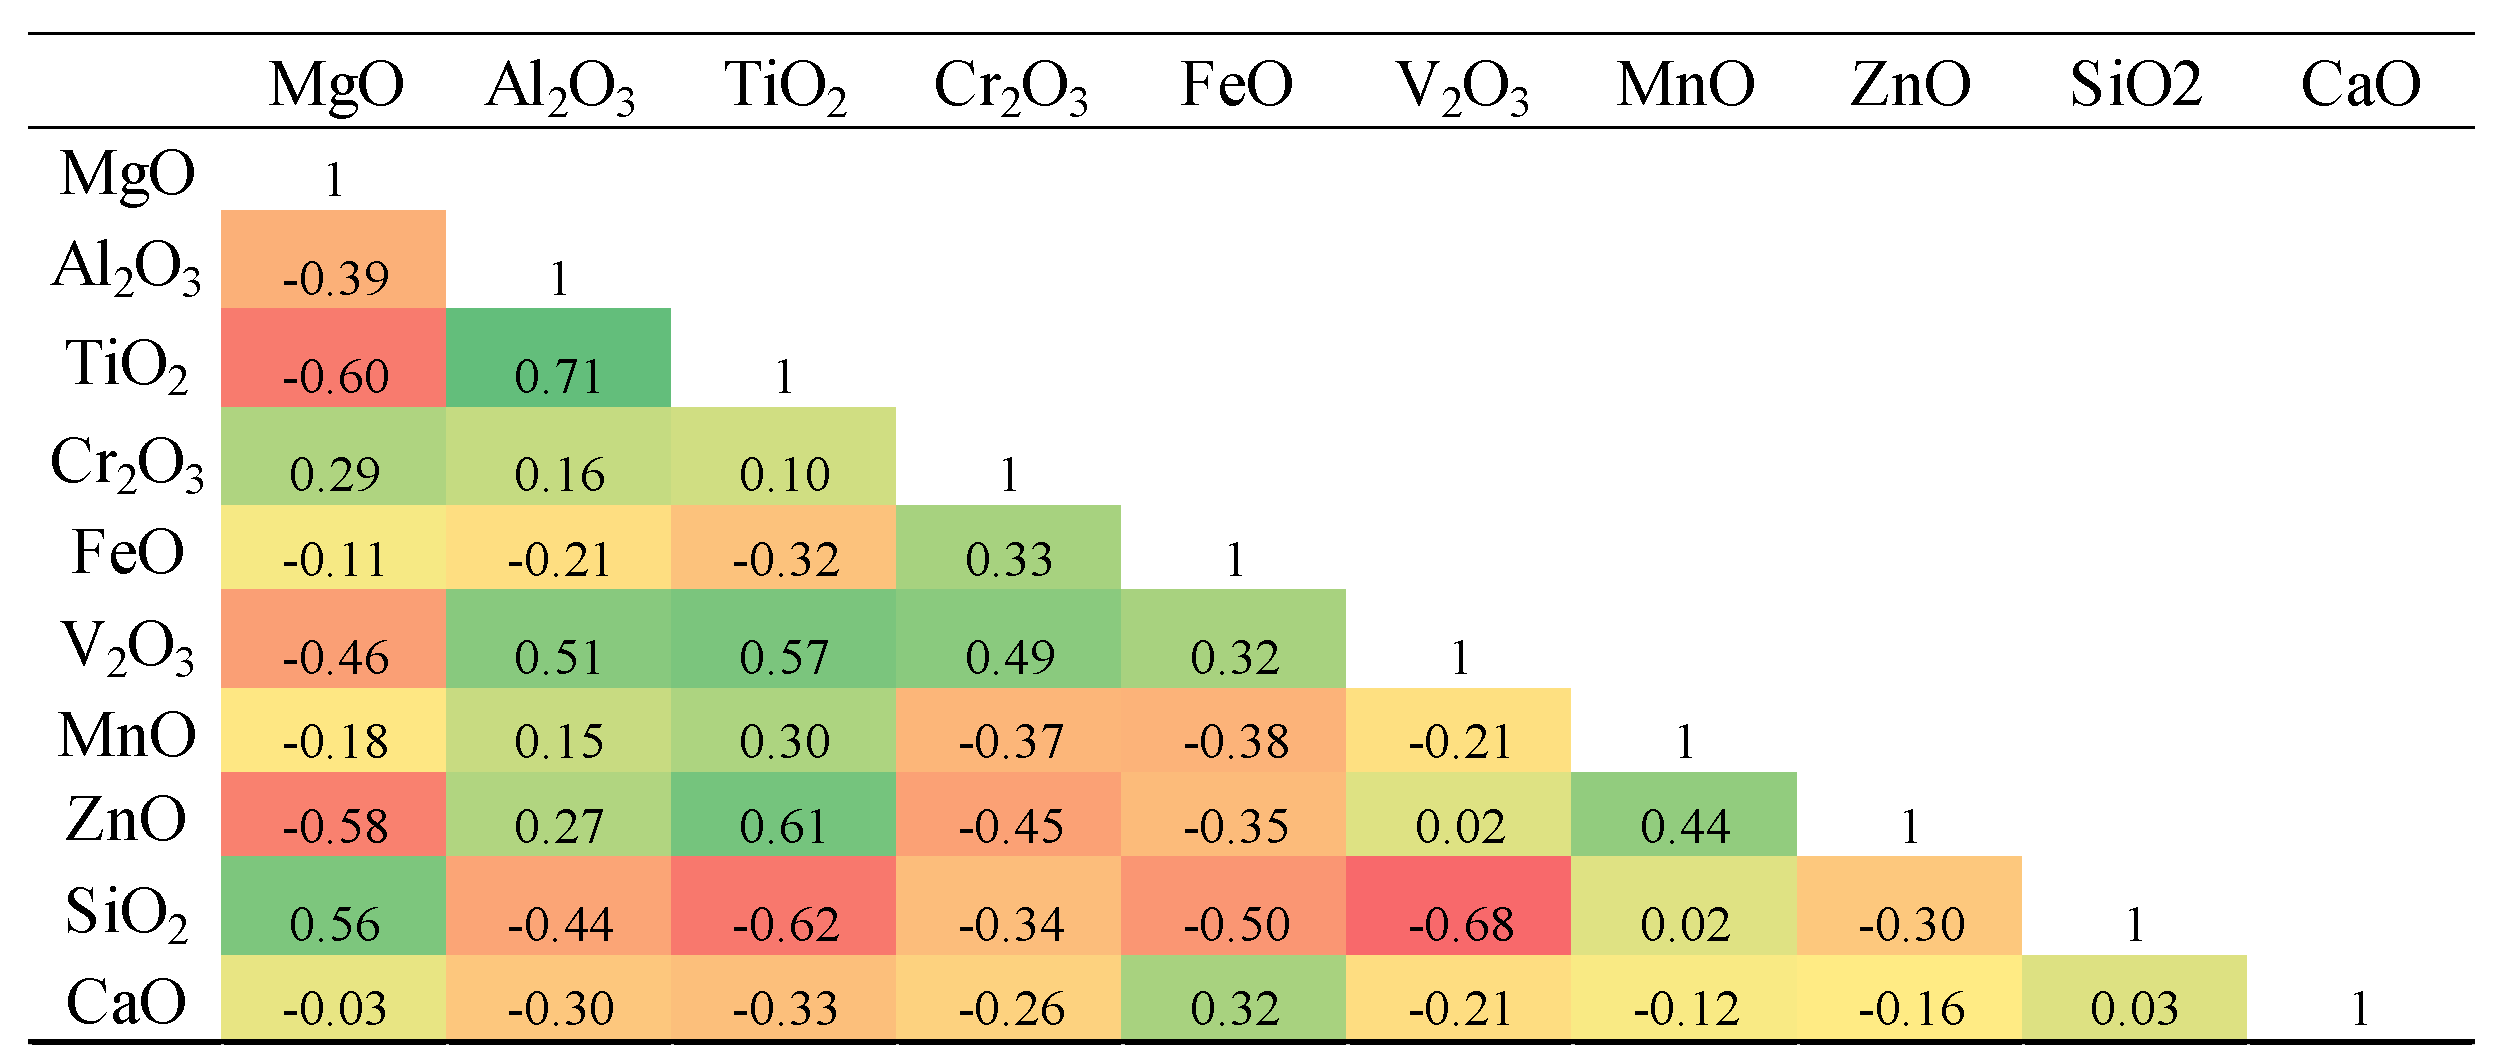
Table 4.
Pearson Product correlation coefficient matrix for elements measured in magnetites and titanomagnetites in mineralized veins.
Table 4.
Pearson Product correlation coefficient matrix for elements measured in magnetites and titanomagnetites in mineralized veins.
5. Discussion
5.1. Pyrite Trace Element Behavior and Implications for Ore Genesis
The trace-element composition of sulfides is strongly controlled by the physico-chemical conditions of mineralizing hydrothermal fluids, particularly temperature, pH and redox state—and therefore can be used to infer ore-forming processes e.g., [2], [4,6,23,24]. In this context, the Co–Ni–As element suite in pyrite has long been recognized as a robust genetic indicator that reflects the geological setting and evolution of an ore system [25,26].
Plotting the Northeast Saveh pyrite data on Co–Ni–As discrimination diagrams (Figure 14; after [26,27]) reveals a predominant shift toward the Co-enriched endmember, consistent with magmatic–hydrothermal to epithermal affinities (Figure 14A). This pattern suggests a dominant magmatic water source during the early stages of mineralization, with progressive involvement of meteoric waters during later stages.
The degree of S→As substitution in pyrite is temperature-sensitive and generally increases at lower temperatures [28], so elevated As contents are commonly associated with cooler, more evolved fluids.
Nickel commonly concentrates in early, high-temperature phases formed during magmatic differentiation. As differentiation proceeds Ni tends to decline while Co can become relatively enriched. Thus, the systematic shift of our samples toward higher Co/Ni ratios is compatible with cooling and evolution of the ore fluids. In addition, the relative abundance of As in pyrite is strongly influenced by the relative contributions of magmatic versus meteoric waters, magmatic-dominated fluids tend to produce Co-rich pyrite compositions, whereas increasing meteoric-water input drives the signature toward higher As contents [26]. The Northeast Saveh pyrite data (Figure 14A) are therefore best interpreted as recording an evolution from an earl y magmatic-water dominated system to later stages with increased meteoric-water input.
Mixing of mineralizing fluids with high-fO₂ meteoric waters can also promote oxidation of arsenic species (As (0) → As 3+/As 5+, driving arsenic out of the pyrite lattice and into the fluid phase as oxide or oxyanion species (e.g., As₂O₃, As₂O₅). This process can reduce As concentrations in primary pyrite while increasing the mobility and redistribution of As within the evolving system, potentially causing As enrichment in other parts of the hydrothermal column or in secondary phases [29,30].
Complementary evidence from the magnetite chemistry (see chapter 5.3) supports elevated fO₂ in the hydrothermal veins and a cooling trend during system evolution. Classic vertical zoning observed in epithermal systems—where the upper levels are enriched in As, Sb, Hg, Ba and Ag, the mid-levels in Cu, Pb, Zn and Bi, and the deep levels in Co, Ni, Ti and Cr [31]—provides a useful framework for interpreting the Northeast Saveh pyrite data. As illustrated in Figure 14B, most Northeast Saveh pyrite samples plot within the middle to deeper sector of this zoning model, consistent with a predominantly mid-system hydrothermal character with some contribution from deeper, higher-temperature inputs.
In summary, the trace-element systematics of pyrite from Northeast Saveh reflect a multistage hydrothermal evolution, with an early, magmatic-fluid dominated stage (Co-rich signature) followed by progressive cooling and admixture of meteoric waters (increasing As signatures and oxidation).
Pyrite can incorporate appreciable amounts of copper [32], and, in the Northeast Saveh pyrites Cu reaches up to ~0.95 wt.% in some samples. Copper substitution in the pyrite lattice is principally accommodated by the similarity in oxidation state and ionic/atomic radii between Cu²⁺ and Fe (reported here as Cu ≈ 1.28 Å and Fe ≈ 1.56 Å), allowing Cu²⁺ to substitute for Fe²⁺ in the structure; however, Cu cannot substitute for sulfur (S²⁻) because of the large differences in charge and radius between Cu and S. This capacity of pyrite to sequester Cu implies that pyrite may act as a significant transient sink for copper during mineralization and supergene overprint.
Lead is unlikely to enter the pyrite lattice except as Pb²⁺, due to its large ionic radius (~1.8 Å). Galena (PbS) precipitates from solution more rapidly than FeS [33,34], so galena typically forms early and, when present, is usually found as inclusions within pyrite [35]. However, no galena inclusions were observed in the Northeast Saveh pyrites. Pyrite can also trap certain chalcophile elements such as Ag, Sb and Sn during remobilization; in the Northeast Saveh samples the maximum concentrations of these elements are low (≈500, 200 and 20 wt.ppm, respectively).
Nickel readily substitutes into the pyrite crystal structure and, once incorporated, is relatively resistant to removal during later recrystallization [4,33,34,36]. Thus, pyrite Ni contents may record information about the source of the mineralizing fluid. Mantle- and mafic–ultramafic-related lithologies are typically Ni-rich, whereas felsic units have low Ni contents [35,37]. The Ni contents measured in the studied pyrites (up to ~0.34 wt.%) exceed typical continental-crust Ni concentrations (≈19–60 µg g⁻¹; [38]), suggesting a contribution from mafic–ultramafic or upper-mantle sources. Previous work in the region [18,19] using trace-element ratios (e.g., Ta, Nb, La) indicates a dominantly mantle (spinel-lherzolitic) source modified by upper-crustal contamination, and Sr–Nd isotope ratios also point to a significant role for mantle metasomatism in the genesis of the intrusions [39].
Reported solubility limits suggest Ni can be accommodated in pyrite up to ~10 mol% NiS₂, whereas Co may achieve complete miscibility with pyrite at temperatures above ~700 °C [40]. This temperature dependence makes pyrite Co content a useful geothermometer [41]. Consequently, the Co/Ni ratio in pyrite is widely applied as a proxy for ore-forming conditions [35,42,43].
Empirically, low Co/Ni ratios (<1) characterize sedimentary/diagenetic pyrite [42], diagenetic pyrites commonly also show low Co/Ni (≤2), whereas hydrothermal pyrites typically display higher Co/Ni [4,23]. Co/Ni ratios between ~1 and 10 are diagnostic of magmatic–hydrothermal deposits [44,45]. The Co/Ni distribution for Northeast Saveh pyrites predominantly falls between 1 and 10 (Figure 15), consistent with a magmatic–hydrothermal origin.
Given the similar geochemical behavior of Co and Ni, nickel solubility in hydrothermal fluids is primarily controlled by temperature [25]. Cooling of the hydrothermal fluid therefore tends to decrease the solubility of these trace metals and promotes their precipitation as discrete phases or their incorporation into sulfides (e.g., pyrite). Co and Ni are generally incorporated into the pyrite lattice by direct substitution for Fe²⁺. In contrast, As incorporation occurs through charge-balanced, coupled-substitution mechanisms rather than simple one-for-one replacement. Specifically, As³⁺ may occupy Fe²⁺ sites with charge compensation achieved by Fe vacancies or complementary anion/cation substitutions, while reduced As¹⁻ may substitute for S²⁻ with local charge balance adjustments [3,46,47]. Accordingly, Co, Ni, and As are likely present as solid-solution components in pyrites. Because of its relatively large ionic radius, Although Pb commonly occurs as Pb²⁺ in aqueous solution, Pb is not readily accommodated as a point defect in the pyrite lattice; minor Pb in pyrite samples most likely reflects nanoscale galena or other Pb-bearing inclusions, or surface/secondary Pb phases, rather than true lattice substitution [48,49].
Hydrothermal pyrites with elevated Co/Ni ratios have been reported from a range of magmatic–hydrothermal deposits worldwide (for example, vein-type Ag–Pb–Zn deposits; [50]; IOCG systems, [51]; skarn Au–Cu deposits, [52]; and Pb–Zn skarns, [53], and are commonly attributed to intense fluid–rock interaction. On the basis of the evidence summarized above, pyrites from Northeast Saveh appear to be dominantly hydrothermal in origin and to have formed through interaction between magmatic–hydrothermal fluids and the plutonic host rocks.
5.2. Chalcopyrite-Chalcocite Trace Element Behavior and Implications for Ore Genesis
The concentration of trace elements in chalcopyrite is influenced by several key factors, including the intrinsic properties of the elements, coupled substitution mechanisms, and competition among co-crystallizing sulfides [8]. In addition, physicochemical conditions such as temperature, pH, oxygen fugacity (fO₂), and sulfur fugacity (fS₂) have a significant impact on the incorporation of these elements into chalcopyrite [8,54,55,56]. Co-existing sulfide phases certainly exert a strong first-order control.as well for example, sphalerite, galena or bornite may sequester specific chalcophiles, limiting their availability for chalcopyrite [8,57].
The combined major- and trace-element datasets and BSE textures define a coherent, fluid-driven replacement history in which primary chalcopyrite was the dominant magmatic–hydrothermal Cu reservoir that was subsequently dissolved and reprecipitated as Cu-rich sulfides along sharp reaction fronts.
Figure 16 highlights the compositional change associated with the chalcopyrite→chalcocite transformation, copper is concentrated in the secondary chalcocite, while iron is depleted relative to primary chalcopyrite. This pattern supports a model of supergene oxidation and downward copper remobilization with partial replacement of primary sulfides. The major-element trends in chalcopyrite (≈33–35 wt.% Cu, 28–30 wt.% Fe, 33–35 wt.% S) versus chalcocite (≈74–77 wt.% Cu, 3–4 wt.% Fe, 22–25 wt.% S) demonstrate a classic Fe-depletion/Cu-enrichment trajectory consistent with fluid-controlled dissolution–reprecipitation [41,58]. The near-quantitative loss of Fe from the lattice and simultaneous increase in Cu/S ratio reflects interface-coupled dissolution of chalcopyrite and local precipitation of Cu-rich sulfides at the reaction front, rather than solid-state diffusion. This replacement style is supported by thin Cct/Cv rinds, fracture-controlled infills, and partial pseudomorphs, all pointing to an open, fluid-dominated system with sharp disequilibrium boundaries.
Trace-element patterns refine this genetic scenario (Figure 17 and Figure 18). Chalcopyrite shows moderate Pb, Ag, Sb and Zn, with Pb having the broadest variability; chalcocite displays marked enrichment in Zn and Ag and retains variable Pb. This implies two complementary processes: (1) coupled lattice substitution (Pb–Bi, Sb–As, Sn–In type pairings) that reflects formation conditions and crystal-chemical accommodation [8,59], and (2) inclusion-entrainment or co-precipitation where micron/nano inclusions of sphalerite, bornite-derived phases or galena are reworked during replacement and become incorporated into secondary chalcocite [60,61]. The pronounced Zn signal in chalcocite, in particular, is best explained by remobilization of wall-rock or precursor sphalerite-derived Zn and local co-precipitation with chalcocite [8] S.
Redox, pH and temperature exert primary control on sequence and kinetics. Experimental and field work indicate that covellite commonly forms first, with chalcocite/digenite developing rapidly at intermediate temperatures (≈200–300 °C) or after a longer induction period at lower T (<~200 °C) [58]. The dominant replacement textures thin chalcocite/covellite rinds around chalcopyrite and bornite, fracture-controlled infillings, and partial pseudomorphism point to a multi-stage, evolving physicochemical environment (Figure 3 and Figure 8). Microscopically, these processes produce sharp chemical zoning at grain boundaries, inclusion-bearing textures and occasional overgrowths, which are well documented in BSE imagery (Figure 8) and EPMA spot analyses.
The fluid regime is therefore episodic and Cu-bearing. Sulfidic pulses (or evolving ligand chemistry, e.g., chloride → sulfide complexes) promoted rapid local precipitation of low-Fe Cu sulfides, while Fe was likely transported predominantly as Fe³⁺ (and possibly Fe²⁺) species in the H₂O-rich, moderately oxidizing fluid [41].
High-T conditions (>~500–600 °C) increase the capacity of chalcopyrite to host Ga, In, Sn, Zn, Mo and noble metals [8]. Studies demonstrate strong positive correlations between temperature and trace uptake (e.g., Zn solubility rises with T; [62,63]. Reported Au contents in chalcopyrite from porphyry systems decrease markedly with decreasing formation temperature [63] and it can be said that the lack of Au observation in the chalcopyrite s in northeastern Saveh is due to the decrease in system temperature and the onset of the epithermal system (e.g., [20,21].
In many porphyry/epithermal systems, observed positive correlations (e.g., Pb–Bi, Pb–Mo, Zn–Cd, Sn–In, Sb–As, Sb–Ge) imply paired or linked substitutions and/or co-entrainment in inclusions, consistent with reports of Au, Ag, As, Te, In, Zn, Cd, Ge and Ga entering chalcopyrite via coupled mechanisms [59,64].
Cobalt and nickel are typically associated with fluids derived from mafic magmas or leached from rocks with a high background content of these elements [2,32,40]. The Co/Ni ratio in chalcopyrite from porphyry, skarn, and epithermal hydrothermal deposits is typically greater than 1, whereas in Cu-Ni sulfide deposits, it is less than 1 [65]. The Co/Ni ratio in Northeast Saveh chalcopyrites is predominantly above 1, aligning with the characteristics of chalcopyrite in hydrothermal deposits. The general immobility of Co–Ni during chalcopyrite → chalcocite replacement implies the replacement front selectively partitioned Fe and Cu while leaving Co–Ni distributions largely intact.
5.3. Magnetite-Titanomagnetite Trace Element Behavior and Implications for Ore Genesis
The composition of titanomagnetites in the intrusive bodies and hydrothermal veins of Northeast Saveh lies below the magnetite-ulvöspinel join, with a tendency toward the wüstite (FeO) component (Figure 19). Martitized hematite observed in thin sections indicate that martitization of magnetite occurred during the final stages of oxidation, accompanied by decreasing temperature and increasing oxygen fugacity [66].
With increasing temperature, the titanomagnetite solid solution separates into ulvöspinel and magnetite, with magnetite acting as the host for ulvöspinel lamellae along (111) planes, forming a Widmanstätten texture [66]. Subsequently, ilmenite may form as ulvöspinel becomes unstable during cooling/oxidation. Two relevant pathways are: internal oxidation of ulvöspinel yielding magnetite plus ilmenite:
3 Fe2TiO4 + 1/2 O2 → Fe3O4 + 3 FeTiO3
(or equivalently 6 Fe2TiO4 + O2 → 2 Fe3O4 + 6 FeTiO3), and reaction of ulvöspinel with available TiO₂ to produce ilmenite:
Fe2TiO4 + TiO2 → 2 FeTiO3.
The first reaction corresponds to oxidation-driven redistribution of Ti and conversion of titanomagnetite/ulvöspinel to magnetite + ilmenite; the second requires an external TiO₂ phase (e.g., rutile or exsolved Ti-oxide). If rutile is present in samples (or TiO₂ is liberated by exsolution/dissolution), reaction (2) will promote ilmenite formation at lower temperatures
These reactions indicate that the initial stage involved a titanomagnetite solid solution, which, with increasing oxygen fugacity and decreasing temperature, led to the formation of ilmenite lamellae within titanomagnetite. Thin ilmenite lamellae represent the instability of titanomagnetite, whereas thicker lamellae result from internal exsolution after titanomagnetite formation [67].
The degree of martitization varies among titanomagnetites in Northeast Saveh. Under high oxygen fugacity, strongly martitized crystals are occasionally observed. The presence of hematite lamellae within some ilmenites likely formed during the final oxidation stage and cooling of the mineralization system, with ilmenite decomposing according to:
FeTiO3+O2 = 4TiO2+2Fe2O3
Petrographic observations indicate disruption of the cubic structure of titanomagnetite. Thin ilmenite lamellae appear to form during early oxidation of titanomagnetite along planes enriched in Ti, whereas thicker lamellae developed gradually along the (111) and (100) planes due to progressive oxidation of ulvöspinel lamellae coupled with Ti enrichment along these planes. As noted by [68], thick ilmenite lamellae form under advanced oxidation conditions, while thin lamellae develop during initial oxidation stages.
5.3.1. Origin and Compositional Evolution of Titanomagnetite–Magnetite
The chemistry of Fe–Ti oxides is controlled not only by temperature and oxygen fugacity but also by the compositions of the parental magmas and interacting hydrothermal fluids, and by the wall-rock chemistry that is leached during fluid–rock interaction [12,14,70]. Because cation mobility (e.g., Fe²⁺ and minor substituents) is limited during moderate-temperature martitization, hematite formed by oxidation commonly preserves much of the primary magnetite signature; however, dissolution of coexisting silicates can enrich hydrothermal fluids in elements such as Mg, Al and Ti, producing hematite that is locally enriched in those added elements compared with primary magnetite [12,70].
Comparison of intrusive titanomagnetites and hydrothermal magnetites from the mineralized veins in Northeast Saveh demonstrates element redistribution during oxide phase transformations (Figure 20). Titanomagnetites from the intrusive bodies are enriched in Ti, Al and V, whereas magnetites from the silica-veins are depleted in those elements and show higher Fe contents—consistent with crystallization from a more mafic host for the intrusive (Curtis, 1964) and with later oxidation/repartitioning at elevated fO₂. Measured V₂O₅ in intrusive titanomagnetites ranges from ~0.016 to 1.28 wt.% (mean ≈ 0.88 wt.%), whereas V₂O₅ in vein magnetites ranges from ~0.012 to 0.39 wt.% (mean ≈ 0.12 wt.%)—confirming strong V and Cr enrichment in magmatic oxides relative to hydrothermal counterparts [12].
Vanadium partitioning is highly fO₂-sensitive: at low fO₂ V³⁺ (ionic radius ≈ 64 ppm) substitutes readily for Fe³⁺ (≈ 65 ppm), whereas at higher fO₂ V is oxidized to V⁵⁺ and becomes incompatible with the oxide lattice [71,72,73]. Thus V (and Cr) concentrations in magnetite can record both the magmatic/hydrothermal redox path and fluid–rock reactions during magnetite growth [74,75].
Titanium incorporation into magnetite is likewise temperature-dependent. higher crystallization temperatures favor greater Ti uptake into the titanomagnetite solid solution, whereas cooling (and/or delayed increases in fO₂) promotes Ti exsolution (ilmenite/rutile) as lamellae or rims [76,77,78]. Petrographically, Northeast Saveh titanomagnetites display ilmenite lamellae of variable thickness (thin lamellae from early oxidation; thicker lamellae from exsolution), and martitization textures are common where repeated hydrothermal fluid pulses have leached Fe²⁺ and driven hematite replacement [67,68,79].
Chemical re-equilibration of magnetite during multi-phase hydrothermal activity can alter Ti, Al, Mg, Mn, Ca and Si contents [15,80]. A V/Ti versus Fe bivariate plot effectively discriminates magmatic titanomagnetites from hydrothermally re-equilibrated magnetites [77]. When our mineral data are plotted on this diagram, intrusive samples fall in the magmatic field while vein samples plot in the hydrothermal/re-equilibrated field (Figure 18), indicating the strong influence of hydrothermal fluids on oxide chemistry and the occurrence of repeated fluid release and Fe-leaching during system evolution.
5.3.2. Origin and Compositional Evolution of Titanomagnetite–Magnetite
These compositional differences clearly reflect the contrasting physicochemical conditions between magmatic and hydrothermal systems, particularly the relative oxidation state and temperature during mineral formation. To constrain the formation temperatures of titanomagnetite–magnetite in Northeast Saveh, we plotted the element data on bivariate diagrams. An Al + Mn versus Ti + V (wt.%) plot (Figure 21) indicates that titanomagnetites from the intrusive bodies record high crystallization temperatures, whereas magnetites from silica-rich mineralized veins formed at intermediate temperatures (≈200–300 °C), consistent with fluid-inclusion constraints from quartz in the veins [20]. This trend is interpreted as cooling of the system coupled with progressive input of meteoric/oxidizing fluids during hydrothermal activity and subsequent magnetite precipitation at lower temperatures.
A Ti (wt.ppm) vs Mg + Al + Si (wt.ppm) diagram (after [75]; Figure 22A) further supports extensive fluid–rock interaction during vein magnetite formation. Likewise, plotting Ti (wt.ppm) versus V (wt.ppm) effectively discriminates magmatic from hydrothermal magnetites [12]; Northeast Saveh samples separate clearly into magmatic (intrusive) and hydrothermal (vein) groups on this diagram (Figure 22B).
Vanadium and Ti distributions record redox and thermal evolution (Figure 23). Intrusive titanomagnetites are relatively enriched in V and Ti compared with vein magnetites, consistent with crystallization from a lower-fO₂, higher-T magmatic environment [81,82]. Because V speciation and partitioning are highly oxygen-sensitive [71,83], the observed decrease of V and Cr from intrusive to vein magnetites indicates oxidation and element redistribution during hydrothermal re-equilibration. Plotting V (or V₂O₃) variations suggests a progressive increase in fluid fO₂ from the parental magma toward the mineralized veins, accompanied by cooling and crustal contamination, evidence for intense fluid–rock interaction during ore formation [84].
In sum, oxide geochemistry (Ti, V, Al, Mn) and mineral textures in Northeast Saveh record a high-T, low-fO₂ magmatic origin for intrusive titanomagnetites, followed by hydrothermal overprint at intermediate temperatures and higher fO₂ during vein magnetite formation. Multi-stage fluid release and Fe-leaching during hydrothermal events appear to have driven the observed compositional re-equilibration. (Figure 11, Figure 12, Figure 13 and Figure 14; [12,20,75]).
Oxidative overprint and partial replacement of Fe–Ti oxides are widespread. Oxidation of magnetite to hematite—commonly expressed as martitization textures along grain margins and cleavage surfaces—is attributed to Fe²⁺ leaching under acidic, oxidizing conditions. This process may be represented stoichiometrically as, for example:
4 Fe₃O₄ + O₂ → 6 Fe₂O₃,
and has been documented in comparable systems ([85]. Such martitization is commonly observed along crystal boundaries and in alteration halos around oxide grains. Coexistence and textural relations between iron and titanium oxides—along with partial or complete replacement of magnetite and titanomagnetite by hematite—suggest formation and subsequent modification under non-equilibrium thermodynamic conditions, with variable oxygen fugacity (fO₂) and temperature. The observed replacement textures are consistent with an increase in fO₂ during later stages, attributable to supergene weathering and/or late hydrothermal alteration [86,87,88]. Evidence of martitization within semi-subhedral hematite crystals further supports a hydrothermal-oxidative overprint on primary magnetite.
6. Conclusions
This study integrates geology, back-scattered imaging and electron-microprobe analyses to constrain the origin and evolution of Cu–Fe sulfide–oxide mineralization in the Northeast Saveh district.
Mineralization is structurally controlled by fault corridors (N–S and N25°E–N50°W trends) with mineralized zones from tens of meters to ~1 km and Cu grades of ~0.1–5 wt.%. Combined oxide and sulfide geochemistry provides practical discriminants to separate magmatic vs. hydrothermal signatures and to vector toward higher-grade Cu domains.
Titanomagnetites in the shallow monzodiorite intrusions record a high-temperature, low-fO₂ magmatic signature (Ti, V, Al enrichment), whereas magnetites from silica-rich veins formed at lower, intermediate temperatures (~200–300 °C) and under higher fO₂. EPMA data plot the two groups in separate magmatic vs. hydrothermal fields, documenting oxide re-equilibration during hydrothermal overprint. Measured Fe₂O₃ and TiO₂ contents differ markedly between intrusive and vein oxides, reflecting crystallization from different parental fluids and subsequent element redistribution during oxidation and fluid–rock interaction.
Pyrite trace-element systematics (notably Co–Ni–As and dominant Co/Ni values ∼1–10) point to a principally magmatic–hydrothermal source with progressive cooling and increasing meteoric-water input. Pyrite chemistry thus records changes in temperature, ligand chemistry and redox during mineralization.
Chalcopyrite is the primary Cu-host. Replacement textures and micro-textures document a multi-stage evolution: early magmatic–hydrothermal chalcopyrite ± bornite, later hydrothermal reworking and sulfide replacement (covellite → chalcocite/digenite depending on T and fluid composition), and a pronounced supergene stage producing chalcocite, covellite and oxide-hydroxides (malachite, azurite, goethite).
The abundance and mode of incorporation of trace elements in chalcopyrite (solid solution vs. inclusions), and partitioning in Fe–Ti oxides (V, Cr, Ti) are controlled by temperature, fO₂/fS₂, fluid composition and competition among co-precipitating sulfides. Repeated hydrothermal pulses and Fe-leaching explain observed martitization and hematite replacement textures.
The Northeast Saveh Epithermal system is dominantly magmatic–hydrothermal in origin (early Fe–Ti oxides and primary sulfides), subsequently overprinted by lower-temperature hydrothermal re-equilibration and extensive supergene enrichment/oxidation that redistributed Cu and trace metals.
Supplementary Materials
The following supporting information can be downloaded at: Preprints.org. Supplementary Table 1: EPMA results of pyrite in the Northeast Saveh (wt.%). Supplementary Table 2: EPMA results of chalcopyrite in the Northeast Saveh (wt.%), Supplementary Table 3: EPMA results of chalcocite in the Northeast Saveh (wt.%), Supplementary Table 4: EPMA results of magnetite in the Northeast Saveh (wt.%), Supplementary Table 5: EPMA results of titanomagnetite in the Northeast Saveh (wt.%).
Funding
This research was partly funded (without a specific grant number) by the Ministry of Sciences, Research and Technology, Tehran, Iran, and the University of Vienna, Austria.
Data Availability Statement
The data presented in this study are available upon request from the corresponding author due to the on-going research.
Conflicts of Interest
The authors declare no conflicts of interest. The funders had no role in the design of the study; in the collection, analyses, or interpretation of data; in the writing of the manuscript; or in the decision to publish the results.
References
- Z. Y. Zhu, N. Cook, T. Yang, C. Ciobanu, K. D. Zhao, and S. Y. Jiang, ‘Mapping of sulfur isotopes and trace elements in sulfides by LA-(MC)-ICP-MS: Potential analytical problems, improvements and implications’, Minerals, vol. 6, no. 4, p. 110, 2016. [CrossRef]
- M. Reich et al., ‘Pyrite as a record of hydrothermal fluid evolution in a porphyry copper system: a SIMS/EMPA trace element study’, Geochim. Cosmochim. Acta, vol. 104, pp. 42–62, 2013. [CrossRef]
- A. P. Deditius et al., ‘The coupled geochemistry of Au and As in pyrite from hydrothermal ore deposits’, Geochim. Cosmochim. Acta, vol. 140, pp. 644–670, 2014. [CrossRef]
- R. R. Large et al., ‘Gold and trace element zonation in pyrite using a laser imaging technique: Implications for the timing of gold in orogenic and Carlin-style sediment-hosted deposits’, Econ. Geol., vol. 104, no. 5, pp. 635–668, 2009. [CrossRef]
- N. J. Cook, C. L. Ciobanu, D. Meria, D. Silcock, and B. Wade, ‘Arsenopyrite–Pyrite Association in an Orogenic Gold Ore: Tracing Mineralization History from Textures and Trace Elements’, Econ. Geol., vol. 108, pp. 1273–1283, 2013. [CrossRef]
- S. Sykora et al., ‘Evolution of pyrite trace element compositions from porphyry-style and epithermal conditions at the Lihir Gold deposit: Implications for ore genesis and mineral processing’, Econ. Geol., vol. 113, no. 1, pp. 193–208, 2018. [CrossRef]
- E. M. Córdoba, J. A. Muñoz, M. L. Blázquez, F. González, and A. Ballester, ‘Leaching of chalcopyrite with ferric ion. Part I: General aspects’, Hydrometallurgy, vol. 93, no. 3–4, pp. 81–87, 2009. [CrossRef]
- L. L. George, N. J. Cook, B. B. P. Crowe, and C. L. Ciobanu, ‘Trace elements in hydrothermal chalcopyrite’, Mineral. Mag., vol. 82, pp. 59–88, 2018. [CrossRef]
- E. Caraballo, G. Beaudoin, and S. Dare, ‘Trace element composition of chalcopyrite as a tool for deposit type discrimination from magmatic and hydrothermal settings: A machine learning approach’, Miner. Deposita, 2025. [CrossRef]
- Y. Tang et al., ‘Chalcopyrite geochemistry: Advancements and implications in ore deposit research’, Ore Geol. Rev., vol. 179, p. 106528, 2025. [CrossRef]
- C. Dupuis and G. Beaudoin, ‘Discriminant diagrams for iron oxide trace element fingerprinting of mineral deposit types’, Miner. Deposita, vol. 46, pp. 319–335, 2011. [CrossRef]
- P. Nadoll, T. Angerer, J. L. Mauk, D. French, and J. Walshe, ‘The chemistry of hydrothermal magnetite: A review’, Ore Geol. Rev., vol. 61, pp. 1–32, 2014. [CrossRef]
- Y. B. Wu and Y. F. Zheng, ‘Study on the genesis of zircon and its restrictions on explaining the U-Pb age’, Chin. Sci. Bull., vol. 49, pp. 1589–1604, 2004. [CrossRef]
- S. A. S. Dare, S. J. Barnes, G. Beaudoin, J. Meric, E. Boutroy, and C. Potvin-Doucet, ‘Trace elements in magnetite as petrogenetic indicators’, Miner. Deposita, vol. 49, pp. 785–796, 2014. [CrossRef]
- H. Hu, D. Lentz, J. W. Li, T. McCarron, X. F. Zhao, and D. Hall, ‘Reequilibration processes in magnetite from iron skarn deposits’, Econ. Geol., vol. 110, pp. 1–8, 2015. [CrossRef]
- C. Verdel, B. P. Wernicke, J. Hassanzadeh, and B. Guest, ‘A Paleogene extensional arc flare-up in Iran’, Tectonics, vol. 30, pp. 3008–3302, 2011. [CrossRef]
- S. Babazadeh, K. Haase, and J. Ghalamghash, ‘Magmatic evolution of the migrating central Urumieh–Dokhtar arc, Iran: Implications for magma production’, Int J Earth Sci, vol. 112, pp. 1577–1597, 2023. [CrossRef]
- M. Goudarzi et al., ‘Unraveling the Protracted Magmatic Evolution in the Central Urumieh–Dokhtar Magmatic Arc (Northeast Saveh, Iran): Zircon U-Pb Dating, Lu-Hf Isotopes, and Geochemical Constraints’, Minerals, vol. 15, no. 4, p. 375, Apr. 2025. [CrossRef]
- M. Goudarzi, H. Zamanian, and U. Klotzli, ‘Geochemistry and tectono-magmatic setting of hypabyssal intrusive rocks in the south of Mamouniyeh, Urumieh-Dokhtar magmatic arc, Iran’, Sci. Q. J. Geosci., vol. 35, no. 1, pp. 129–148, 2025. [CrossRef]
- M. Goudarzi, H. Zamanian, U. Klötzli, D. Lentz, and M. Ullah, ‘Genesis of the Mamuniyeh copper deposit in the central Urumieh-Dokhtar Magmatic Arc, Iran: Constraints from geology, geochemistry, fluid inclusions, and H–O–S isotopes’, Ore Geol. Rev., vol. 175, p. 106279, 2024. [CrossRef]
- M. Goudarzi, H. Zamanian, U. Klötzli, D. Lentz, and M. Ullah, ‘Genesis of the Mamuniyeh copper deposit in the central Urumieh-Dokhtar Magmatic Arc, Iran: Constraints from geology, geochemistry, fluid inclusions, and H–O–S isotopes’, Ore Geol. Rev., vol. 175, p. 106279, Dec. 2024. [CrossRef]
- D. L. Whitney and B. W. Evans, ‘Abbreviations for names of rock-forming minerals’, Am. Mineral., vol. 95, no. 1, pp. 185–187, 2010. [CrossRef]
- D. D. Gregory et al., ‘Trace Element Content of Sedimentary Pyrite in Black Shales’, Econ. Geol., vol. 110, no. 6, pp. 1389–1410, 2015. [CrossRef]
- S. Saravanan Chinnasamy, P. Hazarika, D. Pal, R. Sen, and G. Govindaraj, ‘Pyrite textures and trace element compositions from the granodiorite-hosted gold deposit at Jonnagiri, Eastern Dharwar Craton, India: Implications for gold mineralization processes’, Econ. Geol., vol. 116, no. 3, pp. 559–579, 2021. [CrossRef]
- G. Loftus-Hills and M. Solomon, ‘Cobalt, nickel and selenium in sulfides as indicators of ore genesis’, Miner. Deposita, vol. 2, no. 3, pp. 228–242, 1967. [CrossRef]
- Y. T. Yan, S. R. Li, B. J. Jia, N. Zhang, and L. N. Yan, ‘Composition typomorphic characteristics and statistical analysis of pyrite in gold deposits of different genetic types’, Adv. Mater. Res., vol. 463–464, pp. 25–29, 2012. [CrossRef]
- S. D. Niu et al., ‘Mineralogical and Isotopic Studies of Base Metal Sulfides from the Jiawula Ag–Pb–Zn Deposit, Inner Mongolia’, NE China J. Asian Earth Sci., vol. 115, pp. 480–491, 2016. [CrossRef]
- C. Kusebauch, M. Oelze, and S. A. Gleeson, ‘Partitioning of Arsenic between Hydrothermal Fluid and Pyrite during Experimental Siderite Replacement’, Chem. Geol., vol. 500, pp. 136–147, 2018. [CrossRef]
- N. J. Cook and S. L. Chryssoulis, ‘Concentrations of invisible gold in the common sulfides’, Can. Mineral., vol. 28, no. 1, pp. 1–16, 1990.
- J.-L. Liang et al., ‘Study on the Valence States of Arsenic in Arsenian Pyrite: Implications for Au Deposition Mechanism of the Yangshan Carlin-Type Gold Deposit, Western Qinling Belt’, J. Asian Earth Sci., vol. 62, pp. 363–372, 2013. [CrossRef]
- R. W. Boyle, ‘The Geochemistry of Gold and Its Deposits’, Geol. Surv. Can. Bull., p. 280, 1979.
- C. Clark, B. Grguric, and M. A. Schmidt, ‘Genetic implications of pyrite chemistry from the Palaeoproterozoic Olary Domain and overlying neoproterozoic Adelaidean sequences, northeastern South Australia’, Ore Geol Rev, vol. 25, pp. 237–257, 2004. [CrossRef]
- M. A. Huerta-Diaz and J. W. Morse, ‘Pyritization of Trace Metals in Anoxic Marine Sediments’, Geochim. Cosmochim. Acta, vol. 56, no. 7, pp. 2681–2702, 1992. [CrossRef]
- N. Koglin, H. E. Frimmel, W. E. L. Minter, and H. Brätz, ‘Trace-Element Characteristics of Different Pyrite Types in Mesoarchaean to Palaeoproterozoic Placer Deposits’, Miner. Deposita, vol. 45, pp. 259–280, 2010. [CrossRef]
- H. X. Zhao, H. E. Frimmel, S. Y. Jiang, and B. Z. Dai, ‘LA-ICP-MS Trace Element Analysis of Pyrite from the Xiaoqinling Gold District, China: Implications for Ore Genesis’, Ore Geol. Rev., vol. 43, no. 1, pp. 142–153, 2011. [CrossRef]
- J. W. Morse and L. G.W, ‘Chemical influences on trace metal-sulfide interactions in anoxic sediments’, Geochim. Cosmochim. Acta, vol. 63, pp. 19–20, 1999. [CrossRef]
- H. Palme and H. S. C. O’Neill, ‘Cosmochemical Estimates of Mantle Composition’, Treatise Geochem., vol. 2, pp. 1–38, 2003. [CrossRef]
- R. L. Rudnick and S. Gao, ‘Composition of the Continental Crust’, in Treatise on Geochemistry, 2nd ed., vol. 4, Eds., Ed., Holland, H.D., Turekian, K.K: Elsevier, 2014, pp. 1–51. [CrossRef]
- M. Rezaei Kahkhaei, D. Esmaili, and C. G. Francisco, ‘Geochemical and Isotopic (Nd and Sr) Constraints on Elucidating the Origin of Intrusions from Northwest Saveh, Central Iran’, Geopersia, vol. 4, no. 1, pp. 103–123, 2014. [CrossRef]
- P. K. Abraitis, R. A. D. Pattrick, and D. J. Vaughan, ‘Variations in the Compositional, Textural, and Electrical Properties of Natural Pyrite: A Review’, Int. J. Miner. Process., vol. 74, no. 1–4, pp. 41–59, 2004. [CrossRef]
- J. Zhao, J. Brugger, G. Chen, Y. Ngothai, and A. Pring, ‘Experimental Study of the Formation of Chalcopyrite and Bornite via the Sulfidation of Hematite: Mineral Replacements with a Large Volume Increase’, Am. Mineral., vol. 99, pp. 343–354, 2014. [CrossRef]
- A. Bralia, G. Sabatini, and F. Troja, ‘A Revaluation of the Co/Ni Ratio in Pyrite as Geochemical Tool in Ore Genesis Problems’, Miner. Deposita, vol. 14, pp. 353–374, 1979. [CrossRef]
- Y. B. Yuan, S. D. Yuan, P. L. Zhao, and D. L. Zhang, ‘Properties and Evolution of Granitic Magma in the Huangshaping Polymetallic Deposit, Southern Hunan: Constraints on Mineralization Differences’, Acta Petrol. Sin., vol. 34, pp. 2565–2580, 2018.
- Z. Bajwah, P. Seccombe, and R. Offler, ‘Trace Element Distribution, Co:Ni Ratios and Genesis of the Big Cadia Iron–Copper Deposit, New South Wales, Australia’, Miner. Deposita, vol. 22, pp. 292–300, 1987. [CrossRef]
- M. Reich et al., ‘Trace Element Signature of Pyrite from the Los Colorados Iron Oxide–Apatite (IOA) Deposit, Chile: A Missing Link between Andean IOA and Iron Oxide Copper–Gold Systems?’, Econ. Geol., vol. 111, no. 3, pp. 743–761, 2016. [CrossRef]
- A. P. Deditius et al., ‘A Proposed New Type of Arsenian Pyrite: Composition, Nanostructure and Geological Significance’, Geochim. Cosmochim. Acta, vol. 72, no. 12, pp. 2919–2933, 2008. [CrossRef]
- M. Keith, D. J. Smith, G. R. T. Jenkin, D. A. Holwell, and M. D. Dye, ‘A Review of Te and Se Systematics in Hydrothermal Pyrite from Precious Metal Deposits: Insights into Ore-Forming Processes’, Ore Geol. Rev., vol. 96, pp. 269–282, 2018. [CrossRef]
- Y. Z. Feng, Y. Zhang, Y. L. Xie, Y. J. Shao, and C. K. Lai, ‘Pyrite Geochemistry and Metallogenic Implications of the Gutaishan Au Deposit in Jiangnan Orogen, South China’, Ore Geol. Rev., vol. 117, p. 103298, 2020. [CrossRef]
- G. S. Cao et al., ‘Trace Element Variations of Pyrite in Orogenic Gold Deposits: Constraints from Big Data and Machine Learning’, Ore Geol. Rev., vol. 157, p. 105447, 2023. [CrossRef]
- K. R. Song et al., ‘Genesis of the Bianjiadayuan Pb–Zn polymetallic deposit, Inner Mongolia, China: Constraints from in-situ sulfur isotope and trace element geochemistry of pyrite’, Geosci. Front., vol. 10, no. 5, pp. 1863–1877, 2019. [CrossRef]
- I. D. Real, J. F. H. Thompson, A. C. Simon, and M. Reich, ‘Geochemical and Isotopic Signature of Pyrite as a Proxy for Fluid Source and Evolution in the Candelaria–Punta del Cobre Iron Oxide Copper–Gold District, Chile’, Econ. Geol., vol. 115, no. 7, pp. 1493–1517, 2020. [CrossRef]
- J. K. Zhang, Y. J. Shao, Z. F. Liu, and K. Chen, ‘Sphalerite as a Record of Metallogenic Information Using Multivariate Statistical Analysis: Constraints from Trace Element Geochemistry’, J. Geochem. Explor., vol. 232, p. 106883, 2022. [CrossRef]
- Y. H. Zhao, H. Tian, J. Li, S. Y. Chen, and J. N. Zhao, ‘Constraints on the Genesis of the Laochang Pb–Zn Ore, Gejiu District, Yunnan: Evidence from Sulfide Trace Element and Isotope Geochemistry’, Ore Geol. Rev., vol. 150, p. 105162, 2022. [CrossRef]
- J. Crespo, ‘Occurrence and Distribution of Silver in the World-Class Río Blanco Porphyry Cu–Mo Deposit, Central Chile’, Econ. Geol., vol. 115, no. 8, pp. 1619–1644, 2020. [CrossRef]
- C. A. Rivas-Romero, ‘The Relation between Trace Element Composition of Cu–(Fe) Sulfides and Hydrothermal Alteration in a Porphyry Copper Deposit: Insights from the Chuquicamata Underground Mine, Chile’, Minerals, vol. 11, no. 7, p. 671, 2021. [CrossRef]
- B. Lehrmann, M. J. Cooper, J. A. Milton, and B. J. F. Murton, ‘Remobilisation and Alteration Processes at Inactive Hydrothermal Vents: Insights from Elemental Analysis of Cu-(Fe-)S Sulfides from TAG, Mid-Atlantic Ridge’, Miner. Deposita, 2022. [CrossRef]
- E. Caraballo, S. Dare, and G. Beaudoin, ‘Variation of Trace Elements in Chalcopyrite from Worldwide Ni–Cu Sulfide and Reef-Type PGE Deposits: Implications for Mineral Exploration’, Miner. Deposita, vol. 57, no. 8, pp. 1293–1321, 2022. [CrossRef]
- A. K. Chaudhari et al., ‘Anatomy of a Complex Mineral Replacement Reaction: Role of Aqueous Redox, Mineral Nucleation, and Ion Transport Properties Revealed by an In-Situ Study of the Replacement of Chalcopyrite by Copper Sulfides’, Chem. Geol., vol. 581, p. 120390, 2021. [CrossRef]
- L. Torró et al., ‘Trace Element Geochemistry of Sphalerite and Chalcopyrite in Arc-Hosted VMS Deposits’, J. Geochem. Explor., vol. 232, p. 106882, 2022. [CrossRef]
- D. L. Huston, S. H. Sie, G. F. Suter, D. R. Cooke, and R. A. Both, ‘Trace Elements in Sulfide Minerals from Eastern Australian Volcanic-Hosted Massive Sulfide Deposits. Part I: Proton Microprobe Analyses of Pyrite, Chalcopyrite, and Sphalerite; Part II: Selenium Levels in Pyrite—Comparison with δ34S Values and Implications for the Source of Sulfur in Volcanogenic Hydrothermal Systems’, Econ. Geol., vol. 90, no. 5, pp. 1167–1196, 1995. [CrossRef]
- H. M. Aird et al., ‘Gold- and silver-bearing assemblages in the Ann-Mason copper porphyry deposit, Yerington, Nevada’, Ore Geol. Rev., vol. 104339, 2021. [CrossRef]
- S. Kojima and A. Sugaki, ‘Phase Relations in the Cu–Fe–Zn–S System between 500° and 300°C under Hydrothermal Conditions’, Econ. Geol., vol. 80, pp. 158–171, 1985. [CrossRef]
- G. Simon, ‘Gold in Porphyry Copper Deposits: Experimental Determination of the Distribution of Gold in the Cu–Fe–S System at 400–700 °C’, Econ. Geol., vol. 95, pp. 259–276, 2000. [CrossRef]
- C. Yang, G. Beaudoin, J.-X. Tang, Y. Song, L.-Q. Wang, and X.-W. Huang, ‘Cu-Sulfide Mineralogy, Texture, and Geochemistry in the Tiegelongnan Porphyry–Epithermal Copper System, Tibet, China’, Miner. Deposita, vol. 57, no. 5, pp. 759–779, 2022. [CrossRef]
- D. F. Chen, ‘Characteristics of Main Metallic Minerals in Some Copper–Nickel Sulfide Deposits of China’, Acta Petrol. Mineral., vol. 14, pp. 345–354, 1995.
- R. Mondal and T. K. Baidya, ‘Titaniferous Magnetite Deposits Associated with Archean Greenstone Belt in the East Indian Shield’, Earth Sci., vol. 4, no. 4–1, pp. 15–30, 2015. [CrossRef]
- J. A. Dunn and A. K. Dey, ‘Vanadium Bearing Titaniferous Magnetite Iron Ores in Singhbhum and Mayurbhanj, India’, Trans. Min. Geol. Metall. Inst. India, vol. 3, pp. 117–194, 1973. [CrossRef]
- J. D. Pasteris, ‘Relationships between Temperature and Oxygen Fugacity among Fe–Ti Oxides in Two Regions of the Duluth Complex’, Can. Mineral., vol. 23, pp. 111–127, 1985.
- B. A. and L. D, ‘Iron-titanium oxide minerals and synthetic equivalents’, J. Petrol., vol. 5, pp. 310–357, 1964. [CrossRef]
- T. Angerer, S. G. Hagemann, and L. V. Danyushevsky, ‘Geochemical Evolution of the Banded Iron Formation–Hosted High-Grade Iron Ore System in the Koolyanobbing Greenstone Belt, Western Australia’, Econ. Geol., vol. 107, no. 4, pp. 599–644, 2012. [CrossRef]
- A. Bordage, E. Balan, J. R. Villiers, R. Cromarty, A. Juhin, and C. Carvallo, ‘V Oxidation State in Fe–Ti Oxides by High-Energy Resolution Fluorescence-Detected X-Ray Absorption Spectroscopy’, Phys. Chem. Miner., vol. 38, pp. 449–458, 2011. [CrossRef]
- M. J. Toplis and M. R. Carroll, ‘An Experimental Study of the Influence of Oxygen Fugacity on Fe–Ti Oxide Stability, Phase Relations, and Mineral–Melt Equilibria in Ferro-Basaltic Systems’, J. Petrol., vol. 36, pp. 1137–1170, 1995. [CrossRef]
- G. Ahmadzadeh, A. Jahangiri, D. Lentz, and M. Mojtahedi, ‘Petrogenesis of Plio-Quaternary post-collisional ultrapotassic volcanism in NW of Marand, NW Iran’, J. Asian Earth Sci., vol. 39, no. 1–2, pp. 37–50, 2010. [CrossRef]
- J. L. Knipping et al., ‘Trace Elements in Magnetite from Massive Iron Oxide–Apatite Deposits Indicate a Combined Formation by Igneous and Magmatic–Hydrothermal Processes’, Geochim. Cosmochim. Acta, vol. 171, pp. 15–38, 2015. [CrossRef]
- J. Tian, Y. Zhang, L. Gong, D. G. Francisco, and A. G. Berador, ‘Geochemical Evolution and Metallogenic Implications of Magnetite: Perspective from the Giant Cretaceous Atlas Porphyry Cu–Au Deposit (Cebu, Philippines’, Ore Geol. Rev., vol. 133, p. 104084, 2021. [CrossRef]
- J. R. Craig, D. J. O. M. Vaughan, and O. Petrography, 2nd ed. New York, NY, USA: Wiley, 1994.
- G. Wen, J. W. Li, A. H. Hofstra, A. E. Koenig, H. A. Lowers, and D. Adams, ‘Hydrothermal Reequilibration of Igneous Magnetite in Altered Granitic Plutons and Its Implications for Magnetite Classification Schemes: Insights from the Handan–Xingtai Iron District, North China Craton’, Geochim. Cosmochim. Acta, vol. 213, pp. 255–270, 2017. [CrossRef]
- A. Zarasvandi, M. Rezaei, M. Sadeghi, D. Lentz, M. Adelpour, and H. Pourkaseb, ‘Rare earth element signatures of economic and sub-economic porphyry copper systems in Urumieh-Dokhtar magmatic arc (UDMA’, Iran Ore Geol. Rev., vol. 70, pp. 407–423, 2015. [CrossRef]
- S. Yin et al., ‘Replacement of Magnetite by Hematite in Hydrothermal Systems: A Refined Redox-Independent Model’, Earth Planet. Sci. Lett., vol. 577, p. 117282, 2022. [CrossRef]
- H. Hu et al., ‘Dissolution-reprecipitation process of magnetite from the Chengchao iron deposit: Insights into ore genesis and implication for in-situ chemical analysis of magnetite’, Ore Geol. Rev., vol. 57, pp. 393–405, 2014. [CrossRef]
- X. Sun et al., ‘Trace Element Geochemistry of Magnetite from the Giant Beiya Gold–Polymetallic Deposit in Yunnan Province, Southwest China, and Its Implications for Ore-Forming Processes’, Ore Geol. Rev., vol. 91, pp. 477–490, 2017. [CrossRef]
- M. Valkama, K. Sundblad, N. J. Cook, and V. I. Ivashchenko, ‘Geochemistry and Petrology of the Indium-Bearing Polymetallic Skarn Ores at Pitkäranta, Ladoga Karelia, Russia’, Miner. Deposita, vol. 51, pp. 823–839, 2016. [CrossRef]
- M. J. Toplis and A. Corgne, ‘An Experimental Study of Element Partitioning between Magnetite, Clinopyroxene and Iron-Bearing Silicate Liquids with Particular Emphasis on Vanadium’, Contrib. Mineral. Petrol., vol. 144, pp. 22–37, 2002. [CrossRef]
- C. Wang, Y. Shao, X. Zhang, J. Dick, and Z. Liu, ‘Trace Element Geochemistry of Magnetite: Implications for Ore Genesis of the Huanggangliang Sn–Fe Deposit, Inner Mongolia, Northeastern China’, Minerals, vol. 8, no. 5, p. 195, 2018. [CrossRef]
- A. Mücke and A. R. Cabral, ‘Redox and Nonredox Reactions of Magnetite and Hematite in Rocks’, Geochemistry, vol. 65, pp. 271–278, 2005. [CrossRef]
- C. Klein, ‘Some Precambrian Banded Iron-Formations (BIFs) from around the World: Their Age, Geologic Setting, Mineralogy, Metamorphism, Geochemistry, and Origin’, Am. Mineral., vol. 90, pp. 1473–1499, 2005. [CrossRef]
- S. Makvandi et al., ‘Partial Least Squares–Discriminant Analysis of Trace Element Compositions of Magnetite from Various VMS Deposit Subtypes: Application to Mineral Exploration’, Ore Geol. Rev., vol. 78, pp. 388–408, 2016. [CrossRef]
- T. Riegler, J. L. Lescuyer, P. Wollenberg, D. Quirt, and D. Beaufort, Alteration Related to Uranium Deposits in the Kiggavik–Andrew Lake Structural Trend, vol. 52, no. 1. Nunavut, Canada: New Insights from Petrography and Clay Mineralogy. Canadian Mineralogist, 2014. [CrossRef]
Figure 1.
(A) Location off study area in the geological map of iran (B) 1:20000 geological map of the Northeast Saveh area [18]. (C) A view of monzonite–monzodiorite rocks. (D) close up view of monzonite, Monzo-diorite. (E) General view of gabbroic outcrops. (F) close up view of gabbroic rock. (G) sericitization of plagioclase crystals along polysynthetic twining and fracture filling with carbonate in gabbro-diorite. (H) coarse plagioclase crystals with small clinopyroxene crystals inclusions, where some minerals have been replaced by carbonate and chlorite.
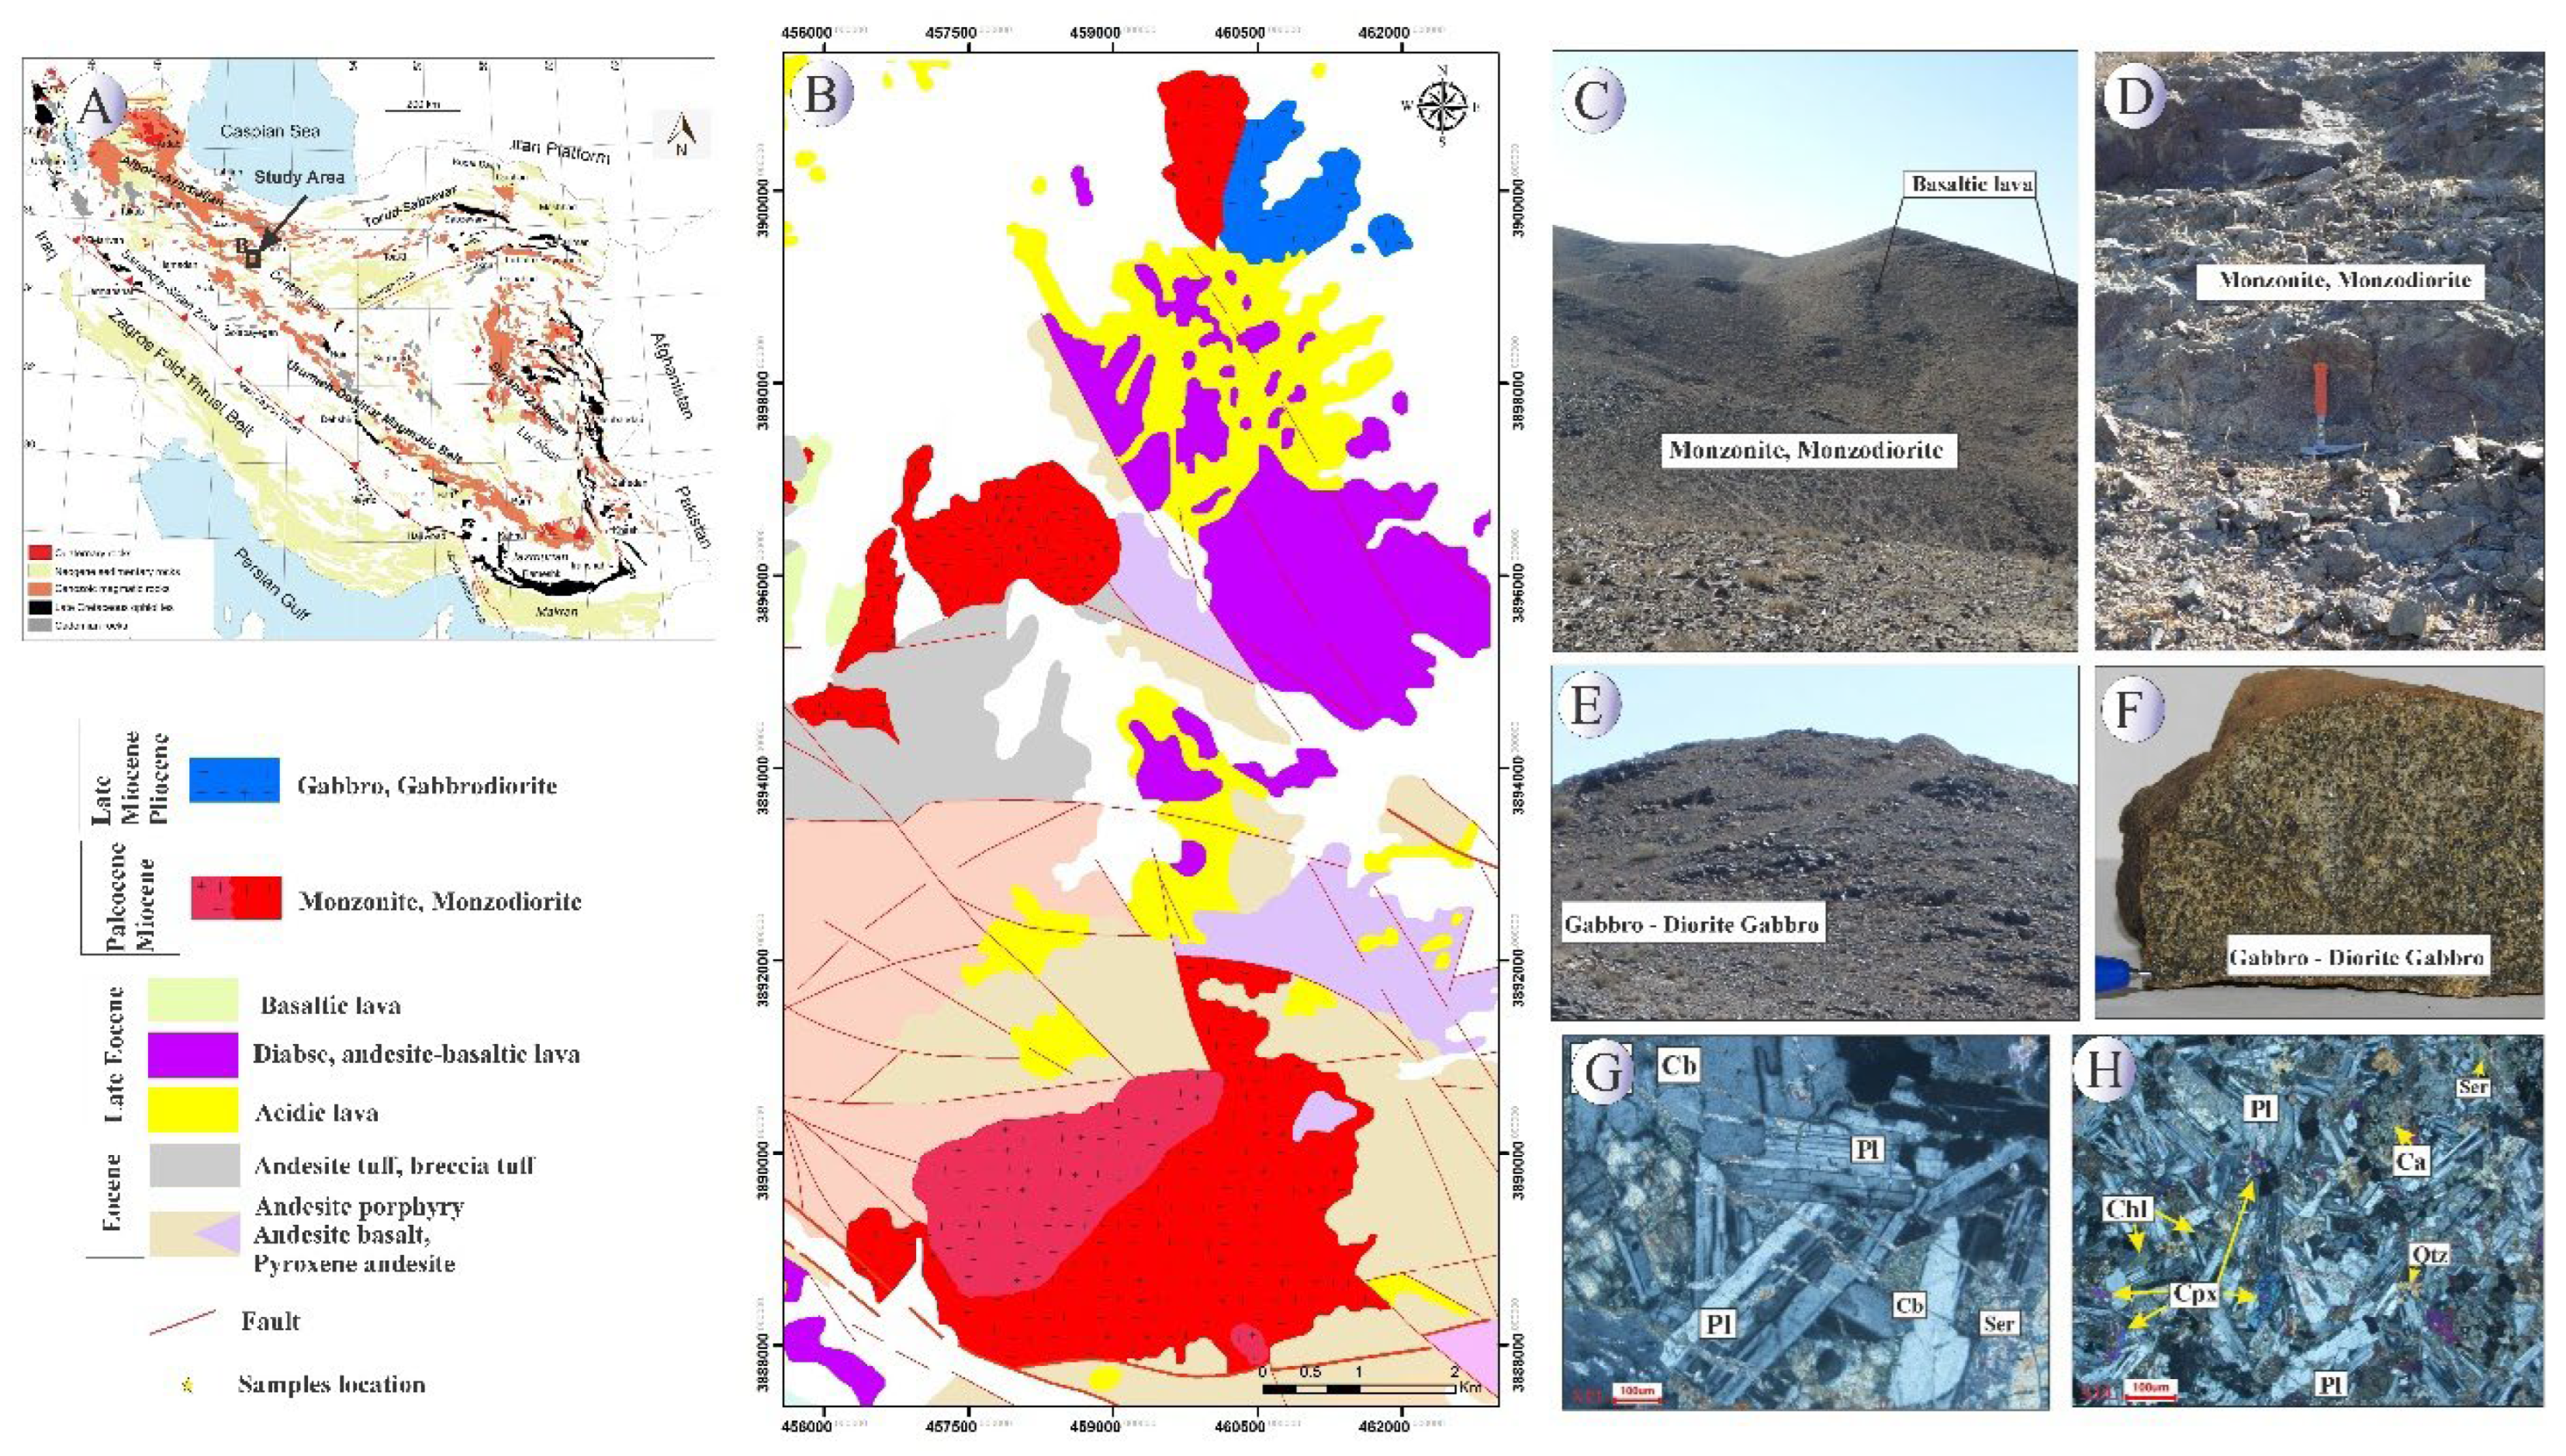
Figure 2.
(A) Satellite image study area and location of mineralization zones. (B) General view of the Northeast Saveh area and intrusive-volcanic outcrops. (C) Mineralized silica vein containing Cu ore and magnetite. (D) A close view of the mineralized silica vein. (E) Core drilling sample containing chalcopyrite. (F) Core drilling sample containing chalcopyrite and Fe oxide (magnetite-hematite) veins. (G) Pyrite vein and Fe oxide in a core drilling sample. Mineral abbreviations after [22]; Py: Pyrite, Ccp: Chalcopyrite, Hem: hematite, Mal: malachite, Mag: magnetite, Qtz: Quartz.
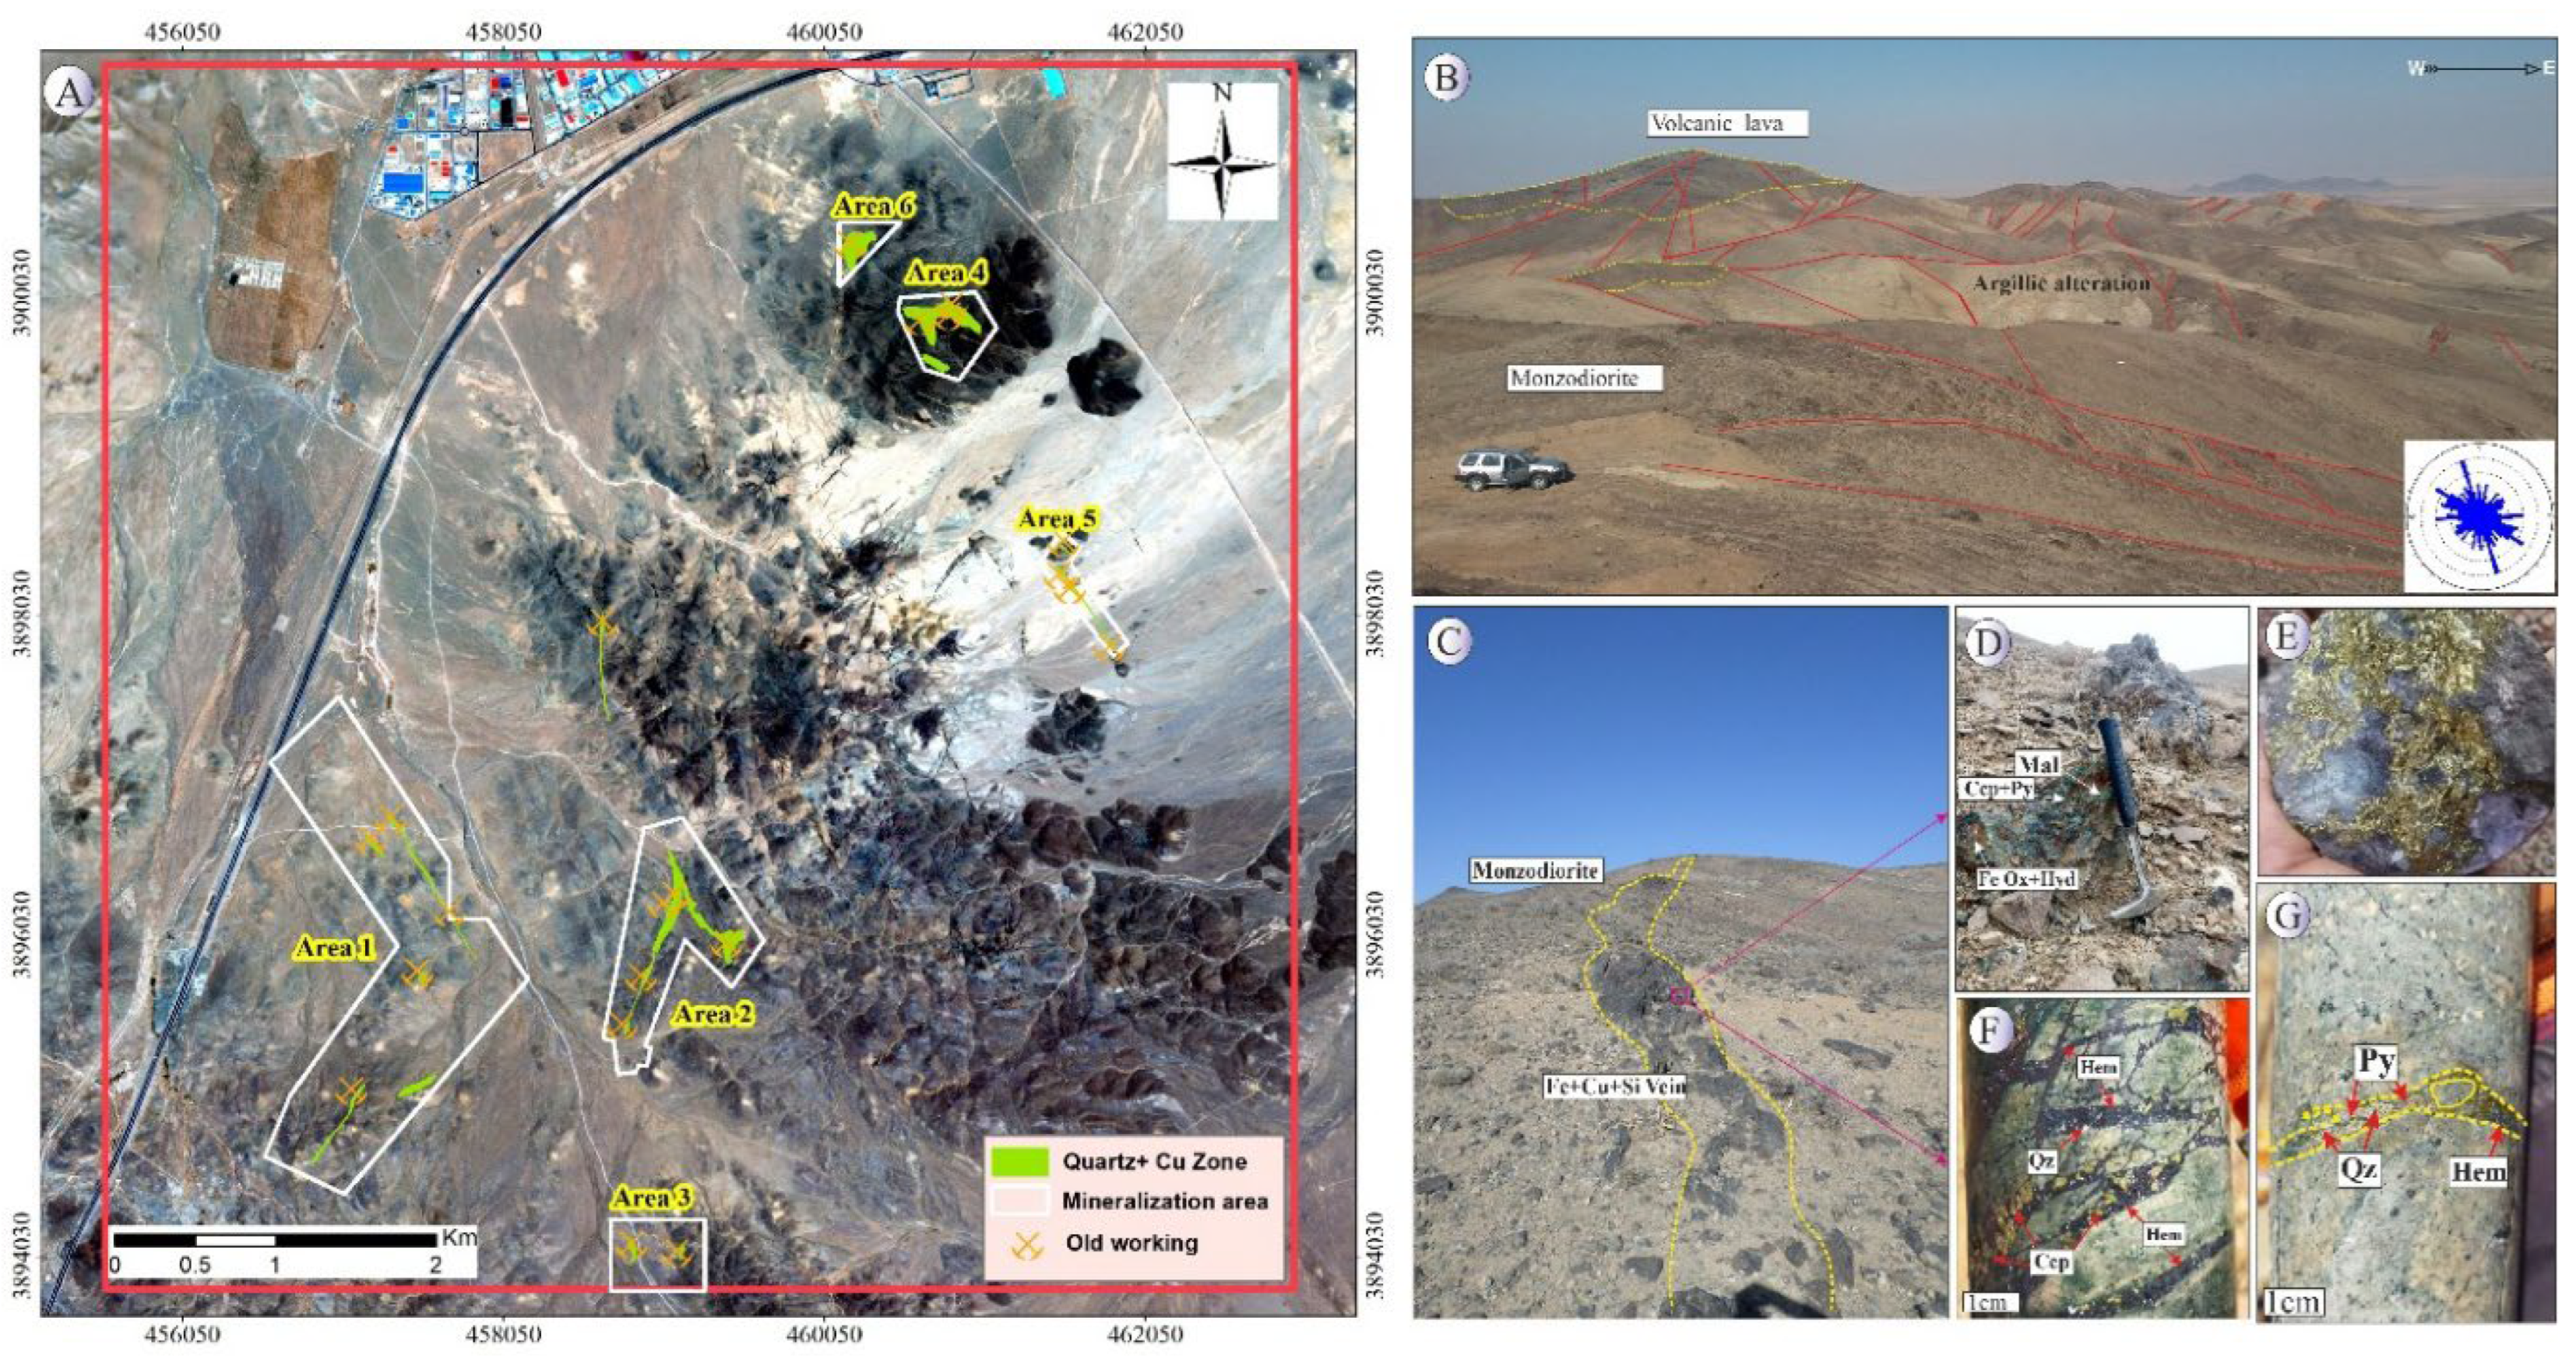
Figure 3.
Photographs of sulfide mineralization at Northeast Saveh. (A) Disseminated first generation pyrite and titanomagnetite in the matrix of the rhyodacite unit. (B,C) Second generation pyrite and chalcopyrite disseminated in the matrix of a silica vein. (D) Second and third generation of disseminated pyrite and second generation of pyrite in a chalcopyrite matrix. (E) Chalcopyrite which has been altered to goethite at the rims due to weathering. (F-I) Chalcopyrite, which has been replacement into bands of blue chalcocite and covellite in its rim and supergene alteration products including malachite and iron oxide-hydroxides in joint and fissure. Mineral abbreviations [22]: Ccp: chalcopyrite, Cct: chalcocite, Mal: malachite, Py: pyrite, Cv: covellite, Tn: tenorite, Gth: goethite, Fe Ox-Hyd: iron oxides and hydroxides.
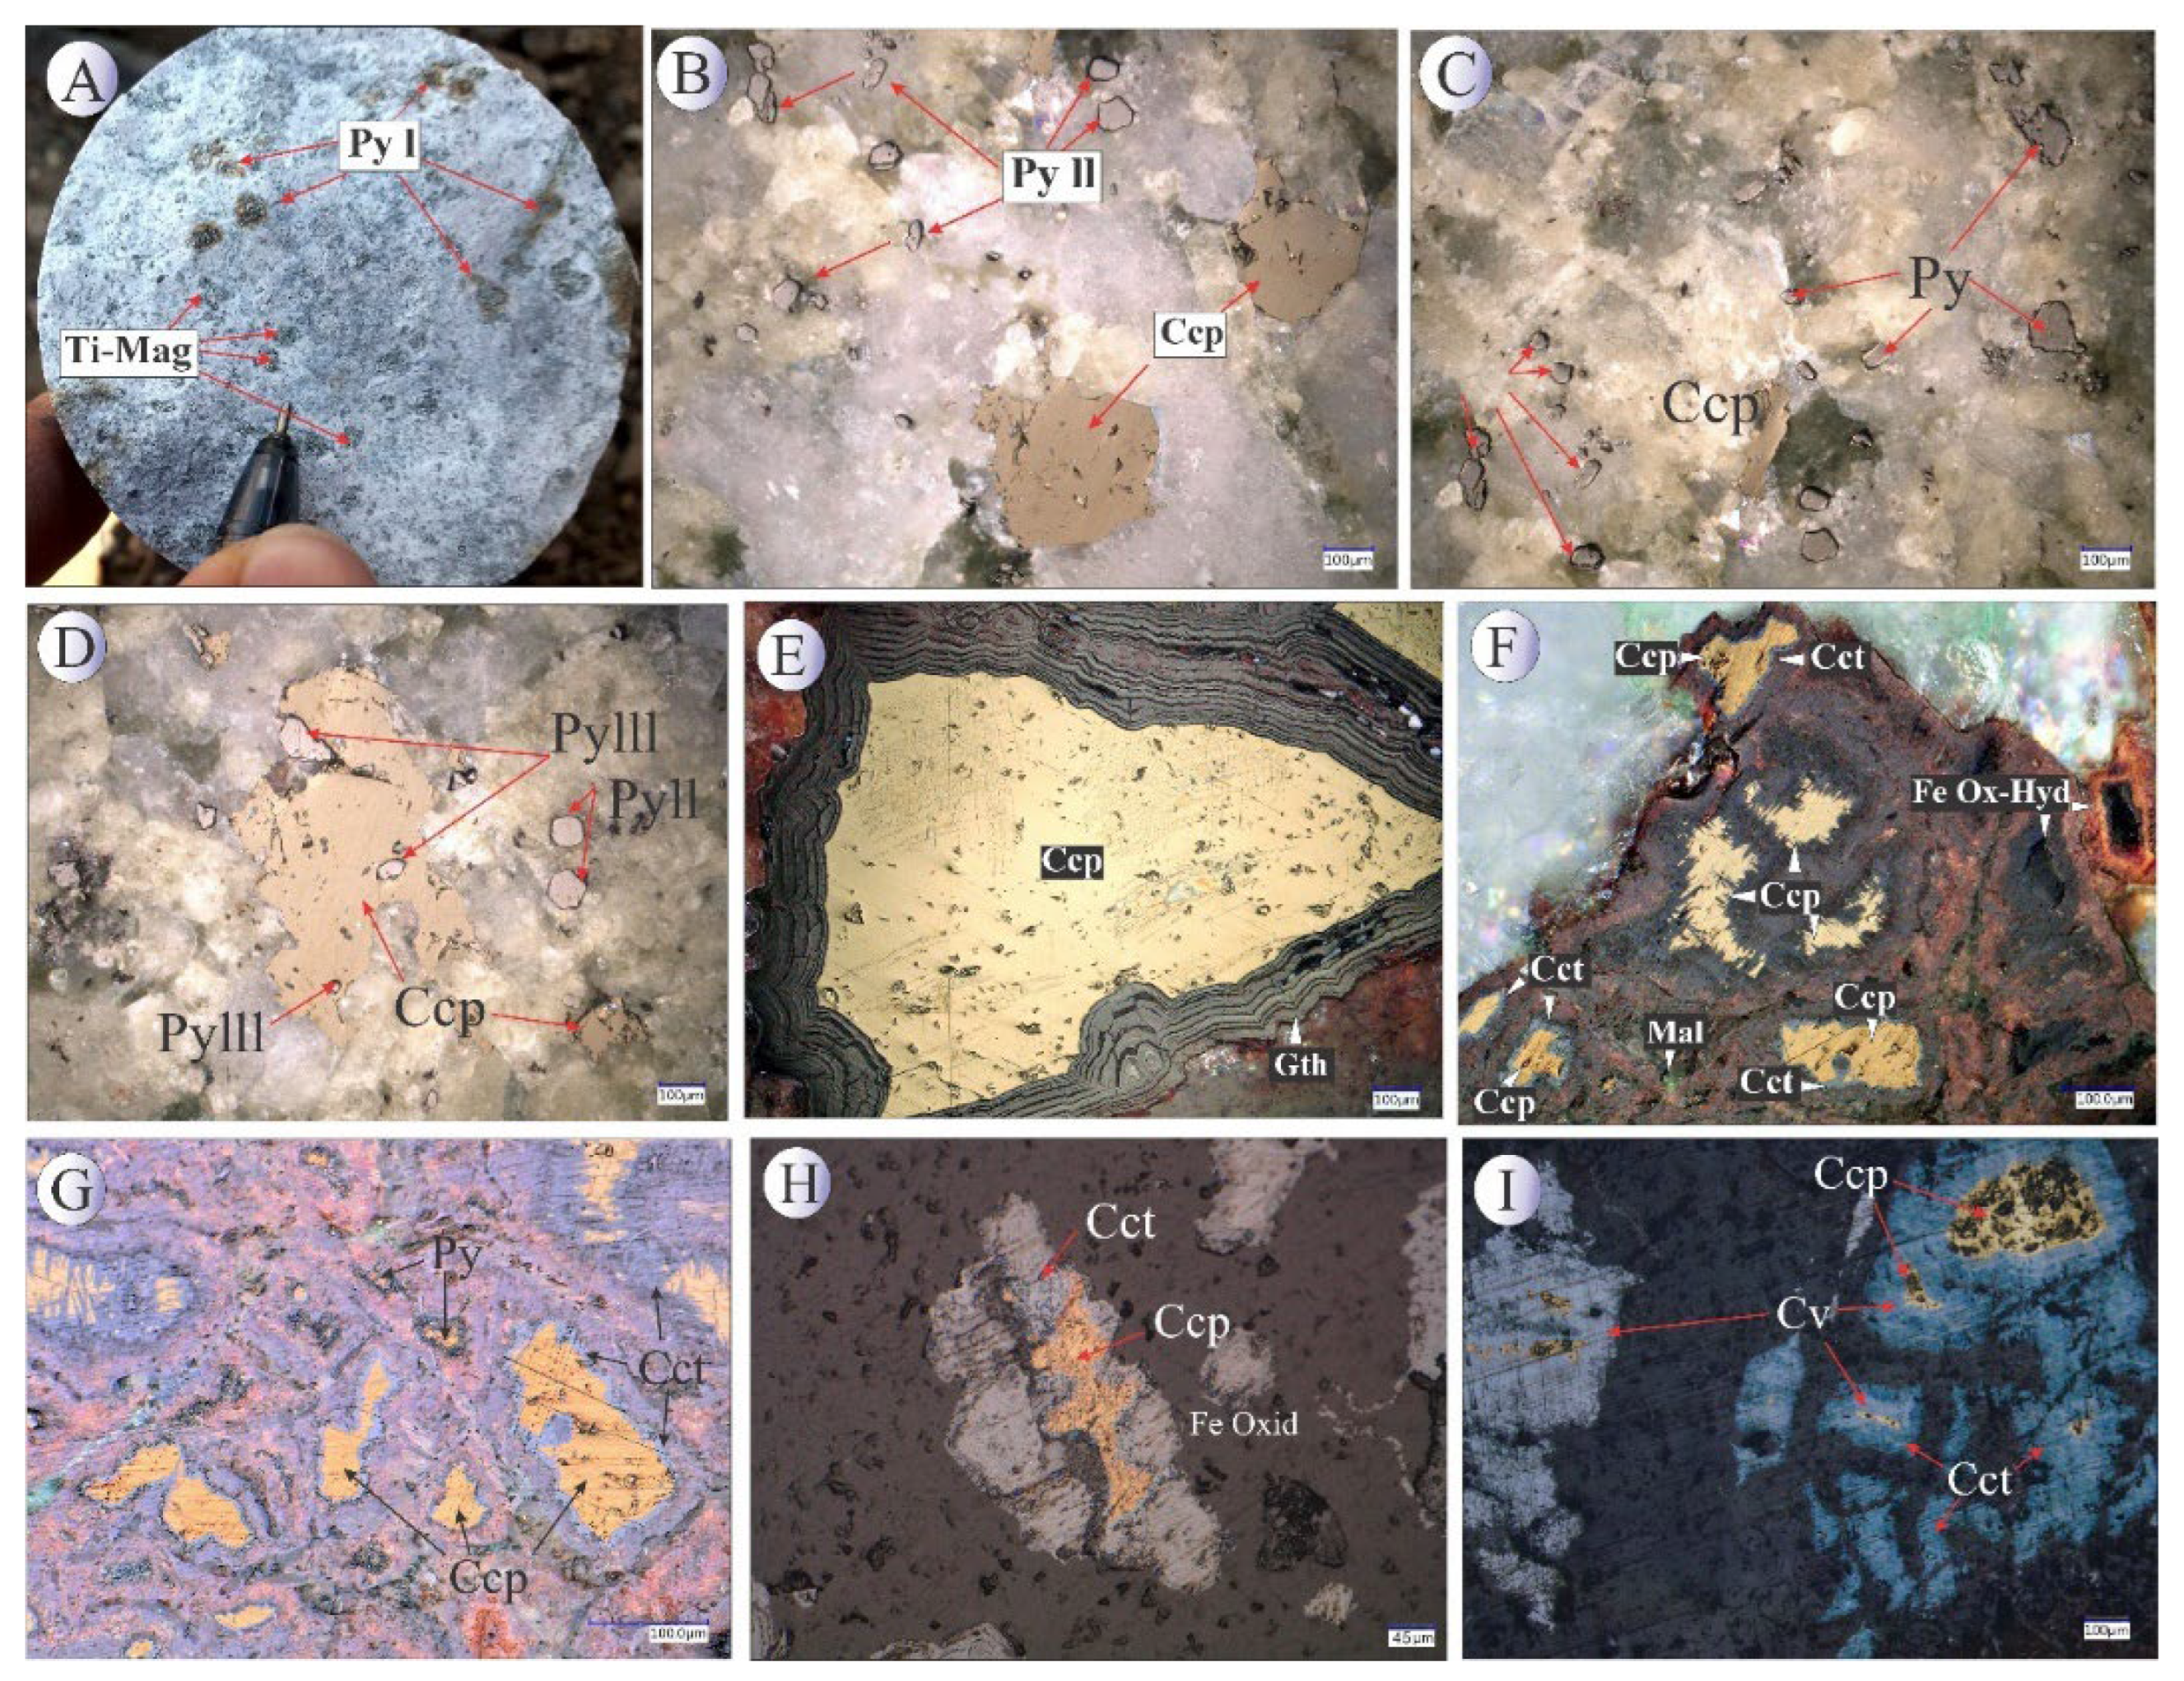
Figure 4.
Photomicrographs of oxide minerals from the hypogene stage at Northeast Saveh. (A) Titanomagnetite and Pyrite disseminated Mineralization in the Monzonite matrix. (B) Bladed specular hematite in the silica vein. (C) Euhedral martitized magnetite crystals that are replaced by hematite due to alteration. (D) Euhedral magnetite crystals in the silica vein. (E) A titanomagnetite crystal with stockwork texture that contains solid solution blades of ilmenite. (F) Euhedral martitized magnetite crystals that are replaced by hematite due to alteration. Mineral abbreviations (Whitney and Evans, 2010): Hem: hematite, Mal: malachite, Py: pyrite, Mag: magnetite, Ilm: ilmenite, Spc: Specularite.
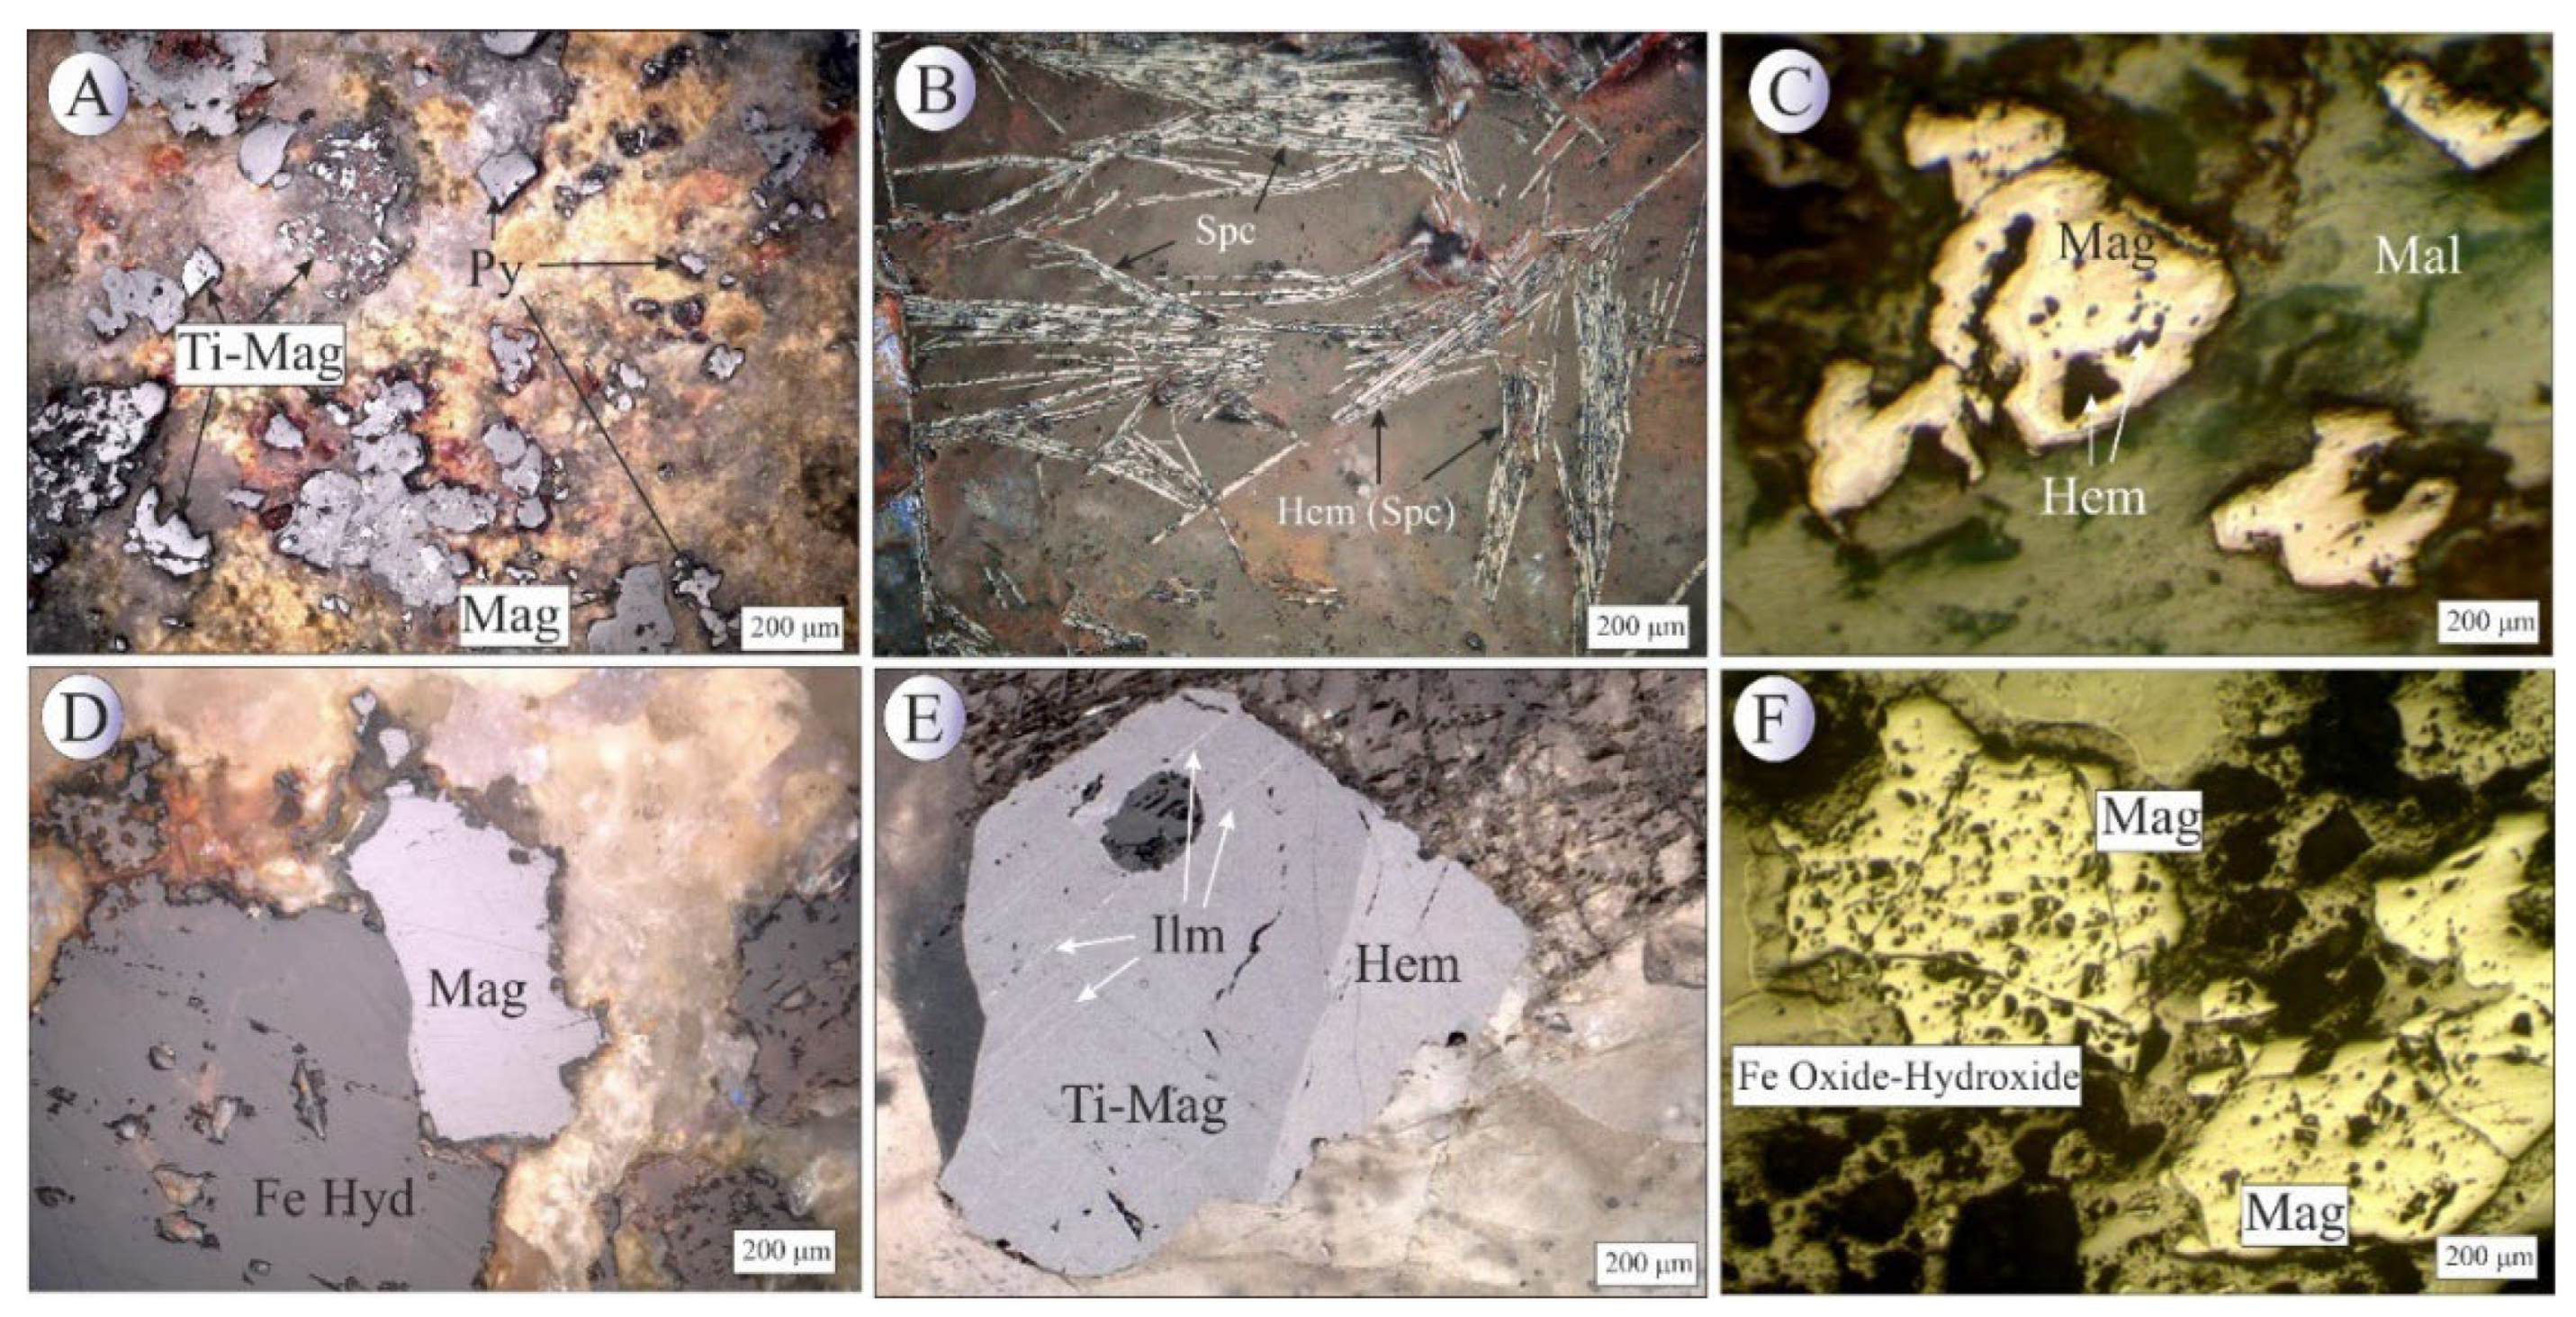
Figure 14.
(A) Comparison of pyrite composition in metamorphic, Carlin, and magmatic-hydrothermal or epithermal deposits on the Co-Ni-As ternary diagram (modified from [26] and the position of the measured points of Northeast Saveh pyrites on it. (B) Ternary diagram of Cu+Pb+Zn, Co+Cr, and As+Sb+Ag based on [31] and the position of the measured points of Northeast Saveh pyrites on it.
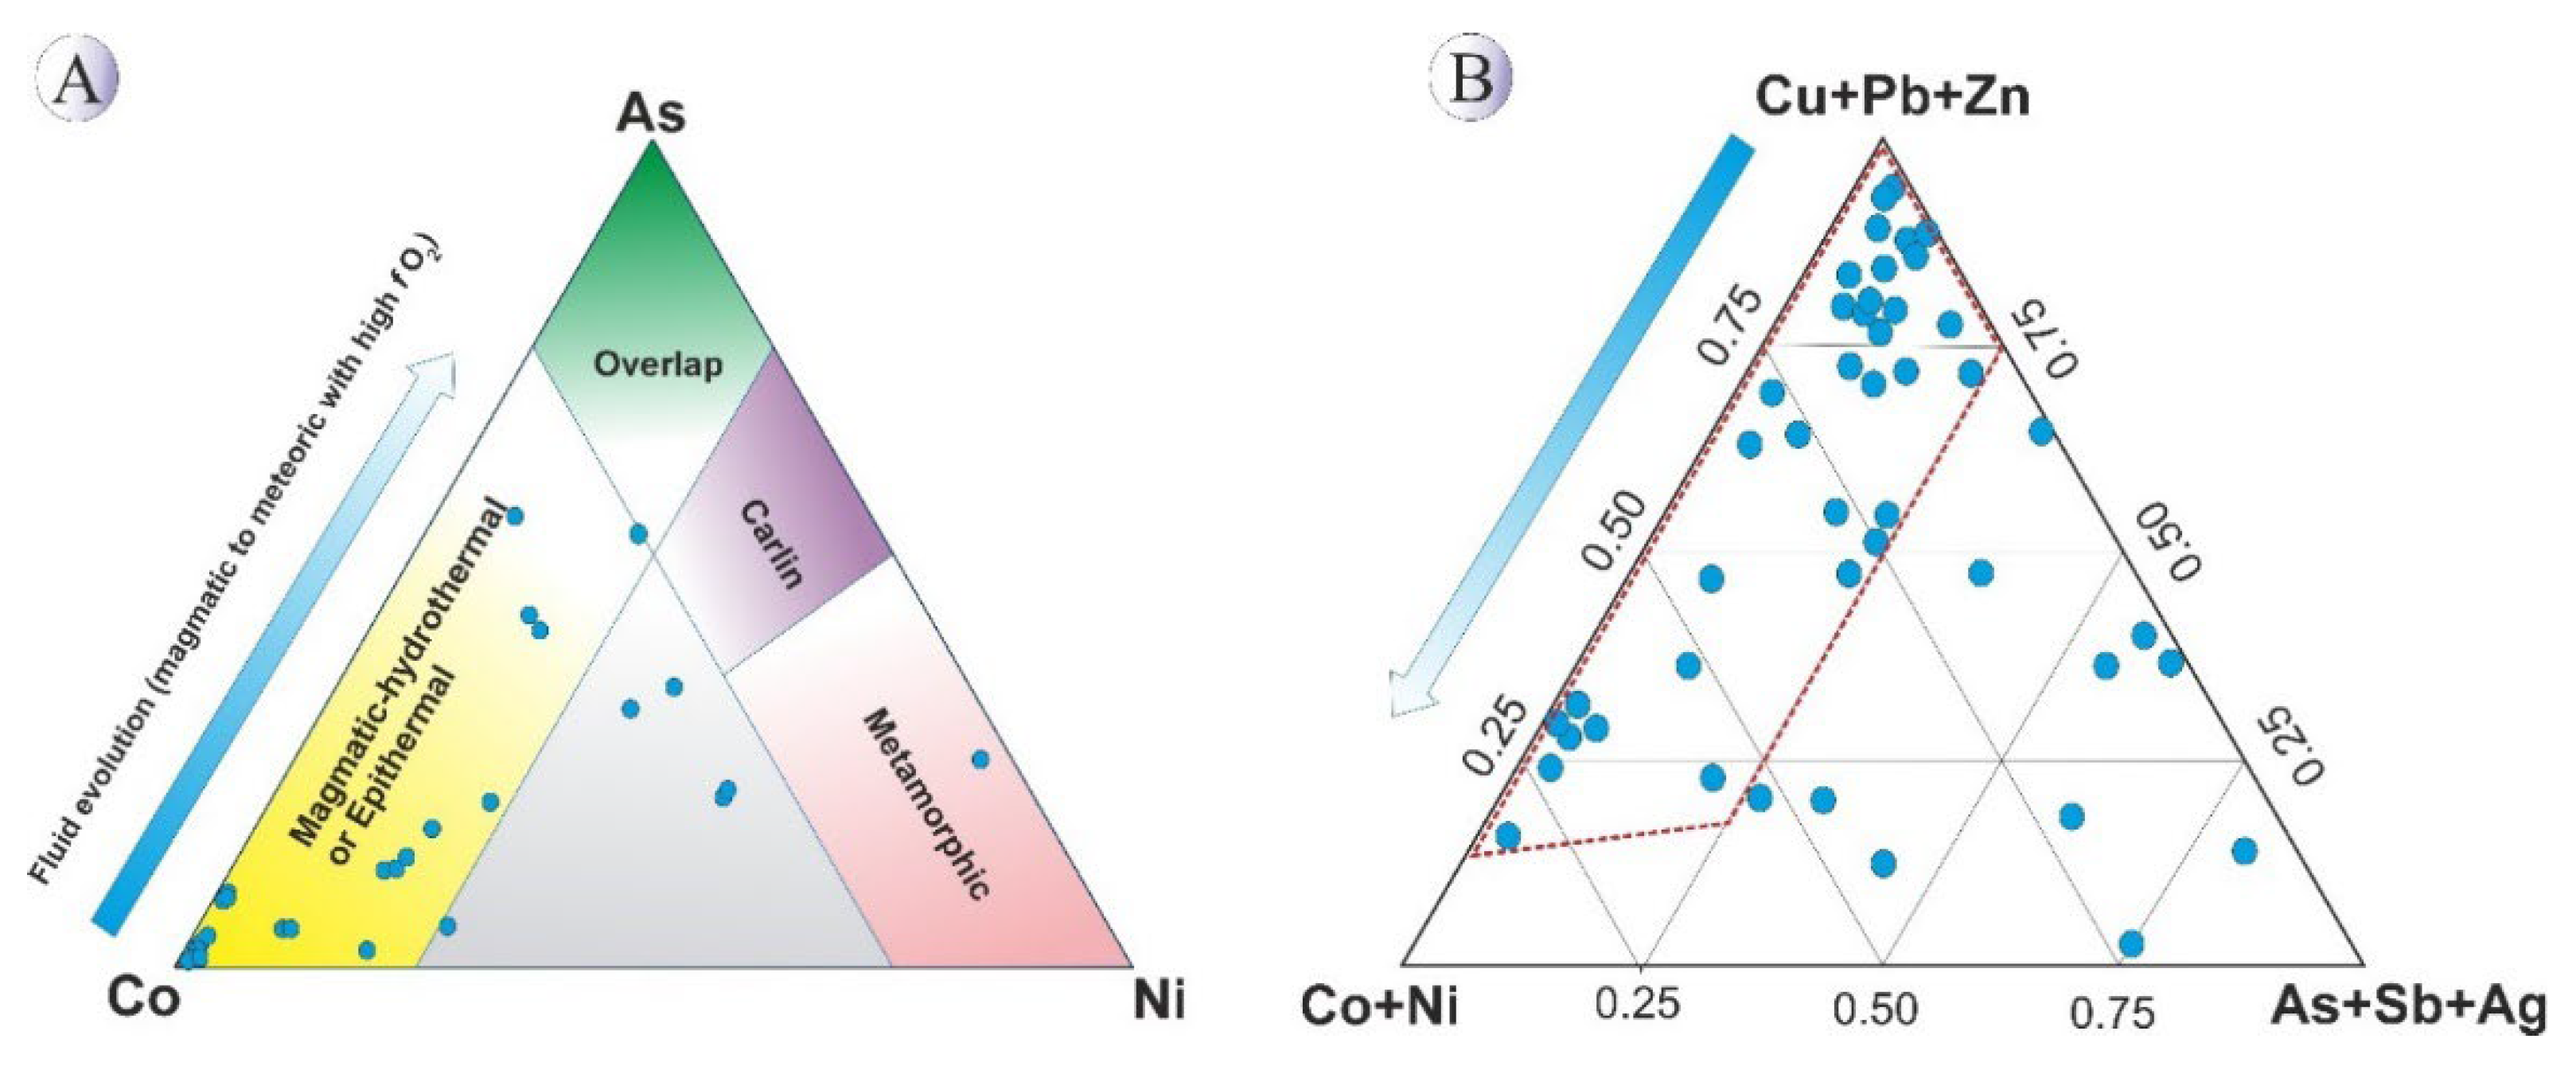
Figure 15.
Diagram of Co variations versus Ni and the Co/Ni ratio in Northeast Saveh pyrites. The Co/Ni ratio of pyrite for most samples have a ratio between 1 and 10, which corresponds to pyrites of Igneous-hydrothermal origin [45]. Samples with a Co/Ni ratio of ~100 (as a result from cobalt enrichment rather than nickel depletion) reflect pyrite grains formed at shallower stratigraphic levels.
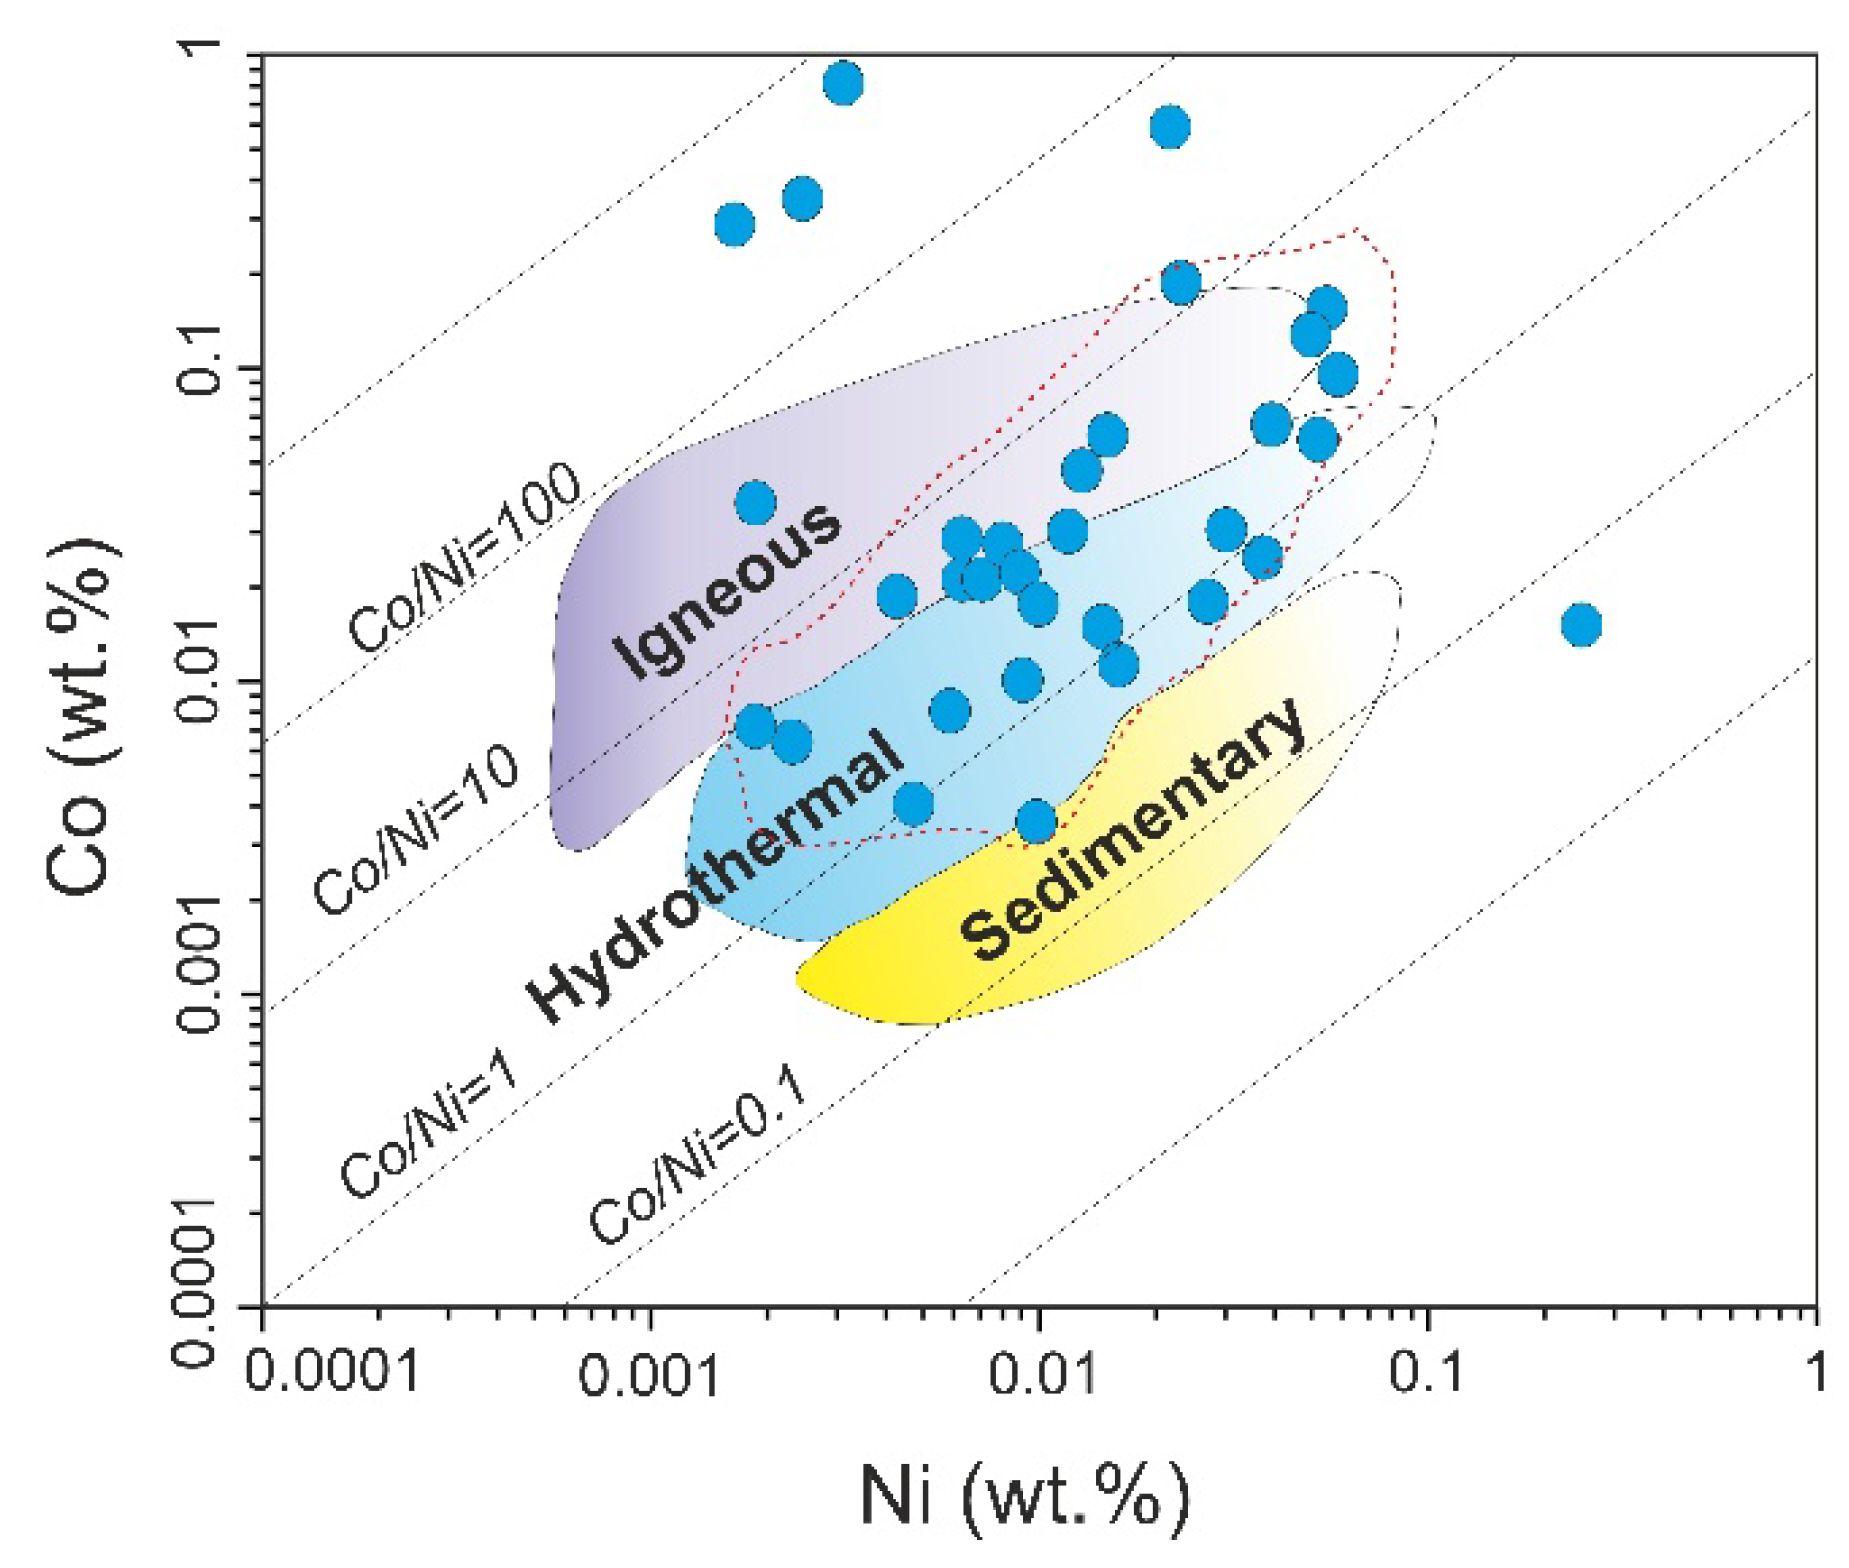
Figure 16.
Box plots showing variations in Fe, Cu, and S concentrations in chalcopyrite (Ccp) and chalcocite (Cct) from the Northeast Saveh area. Dashed arrows indicate compositional trends from chalcopyrite to chalcocite.
Figure 16.
Box plots showing variations in Fe, Cu, and S concentrations in chalcopyrite (Ccp) and chalcocite (Cct) from the Northeast Saveh area. Dashed arrows indicate compositional trends from chalcopyrite to chalcocite.
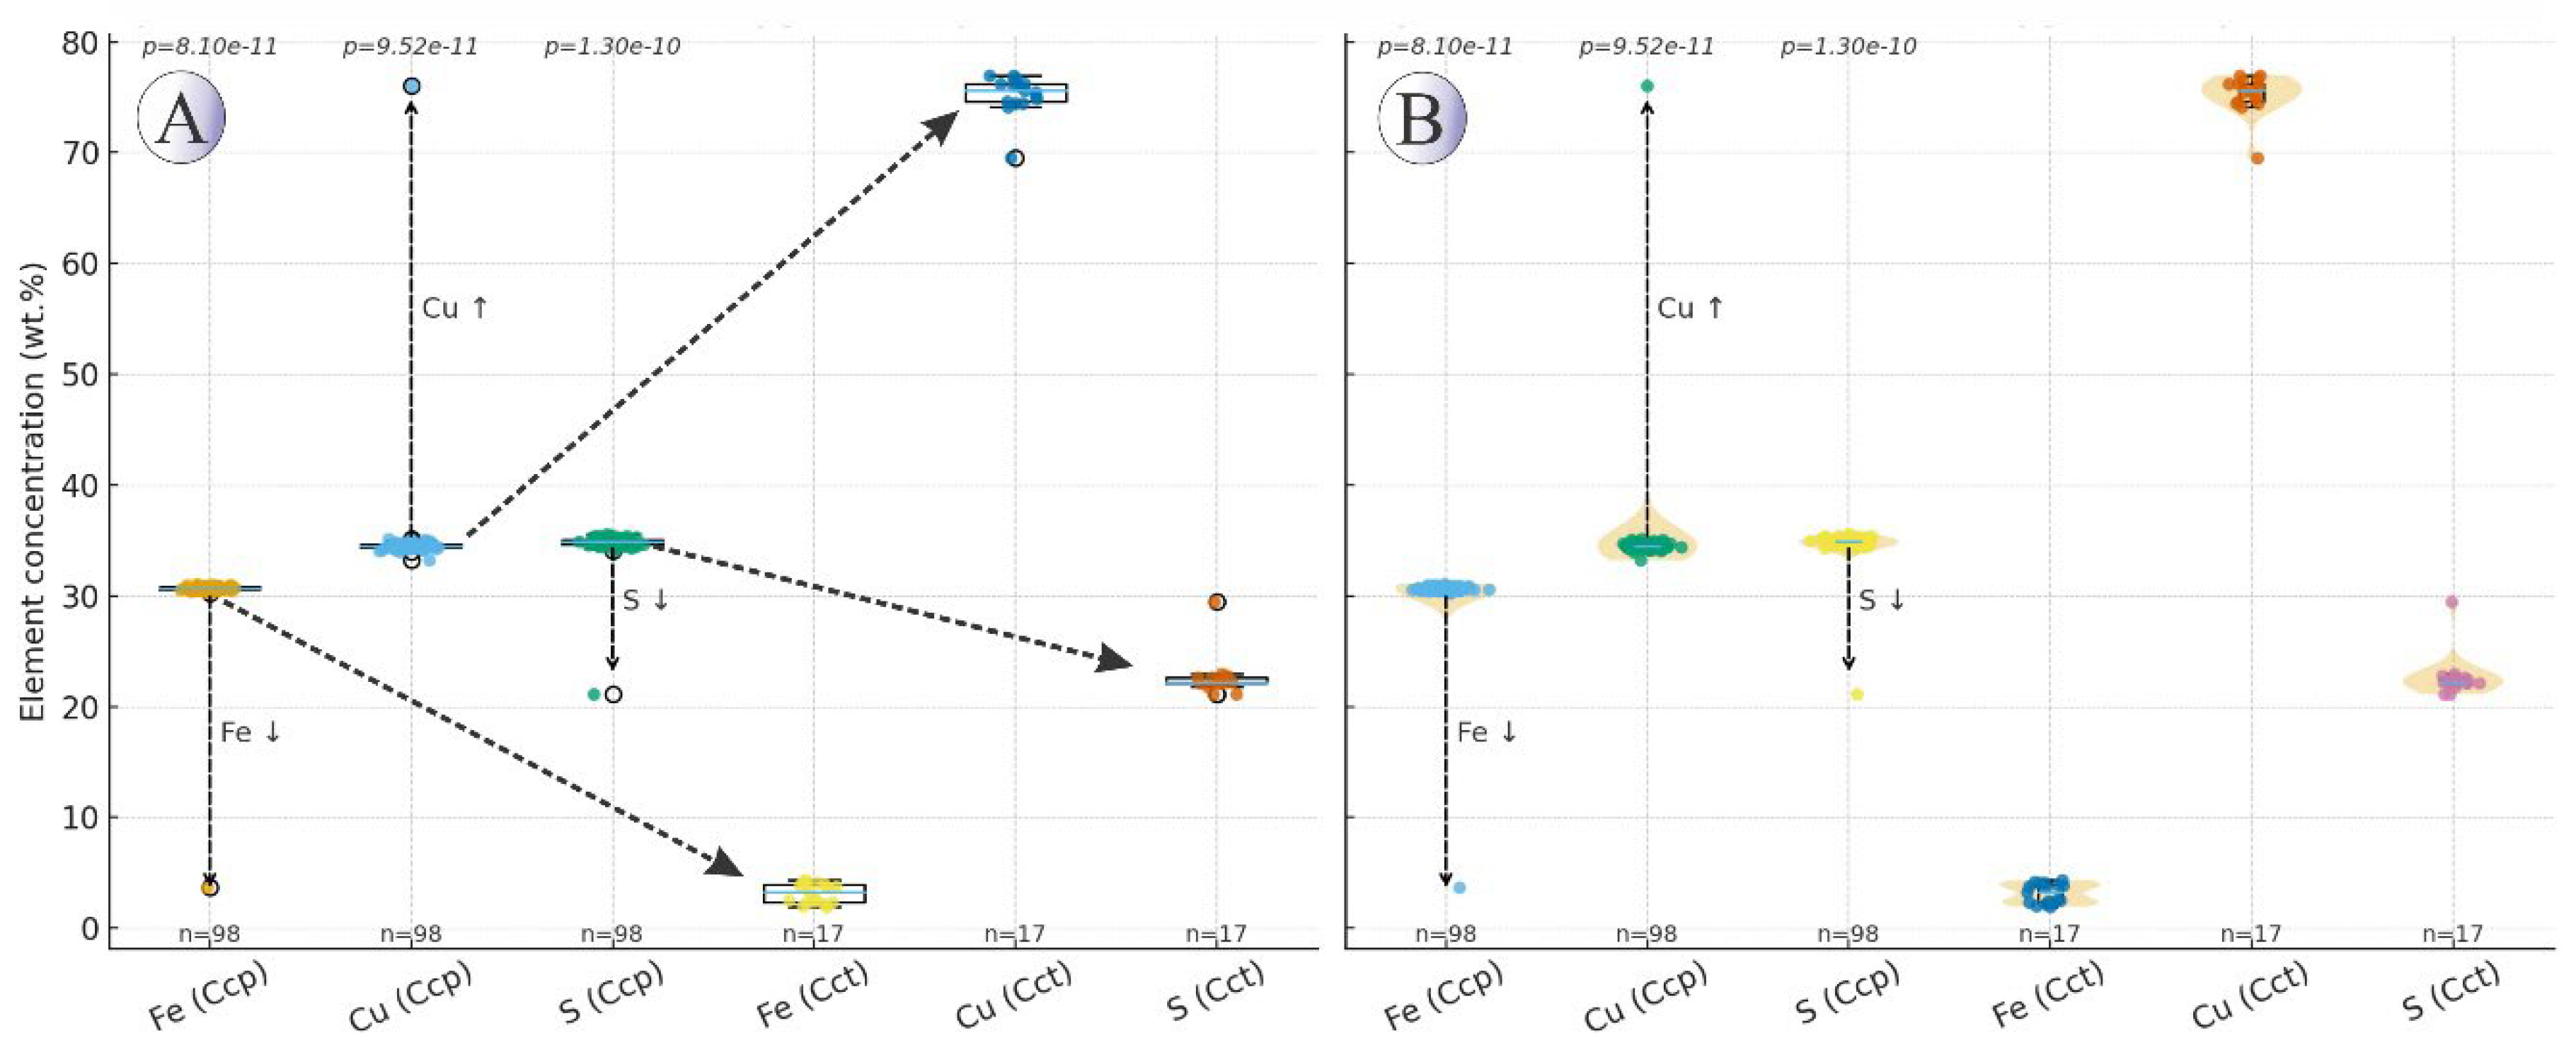
Figure 17.
(A) Boxplots showing the distribution of trace element concentrations (wt.%) in chalcopyrite (except Fe, S, Cu) from the Northeast Saveh area. Each box represents the interquartile range, with the median line and whiskers corresponding to 1.5×IQR. (B) Violin plots illustrating the same data, showing kernel density distributions that highlight the variability and skewness of elemental concentrations.
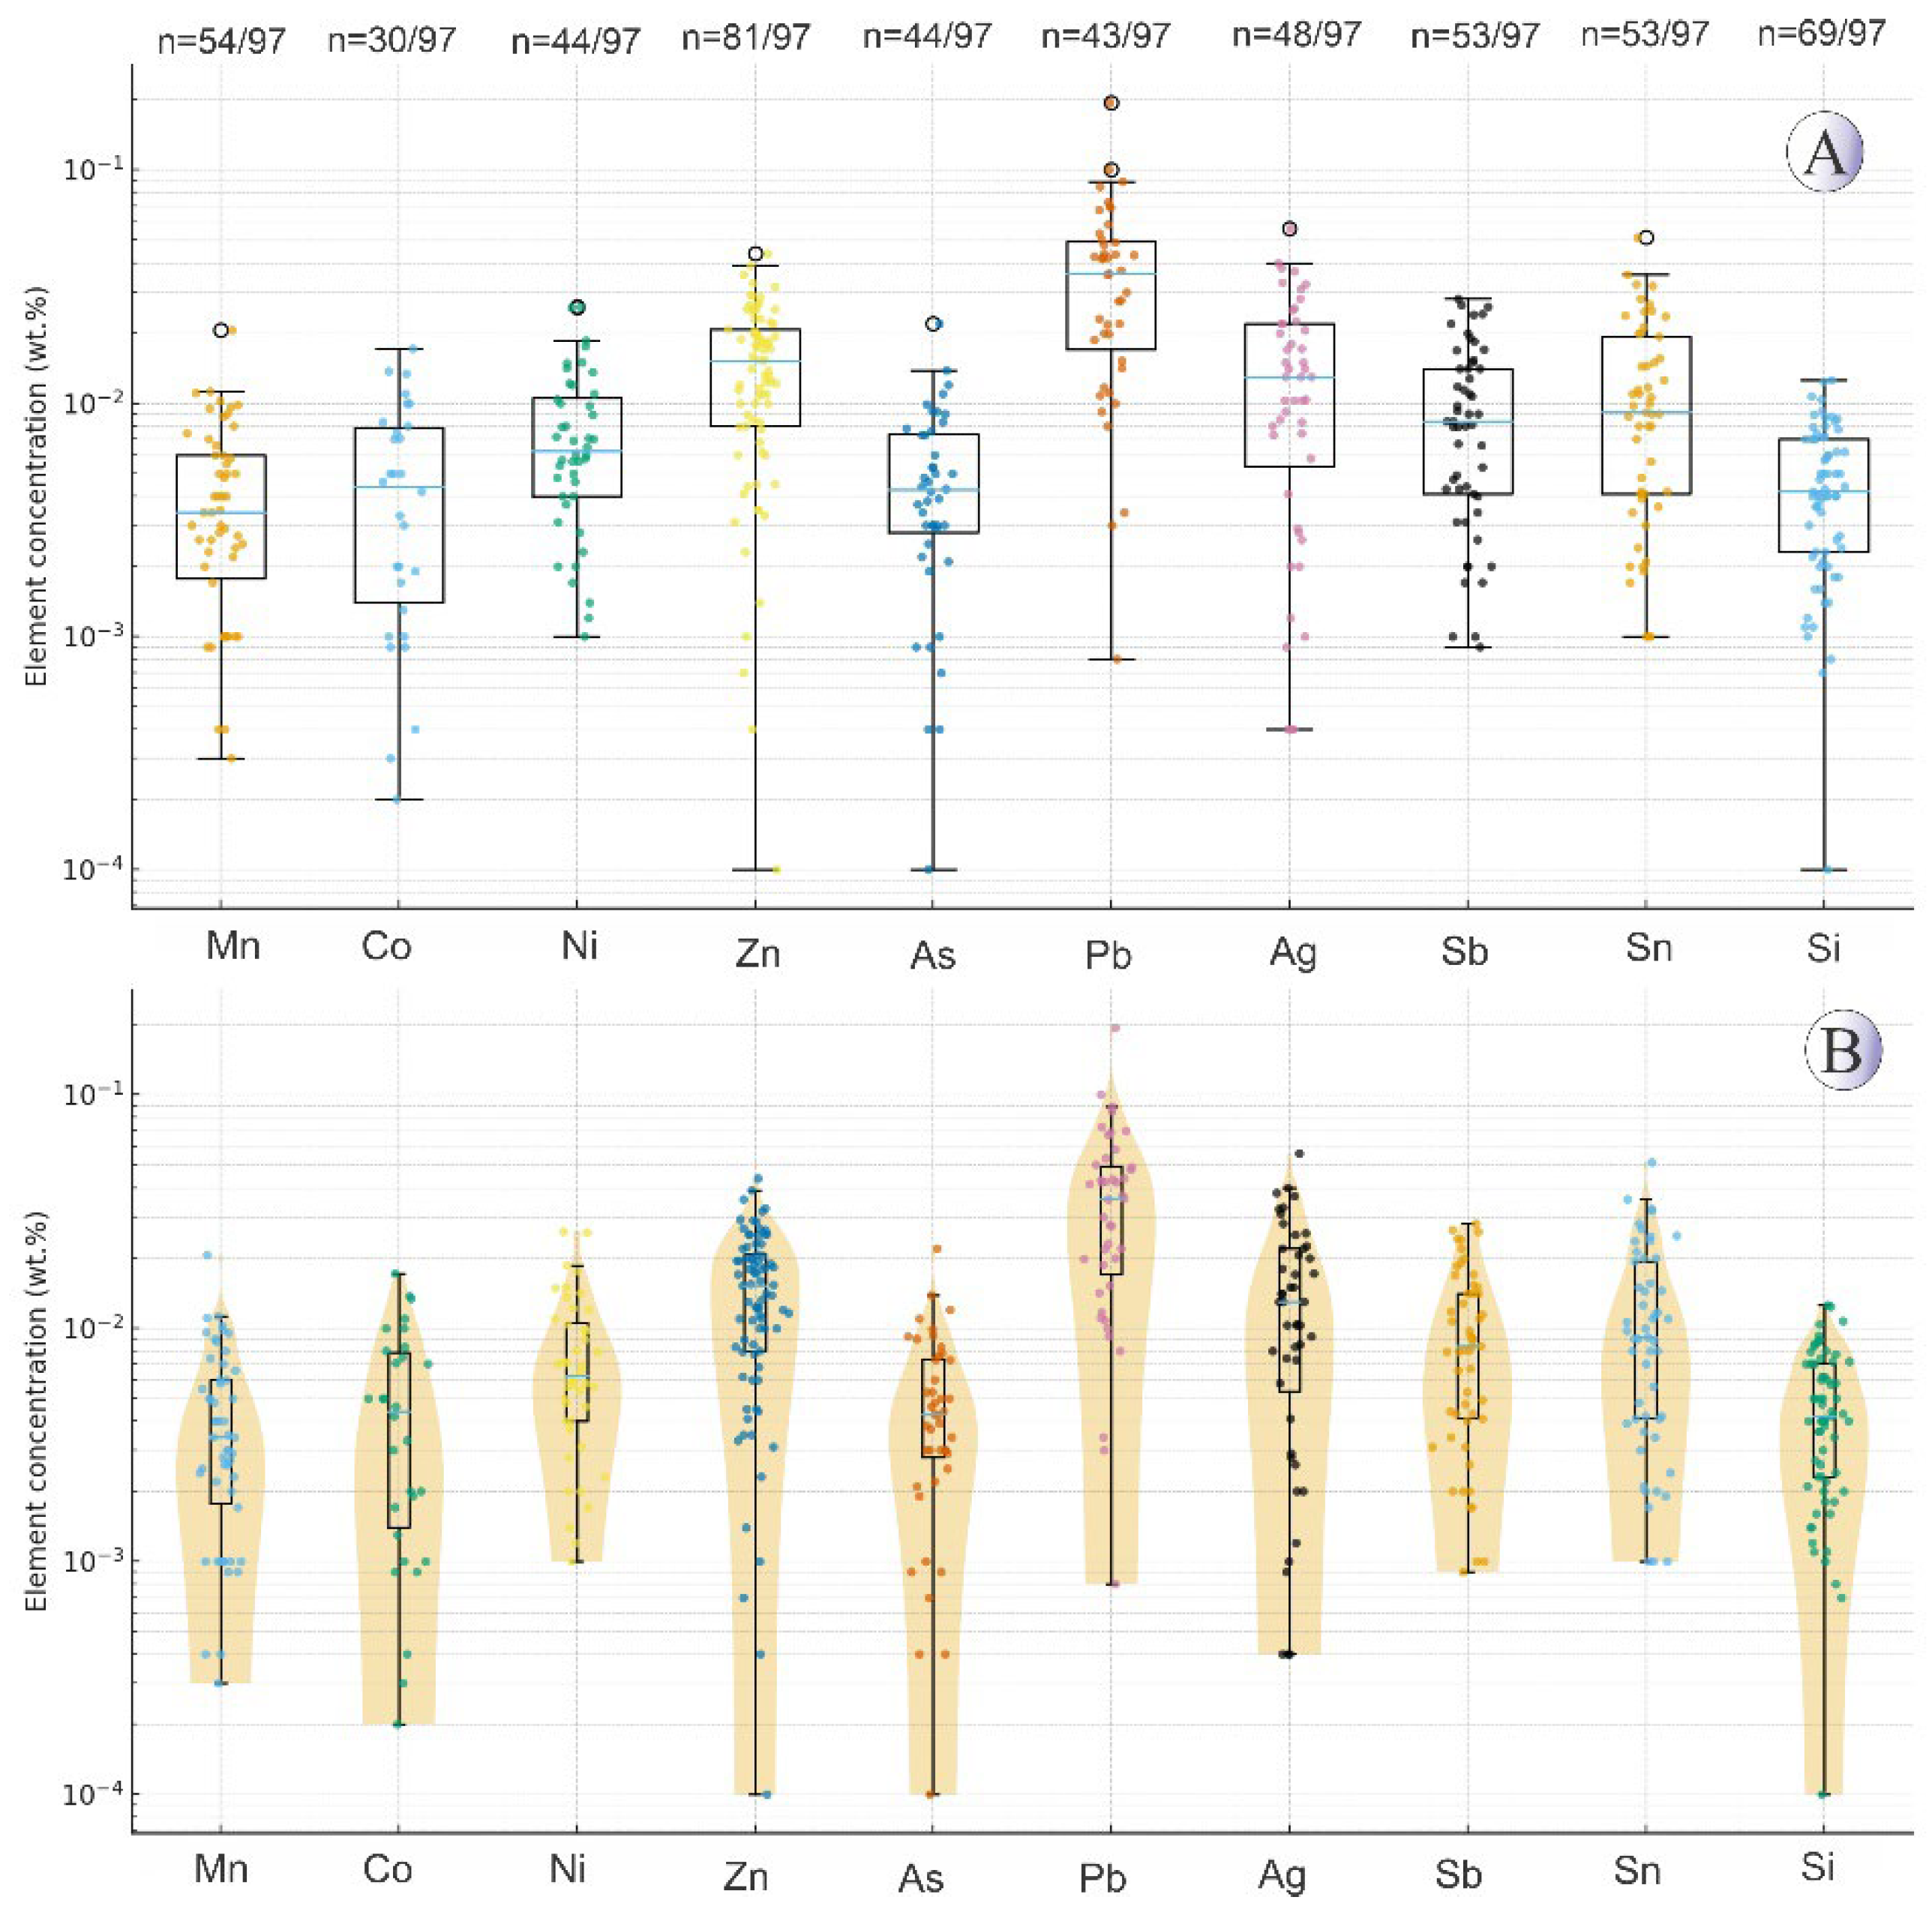
Figure 18.
Figure. 16. (A) Boxplots showing the distribution of trace element concentrations (wt.%) in chalcocite (except Fe, S, Cu) from the Northeast Saveh area. Each box represents the interquartile range, with the median line and whiskers corresponding to 1.5×IQR. (B) Violin plots illustrating the same data, showing kernel density distributions that highlight the variability and skewness of elemental concentrations.
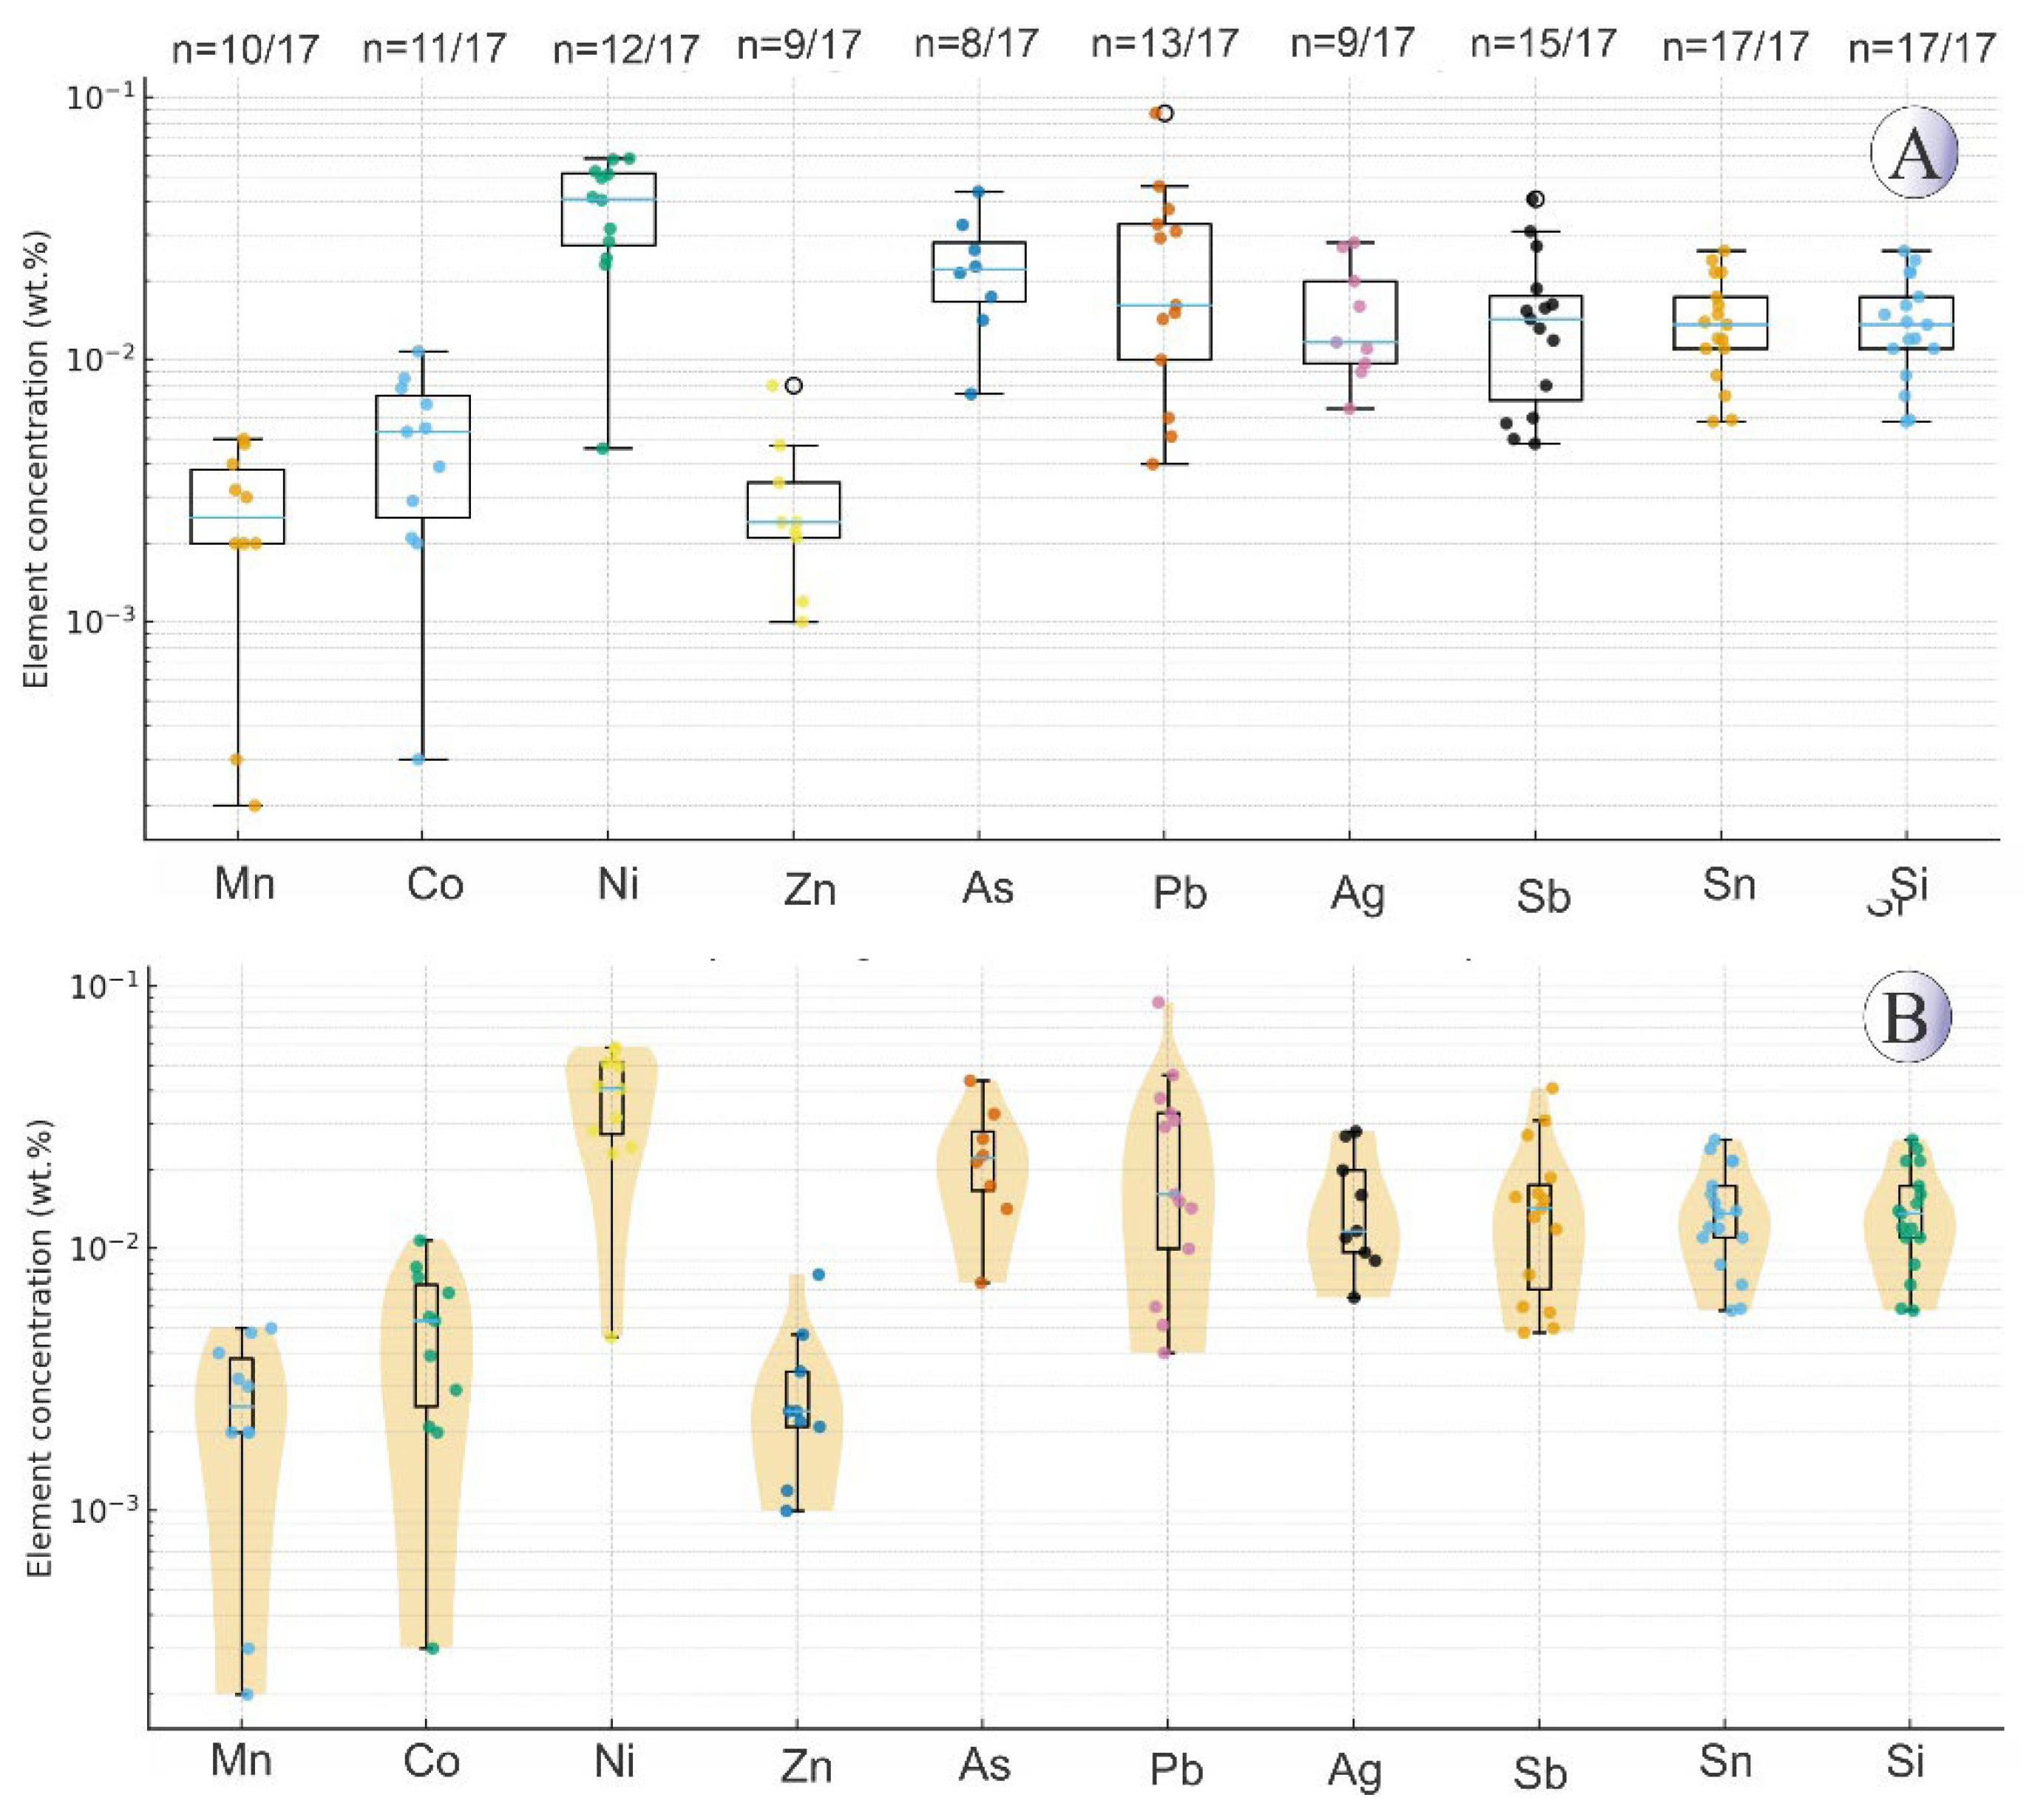
Figure 19.
FeO-Fe₂O₃-TiO₂ ternary diagram [69], showing the locations of EPMA analysis results of magnetite and titanomagnetite from intrusive rocks and hydrothermal veins.
Figure 19.
FeO-Fe₂O₃-TiO₂ ternary diagram [69], showing the locations of EPMA analysis results of magnetite and titanomagnetite from intrusive rocks and hydrothermal veins.
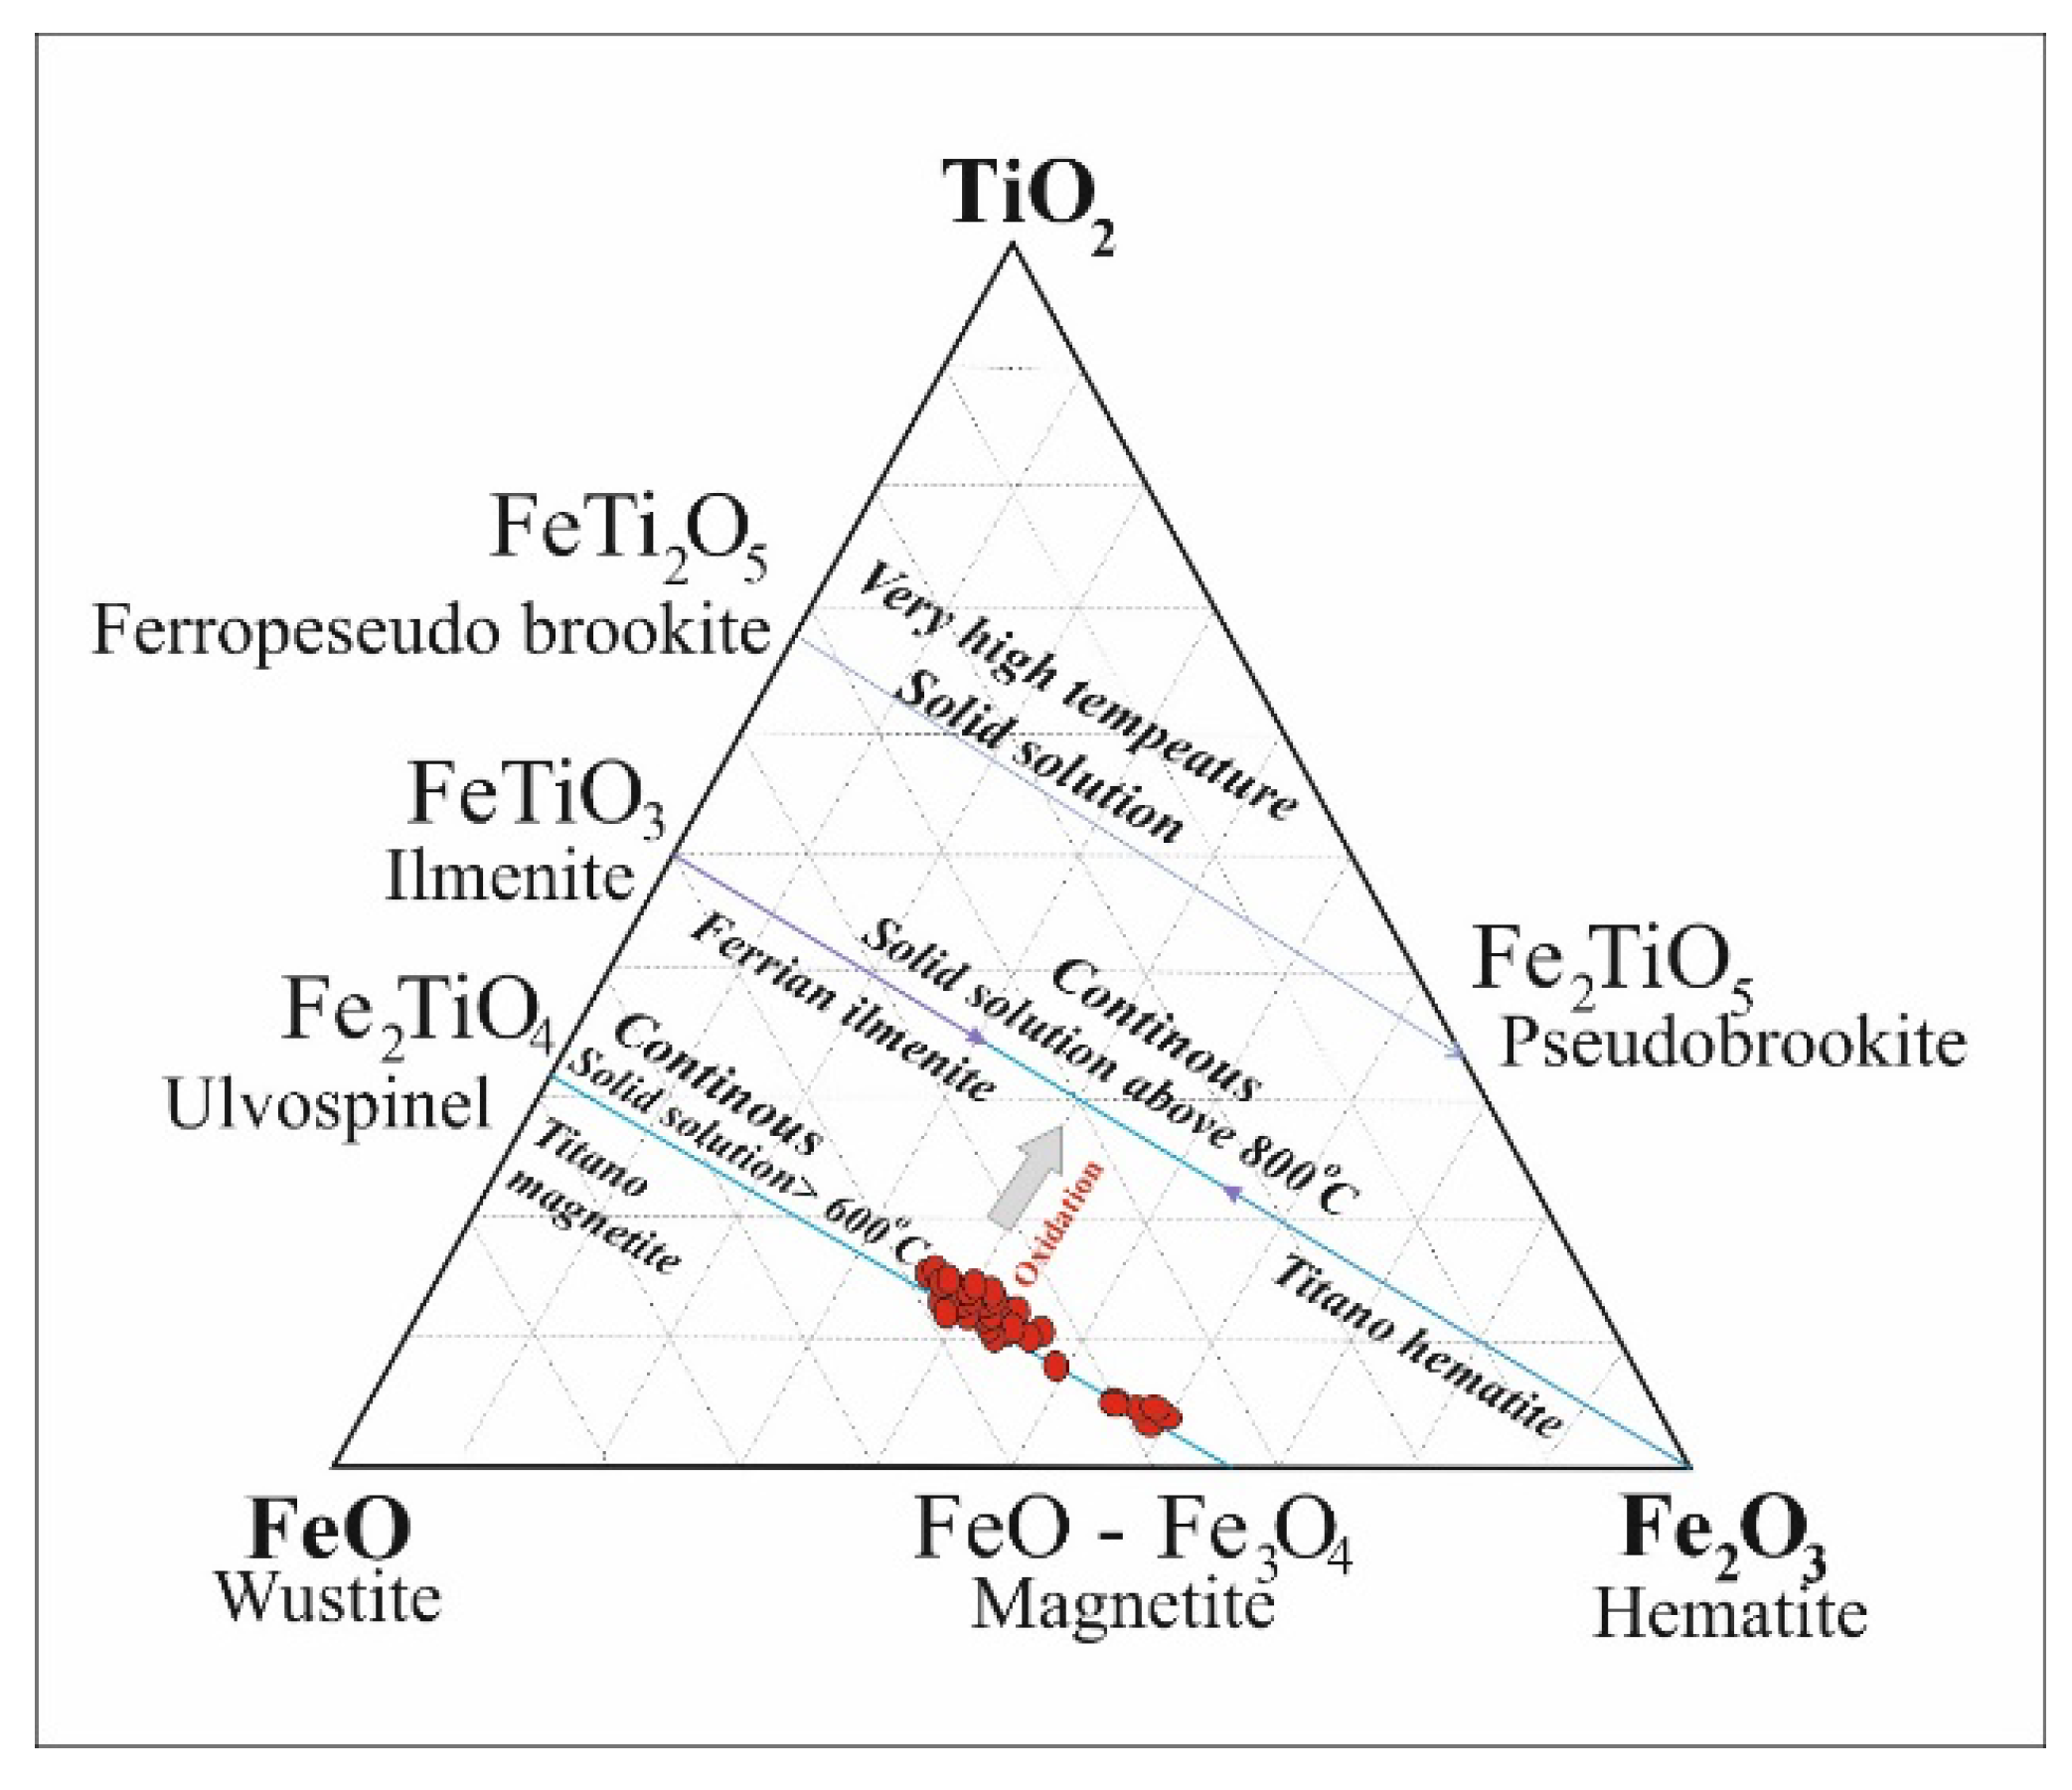
Figure 20.
V/Ti (wt.%) versus Fe (wt.%) diagram to distinguish magmatic, hydrothermal and re-equilibrated magnetites [77]. (A) Samples related to intrusive bodies. (B) Samples related to mineralized veins.
Figure 20.
V/Ti (wt.%) versus Fe (wt.%) diagram to distinguish magmatic, hydrothermal and re-equilibrated magnetites [77]. (A) Samples related to intrusive bodies. (B) Samples related to mineralized veins.
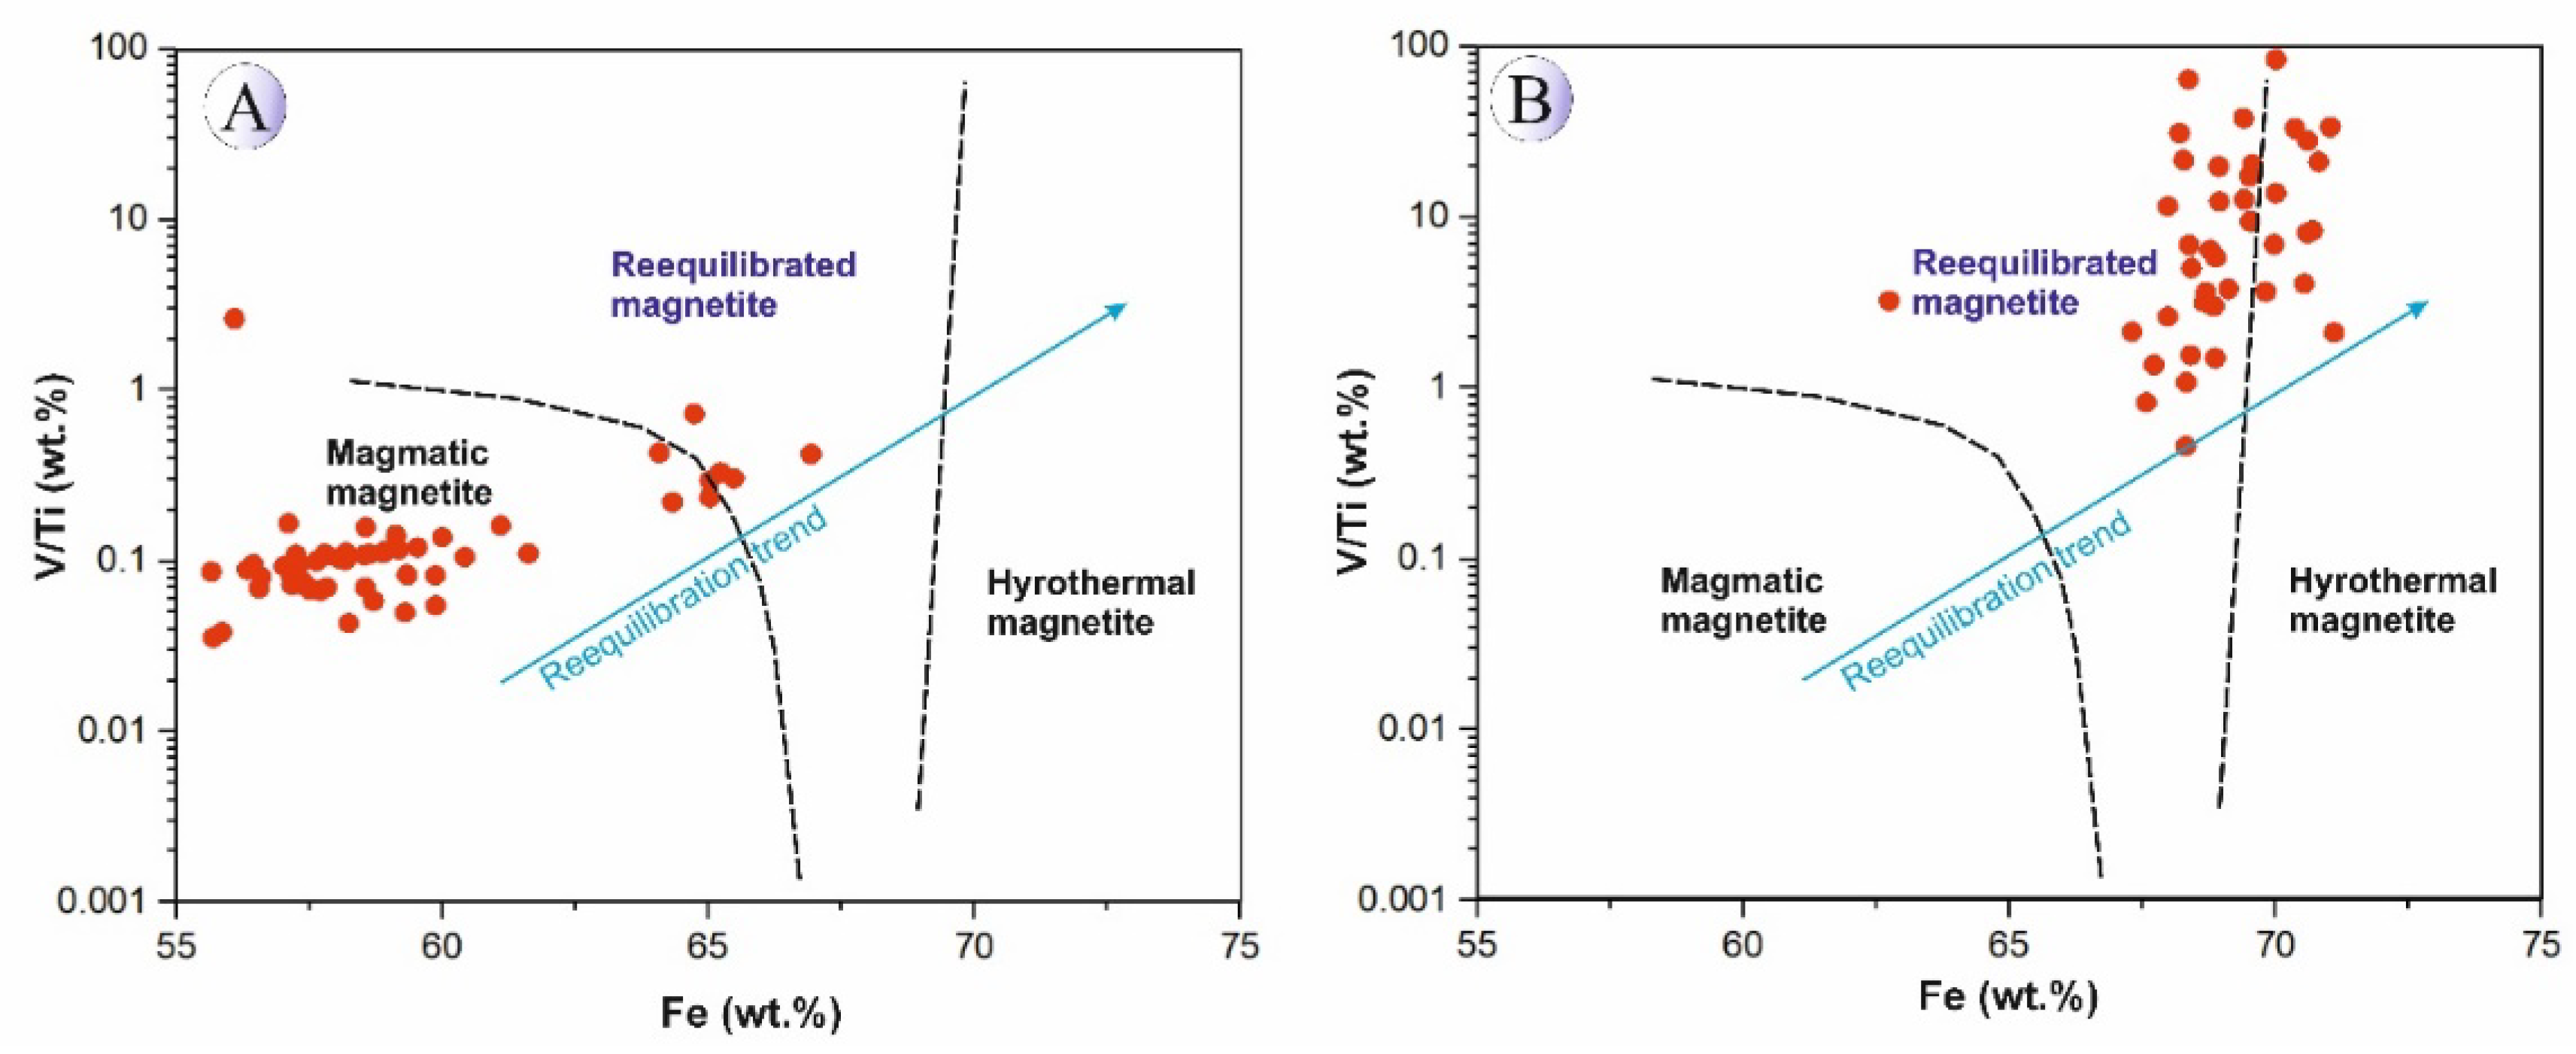
Figure 21.
Bivariate plot of Ti+V (wt.%) versus Al+Mn (wt.%) [12,46] showing the temperature range of Northeast Saveh magnetites and titanomagnetites. A) Samples related to intrusive bodies. B) Samples related to mineralized veins.
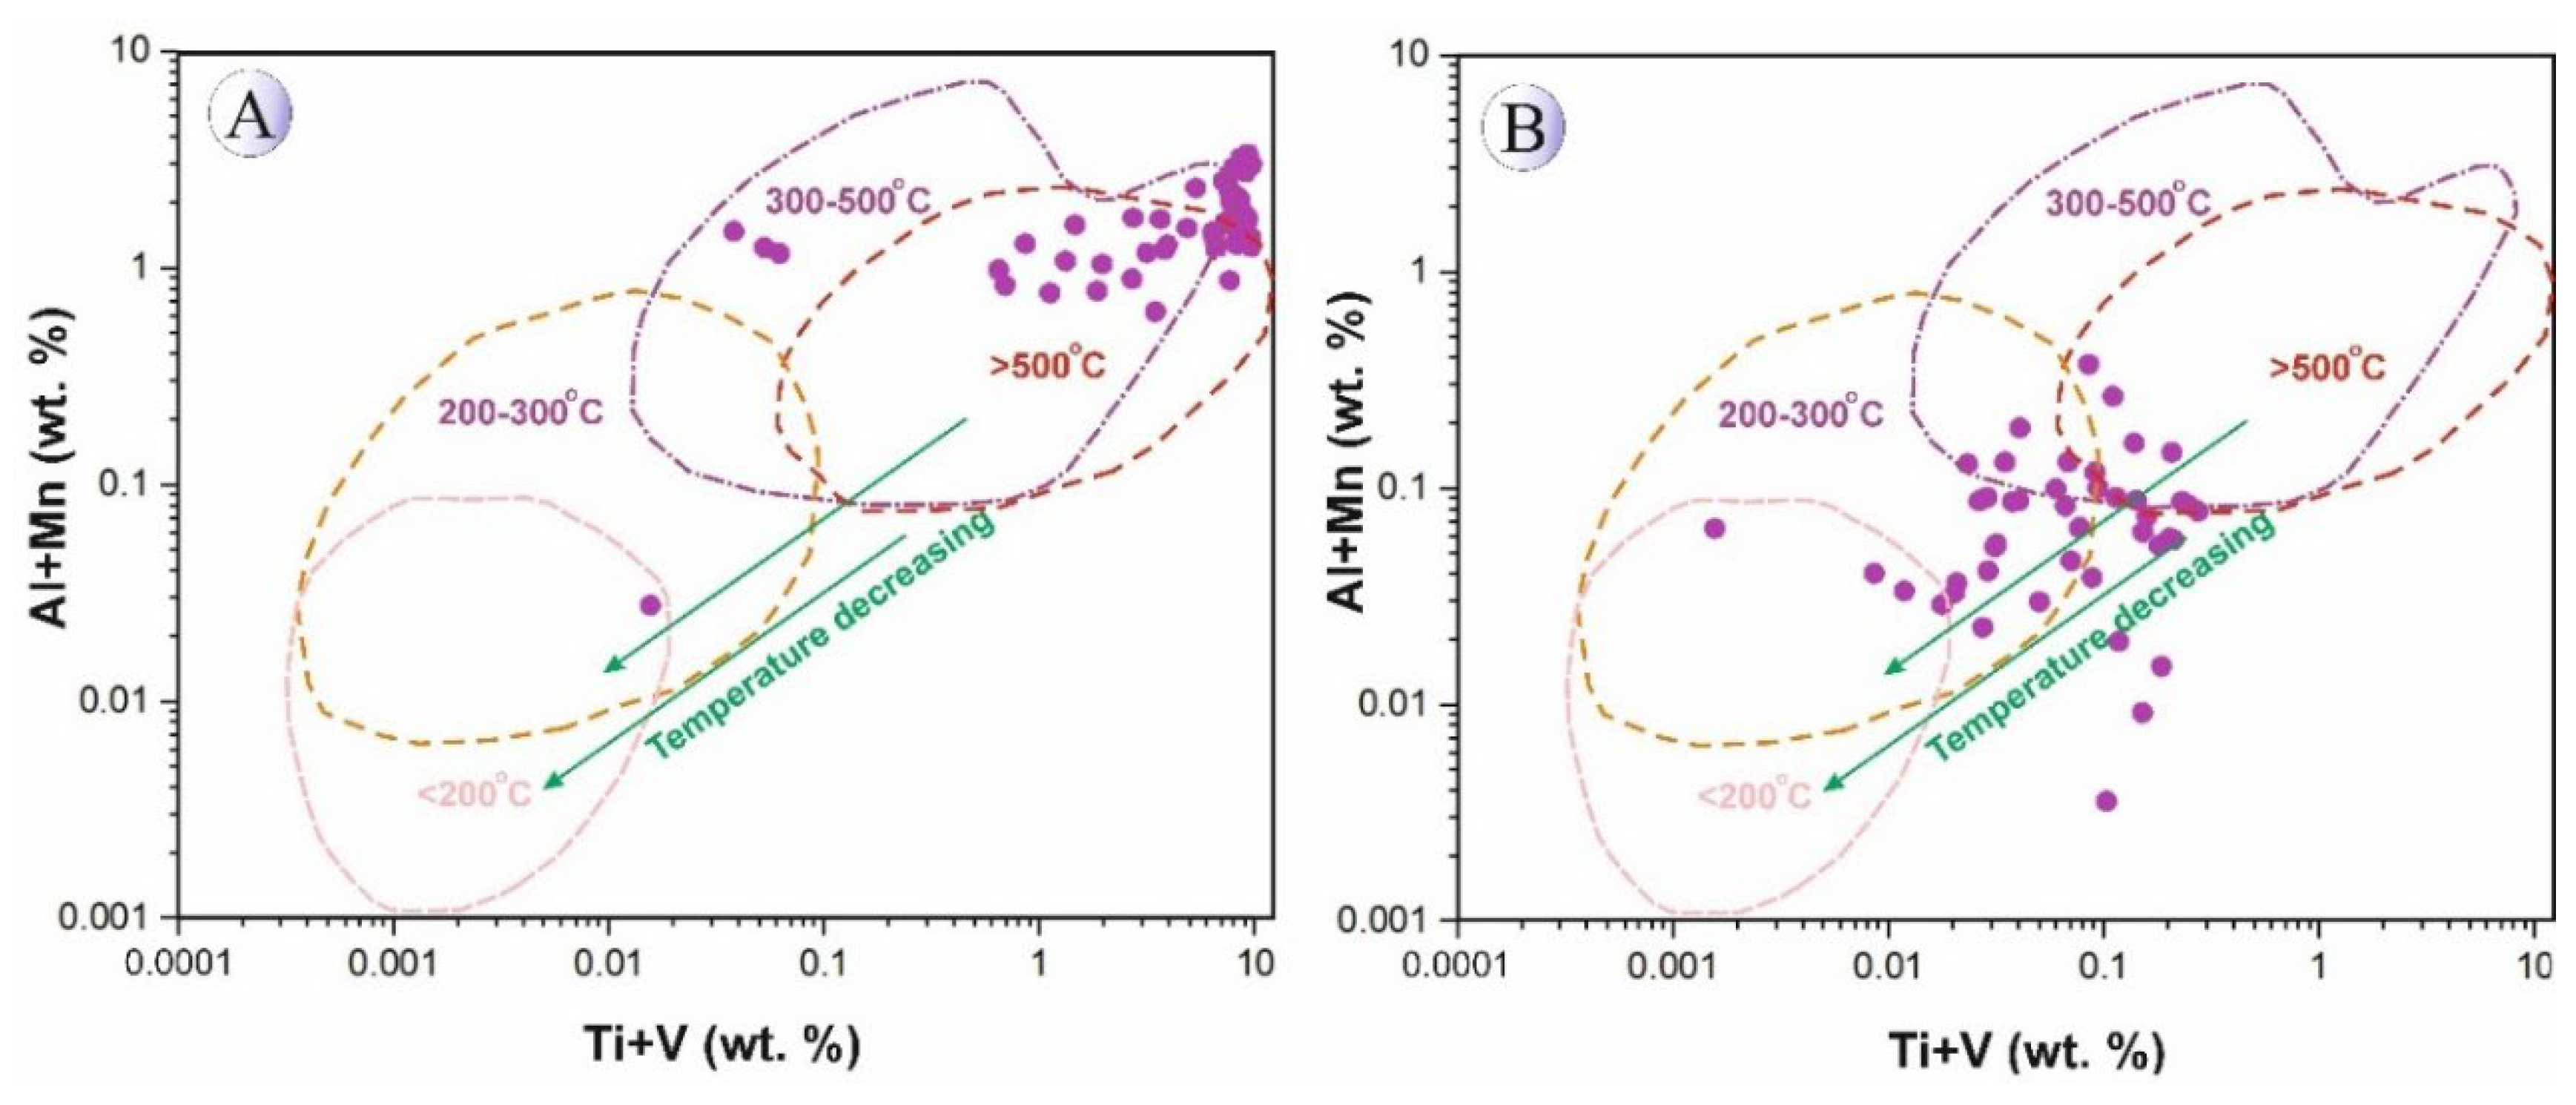
Figure 22.
(A) Ti versus Mg+Al+Si diagram [75] for determining the reaction rate between fluid and wall rock in Northeast Saveh magnetites. The arrow indicates the direction of decreasing fluid-rock interaction rate. (B) Bivariate diagram of Ti versus V [12] showing the range of Northeast Saveh titanomagnetites in the magmatic field and titanomagnetites of mineralized veins in the hydrothermal field.
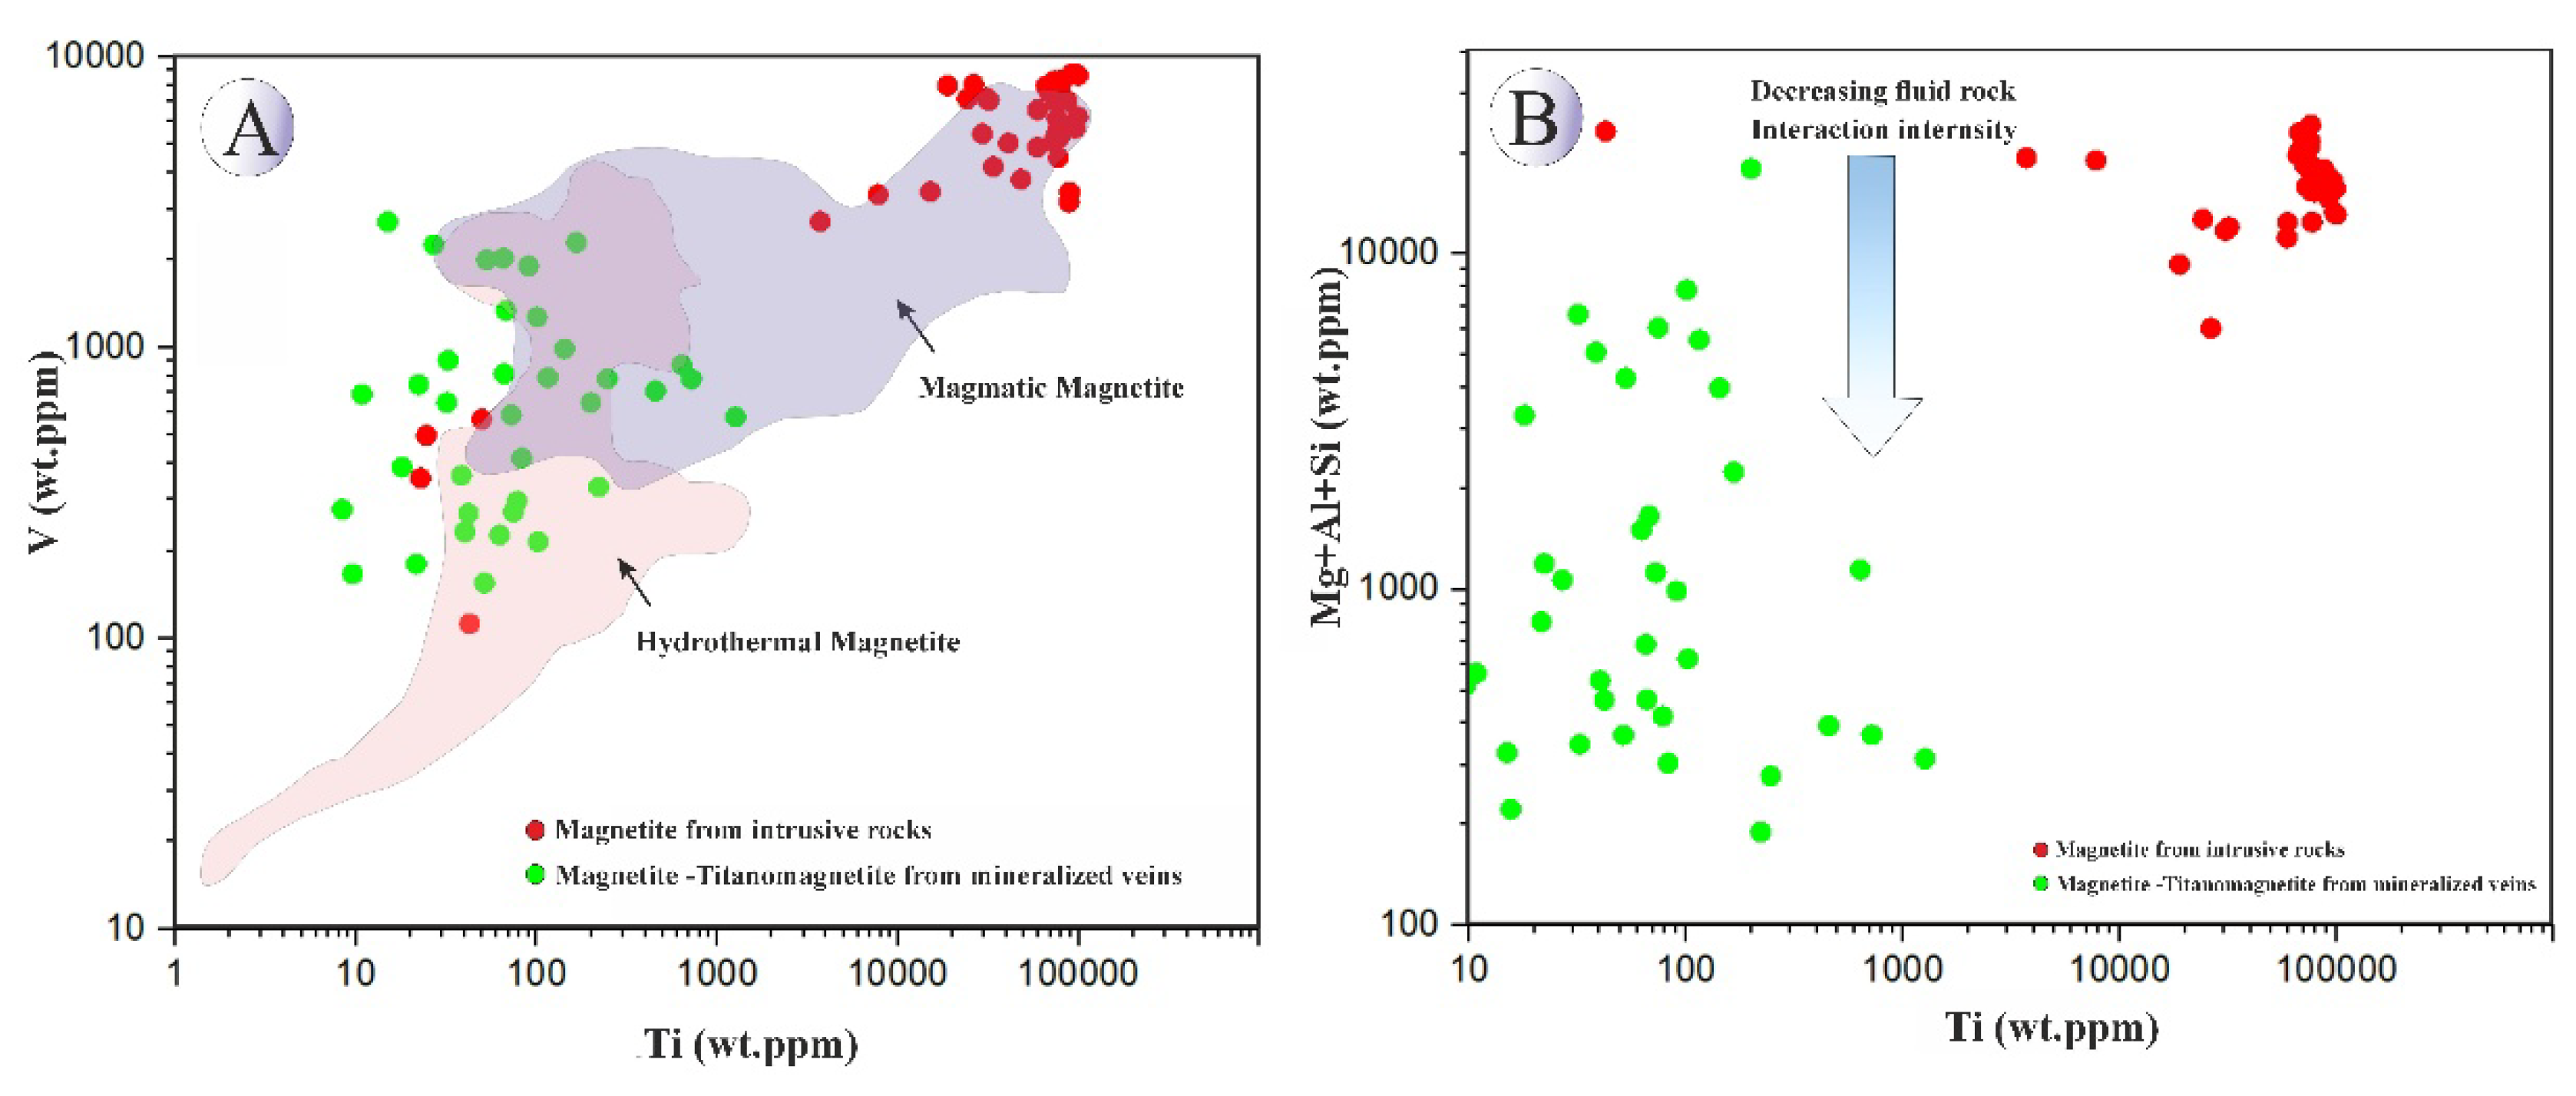
Figure 23.
Diagram showing the relationship between magnetite composition and deposit type (temperature trends and boundaries from [12].
Figure 23.
Diagram showing the relationship between magnetite composition and deposit type (temperature trends and boundaries from [12].
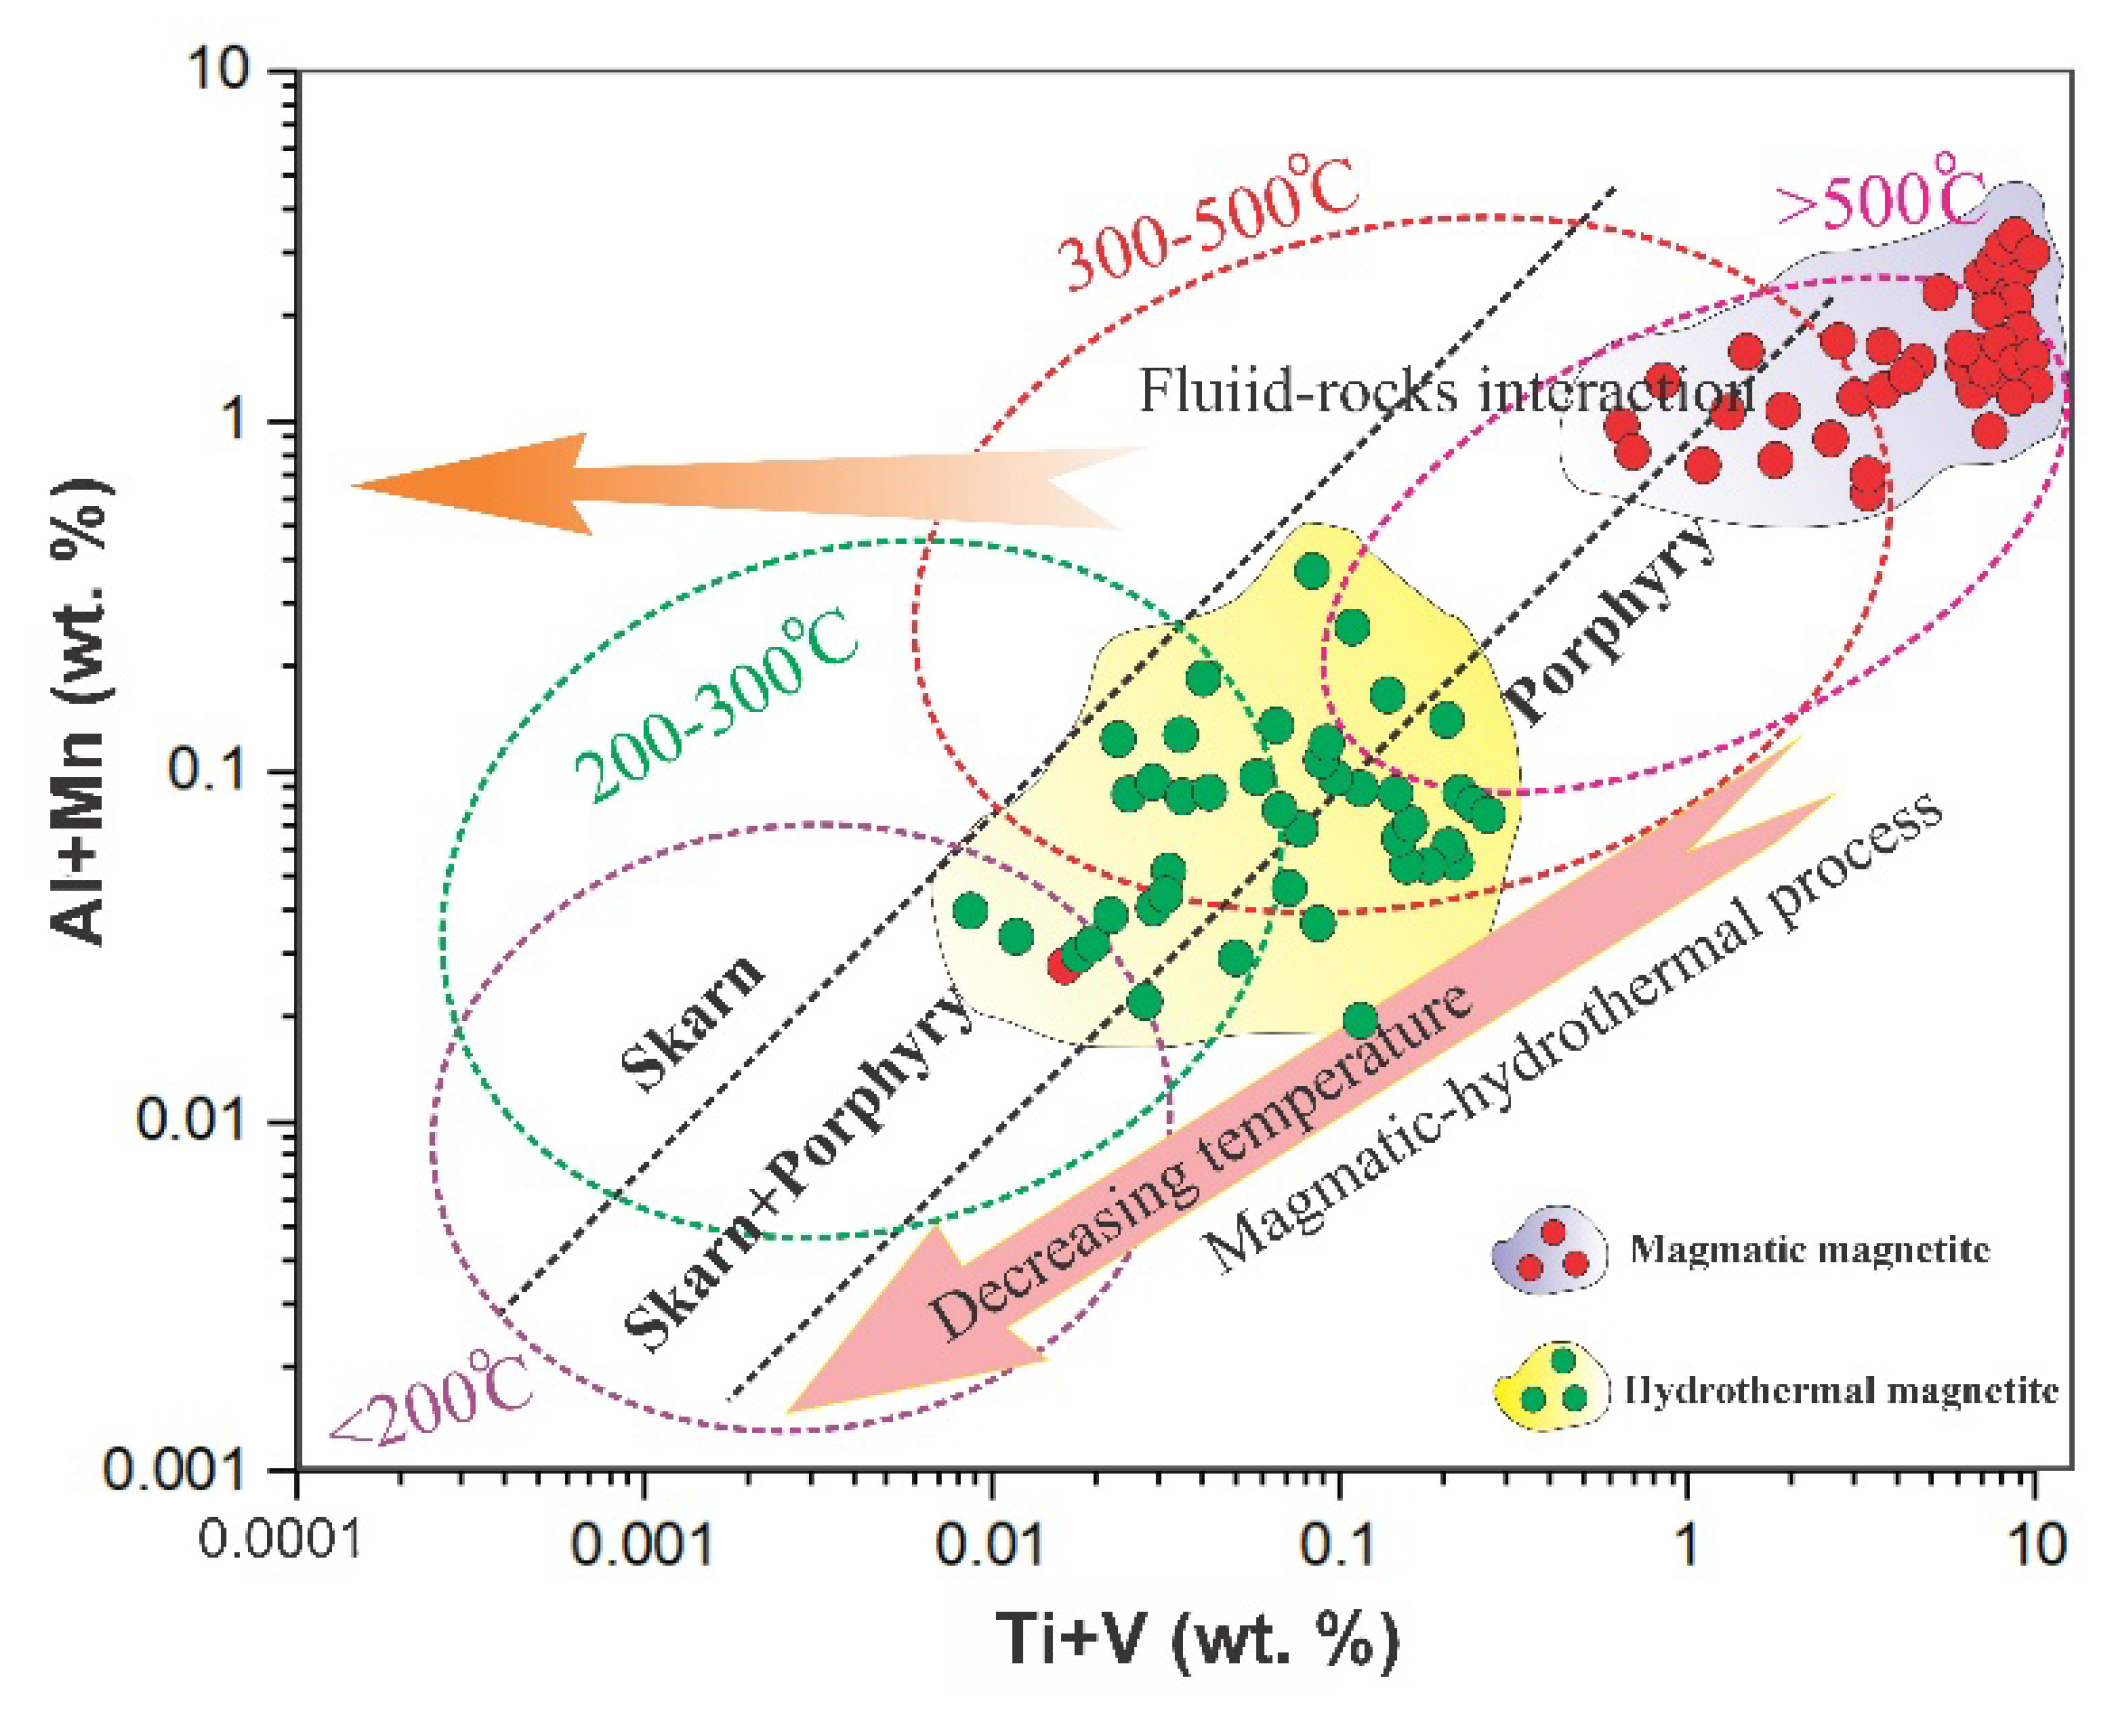
Disclaimer/Publisher’s Note: The statements, opinions and data contained in all publications are solely those of the individual author(s) and contributor(s) and not of MDPI and/or the editor(s). MDPI and/or the editor(s) disclaim responsibility for any injury to people or property resulting from any ideas, methods, instructions or products referred to in the content. |
© 2025 by the authors. Licensee MDPI, Basel, Switzerland. This article is an open access article distributed under the terms and conditions of the Creative Commons Attribution (CC BY) license (http://creativecommons.org/licenses/by/4.0/).
Copyright: This open access article is published under a Creative Commons CC BY 4.0 license, which permit the free download, distribution, and reuse, provided that the author and preprint are cited in any reuse.


