
Submitted:
16 November 2025
Posted:
18 November 2025
You are already at the latest version
Abstract
In this study, a Support Vector Machine (SVM)-based model was developed to predict the Rate of Penetration (ROP) during tunnel excavation. The model demonstrated high accu-racy and stability on both training and testing datasets, with performance metrics indica-ting its reliability (R² = 0.9583–0.9664, NSE = 0.9164–0.9292, MAE = 0.095–0.0968). To en-hance predictive performance, three systematic hyperparameter optimization strate-gies—Grid Search, Random Search, and Bayesian Optimization—were employed. Notably, Bayesian Optimization achieved high accuracy and computational efficiency with fewer evaluations, leveraging a probabilistic search framework and Gaussian Process-based modeling.
Unlike previous studies in the literature, the dataset and input parameters used in this work exhibit greater diversity, and the effect of hyperparameter optimization on model performance was analyzed in detail. The results demonstrate that careful hyperparameter tuning can ensure strong generalization even under limited data conditions. This study provides significant methodological contributions to TBM performance prediction and ge-otechnical engineering applications.
Keywords:
tunnel boring machine (TBM)
; rate of penetration (ROP)
; support vector machine (SVM)
; hyperparameter optimization
; grid search
; random search
; bayesian optimization
1. Introduction
In modern transportation, energy, and infrastructure projects, tunnels are constructed to ensure continuity in intercity and regional transport, as well as to support water supply, wastewater management, and energy transmission. However, these structures are often executed under complex geotechnical conditions and variable ground properties, posing high costs, safety risks, and technical challenges during design, construction, and operation. Therefore, the efficient and safe excavation of tunnels is directly dependent on the accurate prediction of tunnel boring machine (TBM) performance. Reliable estimation of TBM penetration rate (ROP) is crucial for planning excavation operations and controlling project costs.
Early research on TBM penetration rate prediction [1] began with empirical models based on rock strength, followed by studies examining TBM performance in sedimentary rock environments [2]. A statistical regression model relating rock properties (UCS, PSI, DPW, α) to penetration rate was first proposed in [3]. Through advanced regression analysis, this model achieved the highest correlation (r = 0.82) and provided an empirical prediction equation based on measured rock parameters [3]. However, these early approaches generally relied on simple correlations and were insufficient in capturing complex geotechnical interactions.
Heuristic optimization algorithms were first applied to TBM performance prediction by Yağiz and Karahan [4], who developed a particle swarm optimization (PSO)-based model to minimize the difference between measured and predicted ROP values [4]. Subsequent studies [5] extended these approaches using Harmony Search (HS), Differential Evolution (DE), and Grey Wolf Optimizer (GWO) algorithms, demonstrating the applicability of heuristic methods for TBM performance estimation. While these models offer interpretability due to their analytical form, they remain limited in capturing ground heterogeneity and complex interactions.
To overcome these limitations, artificial intelligence-based methods such as Artificial Neural Networks (ANN) [6,7,8], Support Vector Machines (SVM) [9,10,11], and fuzzy logic [12,13,14] have been increasingly adopted for TBM modeling. These methods can accurately predict penetration rates under complex, multivariate geotechnical conditions and effectively capture nonlinear relationships and intricate interactions among parameters. Even with small or noisy datasets, they can yield reliable results, although interpretability may be somewhat constrained.
Furthermore, model performance is highly dependent on network architecture, activation functions, and learning algorithms for ANNs [15,16,17], and on proper selection of model parameters for SVMs [18]. This necessitates numerous trial-and-error iterations prior to modeling. Given their reliance on hyperparameter optimization and data preprocessing, these methods can incur significant time and computational costs, especially when dealing with large datasets.
Accurate prediction of TBM penetration rate is therefore critical for planning and optimizing tunnel construction projects. Recent studies have increasingly employed AI-based models for this purpose [19,20]. For example, Reference [19] developed an SVR-based model under hard rock conditions and achieved high predictive accuracy. Similarly, Reference [20] compared the performance of ANN, SVM, and GEP models for the Chamshir water conveyance tunnel project in Iran, reporting that the GEP model exhibited relatively lower error. These studies highlight the influence of dataset size and geological variability on model performance.
In a recent study [21], MLR, ANN, and SVM methods were compared for predicting TBM penetration rates in the Kerman and Gavoshan tunnels. The models incorporated variables such as RQD, UCS, BTS, density, Poisson’s ratio, joint angle, and joint spacing as input features. While all methods achieved high accuracy, SVM predictions were found to be more precise and realistic than those of other methods.
However, SVM performance strongly depends on the proper optimization of hyperparameters, including the regularization parameter (C), the ε-insensitive loss function, and the kernel parameter (γ). To reliably assess the model’s generalization capability, the dataset must be split into training and testing subsets, which plays a key role in reducing the risk of overfitting [15]. In the aforementioned studies [19,20,21], achieving high model performance required numerous trial-and-error iterations to select suitable parameters.
In this study, Grid Search, Random Search, and Bayesian optimization strategies were systematically applied to improve SVM performance for TBM modeling. The resulting findings are presented with figures and visualizations, aiming to provide original contributions to academic research, practical guidance for field applications, and teaching resources.
From an educational perspective, this study allows students in civil, geological, and geophysical engineering to experience modeling TBM performance based on real-world data. The comparison of different optimization strategies enhances students’ data-driven decision-making and design skills. Moreover, integrating AI and modeling processes provides a valuable foundation for translating acquired knowledge and skills into practical field applications.
2. Materials and Methods
2.1. Study Area and Data Collection
This study is based on field and laboratory measurements from a tunnel construction project located in the Queens area, southwestern New York City [3]. The dataset employed [4,5] has been widely used in subsequent TBM performance modeling studies [7,8]. It includes the essential parameters required to predict the TBM penetration rate (ROP). The measured parameters comprise uniaxial compressive strength (UCS), Brazilian tensile strength (BTS), rock hardness index (BI), excavation depth (DPW), and joint angle (α).
These data were utilized to model TBM performance and predict penetration rates, providing a reliable representation of field conditions and serving as a practical reference for both training purposes and field applications.
2.2. Input and Output Parameters
Five key input parameters affecting TBM performance were selected for the prediction models: UCS, BTS, BI, DPW, and joint angle (α, °). The target output of the model was defined as the TBM penetration rate (ROP, m/h). The correlation relationships between these input variables and ROP are illustrated in Figure 1.
As shown in Figure 1, the strongest correlations with ROP are observed with BI, UCS, α, and BTS parameters, respectively, whereas DPW exhibits a negative correlation of -0.465 with ROP. The correlation matrix clearly illustrates the relationships between ROP and the other variables, providing a crucial foundation for constructing the network architectures of SVM and ANN models. This information enables the identification of which input variables exert the most significant influence on the output.
The variation of the model input variables and the measured ROP values along the tunnel length is presented in Figure 2. In this figure, the first five parameters represent the model inputs, while the last parameter corresponds to the target ROP to be predicted. It is evident that the relationship between the model inputs and ROP is highly variable and complex along the tunnel length. Consequently, conventional regression methods or empirically derived relationships optimized through heuristic approaches exhibit limited success in accurately capturing these intricate patterns.
2.3. Hyperparameter Optimization
To more accurately model the complex and nonlinear relationships illustrated in Figure 2, advanced machine learning approaches were employed. During the parameter optimization and modeling process, the dataset was divided into training and testing subsets to minimize the risks of overfitting and underfitting, thereby enhancing the model’s generalization capability. In the SVM model, the hyperparameters C, γ, and ε were optimized using three different strategies: Grid Search, Random Search, and Bayesian Optimization. The predictive performance of the model was then comparatively evaluated across these optimization methods to identify the most effective configuration.
2.4. Evaluation of Model Performance
The performance of the models was assessed using several statistical indicators commonly adopted in the literature, including the coefficient of determination (R2), mean squared error (MSE), root mean squared error (RMSE), mean absolute error (MAE), and the Nash–Sutcliffe efficiency coefficient (NSE). The R2 value represents the proportion of the measured ROP variance explained by the model and reflects its overall explanatory capability. MSE and RMSE quantify the prediction accuracy, with lower values indicating a higher level of precision. MAE defines the average magnitude of the prediction errors, providing insight into the model’s overall error distribution. The NSE coefficient measures the agreement between predicted and observed values, where values approaching unity denote excellent predictive performance. Collectively, these metrics offer a comprehensive evaluation of model accuracy, robustness, and generalization capacity, enabling a meaningful comparison of the effects of different hyperparameter optimization strategies.
3. Methodology
3.1. General Approach
In this study, a Support Vector Machine (SVM)-based model was developed to predict the performance parameters of a Tunnel Boring Machine (TBM). SVM was selected as the modeling technique due to its strong generalization capability in handling nonlinear and multivariate data structures, which makes it a suitable approach for TBM performance prediction.
To optimize the model performance, the main hyperparameters of SVM—namely the penalty parameter (C), kernel parameter (γ), and epsilon (ε)—were tuned using three different optimization techniques: Grid Search, Random Search, and Bayesian Optimization. These methods were chosen considering their distinct strategies for exploring the hyperparameter space and their potential to achieve a global optimum.
Through this approach, the effects of each optimization technique on model prediction accuracy, computational cost, and stability were comparatively evaluated. Consequently, the study aimed to identify the most suitable optimization strategy for TBM performance prediction and to demonstrate the effectiveness of SVM-based modeling in this context.
3.2. Dataset and Preprocessing
In the modeling process, BI, UCS, α, BTS, and DPW parameters were considered as independent variables, while the rate of penetration (ROP), representing the excavation performance, was designated as the dependent variable.Although outlier removal is commonly applied to enhance model performance, in this study, extreme values were deliberately retained. Eliminating these data points could weaken the representation of natural excavation behavior in both hard and soft ground conditions. Therefore, the dataset was preserved in its entirety to ensure a more realistic reflection of actual field performance.
Additionally, the dataset was divided into two subsets with 70% used for training and 30% for testing. In contrast to the commonly adopted 80–20 split in the literature, this study intentionally trained the model with a smaller portion of the data. This approach aimed to evaluate the model’s generalization capability under limited training conditions and to obtain a performance assessment that better reflects real-world scenarios. Remarkably, despite being trained with less data, the proposed model achieved superior predictive accuracy compared to studies employing larger training ratios, demonstrating its strong generalization ability and the effectiveness of the adopted methodology. This confirms that the SVM-based approach can effectively capture underlying patterns and maintain robust predictive power even when trained on a reduced dataset.
3.3. SVM Model
Support Vector Machines (SVM) represent a powerful regression and classification technique capable of modeling both linear and nonlinear relationships. In this study, Support Vector Regression (SVR) was employed to predict the performance parameters of the Tunnel Boring Machine (TBM). The SVR model was configured with a Radial Basis Function (RBF) kernel, which enables effective learning of nonlinear patterns by mapping the input data into a high-dimensional feature space. The RBF kernel computes the similarity between data points based on Euclidean distance, allowing the model to capture complex data structures [22]. The performance of the SVR model depends critically on the proper selection of its key hyperparameters — C (penalty parameter), γ (gamma), and ε (epsilon).
The C parameter controls the trade-off between model complexity and tolerance to errors: higher C values aim to minimize errors more strictly, while lower C values yield a more flexible model. The γ parameter determines the influence radius of the RBF kernel; small gamma values produce smoother decision surfaces, whereas large gamma values create tighter, more localized regions of influence. The ε parameter defines the width of the error-insensitive zone, within which deviations are not penalized.
SVM models are computationally efficient since predictions rely only on support vectors, leading to reduced memory requirements and strong generalization capability. Furthermore, the margin-maximization principle minimizes the risk of overfitting. [22,23].
In this study, the modeling process was carried out in three main stages.First, the SVR model was trained using the training dataset.Second, the hyperparameters were optimized using Grid Search, Random Search, and Bayesian Optimization methods. Finally, the optimal parameter combination was applied to the test dataset, and the model’s predictive performance was comprehensively evaluated.
3.4. Hyperparameter Optimization
The performance of the SVM model depends on three key parameters: the penalty parameter (C), the RBF kernel parameter (γ), and epsilon (ε) [22,23].
In this study, the ranges of the hyperparameters used in the Support Vector Regression (SVR) model were determined based on the recommendations of previous studies and preliminary experiments. The parameter C, which balances model complexity and generalization capability, was defined within the range of 0.1 to 10,000. The γ (gamma) parameter, which controls the influence of individual training samples in capturing nonlinear relationships, was constrained between 1×10⁻⁶ and 0.1. The ε (epsilon) parameter, representing the tolerance for prediction errors, was explored within the range of 1×10⁻³ to 0.2. These ranges guided the hyperparameter search process across the three optimization methods.
Hyperparameter optimization was performed using three distinct search strategies.
First, the Grid Search method was applied, in which all possible parameter combinations were systematically evaluated over a logarithmically spaced grid defined within the selected parameter ranges [24]. Second, the Random Search approach was employed, where 1000 randomly selected parameter combinations were tested. This method allowed efficient exploration of a wide parameter domain while maintaining lower computational cost [24]. Finally, Bayesian Optimization was adopted as a probabilistic optimization technique. This approach dynamically explored the parameter space using a Gaussian Process-based surrogate model and selected new candidate combinations through the Expected Improvement (EI) acquisition function [25,26].
4. Model Implementation
In this study, the developed SVM model was implemented after splitting the dataset into 70% for training and 30% for testing, utilizing three different optimization strategies. The predictive performance of the model was comprehensively evaluated using several performance indicators, including Mean Absolute Error (MAE), Mean Squared Error (MSE), Root Mean Squared Error (RMSE), Coefficient of Determination (R2), and Nash–Sutcliffe Efficiency (NSE).
During the hyperparameter optimization process, Grid Search, Random Search, and Bayesian Optimization techniques were employed. Among these, Bayesian Optimization demonstrated a clear advantage in computational efficiency by achieving high predictive accuracy with fewer evaluations. The optimal C and γ values obtained reflected the distinct search behaviors of the optimization methods, and the impact of these variations on model performance was visualized through three-dimensional hyperparameter search surfaces, as illustrated in Figure 3.
These plots clearly show that Bayesian Optimization reached optimal performance with a limited number of trials and provided more efficient hyperparameter tuning compared to Grid Search and Random Search. While Grid Search produced results close to those of Bayesian Optimization, Random Search exhibited greater deviation from the optimal region.
Although reducing grid density in Grid Search or increasing the number of trials in Random Search can enhance model performance, both approaches substantially increase computation time and memory requirements. In contrast, Bayesian Optimization offers a distinct advantage by achieving both high predictive accuracy and computational efficiency with far fewer evaluations.
Overall, the predictions obtained from the measured data demonstrate that the developed model possesses a high degree of accuracy and stability. Furthermore, the comparative analysis of optimization strategies highlights the critical role of hyperparameter selection in model performance and provides a practical methodology for engineering applications that aim to achieve efficient results under limited computational resources.
As illustrated in Figure 3, the optimal SVM parameters obtained through Bayesian Optimization were determined as C = 16.322462, γ = 0.000865, and ε = 0.111265. Using these optimized parameters, the model performance was evaluated, and the results for the training, testing, and entire datasets were computed based on various performance metrics. The corresponding results for MSE, RMSE, MAE, NSE, and R2 are presented in Table 1.
As shown in Table 1, the model achieved R2 values of 0.9583 and 0.9664, NSE values of 0.9164 and 0.9292, and MAE values of 0.0968 and 0.0950 for the training and testing datasets, respectively. These results indicate minimal prediction errors and demonstrate the SVM model’s high accuracy and strong predictive capability. Figure 4 presents the ROP predictions along the tunnel together with the scatter plots of the training and testing data. When Table 1 and Figure 4 are evaluated jointly, it becomes evident that the model maintained high accuracy and stability across both datasets, with predictions showing a strong agreement with the observed values.
5. Discussion
The SVM model developed in this study exhibited high accuracy and robustness in predicting the rate of penetration (ROP) during tunnel excavation. As shown in Table 1, the performance metrics demonstrate a strong fit for both training and testing datasets: R2 values of 0.9583 (train) and 0.9664 (test), NSE values of 0.9164 and 0.9292, and MAE values of 0.0968 and 0.0950, respectively. The ROP predictions along the tunnel and the scatter plots in Figure 4 confirm that the model effectively captured both overall trends and local variations.
Previous studies have addressed TBM penetration-rate prediction using various datasets and input parameters. For instance, in [19], an SVR-based model developed from the Queens Water Tunnel dataset achieved high accuracy through 10-fold cross-validation (R2 = 0.99 for training and R2 = 0.95 for testing). However, the limited sample size and the use of eight input parameters restricted the model’s generalization capability, leading to inconsistent performance under different geological conditions. Similarly, [20] compared ANN, SVM, and GEP based models using data from the Chamshir water conveyance tunnel. Although GEP yielded the lowest errors, SVM performed relatively worse. Since those studies did not report how SVM parameters were selected or tuned, a detailed comparison was not possible. A more recent study [21] applied SVM using parameter values directly adopted from literature references, without further optimization.
In the present work, both the dataset and input parameters differ from those used in earlier studies. Whereas most ANN and SVM-based approaches allocate 80% of the data for training and 20% for testing, this study employed a 70/30 split and still achieved NSE, R2, and RMSE values nearly identical to those of the training data. Thus, higher performance was obtained with less training data, demonstrating the model’s strong generalization capacity.
Hyperparameter optimization was carried out systematically through Grid Search, Random Search, and particularly Bayesian Optimization, rather than through time-consuming trial-and-error procedures. This strategy enabled the model to achieve high predictive accuracy and stability even with limited data, as verified by the R2, NSE, and MAE metrics. Unlike previous studies, this work provides a detailed assessment of the impact of hyperparameter optimization and the contribution of each parameter to model performance, offering valuable methodological and pedagogical insights for both practice and geotechnical engineering education.
6. Conclusion and Future Work
In this study, an SVM-based model was developed to predict the rate of penetration (ROP) during tunnel excavation, and hyperparameter optimization was conducted using Grid Search, Random Search, and, in particular, Bayesian Optimization. The model’s performance was evaluated on both training and testing datasets using R2, NSE, and MAE metrics, showing high accuracy and stability (R2 = 0.9583–0.9664, NSE = 0.9164–0.9292, MAE = 0.095–0.0968). The Bayesian Optimization approach achieved high predictive accuracy with a limited number of iterations, offering a clear advantage in both performance and computational efficiency.
This study distinguishes itself from previous research by systematically addressing SVM hyperparameter optimization using a broader dataset and a distinct set of input parameters. This methodological framework enhanced the stability of both training and testing performance and clarified the influence of each hyperparameter on overall model behavior. The findings provide meaningful contributions to geotechnical engineering, both in practical applications and educational contexts.
Future research may focus on improving the model’s generalization capability by employing larger and more diverse datasets that represent various geological conditions. Incorporating additional input features—such as sensor data, TBM operational parameters, or other geotechnical measurements—could further enhance predictive performance. Moreover, the SVM model can be compared with other machine learning algorithms such as ANN, GEP, Random Forest, and XGBoost, and hybrid or advanced optimization techniques may be explored to refine hyperparameter tuning.
Supplementary Materials
The following supporting information can be downloaded at the website of this paper posted on Preprints.org.
References
- Tarkoy, P.J. (1975). Rock Hardness Index Properties and Geotechnical Parameters for Predicting Tunnel Boring Machine Performance. University of Illinois at Urbana-Champaign.
- Nelson, P. (1983). Tunnel Boring Machine Performance in Sedimentary Rocks. Cornell University.
- Yağız, S. Utilizing Rock Mass Properties to Predict TBM Performance in Hard Rock Conditions. Tunnelling and Underground Space Technology 2008, 23, 326–339. [Google Scholar] [CrossRef]
- Yağız, S.; Karahan, H. Prediction of Hard Rock TBM Penetration Rate Using Particle Swarm Optimization. International Journal of Rock Mechanics and Mining Sciences 2011, 48, 427–433. [Google Scholar] [CrossRef]
- Yağız, S.; Karahan, H. Application of Various Optimization Techniques to Predict TBM Penetration Rate in Rock Mass and Comparison of Their Performance. International Journal of Rock Mechanics and Mining Sciences 2015, 80, 308–315. [Google Scholar] [CrossRef]
- Benardos, A.G.; Kaliampakos, D.C. Modeling TBM Performance Using Artificial Neural Networks. Tunnelling and Underground Space Technology 2004, 19, 597–605. [Google Scholar] [CrossRef]
- Armaghani, D.J.; Koopialipoor, M.; Marto, A.; Yagiz, S. Application of Various Optimization Techniques to Predict TBM Advance Rate in Granitic Rocks. Journal of Rock Mechanics and Geotechnical Engineering 2019, 11, 779–789. [Google Scholar] [CrossRef]
- Koopialipoor, M.; Fahimifar, A.; Ghaleini, E.N.; Momenzadeh, M.; Armaghani, D.J. Development of a New Hybrid ANN to Solve a Geotechnical Problem Related to Tunnel Boring Machine Performance. Computers and Geotechnics 2020, 36, 345–357. [Google Scholar] [CrossRef]
- La, Y.S.; Kim, M.I.; Kim, B. Prediction of Shield TBM Disc Cutter Replacement Time Using SVM. Journal of the Korean Tunnelling and Underground Space Association 2019, 21, 641–656. [Google Scholar]
- Afradi, A.; Ebrahimabadi, A.; Hallajian, T. Prediction of TBM Penetration Rate Using Support Vector Machine. GEOSABERES: Revista de Estudos Geoeducacionais 2020, 11, 467–479. [Google Scholar] [CrossRef]
- Liu, F.; Yang, M.; Ke, J. TBM Tunnel Prediction Method Surrounding Rock Classification Based on LSTM-SVM. Advances in Mechanical Engineering 2024, 16, 16878132241255209. [Google Scholar] [CrossRef]
- Minh, V.T.; Katushin, D.; Antonov, M.; Veinthal, R. Regression Models and Fuzzy Logic Prediction of TBM Penetration Rate. Open Engineering 2017, 7, 60–68. [Google Scholar] [CrossRef]
- Arbabsiar, M.H.; Farsangi, M.A.E.; Mansouri, H. Fuzzy Logic Modeling to Predict the Level of Geotechnical Risks in Tunnel Boring Machine (TBM) Tunneling. Rudarsko-geološko-naftni zbornik 2020, 35. [Google Scholar] [CrossRef]
- Afradi, A.; Ebrahimabadi, A.; Hallajian, T. Prediction of TBM Penetration Rate Using Fuzzy Logic, Particle Swarm Optimization, and Harmony Search Algorithm. Geotechnical and Geological Engineering 2022, 40, 1513–1536. [Google Scholar] [CrossRef]
- Karahan, H.; Ayvaz, M.T. Prediction of Aquifer Parameters Using Artificial Neural Networks. Journal of Porous Media 2006, 9. [Google Scholar] [CrossRef]
- Karahan, H.; Çetin, M.; Can, M.E.; Alsenjar, O. Development of a New ANN Model to Predict Daily Actual Evapotranspiration Using Limited Climate Data and Remote Sensing Techniques for Sustainable Water Management. Sustainability 2024, 16, 2481. [Google Scholar] [CrossRef]
- Karahan, H.; Erkan Can, M. A New Method to Predict Nitrate Concentration Levels in Irrigation Fields for Sustainable Agriculture. Agriculture 2025, 15, 161. [Google Scholar] [CrossRef]
- Karahan, H.; İplikci, S.; Yaşar, M.; Gurarslan, G. River Flow Prediction from Upstream Records Using Support Vector Machines. Journal of Applied Mathematics 2014, 2014, 714213. [Google Scholar] [CrossRef]
- Mahdevari, S.; et al. A Support Vector Regression Model for Predicting Tunnel Boring Machine Penetration Rates. Automation in Construction 2014, 42, 1–9. [Google Scholar] [CrossRef]
- Afradi, A.; Ebrahimabadi, A. Comparison of ANN, SVM, and GEP Approaches for Predicting TBM Penetration Rate. SN Applied Sciences 2020, 2, 2004. [Google Scholar] [CrossRef]
- Afradi, A.; Ebrahimabadi, A.; Hedayatzadeh, M. Performance Prediction of a Hard Rock TBM Using Statistical and Artificial Intelligence Methods. Mining and Environmental Journal 2024, 15, 323–343. [Google Scholar] [CrossRef]
- Cortes, C.; Vapnik, V. Support-vector Networks. Machine Learning 1995, 20, 273–297. [Google Scholar] [CrossRef]
- Smola, A.J.; Schölkopf, B. A Tutorial on Support Vector Regression. Statistics and Computing 2004, 14, 199–222. [Google Scholar] [CrossRef]
- Bergstra, J.; Bengio, Y. Random Search for Hyper-Parameter Optimization. Journal of Machine Learning Research 2012, 13, 281–305. [Google Scholar]
- Snoek, J.; Larochelle, H.; Adams, R.P. Practical Bayesian Optimization of Machine Learning Algorithms. Advances in Neural Information Processing Systems 2012, 25, 2951–2959. [Google Scholar]
- Shahriari, B.; Swersky, K.; Wang, Z.; Adams, R.P.; De Freitas, N. Taking the Human Out of the Loop: A Review of Bayesian Optimization. IEEE Proceedings 2015, 104, 148–175. [Google Scholar] [CrossRef]
Figure 1.
The correlation relationship between ROP and model parameters.
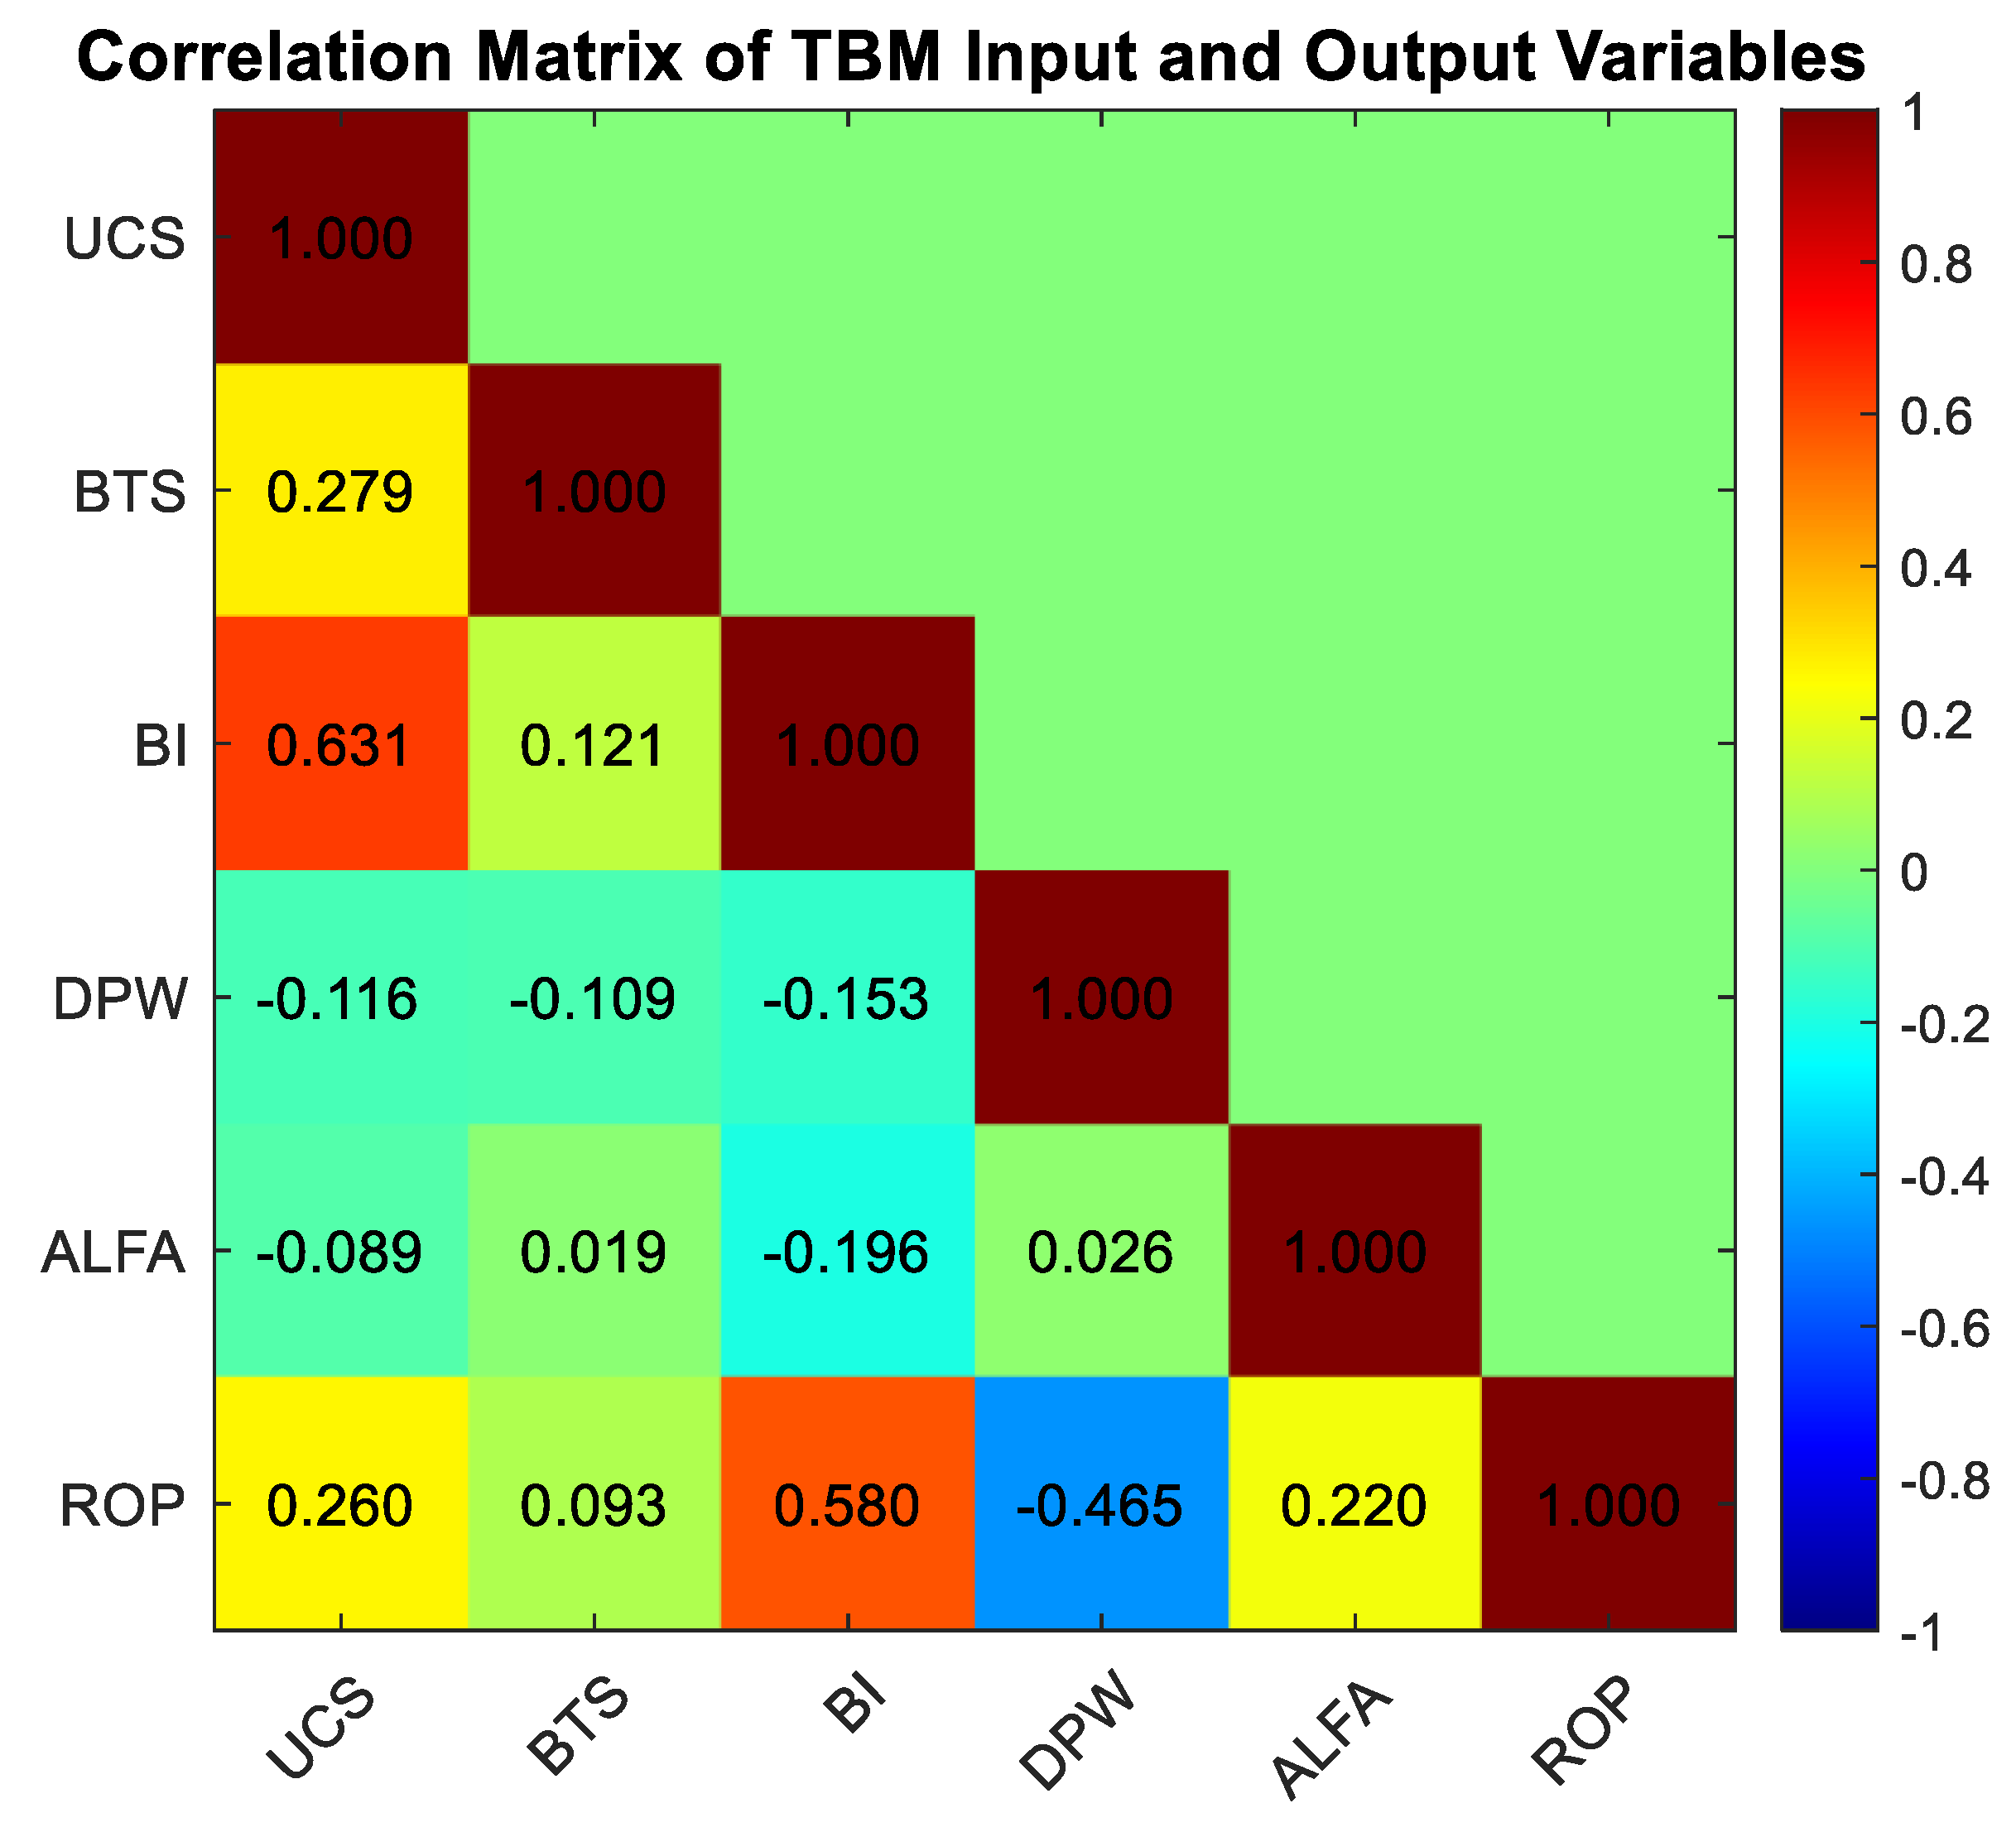
Figure 2.
Variation of model variables and ROP values along the tunnel length.
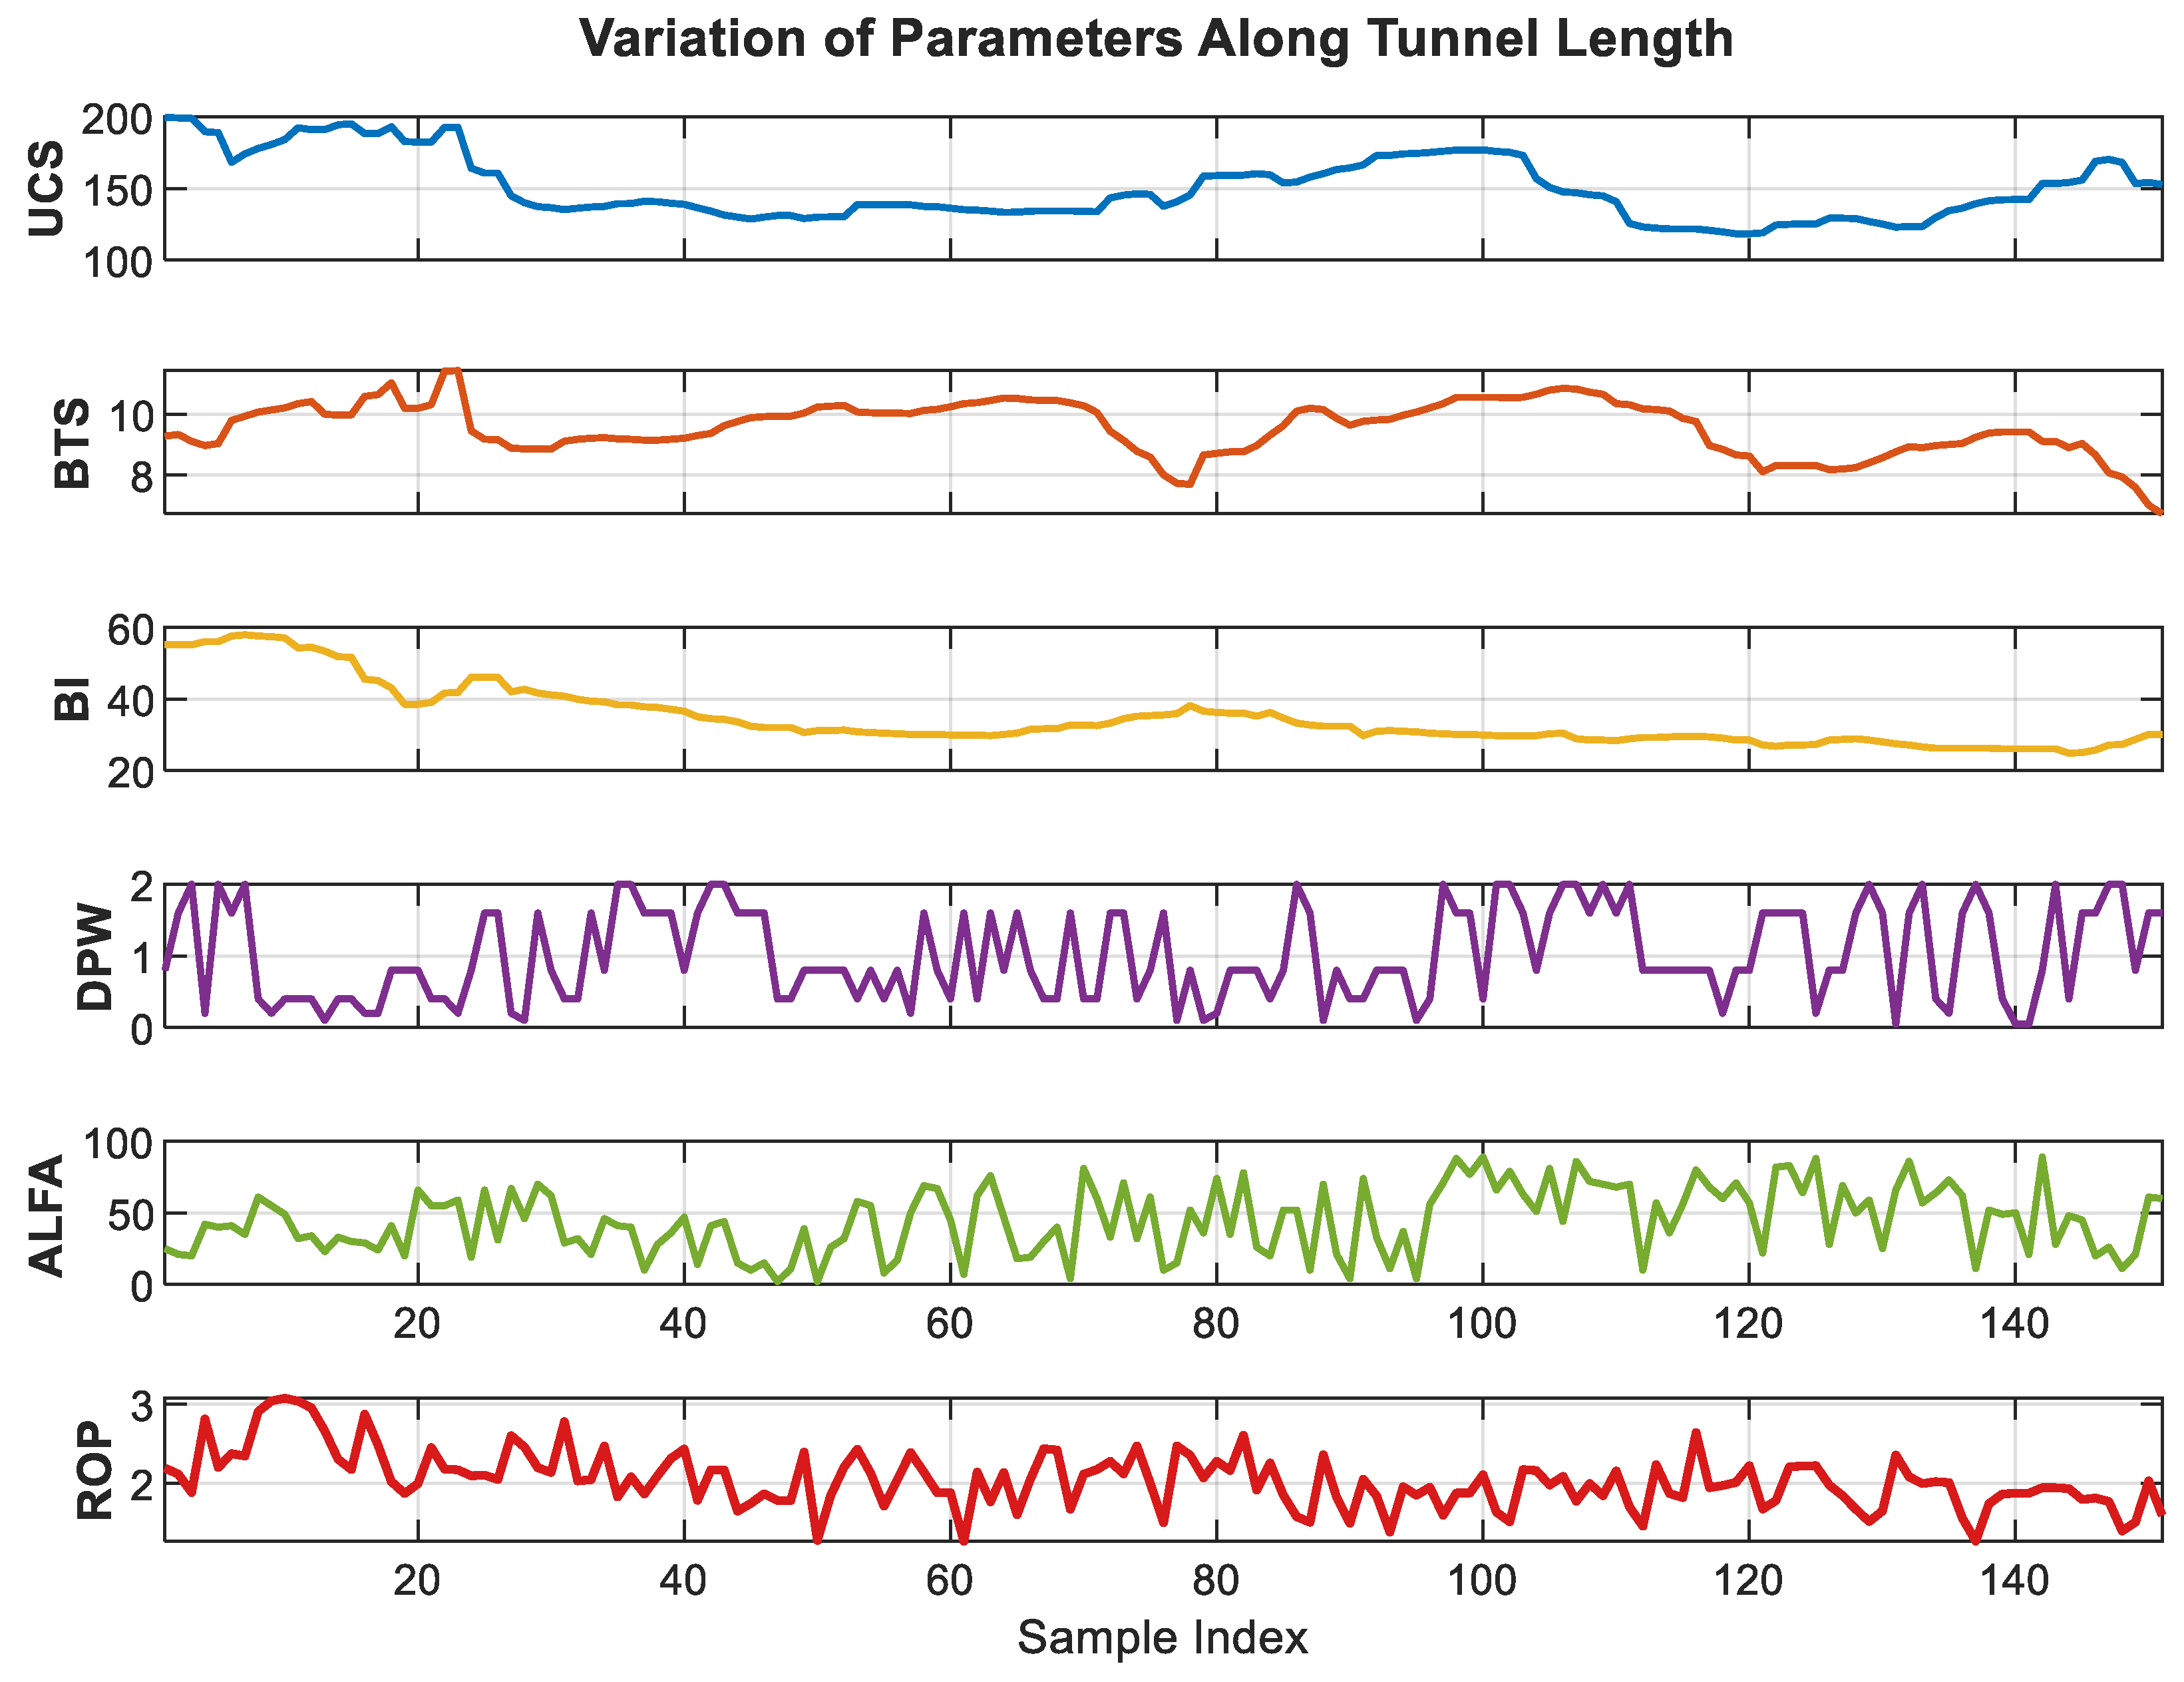
Figure 3.
Optimized SVM parameters.
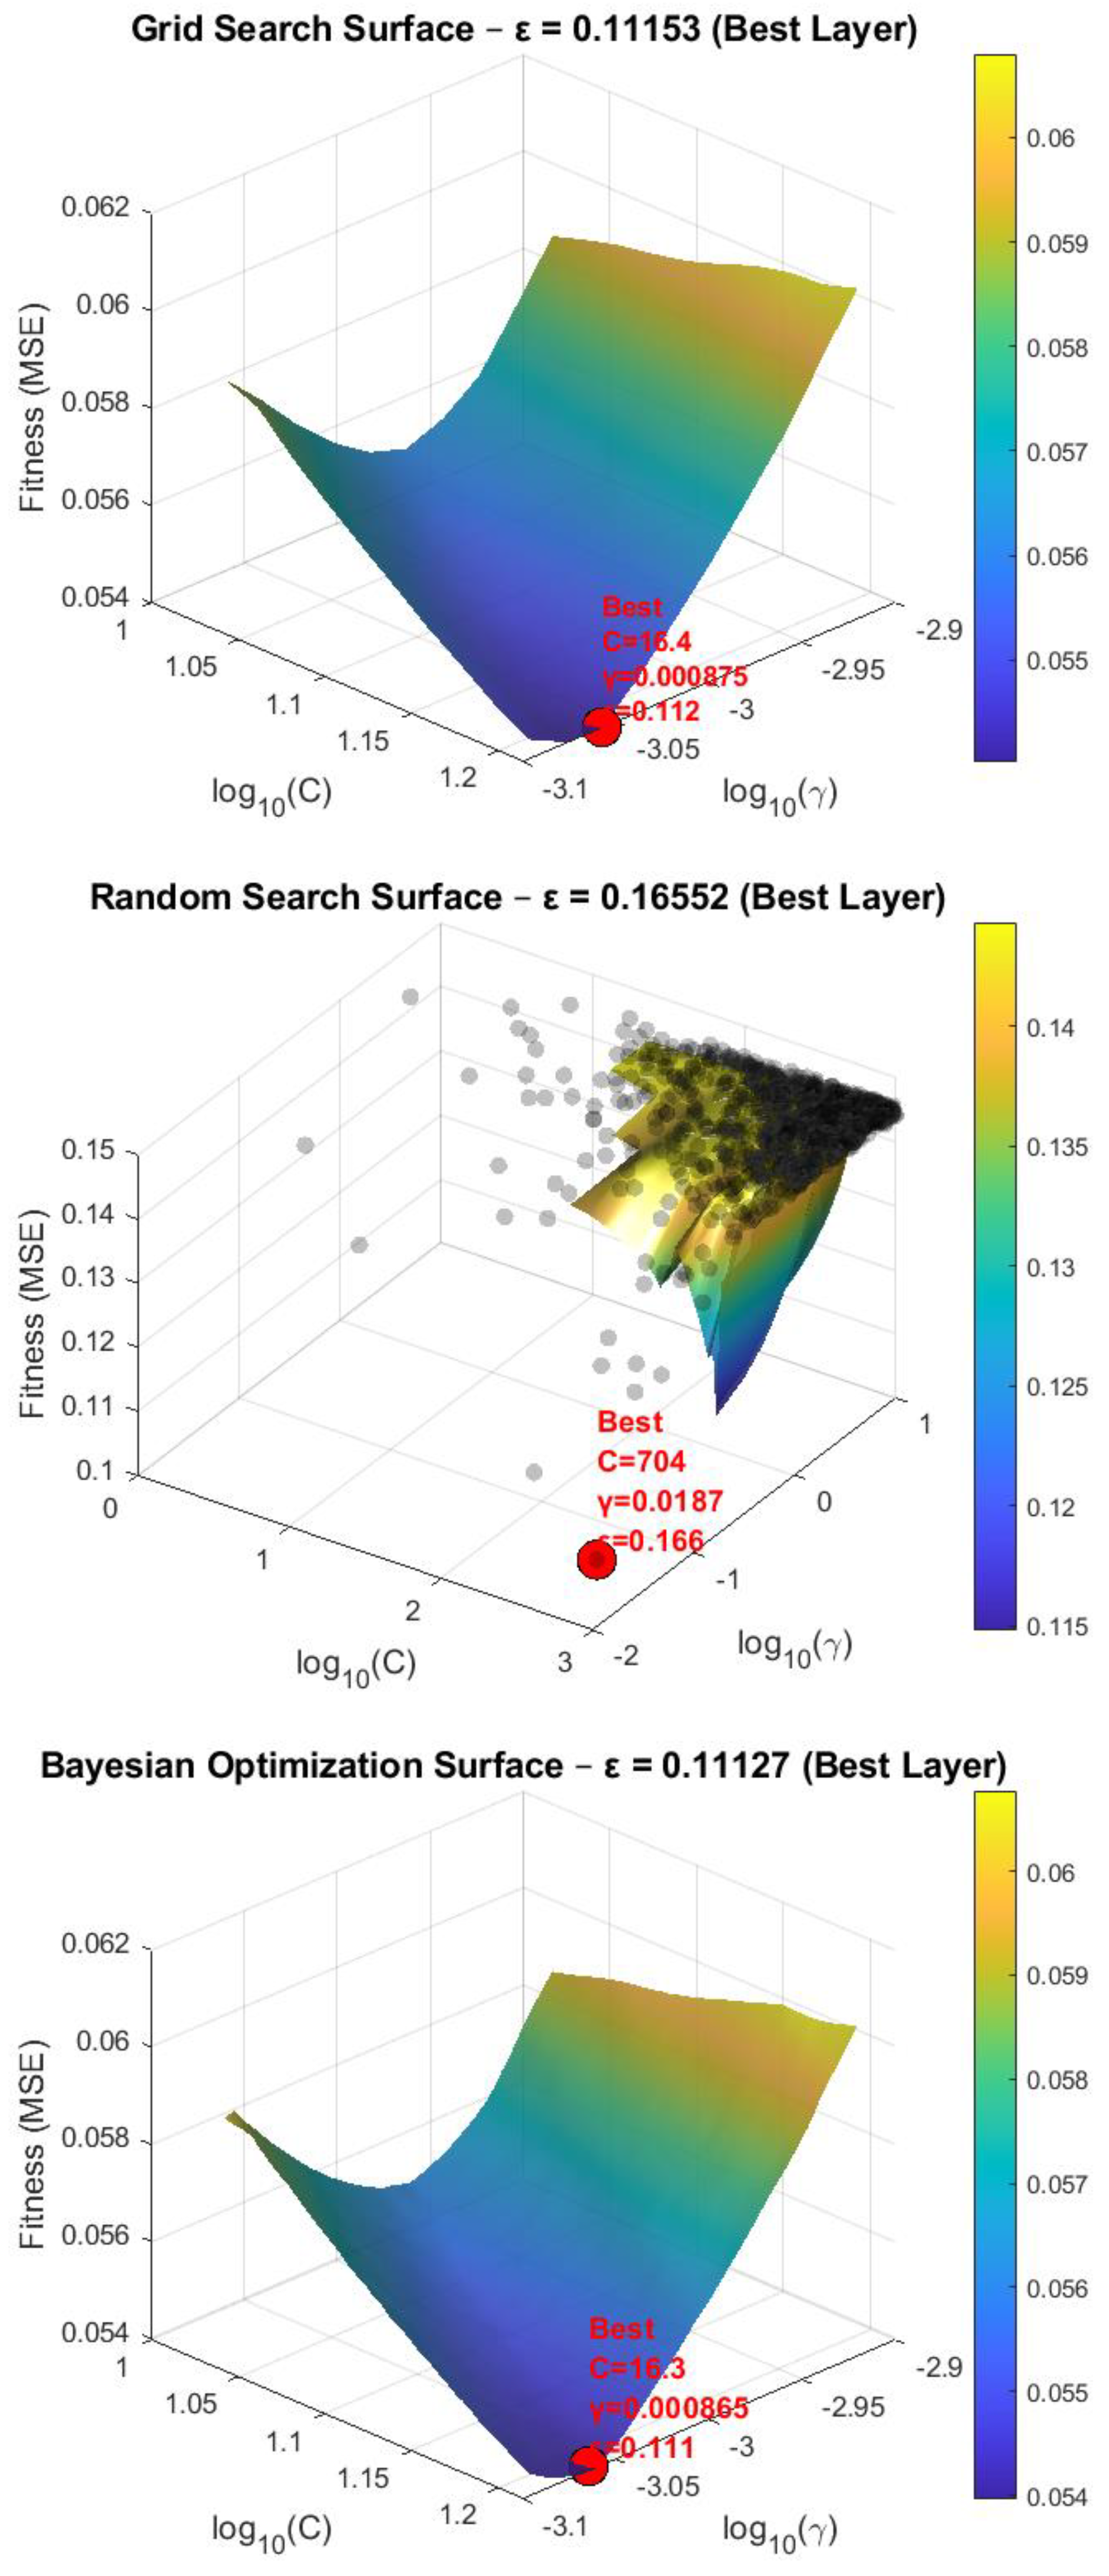
Figure 4.
Scatter plots showing the predicted ROP along the tunnel alongside the training and testing data.
Figure 4.
Scatter plots showing the predicted ROP along the tunnel alongside the training and testing data.
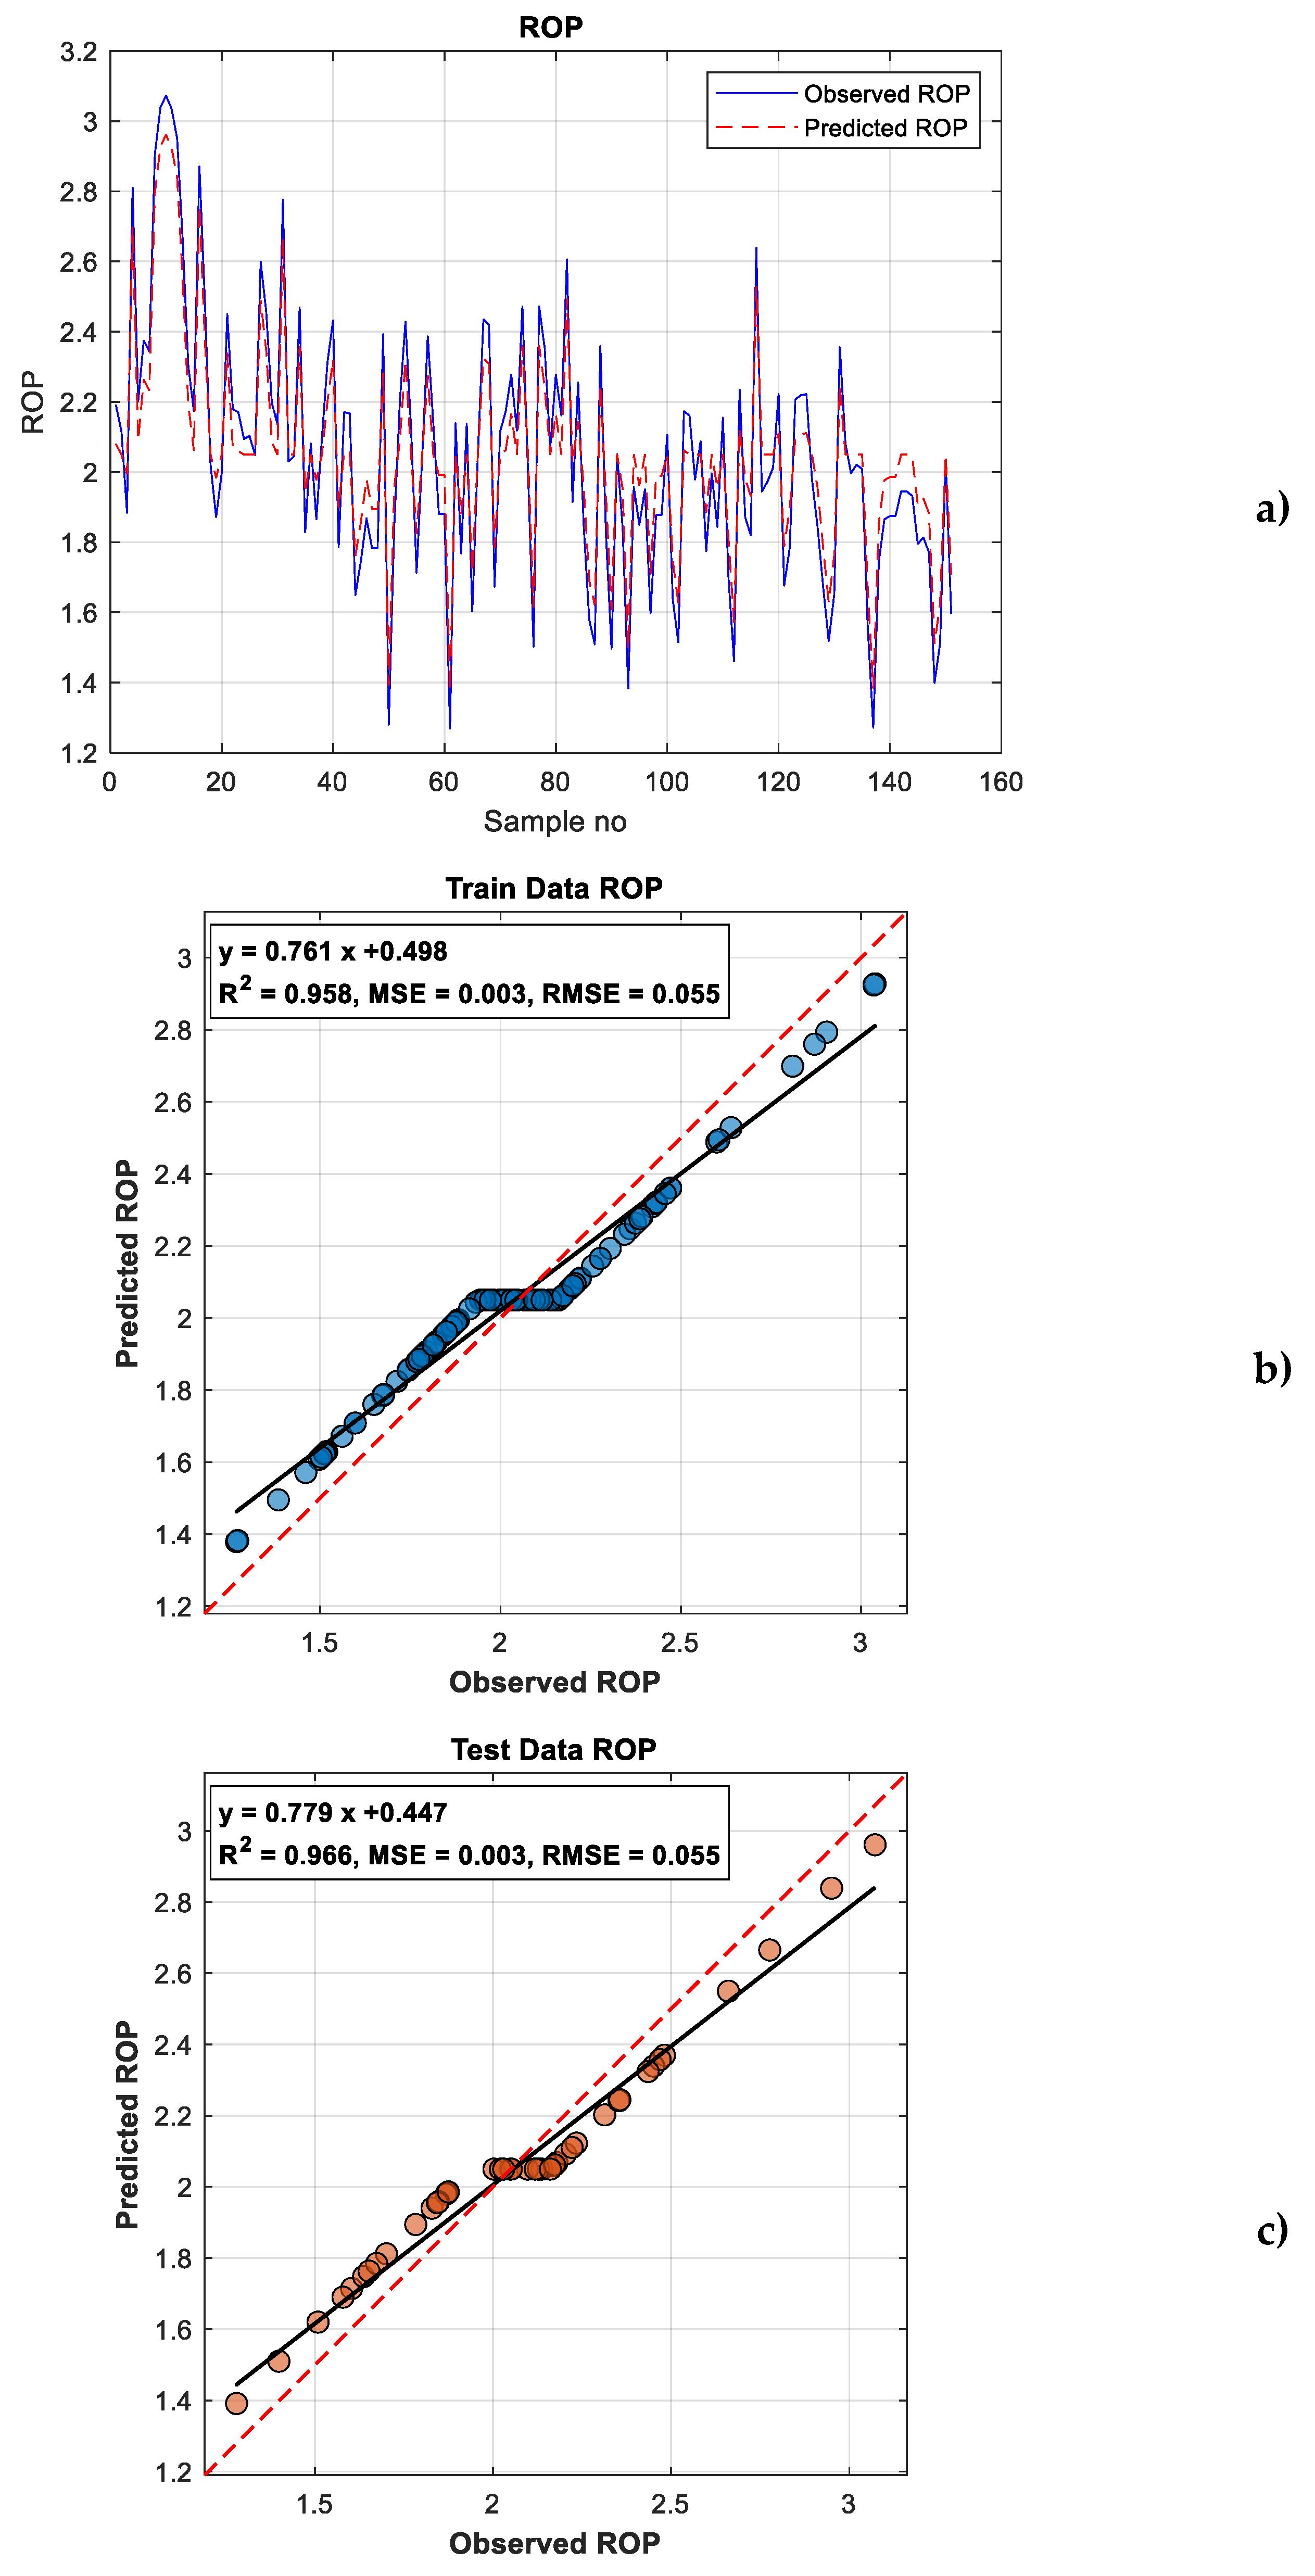

Table 1.
SVM model performance.
| Metric | Train | Test | All Data |
| MSE | 0.010161 | 0.010160 | 0.010161 |
| RMSE | 0.100803 | 0.100796 | 0.100801 |
| MAE | 0.096832 | 0.094994 | 0.096284 |
| NSE | 0.916367 | 0.929197 | 0.920932 |
| R2 | 0.958294 | 0.966447 | 0.960534 |
Disclaimer/Publisher’s Note: The statements, opinions and data contained in all publications are solely those of the individual author(s) and contributor(s) and not of MDPI and/or the editor(s). MDPI and/or the editor(s) disclaim responsibility for any injury to people or property resulting from any ideas, methods, instructions or products referred to in the content. |
© 2025 by the authors. Licensee MDPI, Basel, Switzerland. This article is an open access article distributed under the terms and conditions of the Creative Commons Attribution (CC BY) license (http://creativecommons.org/licenses/by/4.0/).
Copyright: This open access article is published under a Creative Commons CC BY 4.0 license, which permit the free download, distribution, and reuse, provided that the author and preprint are cited in any reuse.


