
Submitted:
14 November 2025
Posted:
17 November 2025
You are already at the latest version
Abstract
Background. Frailty is a multifactorial condition that significantly impacts older adults' health and independence, which can be mitigated through training. This study examined the effects of a 12-week progressive strength training (PST) program on frailty status and short-term autonomic compensatory responses during postural transitions. Methods: Eight older adults (60-79 years) classified as pre-frail or frail according to the frailty index (FI) participated in a 12-week PST program. Time and frequency-domain heart rate varia-bility (HRV) in the supine position, cardiac parasympathetic modulation (CPM) deter-mined from the HR 30:15 ratio (longest RR interval around the 30th heartbeat divided by the shortest RR interval around the 15th heartbeat after standing), and cardiac baroreceptor gain (CBG) assessed as the ratio of heart rate change to systolic blood pressure drop (ΔHR/ΔSBP) at 30, 60, 180, and 420 seconds after standing were assessed at pre-test, 8 weeks and 12 weeks (autonomic function outcomes). The level of physical activity (LPA), handgrip strength (HGS), and gait speed (GS) were assessed, and orthostatic intolerance (OI) symptoms were self-reported at pre-test, 8 weeks and 12 weeks. Results: After 12 weeks of PST, FI scores decreased from 0.18 to 0.04 (78% reduction). LPA, HGS, and GS improved by 152%, 13%, and 11%, respectively. Three of eight participants reported OI symptoms at pre-test, with no reported symptoms at week 12. Despite this, PST did not enhance short-term autonomic responses. Conclusion: PST counteracted frailty and im-proved physical and muscular function but did not enhance indices of short-term auto-nomic regulation in frail older people.
Keywords:
autonomic function
; frailty
; older adults
; heart rate variability
; cardiac parasympathetic modulation
; baroreceptor gain
; strength training
1. Introduction
Frailty is a dynamic and multifactorial condition that significantly impacts the health and independence of older adults [1]. Although it can be mitigated through targeted interventions such as progressive strength training (PST) [2,3], the majority of studies have primarily demonstrated improvements using frailty identification instruments such as the frailty phenotype or the frailty index [4,5,6]. Whilst these instruments may capture symptoms, morbidities, disabilities and/or aspects of physical and functional status, they do not directly measure the underlying physiological mechanisms. As a result, while favourable exercise-induced transitions in frailty status have been well-documented [4], it remains unclear whether these favourable changes stem from enhanced autonomic nervous system regulation, dysfunction of which is frequently associated with frailty.
The autonomic nervous system (ANS) is essential for regulating autonomic responses and ensuring rapid physiological adjustments during daily stressors such as postural transitions (e.g., from lying to standing; sitting to standing) [7]. If the ANS is not well-regulated, people could have orthostatic hypotension (OH), a condition characterized by a sudden drop in blood pressure upon standing [8]. OH is a key contributor to orthostatic intolerance (OI) [9] (e.g., lightheadedness, faintness, blurry vision), increasing instability in the first few seconds on standing and the risk of falls [10], which has also been linked with frailty [11].
One frequently used non-invasive measurement of autonomic function is heart rate variability (HRV) [12], which reflects the beat-to-beat fluctuations of the time intervals between successive heartbeats [13]. However, the literature remains inconsistent regarding the effects of PST on HRV. For example, Lin et al. [14] found significant changes in HRV after 24 weeks of strength training in older adults (females and males), showing that individual differences in baseline autonomic function, age-related physiological alterations, and health status may influence the autonomic adaptations after strength training. In contrast, Gambassi et al. [15] reported no significant improvements in HRV following a 10-week strength training program in older females, suggesting impaired parasympathetic modulation. Cardiac parasympathetic modulation (CPM) is another important factor that provides an index of cardiac parasympathetic withdrawal on standing [16]. There is a lack of literature regarding the specific effects of PST on CPM in frail older adults, limiting our understanding of how exercise might improve autonomic regulation in this population. Another marker of autonomic function is cardiac baroreceptor gain (CBG), which reflects the sensitivity of the baroreflex in modulating heart rate (HR) in response to blood pressure (BP) fluctuations [17]. Despite its relevance, only a few studies have addressed how strength training influences CBG [18,19]. However, no study has examined the effects of PST on CBG across multiple specific short-term compensatory responses following postural transitions (e.g., 30s, 60s, 180s, and 420s) in frail individuals. Assessing the PST effects on CBG in this time-course framework could show novel insights into the temporal dynamics of autonomic adaptation to PST in frail older adults.
This study aimed to (1) determine whether a 12-week PST program can counteract frailty; (2) examine changes in short-term autonomic responses, including HRV, CPM, and CBG, across postural transitions; and (3) evaluate changes in the level of physical activity (LPA), handgrip strength (HGS), and gait speed (GS), as well as OI symptoms following 12 weeks of PST. It was hypothesized that: (i) PST will reduce frailty index scores, indicating improved frailty status; (ii) enhance HRV at rest (supine), reflecting improved autonomic adaptability; (iii) increase CPM, indicating lower parasympathetic dominance and greater autonomic responsiveness; (iv) increase CBG across postural phases (30, 60, 180, and 420 s), suggesting faster baroreceptor activation; (v) improve LPA, HGS, and GS; and (vi) lower the incidence of OI symptoms after 12 weeks of PST.
2. Materials and Methods
This study employs a one-group time series quasi-experimental design. Reporting followed established guidelines, including the Transparent Reporting of Evaluations with Non-Randomized Designs (TREND) [20], and the Consensus on Exercise Reporting Template (CERT) [21].
2.1. Settings
The study took place at the Applied Research Centre within the Faculty of Kinesiology and Recreation Management at the University of Manitoba from August 2022 to August 2023. Ethical clearance was granted by the University of Manitoba Health Research Ethics Board (Protocol No. HE2022-0058).
2.2. Participants
A convenience sampling approach was utilized to recruit pre-frail and frail older adults. Potential participants were identified from Dr. Todd Duhamel’s database registry at the University of Manitoba, including over 1,000 female volunteers from the Women’s Advanced Risk-Assessment in Manitoba (WARM) Hearts study and our Living F.R.E.E (Frailty Research in ExercisE) database; all had previously consented to be contacted by email or telephone. Individuals interested in participating could also reach out to the research team via email or telephone. The final sample included adults aged 60 to 79 years who completed a 12-week PST intervention and underwent orthostatic stress assessments involving sit-to-stand and lie-to-stand transitions (Figure 1).
Inclusion criteria required participants to be within the target age range (60-79 years), assigned female or male at birth, and classified as pre-frail or frail according to the 30-item frailty (appendix 1). The FI was created according to the standard procedure based on the deficit accumulation model [22]. Exclusion criteria included any history of cardiovascular disease (e.g., ischemic heart disease, myocardial infarction, stroke, percutaneous coronary intervention, coronary artery bypass grafting, or congestive heart failure), psychiatric disorders, or significant cognitive impairment. None of the participants was receiving hormone replacement therapy.
Participant eligibility was confirmed through a health screening questionnaire developed by the research team to ensure adherence to all inclusion and exclusion criteria. The recruitment process is summarized in Figure 2. Twenty-two pre-frail or frail individuals were contacted; 13 participants declined participation, and nine participants were initially enrolled and completed assessments at pre-test, 8 weeks, and 12 weeks. One participant was excluded from the final 12-week analysis due to poor signal quality resulting from excessive noise and motion artifacts. To maintain the assumptions required for within-subject repeated-measures analysis and avoid missing data, the final analysis included eight participants with complete data across all three time points.
2.3. Data Collection
Participants were provided with pre-assessment instructions 48 hours before their scheduled visit to the laboratory. Upon arrival, they were given the informed consent form to review, and any questions were addressed by the research team before obtaining written consent. Before initiating any testing procedures, a trained researcher measured resting HR and BP to confirm that participants met the safety criteria required for participation. Resting systolic and diastolic blood pressure (SBP and DBP) readings were taken using a digital monitor (ARSIMAI, BSX516, Munster, Germany). All procedures adhered to the standards outlined by the Canadian Society for Exercise Physiology (CSEP) [23].
After completing the consent and familiarization procedures, participants underwent orthostatic stress testing involving active standing, with continuous non-invasive beat-to-beat blood pressure monitoring via the Finometer™ Pro (Finapres Medical System BV, Amsterdam, The Netherlands). Upon conclusion of the assessment, participants were asked about any symptoms such as light-headedness or faintness to assess for orthostatic intolerance (OI). All assessments were conducted in a quiet, temperature-controlled environment (22.0 ± 1.0 °C), with humidity and barometric pressure kept at ambient conditions. To reduce the influence of circadian rhythms, testing was scheduled on weekdays between 8:30 and 11:30 a.m.
Demographic, Anthropometric Measurements, and Frailty Index
Demographic information, including sex assigned at birth, age, and date of birth, was collected, along with anthropometric and body composition data, to describe the characteristics of the study sample. Body mass (kg) was measured using the InBody 270 analyzer (©2015 InBody Co., Ltd, Cerritos, CA, USA), and height (m) was recorded using a SECA mobile stadiometer (SECA, Frankfurt, Germany). Frailty status was determined based on the Frailty Index (FI), which classified individuals as non-frail (≤ 0.08), pre-frail (> 0.08 to 0.25), or frail (≥ 0.25), following established guidelines [22]. For instance, if a participant presents 10 deficits out of 30 possible indicators, the resulting FI would be 0.33, categorizing the individual as frail. A higher number of deficits corresponds to a greater degree of frailty.
2.4. Assessment of Heart Rate Variability (HRV), Cardiac Parasympathetic Modulation (CPM), Cardiac Baroreceptor Gain (CBG)
Short-term autonomic and cardiovascular responses were assessed through continuous beat-to-beat recordings of the electrocardiogram (ECG) and finger arterial pressure using the Finometer system (Finapres Medical System, Arnhem, The Netherlands) [24]. Data were collected with LabChart 8.0 software (ADInstruments, Colorado Springs, USA) at a 1 kHz sampling rate and processed in MATLAB (R2024, The MathWorks Inc., Natick, MA). Standard filtering, calibration, and signal-alignment procedures were applied to optimize R-R interval and systolic blood pressure (SBP) detection. Autonomic indices included HRV, CPM, and CBG. HRV was analyzed in the supine position using time-domain (mean R-R interval, standard deviation of RR intervals (SDNN), root mean square of successive differences between RR intervals (RMSSD)) and frequency-domain (low-frequency (LF), high-frequency (HF), and low-frequency to high-frequency power ratio (LF/HF ratio)) measures following international guidelines. CPM was derived from the HR 30:15 ratio of the minimum (longest RR-interval) around the 30th heartbeat and maximum HR (shortest RR-interval) around the 15th heartbeat after standing, representing cardiac vagal reflex function. CBG was calculated as the ratio of HR to SBP (ΔHR/ΔSBP, bpm/mmHg) at 30, 60, 180, and 420 seconds after active standing to assess dynamic baroreflex sensitivity. All measurements were obtained during sit-to-stand and lie-to-stand transitions at pre-test, 8 weeks, and 12 weeks of PST. For detailed instrumentation, calibration, and signal-processing procedures, see de Matos et al [25].
2.5. Level of Physical Activity, Hand Grip Strength, and Gait Speed
Level of physical activity (LPA) were assessed using the International Physical Activity Questionnaire - Short Form (IPAQ-SF) [26], a validated self-report tool that estimates time spent on various intensities of activity over the previous seven days. The seven-item instrument captures frequency and duration of vigorous and moderate physical activity, walking, and sedentary time. Weekly physical activity was expressed in metabolic equivalent of task (MET) minutes by applying standard MET values. A Handful Hand Strength Dynamometer was used to measure the hand grip strength (HGS) following CSEP guidelines [23]. Participants completed two trials with their dominant hand, allowing 30 seconds of rest between attempts. The highest value was used for the analyses. To assess gait speed (GS), participants walked a 5-meter flat, straight course at their usual pace, while the time taken was recorded. This procedure was repeated three times with 60-second breaks between trials. The mean of the three trials was used to calculate gait speed [23].
2.6. Progressive Strength Training
Participants engaged in the PST program that incorporated a series of exercises recommended by the Canadian Society for Exercise Physiology (CSEP) for older adults [23]. These exercises included leg press, leg extension, seated leg curl, chest press, shoulder press, seated rowing, calf raises, and cat-camel exercise. Program adherence and engagement were monitored using attendance logs and participant feedback, ensuring consistent participation throughout the intervention.
2.7. Familiarization, 1 Repetition Maximum Test (1-RM), and Strength Training Intensity Control
All participants underwent a structured familiarization process with the testing procedures, study protocols, and exercise training regimen. During the first three weeks, resistance loads were carefully introduced to ensure participants could safely engage in the PST program. Load determination was based on the one-repetition maximum (1-RM) test. Familiarization sessions were spaced approximately 48 to 72 hours apart. The first session focused on introducing participants to the testing procedures and overall protocol, while the second session was dedicated to establishing individualized training loads for the PST intervention (see Table 1). This 12-week training followed exercise prescription principles as recommended by the CSEP [23] and the American College of Sports Medicine [27] guidelines. The intensity of the PST sessions was monitored using the OMNI-RES scale [28].
2.8. Sample Size
The sample size was calculated using G*Power software (Heinrich Heine University, Dusseldorf, Germany) [29] based on an internal pilot study (n = 5). Power analysis was conducted using the F-test ANOVA repeated measures, within factors. For experiment 1 (sit-to-stand), an alpha of 0.05, with an actual power of 0.84 and an effect size of 0.53, based on a partial Eta-squared (η²p) value of 0.22. The values were observed in baroreceptor gain phase 1 (30 seconds) after standing during pre-test, 8 weeks, and 12 weeks in the pre-frail/frail group. The total sample size required for this experiment is 8 participants. For experiment 2 (lie-to-stand), an alpha of 0.05, with an actual power of 0.82 and an effect size of 0.62, based on a partial Eta-squared (η²p) value of 0.28. The values were observed in baroreceptor gain phase 1 (30 seconds) after standing during pre-test, 8 weeks, and 12 weeks in the pre-frail/frail group. The total sample size estimated for this experiment is 6 participants.
2.9. Statistics
The normality of the data distribution was evaluated using the Shapiro-Wilk test. Variables with a parametric distribution were expressed as mean ± standard deviation, with 95% confidence intervals (95% CI). Non-parametric data were presented as medians with interquartile ranges, along with the observed minimum and maximum values. For the sample characterization, continuous variables were summarized using descriptive statistics, including mean, standard deviation, and 95% CI, whereas categorical variables were described by absolute frequencies and percentages. Cochran’s Q test was employed to examine repeated categorical measures across multiple time points. To assess changes over three time points (pre-test, week 8, and week 12), a one-way repeated measures ANOVA was used for parametric data. For non-parametric variables, the Friedman One-Way repeated measures analysis of variance by ranks test was conducted. When statistically significant differences were identified, Bonferroni-adjusted post-hoc comparisons were applied. Cardiovascular medication use was included as a covariate in the main analyses to control for potential confounding effects on autonomic outcomes. To adjust for multiple hypotheses in CBG testing, the p-values were corrected using the Benjamini-Hochberg adjustment [30], with the false discovery rate set at 0.05. All statistical analyses were conducted using Jamovi (Version 2.3.28).
3. Results
Anthropometric variables (height, body mass, BMI) and resting cardiovascular parameters (SBP, DBP, and HR) were similar across all three time points. The FI showed a significant reduction over time, with improvements in both 8 weeks and 12 weeks relative to the pre-test. However, no statistically significant change was observed between the 8- and 12-week assessments. Analysis using Cochran’s Q test indicated no significant variation in OI symptoms across the three measured intervals (p = 0.09). Descriptive analysis showed that at pre-test, 3 of 8 participants reported OI symptoms (38%), at week 8, only one participant reported OI symptoms (13%), and by week 12, no OI symptoms were reported (Table 2).
3.1. Frailty Index Changes over the Progressive Strength Training
Figure 3 illustrates group and individual changes in the FI scores from the pre-test through the 12-week intervention period. The FI decreased by 56% from the pre-test to week 8 (p < 0.001), by 50% from week 8 to week 12 (although this did not reach statistical significance, p = 0.08), and by 78% from the pre-test to week 12 (p < 0.001). Participant 1 exhibited the highest initial FI (0.33), which decreased by 30% in week 8 (0.23) and further declined by 78% by week 12 (0.05). Participant 2 demonstrated a reduction from 0.29 to 0.17 (41%) over the first 8 weeks, followed by a decrease to 0.10 (41%) in week 12. Participant 3’s FI decreased from 0.18 to 0.04 (78%) in week 8 and remained stable thereafter. Participant 4 showed a progressive decline from 0.15 in the pre-test to 0.04 (73%) in week 8, and to 0.01 (75%) in week 12. Participant 5 improved from 0.13 to 0.08 (39%) by week 8 and to 0.07 (13%) by the end of the intervention. Participant 6 experienced a reduction from 0.10 to 0.04 (60%) after 8 weeks, ultimately reaching 0.00 in week 12. Participant 7 showed a complete reduction in FI from 0.09 to 0.00 within the first 8 weeks, with no further change observed. Lastly, Participant 8’s FI decreased from 0.08 to 0.02 (75%) in week 8 and remained unchanged thereafter. Two participants were classified as frail and six as pre-frail at baseline. By week 8, three participants were classified as pre-frail and five as non-frail, and by week 12, one participant was classified as pre-frail and seven as non-frail.
3.2. Level of Physical Activity, Hand Grip Strength, and Gait Speed
Figure 4 shows the effects of PST on the level of physical activity (LAP), hand grip strength (HGS), and gait speed (GS). Participants demonstrated a progressive and statistically significant increase in LAP across the 12 weeks of PST. The mean energy expenditure rose from 1695.34 ± 754.53 kcal/week at pre-test to 3310.39 ± 649.14 kcal/week at 8 weeks (95%; p = 0.002), and further to 4284.11 ± 675.48 kcal/week at 12 weeks (29%, p = 0.001). From pre-test to 12 weeks, there was a 153% increase in LAP (p < 0.001). HGS significantly increased from pre-test to both 8 and 12 weeks. The was an increase from 23.61 ± 6.25 kg at pre-test to 25.76 ± 5.75 kg at 8 weeks (p = 0.008), and to 26.75 ± 5.82 kg at 12 weeks (p = 0.046), representing a 9% and 13% improvement, respectively. However, no significant differences were observed between the 8 and 12 weeks of PST. From pre-test to 12 weeks, there was a 13% increase in HGS (p = 0.01). GS improved significantly after 12 weeks of PST. Pre-test GS was 1.11 ± 0.20 m/s, increasing to 1.23 ± 0.16 m/s at 8 weeks (11%, p = 0.018), and further to 1.32 ± 0.18 m/s at 12 weeks (7%, p = 0.017). No statistical differences were identified between 8 and 12 weeks (p = 0.1). From pre-test to 12 weeks, there was a 19% increase in GS (p = 0.01).
3.3. Heart Rate Variability at Baseline in the Supine Position
In the time and frequency domain analysis, no statistically significant differences were observed between pre-test, 8 weeks, and 12 weeks of PST (Table 3). When cardiovascular medication was included as a covariate in the analysis, the statistical results were not altered (data not shown).
3.4. Cardiac Parasympathetic Modulation (CPM)
There were no statistically significant differences in CPM responses between pre-test, 8 weeks, and 12 weeks of PST (Table 4). Cardiovascular medication did not alter these results when it was included as a covariate in the analysis (data not shown).
3.5. Short-Term Baroreceptor Gain During Active Stand Orthostatic Stress Across Phases
In the sit-to-stand and lie-to-stand transitions, no statistically significant differences were found in all phases between pre-test, 8 weeks, and 12 weeks of PST (Table 5). Cardiovascular medication use did not alter statistical results when it was included as a covariate in the analysis (data not shown).
4. Discussion
To the best of our knowledge, this is the first study that analyzes the effects of 12 weeks of PST on the phase-specific autonomic short-term compensatory responses in pre-frail and frail community-dwelling older adults under two distinct active-standing orthostatic stress conditions. The PST counteracted frailty by showing a lower FI score, improved levels of physical activity, hand grip strength, and gait speed, and OI symptoms were absent at week 12. However, PST did not improve the autonomic function variables related to short-term compensatory responses.
4.1. Frailty Dynamics in Responses to 12 Weeks of Progressive Strength Training
Throughout the 12 weeks of the PST program, participants showed progressive improvements in frailty status, as reflected by reductions in their FI scores. On average, FI decreased by 56% by week 8, and a further 50% reduction occurred between weeks 8 and 12, resulting in a total decline of 78% from the pre-test. Notably, the participant with the highest initial frailty (FI = 0.33) experienced the most substantial improvement, achieving a 30% reduction by week 8 (FI = 0.23) and an overall decrease of 85% by the end of the intervention (FI = 0.05). This change far exceeds the minimal clinically important difference (MCID) for the Frailty Index, which has been suggested to be approximately 0.03 points in previous literature [31,32]. A reduction of 0.28 points in this individual not only represents a clinically meaningful improvement but also a shift from frailty toward a non-frail status. Such a significant change is likely to translate into meaningful improvements in physical function, independence, and overall quality of life. Corroborating with our findings, Kehler et al. [33] found that individuals with higher baseline frailty (FI > 0.30) benefited the most from cardiac rehabilitation, with average FI reductions ranging from 0.08 to 0.11. Similarly, in our study, the frailest participant experienced the largest improvement, supporting prior findings that those with greater initial frailty show the most significant and clinically meaningful gains. Also, aligned with our findings, Perez-Zepeda et al. [4] reported a 23% reduction in frailty index (FI) scores among hospitalized frail older adults engaged in a multi-component exercise program that included supervised strength training, balance, and walking exercise, decreasing from 0.26 ± 0.1 at admission to 0.20 ± 0.1 at discharge.
The reduction in FI observed after 12 weeks of PST may be attributed to adaptations across the musculoskeletal and cardiovascular systems, as evidenced by our data that showed a significant increase in physical activity levels, grip strength, and walking speed, suggesting a reduction in physical frailty. Regular strength training enhances muscle strength and power through increased motor unit recruitment, improved neuromuscular coordination, and hypertrophy of type II muscle fibers [34]. These neuromuscular adaptations likely contributed to improved performance in strength-dependent functional activities [35]. Moreover, the cumulative postural and muscular demands imposed by the training may have supported more efficient blood pressure regulation during orthostatic stress by enhancing baroreflex function and venous return [34,35]. Adaptations in peripheral circulation, including increased capillary density, may also have promoted more effective oxygen delivery and metabolic exchange during physical activity [34]. These systemic improvements may contribute to enhanced functional capacity and attenuation of physiological deficits associated with frailty.
When examining the specific FI components, the largest improvements were likely driven by gains in physical activity levels, gait speed, and handgrip strength. These three items are directly linked to muscular performance, mobility, and overall vitality [36,37]. These parameters are among the most responsive to resistance-based interventions, reflecting enhanced functional independence and physiological reserve [36,37]. Improvements in these domains may also have indirectly influenced other FI items, such as reduced fatigue and improved ability to perform daily tasks, thereby contributing to the overall decline in frailty status.
4.2. Heart Rate Variability (HRV) Responses at Baseline After Progressive Strength Training
No statistically significant differences were observed in HRV in either the time or frequency domains at any of the points analyzed. Supporting our results, Gambassi et al. [15] reported no significant changes in HRV after 10 weeks of strength training when comparing older adults in experimental and control groups. However, they observed within-group improvements in HRV among trained participants. The authors attributed these changes to reductions in body fat and increases in fat-free mass and muscular strength, suggesting that improvements in body composition might mediate autonomic adaptations. Similarly, Gerage et al. [38] found no statistical differences in HRV following 12 weeks of strength training in untrained older females compared to controls and proposed that the protocol, short training duration and low-to-moderate volume, may not have provided effects to autonomic changes. In contrast to our results, Lin et al. [14] observed improvements in HRV in older females and males after 24 weeks of strength training compared to a control group. However, the training duration in that study was twice as long as in our study. The authors suggested that the longer duration and higher intensity of training were key factors for improving vagal tone and orthostatic tolerance, indicating that training load and duration are critical for inducing autonomic modulation.
There were no statistically significant differences in HRV in both time and frequency domains, suggesting that autonomic cardiac modulation remained unchanged throughout the intervention. In pre-frail and frail older adults, autonomic regulation is often characterized by a reduction in parasympathetic activity and impaired reflex control of HR [39]. These alterations are frequently linked to structural and functional changes in the autonomic system [12], including diminished baroreceptor sensitivity and altered central autonomic integration [12]. Such alterations may limit the influence of strength training on vagal modulation and autonomic balance over 12 weeks of PST.
4.3. Cardiac Parasympathetic Modulation (CPM) Responses During Active Standing Orthostatic Stress After Progressive Strength Training
The CPM was similar across the pre-test, 8 weeks, and 12 weeks, with no statistically significant differences. The lack of statistical differences in CPM (HR 30:15 ratio) throughout the 12-week intervention suggests that the PST did not influence the vagal regulation of HR in this sample of pre-frail and frail community-dwelling older adults. Aging and frailty are commonly associated with a decline in parasympathetic activity [39], which reflects changes at both central and peripheral levels of autonomic control [12]. These include altered neurotransmission in brainstem nuclei involved in cardiovagal regulation, reduced acetylcholine availability at the sinoatrial node, and structural changes in afferent and efferent pathways that mediate parasympathetic output [39,40]. Such impairments may limit the ability of short-term interventions (≤ 12 weeks) to modify cardiovagal function and vagally mediated HR control, at least within the timeframe assessed in the current study (12 weeks).
4.4. Short-Term Baroreceptor Gain During Active Standing Orthostatic Stress After Progressive Strength Training
CBG remained unchanged across the pre-test, 8-week, and 12-week assessments, indicating no significant adaptation in baroreflex sensitivity over the course of the intervention. Our findings are aligned with Fecchio et al. [18] who also observed no significant changes in CBG after 10 weeks of dynamic strength training in hypertensive males. They proposed that despite improvements in vascular function and reductions in resting blood pressure, the short training duration and the specific protocol used may not have been sufficient to affect CBG. Similarly to our results, Bellavere et al. [41] did not find statistical differences in CBG after 16 weeks of strength training in older females and males. They suggested that the lack of change in the response across the intervention may reflect either the limited sample size (n = 9) or a potentially lower responsiveness of baroreflex components to strength training. In pre-frail and frail older adults, blunted baroreflex function is commonly observed and may reflect age-related alterations in arterial compliance, afferent baroreceptor signalling, and central autonomic integration [42,43]. These changes impair the regulation of HR in response to fluctuations in blood pressure, compromising short-term autonomic regulation [43]. Unaltered responses in the present study may suggest that PST over a 12-week period does not influence the components of the baroreflex arc among pre-frail and frail community-dwelling individuals. Changes may be reflected in timing rather than magnitude, with adaptive responses occurring more quickly after PST. However, our measurements captured only specific points in time (30, 60, 180, and 420 s), not the rate at which it adjusted to compensate for pressure disturbances induced by the postural maneuvers.
4.5. Level of Physical Activity, Hand Grip Strength, and Gait Speed
Throughout the 12-week intervention, participants exhibited gains in physical activity levels, hand grip strength, and gait speed, reflecting improved functional performance and physical frailty. Weekly physical activity levels rose by 95% from baseline to week 8, with a further 29% increase between weeks 8 and 12, totaling a 153% increase over the full period. Hand grip strength improved by 9% at week 8 and 13% by week 12, with no significant difference observed between weeks 8 and 12. Similarly, gait speed increased by 11% at week 8 and reached an overall improvement of 19% by week 12, without further significant change during the final four weeks. The observed enhancements in hand grip strength and gait speed align with initial adaptations typically seen during the early stages of strength training, particularly those attributed to neural mechanisms [34]. This phase, dominant in the first weeks of training, is characterized by improved motor unit activation, increased firing rates, and reduced inhibitory signals, all of which enhance muscle force generation [34]. Gains in gait speed may similarly reflect better neuromuscular coordination, facilitating more stable and efficient movement patterns [34]. The intervention over 12 weeks may have also improved structural changes, including increased muscle fiber size and tendon stiffness, which are known to support improved physical function [34,44]. Additionally, the rise in physical activity levels likely shows the mechanical load applied to the musculoskeletal system, reinforcing both neural and morphological adaptations that contribute to enhanced motor function in older adults [34,45].
4.6. Orthostatic Intolerance Symptoms After Progressive Strength Training
Despite the lack of statistical significance over the 12-week PST intervention, a downward trend in OI symptoms was observed. Initially, 38% of participants (3 out of 8) reported OI symptoms at baseline. This proportion decreased to 13% (1 out of 8) by week 8, and by week 12, no participants reported OI symptoms, amounting to a 100% relative reduction. Although the change did not reach statistical significance (p = 0.09), this pattern may hold clinical value, particularly considering the adverse effects of OI on functional independence and fall risk in frail older adults. OI is often associated with impaired autonomic compensatory responses during postural transitions, particularly reduced baroreflex sensitivity, diminished vascular responsiveness, and delayed recovery of cardiac output and systemic vascular resistance [10,46]. These impairments are frequently exacerbated by frailty-related autonomic dysfunction [12]. Another possibility is that PST did not modify these autonomic indices within the observed timeframe, but other factors, such as limited sample size, sensitivity of the variables to detect changes, may also have contributed to the lack of significance.
4.7. Limitation
The present study has limitations that should be considered. CBG was assessed at specific time points (30 s, 60 s, 180 s, and 420 s), which may have overlooked continuous variations in baroreflex activity during the active standing orthostatic stress protocol. Although this method provides key short-term responses in predefined phases, it may miss detecting transient fluctuations or adaptations that occur at specific times. Alternative approaches, such as the sequence methods [17], which identifies spontaneous changes in SBP and RR interval changes, or transfer function analysis [17], which evaluates baroreflex function across frequency ranges, could offer a more detailed understanding. Although the study met the minimum number of participants required by prior power analysis (n = 8), the inclusion of only eight older adults may still restrict the generalizability of the findings and limit the ability to account for inter-individual variability. Small sample sizes are also associated with an increased likelihood of type II errors and constrain the potential to examine subgroup differences, such as stratification by frailty status [47] and sex. On the other hand, studies involving small but well-characterized cohorts can provide physiological insights, particularly in populations that are challenging to recruit and underrepresented in clinical research, such as frail older adults. This study utilized a quasi-experimental time-series design without a randomized control group, which limits the capacity to draw causal inferences [47]. The lack of randomization has a greater risk of bias and may compromise internal validity when compared to randomized controlled trials (RCTs) [47], which are designed to isolate the effect of an intervention by ensuring group equivalence at baseline through random assignment [47]. However, this design allowed for the longitudinal monitoring of individual responses, an approach particularly relevant in heterogeneous and clinically complex populations such as older adults living with frailty, and its use in clinical settings.
5. Conclusions
In conclusion, frailty index scores were reduced after 12 weeks of PST, showing that frailty status can be counteracted. Physical activity levels, hand grip strength, and gait speed improved with PST, suggesting a reduction in physical frailty. While the prevalence of OI symptoms did not change statistically, the descriptive analysis shows a reduction in the number of participants reporting these symptoms, which may indicate a clinically relevant improvement in orthostatic tolerance. However, the PST did not improve the variables related to short-term autonomic compensatory responses in this population.
Supplementary Materials
The following supporting information can be downloaded at the website of this paper posted on Preprints.org.
Author Contributions
D.G.d.M.: project administration, review and editing, writing—original. draft, formal analysis, data curation, visualization. J.L.d.S.: review, editing, and data curation. F.J.A., S.M.C., G.G.G., A.N.-S., and R.R.-O.: review and editing, visualization. T.A.D. and R.V.: project administration, writing, review, editing, supervision, formal analysis, and conceptualization. All authors have read and agreed to the published version of the manuscript.
Funding
This research was supported in part by the Manitoba Medical Service Foundation (MMSF #2021-11) (RV), Centre on Aging Research Fellowship (University of Manitoba) (RV), University of Manitoba Retirees Association Scholarship (DM), Center on Aging Betty Havens Memorial Graduate Fellowship (DM), and Jack MacDonell Scholarship for Research in Aging (DM).:.
Institutional Review Board Statement
Ethical approval was granted by the University of Manitoba Health Research Ethics Board (approval number HE2022-0058) on 26 April 2022.
Informed Consent Statement
Informed consent was obtained from all subjects involved in the study.
Data Availability Statement
The raw data supporting the conclusions of this article will be made available by the authors on request.
Acknowledgments
Special thanks to all participants for their dedication. Thank you to the FAPEMIG (APQ-04126-23), call 009/2023 for supporting Albena Nunes-Silva in the internationalization program of the ICTMGS.
Conflicts of Interest
The authors declare no conflicts of interest.
Abbreviations
| ACSM | American College of Sports Medicine |
| ANS | Autonomic Nervous System |
| BP | Blood Pressure |
| CBG | Cardiac Baroreceptor Gain |
| CSEP | Canadian Society for Exercise Physiology |
| CPM | Cardiac Parasympathetic Modulation |
| DBP | Diastolic Blood Pressure |
| ECG | Electrocardiogram |
| ES | Effect Size |
| FI | Frailty Index |
| GS | Gait Speed |
| HG | Handgrip Strength |
| HF | High-Frequency Power |
| HR | Heart Rate |
| HRV | Heart Rate Variability |
| IPAQ-SF | International Physical Activity Questionnaire–Short Form |
| LFA | Low-Frequency Area (sometimes presented as LF) |
| LF | Low-Frequency Power |
| LPA | Level of Physical Activity |
| MCID | Minimal Clinically Important Difference |
| MET | Metabolic Equivalent of Task |
| OI | Orthostatic Intolerance |
| OH | Orthostatic Hypotension |
| OMNI-RES | OMNI Resistance Exercise Scale |
| PST | Progressive Strength Training |
| RMSSD | Root Mean Square of Successive Differences between RR Intervals |
| RR | Average Interval between Consecutive Heartbeats |
| SBP | Systolic Blood Pressure |
| SDNN | Standard Deviation of RR Intervals |
| TREND | Transparent Reporting of Evaluations with Non-Randomized Designs |
References
- Hoogendijk, E.O.; Afilalo, J.; Ensrud, K.E.; Kowal, P.; Onder, G.; Fried, L.P. Frailty: Implications for Clinical Practice and Public Health. Lancet 2019, 394, 1365–1375. [CrossRef]
- Dent, E.; Martin, F.C.; Bergman, H.; Woo, J.; Romero-ortuno, R.; Walston, J.D. Frailty 2 Management of Frailty : Opportunities , Challenges , and Future Directions. Lancet 2019, 394, 1376–1386. [CrossRef]
- Bray, N.W.; Smart, R.R.; Jakobi, J.M.; Jones, G.R. Exercise Prescription to Reverse Frailty. Appl. Physiol. Nutr. Metab. 2016, 41, 1112–1116. [CrossRef]
- Pérez-Zepeda, M.U.; Martínez-Velilla, N.; Kehler, D.S.; Izquierdo, M.; Rockwood, K.; Theou, O. The Impact of an Exercise Intervention on Frailty Levels in Hospitalised Older Adults: Secondary Analysis of a Randomised Controlled Trial. Age Ageing 2022, 51, 1–9. [CrossRef]
- Cadore, E.L.; Pinto, R.S.; Bottaro, M.; Izquierdo, M. Strength and Endurance Training Prescription in Healthy and Frail Elderly. Aging Dis. 2014, 5, 183–195. [CrossRef]
- Lopez, P.; Izquierdo, M.; Radaelli, R.; Sbruzzi, G.; Grazioli, R.; Pinto, R.S.; Cadore, E.L. Effectiveness of Multimodal Training on Functional Capacity in Frail Older People: A Meta-Analysis of Randomized Controlled Trials. J. Aging Phys. Act. 2018, 26, 407–418. [CrossRef]
- Parvaneh, S.; Mohler, J.; Toosizadeh, N.; Grewal, G.S.; Najafi, B. Postural Transitions during Activities of Daily Living Could Identify Frailty Status: Application of Wearable Technology to Identify Frailty during Unsupervised Condition. Gerontology 2017, 63, 479–487. [CrossRef]
- Monahan, K.D. Effect of Aging on Baroreflex Function in Humans. Am. J. Physiol. - Regul. Integr. Comp. Physiol. 2007, 293. [CrossRef]
- Kharraziha, I.; Holm, H.; Bachus, E.; Ricci, F.; Sutton, R.; Fedorowski, A.; Hamrefors, V. Cerebral Oximetry in Syncope and Syndromes of Orthostatic Intolerance. Front. Cardiovasc. Med. 2019, 6, 1–6. [CrossRef]
- Fedorowski, A.; Melander, O. Syndromes of Orthostatic Intolerance: A Hidden Danger. J. Intern. Med. 2013, 273, 322–335. [CrossRef]
- Romero-Ortuno, R.; Cogan, L.; O’shea, D.; Lawlor, B.A.; Kenny, R.A. Orthostatic Haemodynamics May Be Impaired in Frailty. Age Ageing 2011, 40, 576–583. [CrossRef]
- Parvaneh, S.; Howe, C.L.; Toosizadeh, N.; Honarvar, B.; Slepian, M.J.; Fain, M.; Mohler, J.; Najafi, B. Regulation of Cardiac Autonomic Nervous System Control across Frailty Statuses: A Systematic Review. Gerontology 2015, 62, 3–15. [CrossRef]
- Catai, A.M.; Pastre, C.M.; Godoy, M.F. de; Silva, E. da; Takahashi, A.C. de M.; Vanderlei, L.C.M. Heart Rate Variability: Are You Using It Properly? Standardisation Checklist of Procedures. Brazilian J. Phys. Ther. 2020, 24, 91–102. [CrossRef]
- Lin, L.L.C.; Chen, Y.J.; Lin, T.Y.; Weng, T.C. Effects of Resistance Training Intensity on Heart Rate Variability at Rest and in Response to Orthostasis in Middle-Aged and Older Adults. Int. J. Environ. Res. Public Health 2022, 19. [CrossRef]
- Gambassi, B.B.; Rodrigues, B.; Feriani, D.J.; de Jesus Furtado Almeida, F.; Sauaia, B.A.; Schwingel, P.A.; de Moraes, O.A.; Pulcherio, J.O.B.; Andrade, M.F.B.; Mostarda, C.T. Effects of Resistance Training of Moderate Intensity on Heart Rate Variability, Body Composition, and Muscle Strength in Healthy Elderly Women. Sport Sci. Health 2016, 12, 389–395. [CrossRef]
- Ewing, A.D.J.; Campbell, I.W.; Murray, A.; Neilson, J.M.M.; Clarke, B.F. Diabetes Immediate Autonomic Neuropathy In. 1978, 1, 145–147.
- La Rovere, M.T.; Pinna, G.D.; Raczak, G. Baroreflex Sensitivity: Measurement and Clinical Implications. Ann. Noninvasive Electrocardiol. 2008, 13, 191–207. [CrossRef]
- Fecchio, R.Y.; de Sousa, J.C.S.; Oliveira-Silva, L.; da Silva Junior, N.D.; Pio-Abreu, A.; da Silva, G. V.; Drager, L.F.; Low, D.A.; Forjaz, C.L.M. Effects of Dynamic, Isometric and Combined Resistance Training on Blood Pressure and Its Mechanisms in Hypertensive Men. Hypertens. Res. 2023, 46, 1031–1043. [CrossRef]
- Cooke, W.H.; Carter, J.R. Strength Training Does Not Affect Vagal-Cardiac Control or Cardiovagal Baroreflex Sensitivity in Young Healthy Subjects. Eur. J. Appl. Physiol. 2005, 93, 719–725. [CrossRef]
- Haynes AB, Haukoos JS, D.J. TREND Reporting Guidelines for Nonrandomized/Quasi-Experimental Study Designs. JAMA Surg. 2021, 156, 2.
- Slade, S.C.; Dionne, C.E.; Underwood, M.; Buchbinder, R.; Beck, B.; Bennell, K.; Brosseau, L.; Costa, L.; Cramp, F.; Cup, E.; et al. Template ( CERT ): Modified Delphi. Phys. Ther. 2016, 96, 1514–1524.
- Searle, S.D.; Mitnitski, A.; Gahbauer, E.A.; Gill, T.M.; Rockwood, K. A Standard Procedure for Creating a Frailty Index. BMC Geriatr. 2008, 8, 1–10. [CrossRef]
- Canadian Society for Exercise Physiology Canadian Physical Activity Guidelines for Older Adults 65 Years and Older; CSEP, Ed.; Ottawa, 2011;
- Guelen, I.; Westerhof, B.E.; Van Der Sar, G.L.; Van Montfrans, G.A.; Kiemeneij, F.; Wesseling, K.H.; Bos, W.J.W. Finometer, Finger Pressure Measurements with the Possibility to Reconstruct Brachial Pressure. Blood Press. Monit. 2003, 8, 27–30. [CrossRef]
- Gama de Matos, D.; Lima de Santana, J.; Aidar, F.J.; Cornish, S.M.; Giesbrecht, G.G.; Nunes-Silva, A.; Romero-Ortuno, R.; Duhamel, T.A.; Villar, R. Changes in Autonomic Balance, Cardiac Parasympathetic Modulation, and Cardiac Baroreflex Gain in Older Adults Under Different Orthostatic Stress Conditions. 2025, 1–19.
- Hagströmer, M.; Oja, P.; Sjöström, M. The International Physical Activity Questionnaire (IPAQ): A Study of Concurrent and Construct Validity. Public Health Nutr. 2006, 9, 755–762. [CrossRef]
- American College of Sports Medicine ACSM’s Guidelines for Exercise Testing and Prescription; 10th ed.; Wolters Kluwer, 2020; ISBN 9781496339072.
- Lagally, K.M.; Robertson, R.J. Construct Validity of the OMNI Resistance Exercise Scale. J. Strength Cond. Res. 2006, 20, 252–256. [CrossRef]
- Faul, F.; Erdfelder, E.; Lang, A.-G.; Buchner, A. G*Power 3: A Flexible Statistical Power Analysis Program for the Social, Behavioral, and Biomedical Sciences. Behav. Res. Methods 2007, 39, 175–191. [CrossRef]
- Yoav Benjamini and Yosef Hochberg Controlling the False Discovery Rate: A Practical and Powerful Approach to Multiple Testing. J. R. Stat. Soc. Ser. B 1995, 57, 289–300.
- Kehler, D.S.; Giacomantonio, N.; Firth, W.; Blanchard, C.M.; Rockwood, K.; Theou, O. Association Between Cardiac Rehabilitation and Frailty. Can. J. Cardiol. 2020, 36, 482–489. [CrossRef]
- Theou, O.; van der Valk, A.M.; Godin, J.; Andrew, M.K.; McElhaney, J.E.; McNeil, S.A.; Rockwood, K. Exploring Clinically Meaningful Changes for the Frailty Index in a Longitudinal Cohort of Hospitalized Older Patients. Journals Gerontol. - Ser. A Biol. Sci. Med. Sci. 2020, 75, 1928–1934. [CrossRef]
- Kehler, D.S.; Clara, I.; Hiebert, B.; Stammers, A.N.; Hay, J.L.; Schultz, A.; Arora, R.C.; Tangri, N.; Duhamel, T.A. The Association between Bouts of Moderate to Vigorous Physical Activity and Patterns of Sedentary Behavior with Frailty. Exp. Gerontol. 2018, 104, 28–34. [CrossRef]
- Haff, G.G.; Triplett, T. Essentials of Strength Training and Conditioning; 4th ed.; Human Kinetics, 2015; ISBN 978-1492501626.
- Fragala, M.S.; Cadore, E.L.; Dorgo, S.; Izquierdo, M.; Kraemer, W.J.; Peterson, M.D.; Ryan, E.D. Resistance Training for Older Adults. J. Strength Cond. Res. 2019, 33, 2019–2052. [CrossRef]
- Pan, P.J.; Hsu, N.W.; Lee, M.J.; Lin, Y.Y.; Tsai, C.C. Physical Fitness and Its Correlation with Handgrip Strength in Active Community - Dwelling Older Adults. Sci. Rep. 2022, 1–14. [CrossRef]
- Haider, S.; Luger, E.; Kapan, A.; Titze, S.; Lackinger, C.; Schindler, K.E.; Dorner, T.E. Associations between Daily Physical Activity , Handgrip Strength , Muscle Mass , Physical Performance and Quality of Life in Prefrail and Frail Community-Dwelling Older Adults. Qual. Life Res. 2016, 25, 3129–3138. [CrossRef]
- Gerage, A.M.; Forjaz, C.L.M.; Nascimento, M.A.; Januário, R.S.B.; Polito, M.D.; Cyrino, E.S. Cardiovascular Adaptations to Resistance Training in Elderly Postmenopausal Women. Int. J. Sports Med. 2013, 34, 806–813. [CrossRef]
- Christopher J. Mathias and Roger Bannister Autonomic Failure: A Textbook of Clinical Disorders of the Autonomic Nervous System; 5th ed.; Oxford University Press, 2013; ISBN 9788578110796.
- Cardinali, D.P. Autonomic Nervous System; 1st ed.; Springer International Publishing, 2018; ISBN 978-3-319-57570-4.
- Bellavere, F.; Cacciatori, V.; Bacchi, E.; Gemma, M.L.; Raimondo, D.; Negri, C.; Thomaseth, K.; Muggeo, M.; Bonora, E.; Moghetti, P. Effects of Aerobic or Resistance Exercise Training on Cardiovascular Autonomic Function of Subjects with Type 2 Diabetes: A Pilot Study. Nutr. Metab. Cardiovasc. Dis. 2018, 28, 226–233. [CrossRef]
- Kaufmann, H.; Norcliffe-Kaufmann, L.; Palma, J.-A. Baroreflex Dysfunction. N. Engl. J. Med. 2020, 382, 163–178. [CrossRef]
- Wehrwein, E.A.; Joyner, M.J. Regulation of Blood Pressure by the Arterial Baroreflex and Autonomic Nervous System. Handb. Clin. Neurol. 2013, 117, 89–102. [CrossRef]
- Powers, S.K.; Howley, E.T. Exercise Physiology : Theory and Application to Fitness and Performance; 2012; ISBN 978-0.07-802253-1.
- Fragala, M.S.; Cadore, E.L.; Dorgo, S.; Izquierdo, M.; Kraemer, W.J.; Peterson, M.D.; Ryan, E.D. Resistance Training for Older Adults: Position Statement from the National Strength and Conditioning Association. J. Strength Cond. Res. 2019, 33, 2019–2052. [CrossRef]
- Goswami, N.; Blaber, A.P.; Hinghofer-Szalkay, H.; Montani, J.P. Orthostatic Intolerance in Older Persons: Etiology and Countermeasures. Front. Physiol. 2017, 8. [CrossRef]
- Portney, L.G.; Watkins, M.P. Foundation Clinical Research. Foreign Aff. 2012, 91, 390–404, 503–522.
Figure 1.
Progressive strength training program timeline.
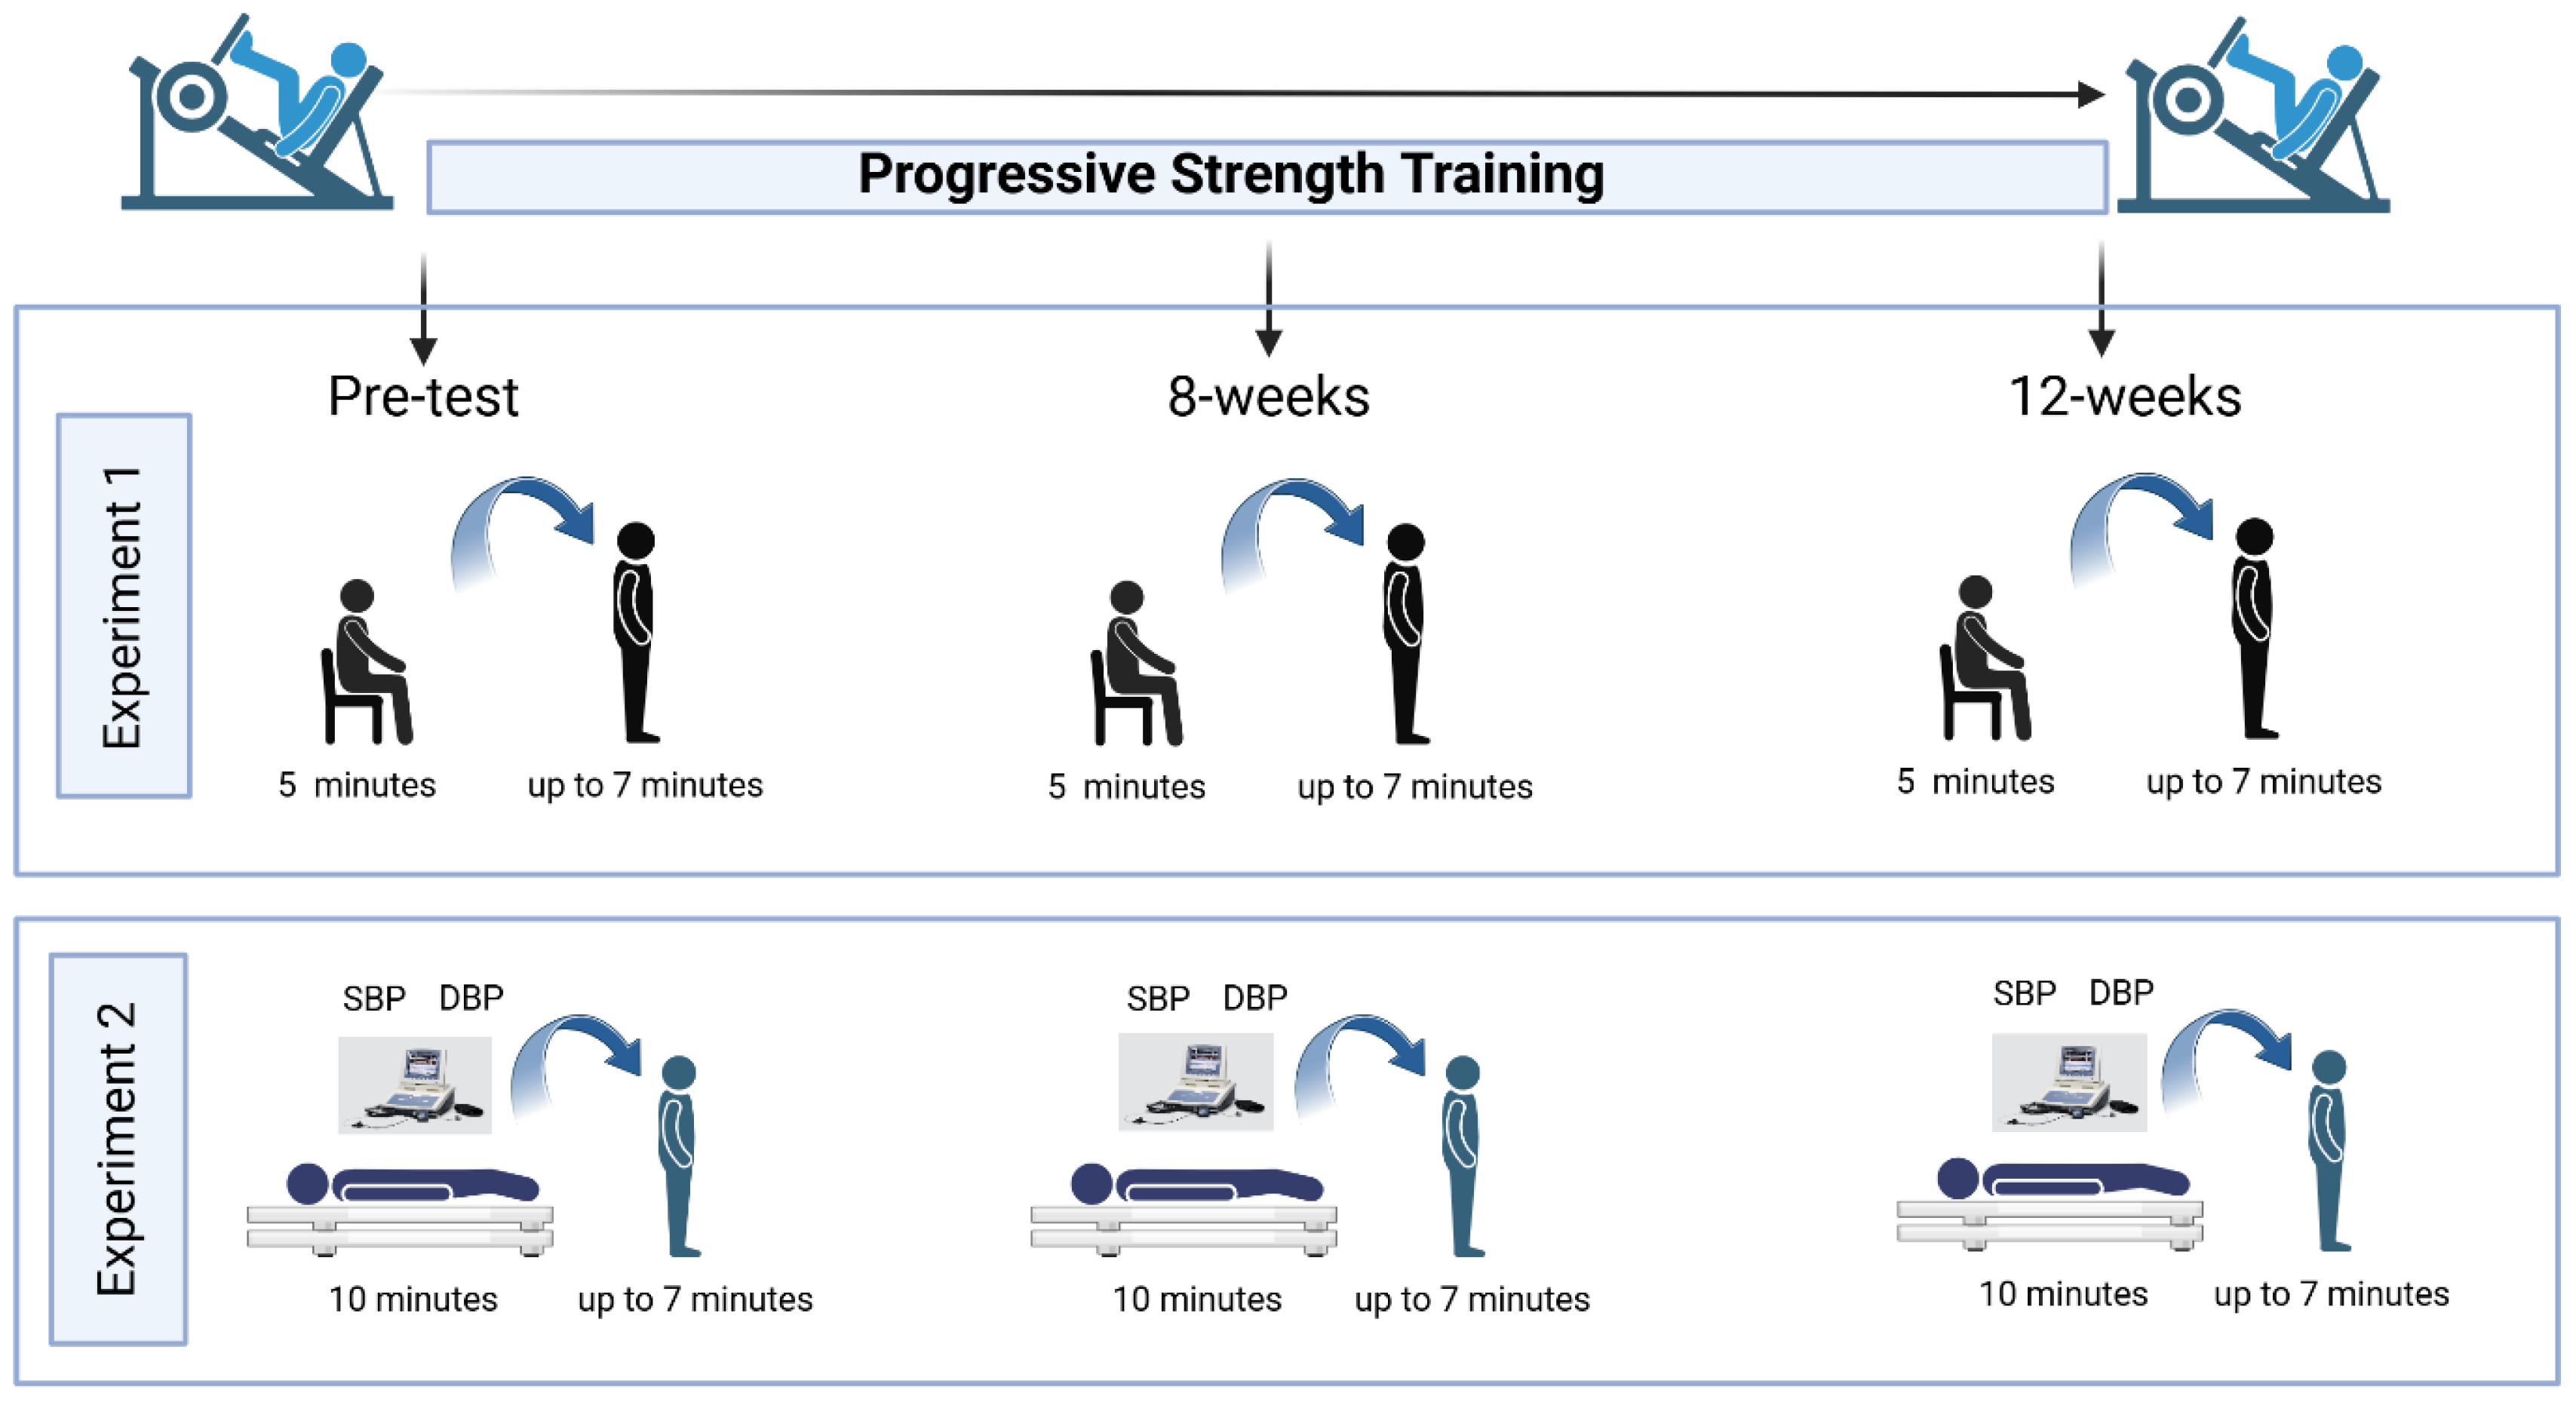
Figure 2.
Flow chart of the participants’ recruitment.
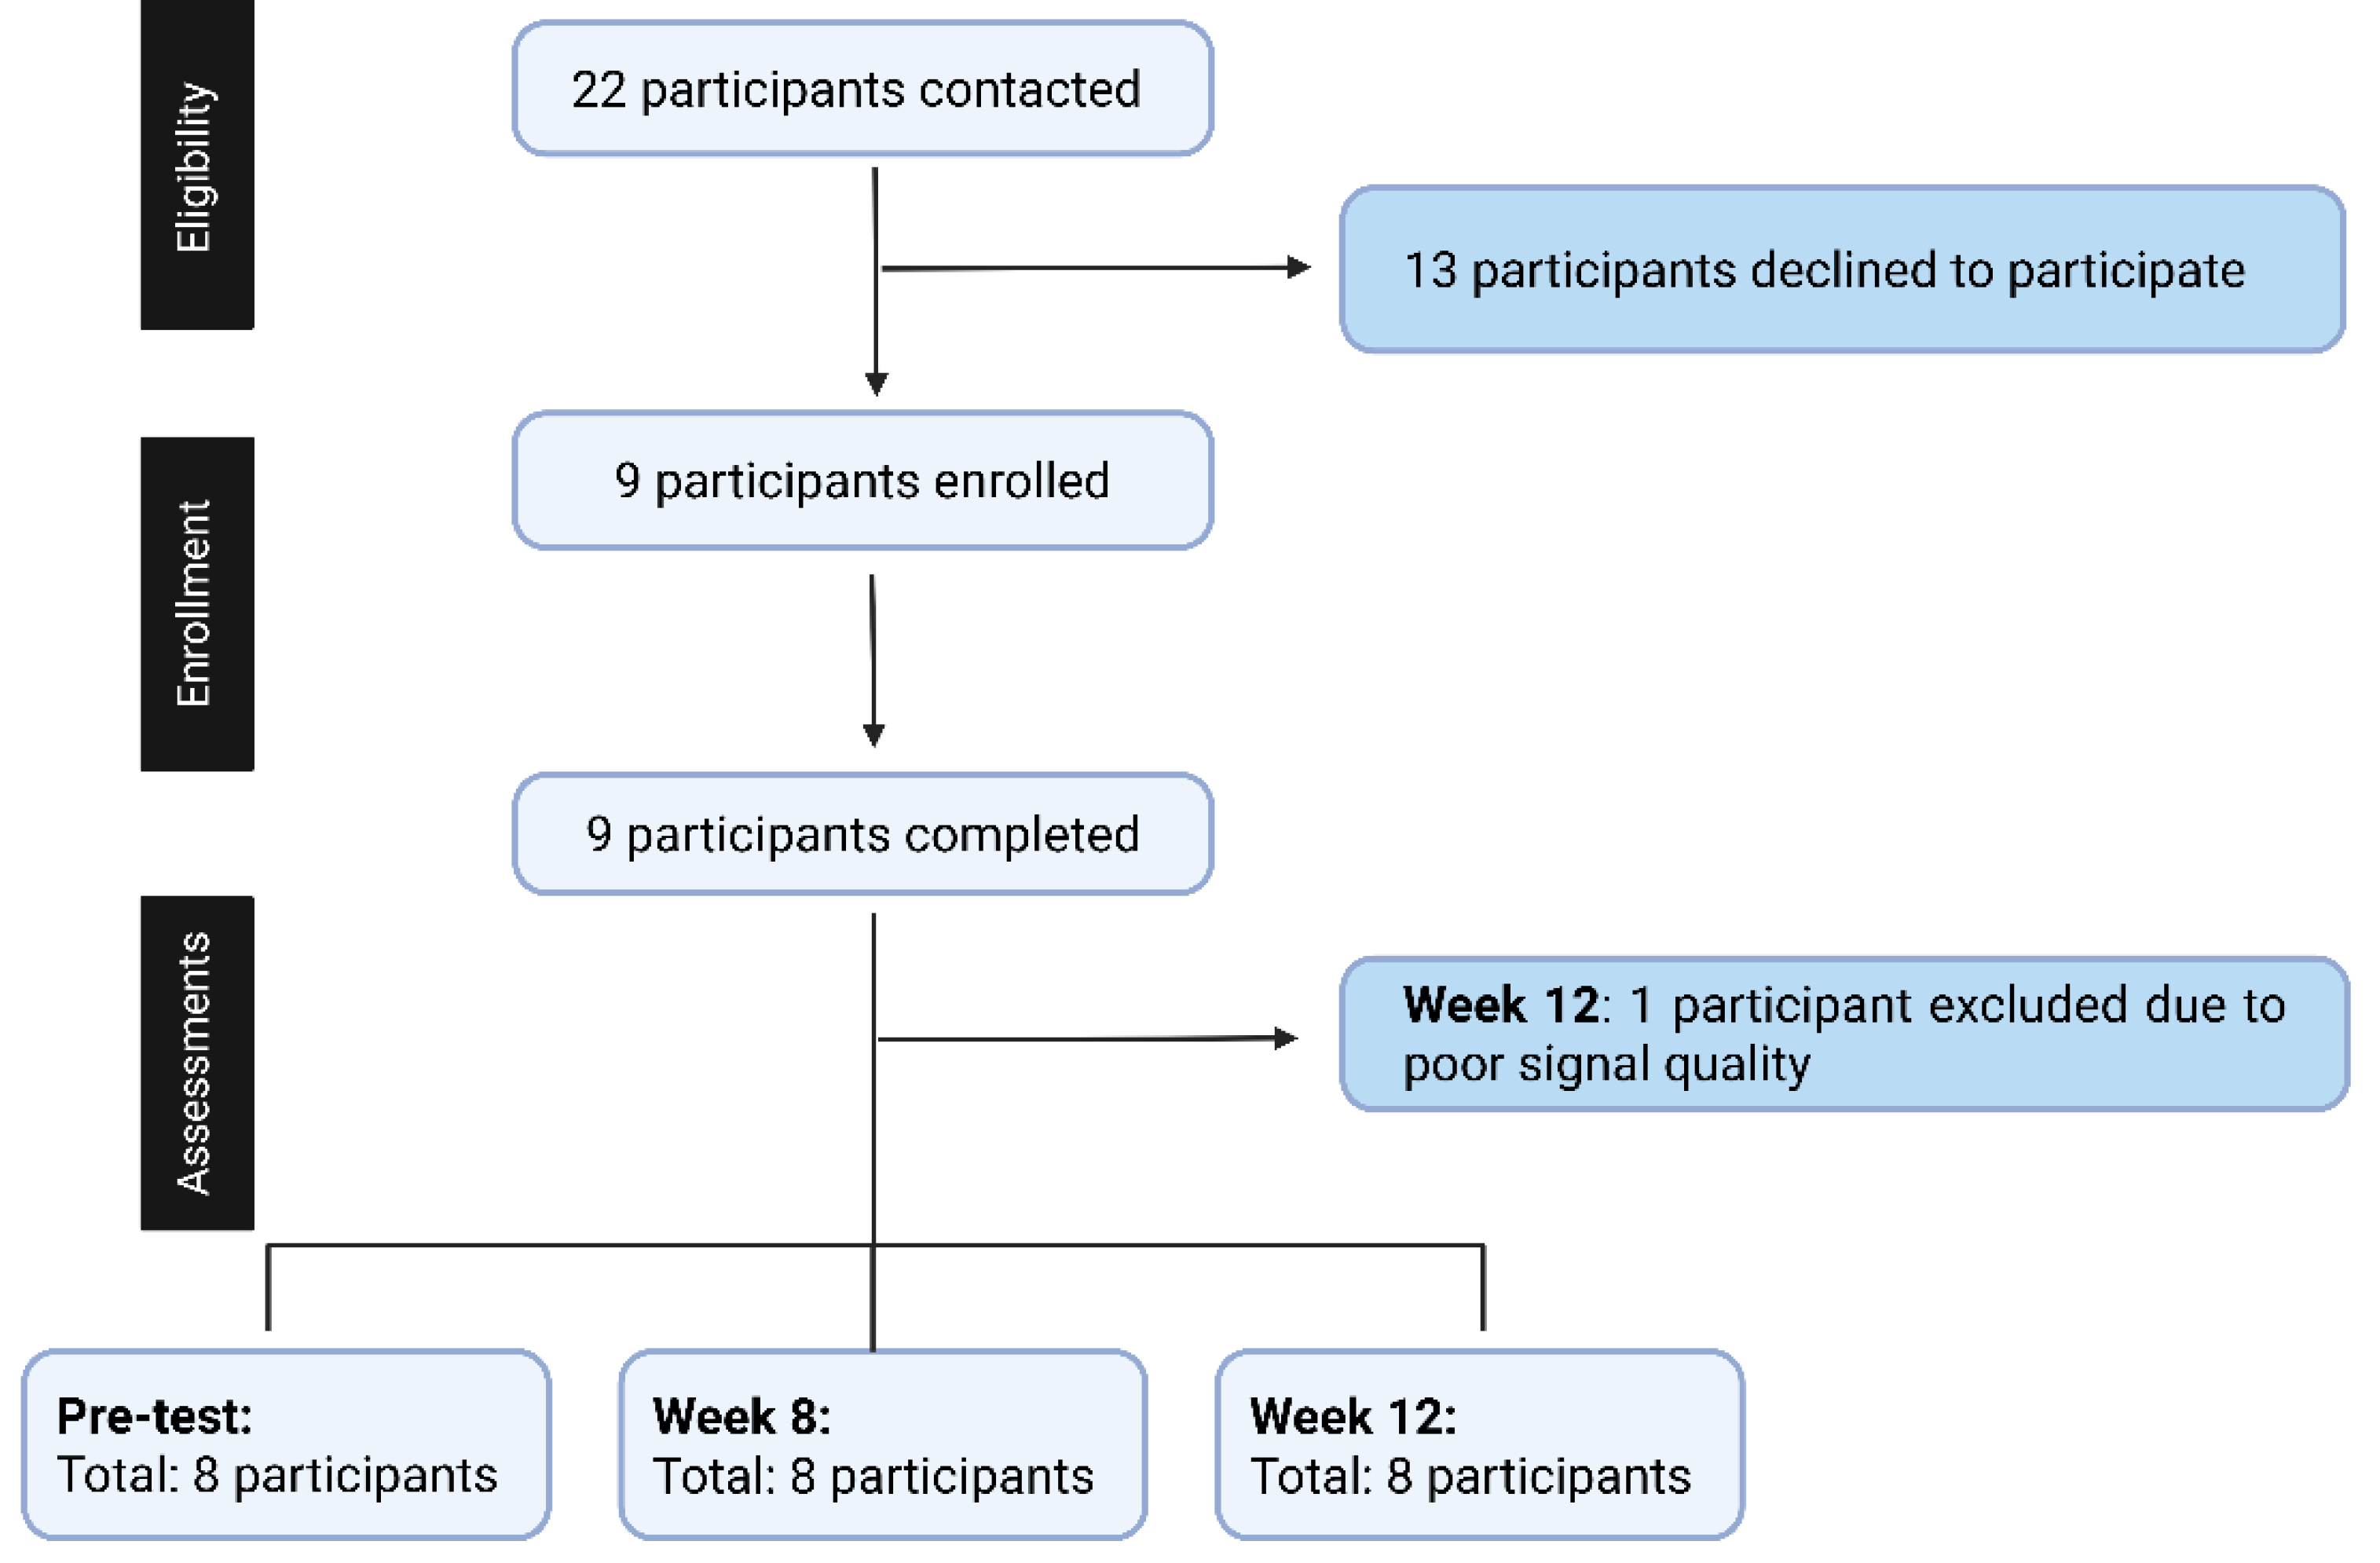
Figure 3.
Progressive reduction in Frailty Index scores following 12 weeks of progressive strength training in pre-frail and frail older adults. Individual trajectories (dashed lines) and group distributions (box plots) show a significant decrease in FI from pre-test to 8 weeks and 12 weeks, indicating a transition from pre-frail/frail toward non-frail status.
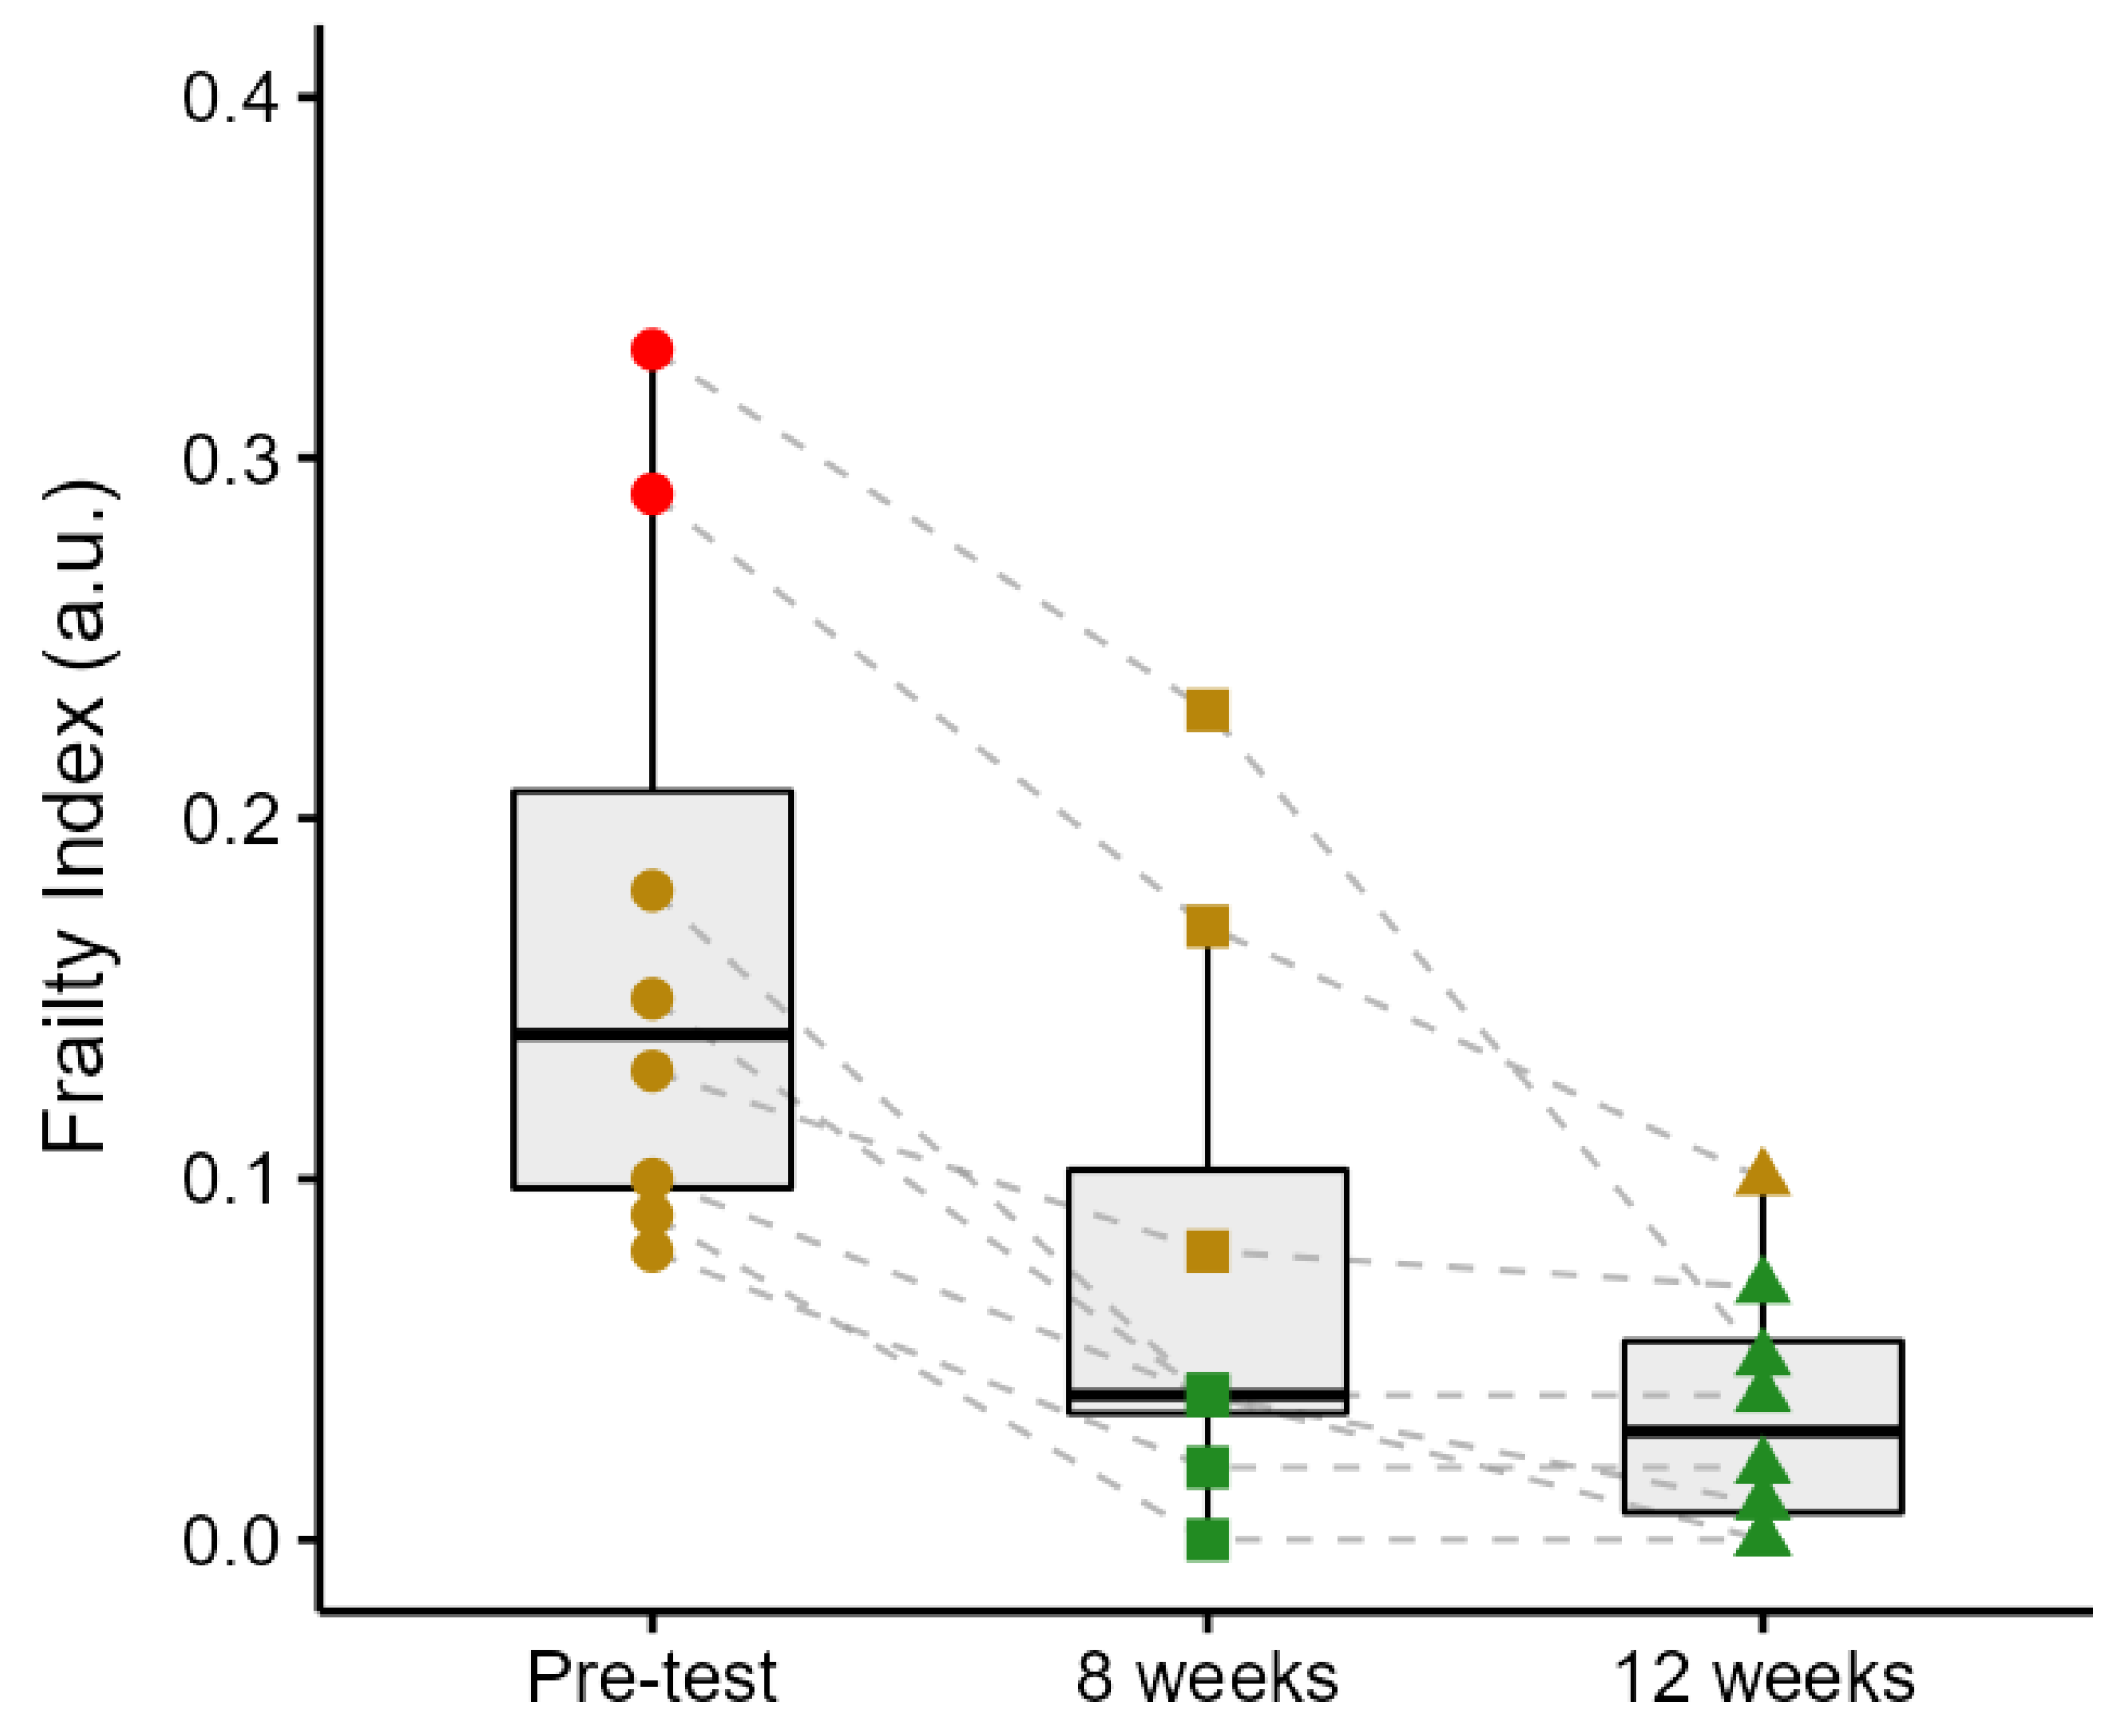
Figure 4.
Changes in level of physical activity, handgrip strength, and gait speed following 12 weeks of progressive strength training (PST) in pre-frail and frail older adults. Data show individual trajectories (dashed lines) and group means ± SD across pre-test, 8 weeks, and 12 weeks. red dots = frail; yellow squares = pre-frail, green triangle = non-frail.
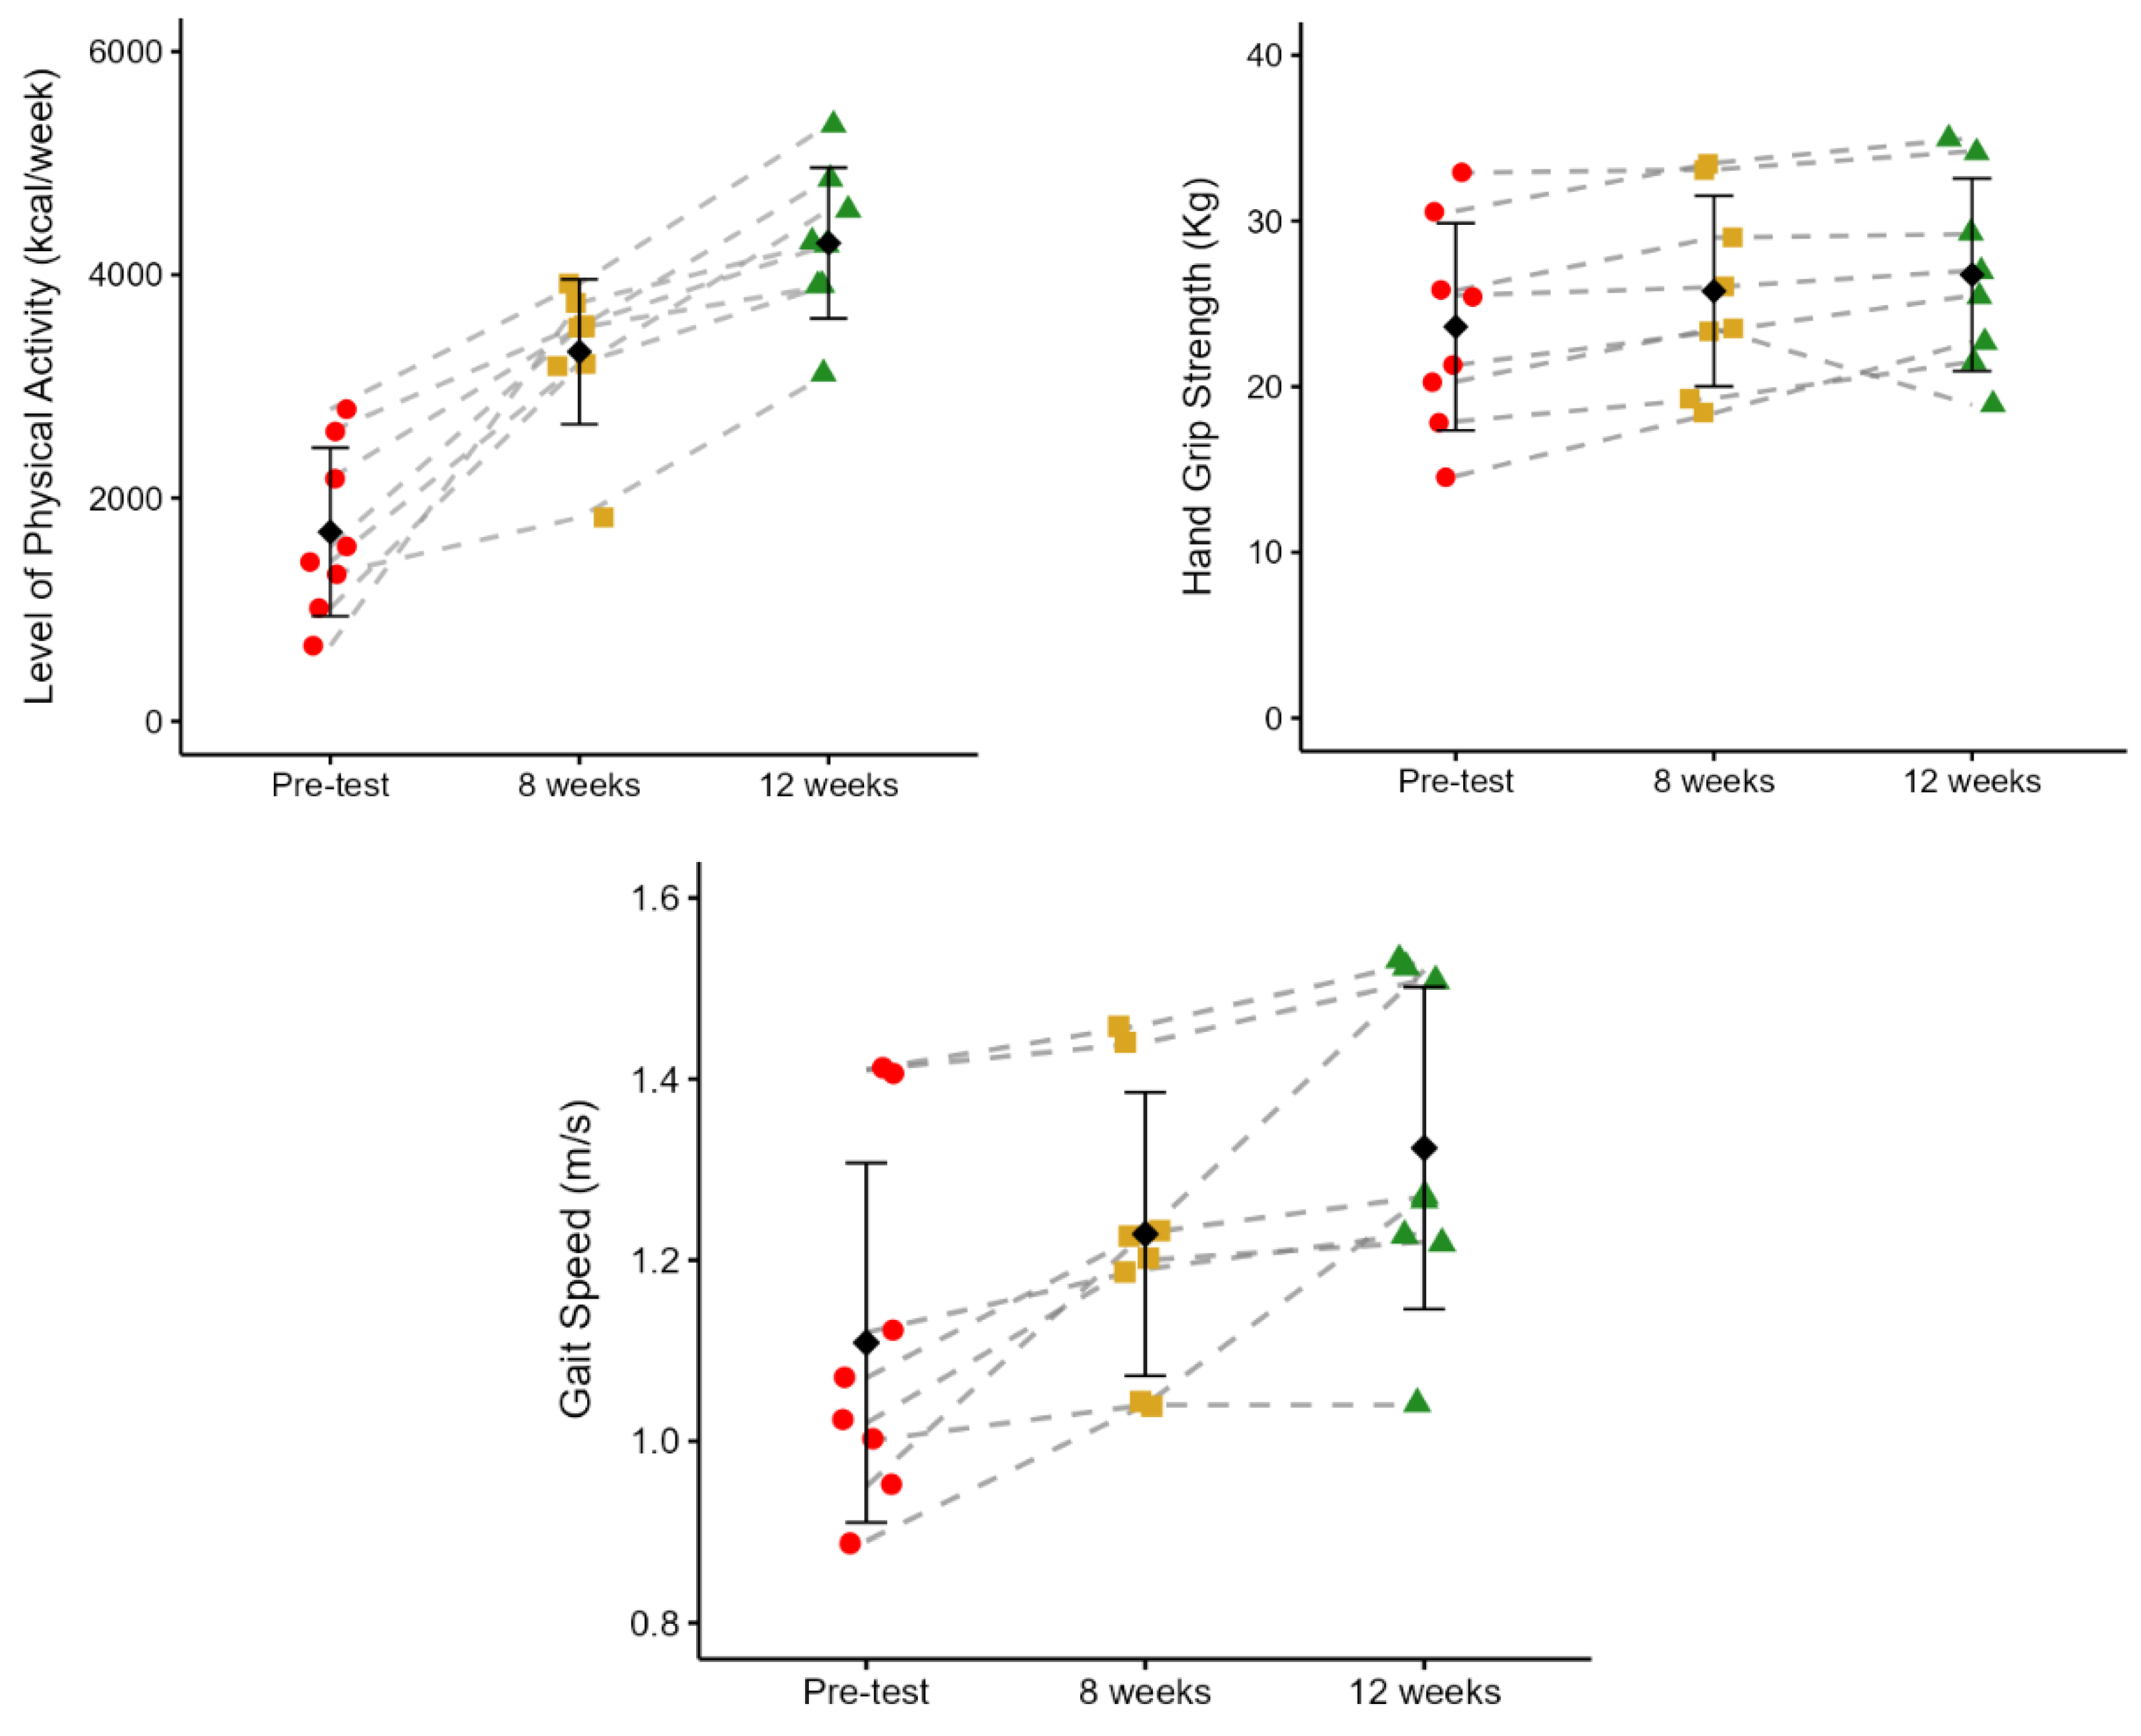

Table 1.
Progressive strength training program progression.
| Weeks |
Frequency (days/week) |
Loading (% RM) |
Sets |
Rest interval (sec) |
Reps |
| 1-3 (familiarization) | 2 | 40-50% of 1RM | 1 | 120 | 15 |
| 4-6 | 2 | 50-60% of 1RM | 2 | 90 | 12 |
| 7-9 | 3 | 60-70% of 1RM | 3 | 60 | 10 |
| 10-12 | 3 | 70-80% of 1RM | 3 | 60 | 8 |
Reps = repetitions.
Table 2.
Sample characterization.
| Variables | Pre-test | 8 Weeks | 12 Weeks | p | |||||||
| n | % | n | % | n | % | ||||||
| Females | 7 | 87.5 | 7 | 87.5 | 7 | 87.5 | <0.001* | ||||
| Males | 1 | 12.5 | 1 | 12.5 | 1 | 12.5 | |||||
| Anthropometric | Mean± SD | Min; Max | Mean± SD | Min; Max | Mean± SD | Min; Max | p | ||||
| Age | 70.3 ± 4.7 | 63; 78 | 70.3 ± 4.7 | 63; 78 | 70.3 ± 4.7 | 63; 78 | 0.1 | ||||
| Height (m) | 1.61 ± 5.6 | 1.56; 1.74 | 1.61 ± 5.6 | 1.56; 1.74 | 1.61 ± 5.6 | 1.56; 1.74 | 0.3 | ||||
| Body mass (kg) | 75.3 ± 13.3 | 54.7; 91.8 | 75.4 ± 13.5 | 55.1; 92.6 | 77.4 ± 12.8 | 56.7; 92.1 | 0.5 | ||||
| BMI | 28.8 ± 4.9 | 22.5, 36.3 | 28.9 ± 5.0 | 22.6, 36.6 | 29.0 ± 4.7 | 23.3, 36.4 | 0.5 | ||||
| Hemodynamic | Mean± SD | Min; Max | Mean± SD | Min; Max | Mean± SD | Min; Max | p | ||||
| Resting SBP | 132 ± 8.7 | 120; 141 | 128.0 ± 11.7 | 113; 149 | 128.5 ± 11.8 | 114; 148 | 0.1 | ||||
| Resting DBP | 80 ± 11.0 | 60; 92 | 76 ± 11.7 | 61; 91 | 75 ± 7.4 | 64; 88 | 0.4 | ||||
| Resting HR | 74 ± 8.2 | 64; 88 | 75 ± 8.1 | 62; 85 | 76 ± 4.0 | 68, 80 | 0.7 | ||||
| Frailty Status | Mean± SD | Min; Max | Mean± SD | Min; Max | Mean± SD | Min; Max | p | ||||
| Frailty Index | 0.18 ± 0.1 | 0.08; 0.33 | 0.08 ± 0.04 | 0.00; 0.23 | 0.04 ± 0.04 | 0.00; 0.10 | <0.001* | ||||
| Orthostatic Intolerance | N | % | n | % | n | % | p | ||||
| No | 5 | 62 | 7 | 87 | 8 | 100 | 0.09 | ||||
| Yes | 3 | 38 | 1 | 13 | 0 | 0 | |||||
Table 3.
Heart Rate Variability (HRV) responses in time and frequency domains at rest across frailty groups at pre-test, 8 weeks, and 12 weeks.
Table 3.
Heart Rate Variability (HRV) responses in time and frequency domains at rest across frailty groups at pre-test, 8 weeks, and 12 weeks.
| Time Domain | |||
| Pre-test | 8 weeks | 12 weeks | |
| RR | 788.2 ± 300.7 (557.0; 1019.3) |
814.2 ± 336.2 (533.2; 1095.2) |
816.4 ± 365.0 (478.8; 1153.9) |
| p(ES) | 0.9 (0.1) | 1.0 (0.1) | 1.0 (0.1) |
| SDNN | 32.3 ± 15.5 (20.4; 44.1) |
27.6 ± 8.7 (20.4; 34.9) |
27.7 ± 5.1 (23.0; 32.4) |
| p(ES) | 0.3 (0.2) | 1.0 (0.2) | 0.4 (0.2) |
| RMSSD | 22.0 ± 7.3 (16.3; 27.6) |
19.7 ± 4.0 (16.3; 23.0) |
21.1 ± 6.3 (15.3; 26.9) |
| p(ES) | 1.0 (0.01) | 1.0 (0.01) | 1.0 (0.01) |
| Frequency Domain | |||
| LF | 438.3 ± 650.7 (−61.8; 938.5) |
207.9 ± 264.5 (−13.2; 429.0) |
100.0 ± 59.1 (45.4; 154.7) |
| p(ES) | 0.7 (0.3) | 1.0 (0.3) | 0.9 (0.3) |
| HF | 915.0 ± 1818.0 (−482.4; 2312.4) |
426.4 ± 711.1 (−168.2; 1020.9) |
194.1 ± 114.2 (88.5; 299.8) |
| p(ES) | 1.0 (0.2) | 1.0 (0.2) | 1.0 (0.2) |
| LF/HF | 0.7 ± 0.4 (0.4; 0.9) |
0.7 ± 0.3 (0.4; 1.0) |
0.7 ± 0.4 (0.3; 1.0) |
| p(ES) | 1.0 (0.02) | 1.0 (0.02) | 1.0 (0.02) |
ES: Effect size, HRV: heart rate variability; RR: Average interval between consecutive heartbeats (RR-intervals); SDNN: Standard Deviation of RR intervals; RMSSD: Root Mean Square of Successive differences between RR intervals; LF: Low-Frequency power; HF: High-Frequency power; LF/HF: Low Frequency to High-Frequency power ratio: HR: heart rate.
Table 4.
Cardiac parasympathetic modulation (HR Δ 30:15) during sit-to-stand and lie-to-stand transitions across frailty groups at pre-test, 8 weeks, and 12 weeks.
Table 4.
Cardiac parasympathetic modulation (HR Δ 30:15) during sit-to-stand and lie-to-stand transitions across frailty groups at pre-test, 8 weeks, and 12 weeks.
| Cardiac Parasympathetic Modulation (CPM) | |||
| Sit-to-stand | |||
| Pre-test | 8 weeks | 12 weeks | |
| HR Δ 30:15 | 1.04|0.04 (1.02; 1.18) |
1.0|0.05 (0.93; 1.12) |
1.02|0.04 (1.0; 1.17) |
| p (ES) | 0.8 (0.01) | 1.0 (0.01) | 0.9 (0.01) |
| Lie-to-stand | |||
| Pre-test | 8 weeks | 12 weeks | |
| HR Δ 30:15 | 1.01 ± 0.06 (0.91; 1.11) |
1.04 ± 0.05 (0.94; 1.12) |
1.04 ± 0.04 (1.0; 1.12) |
| p (ES) | 0.2 (0.09) | 1.0 (0.09) | 0.6 (0.09) |
|: Interquartile range with (Minimum and Maximum). ES: effect size.
Table 5.
Cardiac Baroreceptor Gain (CBG) responses during sit-to-stand and lie-to-stand transitions across frailty groups at pre-test, 8 weeks, and 12 weeks.
Table 5.
Cardiac Baroreceptor Gain (CBG) responses during sit-to-stand and lie-to-stand transitions across frailty groups at pre-test, 8 weeks, and 12 weeks.
| Sit-to-stand | |||
| CBG (bpm/mmHg) | Pre-test | 8 weeks | 12 weeks |
| Phase 1: 30 s | 0.6|0.1 (0.4; 0.8) |
0.5|0.1 (0.4; 0.7) |
0.5|0.1 (0.4; 0.6) |
| p (ES) | 0.7 (0.6) | 1.0 (0.6) | 0.9 (0.6) |
| Phase 2: 60 s | 0.6|0.1 (0.4; 0.8) |
0.5|0.1 (0.4; 0.6) |
0.5|0.1 (0.4; 0.7) |
| p (ES) | 0.2 (0.6) | 1.0 (0.6) | 0.1 (0.6) |
| Phase 3: 180 s | 0.5|0.1 (0.4; 0.8) |
0.5|0.1 (0.4;0.7) |
0.5|0.1 (0.3; 0.6) |
| p (ES) | 1.0 (0.4) | 1.0 (0.4) | 1.0 (0.4) |
| Phase 4: 420 s | 0.6|0.1 (0.4; 0.8) |
0.5|0.1 (0.4; 0.7) |
0.5|0.1 (0.4; 0.6) |
| p (ES) | 0.7 (0.5) | 1.0 (0.5) | 1.0 (0.5) |
| Lie-to-stand | |||
| Pre-test | 8 weeks | 12 weeks | |
| Phase 1: 30 s | 0.6 ± 0.1 (0.5; 0.7) |
0.6 ± 0.1 (0.5; 0.6) |
0.6 ± 0.1 (0.5; 0.7) |
| p (ES) | 0.1 (0.1) | 0.9 (0.1) | 0.09 (0.1) |
| Phase 2: 60 s | 0.6 ± 0.1 (0.5; 0.7) |
0.6 ± 0.1 (0.5; 0.7) |
0.6 ± 0.1 (0.5; 0.7) |
| p (ES) | 0.3 (0.09) | 0.1 (0.09) | 1.0 (0.09) |
| Phase 3: 180 s | 0.6 ± 0.1 (0.5; 0.6) |
0.6 ± 0.1 (0.5; 0.6) |
0.6 ± 0.1 (0.5; 0.6) |
| p (ES) | 0.4 (0.09) | 0.2 (0.09) | 1.0 (0.09) |
| Phase: 4 420 s | 0.6 ± 0.1 (0.5; 0.6) |
0.5 ± 0.1 (0.5; 0.6) |
0.6 ± 0.1 (0.5; 0.7) |
| p (ES) | 0.5 (0.07) | 0.1 (0.07) | 1.0 (0.07) |
|: Interquartile range with (Minimum and Maximum). CBG: Cardiac Baroreceptor gain; ES: Effect size.
Disclaimer/Publisher’s Note: The statements, opinions and data contained in all publications are solely those of the individual author(s) and contributor(s) and not of MDPI and/or the editor(s). MDPI and/or the editor(s) disclaim responsibility for any injury to people or property resulting from any ideas, methods, instructions or products referred to in the content. |
© 2025 by the authors. Licensee MDPI, Basel, Switzerland. This article is an open access article distributed under the terms and conditions of the Creative Commons Attribution (CC BY) license (http://creativecommons.org/licenses/by/4.0/).
Copyright: This open access article is published under a Creative Commons CC BY 4.0 license, which permit the free download, distribution, and reuse, provided that the author and preprint are cited in any reuse.


