1. Introduction
Traumatic brain injury (TBI) is one of the leading causes of disability and even death worldwide, commonly resulting from traffic accidents, sports injuries, violence in combat zones, and falls. TBI causes neurological damage regardless of age, sex, or genetic background, and survivors of TBI often experience lasting behavioural, cognitive, and emotional changes [
1]. TBI is a complex process that involves a cascade of molecular and cellular events, leading to both immediate and delayed brain damage. Primary injury occurs immediately after the impact, while the secondary injury response develops over time, aggravating tissue damage and functional impairment. This second response includes neuroinflammation, excitotoxicity, oxidative stress, mitochondrial dysfunction, and impaired cerebral blood flow. In this context, dysfunction of the vascular system plays an important role in the progression of TBI, contributing to hemorrhage, edema and blood-brain barrier (BBB) disruption [
2]. Several studies using postmortem human tissue or mouse models have shown that the integrity of the BBB remains compromised months and even years after TBI [
3,
4]. A more comprehensive understanding of vascular repair mechanisms is needed, as it may lead to the development of new angiogenic therapies, and the development of biomarkers related to BBB status [
5]. TBI is classified from a variety of perspectives, including the classic severity score (Glasgow Coma Scale, GCS) which categorizes injuries as mild, moderate, or severe depending on the level of altered consciousness [
6]. Clinicians commonly use the GCS alongside symptoms like headache, nausea, vomiting, loss of consciousness, and amnesia to evaluate TBI patients and determine their risk for intracranial complications. Computed tomography (CT) scans are frequently used to detect and evaluate trauma-related brain lesions; however, they are expensive, involve radiation exposure, and only around 5% of cases reveal a detectable brain damage [
6]. This emphasises the importance of establishing clear criteria to determine whether a patient requires a CT scan. For this reason, many efforts have been made in the last decades to develop novel blood biomarkers to predict and monitor brain injury progression [
7] and reliably differentiate between CT-positive and CT-negative patients [
8].
The BBB is composed of different cell types including endothelial cells, pericytes, and astrocytes. Following primary injury, its permeability increases, contributing to brain edema. While part of this damage is irreversible due to endothelial cell death, dysfunction of endothelial tight junction proteins can be repaired [
9,
10]. Occludin and ZO-1 are key tight junction proteins that regulate paracellular permeability and maintain BBB integrity. Occludin contributes to barrier stability, while ZO-1 links transmembrane proteins to the cytoskeleton, coordinating junction assembly [
11]. All these processes contribute to the extravasation of peripheral immune system cells leading to increased inflammation in the injured area. Previous studies on brain injury models have suggested that tight junction proteins may be potential biomarkers of neonatal hypoxic/ischemic brain injury [
12], Alzheimer’s disease [
13] and multiple sclerosis [
14].
Thrombospondin-1 (TSP-1) is a matricellular glycoprotein that plays a crucial role in modulating cell-cell and cell-matrix interactions in different physiological processes, which include platelet aggregation, angiogenesis, synaptogenesis, dendritic cell maturation and wound healing [
15]. Following TBI, TSP-1 is implicated in three key processes: i) BBB integrity, ii) vascular remodelling and iii) synaptogenesis [
16].
Therefore, the aim of this study was to evaluate and compare the potential of TSP-1 and tight junction proteins (occludin and ZO-1) as diagnostic and prognostic biomarkers in the serum of TBI patients. Additionally, we aimed to explore the possible relationship of TSP-1, BBB disruption and tight junction proteins in the context of TBI, using the closed-head injury TBI mouse model.
3. Discussion
TBI is unpredictable, and brain damage is not always easily detectable by medical professionals and procedures. In adults, cognitive impairment and symptoms occur during the acute phase of TBI, but it typically takes 3 to 12 months to resolve [
19]. Due to uncertainties in patient prognosis and monitoring, the interest in biomarker research has increased in recent decades [
7]. Biomarkers have shown promise in the early stages of TBI and have gained attention from a therapeutic perspective, suggesting that modulating specific biomarkers may open new research opportunities in the treatment of TBI patients [
20]. The present work focuses on studying different biomarkers related to BBB integrity and angiogenesis. We identified occludin and TSP-1 as promising biomarkers for TBI diagnosis and prognosis in two different patient cohorts. Furthermore, we demonstrated that TSP-1 protein plays a key role in maintaining BBB integrity, as its absence worsens Evans blue extravasation and animal outcomes in relation to neuroinflammation and angiogenic repair after TBI. A major challenge in biomarker validation has been the focus on a single sampling time point instead of evaluating time-dependent changes [
21]. In our first cohort, samples were collected on days 1, 3, and 7 after injury, offering us an advantage over other single time point studies. In this study, S100β was detected at all time points evaluated, yet it was only significantly increased 1 day after TBI (
Figure 1A). These results are in line with a study of 154 patients that showed that the maximum release of this protein occurs approximately 27 hours after injury [
22]. Regarding the prognosis, we also observed significant differences in serum S100β1d levels when patients were classified according to their 6-month outcome (
Figure 1B), suggesting that our cohort is representative of this pathology.
The first new protein examined as a potential biomarker was TSP-1, chosen for its role in regulating important processes such as angiogenesis, inflammatory responses, and tissue repair [
16]. Previous work from our group demonstrated that TLR4 activation following TBI increases TSP-1 release, which contributes to synaptic recovery days after injury [
23]. Our results showed a statistically significant decrease in TSP-1 levels in TBI patients at all time points compared to controls, regardless of the measurement time or injury severity. However, when patients were stratified by prognosis (GOSE at 6 months), TSP-1 levels at day 1 post-injury were significantly higher in patients with poor outcome than in those with good outcome (
Figure 2C). The AUC of the ROC curve was 0.7483, suggesting an acceptable discrimination ability. These findings suggest that TSP-1 could serve as potential prognostic biomarker for TBI outcomes in clinical practice. These promising results need further validation in larger cohorts to confirm its biomarker potential.
Accurate diagnosis of TBI, as well as prognosis, is important to ensure proper medical care and avoid unnecessary radiation exposure from imaging tests such as CT scan. At the same time, it prevents patients' symptoms from being underestimated [
24]. This issue is crucial in cases of mild TBI, as subtle or nonspecific symptoms may appear. The first protein evaluated as a potential diagnostic biomarker to discriminate patients with abnormal CT scans was TSP-1. These patients showed a slight trend toward reduced TSP-1 levels, but without statistical differences. These data suggest that TSP-1 does not correlate with CT scan results in mild TBI patients. TSP-1 is involved in brain repair and synaptogenesis after injury, so it may be associated with long-term effects rather than acute-phase lesions [
25]. We analysed occludin using the same approach as in the first cohort. The results showed that occludin could differentiate between patients with normal and abnormal CT scans, suggesting its potential as a diagnostic biomarker. The ROC curve showed acceptable discrimination (AUC = 0.693). As the mild TBI cohort included only a small number of patients with abnormal CT (approximately 10% of patients), these promising data need to be further explored in larger cohorts. Tight junction proteins such as ZO-1 and occludin play a crucial role in maintaining the integrity of the BBB by limiting diffusion between endothelial cells [
26]. In healthy individuals, ZO-1 was detected in the blood, whereas occludin was barely detectable, indicating that its role is more brain-specific compared to ZO-1. In TBI patients, both proteins showed significantly higher levels at all time points compared to controls. However, no significant differences were observed when patients were stratified by injury severity. When analyzing patients based on prognosis, serum occludin levels at 1 and 7 days after injury were higher in patients with poor outcome. The AUC of the ROC curves were 0.9286 for occludin1d and 0.9038 for occludin7d, indicating a very good discrimination at both time points. Our results are consistent with those obtained in other brain injuries such as hypoxic/ischemic brain injury [
27] and Alzheimer’s disease [
28], in which tight junctions proteins claudin-V, occludin and ZO-1 have demonstrated a role as promising biomarkers for cerebrovascular dysfunction.
Choosing an animal model for TBI research is challenging due to the complexity and variability of human traumatic brain injury and its underlying causes. To date, no model fully recapitulates human biomechanical mechanisms of TBI [
29]. Our model was characterized by increased mRNA levels of pro-inflammatory cytokines, I1b and Tnfa, as well as the vascular growing factor Vegf in the affected area, confirming localized injury. TSP-1 KO mice showed significantly higher Evans blue extravasation than WT animals 24 hours after injury, suggesting that TSP-1 plays a critical role in maintaining BBB integrity, consistent with other TBI models [
30]. To further investigate the status of the BBB, we measured occludin and ZO-1 serum levels. While ZO-1 levels barely changed in WT animals after injury, they remained significantly elevated in TSP-1 KO mice, supporting the findings on BBB integrity. However, occludin levels remained elevated after TBI without significant genotypic differences. These findings, together with BBB integrity experiments, highlight the role of TSP-1 in BBB permeability and correlate with the results obtained with patient serum.
TSP-1 deficiency is associated with a proinflammatory gene profile, leading to an exaggerated response to injury compared to WT animals. TSP-1 has both anti- and pro-inflammatory properties as it interacts with various receptors, suggesting a dual role in inflammation [
16]. TSP-1 binding to CD36 and CD47 receptors inhibits inflammation by blocking leukocyte activation and adhesion to the endothelium. In vitro wound healing models have shown that TSP-1 deficiency prolongs inflammation by delaying wound closure, although it can also reduce transforming growth factor-β (TGF-β) activation, which is known for its anti-inflammatory and tissue repair effects [
31]. On the other hand, when analyzing angiogenic and vascular repair markers after TBI, we observed that Vegf mRNA levels increased in injured WT animals, whereas in TSP-1 KO, Vegf levels remained unchanged despite being inherently elevated at baseline (
Figure 7E). Despite the exacerbated inflammatory response observed in these animals, it does not correlate with an additional VEGF increase (
Figure 7E). This lack of VEGF upregulation in TSP-1 KO mice is somewhat unexpected, as injury-induced angiogenesis is often accompanied by elevated VEGF levels [
32]. TSP-1 is known to regulate VEGF signalling through multiple mechanisms, including inhibition via its receptors CD36 and CD47, which can block downstream VEGF signalling. Additionally, it has been described that TSP-1 can sequester VEGF directly, thereby modulating its availability and bioactivity [
33,
34]. However, in our model, VEGF levels remained unchanged, suggesting a more complex interaction or potential compensatory mechanisms that limit its expression. As Evans Blue extravasation was not increased in naïve TSP-1 KO, we cannot assume that these animals have a basal increased BBB permeability. Instead, we hypothesize that their vascular structure and angiogenic repair capacity are inherently compromised, making them more susceptible to BBB disruption and enhanced secondary damage following TBI. The variation in VEGF and the role of TSP-1 may therefore influence and determine the progression of acute TBI response, justifying its potential utility as a biomarker in this context, although further investigation is needed to understand the exact mechanism of TSP-1.
Despite the exacerbated inflammatory response observed in these animals, it does not correlate with an additional Vegf increase. As Evans Blue extravasation was not increased in naïve TSP-1 KO we cannot assume that these animals have a basal increased BBB permeability. Instead, we hypothesize that their vascular structure and angiogenic repair capacity are inherently compromised, making them more susceptible to BBB disruption and enhanced secondary damage following TBI. The variation in Vegf and the role of TSP-1 may therefore influence and determine the progression of acute TBI response, justifying its potential utility as biomarker in this context, although further investigation is needed to understand the exact mechanism of TSP-1.
4. Materials and Methods
4.1. Human Samples
Study 1. The human samples were collected during an observational prospective cohort study carried out at the Department of Neurosurgery of Hospital Universitario La Paz (Madrid, Spain) between April 2017 an October 2018. Patients were included in accordance with the following criteria: age between 18 and 85 years, hospital admission with a diagnosis of closed-head injury, presentation within 24 h of injury, and admission to either the Intensive Care Unit or the Neurosurgery Ward. Exclusion criteria included a history of previous neurological disease or cognitive impairment, as well as the inability to undergo head CT, to provide a biological sample, or to complete a proper follow-up. Venous blood samples were obtained at 1, 3 and 7 days after suffering TBI (PI-2153).
Study 2. The human samples were collected during an observational prospective cohort study at the Hospital de Vall D’Hebron (Barcelona, Spain) (PR(AG)195/2012 y PR(CS)27/2019). The samples were collected 24 hours after the TBI and were stratified according to whether the CT scan imaging result was pathological or not.
4.2. Animals
C57Bl6/J (RRID: IMSR_JAX:000664) mice, approximately 3 months old (25-30 g), were obtained from the inhouse colony at the animal facilities of Universidad Autónoma de Madrid (UAM, Madrid, Spain). TSP-1 KO (RRID: IMSR_JAX:006141) mice were kindly provided by M. J. Calzada (Instituto de Investigación Biomédica del Hospital La Princesa, Madrid, Spain). Animals were housed in cages of four at 21 °C with a 12 h light/dark cycle and ingested water and food ad libitum. All animal experimentation was performed under the license PROEX 109/18 granted by the Ethics Committee of Universidad Autónoma de Madrid (Madrid, Spain) and in compliance with the Cruelty to Animals Act, 1876, and the European Community Directive, 86/609/EEC. Every effort was made to minimize stress to the animals.
4.3. Traumatic Brain Injury Model
Mice were subjected to the closed-head injury (CHI) model in which, after being anesthetized with inhaled isoflurane, the head of the animal was immobilized and exposed to a free-fall 50 g weight dropped from a height of 34 cm. This procedure is adapted from Flierl et al. 2009 [
35]. After the injury, mice were closely monitored in an individual cage and oxygen was administered until regular breath was restored. This model produces a severe TBI, characterized by a strong inflammatory response and a 5-15% mortality rate. Mice were divided in 2 groups: naïve (no subjected to CHI) and TBI (subjected to CHI).
4.4. Blood-Brain Barrier Integrity Assessment
Evans Blue tracer (Sigma-Aldrich, Madrid, Spain) was diluted at 2% in saline and administered via intraperitoneal injection (3 mL/kg; i.p.) immediately after CHI. Animals were sacrificed 24 h after trauma and brains were gently extracted and sectioned in four 2 mm slices using a mouse brain slicer. Each slice was scanned, and the total area of Evans Blue extravasation was quantified using ImageJ 1.52e software (ImageJ software, National Institutes of Health, Stapleton, NY, USA). Results were represented as total extravasation volume (mm3).
4.5. Tissue Preparation
For transcriptional changes analysis, animals were terminally anesthetized 24 h after TBI with a mix of ketamine:xylacine 1:2 (Ketolar 50 mg/mL, Pfizer, NY, USA; Xilagesic 20 mg/mL, Calier Labs, Barcelona, Spain) and then rapidly transcardially perfused with 0.9% NaCl buffer. Brains were gently removed and a punch of the right (ipsilateral) and left (contralateral) hemispheres were snap frozen and stored at −80 °C until use. RNA and protein were obtained by double-extraction protocol with Trizol reagent (TRI Reagent, Molecular Research Center, Inc., Cincinnati, USA) according to the manufacturer’s instructions.
4.6. ELISA assay
Human blood was used to determine the levels of S100β (Diasorin, Saluggia, Italy), TSP-1 (R&D Systems, Minneapolis, USA), occludin (Elabscience, Texas, USA) and ZO-1 (Elabscience, Texas, USA) using a specific ELISA assay, following the manufacturer protocol. Mice were perfused with 0.9% saline solution and blood was collected in tubes, which were kept at 4 °C overnight to allow blood to clot. Afterward, the tubes were centrifuged at 1500 rpm for 10 minutes at 4 °C, and the serum was collected.
4.7. Quantitative Real-Time Polymerase Chain Reaction (qRT-PCR)
Following the extraction of RNA, the amount and quality of each sample were determined by measuring the optical density using the NanoDrop 2000c spectrophotometer (Thermo Scientific, Waltham, MA, USA). Subsequently, cDNA synthesis was performed using the High-Capacity iScript cDNA Synthesis Kit (BIO RAD, Hercules, CA, USA). Primer and probe sets were designed using the NCBI Nucleotide tool, and their sequences can be found in
Table 1. For qRT-PCR, the samples were analyzed in duplicate using SYBR green dsDNA-intercalating fluorescent dye (TB Green Premix, Takara #RR420L) in a QuantStudio5 Real-Time PCR system (Applied Biosystems). The PCR cycling conditions involved an initial step of 10 minutes at 95 °C, followed by 10 seconds at 95 °C and 30 seconds at 60 °C for 40-45 cycles. To quantify the results, the double delta Ct method was employed, with normalization of the Ct values using WT-Naïve values. The gene expression data were further normalized to the 18S housekeeping gene and presented as arbitrary units.
Table 3.
Oligonucleotide Primer Sequences for qPCR/PCR.
Table 3.
Oligonucleotide Primer Sequences for qPCR/PCR.
| Gene |
Forward primer |
Reverse primer |
| 18s |
5′-CGCCGCTAGAGGTGAAATTCT-3′ |
5′-CATTCTTGGCAAATGTCTTTCG-3′ |
| Ccl2 |
5′-ACAAGAGGATCACCAGCAGC-3′ |
5′-GGACCCATTCCTTCTTGGGG-3′ |
| Nlrp3 |
5′-GCCCAAGGAGGAAGAAGAAG-3′ |
5′-TCCGGTTGGTGCTTAGACTT-3′ |
| Il1b |
5′-AACCTGCTGGTGTGTGACGTTC-3′ |
5′-CAGCACGAGGCTTTTTTGTTGT-3′ |
| Tnfa |
5′-GCCTCTTCTCATTCCTGCTTG-3′ |
5′-CTGATGAGAGGGAGGCCATT-3′ |
| Vegf |
5’- CCACGTCAGAGAGCAACATCA-3’ |
5’-TCATCTCTCCTATGTGCTGGCTTT-3’ |
4.7. Statistical Analyses
Data are presented as means ± standard error of the mean (SEM), with the number of independent experiments and the statistical analysis used specified in each figure. The Kolmogorov-Smirnov test was used to assess population distribution. When the data did not follow a normal distribution, non-parametric tests (Kruskal-Wallis with post hoc pairwise comparisons using Dunn's test) were used. When normality was assumed, one-way or two-way analysis of variance (ANOVA) was performed, depending on the experiment and followed by a Bonferroni post hoc test. For comparisons between two groups, data was analyzed using Student's t-test when normally distributed, and the Mann-Whitney U test was used if the data did not meet the assumptions for parametric analysis. Statistical analysis and graphical representation were performed using GraphPad Prism 8 software.
Author Contributions
“Conceptualization, J.E. and A.B.L-R.; methodology, J.E., V.F-A., I.V. and C.D-P.; formal analysis, I.V and A.B.L-R..; investigation, C.D-P., I.V., M.A-R., E.M-C., J.R.C., M.T-L., A.P. and E.F-Y.; resources, J.E., B.J.H., A.G-R. and J.M.; data curation, A.B.L-R., A.G-R. and M.J.C.; writing—original draft preparation, J.E., C.D-P. and I.V.; writing—review and editing, A.B.L-R., M.J.C, J.M. and B.J.H.; visualization, C.D-P., E.M-C., and I.V.; supervision, J.E., J.M. and A.G-R.; project administration, J.E.; funding acquisition, J.E. All authors have read and agreed to the published version of the manuscript.” Please turn to the CRediT taxonomy for the term explanation. Authorship must be limited to those who have contributed substantially to the work reported.
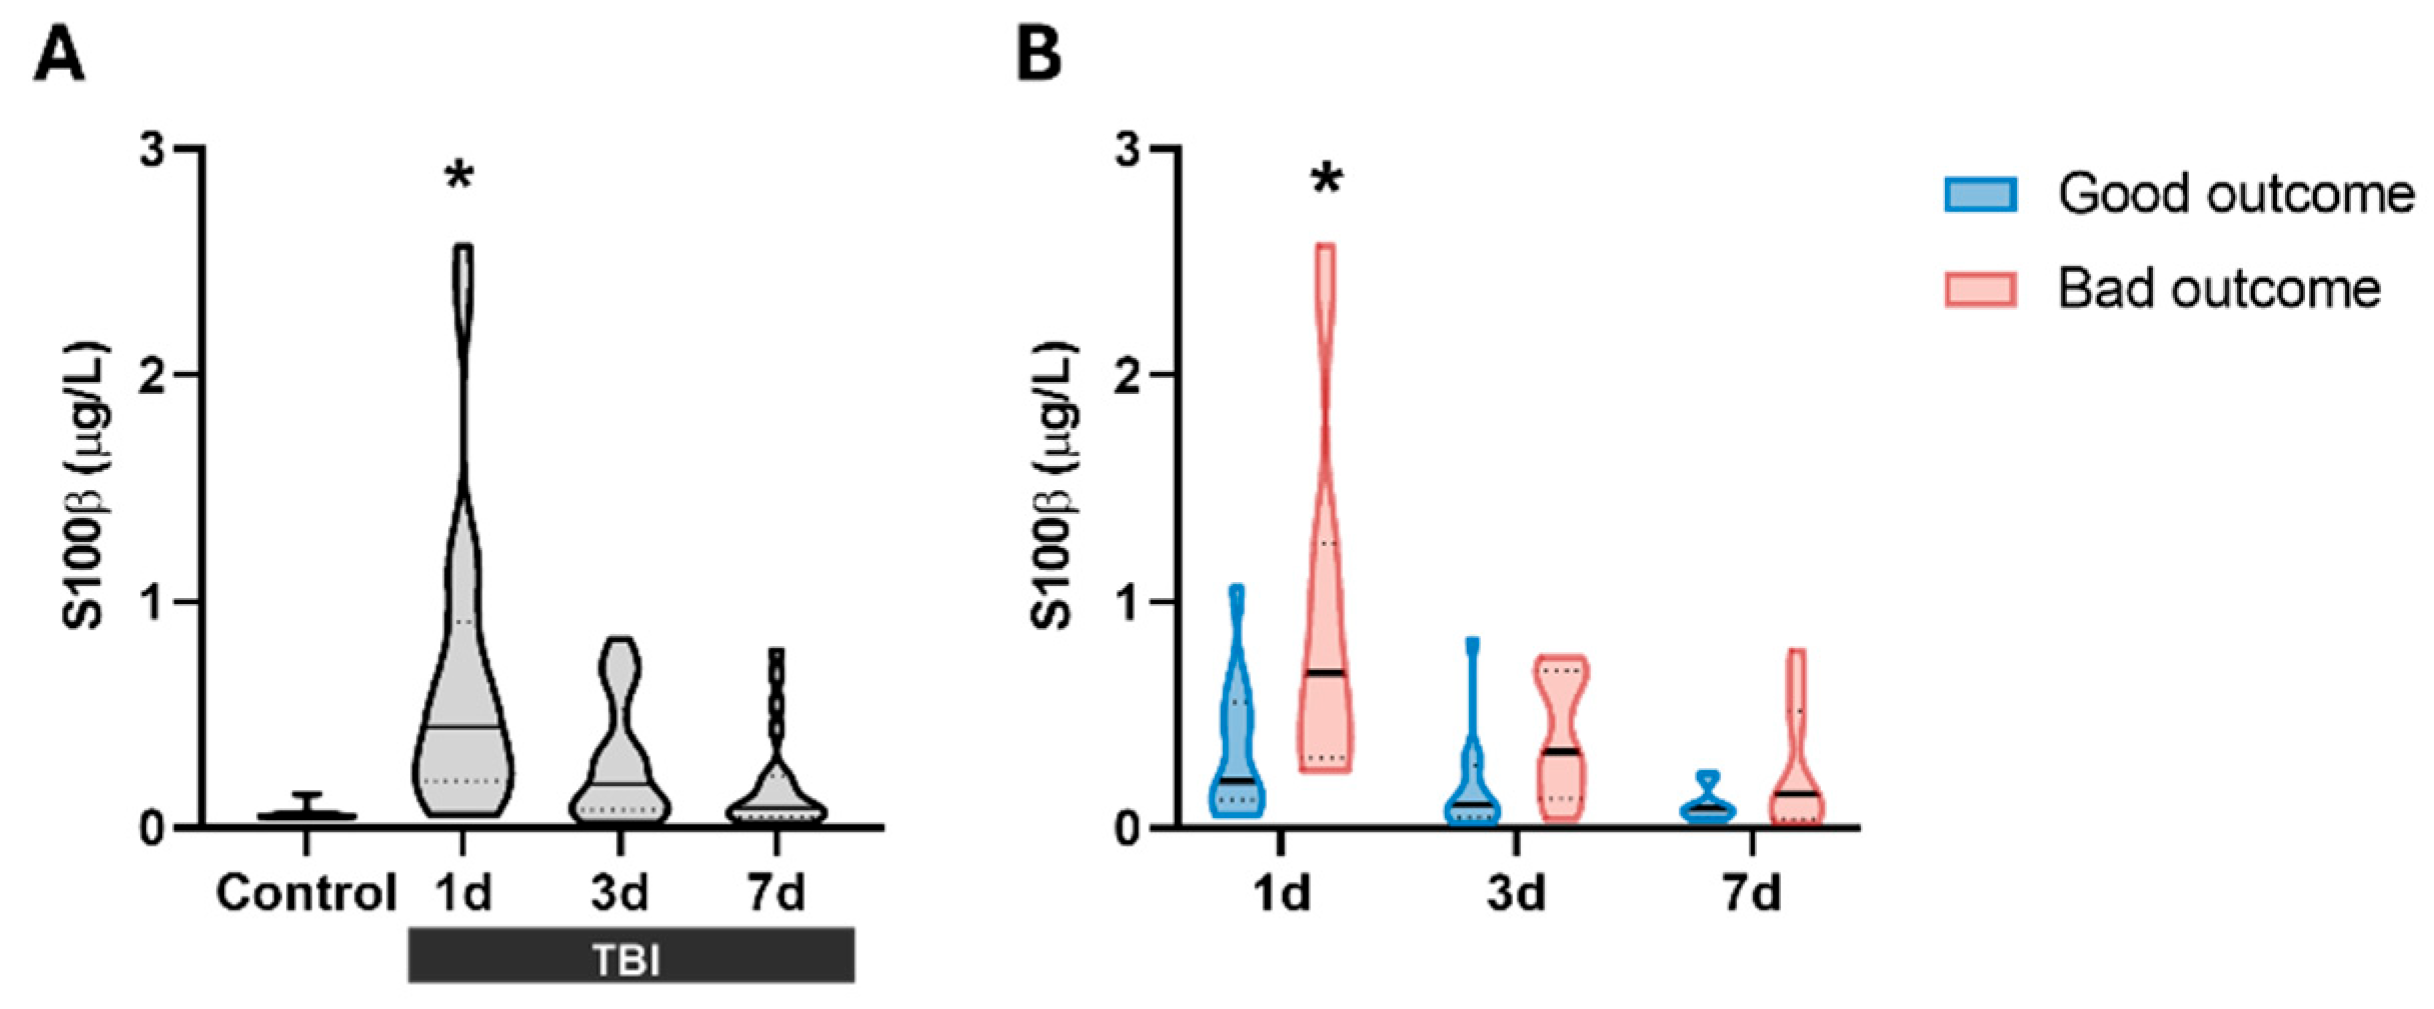
Figure 1.
S100β levels in the serum of patients. (A) S100β significantly increases at 1 day after TBI (n = 23) compared to control subjects, but not at 3 days (n = 23) or 7 days (n = 21) compared to control subjects (Control group, n = 7). *p < 0.05 vs Control, Kruskal-Wallis with Dunn's post-hoc. (B) S100β levels stratified by prognosis at 6 months based on GOSE scale. At 1-day post-TBI, S100β levels were significantly higher in patients with bad outcome (n = 12) compared to those with good outcome (n = 11). No significant differences were observed at later time points. *p < 0.05 vs Good Outcome at the same time point, Two-way ANOVA with Bonferroni post-hoc. Data are presented as the median with the interquartile range.
Figure 2.
TSP-1 levels in the serum of patients and its correlation with prognosis. (A) TSP-1 levels in all patients compared to the control group. TSP-1 significantly decreases at all three measured times, 1 day (n = 24), 3 days (n = 24), and 7 days (n = 22) after TBI compared to control subjects (n = 24). (B) TSP-1 levels in patients classified into two groups according to the severity of their injury based on the GCS scale (mild and severe TBI). TSP-1 levels were always significantly lower and did not correlate with severity at any of the times. *p < 0.05 vs Control, One-way ANOVA followed by Bonferroni post-hoc. (C) TSP-11d values were significantly higher in the poor prognosis group. #p < 0.05 vs good prognosis. To see the effect of prognosis at different times, t-test was performed between each time separately. (C) ROC curve for TSP-11d levels to predict possible differences between the bad outcome group (n = 11) and the bad outcome group (n = 13). The red dot represents the value with the highest Youden index on the curve. Data are presented as the median with the interquartile range.
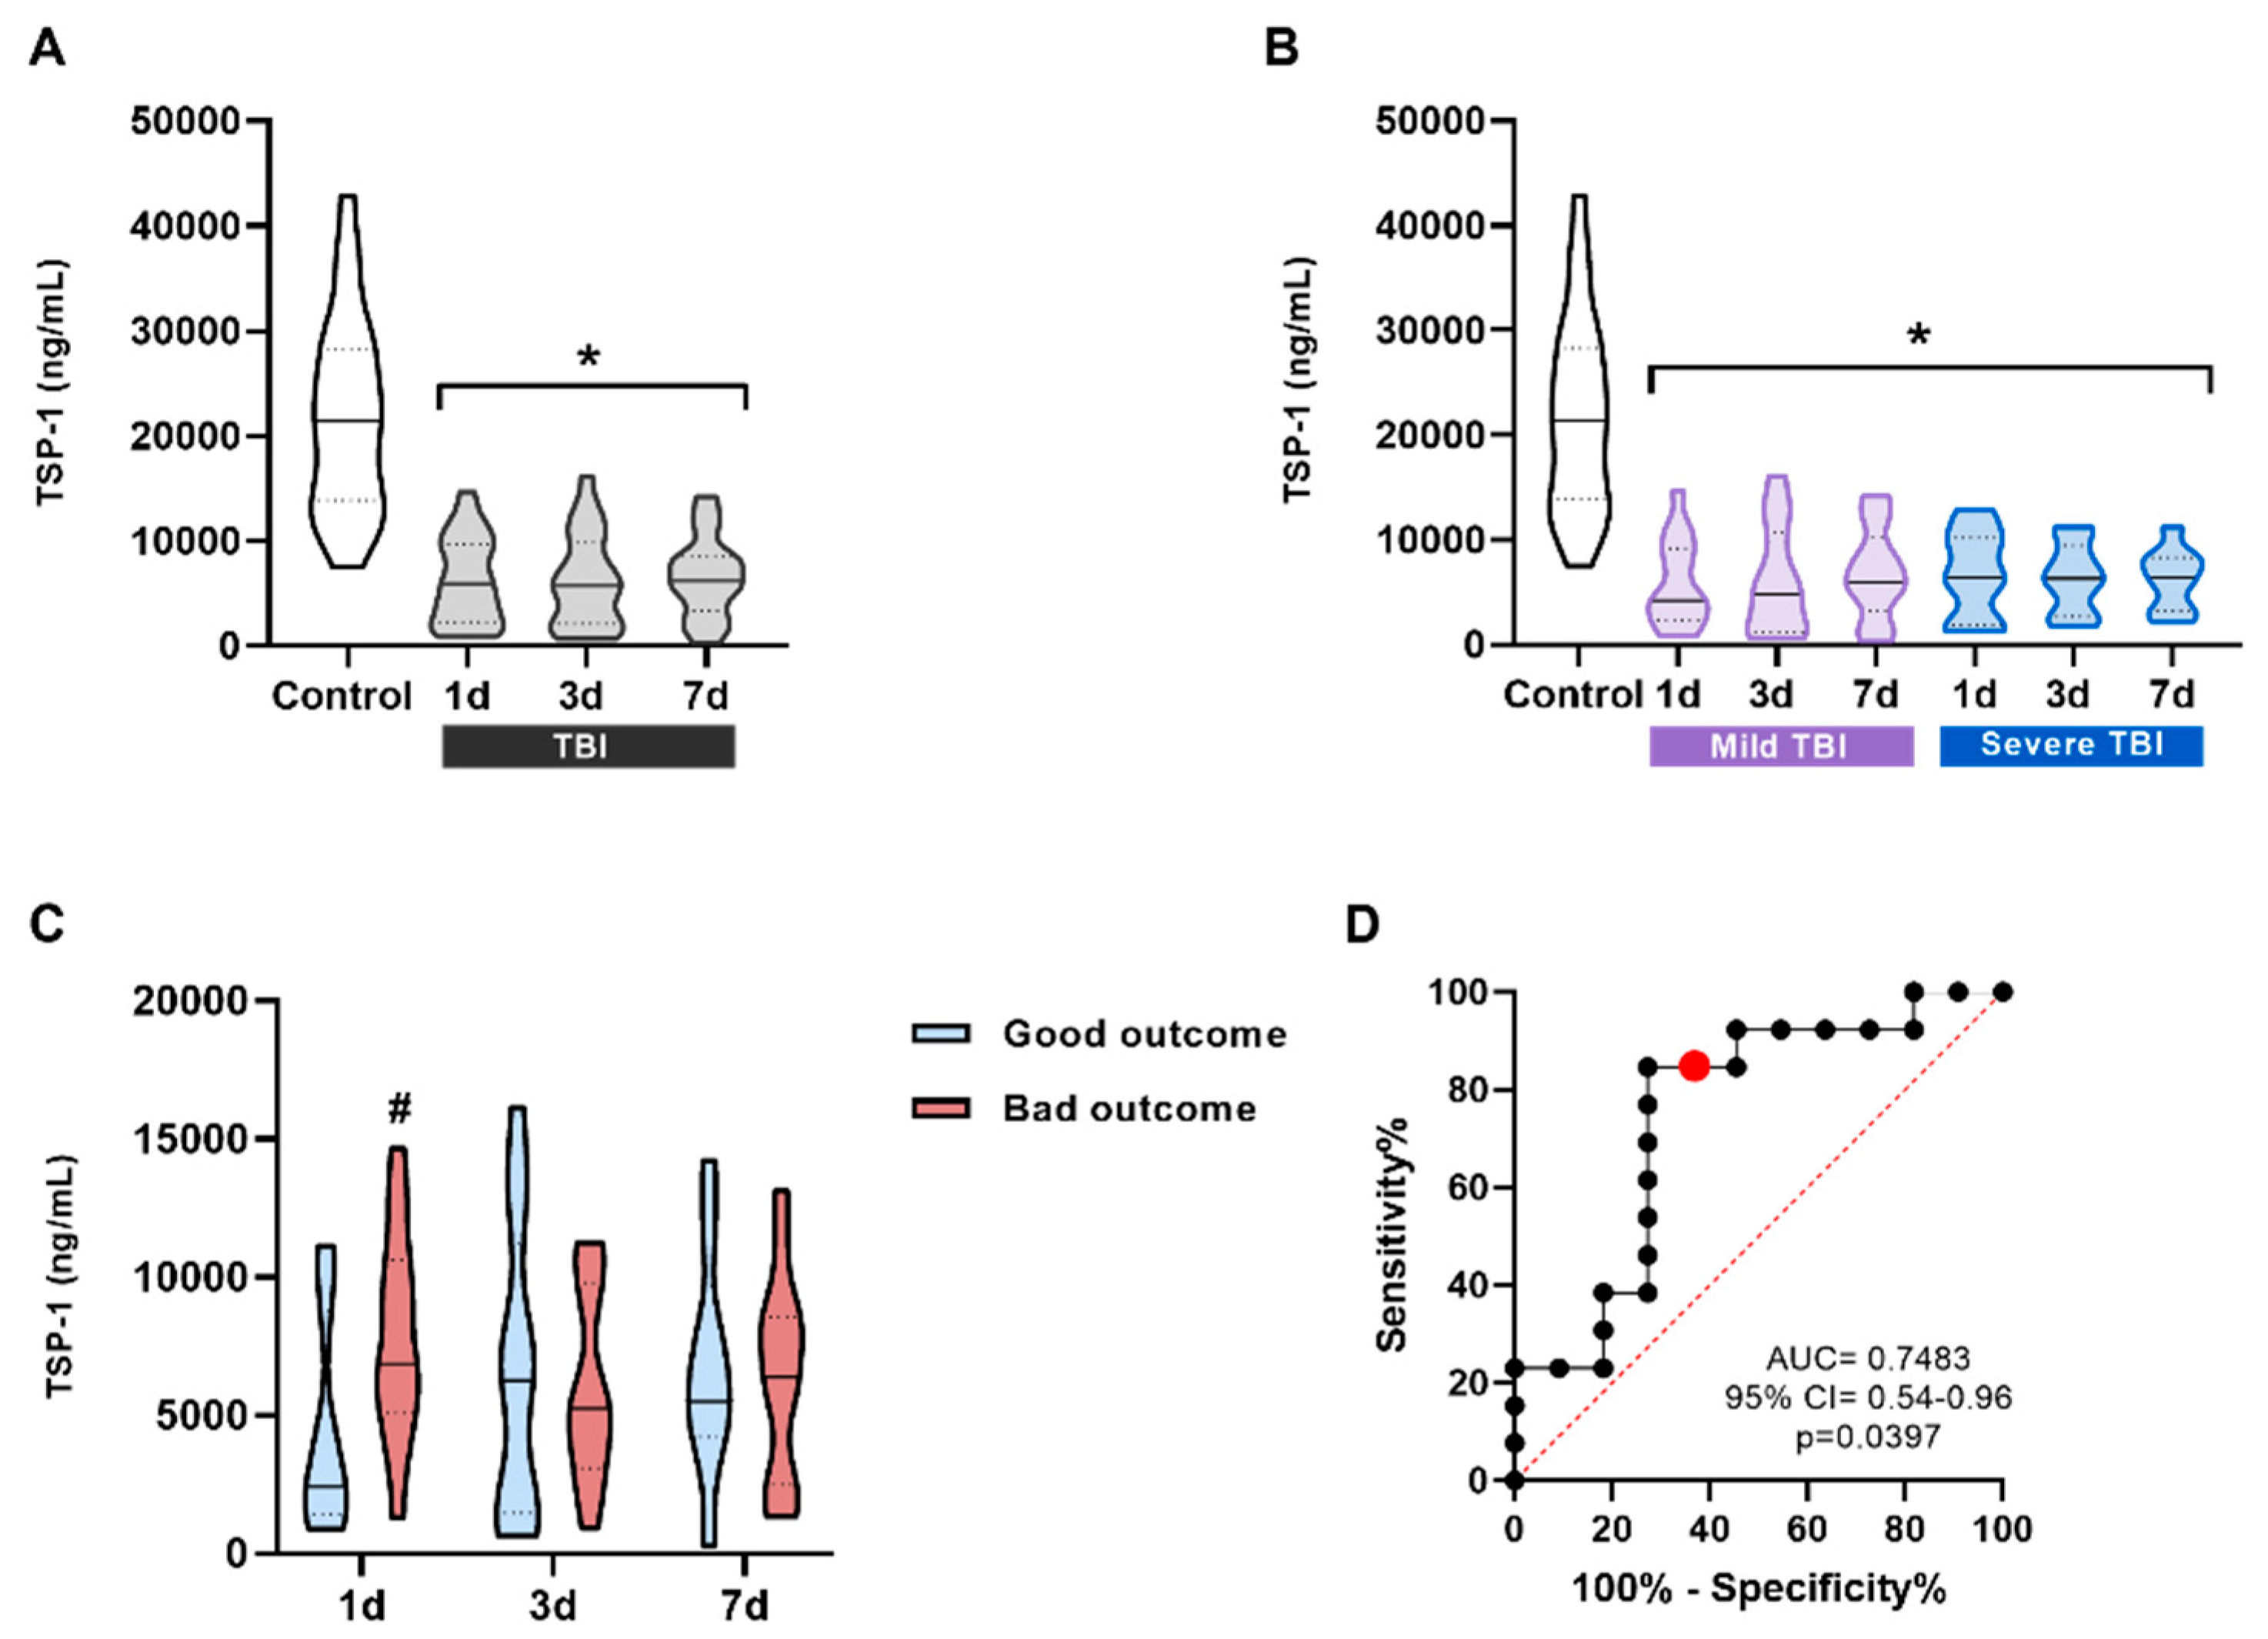
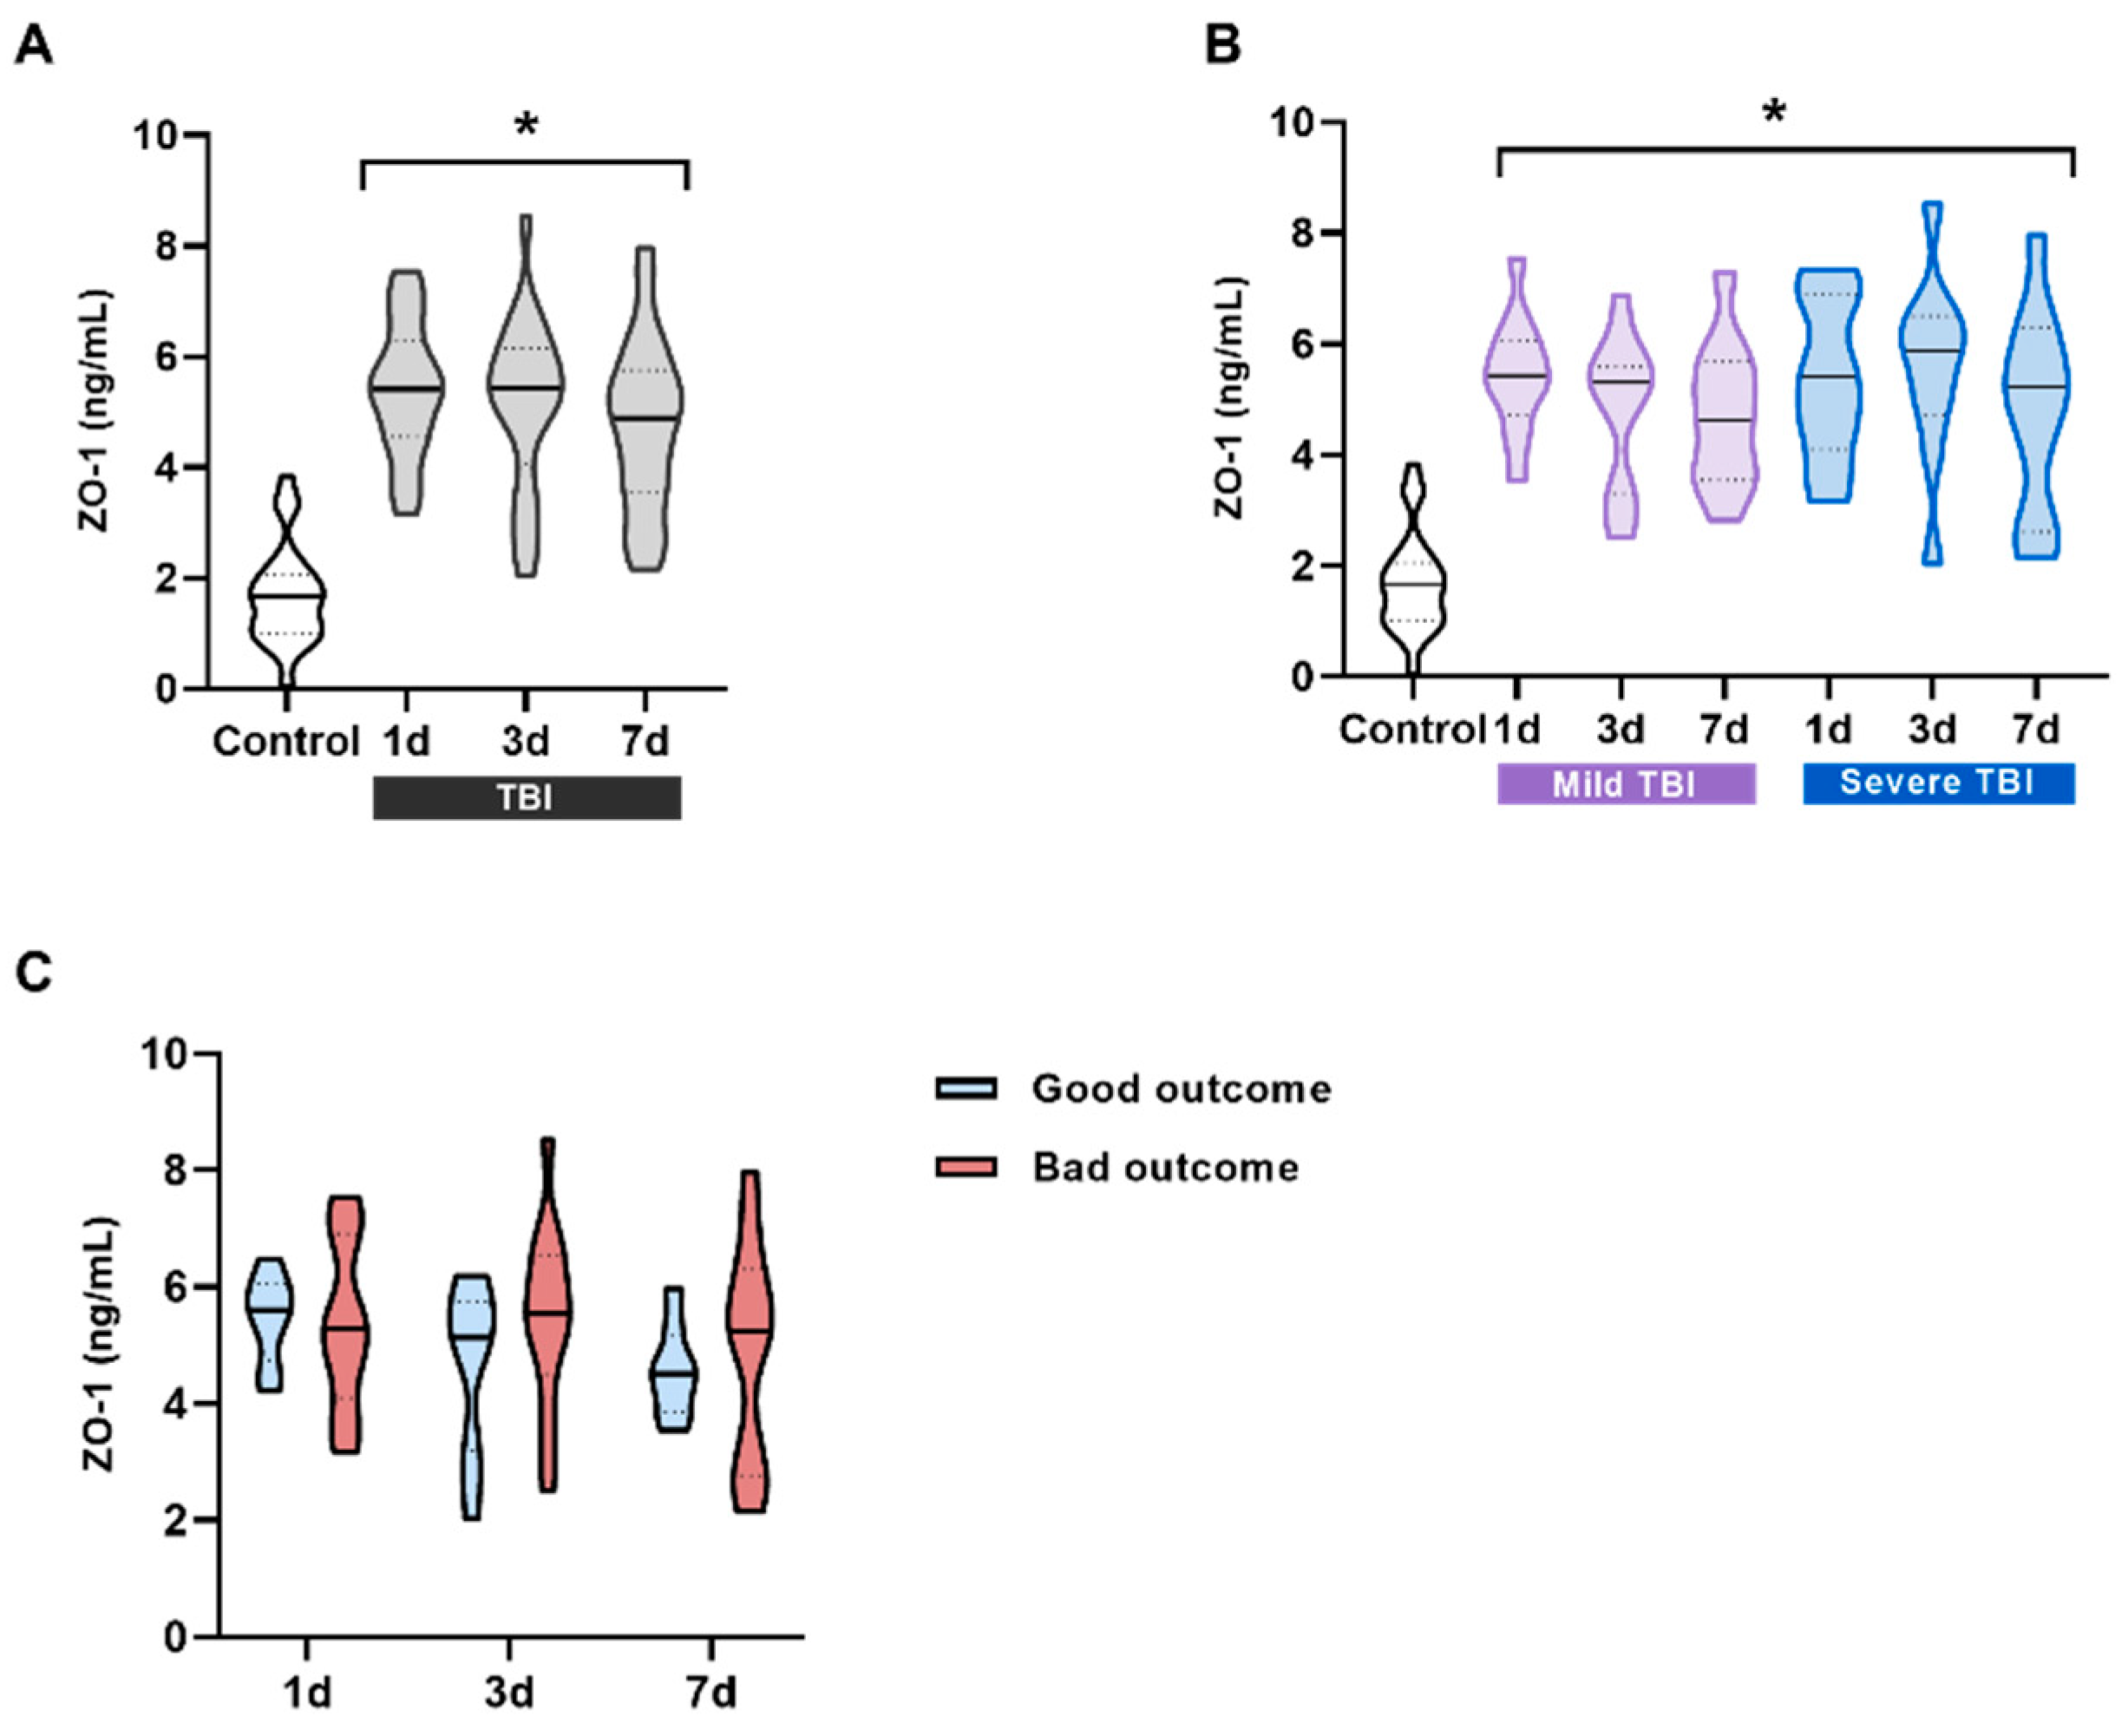
Figure 3.
ZO-1 levels in the serum of patients and its correlation with prognosis. (A) ZO-1 serum levels in all patients compared to the control group. ZO-1 significantly increases at all three measured times, 1 day (n = 21), 3 days (n = 23), and 7 days (n = 22) after TBI compared to control subjects (n = 23). *p < 0.05 vs Control, One-way ANOVA followed by Bonferroni post-hoc. (B) Patients were classified into two groups according to the severity of their injury based on the GCS scale (mild and severe TBI). ZO-1 levels were always significantly higher and did not correlate with severity at any of the times. *p < 0.05 vs Control, One-way ANOVA followed by Bonferroni post-hoc. (C) No significant differences were observed between the ZO-1 values at different times for patients with good/bad outcome. Data are presented as the median with the interquartile range.
Figure 4.
Occludin levels in the serum of patients and its correlation with prognosis. (A) Occludin significantly increases at all three measured times, 1 day (n = 19), 3 days (n = 22), and 7 days (n = 22) after TBI compared to control subjects (n = 23). *p < 0.05 vs Control, Kruskal-Wallis analysis with Dunn's post-hoc. (B) Patients were classified into two groups according to the severity of the injury based on the GCS scale (mild and severe TBI). Occludin levels were always significantly lower and did not correlate with severity at any of the times. *p < 0.05 vs Control, Kruskal-Wallis analysis with Dunn's post-hoc. (A) Occludin1d and occludin7d levels were significantly higher in the bad outcome group (1-day, n = 12 and 7-days n = 13) compared to the good outcome group (1-day, n = 7 and 7-days n = 8) at the same time points. *p < 0.05 vs good outcome. To assess the effect of prognosis at different times, a t-test was performed between each time point separately. (B) ROC curve for occludin1d levels to predict possible differences between the good and the bad outcome groups. (C) ROC curve for occludin7d levels to predict possible differences between the good and the bad outcome groups. The red dot represents the value with the highest Youden index on the curve. Data are presented as the median with the interquartile range.
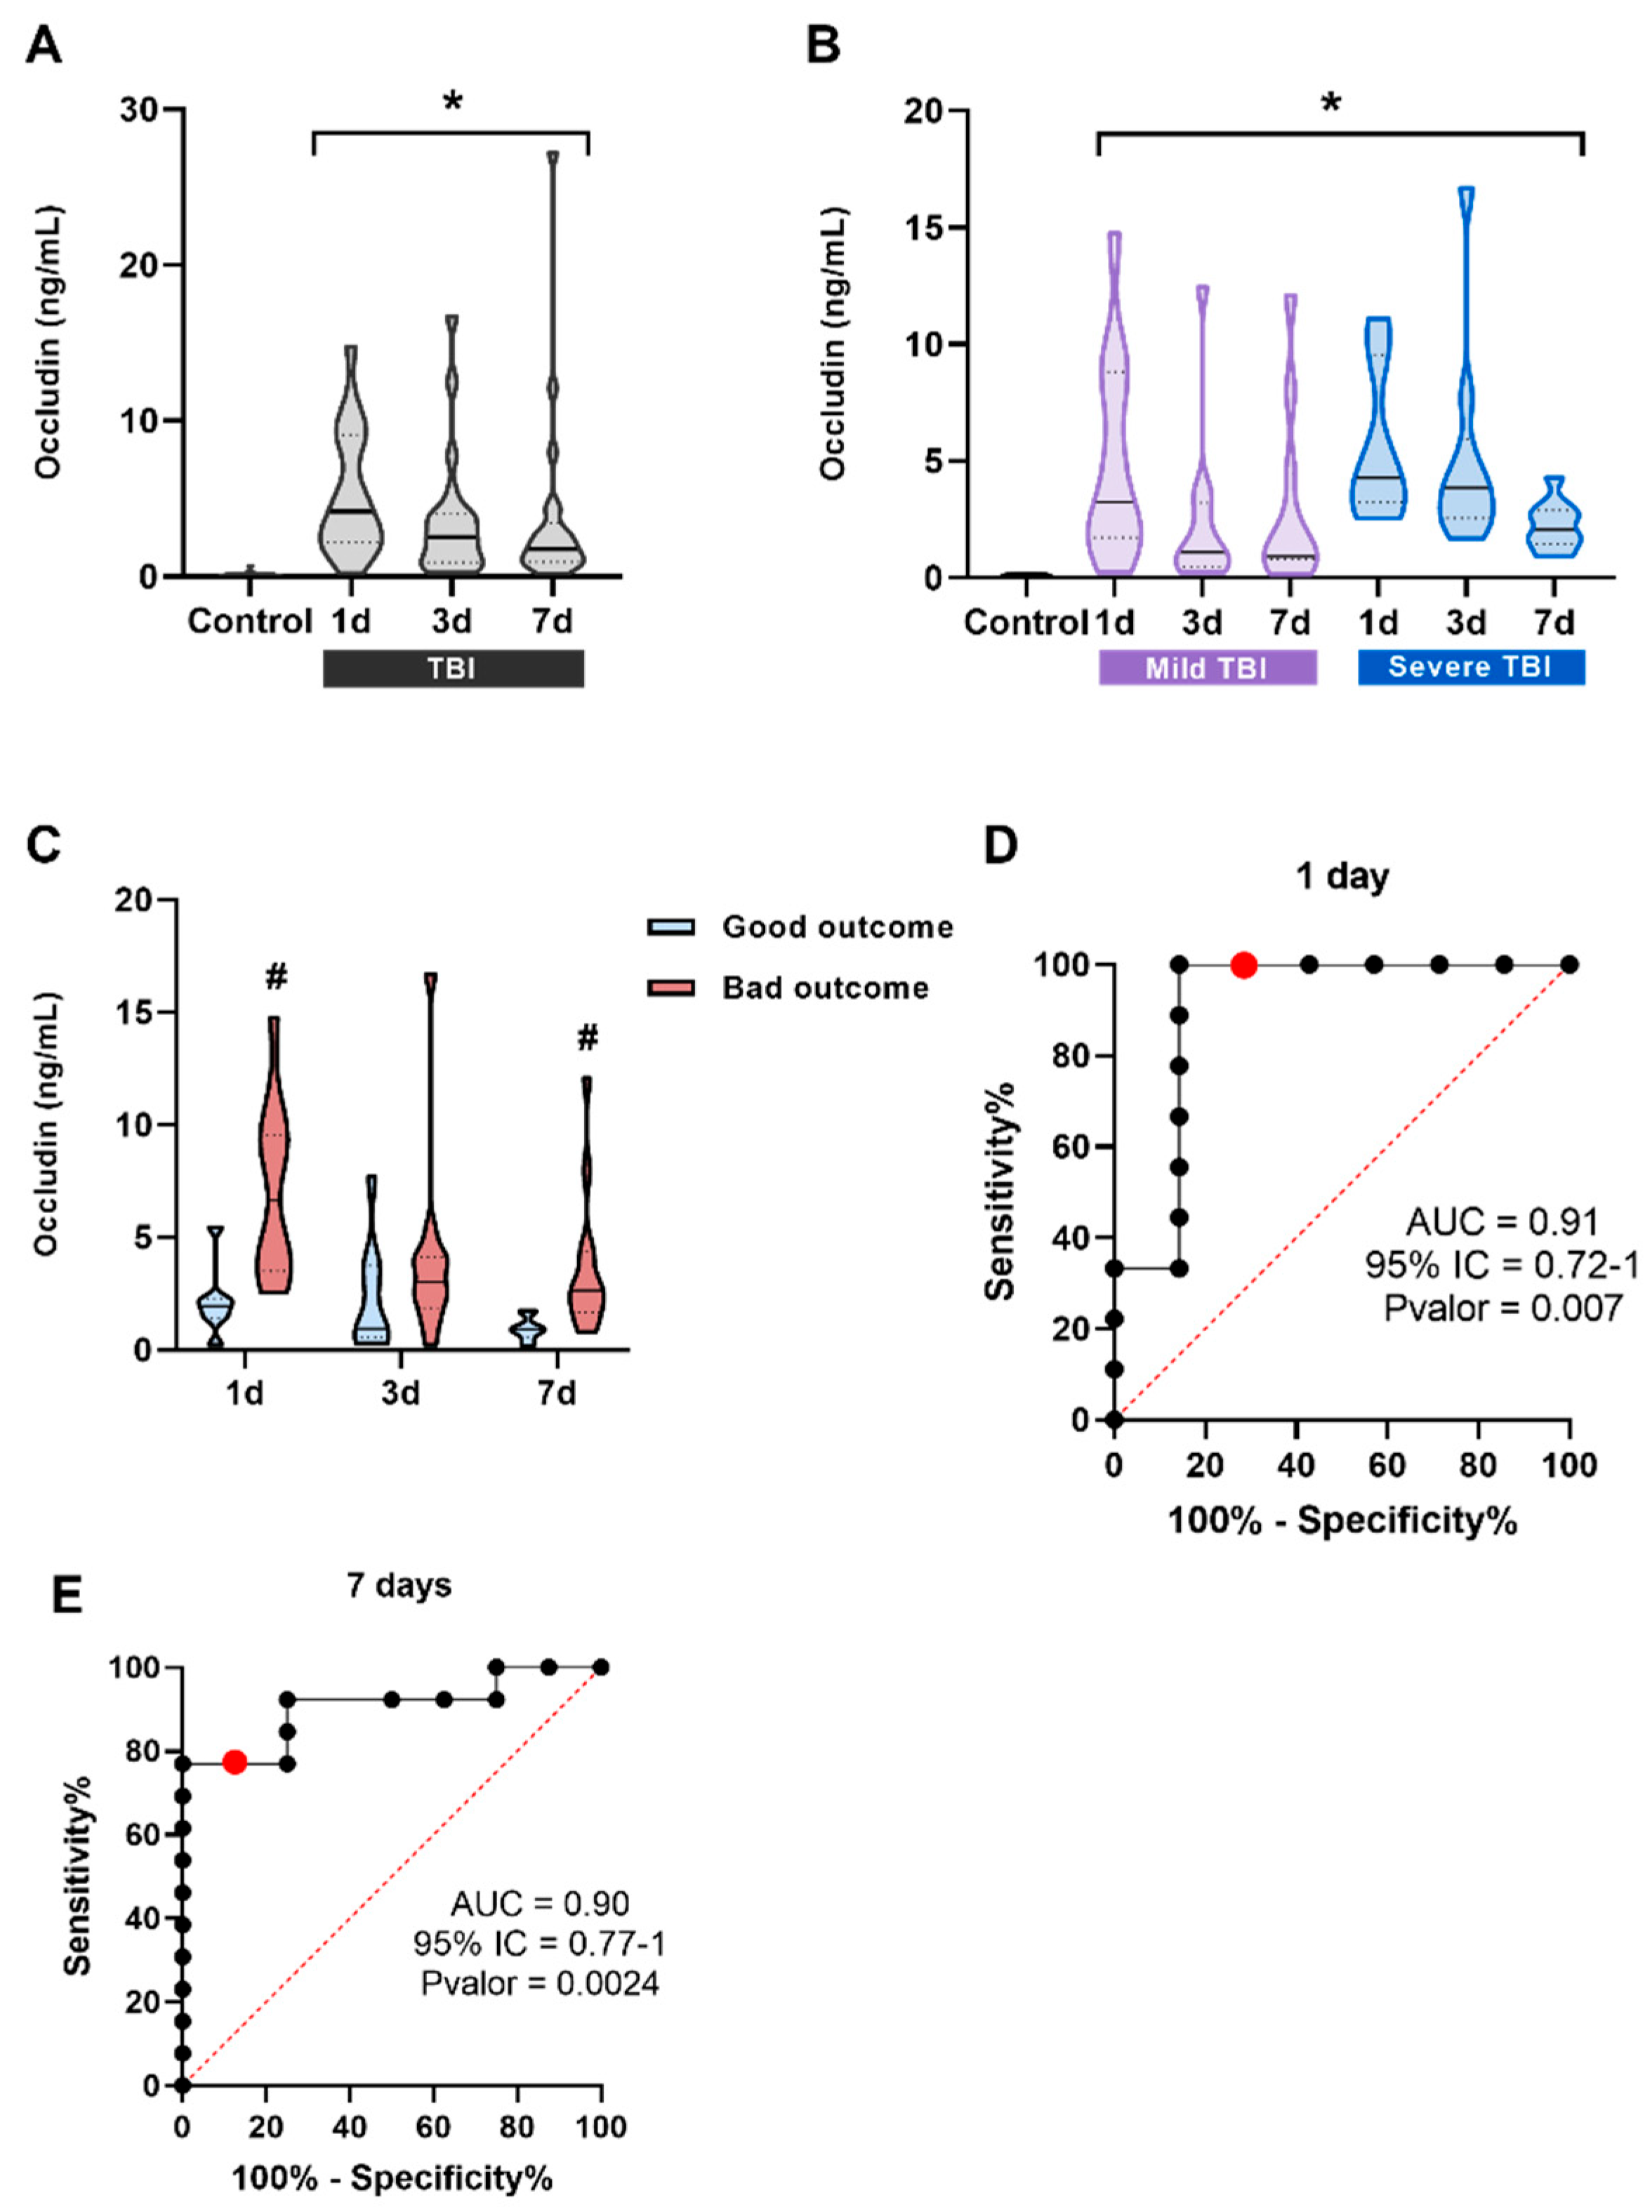
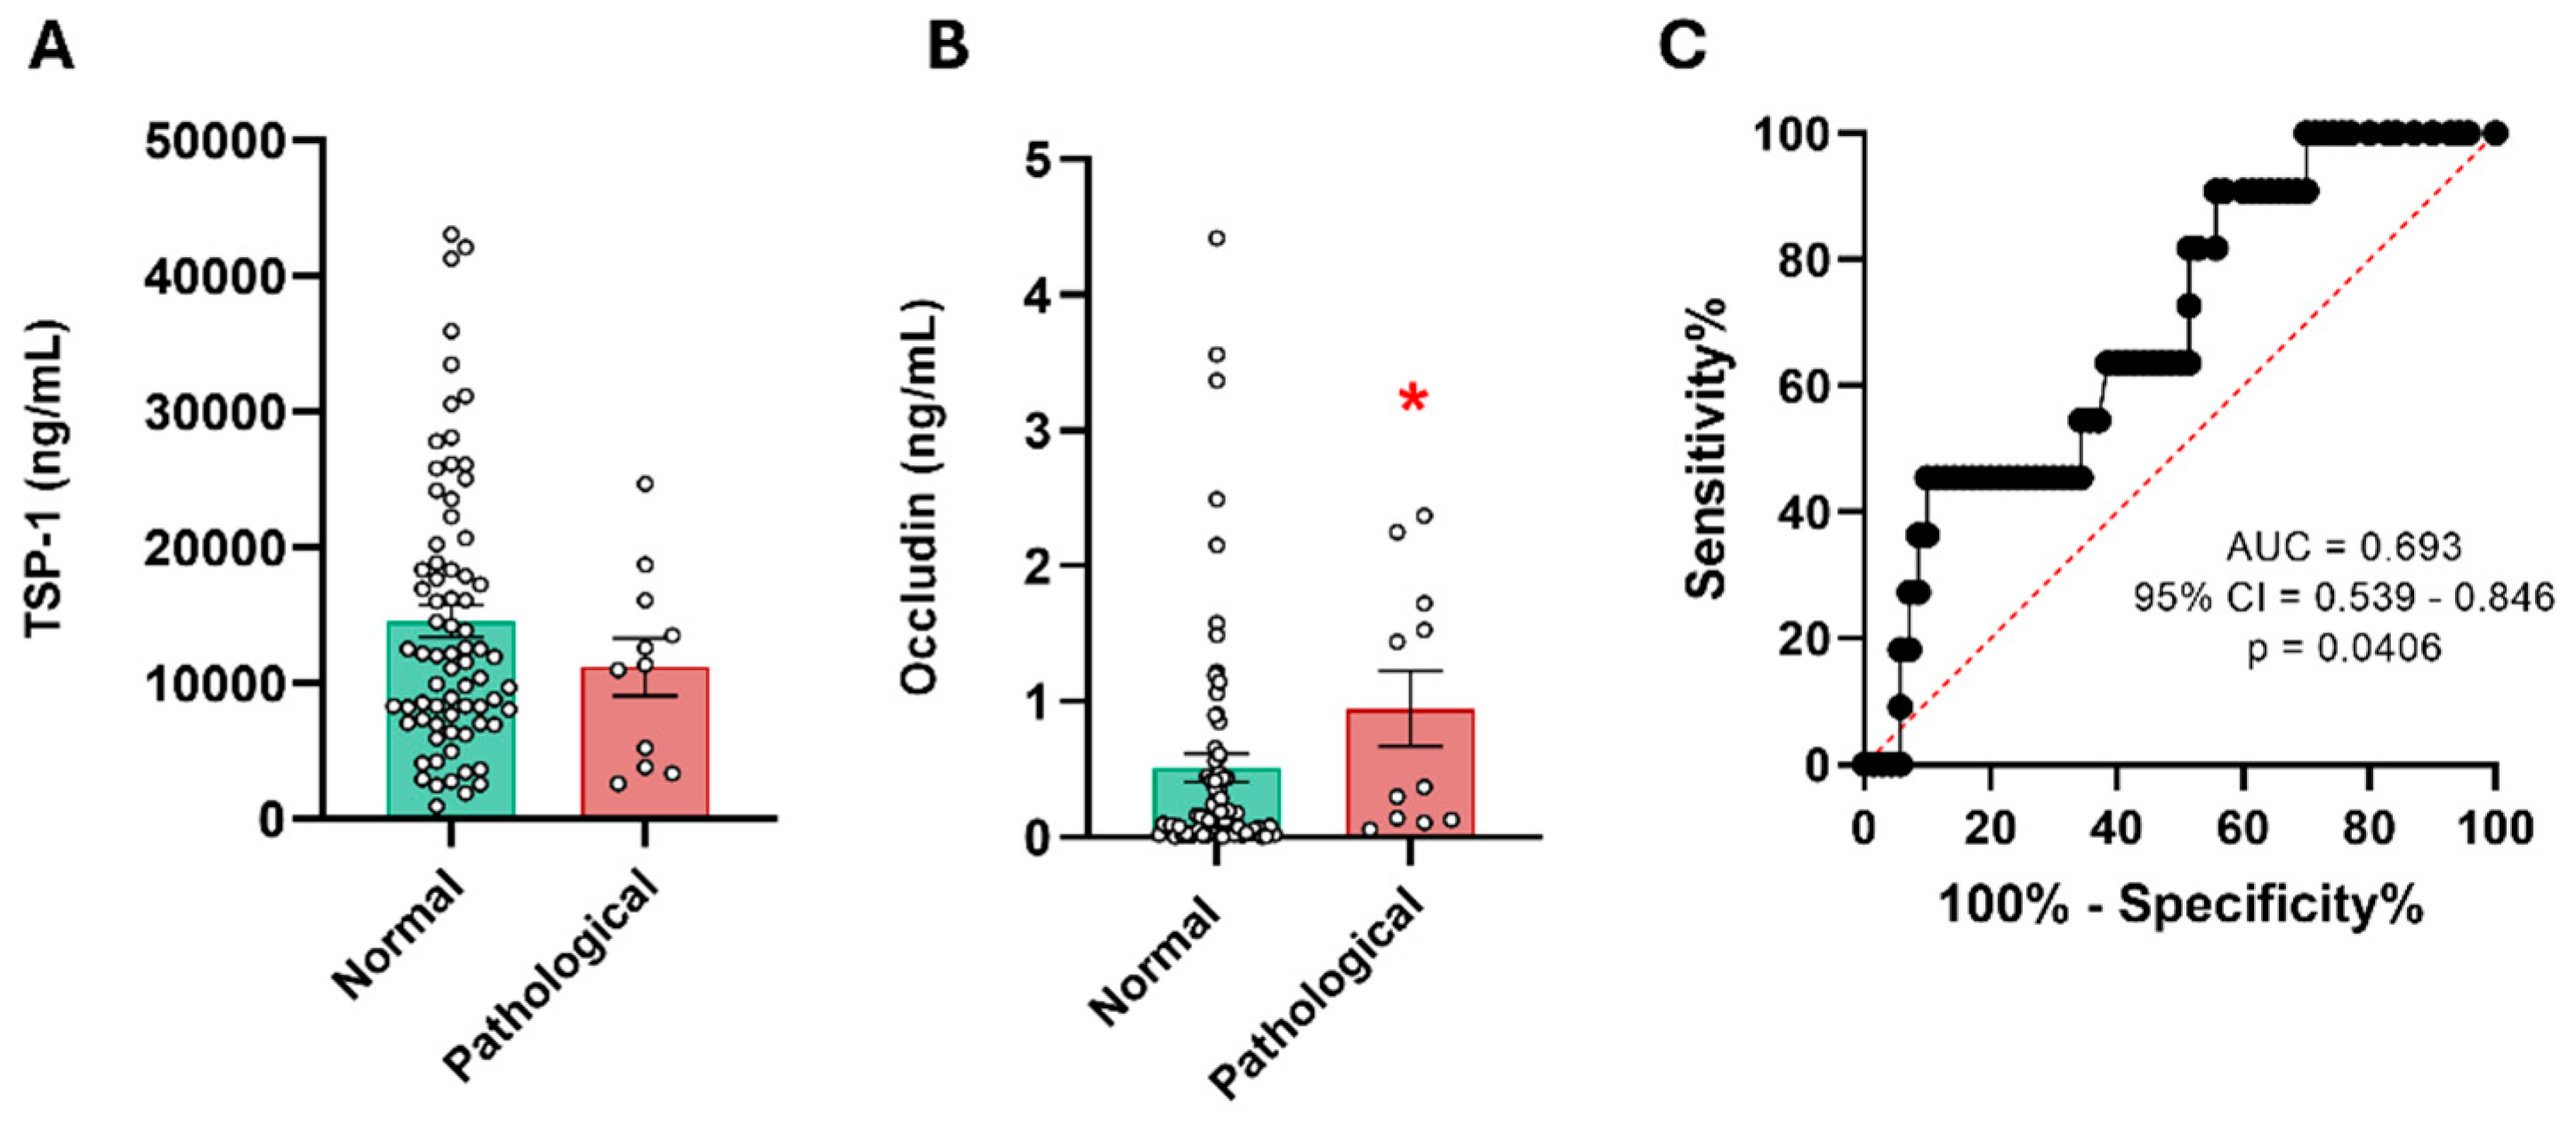
Figure 5.
Serum levels of TSP-1 and occludin in patients with mild TBI and their correlation with CT. (A) Serum levels of TSP-1 in patients with mild TBI. No significant differences were found in the TSP-11d levels of patients with mild TBI dichotomized according to their CT results (normal n = 73 and pathological n = 11). (B) Serum levels of occludin in patients with mild TBI showed a significant increase in those with abnormal CT results. *p < 0.05 vs Normal CT group, Student t-test. (C) ROC curve for occludin1d levels to predict possible differences between the normal CT group (n = 70) and the abnormal CT group (n = 11). CT: Computed tomography.
Figure 6.
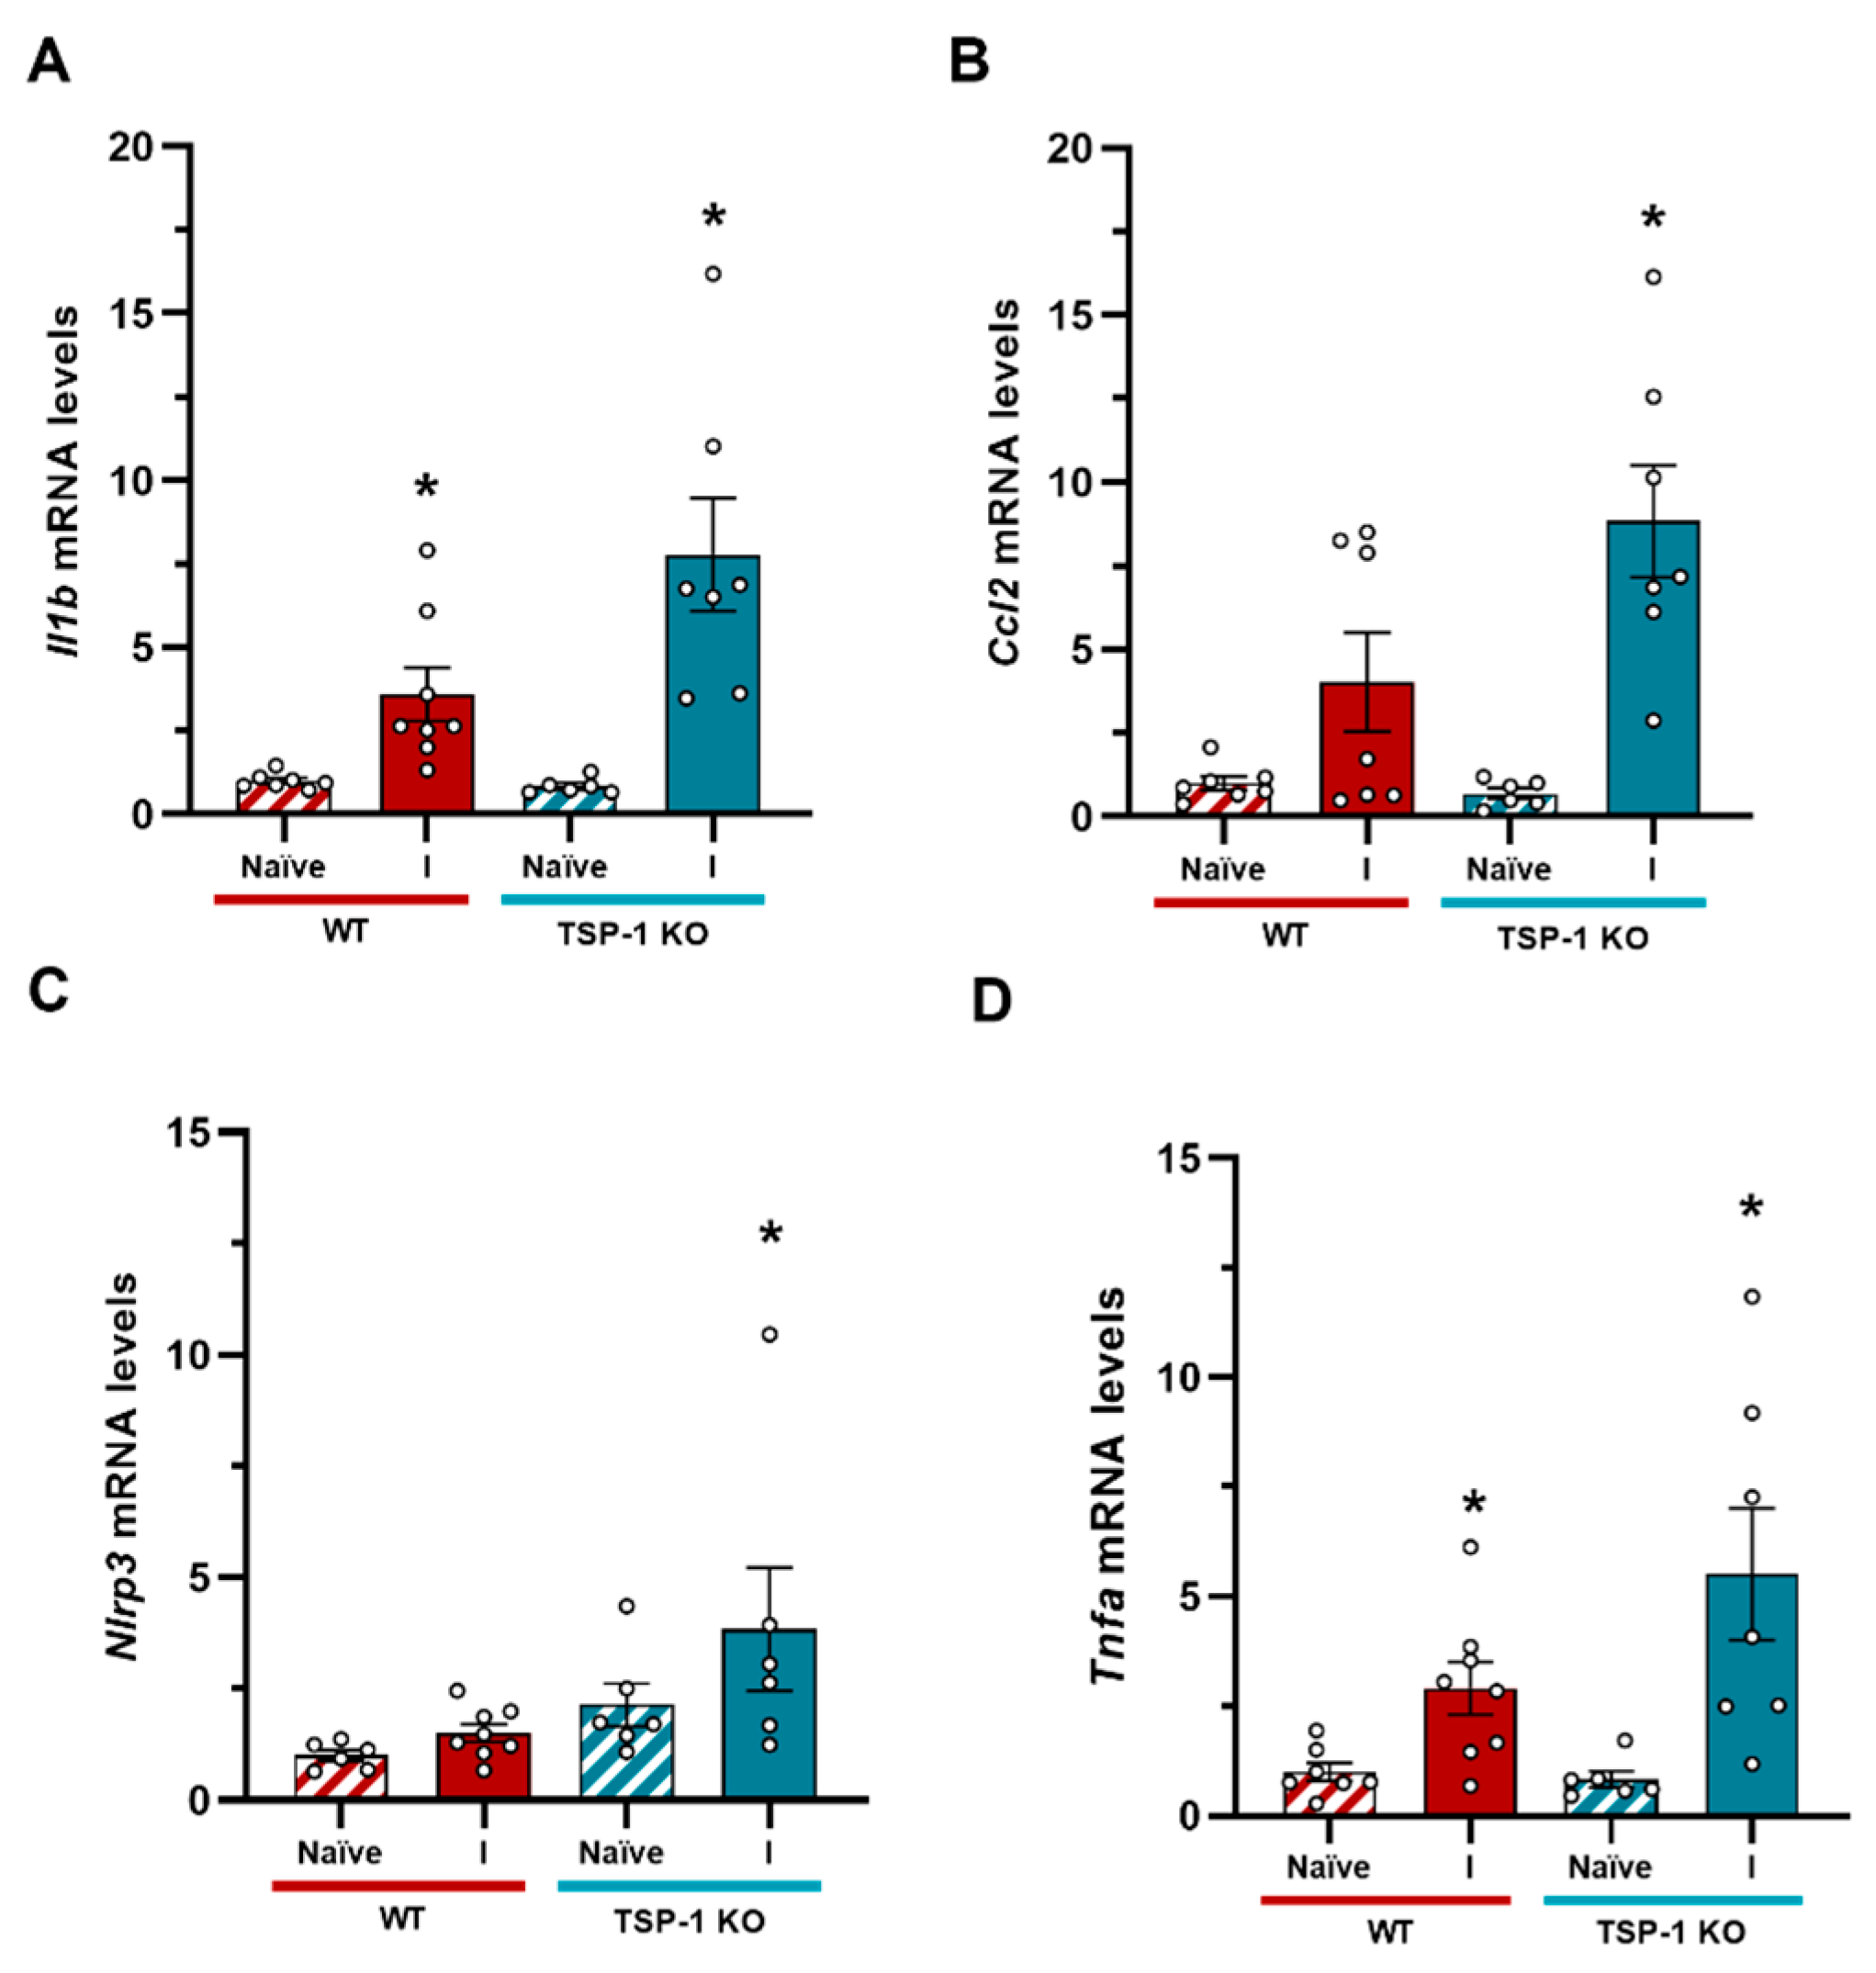
Inflammatory profile of TSP-1 KO animals after TBI. (A) Il1b expression levels were significantly elevated in the ipsilateral hemisphere in WT mice, and this expression significantly increased in TSP-1 KO animals after injury. (B) Ccl2 expression was exacerbated in the ipsilateral side of TSP-1 KO mice compared to WT animals. (C) Nlrp3 levels only were significantly higher in TSP-1 KO animals after TBI. (D) An increase Tnfa expression was observed in both WT and TSP-1 KO animals after TBI compared to naïve animals. Mean ± SEM (n = 6-8). *p < 0.05 vs naïve of their genotype, #p < 0.05 vs WT, Kruskal-Walli’s analysis followed by Dunn’s post-hoc test. A T-test was performed to assess the effect of genotype. (WT: Wild type; KO: knock out; I: ipsilateral).
Figure 6.
Inflammatory profile of TSP-1 KO animals after TBI. (A) Il1b expression levels were significantly elevated in the ipsilateral hemisphere in WT mice, and this expression significantly increased in TSP-1 KO animals after injury. (B) Ccl2 expression was exacerbated in the ipsilateral side of TSP-1 KO mice compared to WT animals. (C) Nlrp3 levels only were significantly higher in TSP-1 KO animals after TBI. (D) An increase Tnfa expression was observed in both WT and TSP-1 KO animals after TBI compared to naïve animals. Mean ± SEM (n = 6-8). *p < 0.05 vs naïve of their genotype, #p < 0.05 vs WT, Kruskal-Walli’s analysis followed by Dunn’s post-hoc test. A T-test was performed to assess the effect of genotype. (WT: Wild type; KO: knock out; I: ipsilateral).
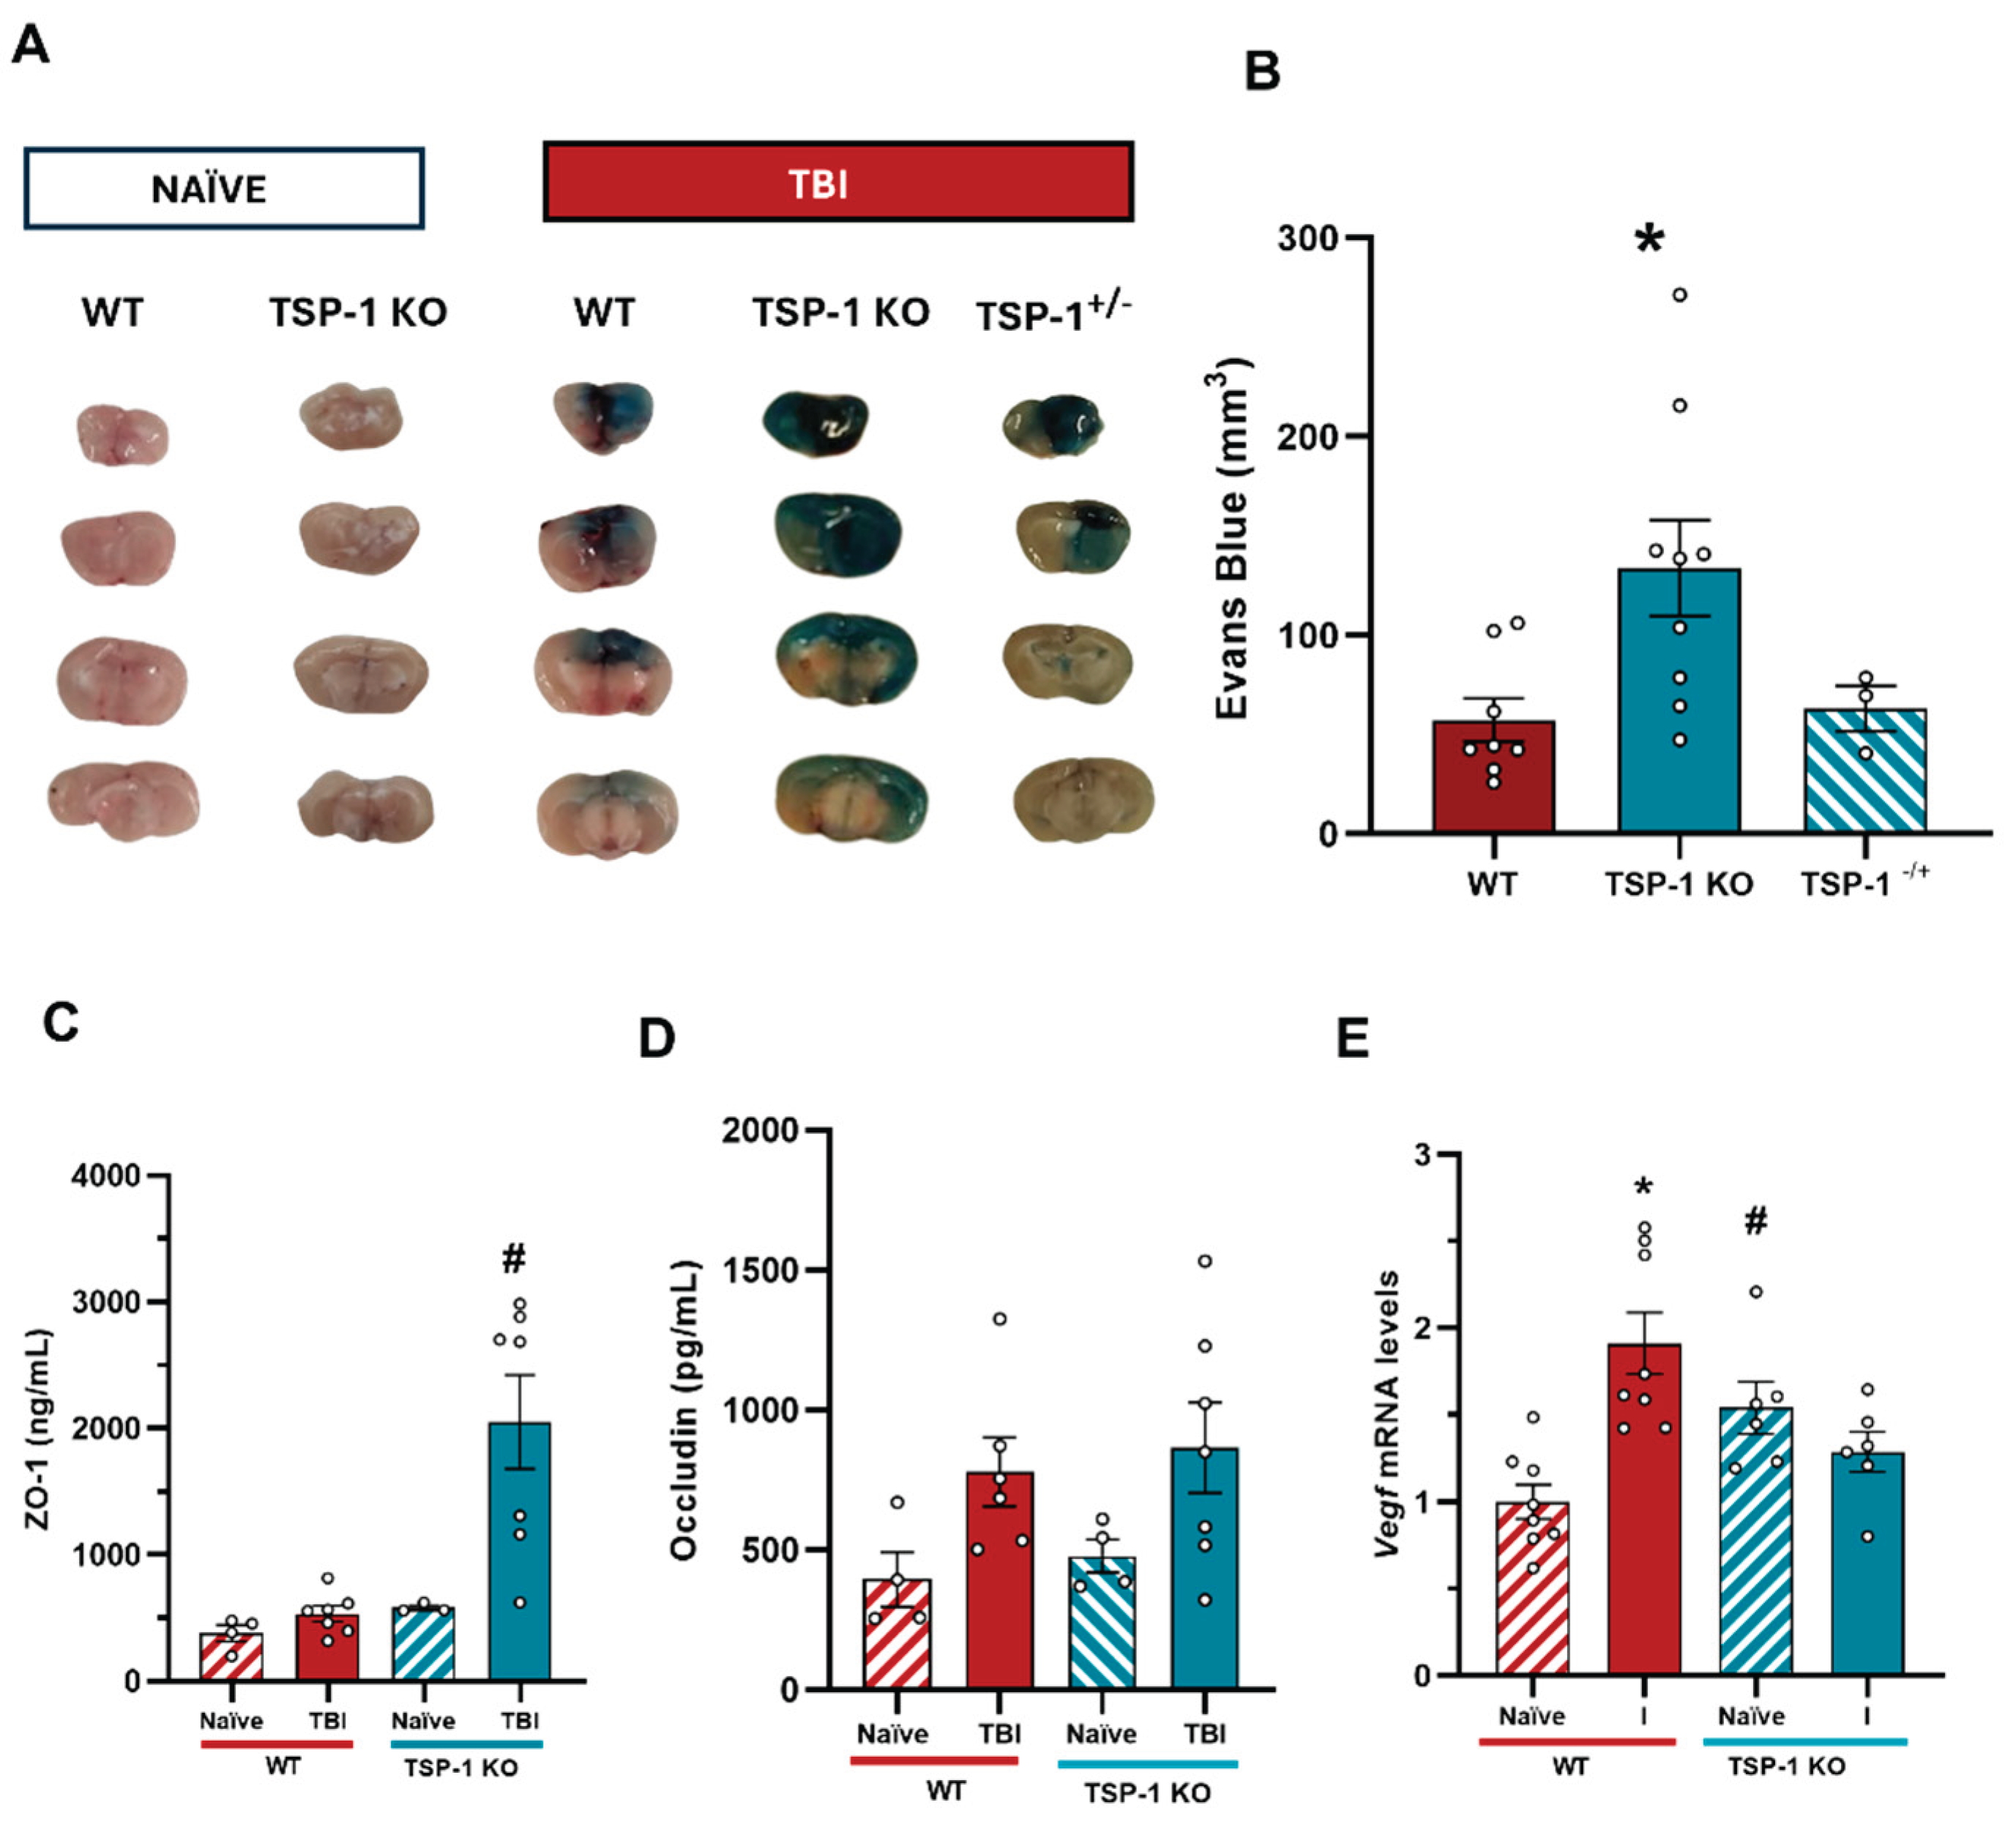
Figure 7.
Effects of TSP-1 deficiency on BBB integrity and angiogenic response. (A) Representative images of 2 mm brain slices for the quantification of Evans blue. (B) Quantification of Evans Blue extravasation. (n = 3 – 9) Mean ± SEM. One-way ANOVA followed by Bonferroni post-hoc test p ≤ 0.05. (* vs. WT). (C) ZO-1 serum levels do not change 24 hours post-TBI in WT animals while in TSP-1-/- mice are significantly increased. (D) Occludin levels are significantly elevated in injured animals 24 hours post-TBI regardless of their genotype. Mean ± SEM (WT naïve n=4, WT TBI n=7-8, TSP-1 KO naïve n=3-4, TSP-1 KO TBI n=7)). Kruskal-Wallis analysis followed by Dunn’s post-hoc test. p ≤ 0.05. (* vs. Naïve of their genotype, # vs. WT). (E) Vegf mRNA levels increased in the ipsilateral hemisphere of injured WT animals. An increase in Vegf was observed in naïve TSP-1 KO animals compared to naïve WT; yet the injury did not modify Vegf mRNA levels in TSP-1 KO animals. *p < 0.05 vs naïve of their genotype, #p < 0.05 vs WT, Two-way ANOVA with Bonferroni post-hoc test.