Submitted:
14 November 2025
Posted:
17 November 2025
You are already at the latest version
Abstract
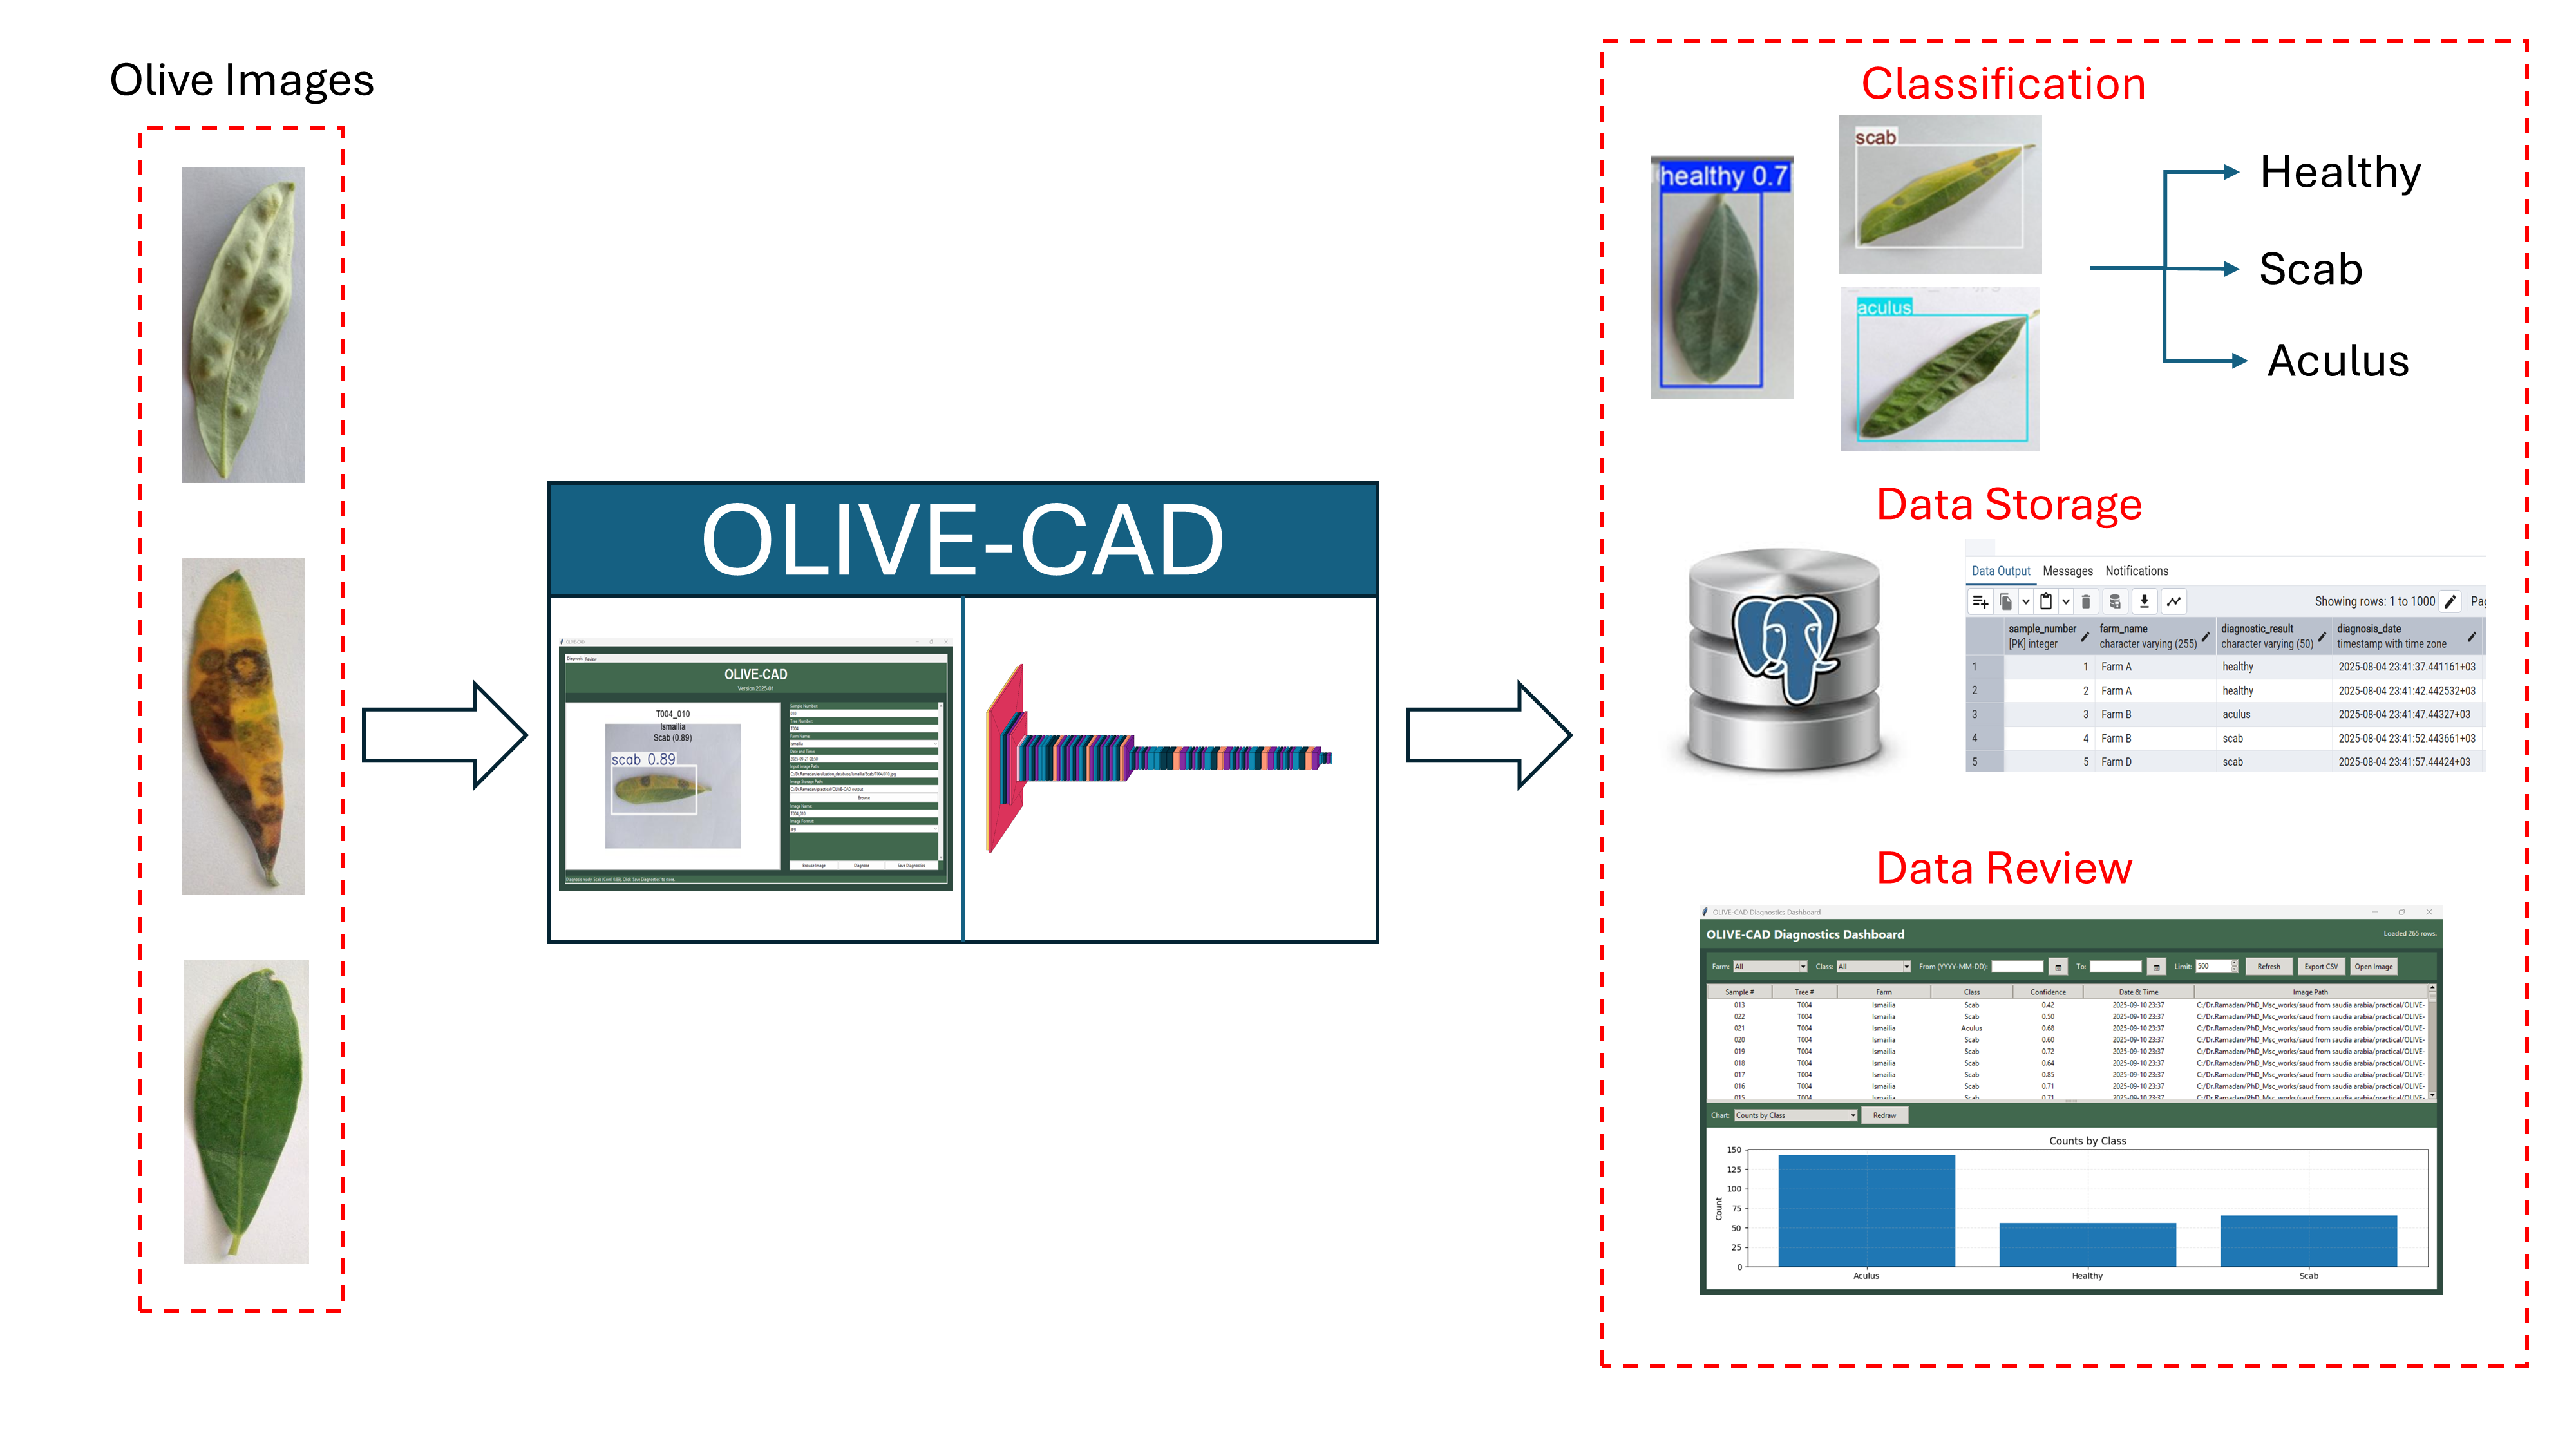
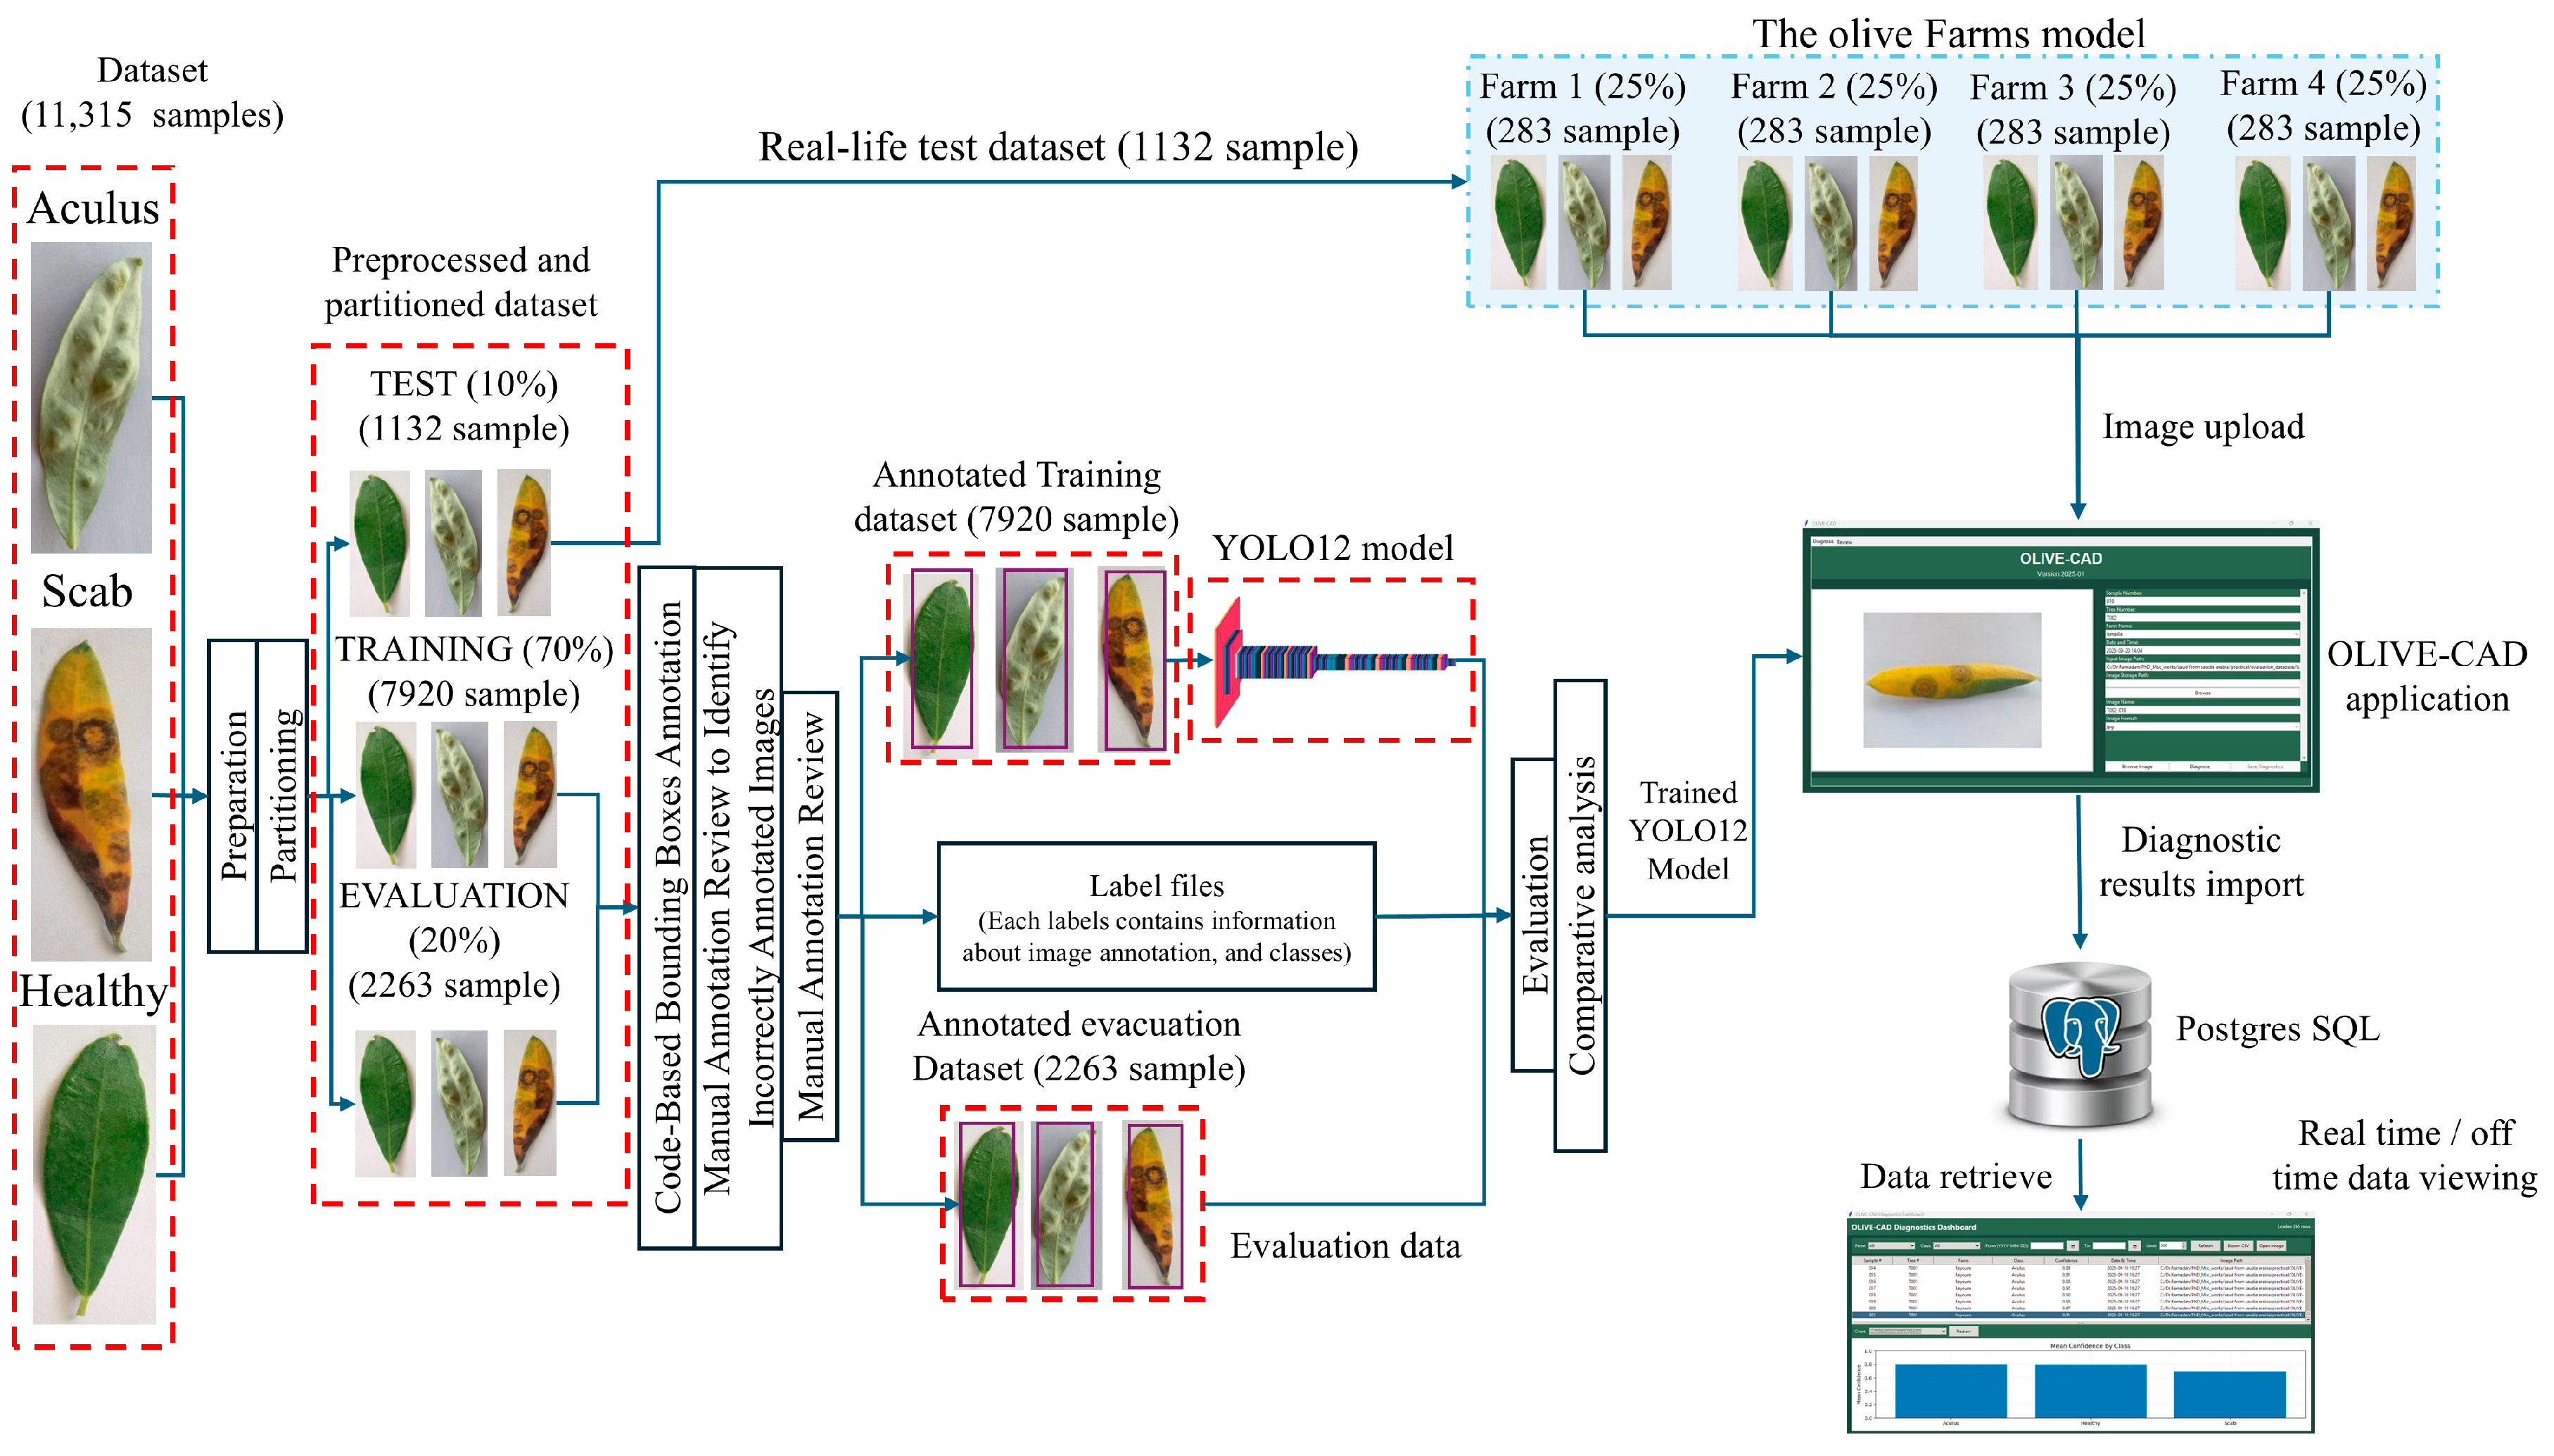
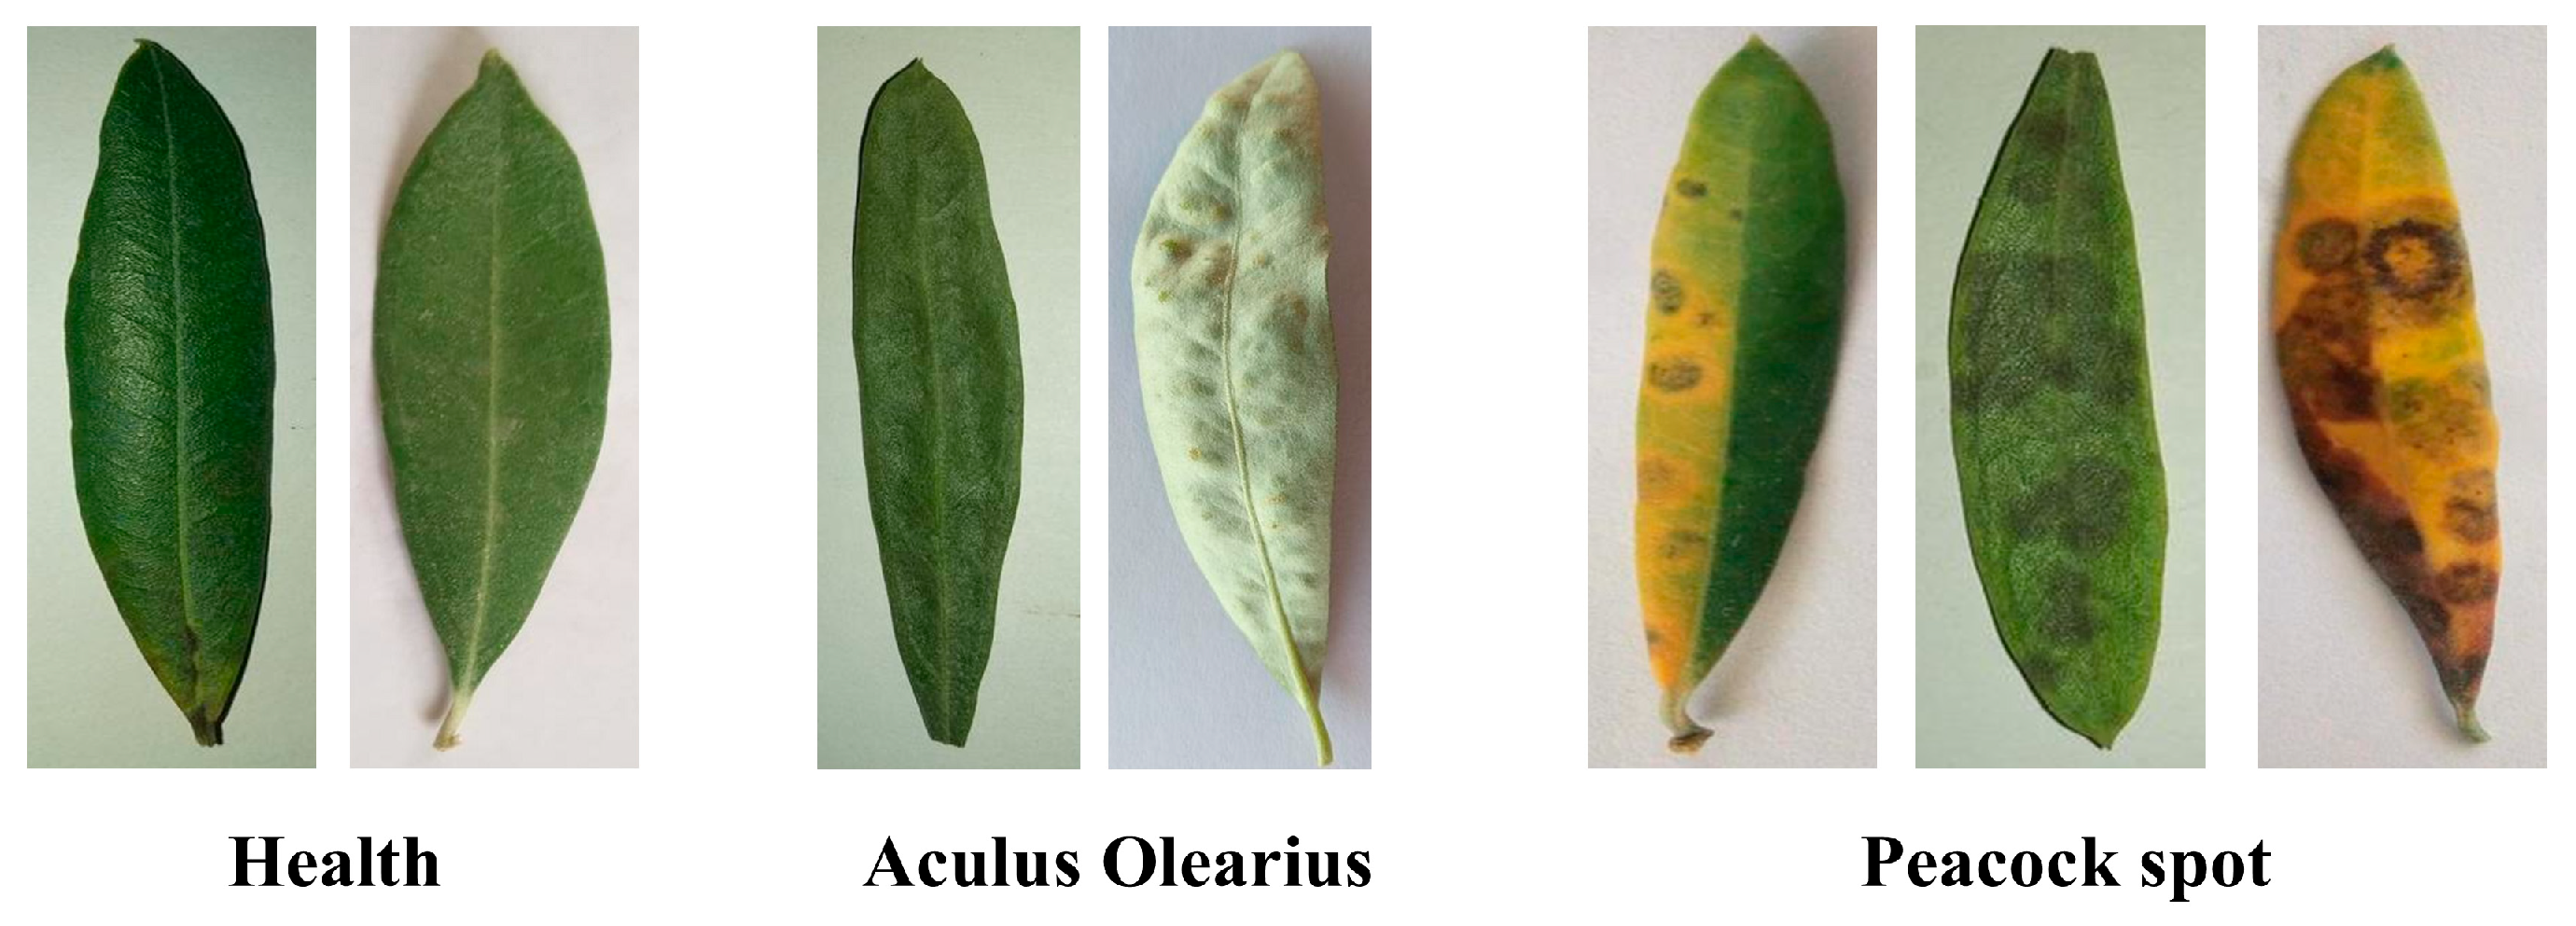
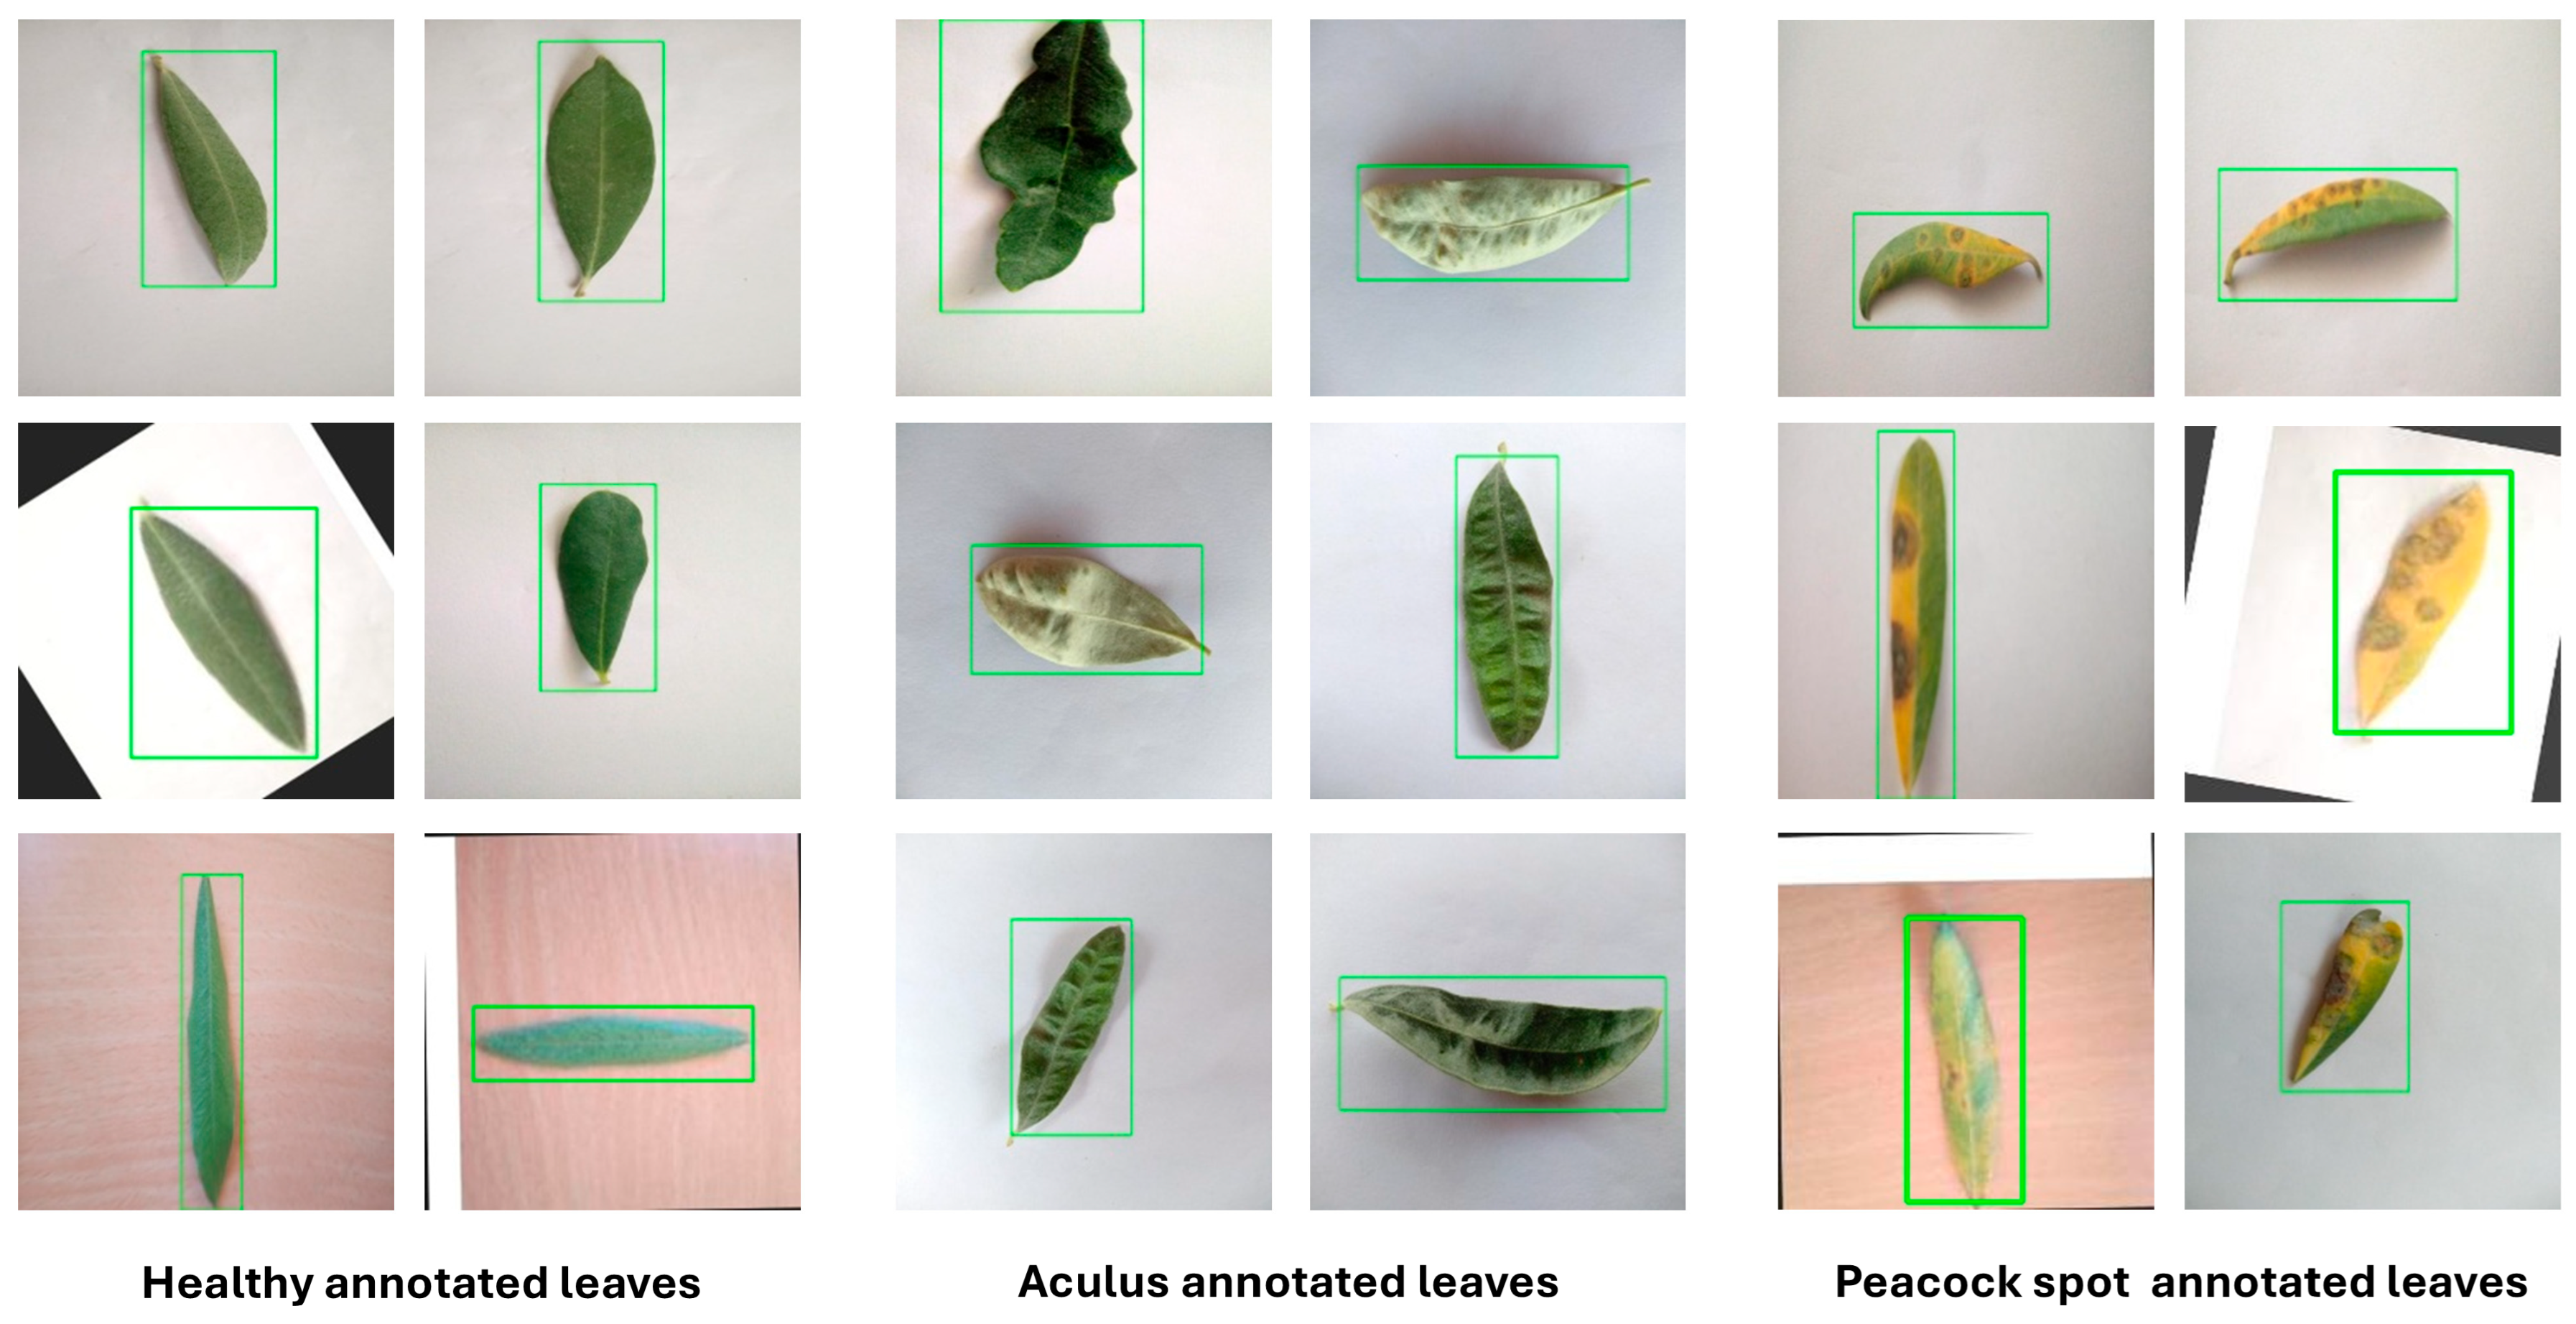
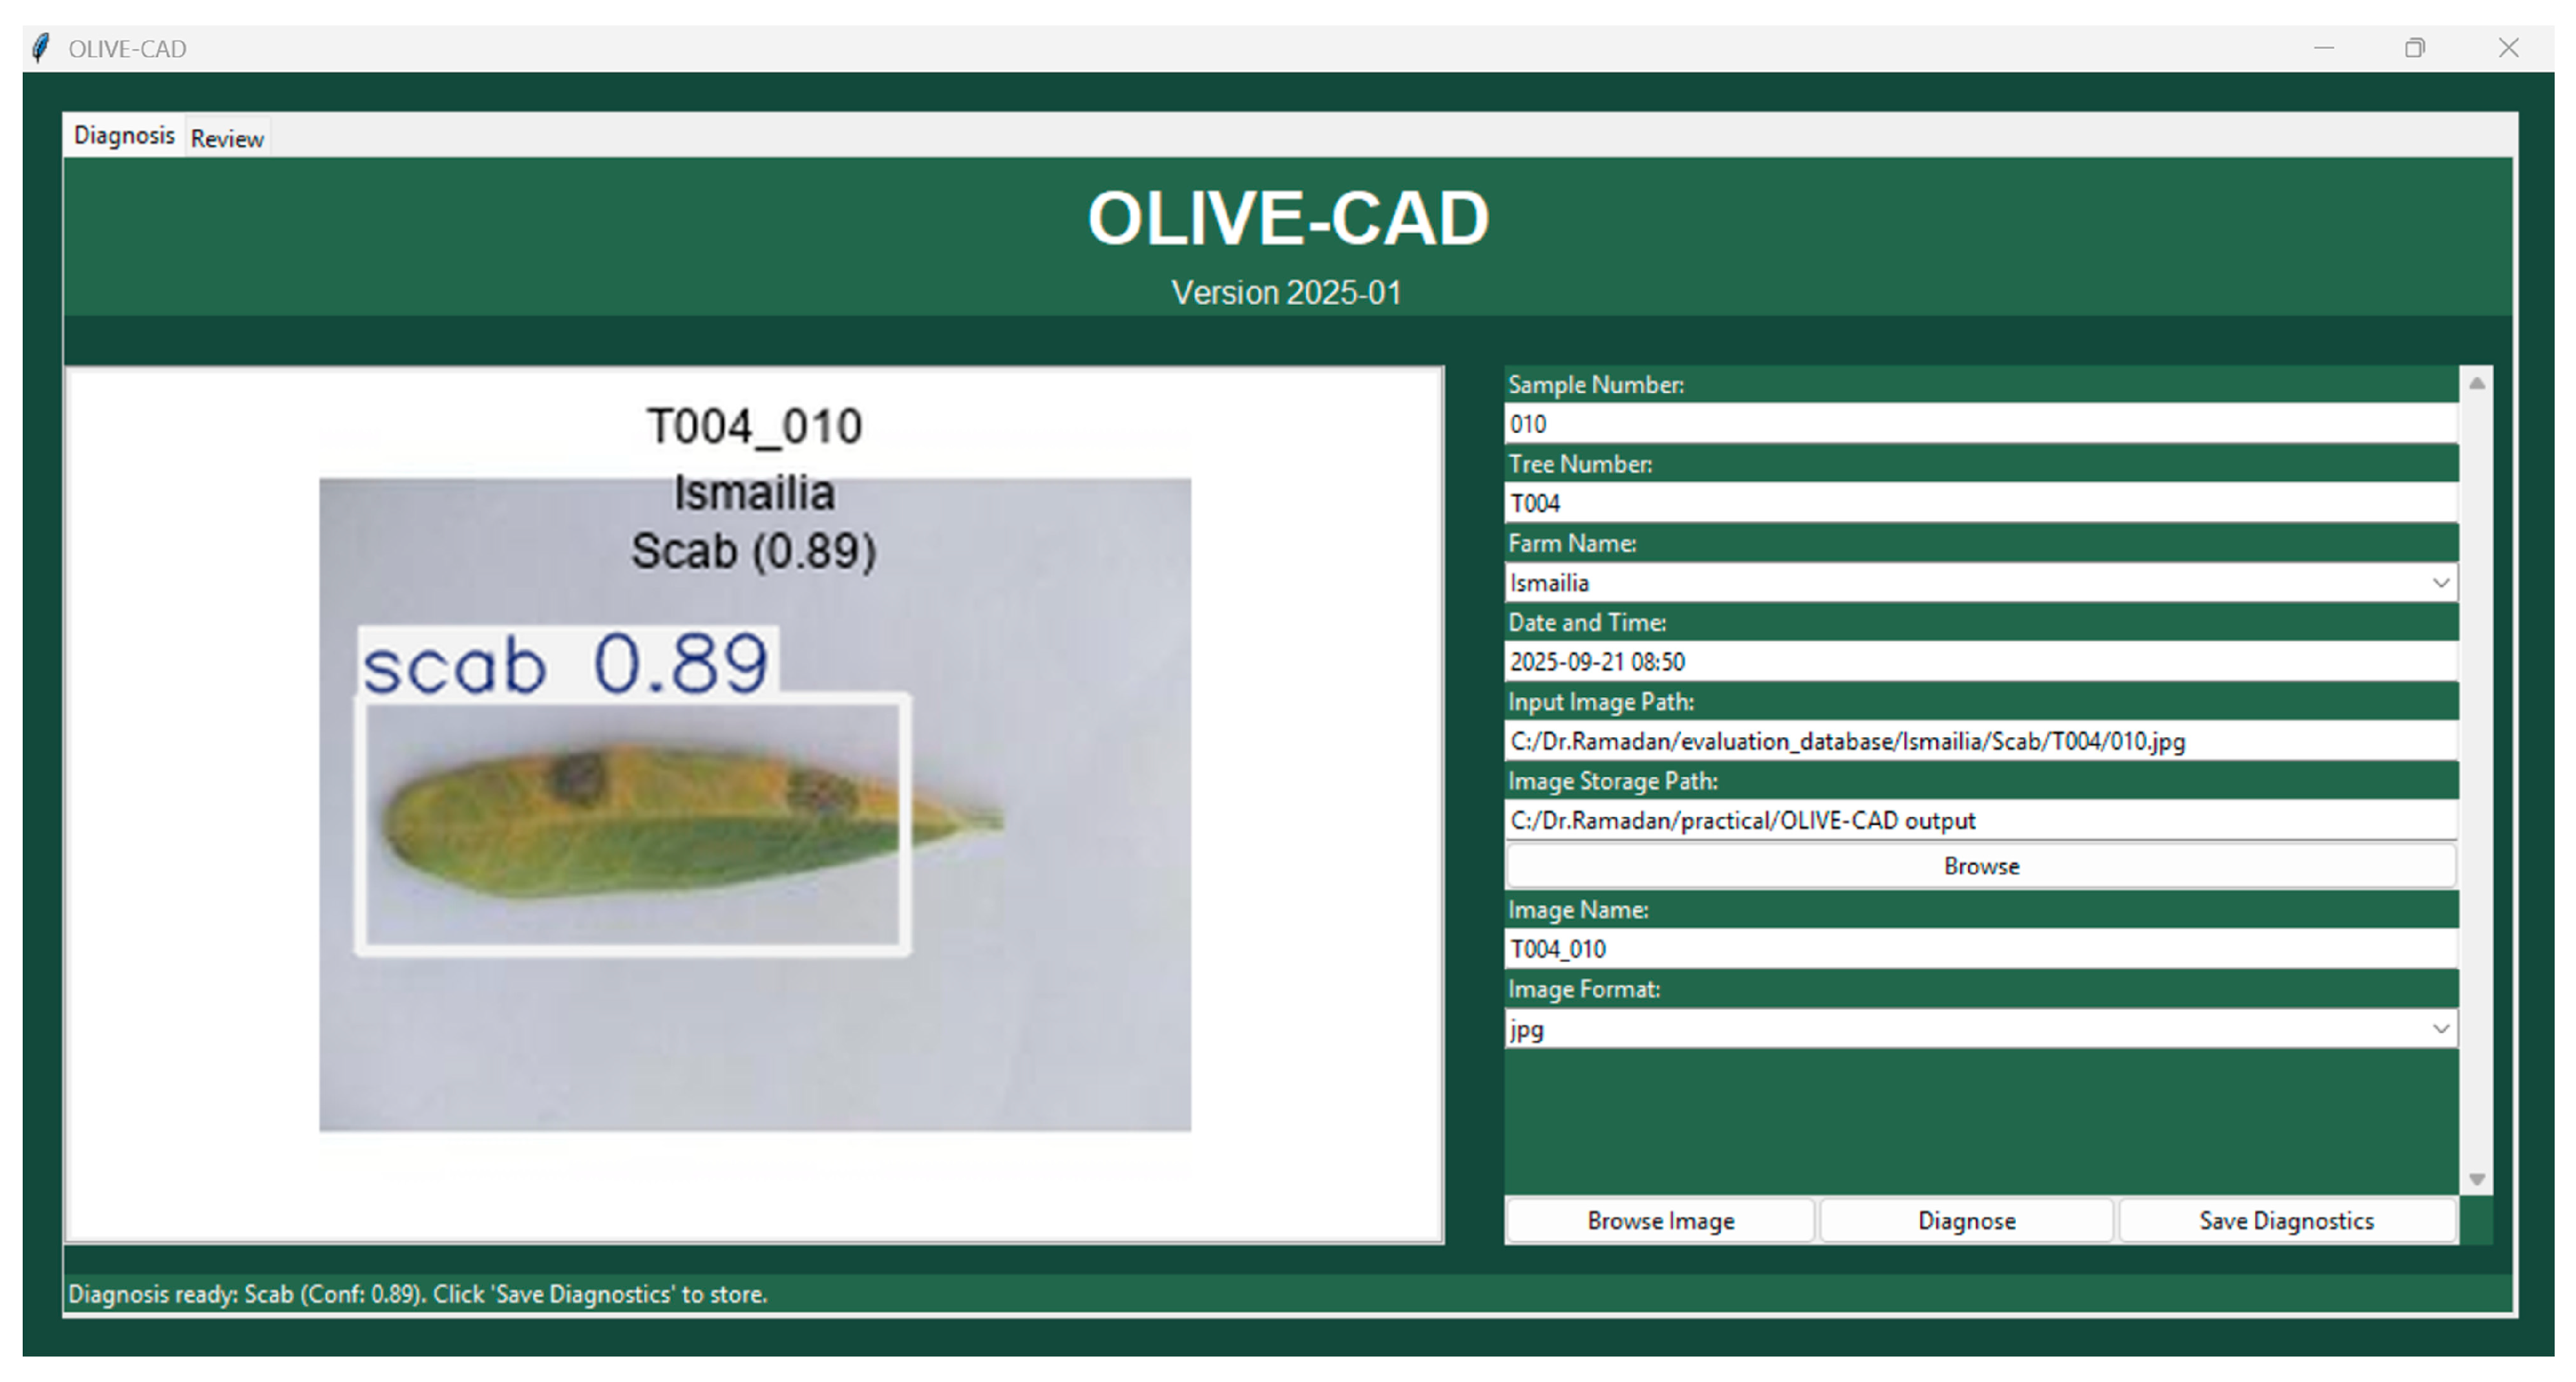
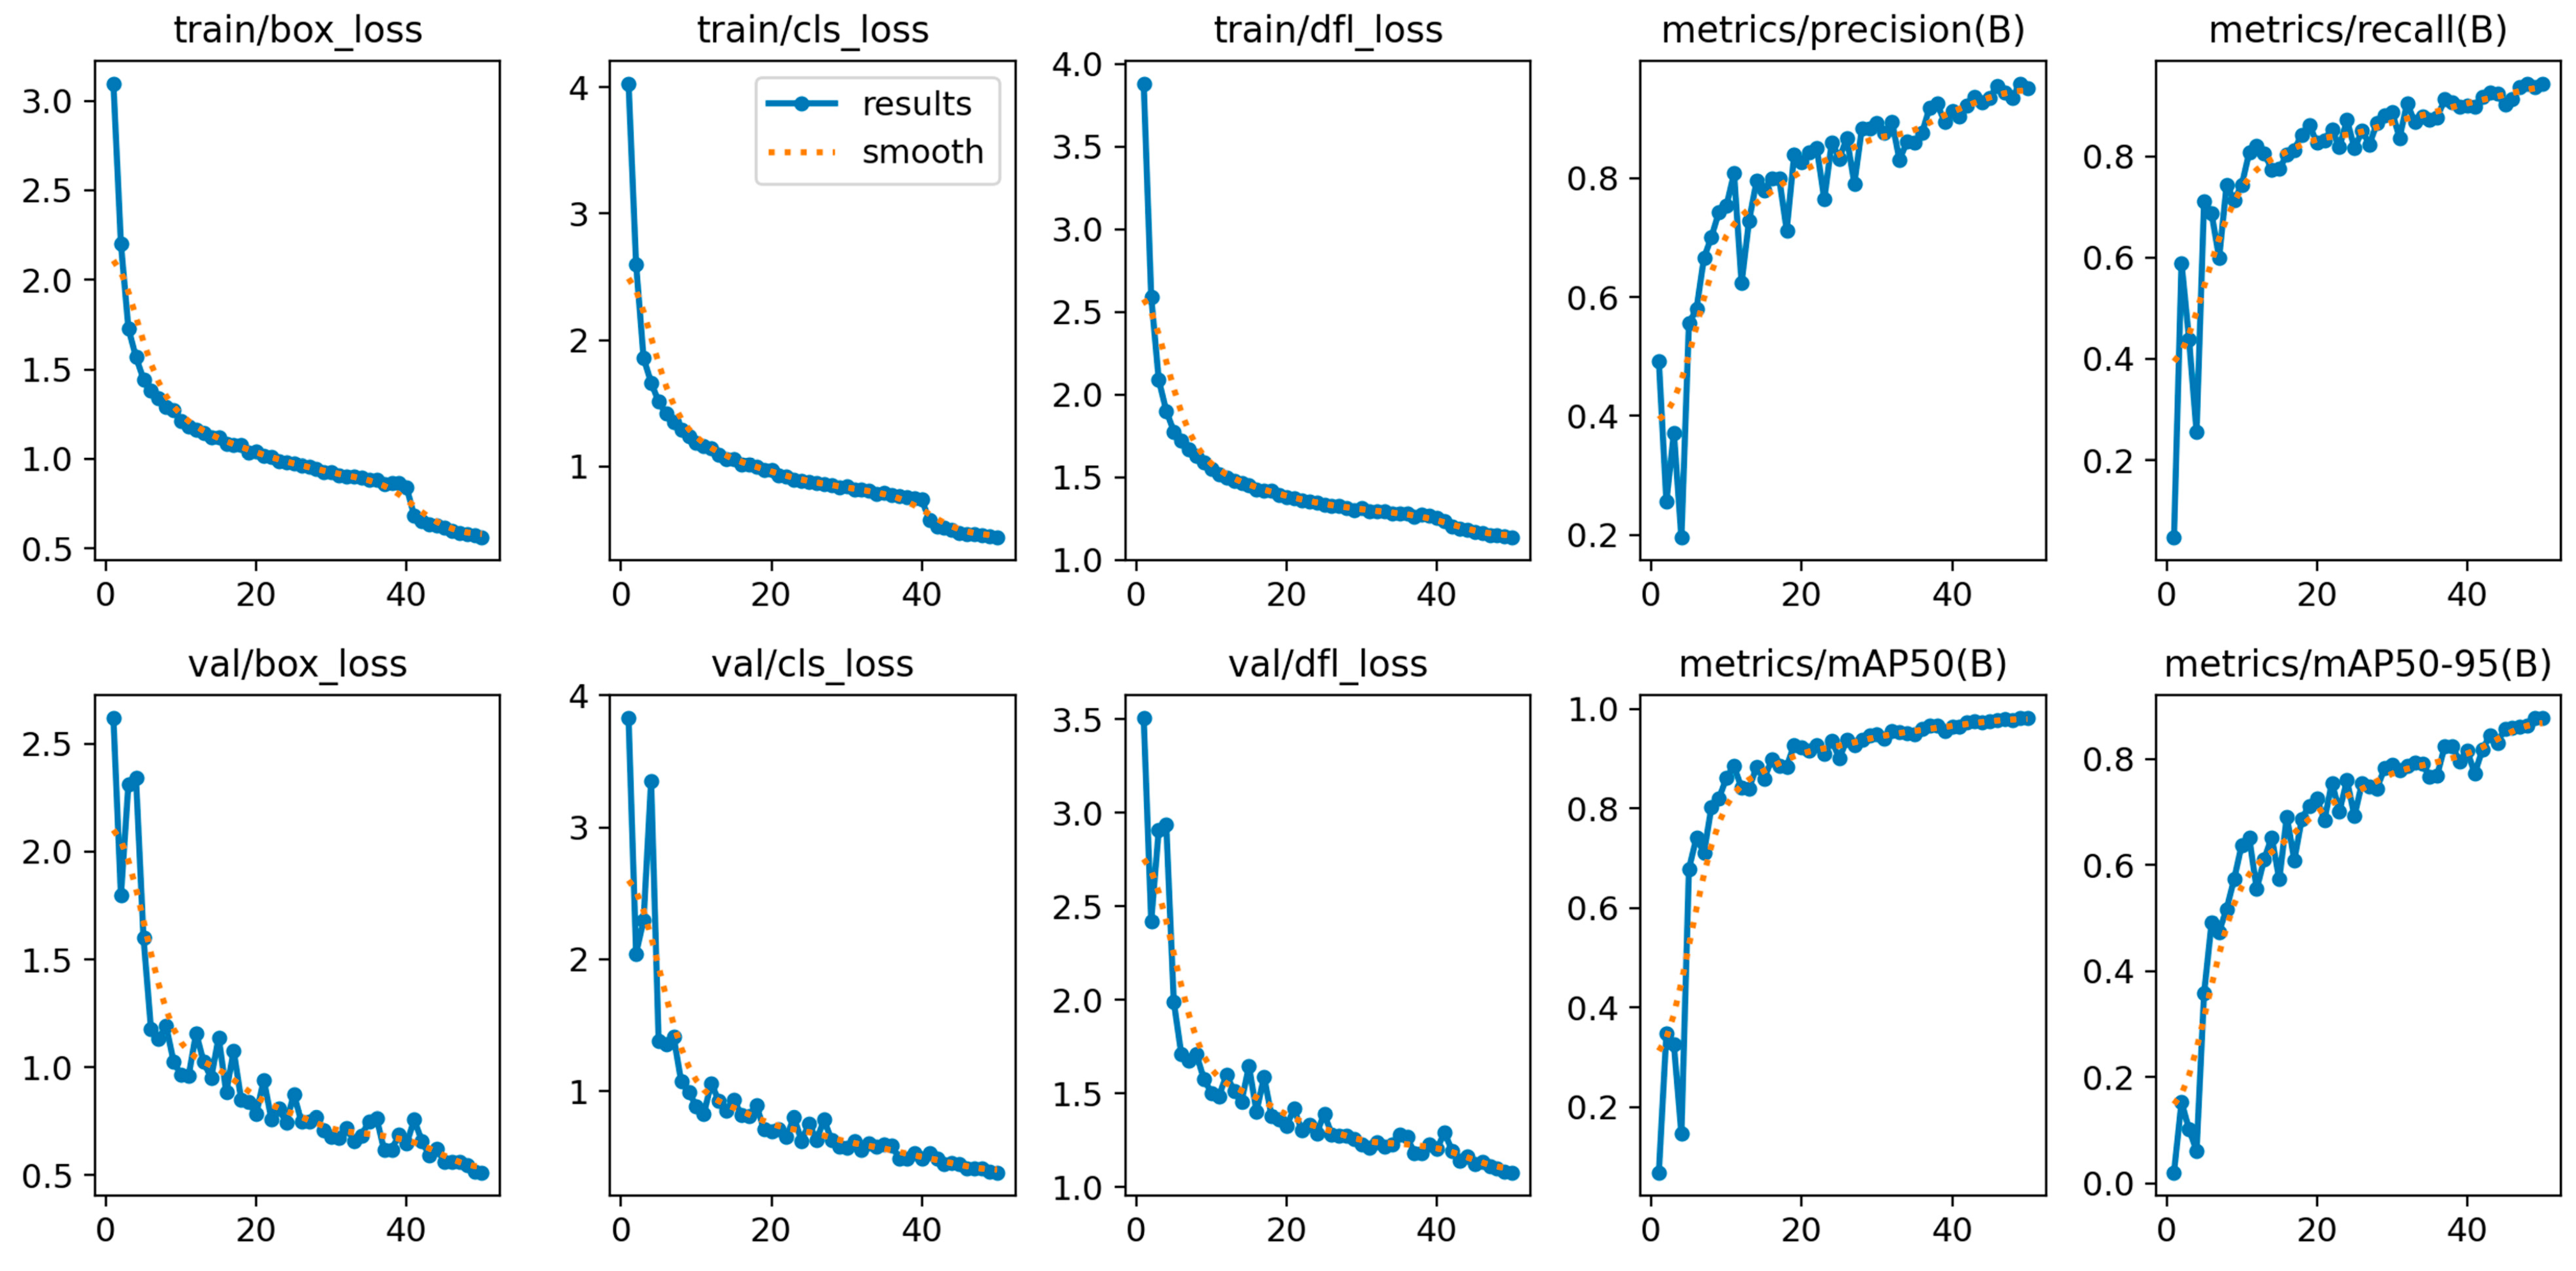
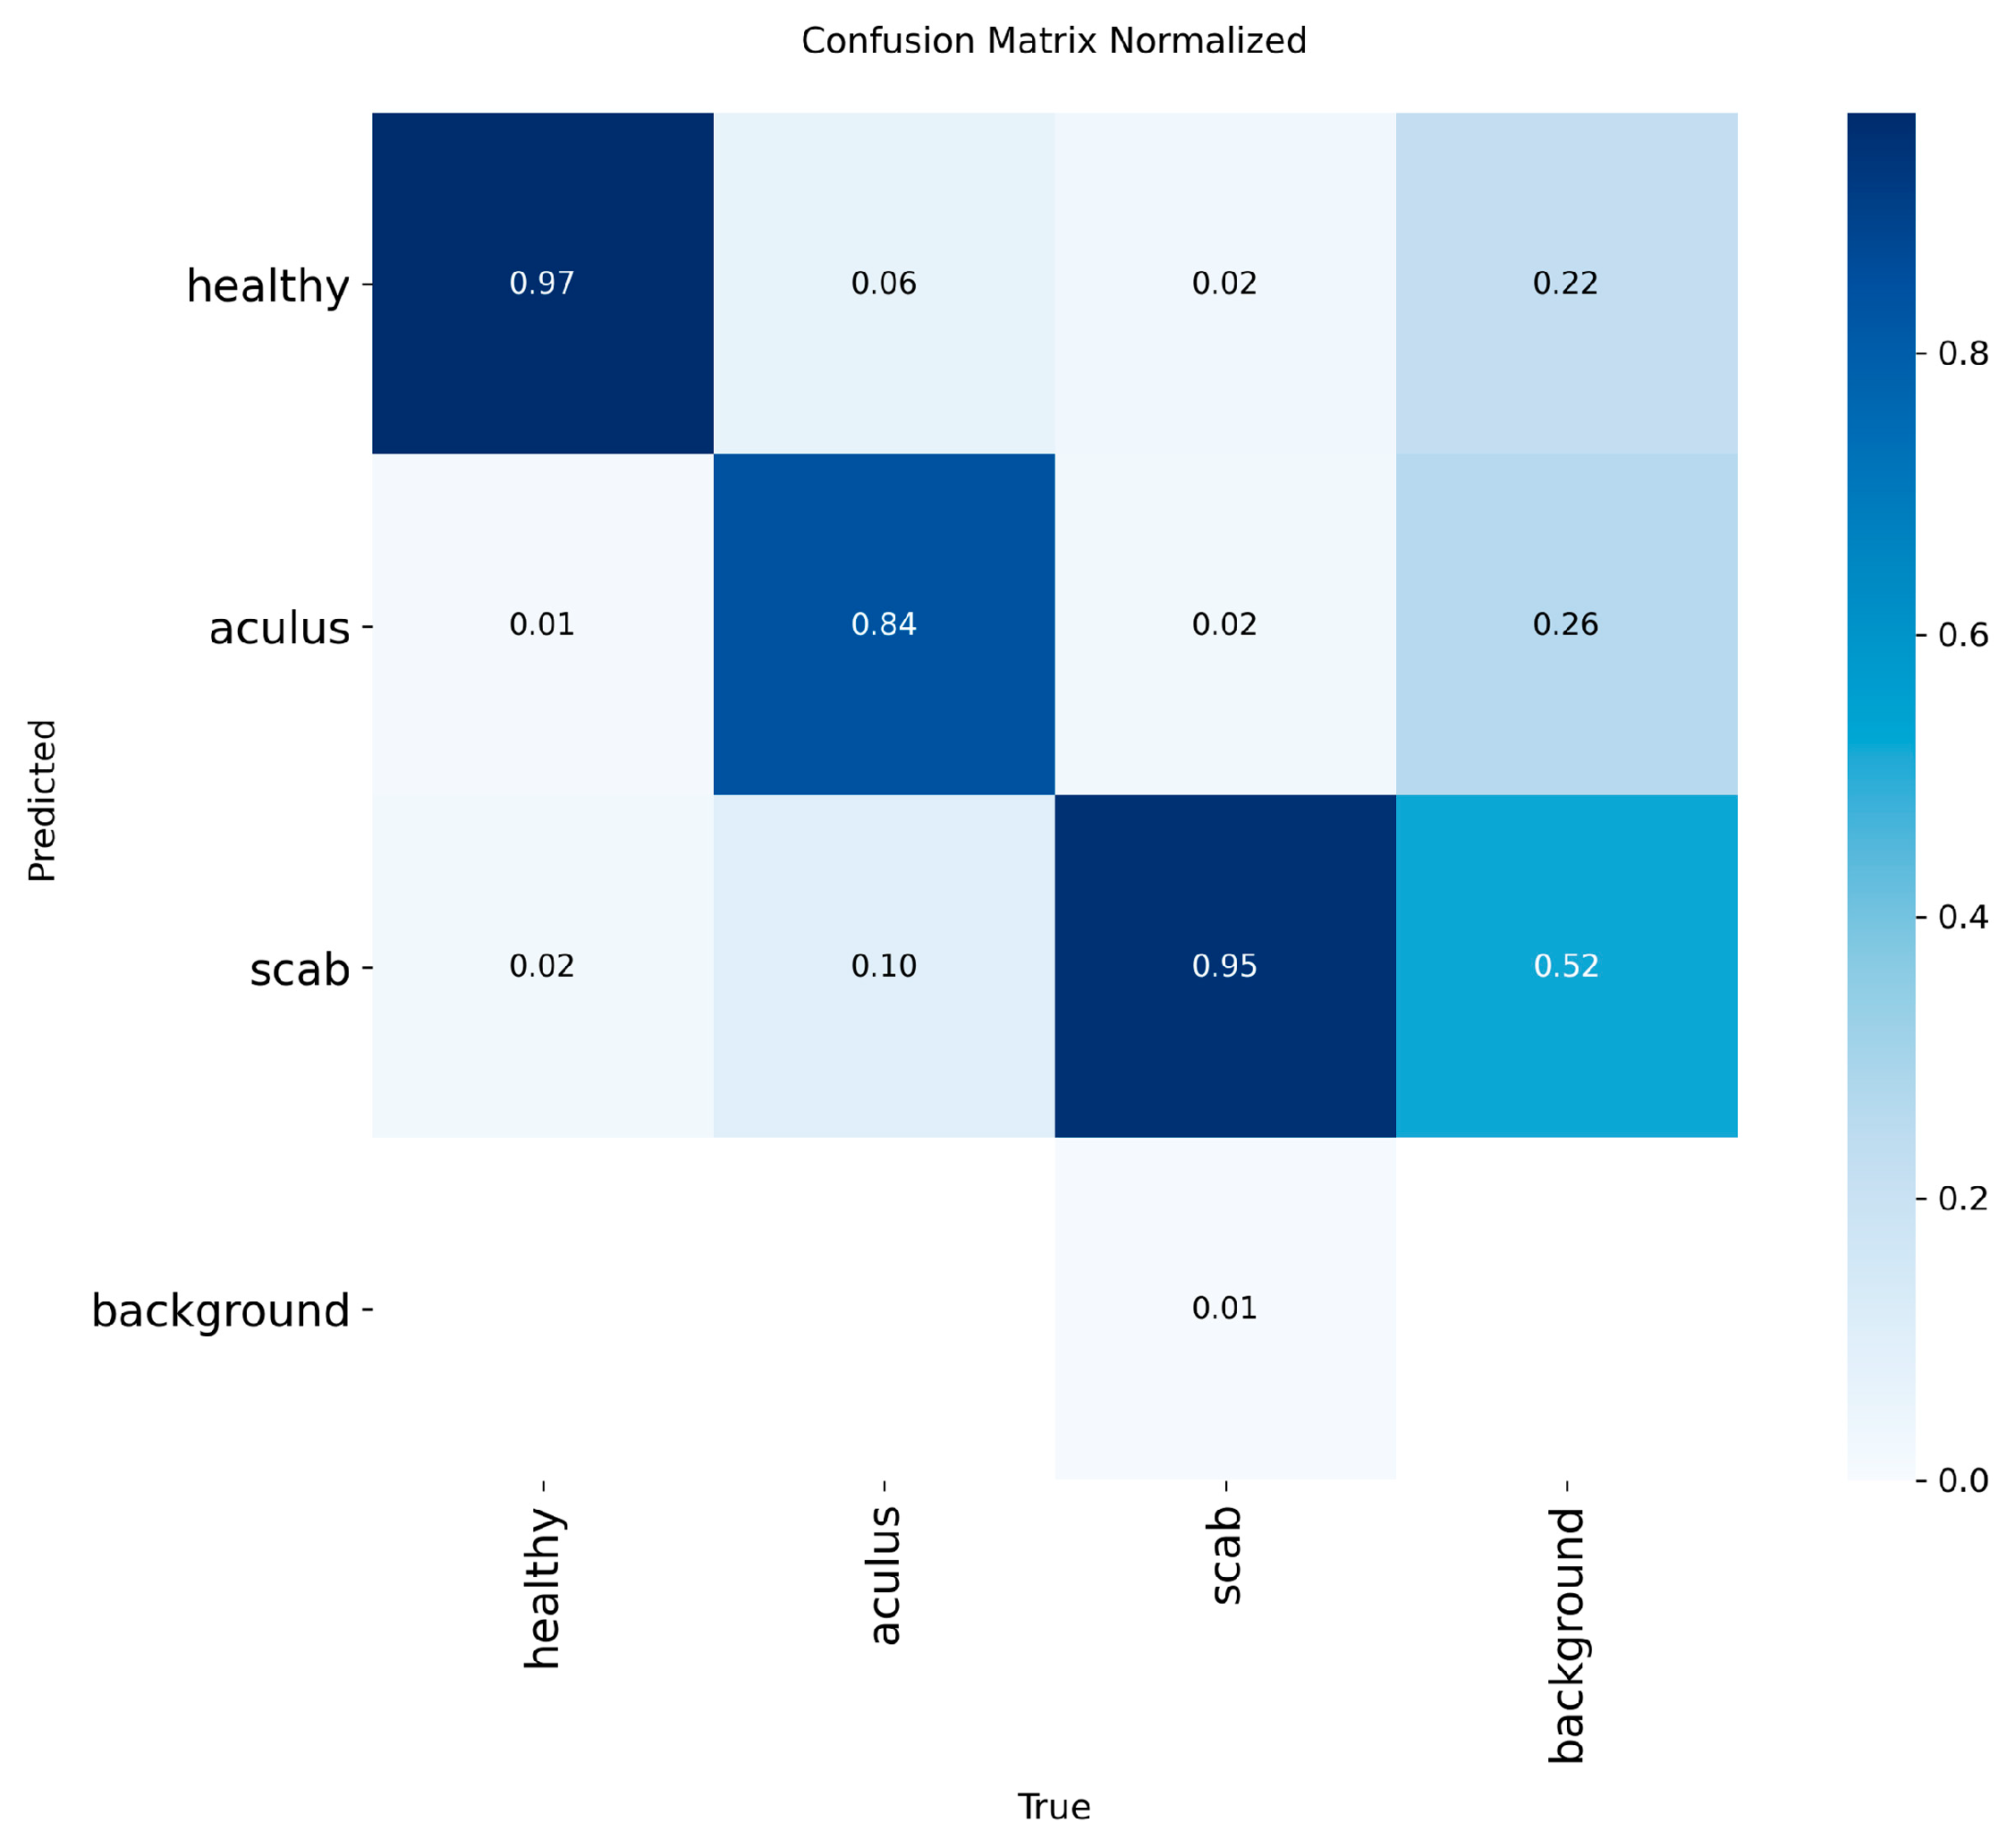
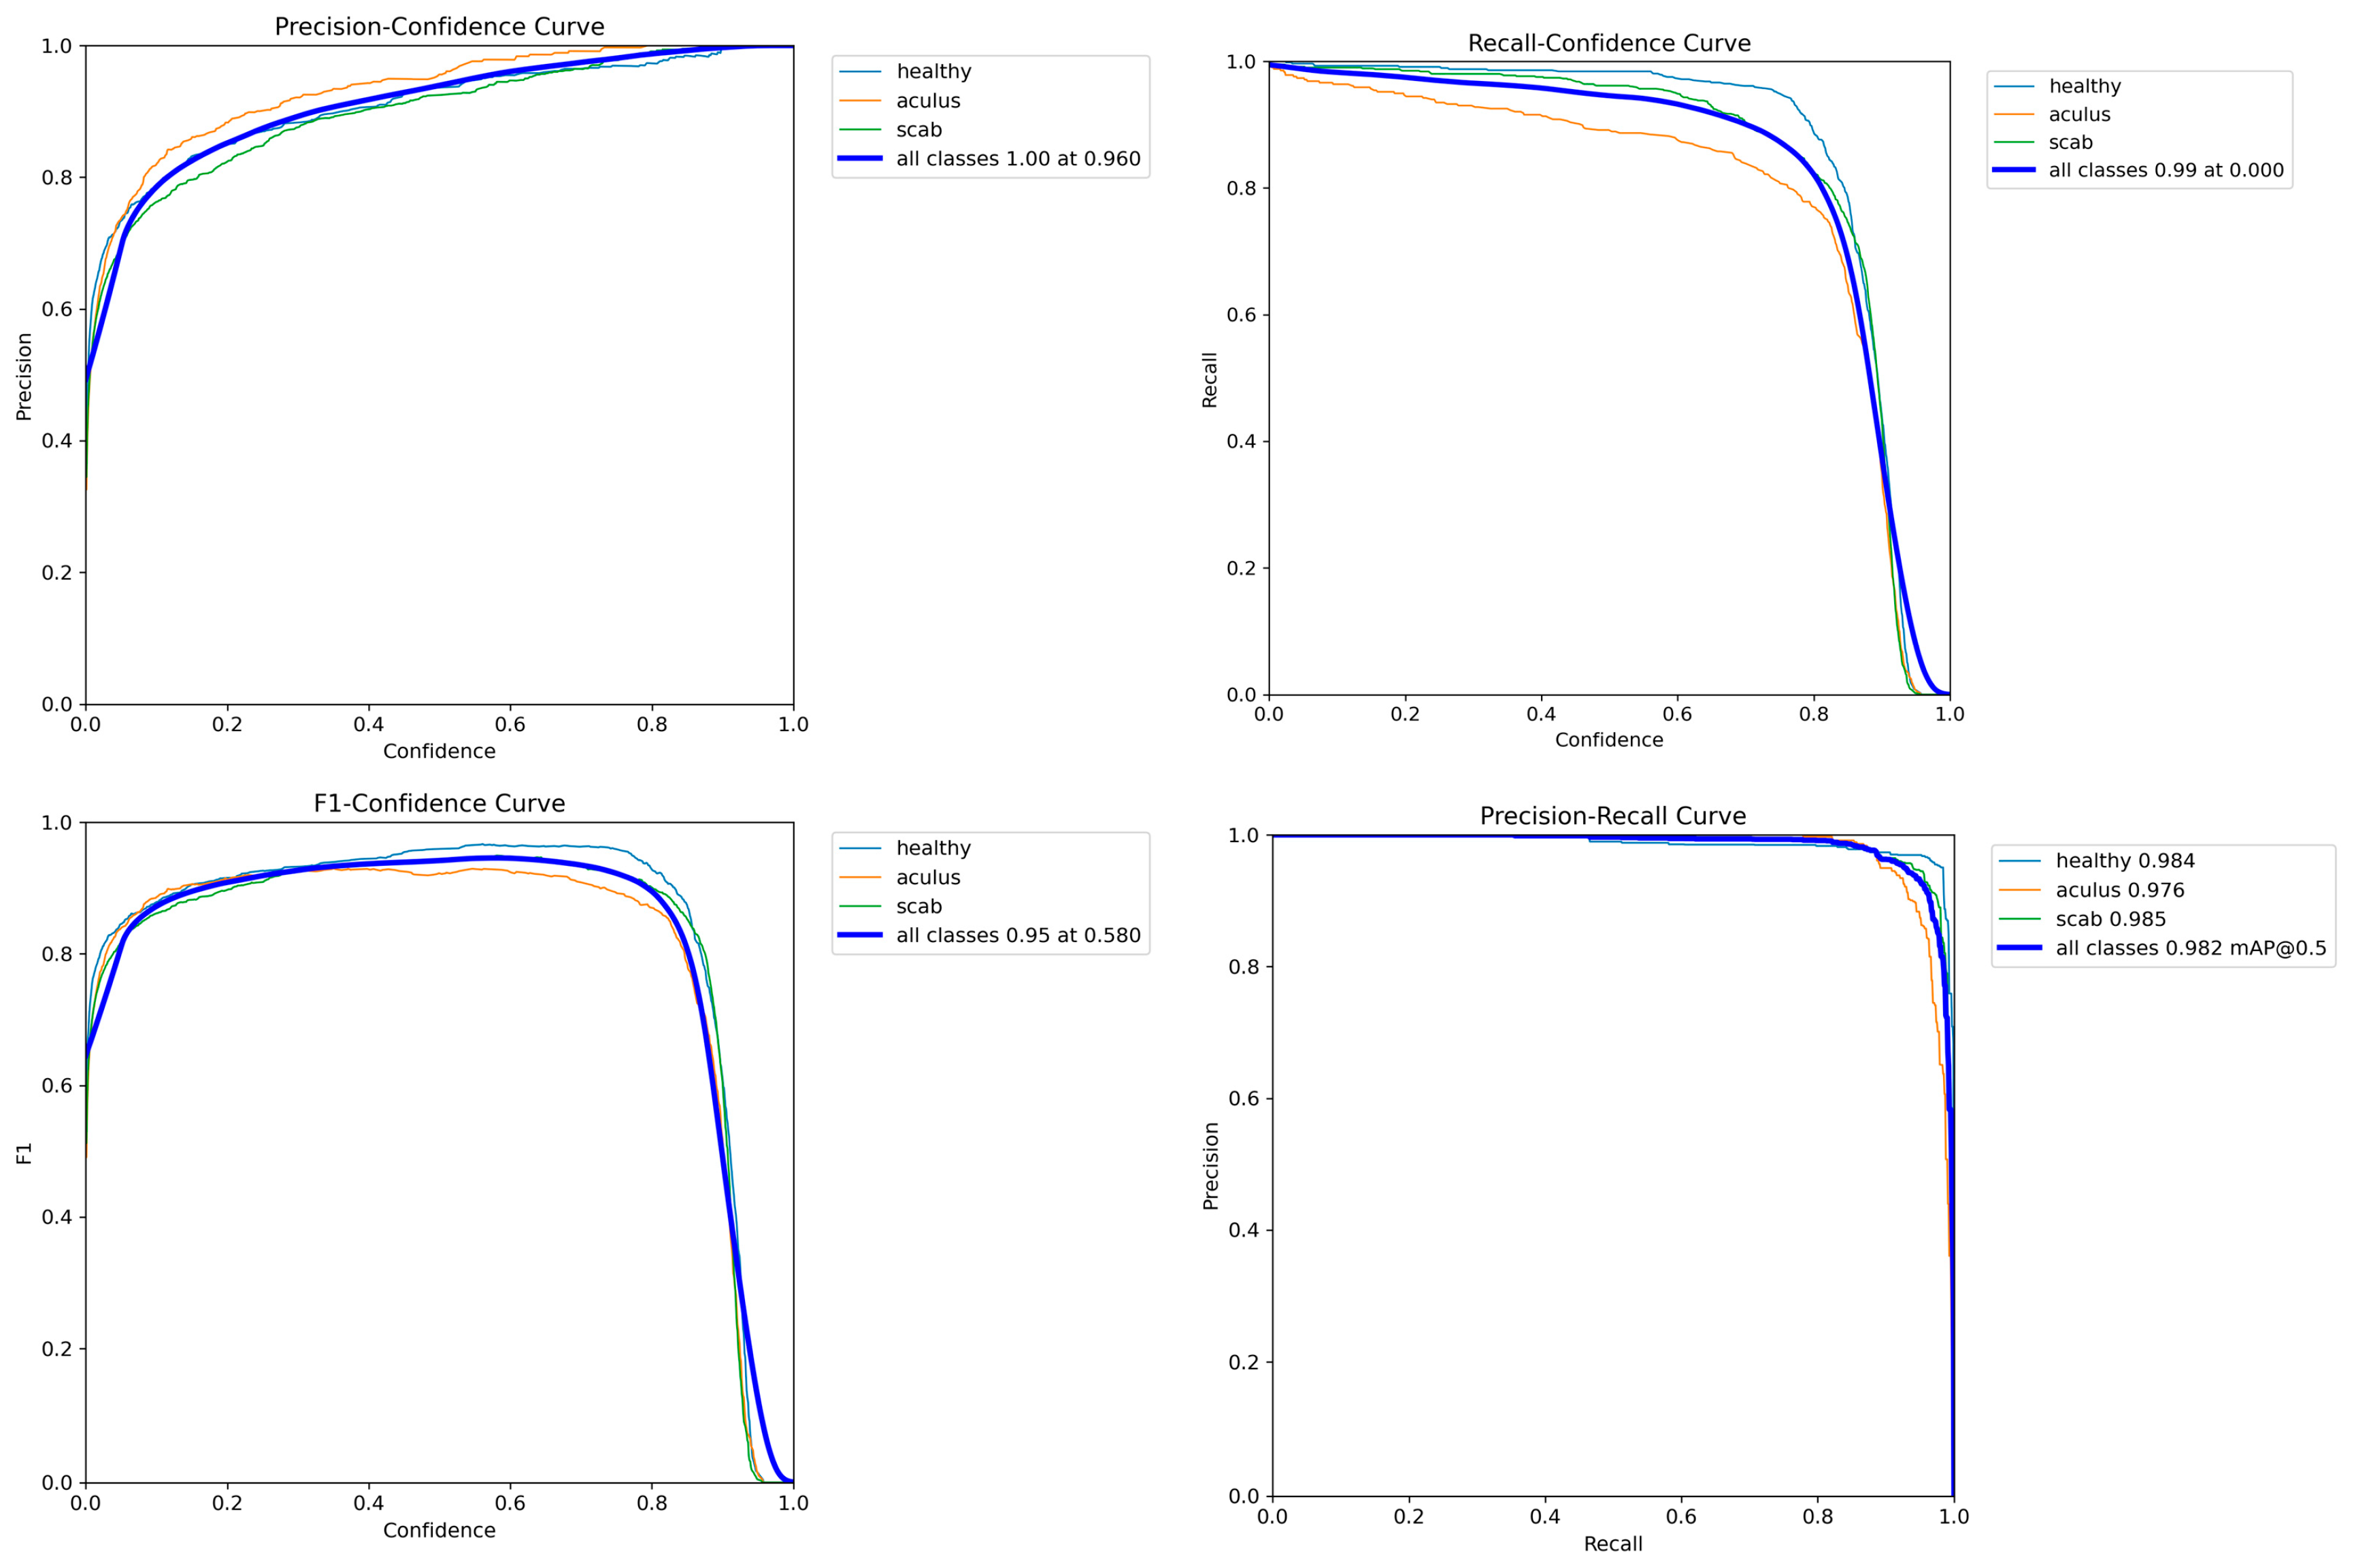
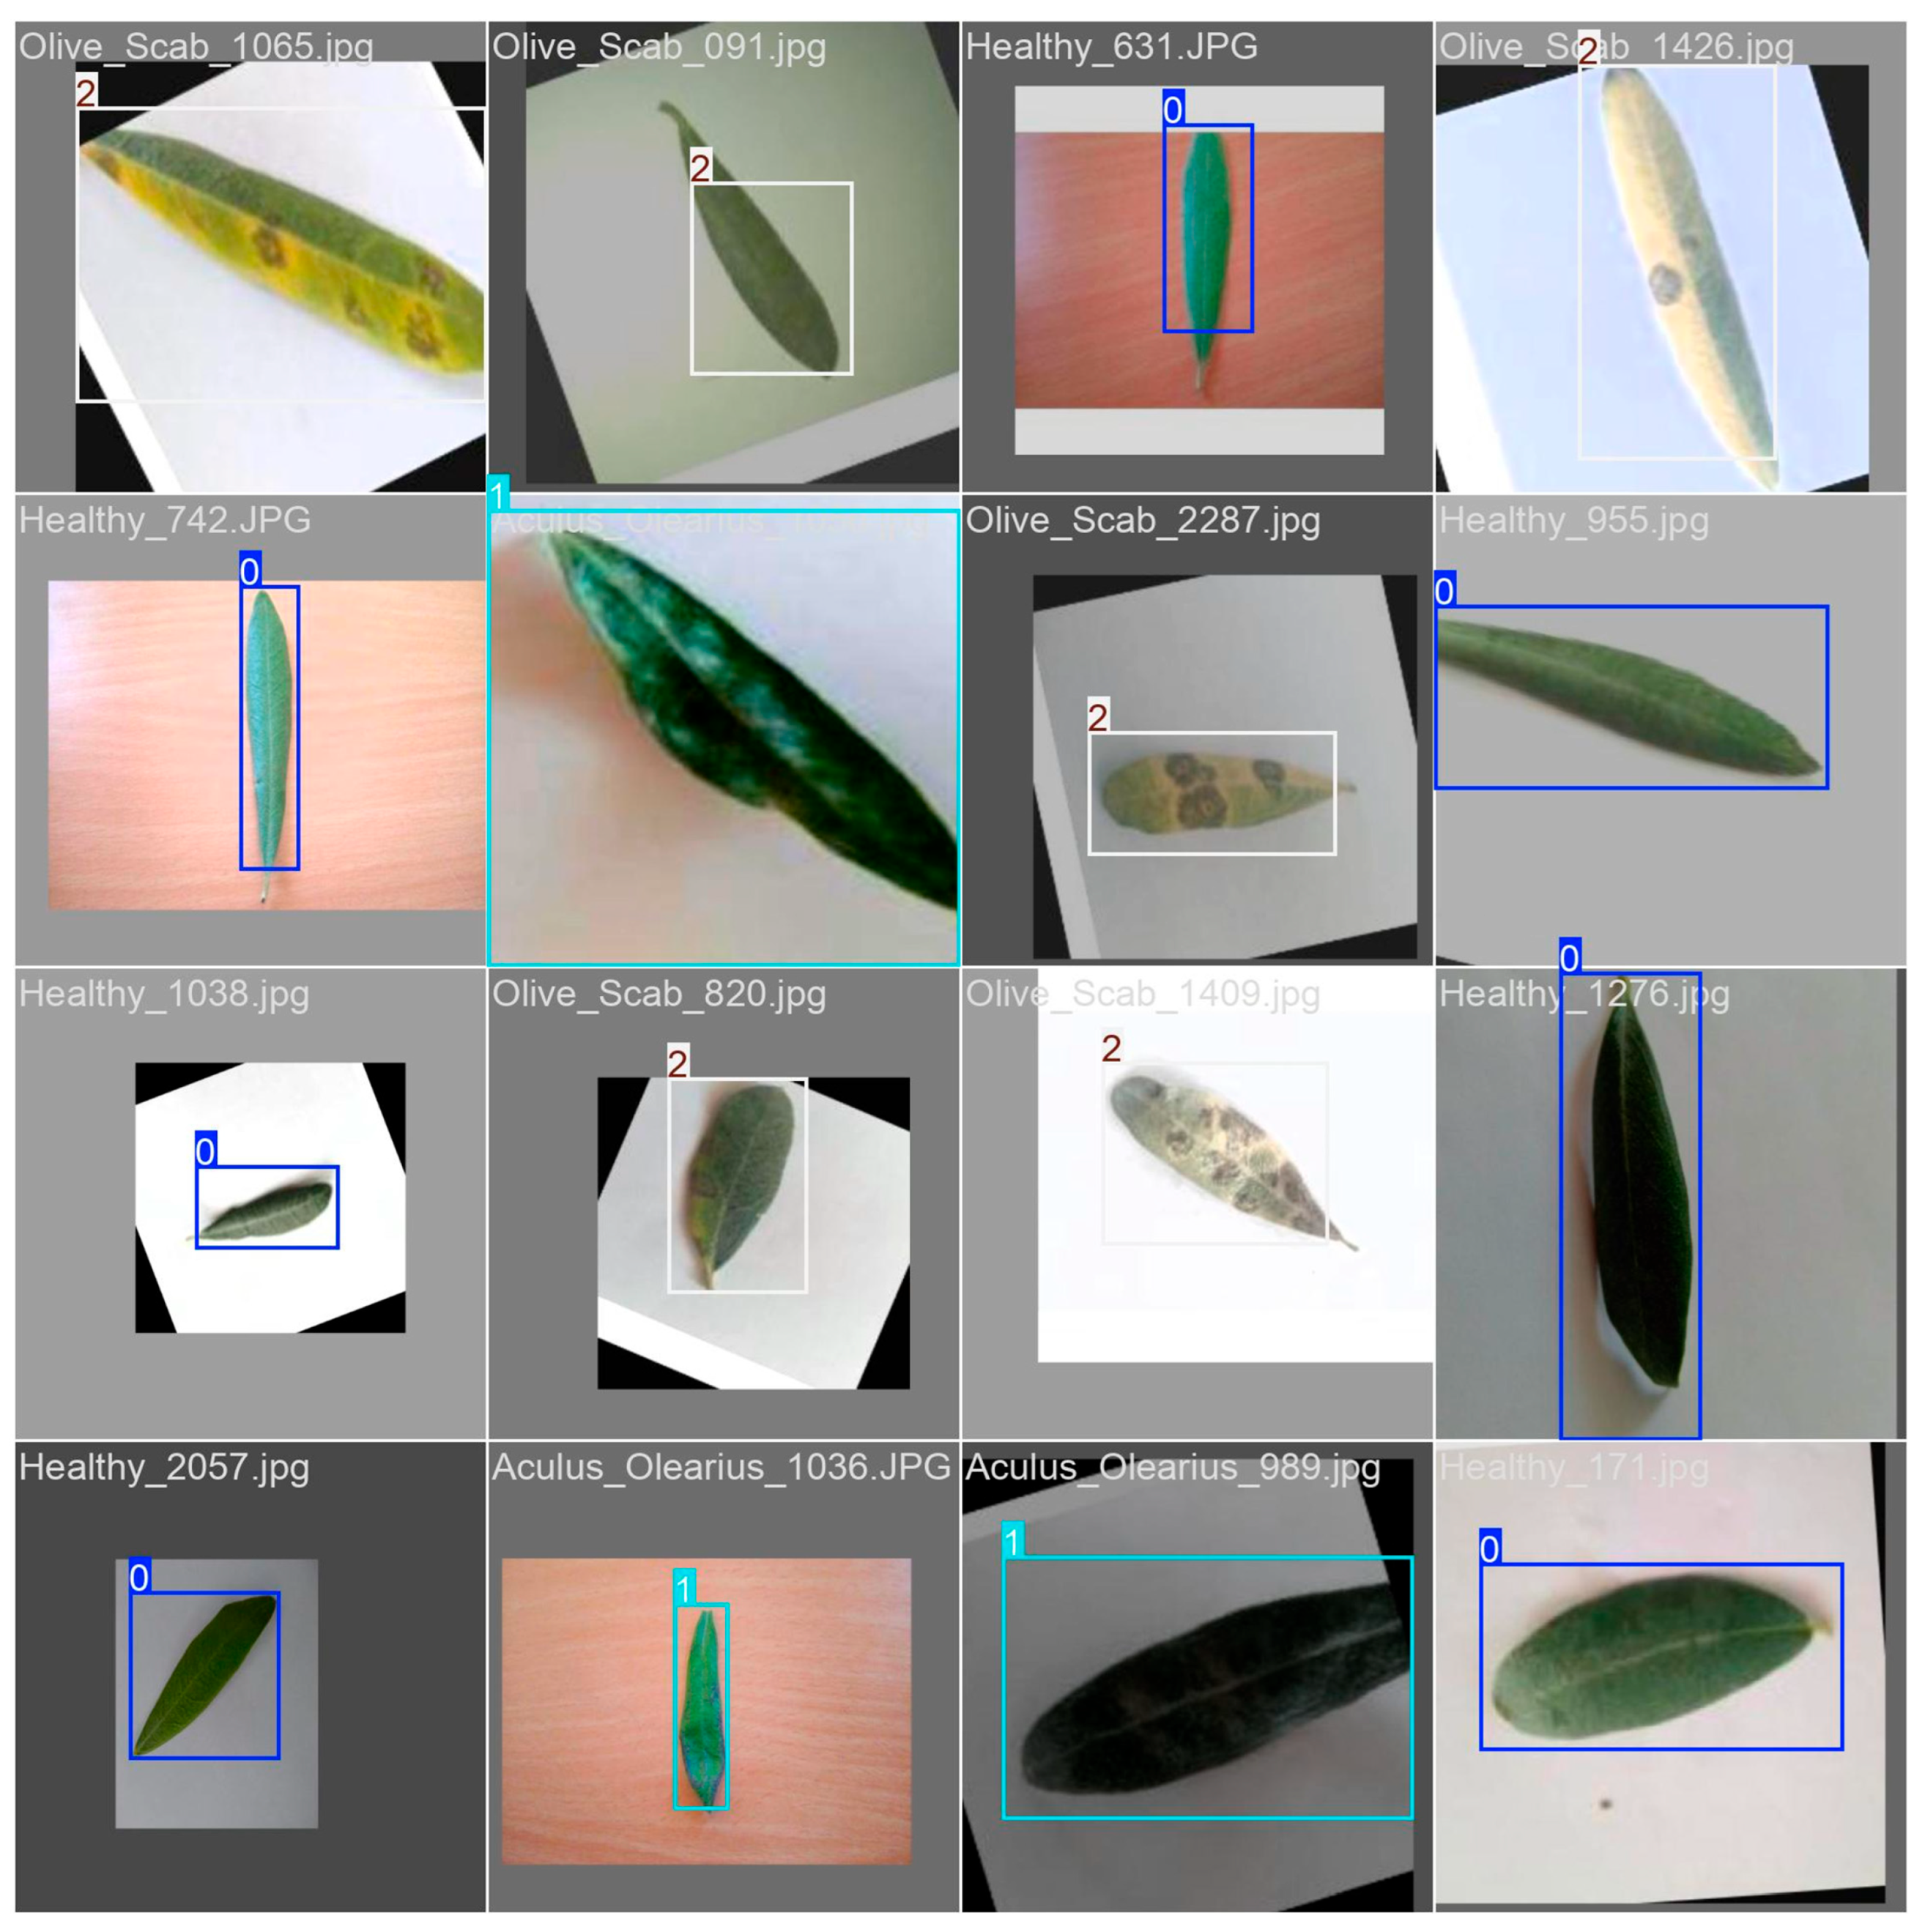
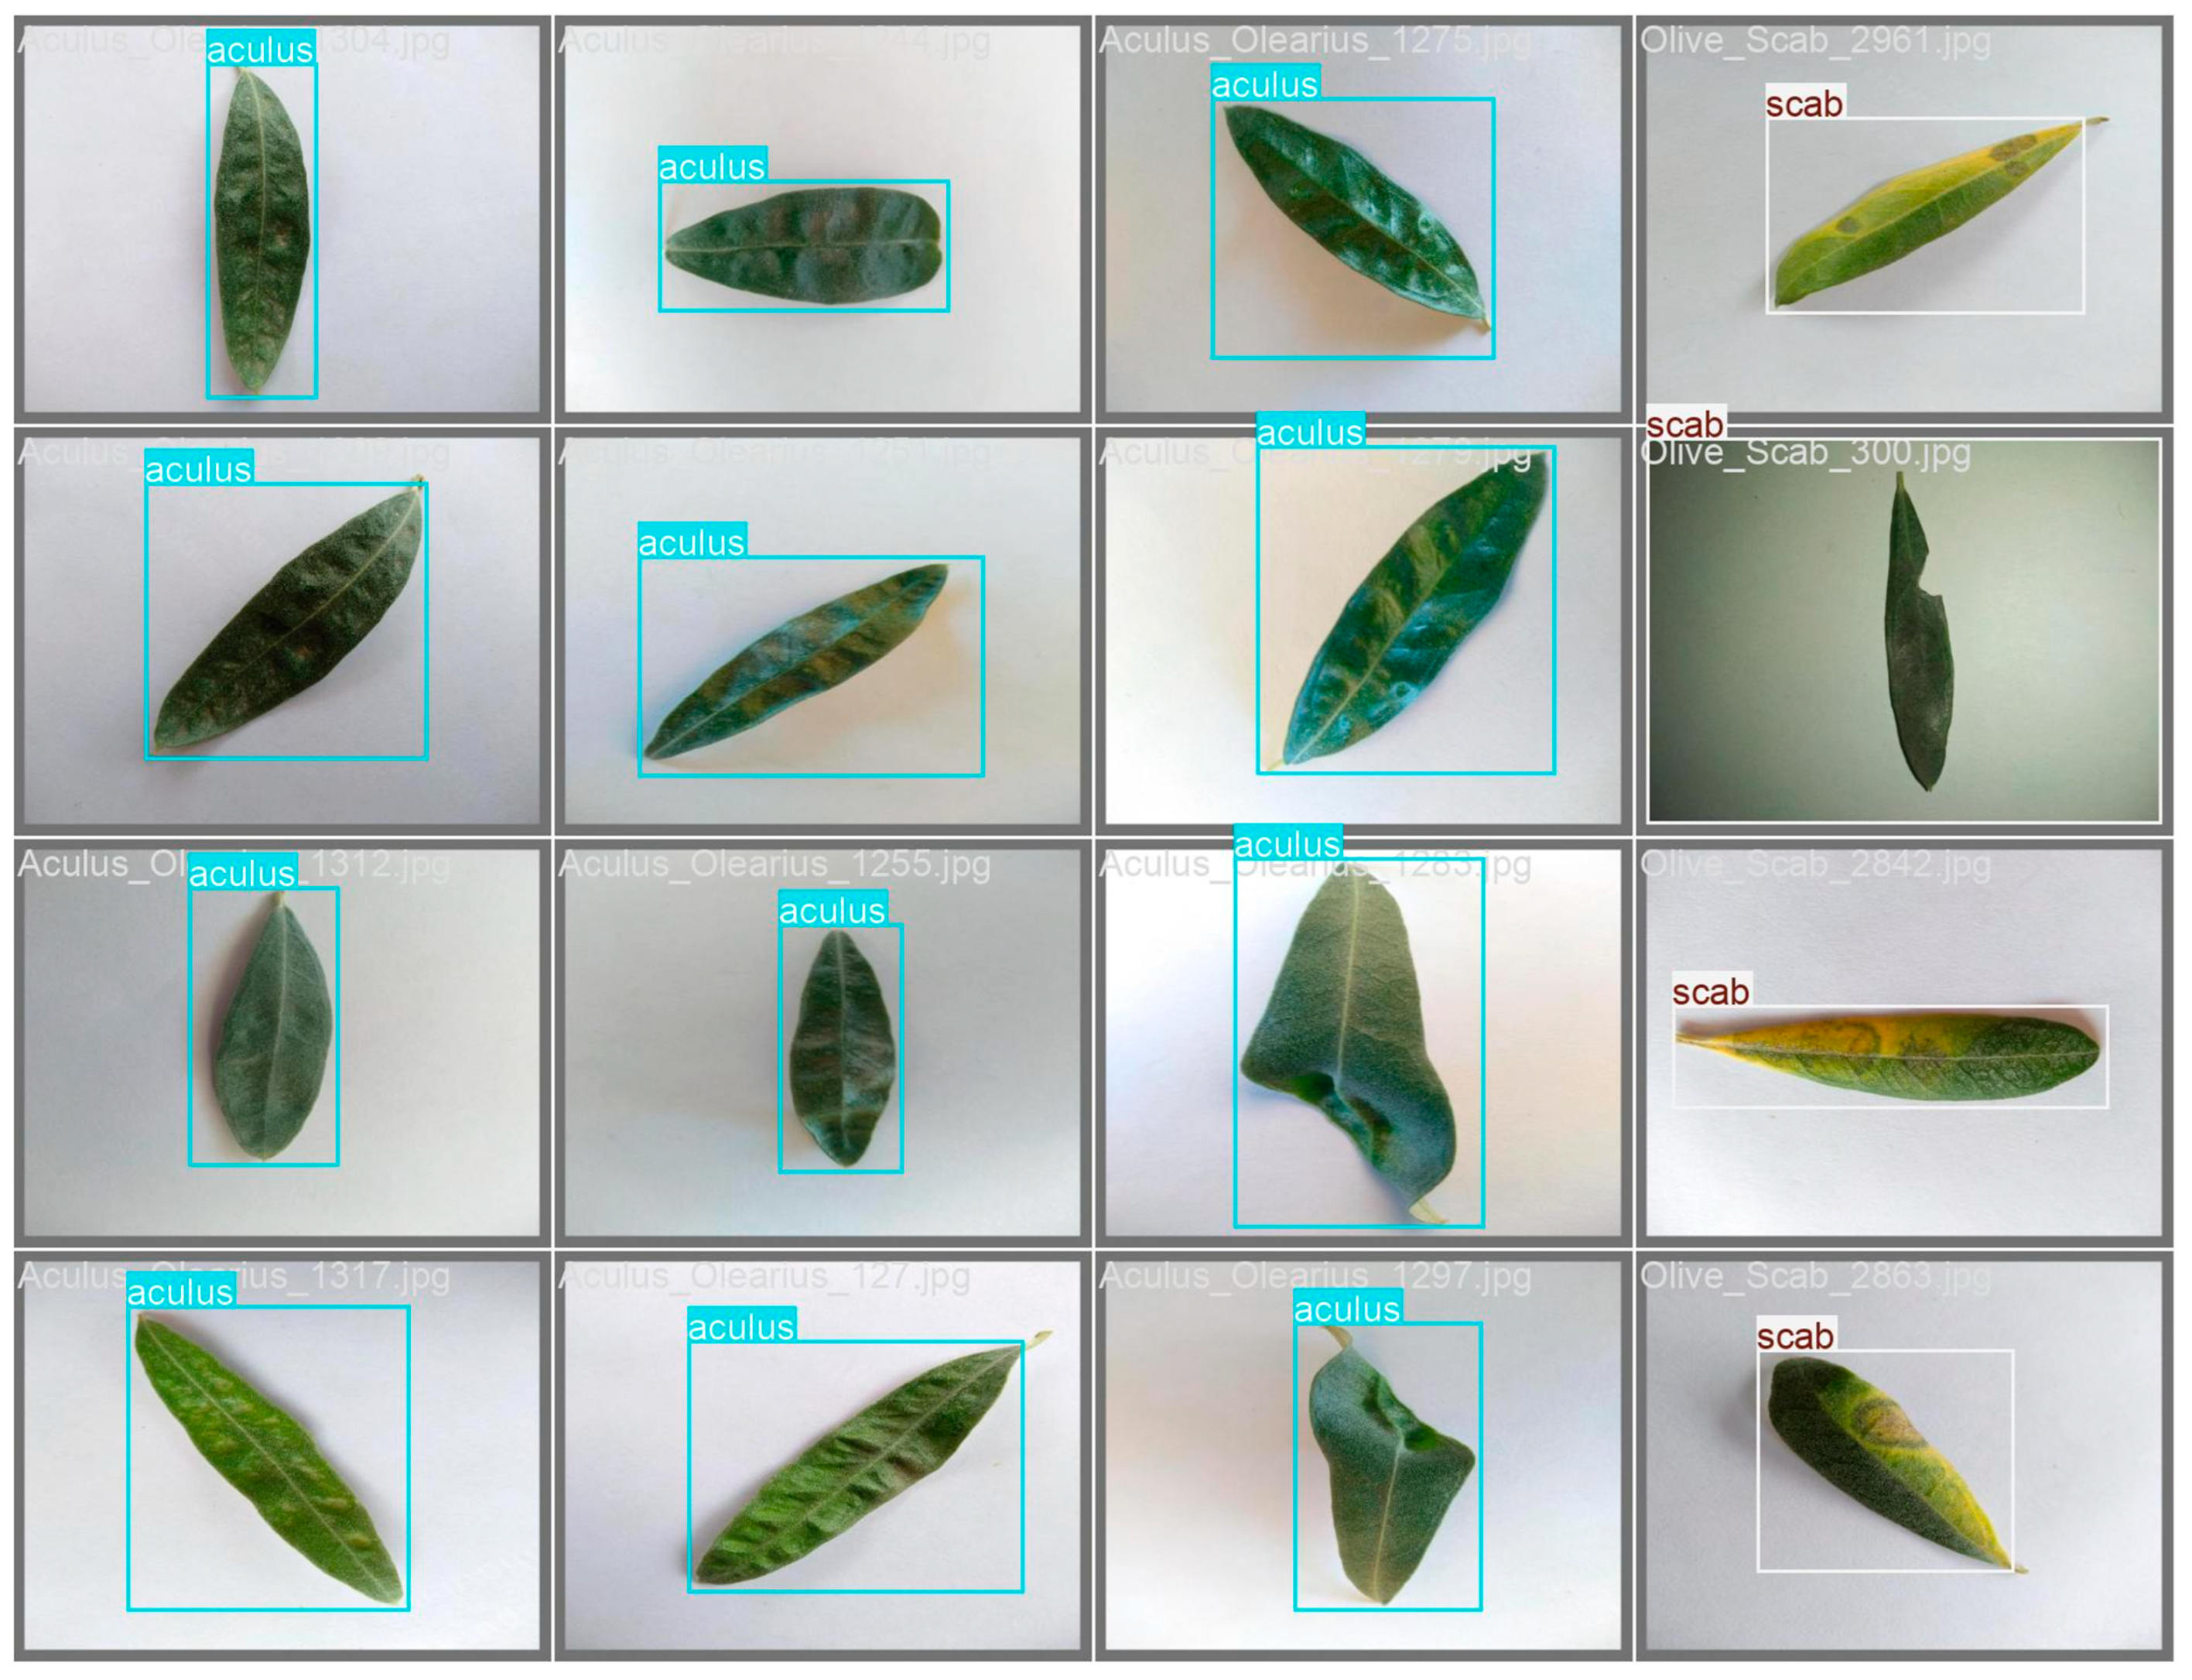
This paper introduces OLIVE-CAD, a novel Computer-Aided Diagnostics system designed for the real life, on-site detection of olive leaf diseases. The core of the system is a YOLOv12-based convolutional neural network model, which was trained on a comprehensive dataset of 11,315 olive leaf images. The images were categorized into 'Aculus', 'Scab', and 'Healthy,' with the dataset divided for training (70%), evaluation (20%), and real-world testing (10%). The key contribution of this work is the end-to-end integration of a custom, field-deployable Computer-Aided Diagnostics system. The trained YOLOv12 model achieved a mean average precision of 98.2% and mean average recall of 95.4%, while the model achieves class-specific evaluation precision of 95.3% and recall of 97.7% for 'Healthy' class; 97.9% precision and 88.3% of recall for 'Aculus' class; and precision of 94.3% and 95.4% of recall for 'Scab' class. OLIVE-CAD enables the storage of the immediate disease diagnostic outcomes to a predesigned database, providing a practical, deployable solution for agricultural applications. The research recommends an IoT-Based real-time central operation diagnostic monitoring system as future work.
Keywords:
1. Introduction
2. Materials and Methods
2.1. Dataset Description and Preparation
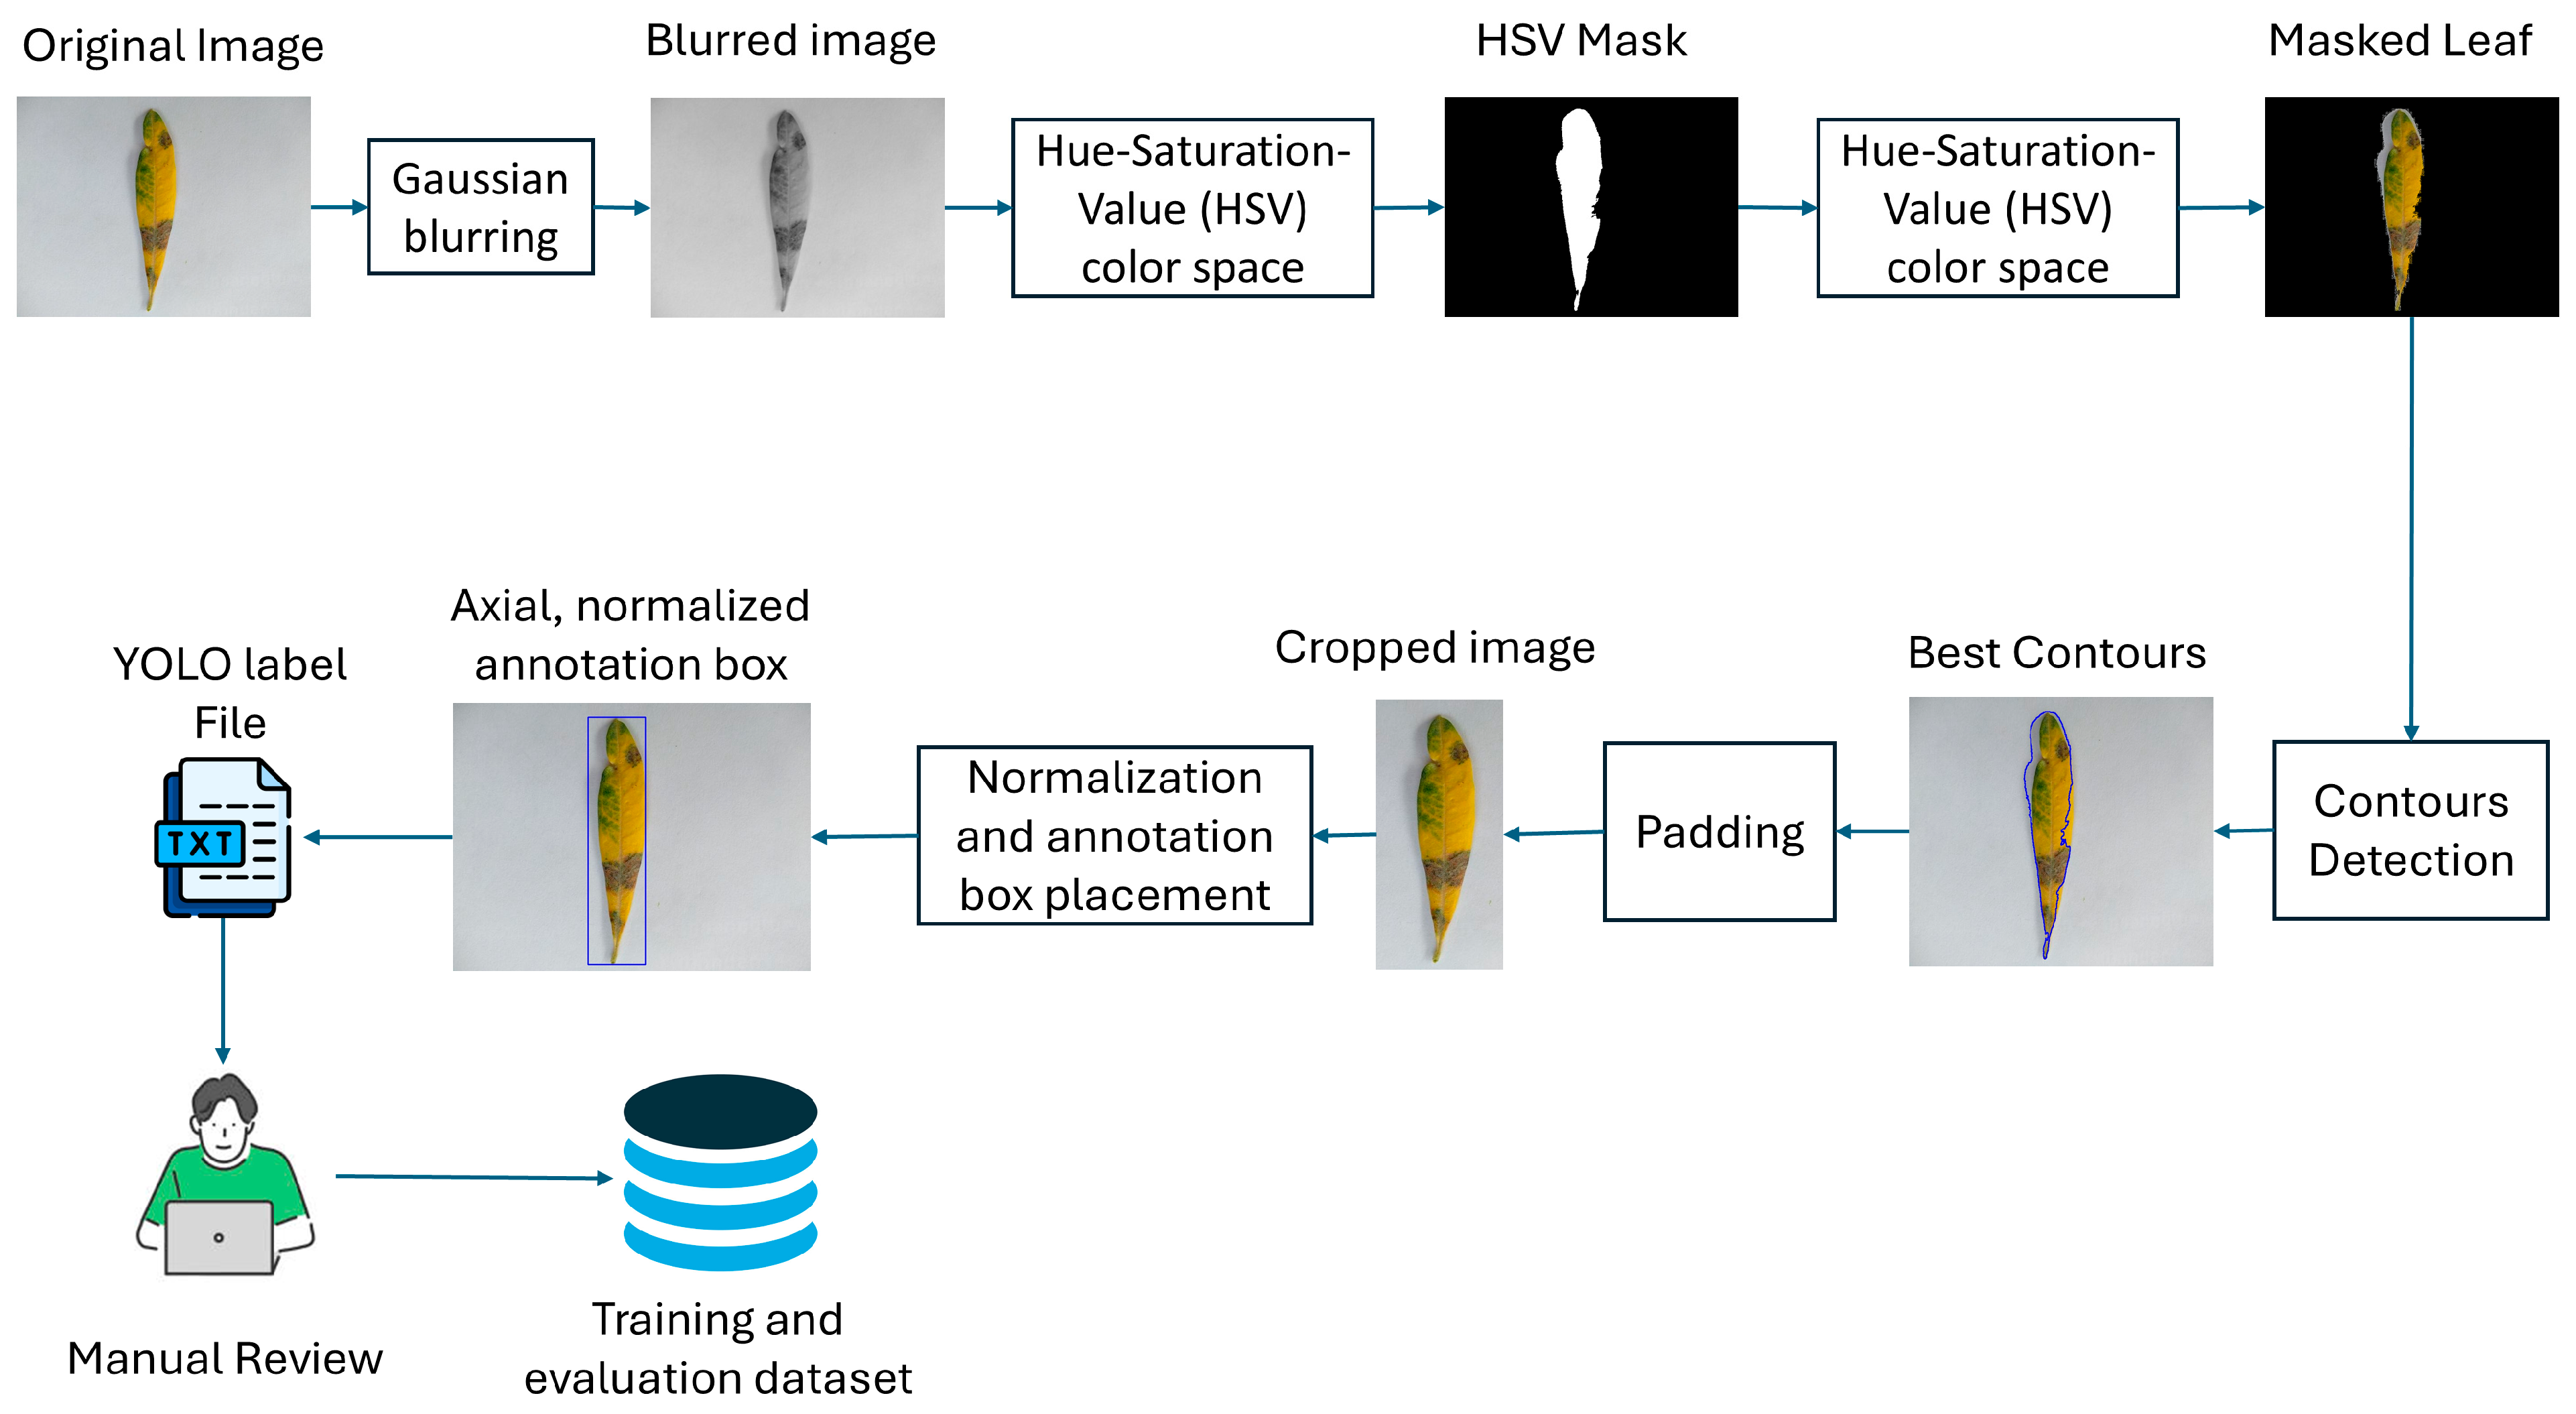
2.2. Dataset Preparation
2.3. YOLOv12 Model
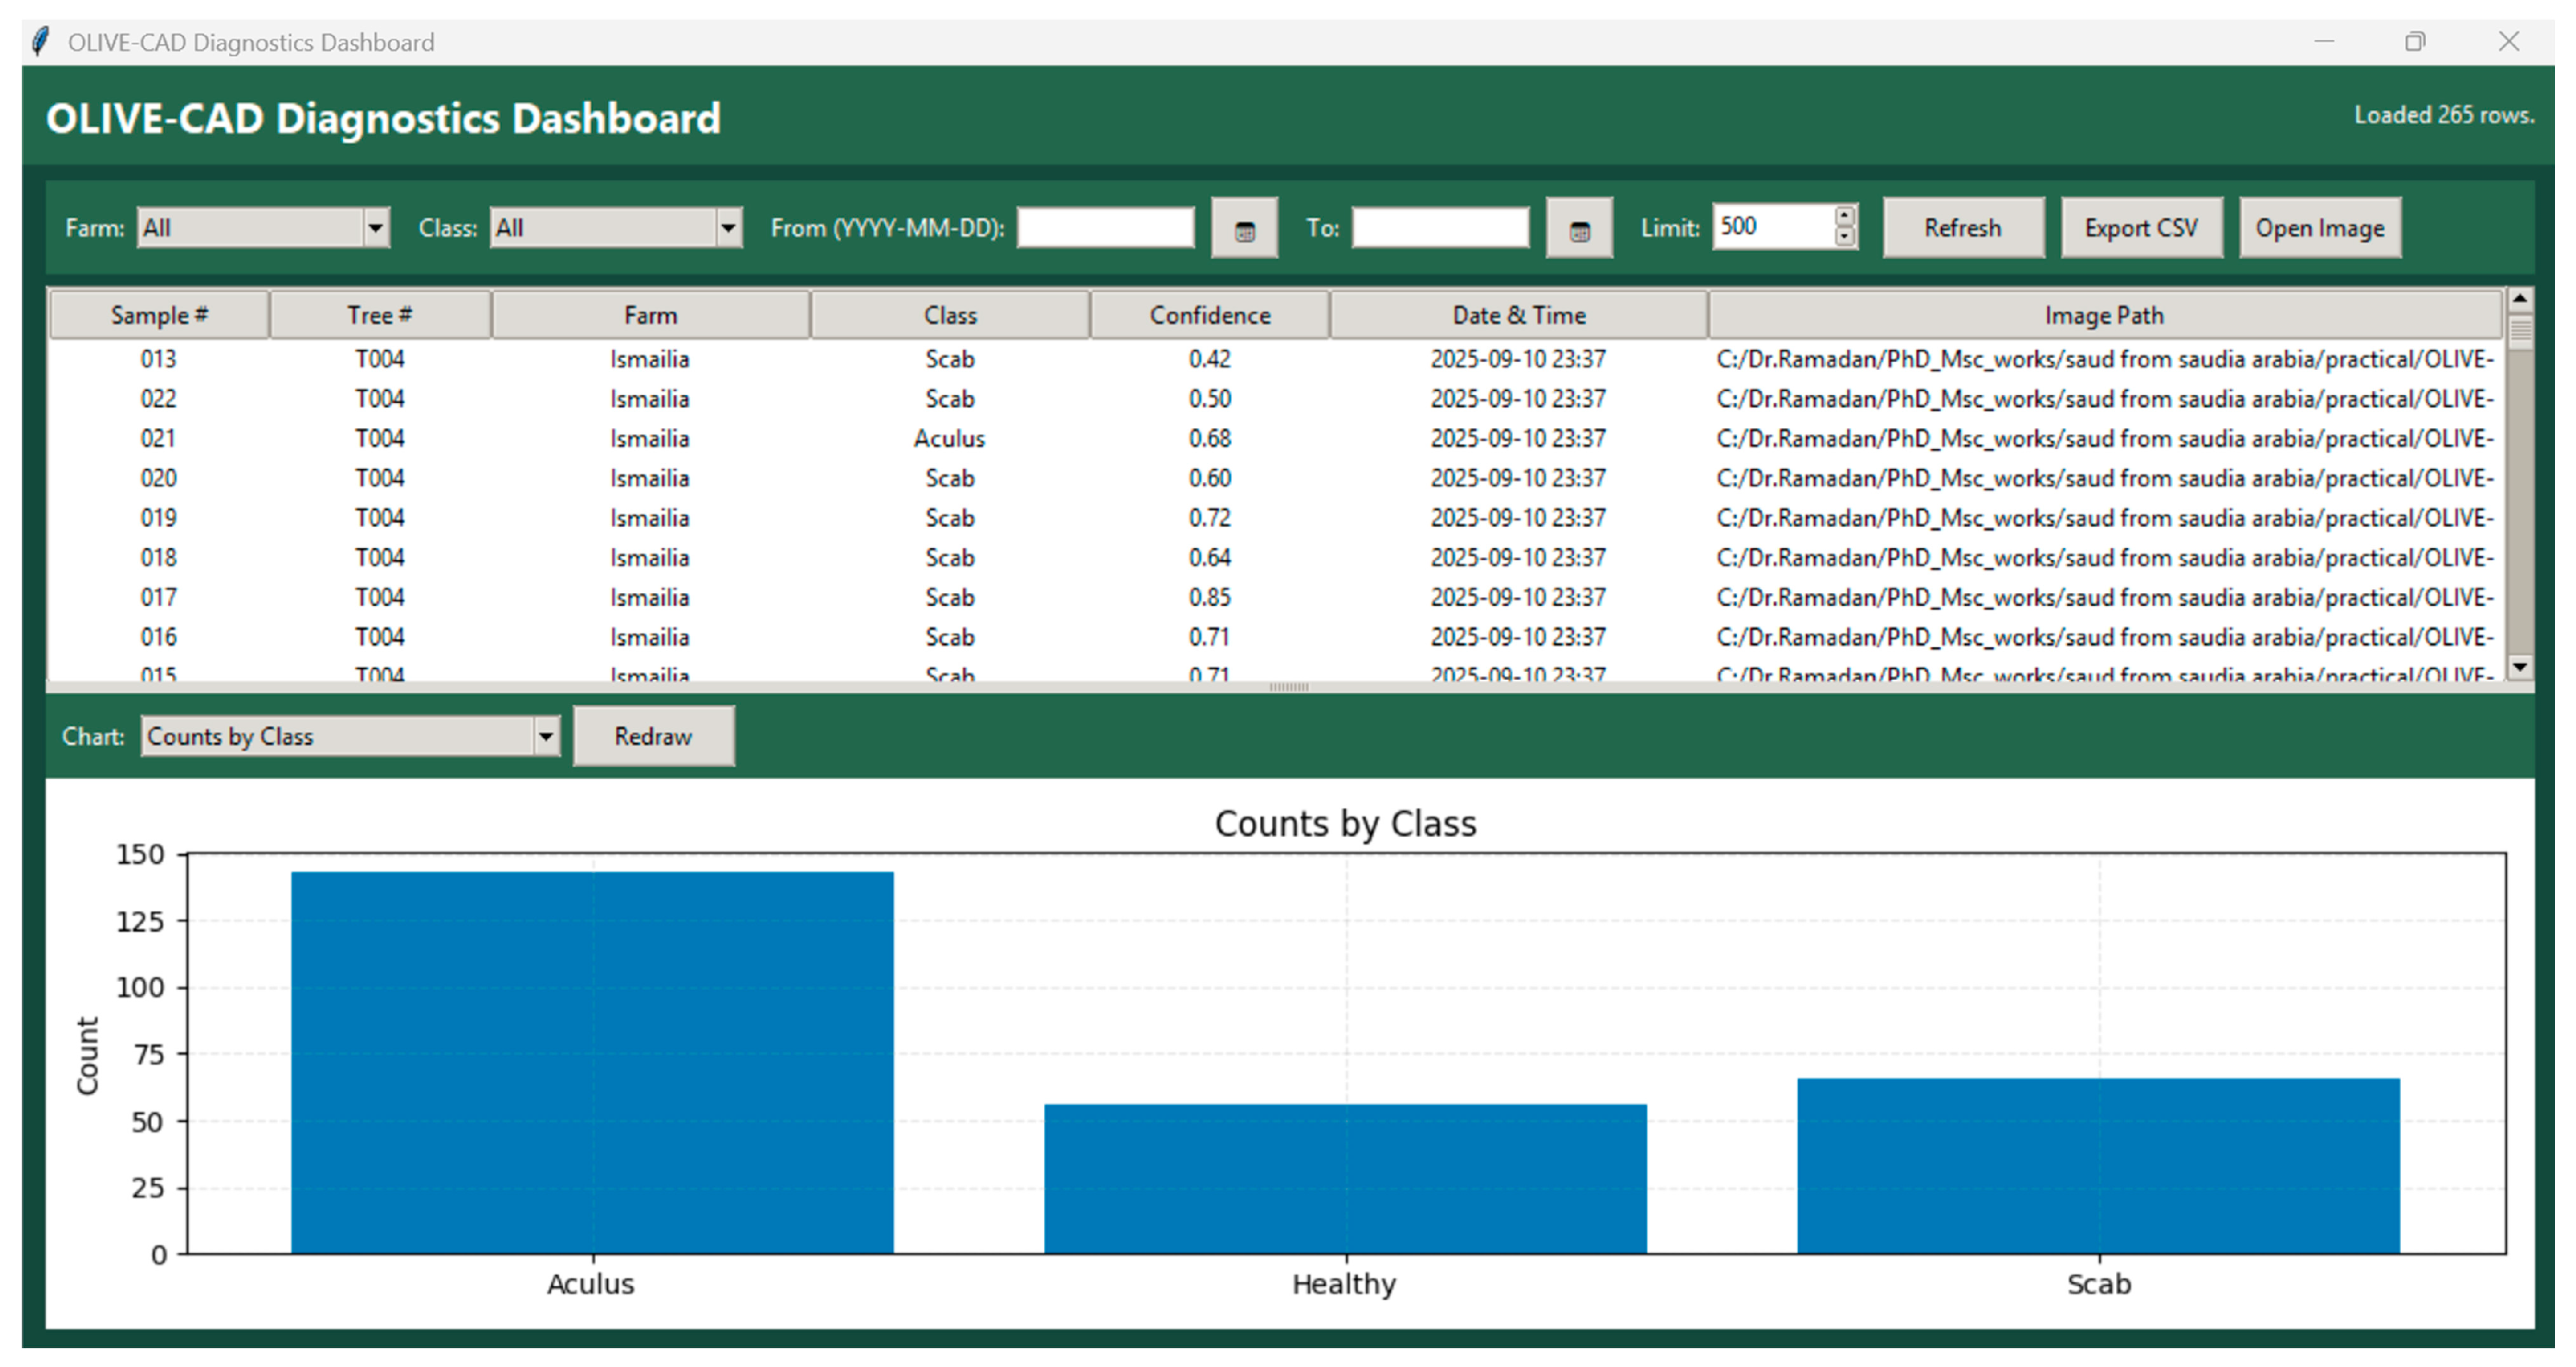
2.4. The OLIVE-CAD Diagnostic System
3. Results
Model Training and Evaluation
4. Discussion
Supplementary Materials
Author Contributions
Funding
Acknowledgments
Conflicts of Interest
Abbreviations
| OLIVE-CAD | Olive Computer Aided Diagnostic system |
| HSV | Hue-Saturation-Value |
| CNN | Convolutional Neural Network |
| GUI | Graphical User Interface |
References
- A. Rhouma, “Plant Diseases: Types, Causes & Impacts,” Egyptian Journal of Agricultural Sciences, vol. 76, no. 3, pp. 21–46, Jul. 2025. [CrossRef]
- C. L. Nkwocha and A. K. Chandel, “Towards an End-to-End Digital Framework for Precision Crop Disease Diagnosis and Management Based on Emerging Sensing and Computing Technologies: State over Past Decade and Prospects,” Computers 2025, Vol. 14, Page 443, vol. 14, no. 10, p. 443, Oct. 2025. [CrossRef]
- Madhavi, T. P. Singh, and S. P. Singh, “Plant Disease Detection: Comprehensive Review of Methods and Techniques,” Machine Learning for Disease Detection, Prediction, and Diagnosis, pp. 367–383, 2025. [CrossRef]
- M. Bagga and S. Goyal, “A Comparative Study of the Deep Learning Based Image Segmentation Techniques for Fruit Disease Detection,” Reviews in Agricultural Science, vol. 13, no. 1, pp. 81–104, Mar. 2025. [CrossRef]
- A. K. M. F. K. Siam, P. Bishshash, M. A. S. Nirob, S. Bin Mamun, M. Assaduzzaman, and S. R. H. Noori, “A comprehensive image dataset for the identification of lemon leaf diseases and computer vision applications,” Data Brief, vol. 58, p. 111244, Feb. 2025. [CrossRef]
- S. A. Patil, A. Bhosale, and A. Patil, “Advancements in plant leaf disease detection: a comprehensive review of latest trends and technologies,” in 2024 3rd International Conference for Innovation in Technology (INOCON), IEEE, 2024, pp. 1–5.
- S. K. Borah, M. Padhiary, L. N. Sethi, A. Kumar, and P. Saikia, “Precision Farming with Drone Sprayers: A Review of Auto Navigation and Vision-Based Optimization,” Journal of Biosystems Engineering 2025 50:2, vol. 50, no. 2, pp. 255–273, May 2025. [CrossRef]
- J. J. Liu, H. Wu, and I. Riaz, “Advanced Technologies for Smart Fertilizer Management in Agriculture: A Review,” IEEE Access, vol. 13, pp. 139766–139790, 2025. [CrossRef]
- D. A. Anagnostopoulos and D. Tsaltas, “Current status, recent advances, and main challenges on table olive fermentation: The present meets the future,” Front Microbiol, vol. 12, p. 797295, 2022.
- A. J. Huertas-Alonso et al., “Table olive wastewater as a potential source of biophenols for valorization: A mini review,” Fermentation, vol. 8, no. 5, p. 215, 2022.
- A. Benítez-Cabello, A. M. Delgado, and C. Quintas, “Main challenges expected from the impact of climate change on microbial biodiversity of table olives: current status and trends,” Foods, vol. 12, no. 19, p. 3712, 2023.
- I. Alrashdi and A. Abozeid, “An efficient deep-learning model for olive tree diseases diagnosis in Al-Jouf region,” Alexandria Engineering Journal, vol. 130, pp. 709–723, Oct. 2025. [CrossRef]
- S. Chouchf, W. Zarrik, and A. E. B. El Alaoui, “A Comparison of Quantization Techniques for Mobile Olive Disease Detection,” in 2025 5th International Conference on Innovative Research in Applied Science, Engineering and Technology (IRASET), IEEE, 2025, pp. 1–5.
- E. Jain and A. Singh, “Olive Leaf Disease Classification Using the Xception Model: A Deep Learning Approach,” in 2024 International Conference on Cybernation and Computation (CYBERCOM), IEEE, 2024, pp. 715–719.
- K. U. Majikumna, M. Zineddine, and A. E. H. Alaoui, “FLVAEGWO-CNN: Grey Wolf Optimisation-Based CNN for Classification of Olive Leaf Disease via Focal Loss Variational Autoencoder,” Journal of Phytopathology, vol. 172, no. 6, p. e13438, 2024.
- A. Diker et al., “An effective feature extraction method for olive peacock eye leaf disease classification,” European Food Research and Technology, vol. 250, no. 1, pp. 287–299, 2024.
- S. Huaquipaco et al., “Peacock spot detection in olive leaves using self supervised learning in an assembly meta-architecture,” IEEE Access, 2024.
- I. F. Kallel, M. Kallel, K. Kammoun, M. Salhi, and M. A. Triki, “Deep learning models for automatic detection and classification of pathogens in olive leaves,” in 2024 4th International Conference on Innovative Research in Applied Science, Engineering and Technology (IRASET), IEEE, 2024, pp. 1–6.
- M. Dammak, A. Makhloufi, B. Louati, and A. Kallel, “Detection and Classification of Olive Leaves Diseases Using Machine Learning Algorithms,” in International Conference on Computational Collective Intelligence, Springer, 2024, pp. 292–304.
- E. Guermazi, A. Mdhaffar, M. Jmaiel, and B. Freisleben, “LIDL4Oliv: A Lightweight Incremental Deep Learning Model for Classifying Olive Diseases in Images.,” in ICAART (2), 2024, pp. 583–594.
- A. Ksibi, M. Ayadi, B. O. Soufiene, M. M. Jamjoom, and Z. Ullah, “MobiRes-net: a hybrid deep learning model for detecting and classifying olive leaf diseases,” Applied Sciences, vol. 12, no. 20, p. 10278, 2022.
- H. Hamdaoui, Y. Zarrouk, N.-E. Kouddane, Y. Hsana, H. AL Kaddouri, and F. Chkird, “A Deep Learning-Based Model for Efficient Olive Leaf Disease Classification,” in International Conference on Electronic Engineering and Renewable Energy Systems, Springer, 2024, pp. 477–487.
- I. Pacal, S. Kilicarslan, B. Ozdemir, M. Deveci, and S. Kadry, “Efficient and autonomous detection of olive leaf diseases using AI-enhanced MetaFormer,” Artificial Intelligence Review 2025 58:10, vol. 58, no. 10, pp. 1–35, Jul. 2025. [CrossRef]
- “View of Olive Leaf Disease Detection using Improvised Machine Learning Techniques.” Accessed: Nov. 12, 2025. [Online]. Available: https://semarakilmu.my/index.php/sijml/article/view/239/304.
- F. M. Talaat, M. Y. Shams, S. A. Gamel, and H. ZainEldin, “DeepLeaf: an optimized deep learning approach for automated recognition of grapevine leaf diseases,” Neural Computing and Applications 2025 37:15, vol. 37, no. 15, pp. 8799–8823, Feb. 2025. [CrossRef]
- F. Rahman and K. S. Raghatate, “Smart Agriculture: Predicting Diseases in olive using Deep Learning Algorithms,” SHS Web of Conferences, vol. 216, p. 01009, 2025. [CrossRef]
- “Olive Leaf Image Dataset.” Accessed: Aug. 12, 2025. [Online]. Available: https://www.kaggle.com/datasets/habibulbasher01644/olive-leaf-image-dataset.
- “Olive Leaf Disease Detection.” Accessed: Aug. 12, 2025. [Online]. Available: https://www.kaggle.com/code/mahmoudlimam/olive-leaf-disease-detection/input.
- “Olive Leaf Disease.” Accessed: Aug. 12, 2025. [Online]. Available: https://www.kaggle.com/datasets/serhathoca/zeytin.
- M. Bagga and S. Goyal, “A Comparative Study of the Deep Learning Based Image Segmentation Techniques for Fruit Disease Detection,” Reviews in Agricultural Science, vol. 13, no. 1, pp. 81–104, 2025.
- H. Hamzaoui et al., “Assessment of Peacock Spot Disease (Fusicladium oleagineum) in Olive Orchards Through Agronomic Approaches and UAV-Based Multispectral Imaging,” Horticulturae, vol. 11, no. 1, p. 46, 2025.
- B. Lee, H. Lee, X. Sun, U. Ali, and E. Park, “Deblurring 3d gaussian splatting,” in European Conference on Computer Vision, Springer, 2024, pp. 127–143.
- C. Wu, D. Wang, and K. Huang, “Enhancement of mine images based on hsv color space,” IEEE Access, vol. 12, pp. 72170–72186, 2024.
- J. Bayón, J. Recas, and M. Guijarro, “An optimized, color-adaptive blue light filtering approach using a novel color space transformation,” Displays, vol. 90, p. 103124, 2025.
- M. L. Ali and Z. Zhang, “The YOLO Framework: A Comprehensive Review of Evolution, Applications, and Benchmarks in Object Detection,” Computers 2024, Vol. 13, Page 336, vol. 13, no. 12, p. 336, Dec. 2024. [CrossRef]
- R. Sapkota, Z. Meng, M. Churuvija, X. Du, Z. Ma, and M. Karkee, “Comprehensive performance evaluation of yolov12, yolo11, yolov10, yolov9 and yolov8 on detecting and counting fruitlet in complex orchard environments,” arXiv preprint arXiv:2407.12040, 2024.
- N. Jegham, C. Y. Koh, M. Abdelatti, and A. Hendawi, “Yolo evolution: A comprehensive benchmark and architectural review of yolov12, yolo11, and their previous versions,” arXiv preprint arXiv:2411.00201, 2024.
- S. P. Mohanty, D. P. Hughes, and M. Salathé, “Using deep learning for image-based plant disease detection,” Front Plant Sci, vol. 7, p. 215232, 2016.
- K. P. Ferentinos, “Deep learning models for plant disease detection and diagnosis,” Comput Electron Agric, vol. 145, pp. 311–318, 2018.

| Ref | Year | Dataset | CAD design | Data storage/review | Performance % |
|---|---|---|---|---|---|
| [14] | 2024 | Aculus, Scab, Healthy | No | No | 99.72 |
| [15] | 2024 | Olive leaf diseases (multi-class) | No | No | 93 |
| [16] | 2024 | Scab vs Healthy | No | No | 99 |
| [17] | 2024 | Scab | No | No | 97.55 |
| [18] | 2024 | Olive leaf pathogens (multi-class) | No | No | 99.2 |
| [19] | 2024 | Olive leaf diseases (multi-class) | No | No | 98.63 |
| [20] | 2024 | Aculus, Peacock spot, Healthy | Yes | No | 95.22 |
| [21] | 2024 | Healthy, Aculus, Scab, Peacock | No | No | 94 |
| [22] | 2024 | Olive leaf diseases (multi-class) | No | No | 89 |
| [23] | 2025 | healthy and infected | No | No | 99.31 |
| [24] | 2025 | healthy and infected | NO | NO | 98.2 |
| [25] | 2025 | healthy and unhealthy | NO | NO | 99.7% |
| [26] | 2025 | healthy and infected | NO | NO | 94% |
| Dataset | Ref | Source | Total | Healthy | Aculus | Scab | Total |
|---|---|---|---|---|---|---|---|
| Dataset1 | [27] | Kaggle | 3400 | 1,050 | 1,460 | 890 | 11315 |
| Dataset2 | [28] | Kaggle | 6961 | 1,926 | 1,778 | 3,257 | |
| Dataset3 | [29] | Kaggle | 954 | 572 | 382 (one file, manually separated) | ||
| Samples | Subset | Percentage | Samples | Description |
|---|---|---|---|---|
| 11315 | Training | 70% | 7920 | Train YOLOv12 model. |
| Evaluation | 20% | 2263 | YOLOv12 model evaluation | |
| Test | 10% | 1132 | YOLOv12 model real-world testing |
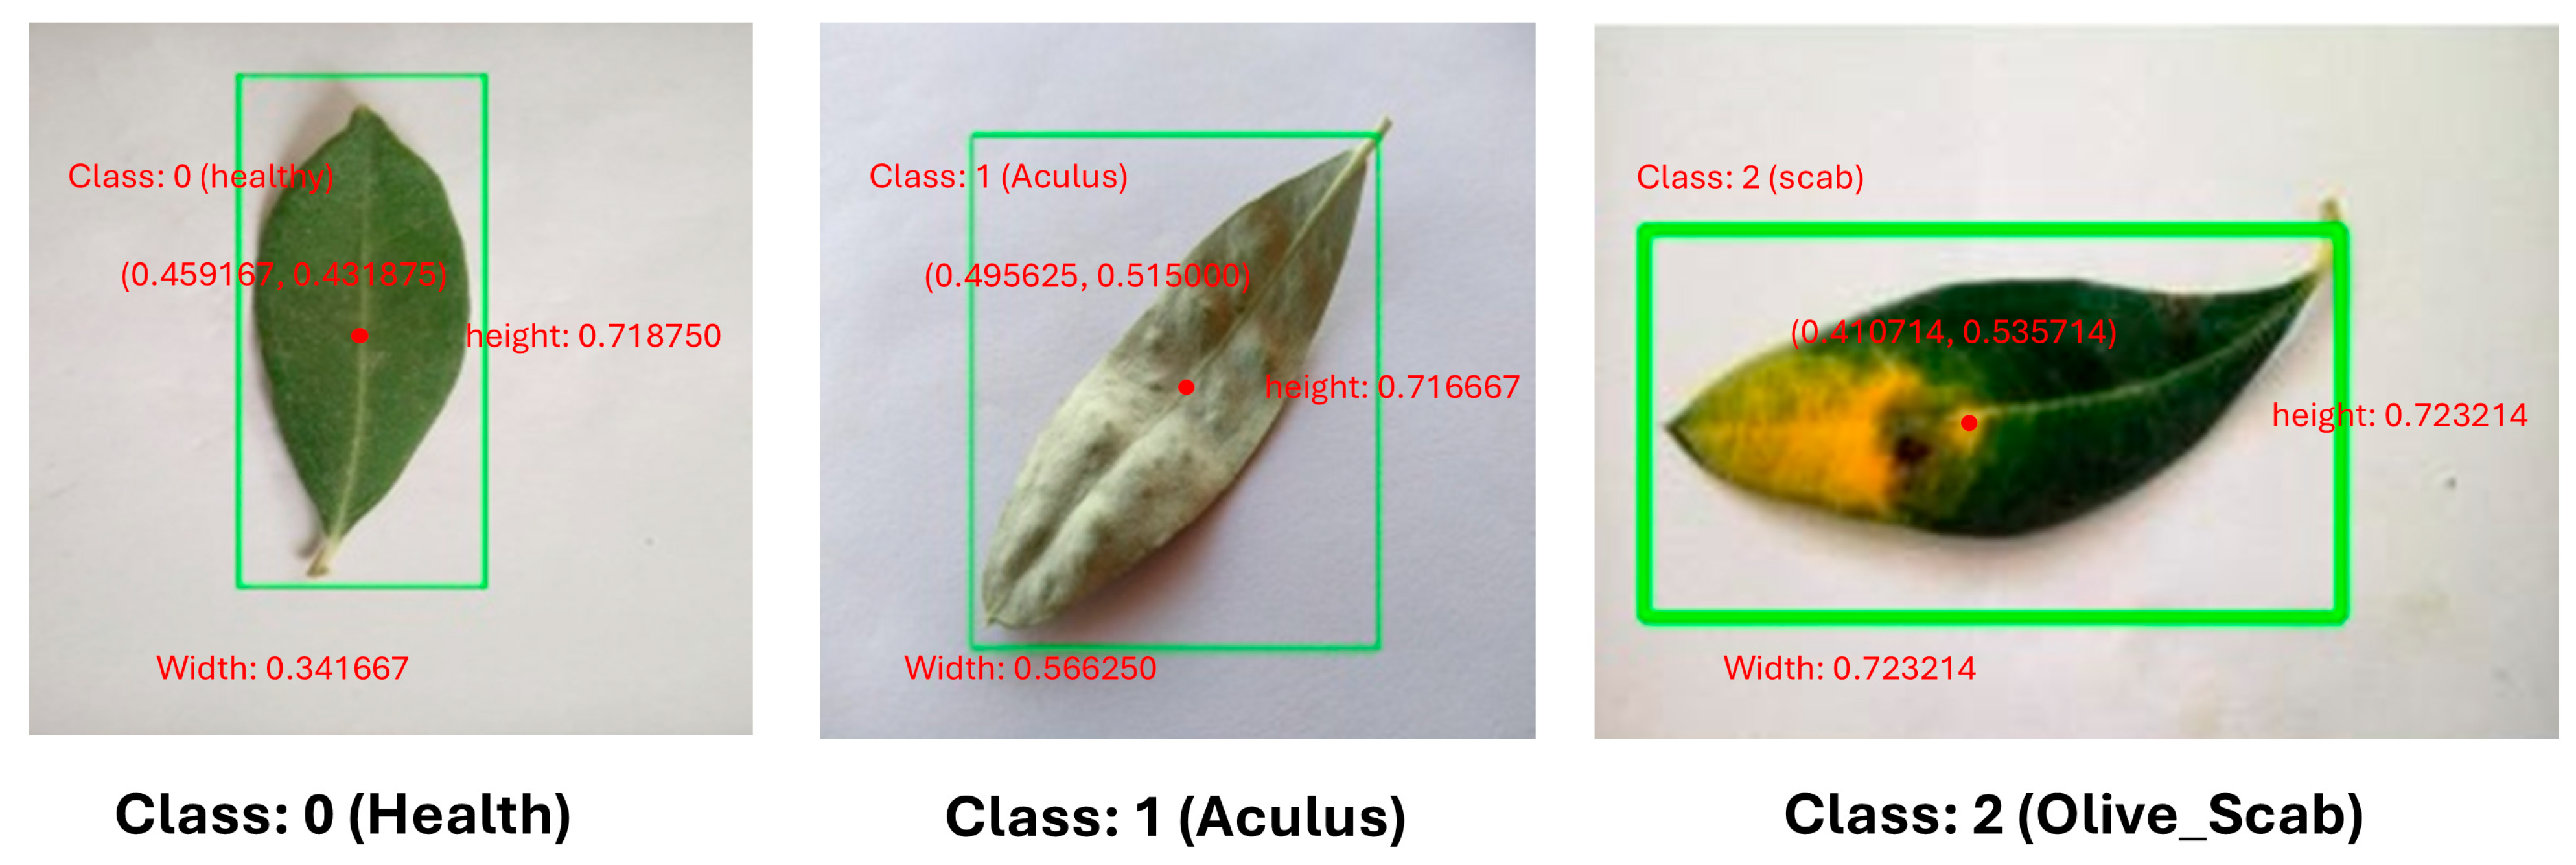
| Field | Description | Range |
|---|---|---|
| Class Id | object class. | 0, 1, 2 |
| X-center | Normalized X-coordinate of center point | 0.0 - 1.0 |
| Y-center | Normalized Y-coordinate of center point | 0.0 - 1.0 |
| Width | Normalized width | 0.0 - 1.0 |
| Height | Normalized height | 0.0 - 1.0 |
| Test dataset | Olive disease | Farm A (25%) | Farm B (25%) | Farm C (25%) | Farm D (25%) | |
|---|---|---|---|---|---|---|
| 1132 sample | Healthy | 355 | 88 | 88 | 88 | 91 |
| Aculus | 343 | 85 | 85 | 85 | 88 | |
| Scab | 434 | 108 | 108 | 108 | 110 | |
| Test dataset | 1132 sample | |||
|---|---|---|---|---|
| Olive disease | Healthy | Aculus | Scab | |
| 355 sample | 343 sample | 434 sample | ||
| Farm A | Original | 88 | 85 | 108 |
| Predicted | 56 | 76 | 103 | |
| Missed | 32 | 9 | 5 | |
| Test ratio | 63.3% | 89.4% | 95.3% | |
| Farm B | Original | 88 | 85 | 108 |
| Predicted | 45 | 81 | 102 | |
| Missed | 43 | 4 | 6 | |
| Test ratio | 51.4% | 95.3% | 94.4% | |
| Farm C | Original | 88 | 85 | 108 |
| Predicted | 81 | 29 | 98 | |
| Missed | 7 | 56 | 10 | |
| Test ratio | 92.1% | 34.1% | 90.7% | |
| Farm D | Original | 91 | 88 | 110 |
| Predicted | 76 | 82 | 103 | |
| Missed | 15 | 6 | 7 | |
| Test ratio | 83.5% | 93.2% | 93.7 | |
| Average test ratio | 72.67% | 78.13% | 93.54% | |
Disclaimer/Publisher’s Note: The statements, opinions and data contained in all publications are solely those of the individual author(s) and contributor(s) and not of MDPI and/or the editor(s). MDPI and/or the editor(s) disclaim responsibility for any injury to people or property resulting from any ideas, methods, instructions or products referred to in the content. |
© 2025 by the authors. Licensee MDPI, Basel, Switzerland. This article is an open access article distributed under the terms and conditions of the Creative Commons Attribution (CC BY) license (http://creativecommons.org/licenses/by/4.0/).


