Submitted:
13 November 2025
Posted:
14 November 2025
You are already at the latest version
Abstract
Actigraphy quantifies human locomotor activity by measuring wrist acceleration with wearable devices at relatively high rates and converting it into lower-temporal-resolution activity values; however, the computational implementations of this data compression differ substantially across manufacturers. Building on our previous work, where we ex-amined how dissimilarly the various activity determination methods we generalized can quantify the same movements through correlation analysis, we investigated here how these methods (e.g., digital filtering, data compression) influence nonparametric circadian rhythm analysis and sleep–wake scoring. In addition to our generalized actigraphic framework, we also emulated the use of specific devices commonly employed in such sleep-related studies by applying their methods to raw actigraphic acceleration data we collected to demonstrate, through concrete real-life examples, how methodological choices may shape analytical outcomes. Additionally, we assessed whether nonparametric indi-cators could be derived directly from acceleration data without compressing them into ac-tivity values. Overall, our analysis revealed that all these analytical approaches of the sleep-wake cycle can be substantially affected by the manufacturer dependent actigraphic methodology, with the observed effects traceable to distinct steps of the signal processing pipeline, underscoring the necessity of cross manufacturer harmonization from a clini-cally oriented perspective.
Keywords:
actigraphy
; human locomotor activity
; sleep-wake cycle
; circadian rhythm
1. Introduction
Actigraphy has been widely used since the 1980s to quantify human motor activity [1]. The method employs a research-grade wearable accelerometer, typically worn on the non-dominant wrist, which samples acceleration mostly along three axes at relatively high rates (e.g., 10–100 Hz). These samples are subsequently aggregated into fixed-length epochs (e.g., 1 minute) by the actigraph device to yield activity values stored in on-board memory [2]. The derivation of these activity values constitutes a lossy data reduction implemented through manufacturer-specific and largely proprietary algorithms which obscure the underlying methods from end users [3]. Although such lossy compression was historically necessitated by limited memory, contemporary devices can also store the raw, high-temporal-resolution acceleration data. However, when raw data (hereafter, acceleration data) are recorded, one may need to transform them post hoc into activity values (hereafter, activity data) to align with their specific analytic approaches, yet no single standardized pathway exists due to the historical heterogeneity of classical devices. In our previous work [2], we collected and categorized the various activity determination methods prevalent in the literature and compared them by applying them to the same set of acceleration data. Through correlation-based analysis, we found that these methods can quantify the same locomotor activity substantially differently, which complicates reproducibility and cross-study comparability. Elements of the generalized activity determination framework and nomenclature we introduced in that work have reportedly been adopted by Garmin Ltd (Olathe, Kansas, USA), a market-leading sports watch manufacturer [4], underscoring the practical relevance of cross-manufacturer harmonization.
Despite these challenges, actigraphy is widely applied across disciplines, including medical and psychiatric research [5,6], sports science [7], and analysis of daily motion patterns [8]. In sleep research, actigraphy provides less physiological detail than the gold-standard laboratory polysomnography (PSG) but offers the major advantage of noninvasive, continuous monitoring over weeks in everyday settings. Nonparametric Circadian Rhythm Analysis (NPCRA) is frequently applied to the collected activity data to characterize circadian and rest–activity rhythms in subjects with various health conditions [9], with commonly derived indicators including the onset time and mean activity of the least active 5 (L5) and the most active 10 (M10) consecutive hours. Another common application is sleep–wake scoring based on the actigraphic data, for which numerous algorithms have been proposed in the past; classic scoring algorithms (e.g., the Sadeh [10] and the Cole–Kripke [11] algorithms) operate solely on epoch-level activity data, whereas the availability of raw acceleration recordings from modern devices has enabled acceleration–based approaches (e.g., the van Hees algorithm [12]).
However, considering our previous comparative work [2], in which we underscored the discrepancies between activity determination methods, the question arises as to how strongly the results of NPCRA and sleep–wake scoring depend on manufacturer-specific approaches to locomotor activity quantification and, pragmatically speaking, on device selection. In the context of NPCRA, this question has not yet been systematically examined, even though studies frequently employ devices from different manufacturers – e.g., Ametris LLC (Pensacola, FL, USA; formerly ActiGraph LLC) [13,14,15], CamNtech Ltd (Cambridge, UK) [16,17], Condor Instruments (São Paulo, Brazil) [18,19,20,21], Ambulatory Monitoring Inc (Ardsley, NY, USA) [21,22,23,24,25] – and thus analyze activity signals produced by heterogeneous processing pipelines (see Section 2.3.2 for details), directly compromising cross-study comparability. For sleep–wake scoring, prior work has evaluated how results obtained with the Sadeh algorithm vary with the consumer wearable used to record raw acceleration; however, the raw data were compressed to epoch-level in only a single way using the Actilife software from Ametris, leaving the broader landscape of device-specific effects unmapped [26].
In the present study, we aim to address these questions oriented toward medical applications, but our analysis can also serve as a continuation of our earlier correlation-based comparison of activity determination methods. Here, we also examine how NPCRA indicators behave when computed directly from acceleration data rather than from activity data. This unprecedented approach allows us to evaluate the similarities between high–temporal-resolution acceleration signals and epoch-level activity data beyond comparing their spectral properties [27] – an examination that cannot be performed with correlation analysis due to the differing temporal resolutions of the two signal types.
2. Materials and Methods
2.1. Sleep-Wake Scoring Algorithms
Over the past four decades, numerous heuristic sleep–wake scoring algorithms have been developed, with more recent approaches incorporating machine learning [1]. In the present study, one representative algorithm designed for epoch-level activity data and another for high–temporal-resolution acceleration data were used to assess the impact of actigraphic signal processing on sleep–wake classification, aiming to detect of sustained, consolidated sleep periods for the sake of comparability.
The Munich Actimetry Sleep Detection Algorithm (MASDA, also known as Roenneberg algorithm) is device-independent activity-data-based sleep-wake scoring algorithm that was validated on ActTrust devices of Condor Instruments and has since been applied to activity data collected with MotionWatch 8 devices of CamNtech Ltd [28,29]. Briefly, MASDA estimates the trend of the activity data using a centered 24-hour moving average and classifies an epoch as sleep if its activity value falls below 15–25% of the trend; the resulting raw sleep–wake classification then undergoes a two-stage automatic rescoring to yield long stretches of consolidated sleep and wake [30]. For this analysis, the open-source pyActigraphy (v1.2.1) implementation [31] of MASDA was used with default parameters, and the threshold was set to 25% within the recommendation [28].
The van Hees algorithm of GGIR (a research-community-driven R package for transparent, vendor-agnostic processing and analysis of actigraphic acceleration data) is specially designed for acceleration-data-based sleep-wake scoring. Briefly, it relies on two parallel steps whose combination yields the final classification [32]: the detection of sustained inactivity bouts (SIBs [12]) and sleep period time (SPT [33]) window. SIBs are identified when the change in wrist angle remains within 5° for at least 5 minutes. SPT-window detection also relies on wrist angle but includes an automated cleaning step to ensure a single contiguous SPT per day (noon-to-noon). Sleep is defined based on the overlap between the contiguous SPT and multiple shorter SIBs. In this study, GGIR (v3.2.6) was run with default settings, except that the SPT threshold was set to 0.4 following visual inspection that is permitted for methodological research by the creators of the package [34]. Note that, since the acceleration data we examined (sampled with 10 Hz; see Section 2.4.1) included real-time clock-based, millisecond precision time stamps, it was necessary to reduce the resolution of the time stamps to obtain time-equidistant samples spaced exactly 100 milliseconds apart, as required by the algorithm.
2.2. Nonparametric Measures of Circadian Rhythm
The characterization of biological rest–activity rhythm has a long tradition, whereby indicators are derived from the activity data to quantify distinct aspects of the rhythm. Here, the effects of actigraphic signal processing were assessed for the 5 most-used indicators in nonparametric circadian rhythm analysis [9].
L5 and M10 capture the least-active 5-hour and most-active 10-hour windows within a day with onset times (L5onset, M10onset) and mean activity levels (L5val, M10val) [9]. Thus, while L5 indexes nocturnal, M10 indexes diurnal activity: lower L5val implies more restful sleep, and higher M10val indicates greater daytime activity. Relative Amplitude (RA) computes the normalized difference between M10val and L5val (see Equation 1). RA ranges from 0 to 1; larger values indicate stronger separation between nighttime and daytime activity and are generally taken to reflect a more robust rest–activity rhythm. We determined L5 and M10 in the traditional way [13,14,15,17,18,19,20,21,22,23,24,35,36]: first, a 24-hour mean profile was obtained by averaging the minute-level activity data across days, then, L5 and M10 were derived by sliding a window in one-minute steps across the 24-hour mean profile in a circular manner and computing the mean activity within each window.
Interdaily Stability (IS) quantifies the day-to-day predictability (i.e., similarity) of the subject’s activity pattern and is computed using Equation 2, where denotes the mean activity in each hour in the multi-day activity data, is the grand mean across the entire time series, and is the mean activity of the -th hour in the 24-hour mean profile [9]. IS ranges from 0 to 1; larger values denote more consistent day-to-day activity patterns.
Intradaily Variability (IV) measures within-day fragmentation of the rest–activity rhythm [9] and is computed as defined in Equation 3, where denotes the mean activity in each hour in the multi-day activity data, is the grand mean across the entire time series. IV ranges from 0 to 2; higher values indicate more frequent rest–activity transitions (e.g., daytime naps, nighttime awakenings), i.e., greater fragmentation.
2.3. Actigraphic Signal Processing
Both NPCRA indicators and MASDA sleep-wake scoring algorithm defined in the previous sections are applied to epoch-level activity data, but to assess the effect of actigraphic signal processing methods on them, we first need to understand how activity data can be derived from the raw acceleration, and what the differences are of these activity determination methods between devices. In Section 2.3.1, we introduce our generalized activity determination framework building on our prior work [2], where we systematically collected, categorized, and compared activity determination methods, and abstracted them into a two-step processing pipeline: (1) preprocessing of raw acceleration data, (2) activity-metric-based aggregation to epoch-level values. Although individual operations in our generalized framework map to commercially available solutions, the whole activity determination workflows – specific pairings of preprocessing techniques and activity metrics – are difficult to match one-to-one to any specific device. Therefore, to provide a comprehensive yet realistic assessment of how signal-processing steps affect NPCRA indicators and sleep–wake scoring, we not only rely on our generalized framework (see Section 2.3.1) to determine activity values from the same set of wrist motion data (see Section 2.4.1) but also extend our analysis to methods employed in specific devices (see Section 2.3.2) that are frequently used in the related literature.
2.3.1. Generalized Activity Determination Methods
In most cases, actigraphs using MEMS (micro-electromechanical system) accelerometers measure the x-, y-, and z-axis components of limb acceleration (UFX, UFY, UFZ; collectively UFXYZ). During preprocessing, the primary aims are to combine these axial signals into a single series and to remove the effect of Earth’s gravitational acceleration (i.e., the gravitational component, g). The former can be achieved by computing the Euclidean norm of the per-axis accelerations to obtain the unfiltered magnitude data (UFM). The effect of g can be removed from this magnitude data by subtracting 1 g and either taking the absolute value (UFNM) or truncating negative differences to zero (ENMO). Alternatively, the DC (gravitational) component can be attenuated using digital filters (e.g., a 3rd-order Butterworth band-pass filter with 0.25 and 2.5 Hz cutoffs), applied either to the UFM data (FMpost) or to the per-axis signals (FX, FY, FZ; collectively FXYZ) before computing the Euclidean norm (FMpre).
Following preprocessing, the acceleration data is partitioned into fixed-length epochs (in our case, 1 minute), and an activity metric is applied to yield one activity value per epoch. The most classical metrics either simply integrate the acceleration (Proportional Integration Method – PIM) or use fixed thresholds to determine the crossings (Zero Crossing Method - ZCM) or the time the signal remains above it (Time Above Threshold - TAT). In our case, the threshold is set equal to the standard deviation of the whole preprocessed acceleration data [2]. Other metrics are based on calculating the standard deviation (Mean Amplitude Deviation – MAD) or the variance (Activity Index – AI) of the acceleration data in the given epoch. The metric High-pass Filtered Euclidean Norm (HFEN) simply averages the acceleration data, but it requires a specific preprocessing scheme: the per-axis signals must be filtered with a high-pass – not a band-pass – filter before magnitude calculation (denoted as HFMpre rather than FMpre).
Preprocessing techniques and activity metrics can be properly combined in 35 different ways, each of which is a different activity determination method that we denote in accordance with our past works: the activity metric is treated as a function whose argument is the preprocessing technique. Thus, for example, PIM(UFNM) denotes such an activity signal that was obtained by minutely integrating the normalized magnitude of acceleration. For details of these procedures, see our prior work [2].
2.3.2. Activity Determination Methods of Specific Devices
Given the widespread use of devices from Ametris LLC [13,14,15] and CamNtech Ltd [16,17] in NPCRA studies, their activity determination methods were also included in the present analysis. We used the Python implementation of Ametris’s algorithm that the company published 3 years ago to enhance transparency [37], following the demand from the scientific community for accessible and reproducible methods [3]. Their solution is comparatively complex and does not align one-to-one with the methods in Section 2.3.1, as epoch-level activity values (the so-called Activity Count; hereafter, AC) are computed via multiple stages (resampling, band-pass filtering, rescaling, thresholding, summing; see [3] for details). CamNtech disclosed the activity determination procedure of their MotionWatch 8 devices in their user manual [38]: each axis is band-pass filtered prior to magnitude computation (FMpre-like preprocessing, with 3 and 11 Hz cutoffs), per-second peak acceleration is then determined, and peaks exceeding 0.1 g are summed within each epoch to yield the activity value (hereafter, MW). As the acceleration data we examine were recorded at a 10 Hz sampling rate, we approximated this band-pass filter with the one specified in our generalized framework.
Beyond these, the PIM(ENMO) activity-determination method in our generalized scheme corresponds directly to the widely used GGIR package, which applies ENMO by default and derives epoch-level values by simple averaging, although using 5-second epochs by default [32]. However, since in circadian rhythm analysis – where the focus is on the overall multi-day activity pattern rather than short bursts – the 1-minute epoch length is preponderant and recommended [13,16,17,18,20,23,39], we employed 1-minute epochs for PIM(ENMO) as well. Furthermore, the ZCM(FMpre), TAT(FMpre), and PIM(FMpre) methods correspond to those implemented in Condor Instruments’ ActTrust devices [18,19,20,21], with the sole difference that ActTrust employs a 0.5–2.7 Hz band-pass filter rather than the 0.25–2.5 Hz band-pass used here [40]. Note that the ZCM, TAT, and PIM metrics are also supported by long-standing and widely used devices from Ambulatory Monitoring Inc [21,22,23,24,25]; however, because these devices use piezoelectric rather than MEMS sensors and only fragmented information is available about their algorithmic details [41], the correspondence is necessarily indirect.
2.4. Comparison of Differently Determined Activity Data Through NPCRA and Sleep-Wake Scoring
Our analysis utilized a dataset of raw actigraphic acceleration data, from which we were retrospectively able to calculate various epoch-level activity data (and higher-temporal-resolution acceleration data preprocessed in different ways, as a preliminary step) using the methods presented in Section 2.3 to emulate the activity determination approaches of different manufacturers. Subsequently, we applied NPCRA and sleep-wake scoring algorithms to these differently calculated signals to assess the disparities introduced in their results by the choice of locomotor activity quantification method.
2.4.1. Acceleration Data
The publicly available actigraphic dataset we collected and examined in several of our previous studies [2,6,27], as well as in this work, contains raw triaxial acceleration data from 42 healthy, free-living subjects [42]. The 10-day-long recordings were acquired on their non-dominant wrist at 10 Hz sampling rate with a ±8 g dynamic range and 16 mg resolution, using a special-purpose MEMS-accelerometer–based actigraphic device we developed [2]. To reduce deterministic measurement errors (scale, offset and orthogonality), the acceleration signals underwent postcalibration using a publicly available algorithm [43].
2.4.2. Methodology of Comparison Through Similarity Matrices
The impact of actigraphic signal processing on sleep-wake scoring and each NPCRA indicator was examined through separate similarity matrices, in which each cell quantifies the discrepancy over the 42 subjects that would arise in the given indicator value or sleep-wake scoring if the subjects had effectively been measured using an alternative actigraphic device – and thus their locomotor activity would have been quantified through a different, manufacturer-dependent method (e.g., MW vs. AC).
For NPCRA indicators with scalar outcomes (L5val, M10val, RA, IS, IV), the Symmetric Mean Absolute Percentage Error (SMAPE) was used as a similarity measure to facilitate comparability with the correlation-based similarity matrix (Figure 1). The computation of a single similarity-matrix cell is defined in Equation 4, where is the number of participants; for participant , and are the values of the given indicator (e.g., L5val), derived from actigraphic signals produced by signal-processing pipelines and . SMAPE ranges from 0% to 200%, with lower values indicating smaller discrepancies in the given indicator attributable to the choice of signal-processing pipeline (e.g., device selection). Note that L5val and M10val are not ratio-type measures (unlike RA, IS, and IV); therefore, we normalized the actigraphic data by their respective means to reduce distortions in the comparison of these indicators due to differences in the value ranges.
For NPCRA indicators where the outcome of interest is the onset (L5onset, M10onset), the similarity matrices were constructed from the overlap (ranging from 0% to 100%) of the designated windows as defined in Equation 5. Here, denotes the number of participants; for participant , and are the designated windows for the given indicator, derived from actigraphic signals produced by signal-processing pipelines and , and is the segment length (5 hours for L5onset and 10 hours for M10onset).
For sleep–wake scoring algorithms, two aspects were evaluated: the timing of sleep and Total Sleep Time (TST). In the former case, analogous to onset-based NPCRA indicators, overlap was assessed; however, because the lengths of sleep segments were not uniform, overlap was quantified via the Intersection over Union (IoU), i.e., the Jaccard index, as in Equation 6. In the formula, denotes the number of participants; for participant , and are the designated sleep intervals from actigraphic signals, produced by signal-processing pipelines and .
Additionally, we employed dendrograms to reveal the structure and hierarchical organization of the similarity matrices. Prior to this, matrices were converted to dissimilarities and rescaled between 0 and 1, with lower values indicating smaller differences. Dendrograms were computed using SciPy (v1.7.3) with the default Euclidean metric and complete linkage, which is less sensitive to outliers and noise [44].
In this work, we also connect our prior findings about the correlation-coefficient-based relationships between the different activity determination methods (see [2] for details) to present results. Figure 1 displays that correlation-based similarity matrix, which not only aids the interpretation of our current results (see Section 3) in light of our previous findings, but also serves to illustrate the rationale behind our matrix-based comparison. In the correlation matrix, the closer the value is to 1, the stronger the linear relationship between activity signals derived from the same acceleration data (see Section 2.4.1) but computed using different methods (Section 2.3.1). These relationships are mainly driven by how the acceleration signal was preprocessed, an observation we reinforced by color coding the labels to indicate different preprocessing families: purple (raw per-axis acceleration), light and dark blue (per-axis filtered acceleration), red (magnitude-filtered acceleration), and green (unfiltered magnitude of acceleration).
3. Results
In the following, we first examine the impact of the actigraphic signal processing methods encompassed in our generalized activity-determination framework on the values of NPCRA indicators (see Section 3.1.1), then on their onset (see Section 3.1.2). This approach allows us to independently investigate the effects of the two main steps of activity determination: acceleration signal preprocessing and its compression into activity values using activity metrics. However, because linking the generalized methods to actual devices is not trivial, we also demonstrate how specific activity determination methods used by widely adopted instruments in the related literature influence NPCRA indicator values (see Section 3.2.1) and sleep–wake scoring (see Section 3.2.2).
3.1. Effect of Generalized Actitity Determination Methods
To fully characterize the influence of signal-processing steps within our generalized activity-determination framework, we applied NPCRA indicators not only to epoch-level activity data but also to the underlying, differently preprocessed higher-temporal-resolution acceleration data – an unprecedented approach for which we first had to explore the technical constraints. Since nonparametric measures (Section 2.2) rely on averaging, they fail for time series with constant means. For raw magnitude data (UFM), positive and negative accelerations cancel out each other, so taking its average over even a few seconds-wide windows converge to Earth’s gravitational constant (1 g). Removing the gravitational component with band-pass filtering late (FX, FY, FZ, FMpost) yields signals near-symmetric around 0 g, whose mean will also be constant unless absolute values are taken. Consequently, NPCRA measures were only applicable to FMpre, HFMpre, UFNM, and ENMO without technical constraints. For FX, FY, FZ, and FMpost, absolute value had to be taken. It should be noted that the 24-h mean profile for acceleration data was obtained at a 1-second resolution rather than 1 minute, reflecting the higher temporal resolution compared to epoch-level activity data.
3.1.1. On the Value of NPCRA
Figure 2 illustrates how the mean values of L5, M10, and RA across 42 subjects depend on which signal-processing pipeline in our generalized framework was used to determine the acceleration or activity signal. For each NPCRA indicator, 43 mean values are represented with colored dots, 35 for those activity signals that previously formed the rows and columns in the correlation matrix of Figure 1, and 8 for acceleration signals that have undergone various preprocessing procedures. The coloring of the dots in Figure 2 indicates three categories: blue denotes values computed from epoch-level activity data derived with threshold-based metrics (TAT, ZCM), red denotes values from activity data derived with non-threshold metrics, and black denotes values computed directly from higher-temporal-resolution acceleration data preprocessed in different ways. As seen, applying the L5 indicator to threshold-based activity signals (blue) yields systematically lower values than applying it to activity signals derived with any non-threshold metric (red). By contrast, for M10 the pattern reverses: threshold-based metrics yield higher values. Notably, indicator values computed from acceleration signals (black) closely resemble those computed from activity signals obtained with non-threshold metrics (red). Since RA is derived from L5 and M10 values, it also forms two distinct clusters, similar to those observed for the two aforementioned indicators.
In Figure 3, the counterpart to the previous figure is shown for the mean values of the IV and IS indicators. In this case, however, the color-coding of the mean values – contrary to Figure 2 – is based on the preprocessing families, since they group according to the preprocessing techniques applied to the acceleration signal and not based on whether the activity metric was threshold-based or not. These clusters that clearly resembles the structure of the correlation-based similarity matrix (see Figure 1) appear in the same order for IS and IV – albeit with opposite directionality.
Figure 2 and Figure 3 clearly demonstrate that the values of all NPCRA indicators considered can differ substantially depending on how actigraphic signals are derived within on our generalized framework. For example, IV was reported to be around 0.67 for control and 0.811 for subjects suffering from bipolar disorder [45], while IS was measured at approximately 0.446 for control and 0.526 for schizophrenic subjects [46]; but as seen from Figure 3, even greater discrepancies can occur within the same group of healthy subjects due to the lack of standardization in actigraphy. Moreover, different NPCRA indicators are more strongly influenced by different aspects of the actigraphic methodology: for the value of L5, M10, and RA, the activity metric exerts the greater influence, whereas for IS and IV, the preprocessing technique applied to the acceleration signal has the larger effect. The impact of these aspects was quantified using similarity matrices and dendrograms, as defined in Section 2.4.2.
Figure 4 presents the SMAPE-based similarity matrices and their corresponding dendrograms for L5 values; the labels follow the same categorical color-coding as for Figure 2. It makes even clearer what was inferred from the means in Figure 2: the L5 values differ substantially (the differences are generally greater than 80%) depending on whether L5 was applied to activity signals derived using threshold-based metrics (blue labels), to activity signals derived using other metrics (red labels), or directly to acceleration signals (black labels). The rationale will be addressed in Section 4. For the value of M10 and RA (corresponding matrices are provided in the Supplementary Material: Figure S1 and Figure S2, respectively), the same clustering pattern has been observed. However, while the SMAPE-based difference between the two clusters was generally greater than 80% for L5, it is below 10% for M10, and around 20% for RA. Since RA is directly derived from the value of M10 and L5, it means that the observed discrepancies for RA are mainly driven by the differences in the value of L5.
As seen in Figure 5, for the IS indicator (the corresponding matrix for IV can be found in Figure S3 of the Supplementary Material), the differently determined acceleration and activity signal types form hierarchical clusters along the choice of acceleration signal preprocessing technique – mirroring the correlation-based similarity matrix of Figure 1 and the separation of mean values observed for IS and IV in Figure 3 –, but the differences between the clusters are generally smaller compared to what we observed for the value of L5 in Figure 4. An important implication follows: for a given preprocessing technique applied to the acceleration signal, IS and IV computed directly from acceleration data generally agree closely with those computed from activity signals derived from the same acceleration data using any activity metrics. In contrast, the values of L5, M10, and RA can differ substantially depending on whether they are computed from acceleration signals or activity signals if the latter was derived using threshold-based metrics.
3.1.2. On the Onset of NPCRA
Figure 6 illustrates the extent of overlap between the 5 least active and 10 most active 10-hour periods identified by L5 and M10. As shown, both matrices exhibit similar structures; however, the onset of L5 appears less affected by the choice of actigraphic methodology, as the designated periods generally overlap to a much greater extent compared to M10. Additionally, the patterns of these matrices resemble those observed for IS and IV (see Figure 5) or in the correlation analysis (see Figure 1), suggesting that the onset of L5 and M10 is primarily influenced by how the acceleration data were preprocessed rather than by the choice of activity metric used for epoch-level data compression, which is the opposite of what we observed for the values of L5 and M10 (see Figure 4). This further reinforces the necessity to consider the entire activity-determination process when comparing results across studies, as L5 and M10 are largely influenced by both main steps of the actigraphic signal-processing pipeline.
3.2. Effect of Activity Determination of Specific Devices
To demonstrate how the selection among specific actigraphic devices used in the literature affects the value of NPCRA indicators and sleep-wake scoring, we performed the analysis on a narrower set of activity determination methods of specific devices. These methods were applied to the raw acceleration data to emulate the outputs of those specific devices. As defined in Section 2.3.2, this narrower set includes the algorithms of AMI and Condon Instruments devices (PIM(FMpre), ZCM(FMpre), and TAT(FMpre)); PIM(ENMO) of the GGIR package from the above analysis; and, as new additions, the specific algorithms used in Ametris and CamNTech devices (AC, and MW, respectively).
3.2.1. On the Value of NPCRA
Panel a) of Figure 7 presents the average value of L5, M10 and RA indicators across the 42 subjects for specific devices. Since AC and MW are also threshold-based activity metrics like ZCM and TAT, the mean values form clusters within each indicator depending on whether the activity data were calculated using threshold-based activity metric, or not. This clustering is further substantiated by the dendrogram in the right panel, which is based on the RA. These findings are in line with the observation we made regarding the generalized activity determination methods (see Figure 2). It is crucial to highlight that ZCM, TAT and PIM are the 3 classical activity metrics supported by both AMI and Condor Instruments devices. However, since the selection between them is up to the scientists when setting up the measurement, only this choice can have a substantial impact on the NPCRA outcomes as seen; for example, the RA value was, on average, close to 0.70 for PIM and 0.86 for ZCM. It is important to underscore that these values were derived from the same motion data; consequently, the average difference of 0.16 – that is greater than what was observed by others when comparing pediatric subjects and adults [47] – for an indicator that ranges between 0 and 1 is purely a consequence of how the actigraph was set up (or which device was used).
Figure 8 shows the counterpart of the previous figure for the IS and IV indicator values, while panel b) depicts the dendrogram for IS. The dendrogram clearly shows that the IS derived from activity data based on the activity determination method of GGIR (i.e., PIM(ENMO)) substantially differs from the rest of the methods. Since PIM(ENMO) is the only activity determination method in this narrower set where digital filtering was not involved in the preprocessing of acceleration data, this behavior aligns with the observation we made regarding the generalized activity determination methods (see Figure 3): the differences the device selection can introduce in the IS and IV are primarily driven by how the acceleration data were preprocessed, rather than the activity metric. For both IV and IS, the greatest discrepancies occurred between PIM(ENMO) from the GGIR package and ZCM(FMpre) supported by the AMI and Condor Instruments devices (for example, 0.99 vs. 0.75 for IV, respectively).
3.2.2. On Sleep-Wake Scoring
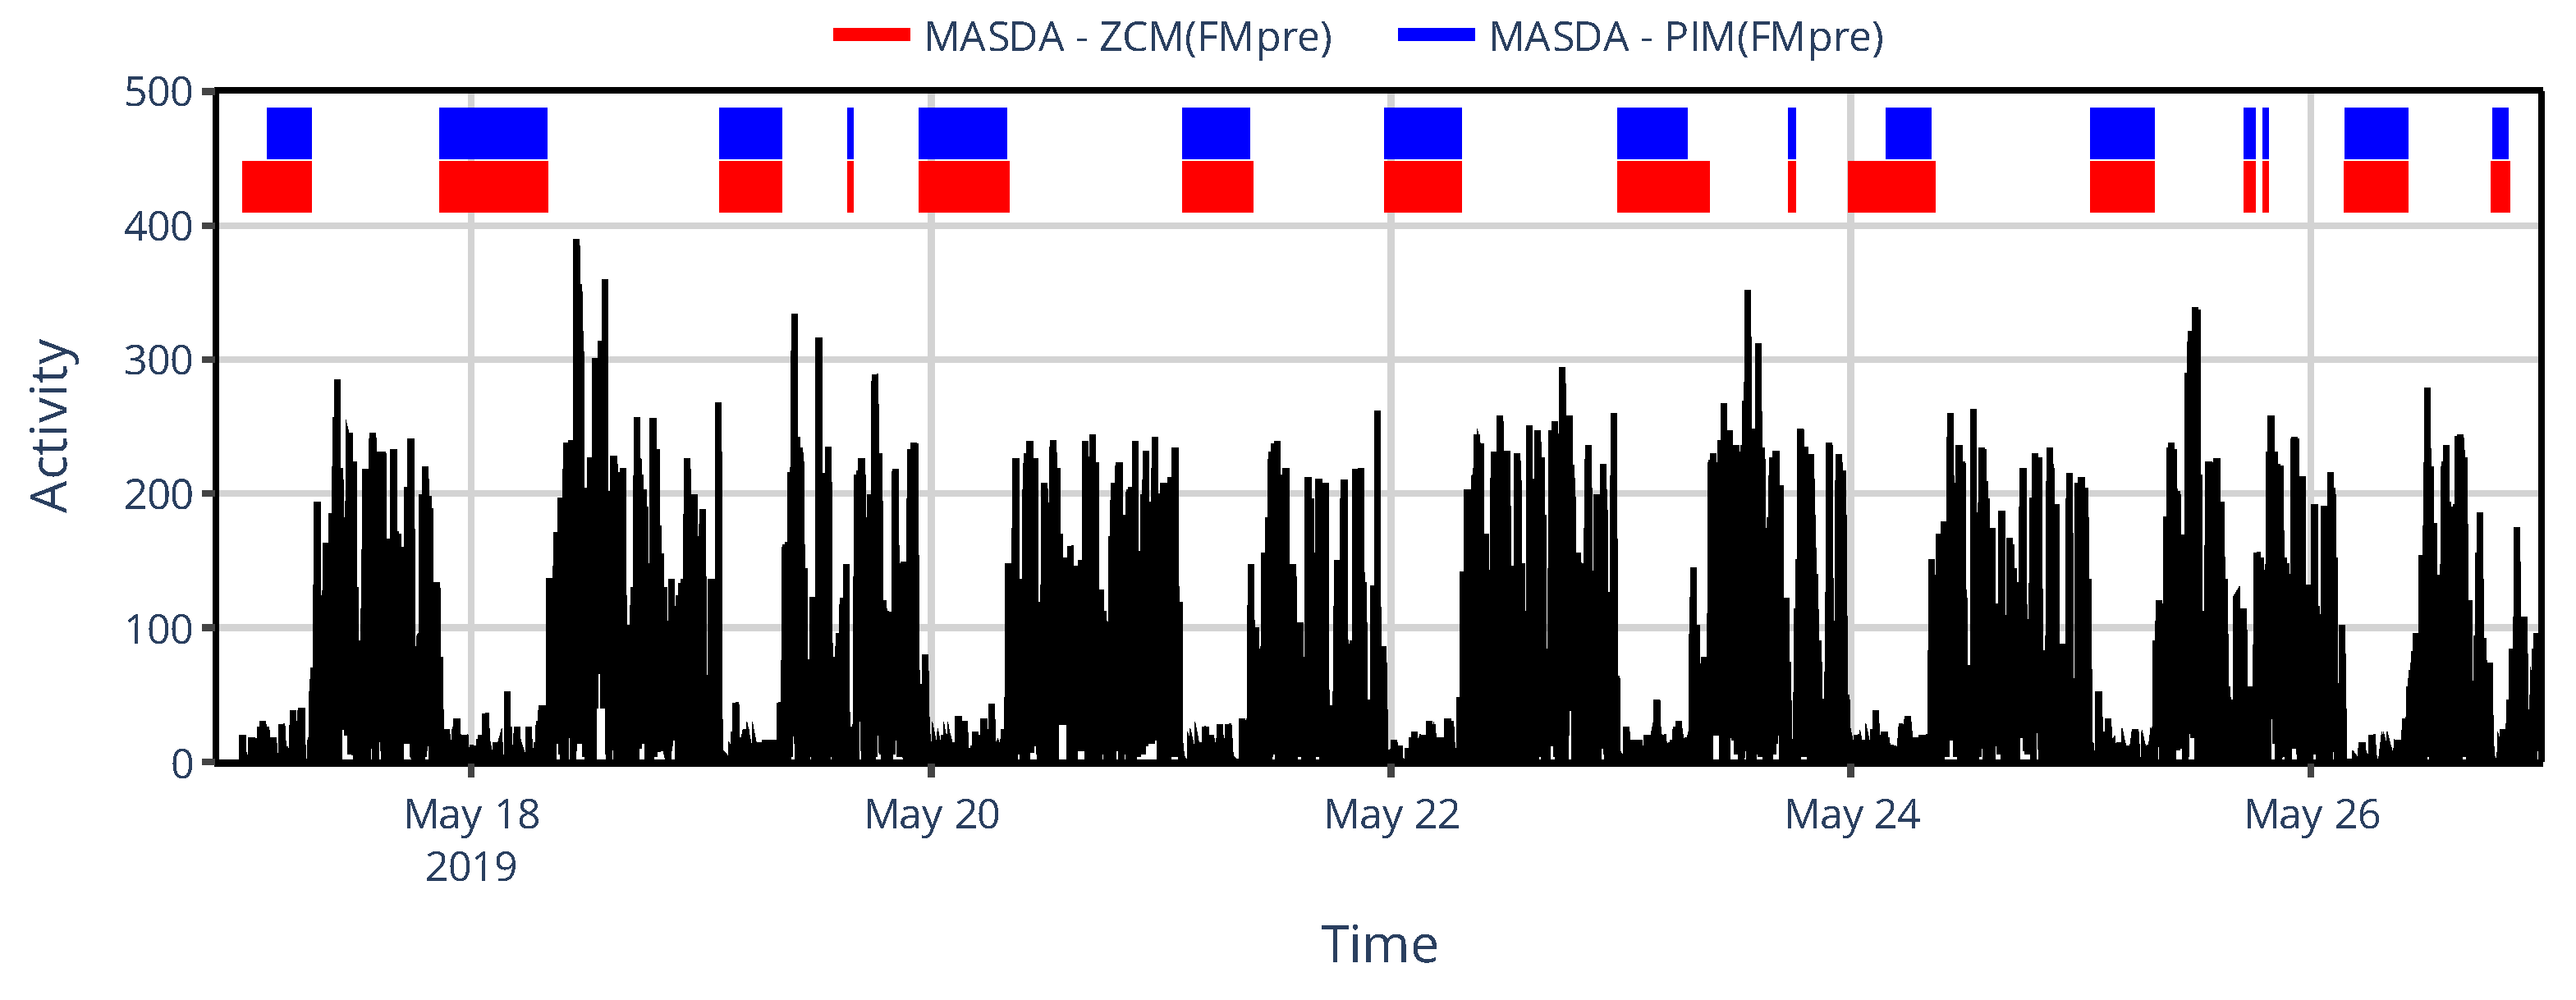
The limited set of specific devices’ activity determination methods did not allow us to comprehensively describe the similarity structure based on NPCRA indicator onset times as we did for the generalized framework where we compared 43 methods (Section 3.1.2) instead of only 6; therefore, we instead examined another timing-related metric in their case: sleep–wake scoring. We assessed the impact of device choice on sleep–wake scoring by classifying sleep and wakefulness from raw acceleration data using the van Hees algorithm, and by applying the MASDA algorithm to 6 different types of activity signals computed from the same acceleration data to emulate specific devices commonly used in the related literature. In Figure 9, one can see for an exemplary subject that even the inter-device selection between ZCM and PIM activity metrics in AMI and ActTrust devices can result in several hours of discrepancies in sleep-wake scoring.
To systematically assess such discrepancies, we first examined the total amount of sleep accumulated over 10 days among 42 participants on average, depending on whether sleep was identified from raw acceleration data using the van Hees algorithm or from activity signals using the MASDA algorithm; this comparison is illustrated in Figure 10 a). For MASDA, highly similar total sleep durations were obtained across activity signals derived from threshold-based metrics (TAT(FMpre), ZCM(FMpre), AC, MW) ranging from 79.3 to 80.3 hours. In contrast, activity signals based on integration yielded shorter sleep durations: PIM(FMpre) produced roughly 4 hours less sleep on average than the threshold-based signals, while PIM(ENMO) showed an exceptionally low TST of only 50.6 hours. As seen earlier (see Figure 8), the PIM(ENMO) signal also behaved anomalously for the IV and IS indicators, likely due to the absence of digital filtering during acceleration preprocessing. Sleep–wake detection from the raw acceleration signal yielded a mean total sleep duration comparable to that estimated by MASDA for the PIM(FMpre) signal.
Figure 10.
a) The mean TST across 42 subjects is shown depending on whether sleep was scored based on the raw acceleration data using the van Hees algorithm (black bar) or by the MASDA algorithm on the activity data of specific devices (grey bars). b) The mean percentage overlaps between the aforementioned sleep segments ranging from 100% to 0%, with the gradient color scale shifting linearly from green to yellow as overlap decreases from 100% to 50%.
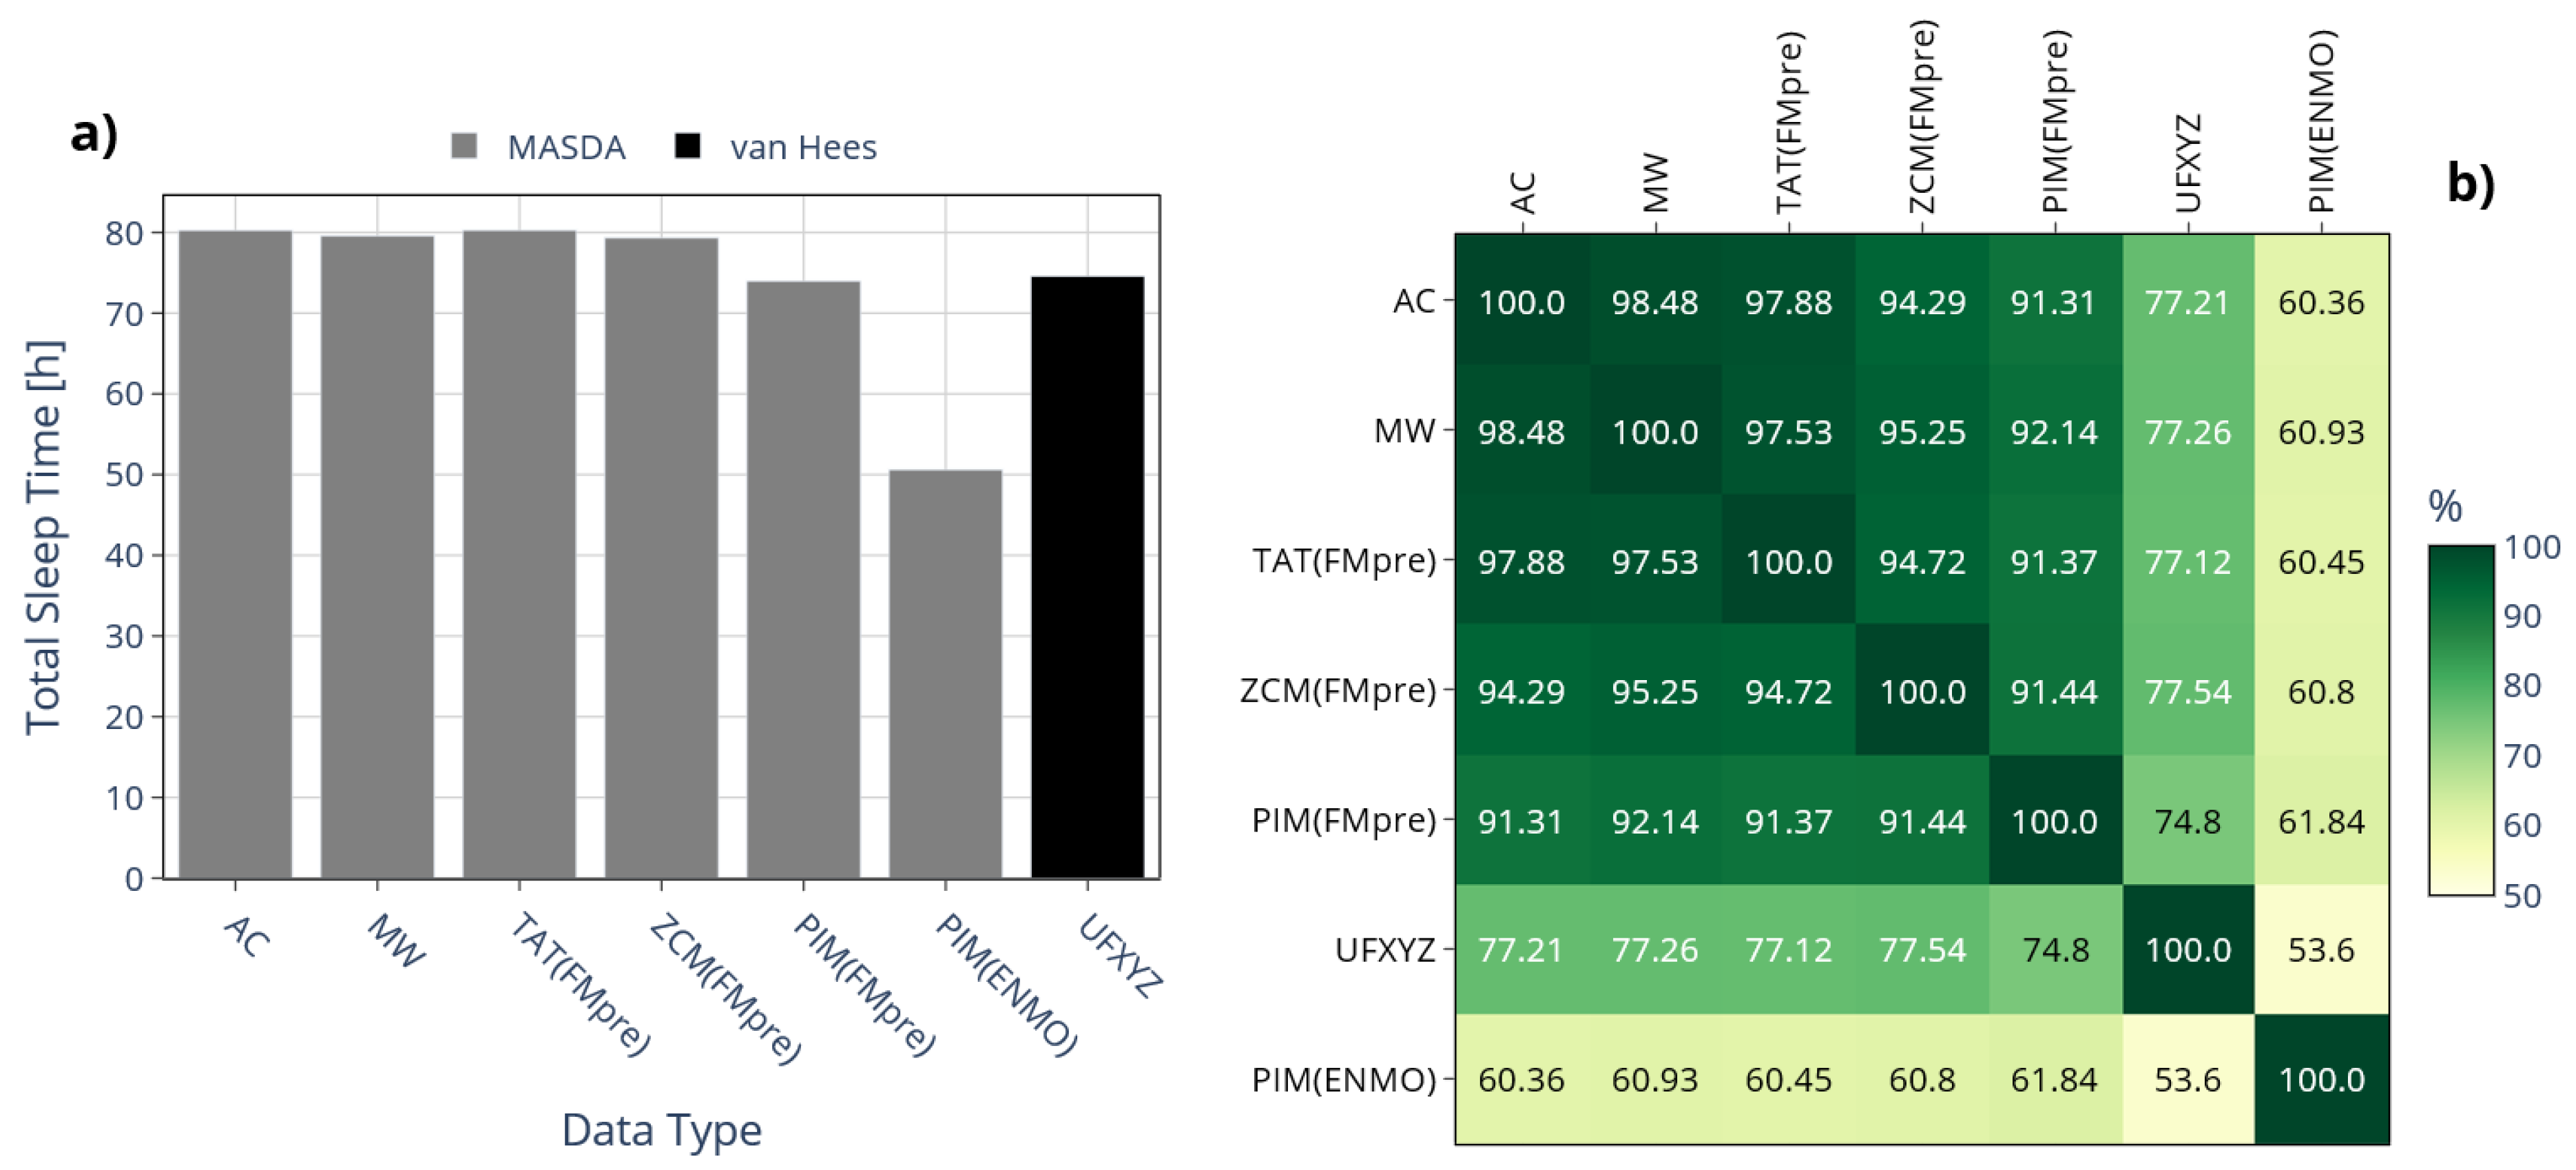
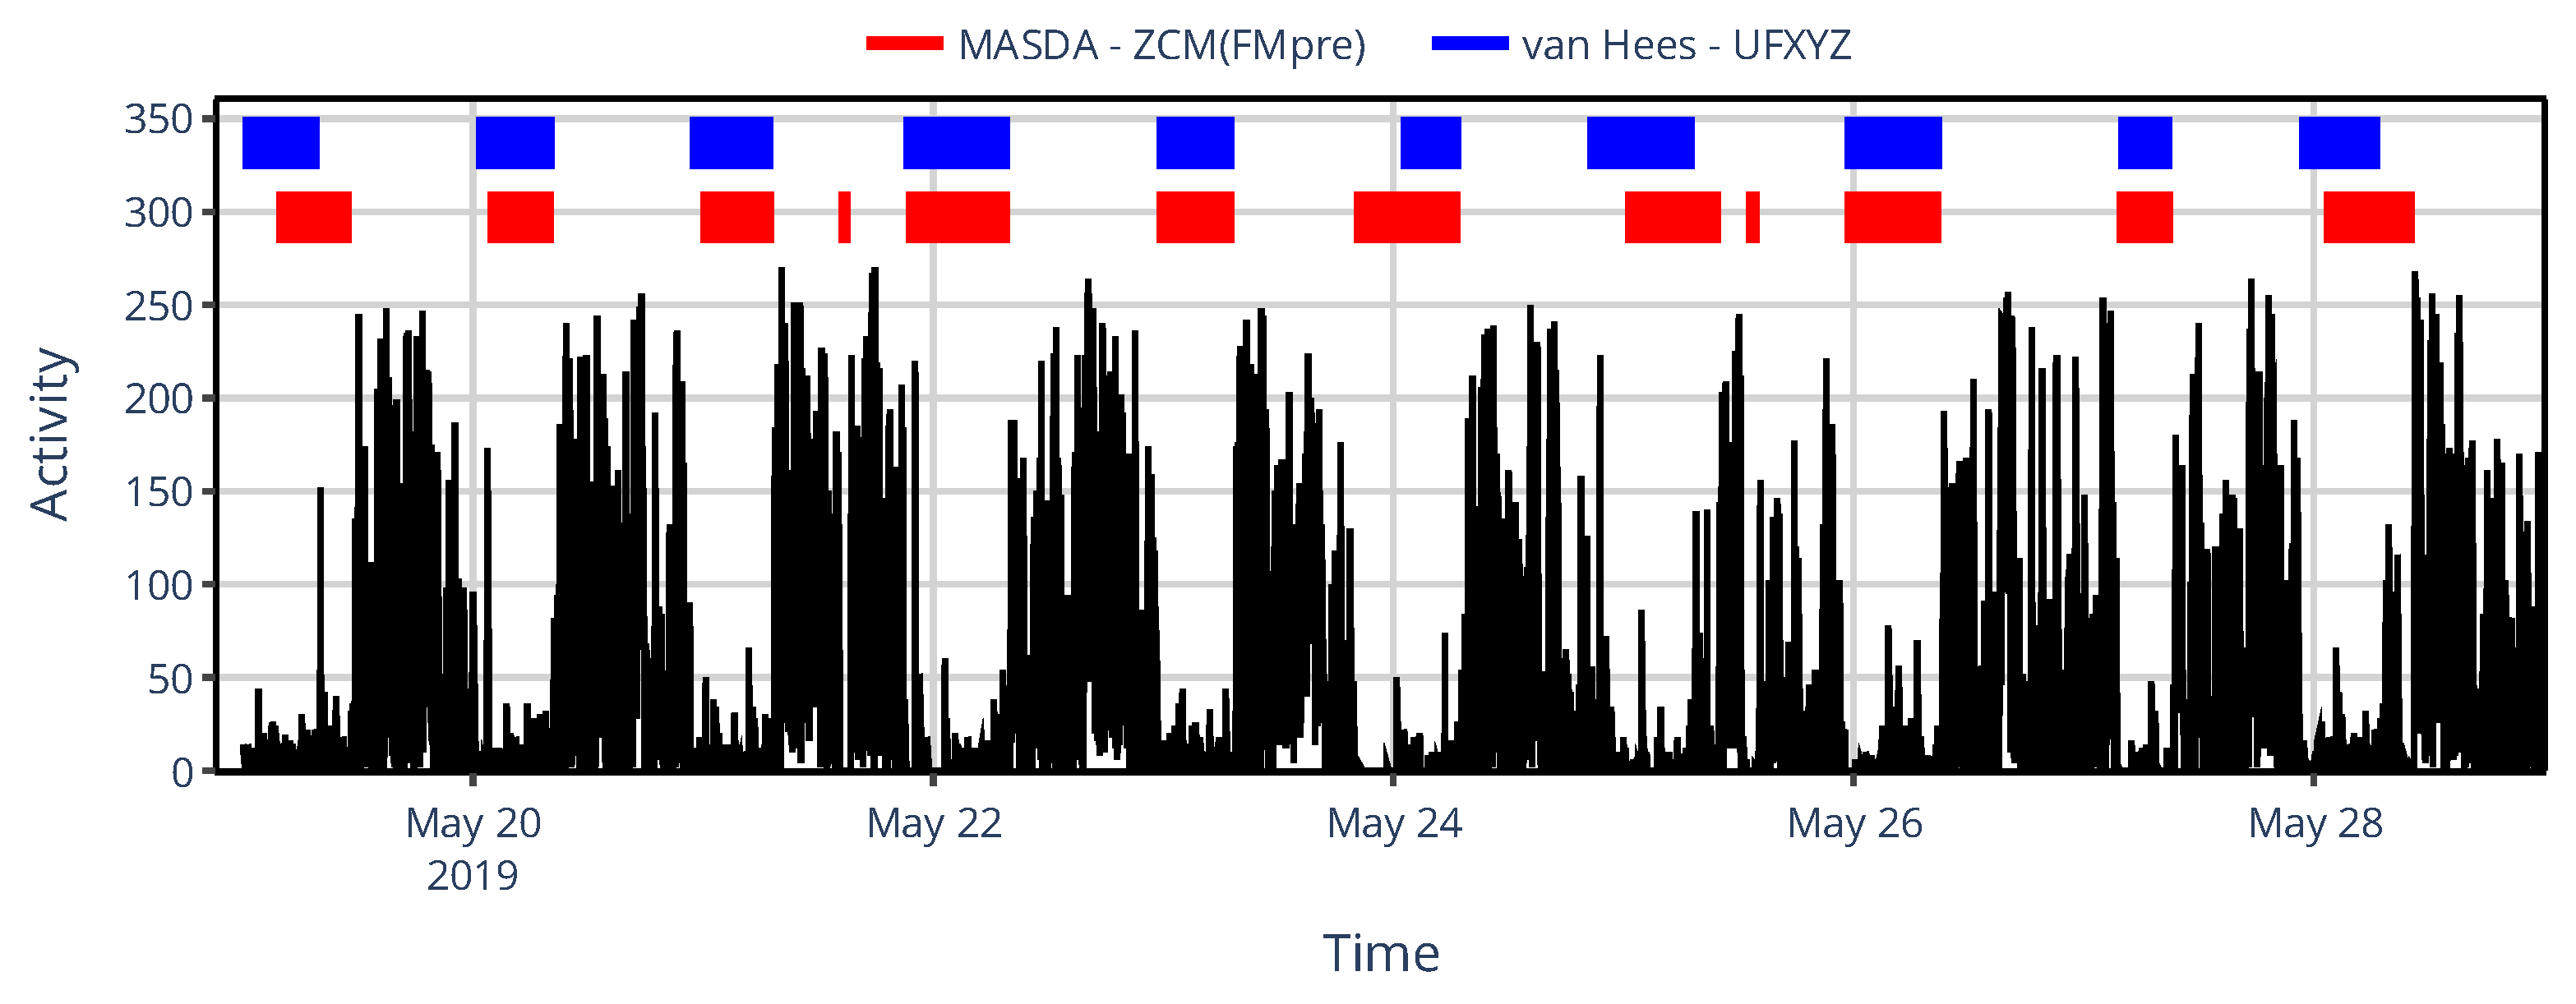
Beyond the similarity in TST estimated by the different methods, it is also crucial to assess how consistently they identified the onset of sleep. To this end, we examined the overlap of sleep segments identified by the different approaches using the IoU metric, as shown in Figure 10 b). Given that the MASDA algorithm produced different TSTs when applied to PIM(ENMO), it is evident that it also identified sleep at substantially different times compared to other methods, with overlaps below 62% in all cases. Comparing acceleration- and activity-based sleep–wake scoring highlights the importance of overlap analyses, since TST alone fails to capture the temporal agreement between methods. While sleep–wake scoring based on acceleration data (van Hees algorithm on UFXYZ) yielded an almost identical TST to the MASDA algorithm applied to activity data, the IoU-based overlap of corresponding sleep segments was consistently below 78% in all cases, underscoring the methodological difference. For instance, although TST differed by only 0.67% between UFXYZ and PIM(FMpre), their sleep segment overlap reached only 74.8%, which disagreement is also illustrated in Figure 11 for one representative participant.
Figure 11.
An example of sleep–wake scoring for a representative subject, showing designated sleep intervals obtained using the MASDA algorithm applied to the ZCM activity data of AMI/ActTrust devices (red) and the van Hees algorithm applied to the underlying, raw acceleration data (blue). The black trace shows the subject’s activity data to aid visual interpretation.
The parameters of the MASDA and van Hees sleep-wake scoring algorithms could be fine-tuned for each signal type to reduce their discrepancies, especially for MASDA when applied to PIM(FMpre) activity data. However, even the tuning on specific datasets is not a common practice in typical use cases in the related literature, which we also aimed to replicate in order to examine the extent to which manufacturer-specific actigraphy signal processing affects sleep–wake scoring. Even the fact that we did not simply retain the default parameters, but instead selected MASDA settings within the recommended range that yielded acceptable results across the differently derived activity signals, already represents a more careful approach. Note that, we used sleep–wake scoring solely to illustrate the discrepancies introduced by the actigraphic methodology of specific devices from a timing-oriented perspective (similar to the onset of L5 and M10 in Section 3.1.2) without focusing on sleep detection performance; therefore, we did not aim to evaluate the specificity or selectivity of the different sleep–wake scoring algorithms in the absence of a gold standard.
4. Discussion
Overall, it is evident that not only the NPCRA indicators but also the evaluated sleep–wake scoring algorithms are influenced by how the underlying movement data are quantified; in other words, by the type of actigraphic device used for data collection. For the IV and IS indicators, as well as the timing of the L5 and M10 indicators and sleep-wake classification, the primary source of difference was the initial step of the activity determination pipeline – that is, the preprocessing of the acceleration data, similar to what we previously observed by comparing activity signals through correlation – where both the fact of digital filtering being applied and the manner in which it was performed played central roles. Conversely, for the values of L5, M10, and RA indicators, the main differences were not due to preprocessing but rather to whether threshold-based or non-threshold-based activity metric was used in the following step to compress the higher-temporal-resolution acceleration data into epoch-level activity values. Because the discrepancies we observed in NPCRA analytical outcomes solely due to differences in actigraphic methodology may exceed those typically reported as significant between subject groups with different health conditions in the literature, and studies often analyze activity data recorded by actigraphs from various manufacturers operating on different principles, particular caution is required when comparing findings across studies. Unfortunately, this issue is further complicated by the fact that studies rarely provide sufficient detail on how their activity data were collected.
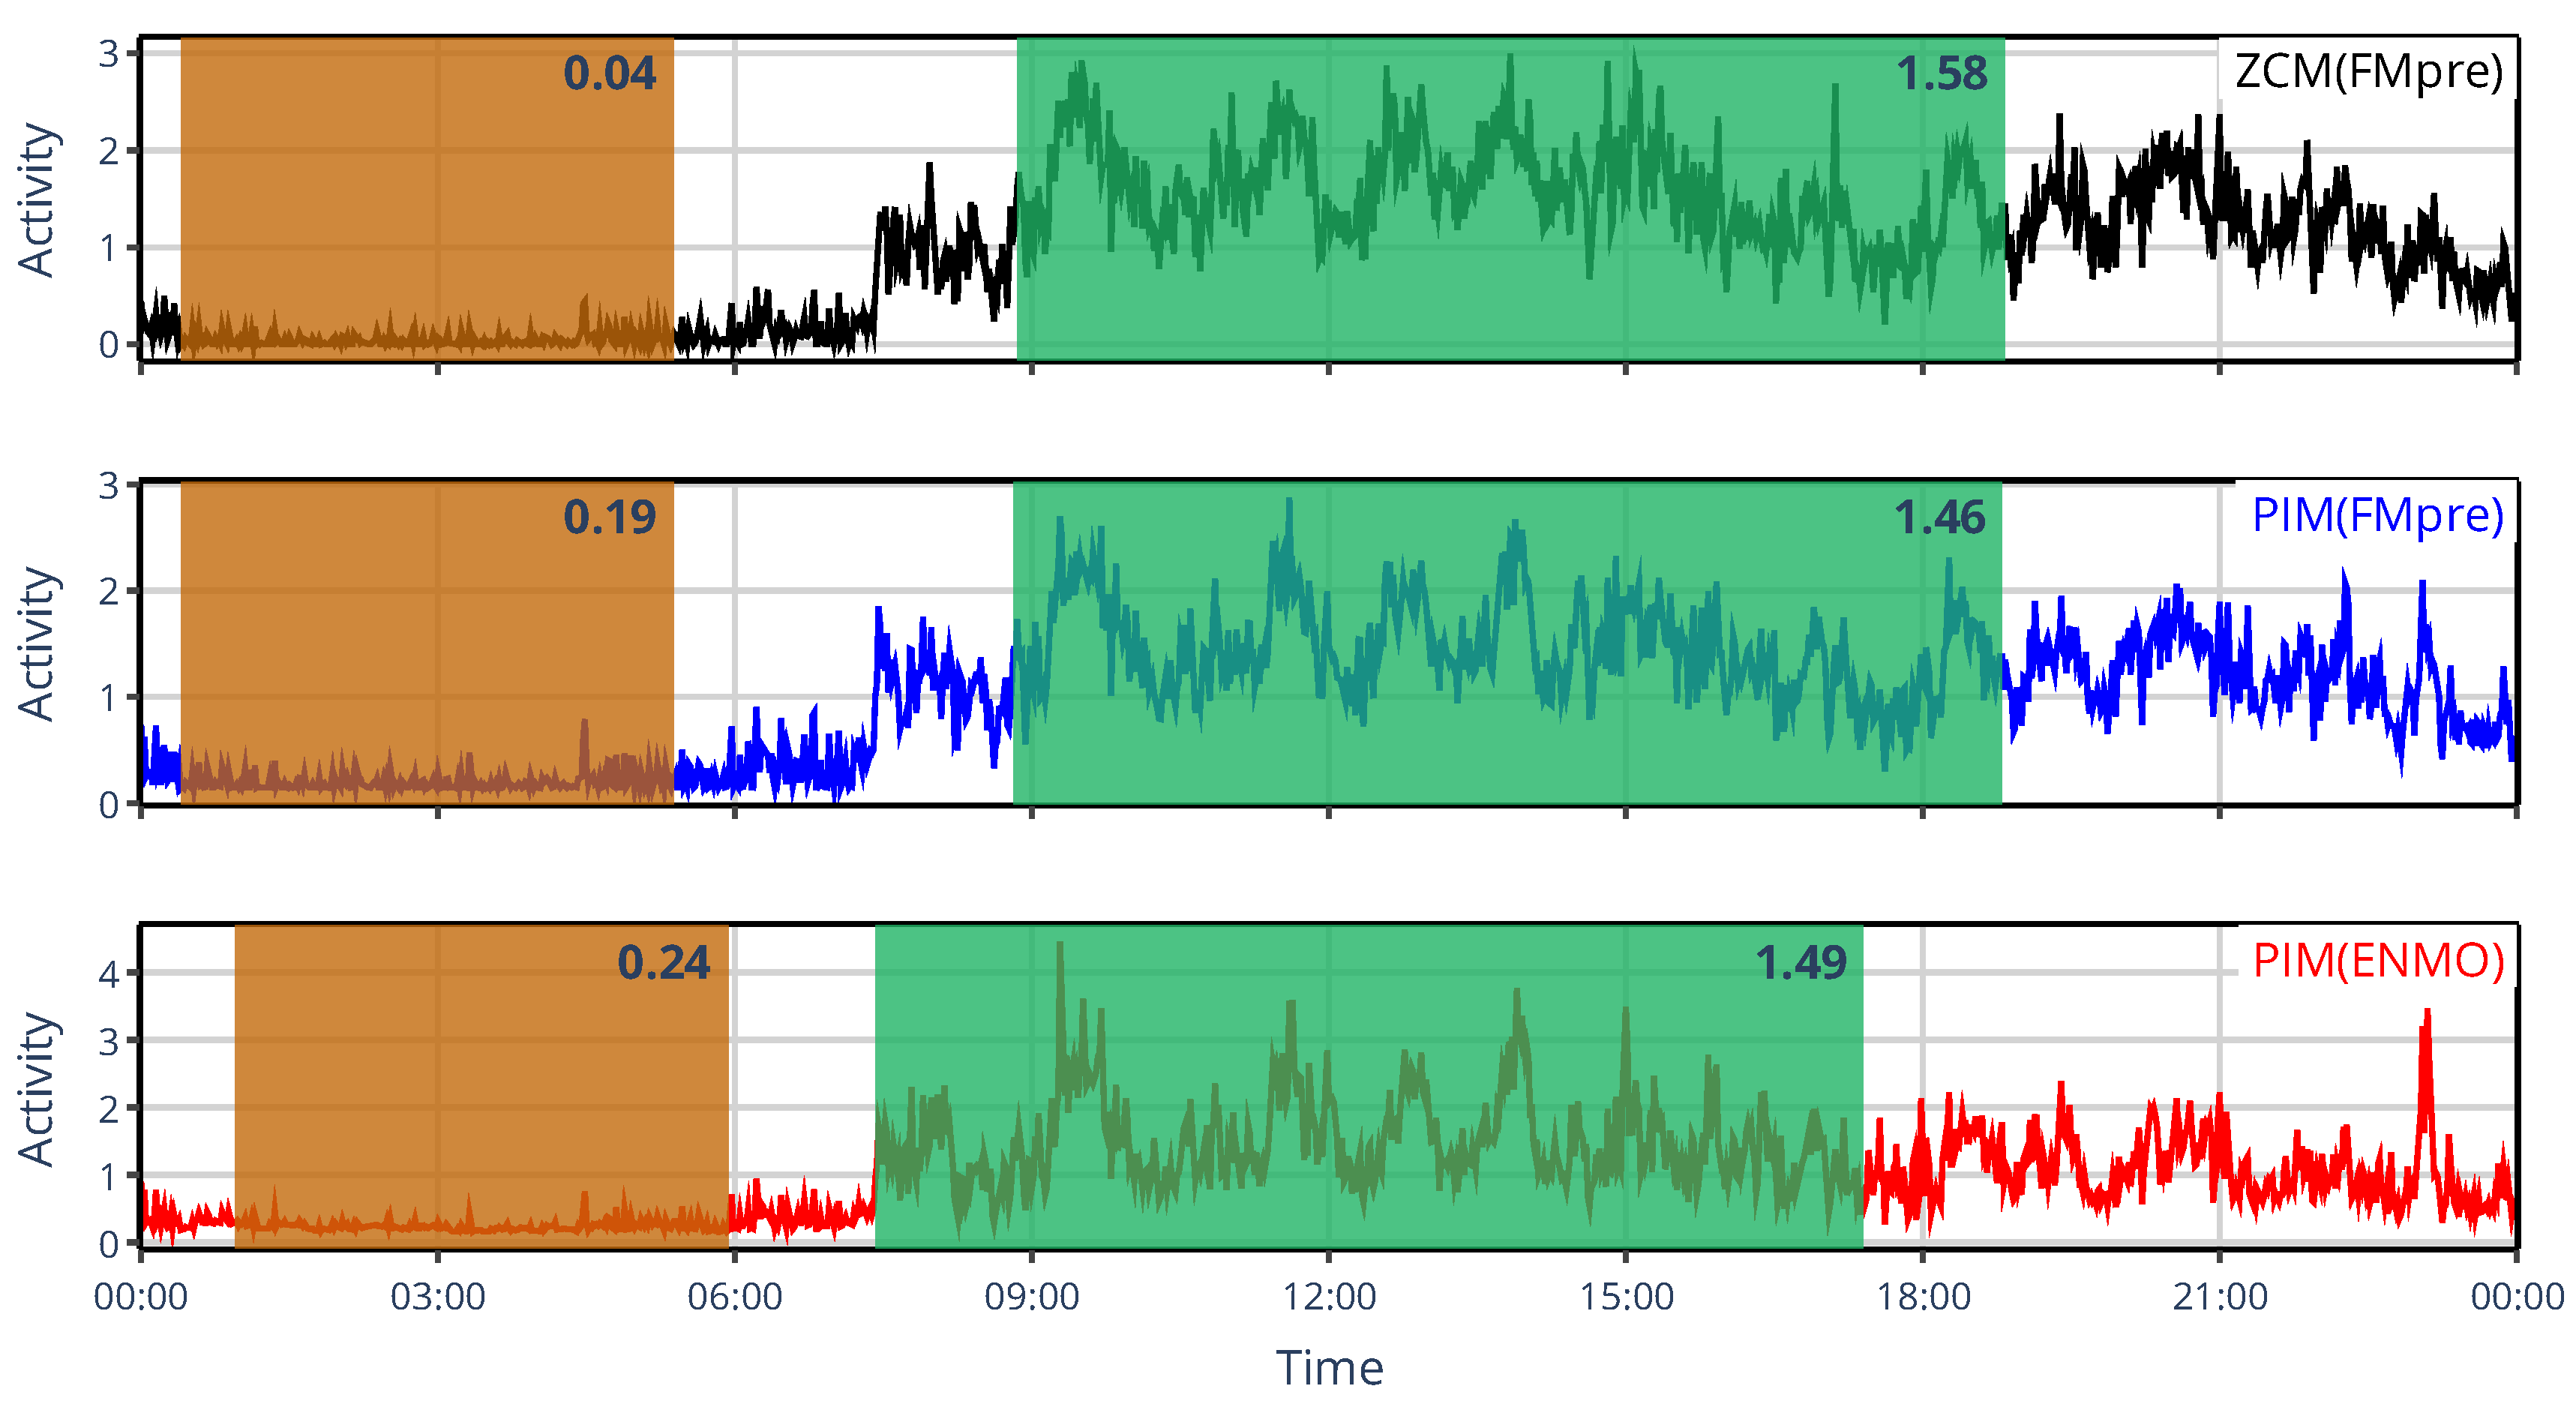
Figure 12 provides an example for L5 and M10, illustrating their dichotomy. On the one hand, when the activity metric is fixed but preprocessing differs (red vs. blue curves), average activity levels within windows are similar, though their onset varies. On the other hand, when the preprocessing technique is fixed but activity metrics differ in whether they involve thresholding (black vs. red curves), the timing of the windows aligns closely, but their mean activity differs – especially for L5. The reason for this is that L5 reflects nocturnal activity; during sleep, apart from infrequent rolling overs in bed, the acceleration values recorded by the actigraph become so small that they fail to generate threshold crossings or time above threshold. Consequently, the threshold-based ZCM and TAT activity metrics often produce epochs with zero activity, leading to lower L5 values. By contrast, acceleration values (after the gravitational component has been removed) remain nonzero, even if very close to it. Therefore, other activity metrics, such as PIM, which integrates acceleration over time, yield small but nonzero activity values and hence higher mean activity. Observing that preprocessing of acceleration data primarily influences the onset of these indicators rather than their values is intriguing; however, understanding the underlying rationale requires further investigation. It should be emphasized that in our analysis, differences arising from the distinct value ranges of various activity signal types were mitigated by normalizing both acceleration and activity signals by their respective means before computing L5 and M10. However, this step is not a standard part of general NPCRA analyses, meaning that across studies, even greater differences in these indicators may occur.
Figure 12.
The 24-h mean activity profile of the same representative subject, whose locomotor activity was quantified using the ZMC(FMpre) (black), PIM(FMpre) (blue), and PIM(ENMO) (red) activity-determination methods. The designated L5 and M10 windows are shaded in orange and green, respectively, while the corresponding indicator values are shown at the top right corner of them.
A further novelty of our work was to extend NCRA indicators beyond epoch-level activity data to higher-temporal-resolution acceleration signals, which we also incorporated on our comparative analyses. Through this, we demonstrated that NPCRA indicators can be flexibly applied to acceleration data from which the gravitational component was already eliminated, and NPCRA indicators derived from them show high agreement with the ones derived from activity data calculated with non-threshold-based activity metrics. However, since the commonly used actigraphs – as also seen from our comparison – usually employ threshold-based activity metrics, analyzing raw acceleration signals alone does not inherently enhance comparability across studies. Moreover, using activity data relaxes practical limitations: compared with tri-axial raw acceleration sampled at 100 Hz, 60-second epoch-based activity data contain 18,000 times less data points, substantially reducing both storage and computational demands. At the same time, activity data computed using non-threshold-based metrics exhibit features like acceleration data – as demonstrated in the present study and in our previous work, where we showed their agreement in the frequency domain [27]. Despite these, we believe that collecting and examining acceleration data is a step in the right direction, as at least the inhomogeneity of activity metrics can be avoided, but the standardization of acceleration preprocessing techniques is still necessary.
Although we aimed to apply a general and inclusive approach for comparison, the emulation of device specificities necessitated a few unavoidable simplifications, which may serve as limitations of our results. These include, for example, that the postcalibration of acceleration data could have also been performed using a different algorithm (e.g., the built-in solution in GGIR); that the ENMO acceleration data were compressed into 60-second epoch-level activity values in accordance with standard guidelines in the literature and for the sake of consistency, even though the default epoch length in GGIR is 5 seconds; and that the filter characteristics specific to MotionWatch devices could only be approximated due to the lower sampling rate of the acceleration data analyzed. While acknowledging these technical constraints contributes to a more comprehensive interpretation of the findings, these factors do not appear to substantially affect the presented results (as also supported by our preliminary observations from ongoing analyses) and certainly do not alter the primary conclusion that differences in manufacturer-specific signal processing techniques employed in actigraphs can markedly influence the outcomes of circadian rhythm and sleep-wake analyses.
Supplementary Materials
Supporting information can be downloaded at: https://www.mdpi.com/article/doi/s1, which includes Figure S1, S2, and S3.
Author Contributions
Conceptualization, B.M. and G.V.; methodology, B.M. and G.V.; software, B.M.; validation, B.M. and A.Z.H.; formal analysis, B.M., A.Z.H. and G.V.; investigation, B.M., A.Z.H. and G.V.; resources, B.M. and G.V.; data curation, B.M. and G.V.; writing—original draft preparation, B.M.; writing—review and editing, B.M. and G.V.; visualization, B.M.; supervision, G.V.; project administration, G.V.; funding acquisition, G.V.
Funding
The publication was supported by the University of Szeged Open Access Fund under the grant number 8225.
Institutional Review Board Statement
The study was conducted in accordance with the Declaration of Helsinki, and approved by the Human Investigation Review Board, University of Szeged, Albert Szent-Györgyi Clinical Centre, Hungary (No 267/2018-SZTE; 26 February 2019).
Informed Consent Statement
Informed consent was obtained from all subjects involved in the study.
Data Availability Statement
The raw actigraphic acceleration data examined in this study are openly available in FigShare at https://doi.org/10.6084/m9.figshare.16437684.v1.
Acknowledgments
This research was supported by project TKP2021-NVA-09, which has been implemented with the support provided by the Ministry of Innovation and Technology of Hungary from the National Research, Development and Innovation Fund, financed under the TKP2021-NVA funding scheme. Bálint Maczák was supported by EKÖP-24-3-II University Research Scholarship Programme of the Ministry for Culture and Innovation from the National Research, Development and Innovation Fund. The authors thank Róbert Bódizs and Csenge G. Horváth for their valuable insights about nonparametric circadian rhythm analysis.
Conflicts of Interest
The authors declare no conflicts of interest.
Abbreviations
The following abbreviations are used in this manuscript:
| PSG | Polysomnography |
| NPCRA | Nonparametric Circadian Rhythm Analysis |
| L5 | Least active consecutive 5 hours |
| M10 | Most active consecutive 10 hours |
| MASDA | Munich Actimetry Sleep Detection Algorithm |
| SIB | Sustained Inactivity Bouts |
| SPT | Sleep Period Time |
| L5val, M10val | The mean activity of the least/most active consecutive 5/10 hours |
| L5onset, M10onset | The start time of the least/most active consecutive 5/10 hours |
| RA | Relative Amplitude |
| IS | Interdaily Stability |
| IV | Intradaily Variability |
| MEMS | Micro-electromechanical systems |
| UFX, UFY, UFZ | Raw acceleration measured along the x, y and z axis |
| UFM | Magnitude of acceleration calculated by taking the Euclidean norm of UFX, UFY, and UFZ |
| UFNM | Magnitude of acceleration where the gravitational component was eliminated by subtracting 1 g from the UFM and taking the absolute value |
| ENMO | Magnitude of acceleration where the gravitational component was eliminated by subtracting 1 g from the UFM data and truncating negative values to 0 |
| FX, FY, FZ | Per-axis acceleration where the gravitational component was eliminated by band-pass filtering the UFX, UFY, and UFZ data |
| FMpost | Postfiltered magnitude of acceleration where the gravitational component was eliminated by band-pass filtering the UFM data |
| FMpre | Prefiltered magnitude of the acceleration where the gravitational component was eliminated by taking the Euclidean norm of FX, FY, and FZ |
| HFMpre | Prefiltered magnitude of the acceleration where the gravitational component was eliminated by taking the Euclidean norm of high-pass-filtered UFX, UFY, and UFZ |
| PIM | Proportional Integration Method |
| ZCM | Zero Crossing Method |
| TAT | Time Above Threshold |
| MAD | Mean Amplitude Deviation |
| AI | Activity Index |
| HFEN | High-pass Filtered Euclidean Norm |
| AC | Activity Count |
| MW | Motion Watch |
| SMAPE | Symmetrical Mean Absolute Percentage Error |
| TST | Total Sleep Time |
| IoU | Intersect over Union |
References
- Patterson, M.R.; Nunes, A.A.S.; Gerstel, D.; Pilkar, R.; Guthrie, T.; Neishabouri, A.; Guo, C.C. 40 Years of Actigraphy in Sleep Medicine and Current State of the Art Algorithms. npj Digit. Med. 2023, 6, 1–7. [CrossRef]
- Maczák, B.; Vadai, G.; Dér, A.; Szendi, I.; Gingl, Z. Detailed Analysis and Comparison of Different Activity Metrics. PLOS ONE 2021, 16, e0261718. [CrossRef]
- Neishabouri, A.; Nguyen, J.; Samuelsson, J.; Guthrie, T.; Biggs, M.; Wyatt, J.; Cross, D.; Karas, M.; Migueles, J.H.; Khan, S.; et al. Quantification of Acceleration as Activity Counts in ActiGraph Wearable. Sci Rep 2022, 12, 11958. [CrossRef]
- Baird, J. Whitepaper: Enhanced Actigraphy (Garmin Ltd.) Available online: https://www8.garmin.com/garminhealth/news/ActigraphyWhitepaper.pdf.
- Faedda, G.L.; Ohashi, K.; Hernandez, M.; McGreenery, C.E.; Grant, M.C.; Baroni, A.; Polcari, A.; Teicher, M.H. Actigraph Measures Discriminate Pediatric Bipolar Disorder from Attention-Deficit/Hyperactivity Disorder and Typically-Developing Controls. J Child Psychol Psychiatry 2016, 57, 706–716. [CrossRef]
- Nagy, Á.; Dombi, J.; Fülep, M.P.; Rudics, E.; Hompoth, E.A.; Szabó, Z.; Dér, A.; Búzás, A.; Viharos, Z.J.; Hoang, A.T.; et al. The Actigraphy-Based Identification of Premorbid Latent Liability of Schizophrenia and Bipolar Disorder. Sensors 2023, 23, 958. [CrossRef]
- Rhudy, M.B.; Dreisbach, S.B.; Moran, M.D.; Ruggiero, M.J.; Veerabhadrappa, P. Cut Points of the Actigraph GT9X for Moderate and Vigorous Intensity Physical Activity at Four Different Wear Locations. J Sports Sci 2020, 38, 503–510. [CrossRef]
- Ochab, J.K.; Tyburczyk, J.; Beldzik, E.; Chialvo, D.R.; Domagalik, A.; Fafrowicz, M.; Gudowska-Nowak, E.; Marek, T.; Nowak, M.A.; Oginska, H.; et al. Scale-Free Fluctuations in Behavioral Performance: Delineating Changes in Spontaneous Behavior of Humans with Induced Sleep Deficiency. PLOS ONE 2014, 9. [CrossRef]
- Gonçalves, B.; Adamowicz, T.; Louzada, F.M.; Moreno, C.R.; Araujo, J.F. A Fresh Look at the Use of Nonparametric Analysis in Actimetry. Sleep Medicine Reviews 2015, 20, 84–91. [CrossRef]
- Sadeh, A.; Sharkey, M.; Carskadon, M.A. Activity-Based Sleep-Wake Identification: An Empirical Test of Methodological Issues. Sleep 1994, 17, 201–207. [CrossRef]
- Cole, R.J.; Kripke, D.F.; Gruen, W.; Mullaney, D.J.; Gillin, J.C. Automatic Sleep/Wake Identification From Wrist Activity. Sleep 1992, 15, 461–469. [CrossRef]
- van Hees, V.T.; Sabia, S.; Anderson, K.N.; Denton, S.J.; Oliver, J.; Catt, M.; Abell, J.G.; Kivimäki, M.; Trenell, M.I.; Singh-Manoux, A. A Novel, Open Access Method to Assess Sleep Duration Using a Wrist-Worn Accelerometer. PLOS ONE 2015, 10, e0142533. [CrossRef]
- Mitchell, J.A.; Quante, M.; Godbole, S.; James, P.; Hipp, J.A.; Marinac, C.R.; Mariani, S.; Cespedes Feliciano, E.M.; Glanz, K.; Laden, F.; et al. Variation in Actigraphy-Estimated Rest-Activity Patterns by Demographic Factors. Chronobiology International 2017, 34, 1042–1056. [CrossRef]
- Gopalakrishnan, K.; Li, Z.; Boukhechba, M.; Reynoso, E.; Mosca, K.; Morris, M.; Avey, S. Fatigue Detection with Machine Learning Approaches Using Data from Wearable Devices. In Proceedings of the 2024 46th Annual International Conference of the IEEE Engineering in Medicine and Biology Society (EMBC); July 2024; pp. 1–6.
- Fairclough, S.J.; Clifford, L.; Brown, D.; Tyler, R. Characteristics of 24-Hour Movement Behaviours and Their Associations with Mental Health in Children and Adolescents. Journal of Activity, Sedentary and Sleep Behaviors 2023, 2, 11. [CrossRef]
- Minaeva, O.; Schat, E.; Ceulemans, E.; Kunkels, Y.K.; Smit, A.C.; Wichers, M.; Booij, S.H.; Riese, H. Individual-Specific Change Points in Circadian Rest-Activity Rhythm and Sleep in Individuals Tapering Their Antidepressant Medication: An Actigraphy Study. Sci Rep 2024, 14, 855. [CrossRef]
- Merikanto, I.; Partonen, T.; Paunio, T.; Castaneda, A.E.; Marttunen, M.; Urrila, A.S. Advanced Phases and Reduced Amplitudes Are Suggested to Characterize the Daily Rest-Activity Cycles in Depressed Adolescent Boys. Chronobiology International 2017, 34, 967–976. [CrossRef]
- Díaz, D.Z.R.; Gavião, M.B.D. Sleep-Wake Circadian Rhythm Pattern in Young Adults by Actigraphy during Social Isolation. Sleep Science 2023, 15, 172–183.
- Forner-Cordero, A.; Umemura, G.S.; Furtado, F.; Gonçalves, B. da S.B. Comparison of Sleep Quality Assessed by Actigraphy and Questionnaires to Healthy Subjects. Sleep Science 2023, 11, 141–145.
- Tonon, A.C.; Constantino, D.B.; Amando, G.R.; Abreu, A.C.; Francisco, A.P.; de Oliveira, M.A.B.; Pilz, L.K.; Xavier, N.B.; Rohrsetzer, F.; Souza, L.; et al. Sleep Disturbances, Circadian Activity, and Nocturnal Light Exposure Characterize High Risk for and Current Depression in Adolescence. Sleep 2022, 45, zsac104. [CrossRef]
- Ferreira, A.B.D.; Schaedler, T.; Mendes, J.V.; Anacleto, T.S.; Louzada, F.M. Circadian Ontogeny through the Lens of Nonparametric Variables of Actigraphy. Chronobiology International 2019, 36, 1184–1189. [CrossRef]
- Filardi, M.; Gnoni, V.; Tamburrino, L.; Nigro, S.; Urso, D.; Vilella, D.; Tafuri, B.; Giugno, A.; De Blasi, R.; Zoccolella, S.; et al. Sleep and Circadian Rhythm Disruptions in Behavioral Variant Frontotemporal Dementia. Alzheimer’s & Dementia 2024, 20, 1966–1977. [CrossRef]
- Cui, S.; Lin, Q.; Gui, Y.; Zhang, Y.; Lu, H.; Zhao, H.; Wang, X.; Li, X.; Jiang, F. CARE as a Wearable Derived Feature Linking Circadian Amplitude to Human Cognitive Functions. npj Digit. Med. 2023, 6, 123. [CrossRef]
- Walsh, C.M.; Ruoff, L.; Varbel, J.; Walker, K.; Grinberg, L.T.; Boxer, A.L.; Kramer, J.H.; Miller, B.L.; Neylan, T.C. Rest-Activity Rhythm Disruption in Progressive Supranuclear Palsy. Sleep Medicine 2016, 22, 50–56. [CrossRef]
- Nunes, D.M.; Gonçalves, B.S.B.; Tardelli Peixoto, C.A.; De Bruin, V.M.S.; Louzada, F.M.; De Bruin, P.F.C. Circadian Rest-Activity Rhythm in Chronic Obstructive Pulmonary Disease. Chronobiology International 2017, 34, 1315–1319. [CrossRef]
- Weaver, R.G.; de Zambotti, M.; White, J.; Finnegan, O.; Nelakuditi, S.; Zhu, X.; Burkart, S.; Beets, M.W.; Brown, D.; Pate, R.R.; et al. Evaluation of a Device-Agnostic Approach to Predict Sleep from Raw Accelerometry Data Collected by Apple Watch Series 7, Garmin Vivoactive 4 and ActiGraph GT9X Link in Children with Sleep Disruptions. Sleep Health 2023, 9, 417–429. [CrossRef]
- Maczák, B.; Gingl, Z.; Vadai, G. General Spectral Characteristics of Human Activity and Its Inherent Scale-Free Fluctuations. Sci Rep 2024, 14, 2604. [CrossRef]
- Loock, A.-S.; Khan Sullivan, A.; Reis, C.; Paiva, T.; Ghotbi, N.; Pilz, L.K.; Biller, A.M.; Molenda, C.; Vuori-Brodowski, M.T.; Roenneberg, T.; et al. Validation of the Munich Actimetry Sleep Detection Algorithm for Estimating Sleep–Wake Patterns from Activity Recordings. Journal of Sleep Research 2021, 30, e13371. [CrossRef]
- Reyt, M.; Deantoni, M.; Baillet, M.; Lesoinne, A.; Laloux, S.; Lambot, E.; Demeuse, J.; Calaprice, C.; LeGoff, C.; Collette, F.; et al. Daytime Rest: Association with 24-h Rest–Activity Cycles, Circadian Timing and Cognition in Older Adults. Journal of Pineal Research 2022, 73, e12820. [CrossRef]
- Roenneberg, T.; Keller, L.K.; Fischer, D.; Matera, J.L.; Vetter, C.; Winnebeck, E.C. Human Activity and Rest In Situ. In Methods in Enzymology; Elsevier, 2015; Vol. 552, pp. 257–283 ISBN 978-0-12-803380-7.
- Hammad, G.; Reyt, M.; Beliy, N.; Baillet, M.; Deantoni, M.; Lesoinne, A.; Muto, V.; Schmidt, C. pyActigraphy: Open-Source Python Package for Actigraphy Data Visualization and Analysis. PLOS Computational Biology 2021, 17, e1009514. [CrossRef]
- Migueles, J.H.; Rowlands, A.V.; Huber, F.; Sabia, S.; van Hees, V.T. GGIR: A Research Community–Driven Open Source R Package for Generating Physical Activity and Sleep Outcomes From Multi-Day Raw Accelerometer Data. 2019.
- van Hees, V.T.; Sabia, S.; Jones, S.E.; Wood, A.R.; Anderson, K.N.; Kivimäki, M.; Frayling, T.M.; Pack, A.I.; Bucan, M.; Trenell, M.I.; et al. Estimating Sleep Parameters Using an Accelerometer without Sleep Diary. Sci Rep 2018, 8, 12975. [CrossRef]
- Migueles, J.H.; van Hees, V.T. GGIR Configuration Parameters Available online: https://wadpac.github.io/GGIR/articles/GGIRParameters.html?q=HDCZA#hdcza_threshold (accessed on 28 October 2025).
- Bradley, A.J.; Webb-Mitchell, R.; Hazu, A.; Slater, N.; Middleton, B.; Gallagher, P.; McAllister-Williams, H.; Anderson, K.N. Sleep and Circadian Rhythm Disturbance in Bipolar Disorder. Psychological Medicine 2017, 47, 1678–1689. [CrossRef]
- Zhao, A.; Cui, E.; Leroux, A.; Zhou, X.; Muschelli, J.; Lindquist, M.A.; Crainiceanu, C.M. Objectively Measured Physical Activity Using Wrist-Worn Accelerometers as a Predictor of Incident Alzheimer’s Disease in the UK Biobank. J Gerontol A Biol Sci Med Sci 2025, 80, glae287. [CrossRef]
- Helsel, B.C. Bhelsel/Agcounts Available online: https://github.com/bhelsel/agcounts (accessed on 9 October 2025).
- CamNtech Ltd. The MotionWatch User Guide 2024.
- Berger, A.M.; Wielgus, K.K.; Young-McCaughan, S.; Fischer, P.; Farr, L.; Lee, K.A. Methodological Challenges When Using Actigraphy in Research. Journal of Pain and Symptom Management 2008, 36, 191–199. [CrossRef]
- Condor Instruments - ACTTRUST User Manual Available online: https://www.condorinst.com.br/wp-content/uploads/2021/08/Manual_ActTrust_2017051701_en.pdf (accessed on 2 March 2021).
- Kazlausky, T.; Tavolacci, L.; Gruen, W. Ambulatory Monitoring Inc. - Product Catalog Available online: http://www.ambulatory-monitoring.com/pdf/29ede7a4.pdf (accessed on 2 March 2021).
- Maczák, B.; Vadai, G.; Dér, A.; Szendi, I.; Gingl, Z. Raw Triaxial Acceleration Data of Actigraphic Measurements – Supporting Information of “Detailed Analysis and Comparison of Different Activity Metrics” 2021, 926544546 Bytes.
- Farago, D.; Maczak, B.; Gingl, Z. Enhancing Accuracy in Actigraphic Measurements: A Lightweight Calibration Method for Triaxial Accelerometers. IEEE Access 2024, 12, 38102–38111. [CrossRef]
- Cluster Analysis; Everitt, B., Ed.; 5. ed.; Wiley: Chichester, 2011; ISBN 978-0-470-97780-4.
- Jones, S.H.; Hare, D.J.; Evershed, K. Actigraphic Assessment of Circadian Activity and Sleep Patterns in Bipolar Disorder. Bipolar Disord 2005, 7, 176–186. [CrossRef]
- Berle, J.O.; Hauge, E.R.; Oedegaard, K.J.; Holsten, F.; Fasmer, O.B. Actigraphic Registration of Motor Activity Reveals a More Structured Behavioural Pattern in Schizophrenia than in Major Depression. BMC Res Notes 2010, 3, 149. [CrossRef]
- Mitchell, J.; Quante, M.; Godbole, S.; James, P.; Hipp, A.; Marinac, C.; Mariani, S.; Feliciano, E.; Glanz, K.; Laden, F.; et al. Variation in Actigraphy-Estimated Rest-Activity Patterns by Demographic Factors. Chronobiology International 2017, 34, 1–15. [CrossRef]
Figure 1.
Correlation-coefficient-based similarity among different activity determination methods [2]. The cells indicate the average correlation, computed across 42 subjects, between activity signals derived from the same motion but determined differently according to our generalized framework. Row and column labels are grouped by the employed acceleration signal preprocessing technique (which is in parentheses, as the argument of the activity metric) and color-coded accordingly.
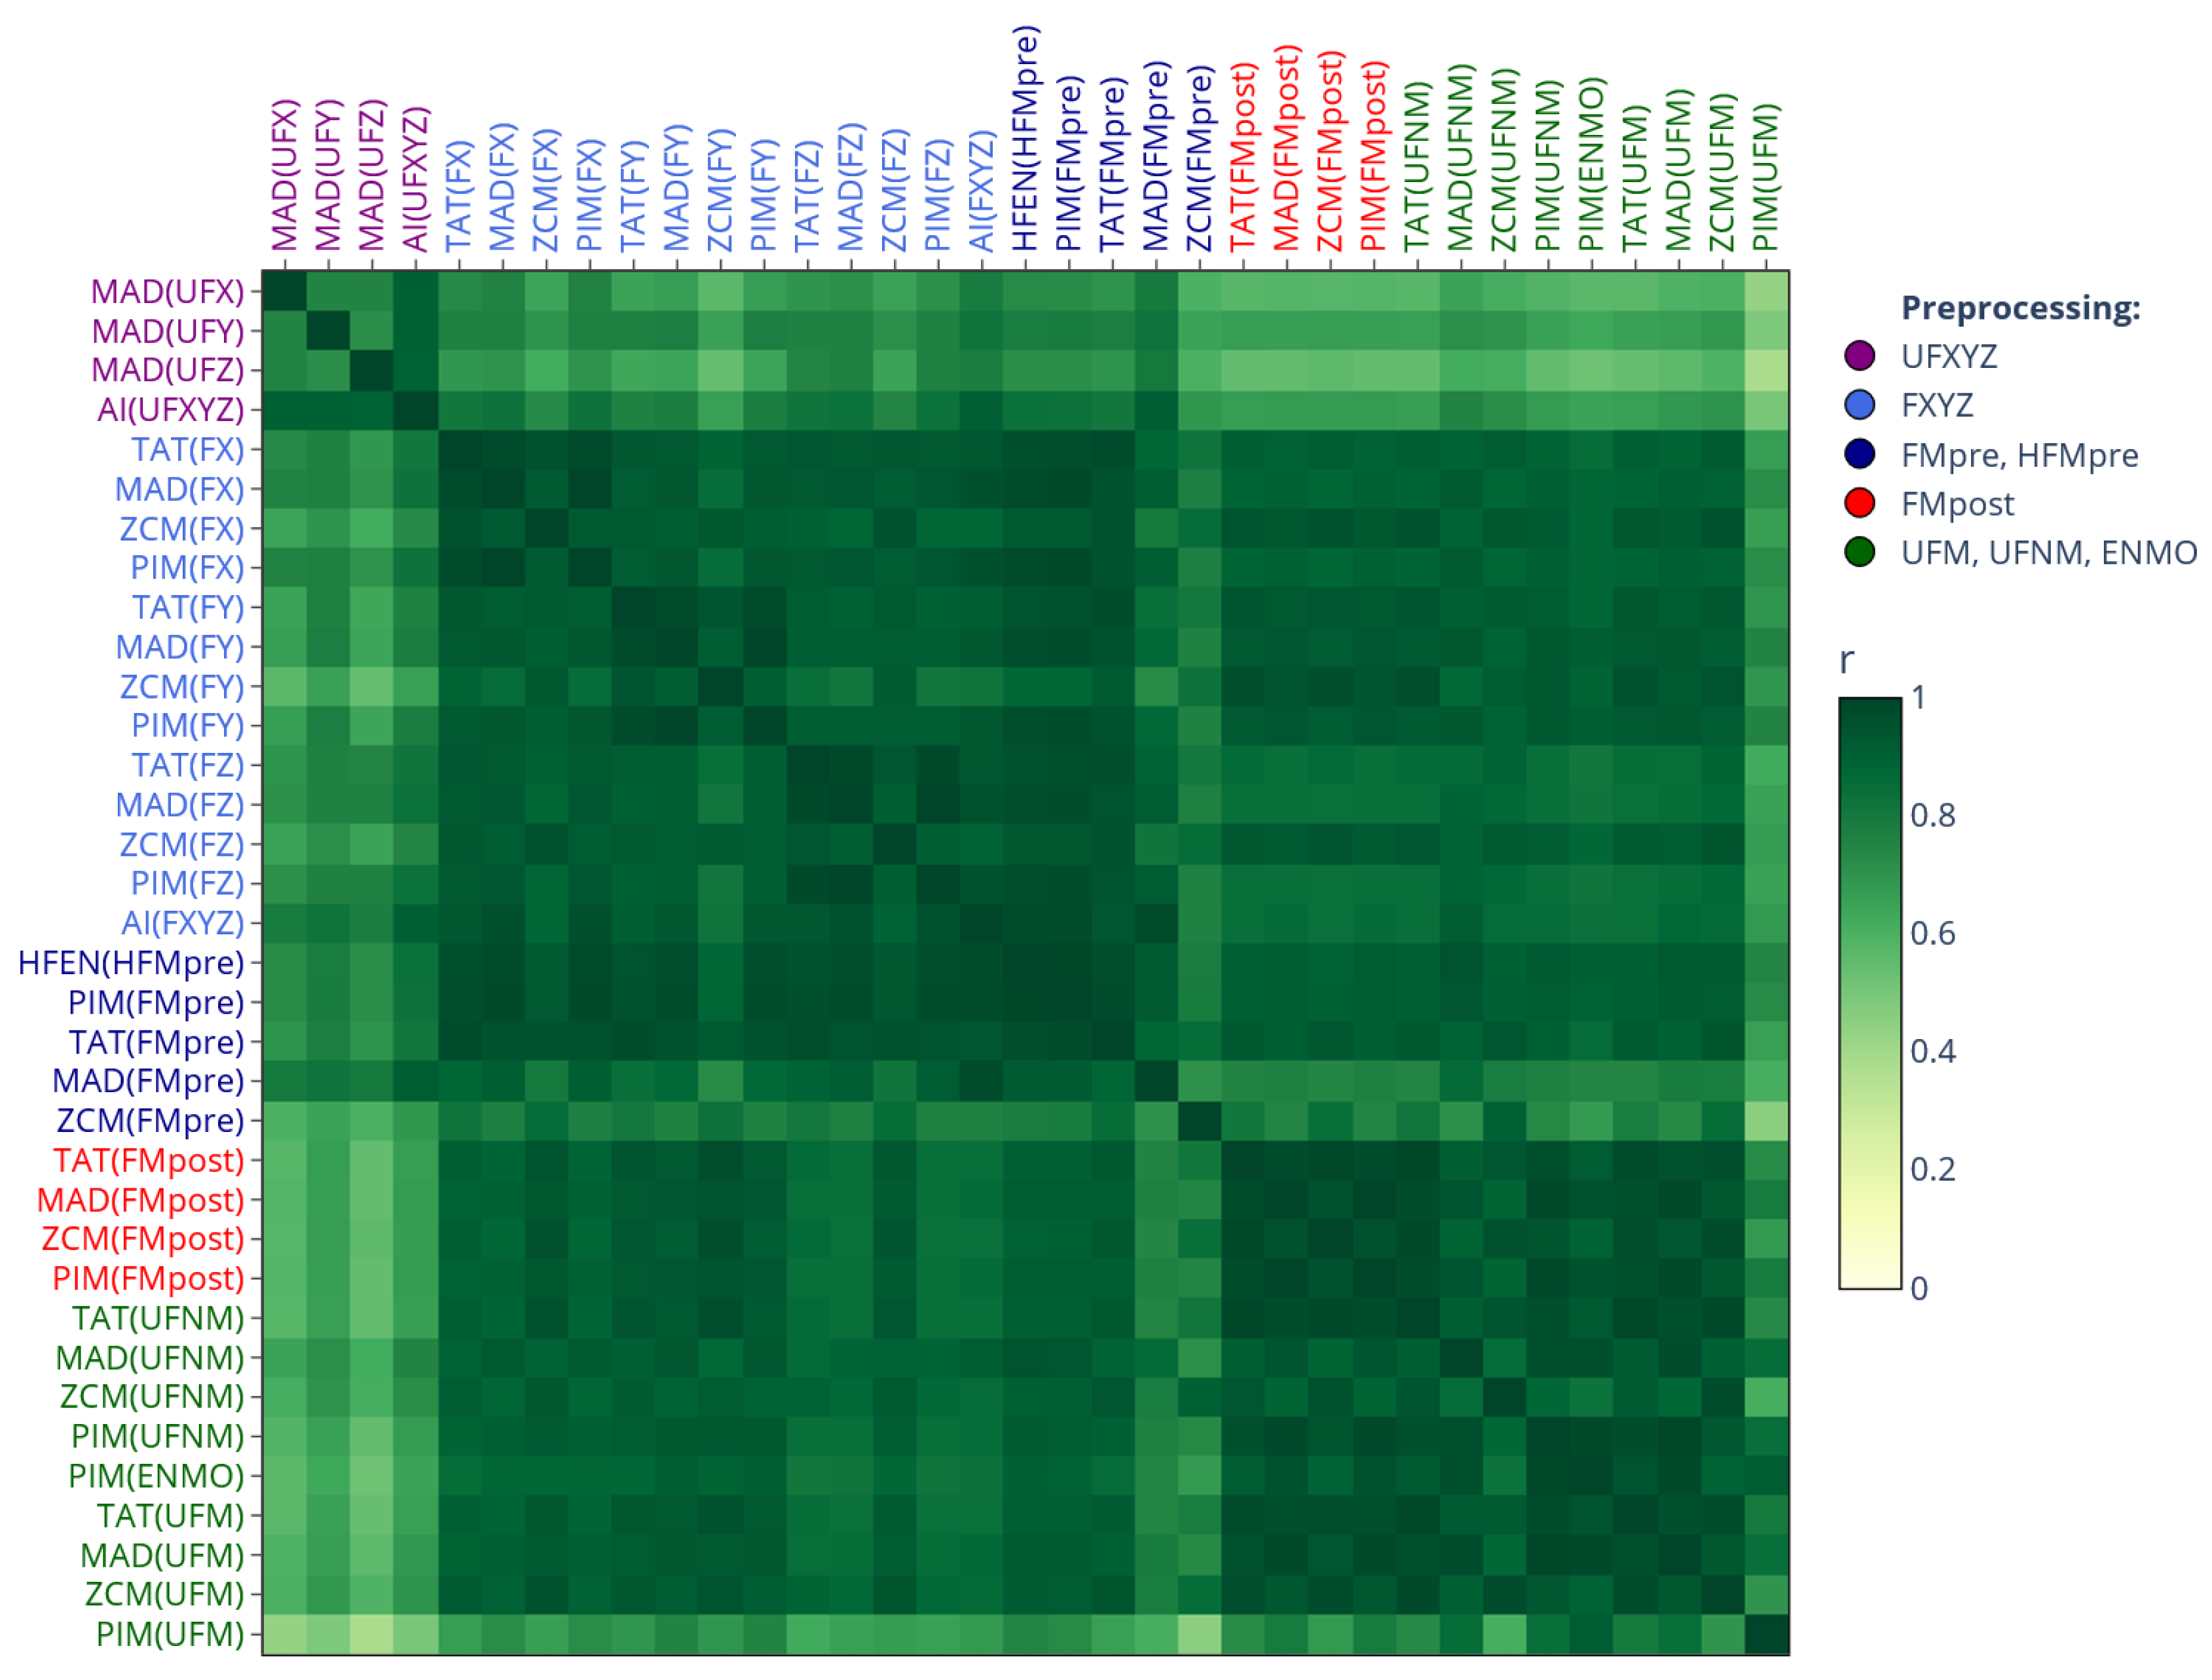
Figure 2.
The mean value of L5, M10, and RA across 42 subjects are shown depending on which signal-processing pipeline of our generalized framework was used to generate the different acceleration and activity signals. The mean values are grouped into 3 categories by color coding: black circles denote mean values derived from acceleration data, while blue and red circles represent mean values for activity signals determined using threshold-based and non-threshold-based activity metrics, respectively.
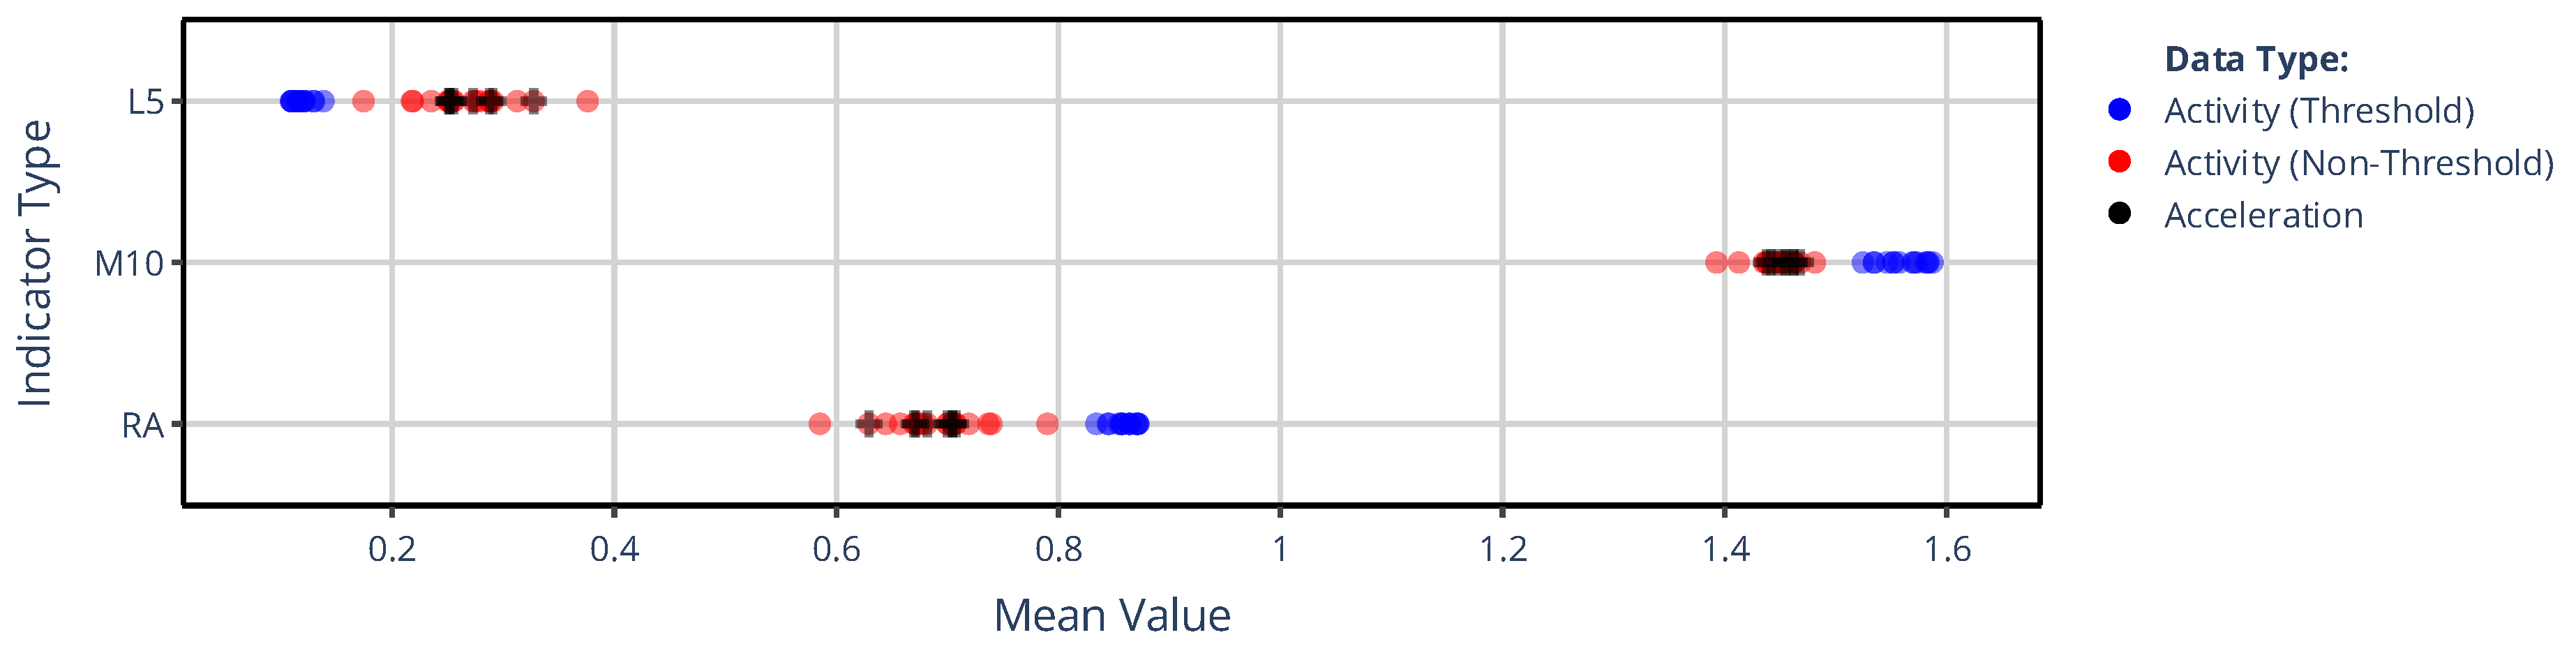
Figure 3.
The mean value of IS and IV across 42 subjects are shown depending on which signal-processing pipeline of our generalized framework was used to generate the different acceleration and activity signals. In contrast to Figure 2, but similar to Figure 1, the mean values are grouped into 5 categories by color coding according to the preprocessing technique applied to the raw acceleration data, as indicated in the legend.
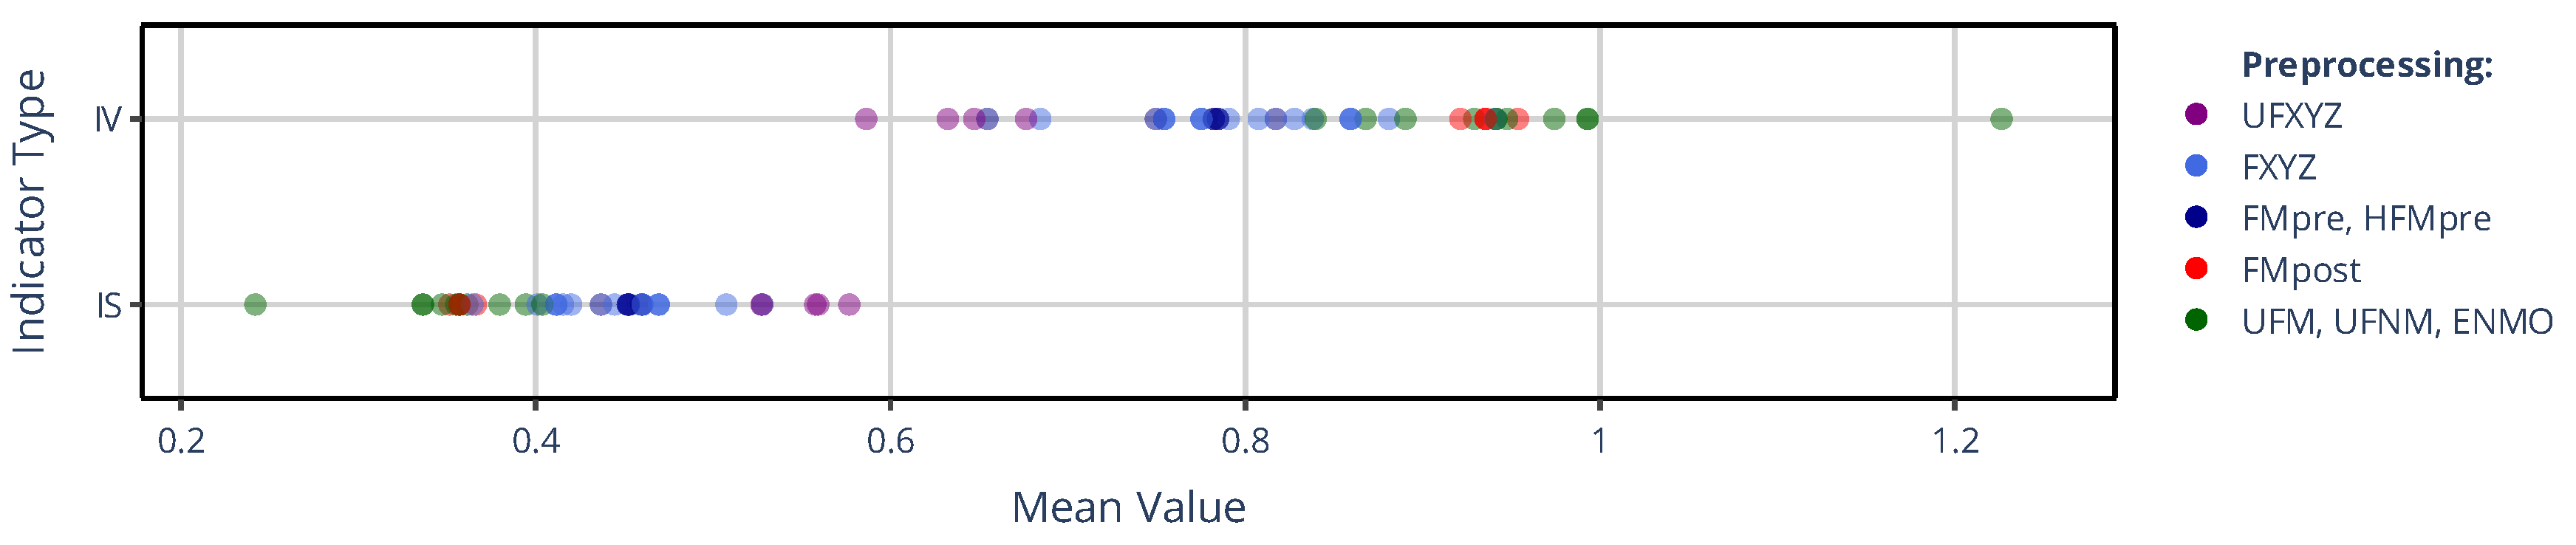
Figure 4.
a) Differences in the mean value of L5 across 42 subjects depending on which signal-processing pipeline of our generalized framework was used to generate the acceleration or activity data. The cells of the matrix represent SMAPE values ranging from 0% to 200%, with the gradient color scale shifting linearly from green to yellow as SMAPE increases from 0% to 100%. b) The dendrogram corresponding to the similarity matrix. The label colors in both the similarity matrix and the dendrogram follow the same color coding as in Figure 2, as indicated in the legend.
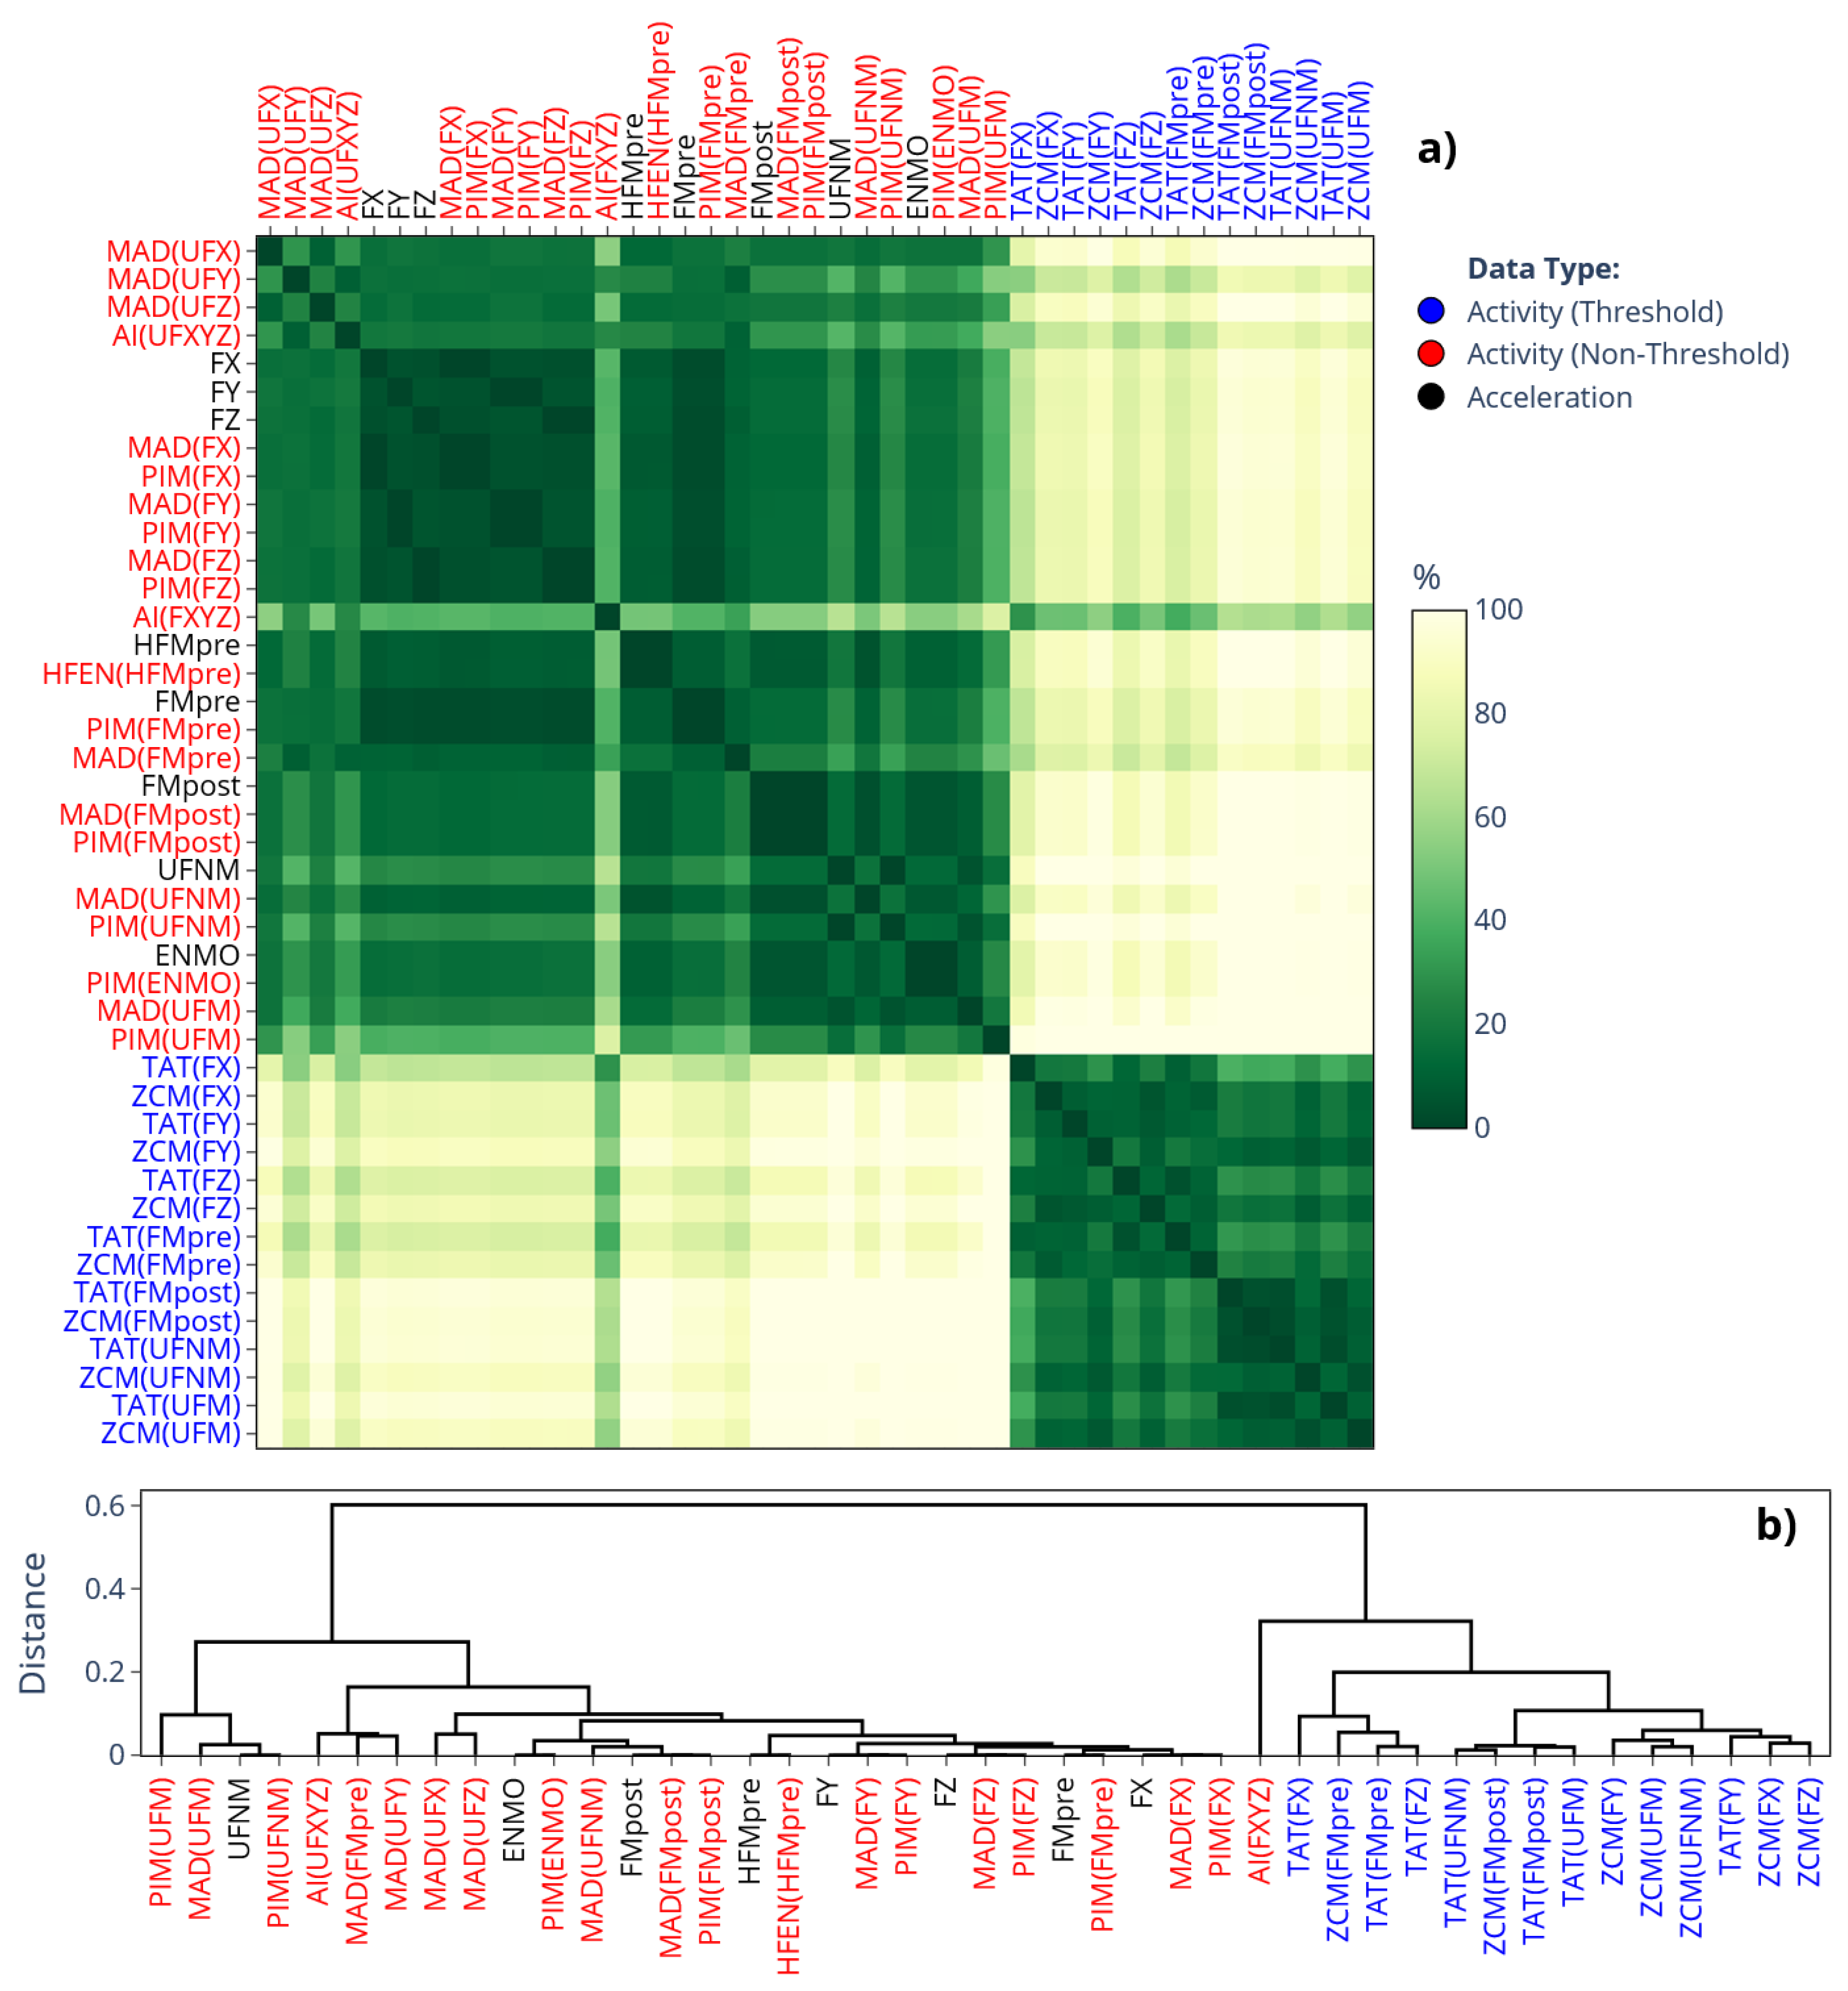
Figure 5.
a) Differences in the mean value of IS across 42 subjects depending on which signal-processing pipeline of our generalized framework was used to generate the acceleration or activity data. The cells of the matrix represent SMAPE values ranging from 0% to 200%, with the gradient color scale shifting linearly from green to yellow as SMAPE increases from 0% to 100%. b) The dendrogram corresponding to the similarity matrix. The label colors in both the similarity matrix and the dendrogram follow the same color coding as in Figures 1 and 3, as indicated in the legend.
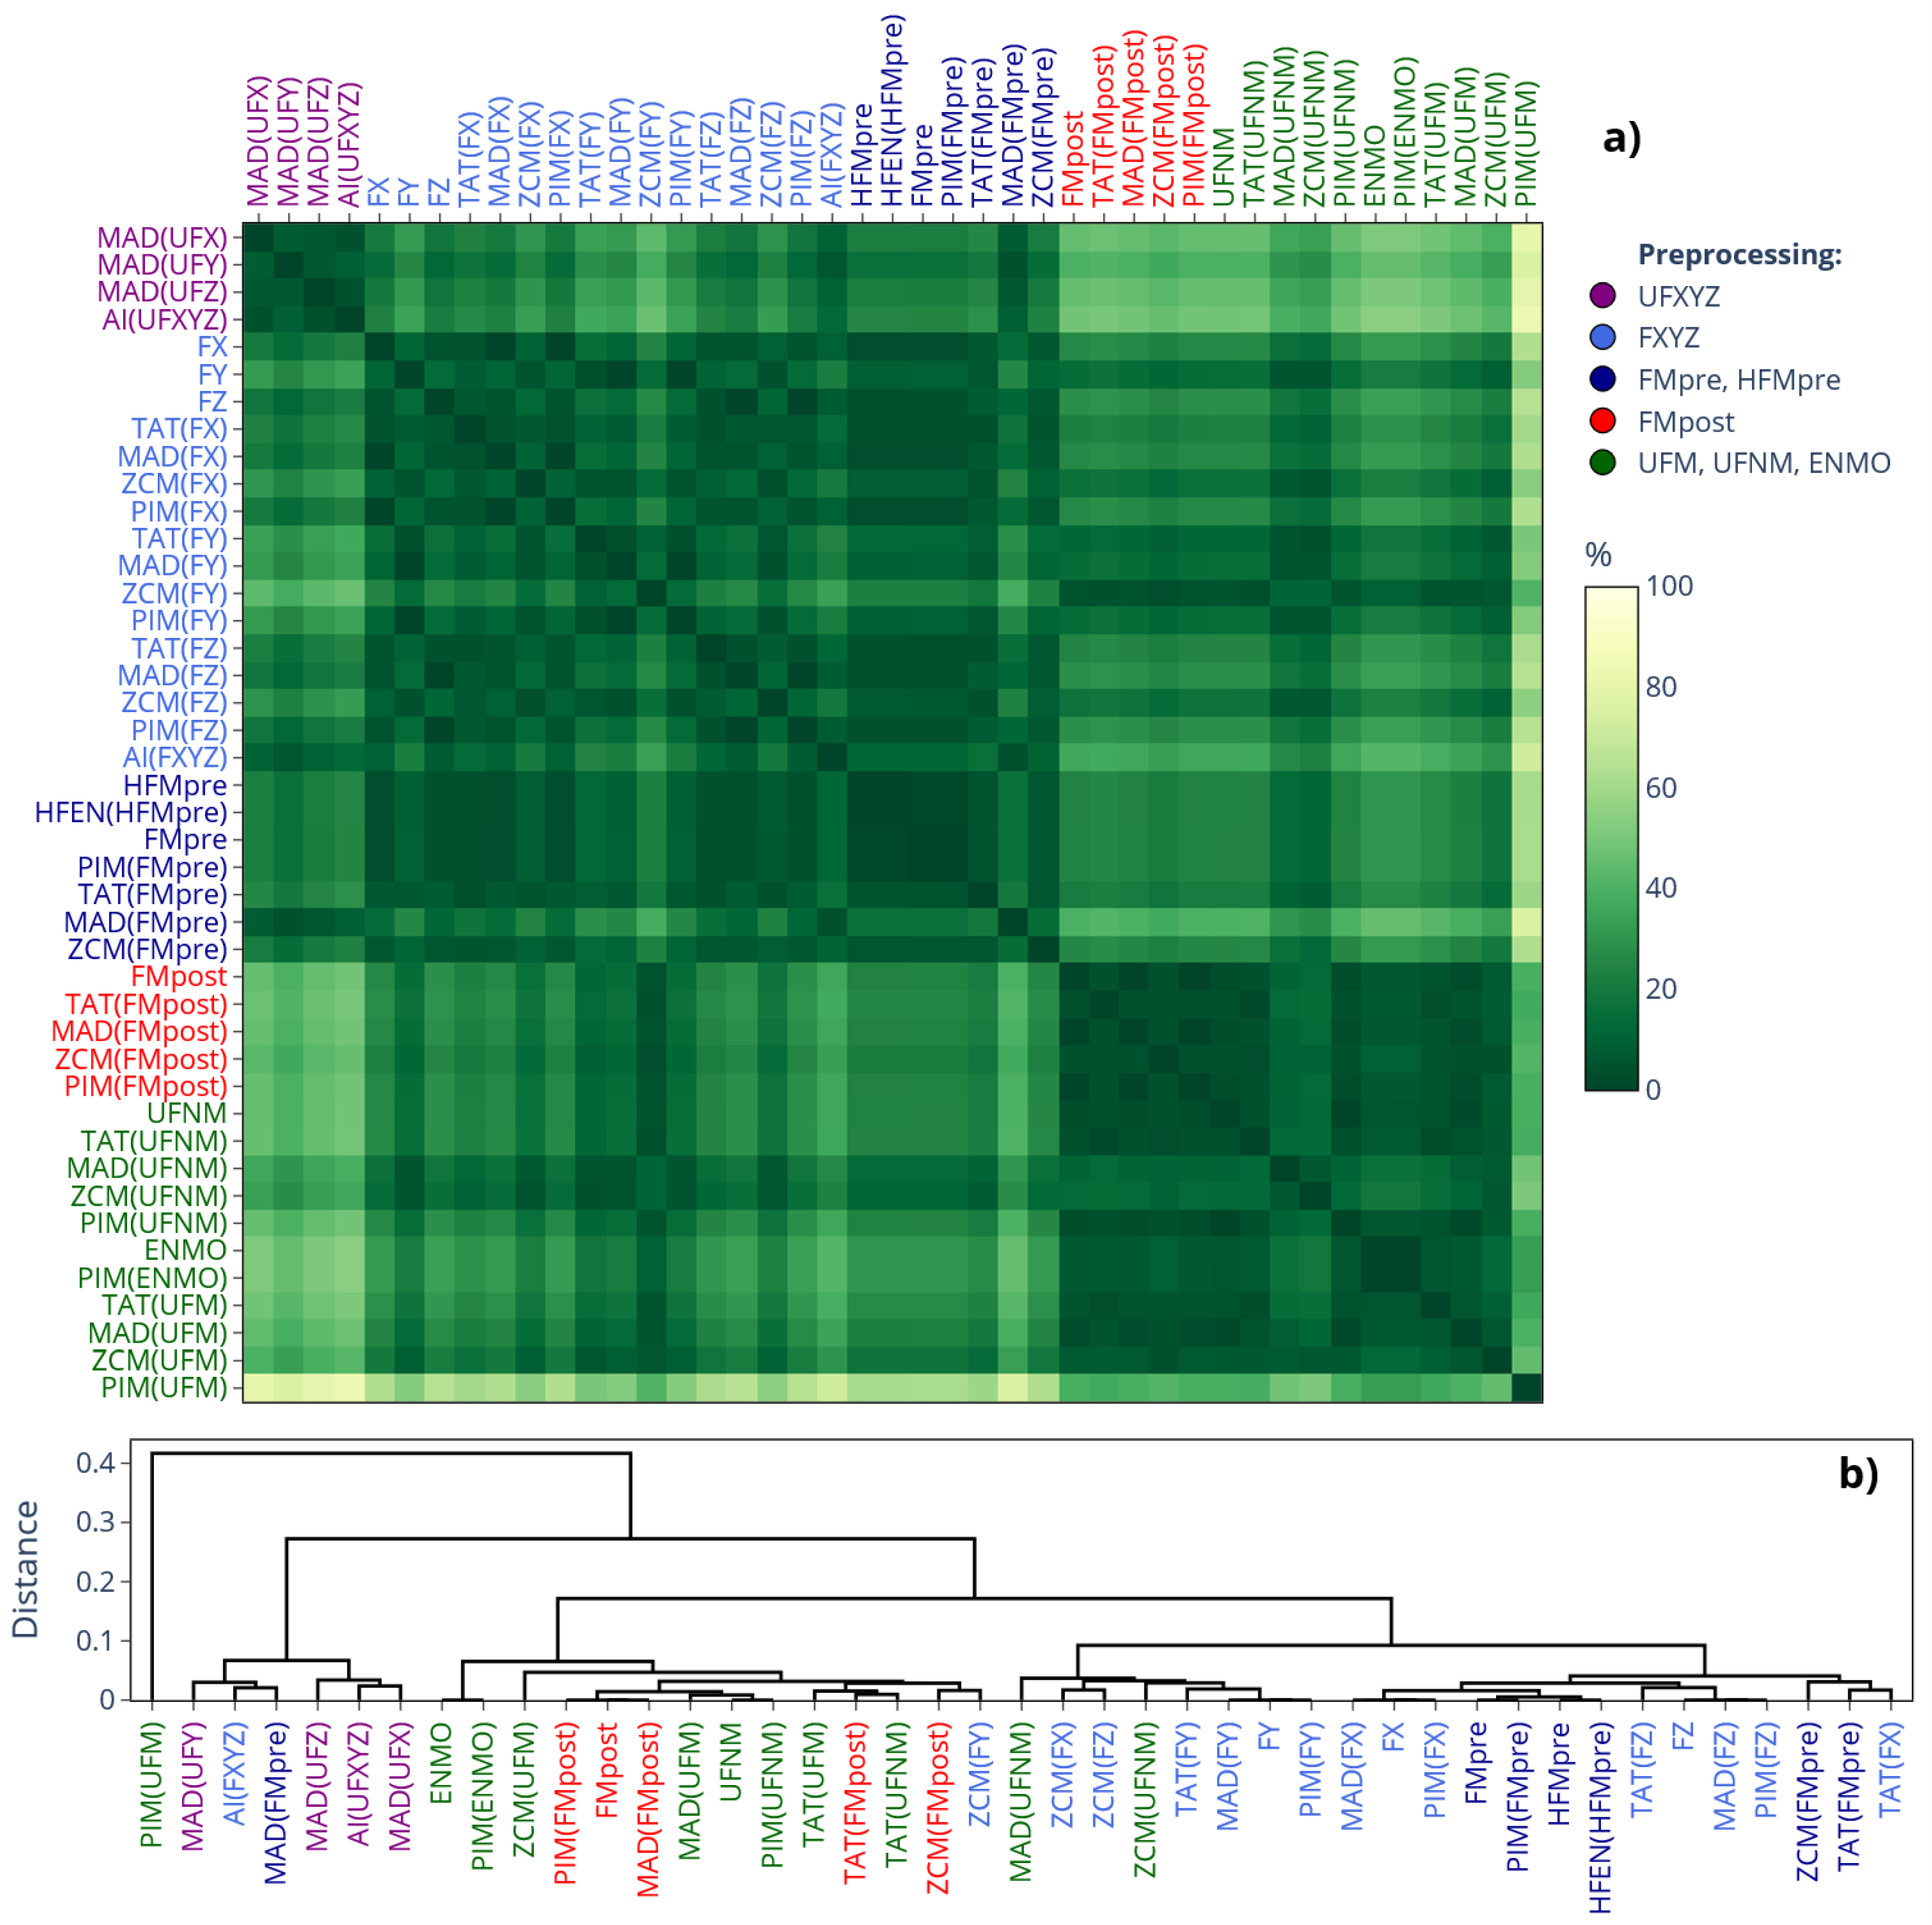
Figure 6.
Differences in the onset of L5 (a) and M10 (b) across 42 subjects depending on which signal-processing pipeline of our generalized framework was used to generate the acceleration or activity data. The cells of the matrix represent the mean percentage overlaps between the designated windows ranging from 100% to 0%, with the gradient color scale shifting linearly from green to yellow as overlap decreases from 100% to 80%. The label colors in both the similarity matrix and the dendrogram follow the same color coding as in Figures 1 and 3, as indicated in the legend.
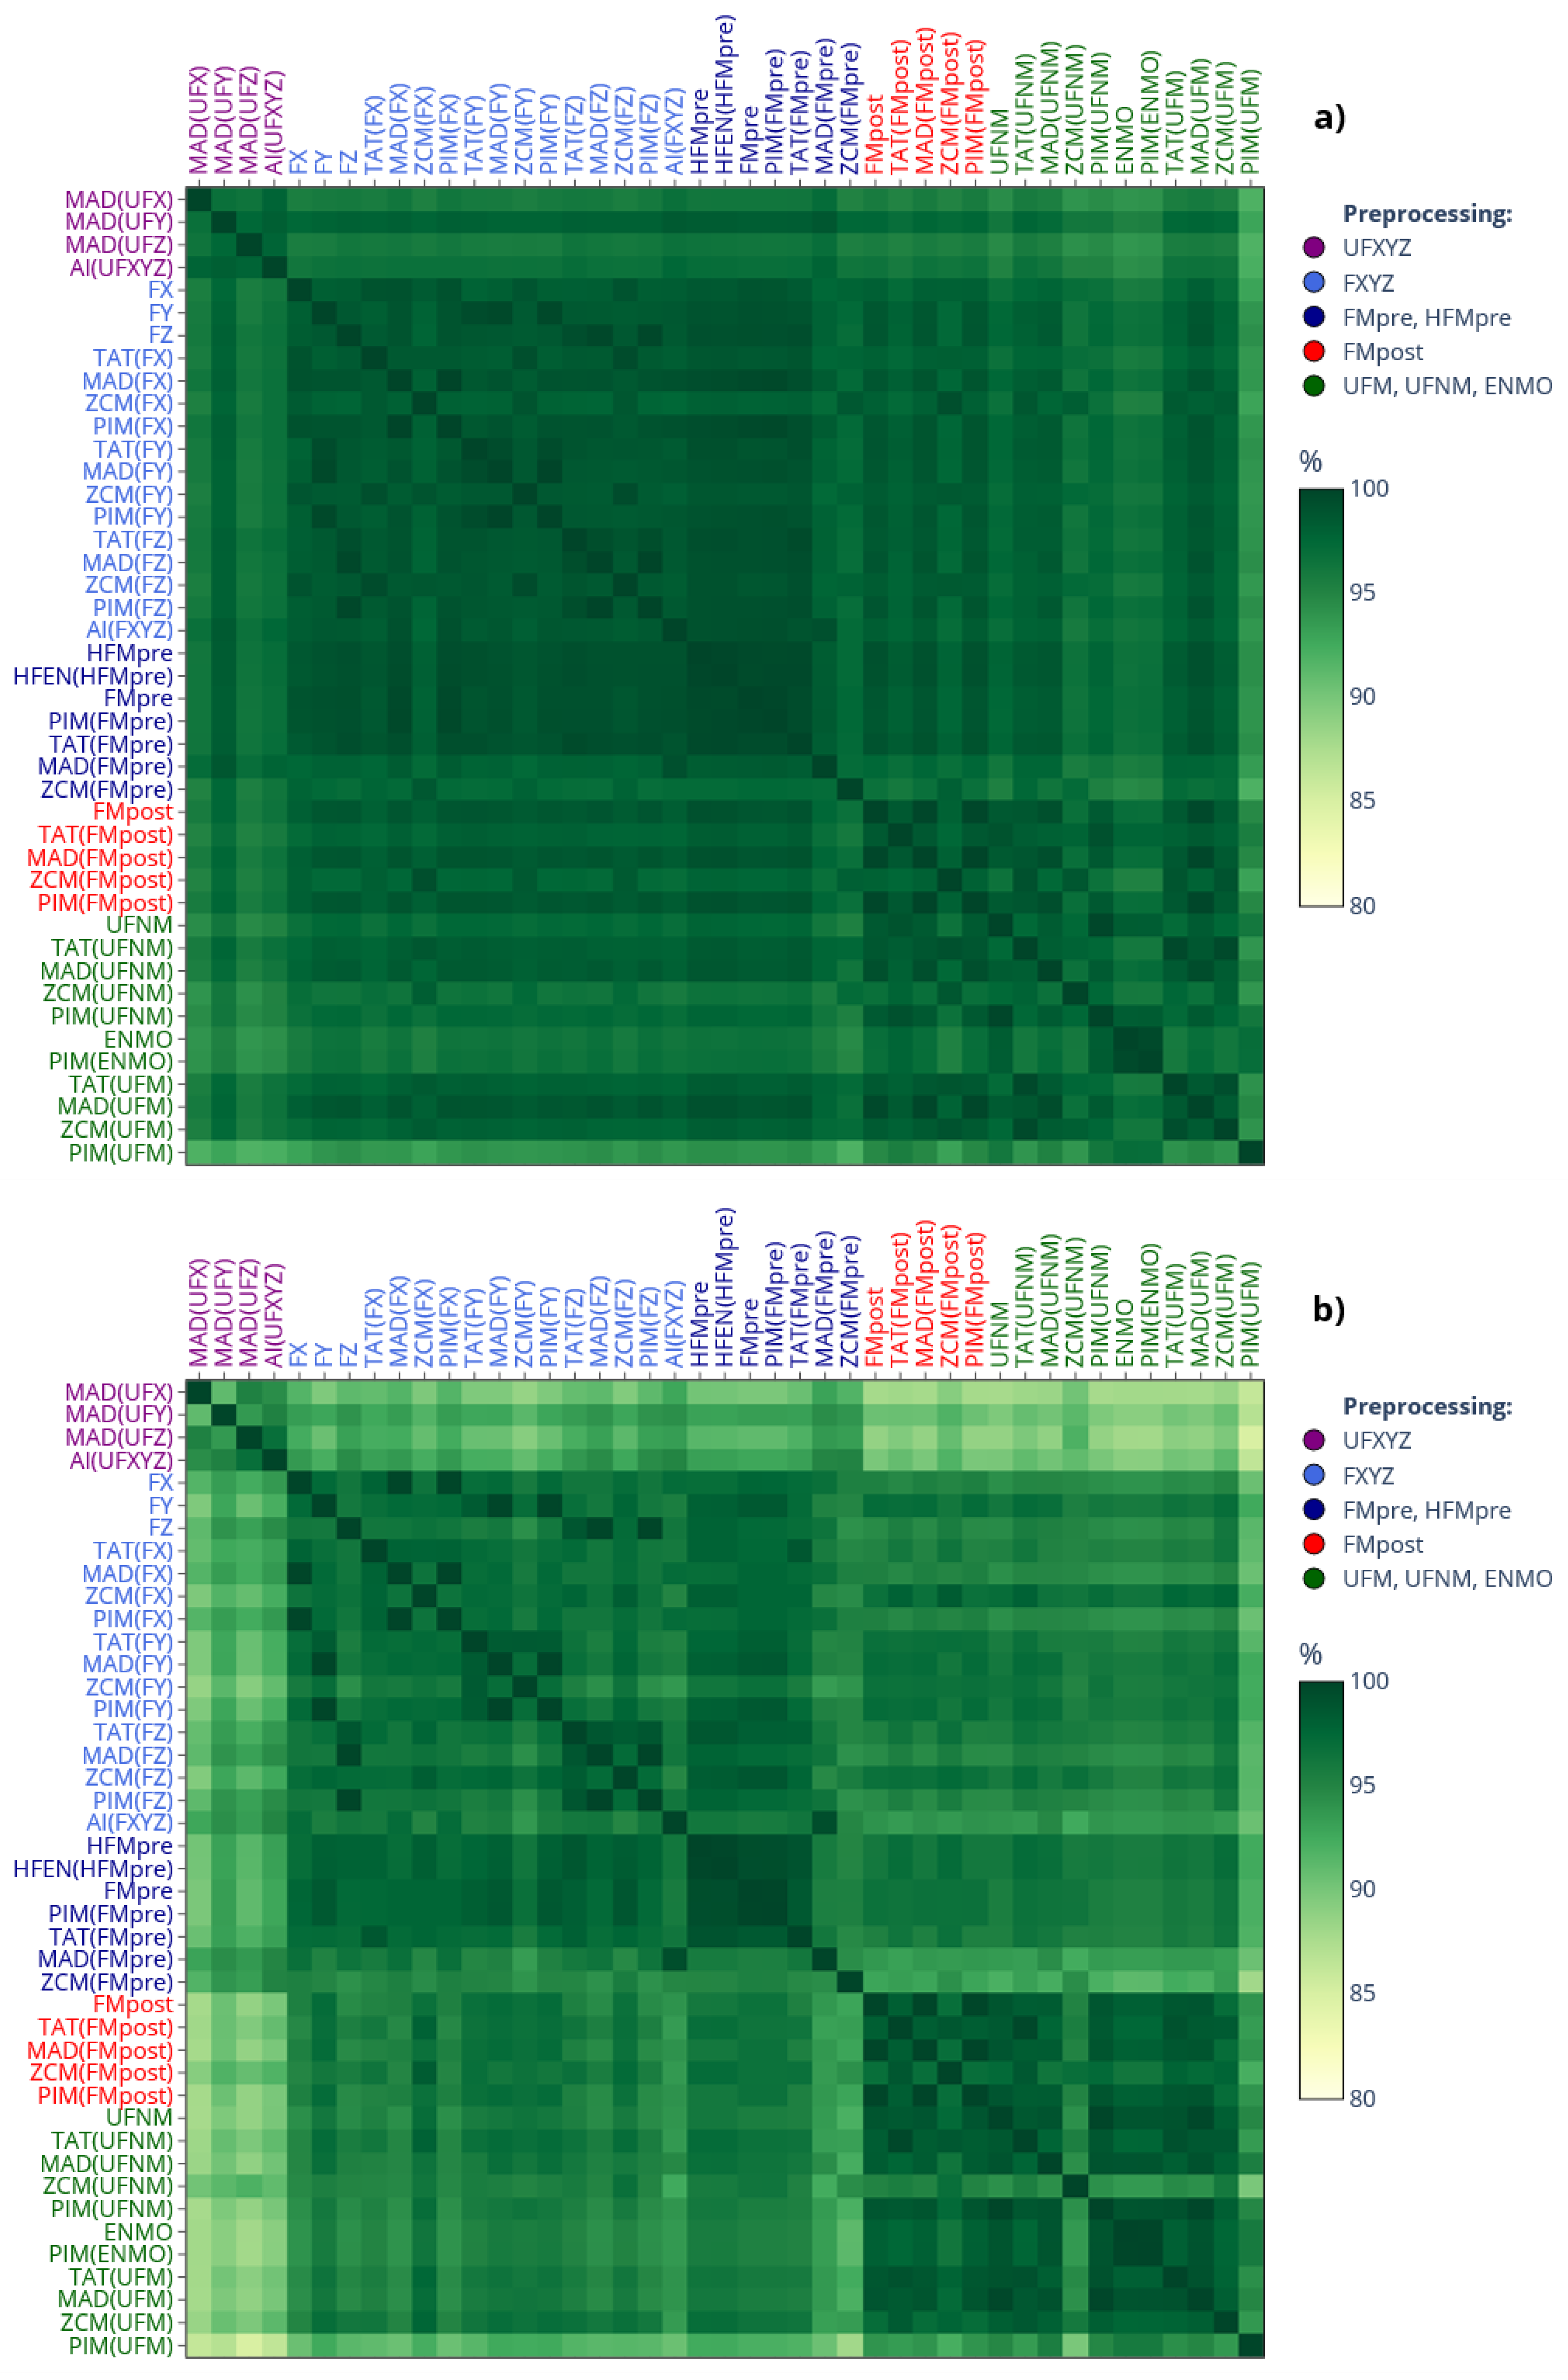
Figure 7.
a) The mean value of L5, M10, and RA across 42 subjects are shown depending on which specific actigraphic device was used to quantify locomotor activity. b) The dendrogram based on RA values.
Figure 7.
a) The mean value of L5, M10, and RA across 42 subjects are shown depending on which specific actigraphic device was used to quantify locomotor activity. b) The dendrogram based on RA values.
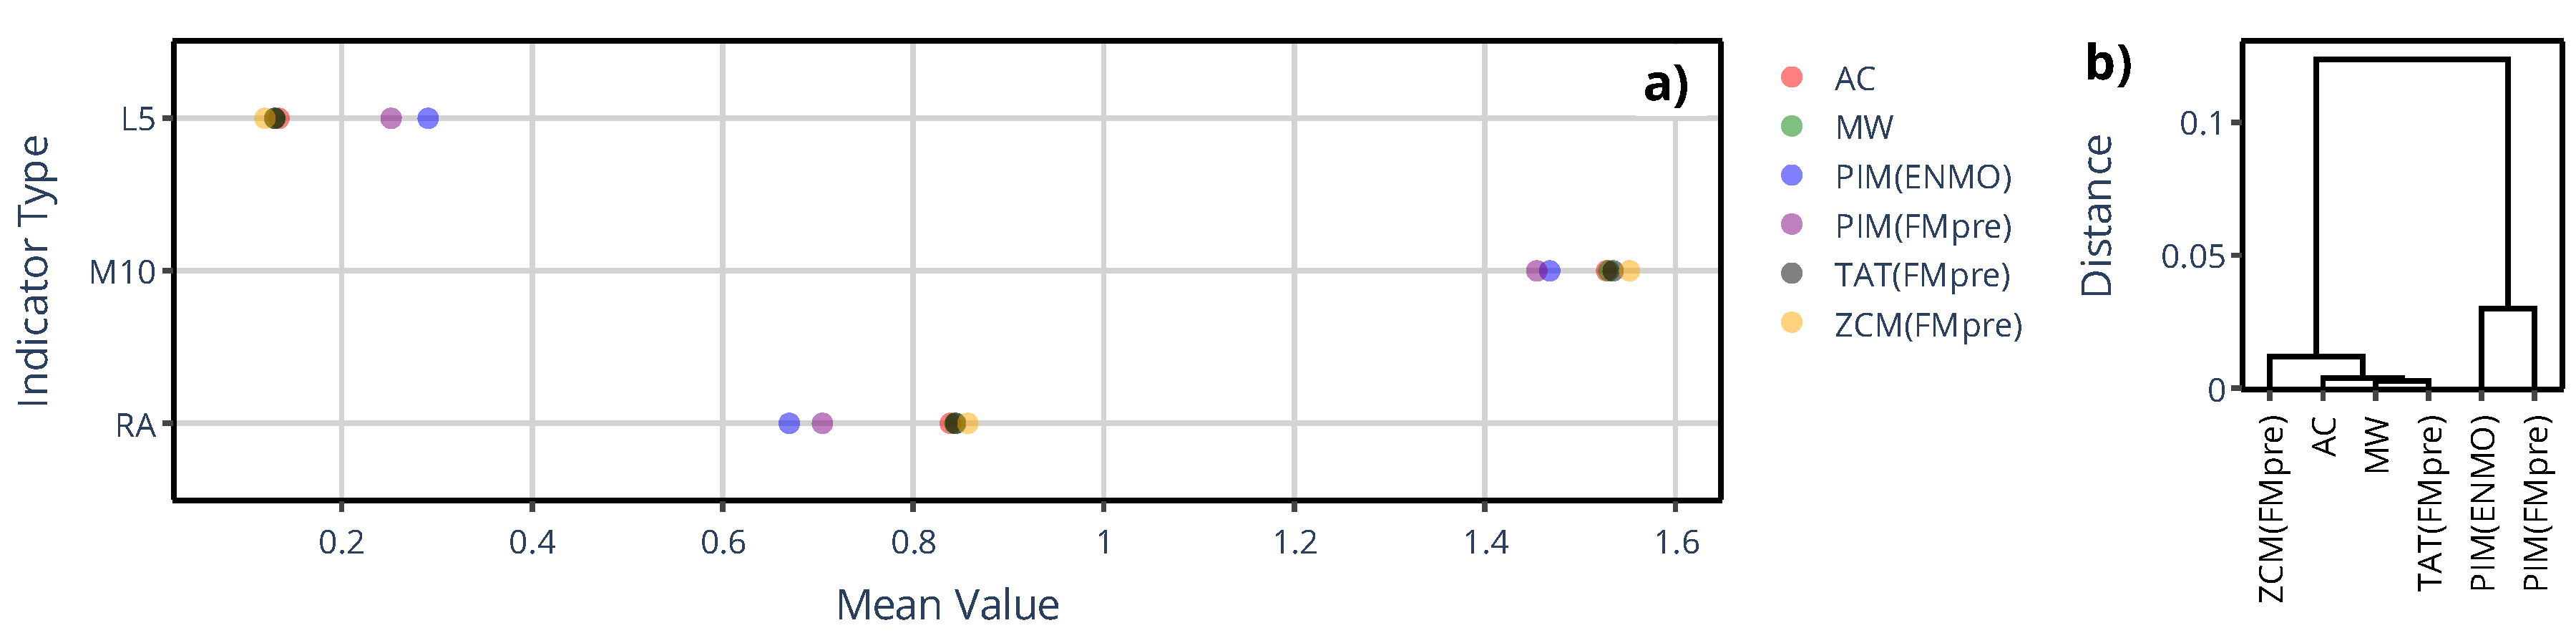
Figure 8.
a) The mean value of IS, and IV across 42 subjects are shown depending on which specific actigraphic device was used to quantify locomotor activity. b) The dendrogram based on IS values.
Figure 8.
a) The mean value of IS, and IV across 42 subjects are shown depending on which specific actigraphic device was used to quantify locomotor activity. b) The dendrogram based on IS values.
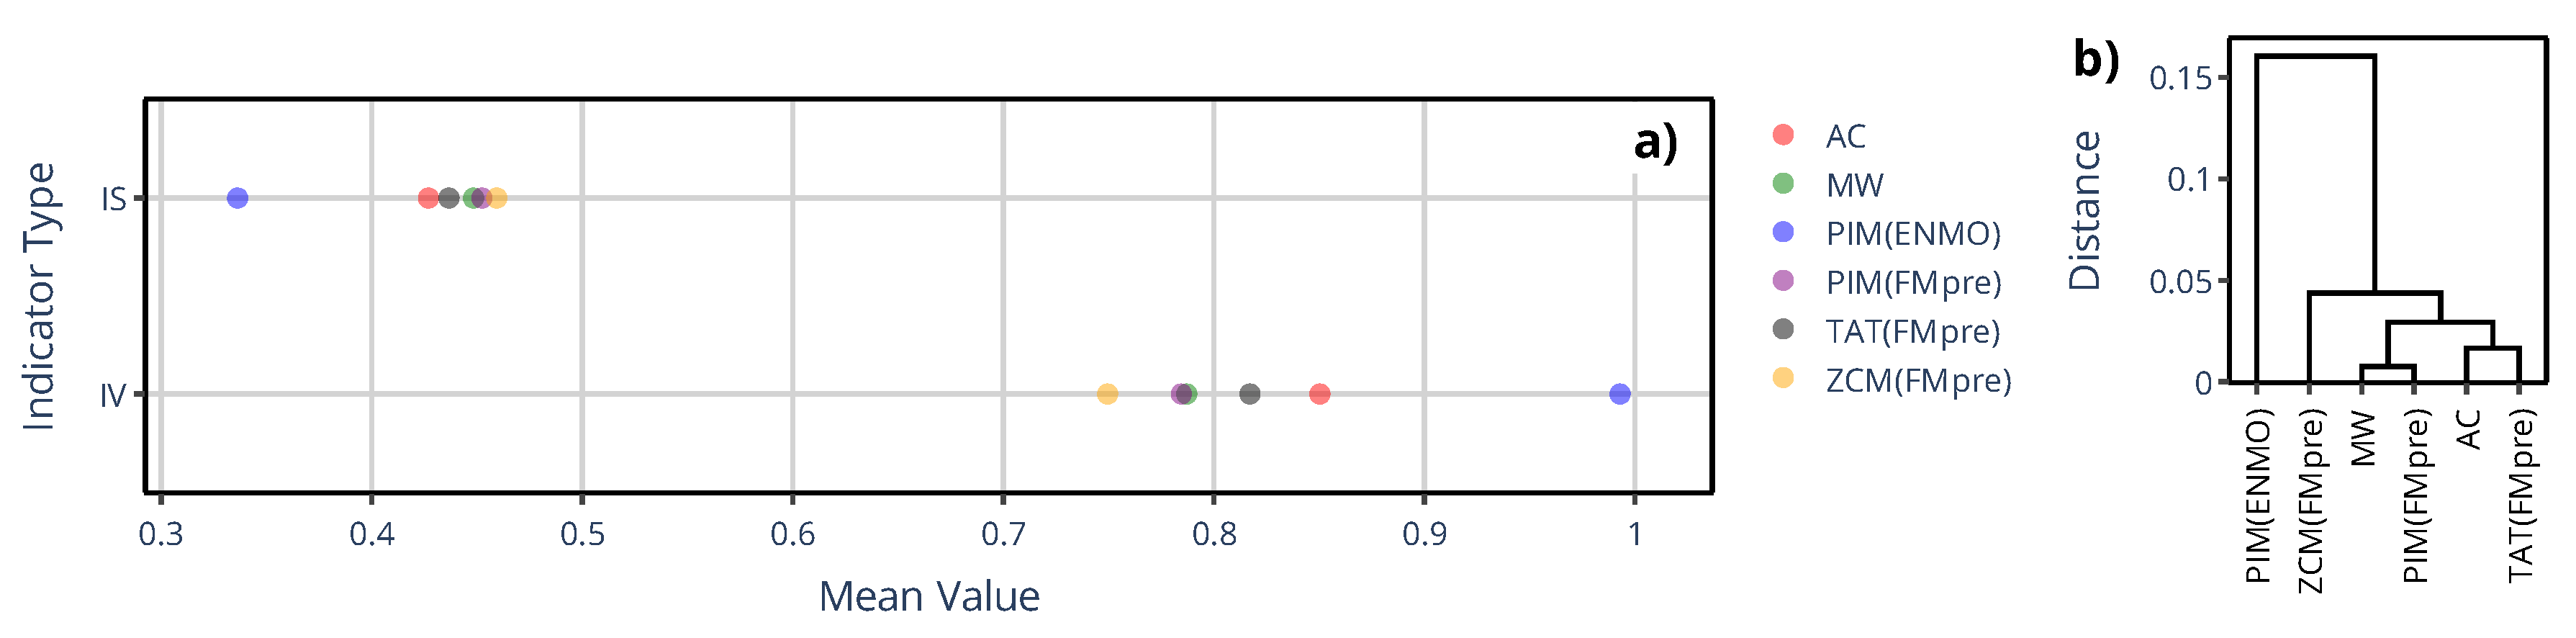
Figure 9.
An example of sleep–wake scoring for a representative subject, showing designated sleep intervals obtained using the MASDA algorithm when the subject’s locomotor activity was quantified with AMI/ActTrust devices operated in ZCM (red) or PIM (blue) mode. The black trace shows the subject’s activity data to aid visual interpretation.
Disclaimer/Publisher’s Note: The statements, opinions and data contained in all publications are solely those of the individual author(s) and contributor(s) and not of MDPI and/or the editor(s). MDPI and/or the editor(s) disclaim responsibility for any injury to people or property resulting from any ideas, methods, instructions or products referred to in the content. |
© 2025 by the authors. Licensee MDPI, Basel, Switzerland. This article is an open access article distributed under the terms and conditions of the Creative Commons Attribution (CC BY) license (http://creativecommons.org/licenses/by/4.0/).
Copyright: This open access article is published under a Creative Commons CC BY 4.0 license, which permit the free download, distribution, and reuse, provided that the author and preprint are cited in any reuse.


