
Submitted:
12 November 2025
Posted:
13 November 2025
You are already at the latest version
Abstract
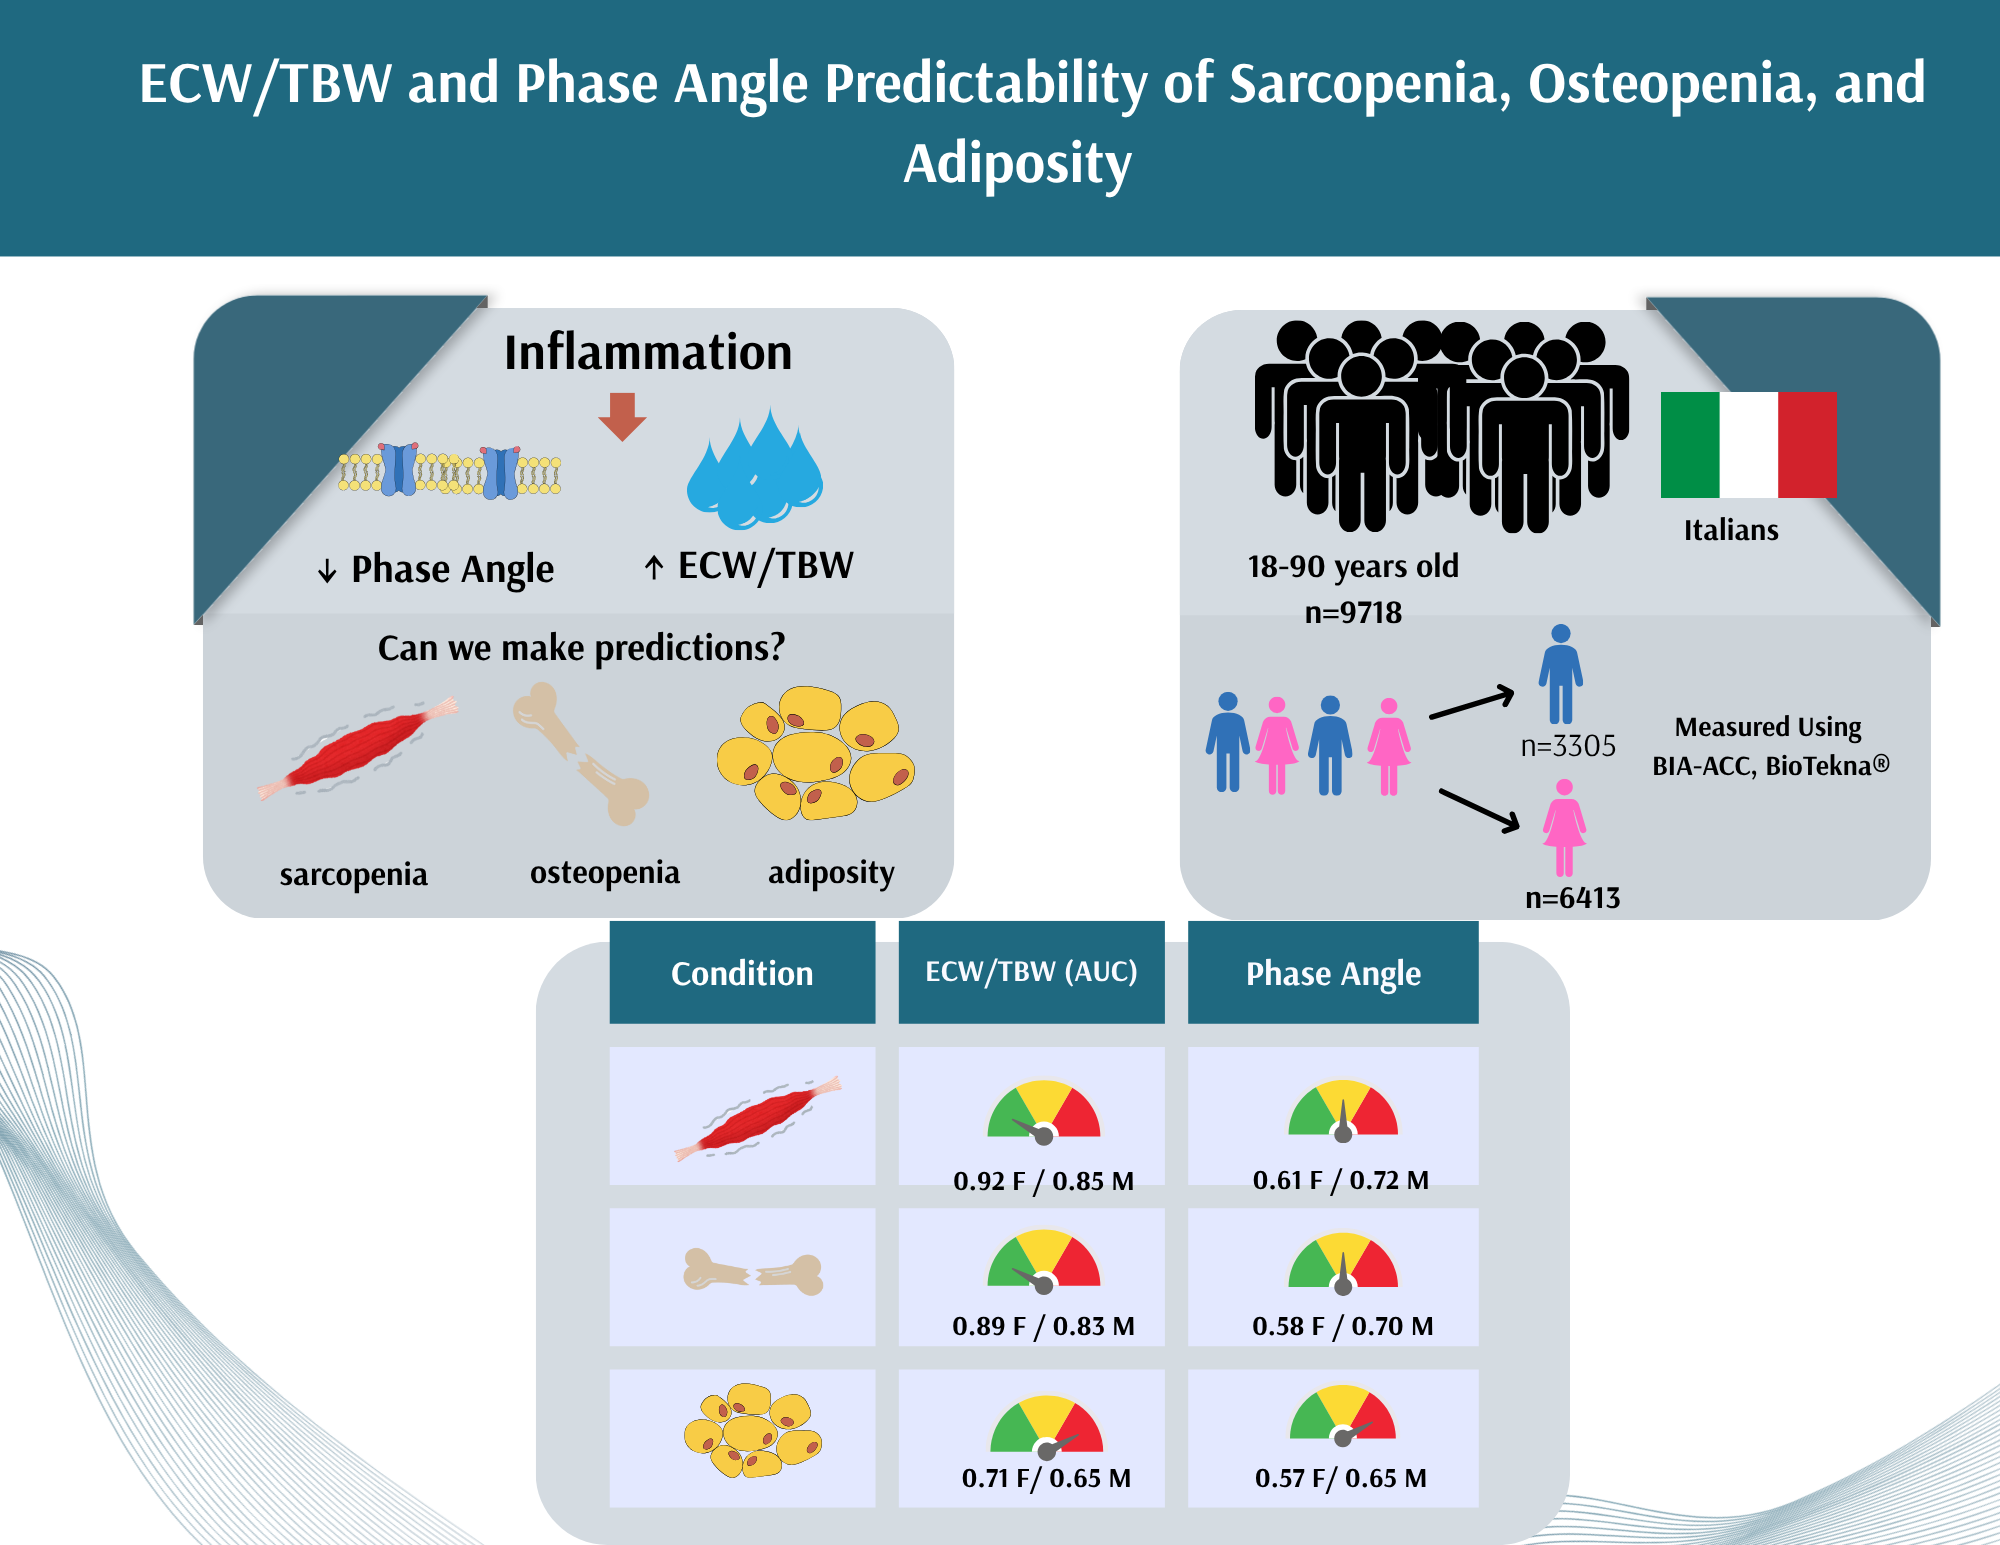
Background/Aim: Extracellular-to-total body water ratio (ECW/TBW) and phase angle (PhA, PA) reflect hydration and cellular health, but their relationship with bone, muscle, and fat, as primary components of body composition, is not fully elucidated. This study aimed to evaluate sex-specific differences in body composition and assess the diagnostic potential of ECW/TBW and PhA for low bone/muscle mass and increased fat mass in generally healthy adults. Methods: This post hoc analysis utilized data from a multicenter, cross-sectional, Italian study (2010–2014) that included 18–90 year adults (n=9717). Body composition was measured by bioelectrical impedance (BIA-ACC, Bio-Tekna®), assessing bone, muscle mass, fat mass, ECW, TBW, and PhA. Low bone/muscle mass and adiposity were defined using standard cutoffs. Associations were examined using nonparametric tests and multiple regression analyses. Results: The mean age of men and women was similar (mean ~48 years). Men had significantly higher body mass index (BMI), intramuscular adipose tissue (IMAT%), T-score (bone), S-score (muscle), and PhA, while women had significantly higher fat mass (FM%) and ECW/TBW. ECW/TBW showed excellent discrimination for low muscle mass (AUC 0.845–0.922) and low bone mass (AUC 0.696–0.885), outperforming PhA. Neither ECW/TBW nor PhA reliably predicted increased fat mass. Regression models indicated ECW/TBW was strongly associated with age, sex, BMI, fat mass, and bone/muscle scores (R² = 0.943), whereas PhA’s association was moderate (R² = 0.368). Conclusions: ECW/TBW and PhA reflected sex-specific differences for body composition and effectively identified low muscle and bone mass (with better predictability of the former). Both showed a limited predictive ability for fat mass. Overall, both parameters provide complementary insights into sarcopenia and osteopenia.
Keywords:
body composition
; bioelectrical impedance analysis (BIA)
; extracellular-to-total body water ratio (ECW/TBW)
; phase angle (PhA)
; bone mass
; muscle mass
; fat mass
1. Introduction
Body composition is a critical determinant of overall health, closely linked to metabolic, nutritional, and functional outcomes in both men and women [1,2,3,4]. Key components such as bone mineral density (BMD skeletal muscle mass, fat mass (FM, or adipose tissue) and adipose tissue distribution play central roles in identifying early pathophysiological changes, including osteoporosis, sarcopenia and obesity/adiposity —conditions often driven and/or initiated by chronic inflammation [5,6,7,8,9].
Inflammation is a tightly regulated and dynamic biological process involving the activation and coordination of immune cells, endothelial cells, and a network of molecular mediators that collectively function to eliminate injurious stimuli and initiate tissue repair [10]. In the context of acute inflammation, increased vascular permeability facilitates the extravasation of plasma proteins and leukocytes into the affected tissue, resulting in localized edema. Following resolution of the inflammatory trigger, interstitial fluid is typically cleared through lymphatic drainage and microvascular resorption mechanisms, thereby contributing to the restoration of tissue homeostasis [11]. When resolution fails or the injurious stimulus persists, chronic inflammation may develop. Chronic inflammation is characterized by sustained immune cell infiltration, ongoing release of pro-inflammatory cytokines, and often impaired lymphatic function [12], as well as by continuous capillary permeability, leading to extracellular water (ECW) accumulation [13]. Therefore, individuals with chronic inflammatory conditions often show elevated ECW levels [14]. Given these mechanisms, ECW and its proportion relative to total body water (ECW/TBW ratio) have been proposed as surrogate markers of inflammation and fluid imbalance. Elevated ECW/TBW ratio is commonly associated with reduced muscle mass, impaired physical function, and increased morbidity, particularly in older adults and those with chronic disease [15,16,17,18].
Phase Angle (PhA, PA) is obtained by bioelectrical impedance (BIA) measurements and calculated as an angle between the resistance and reactance components of electrical impedance. It reflects cellular membrane integrity, body cell mass, and overall health status [19]. Higher PhA values indicate healthy, intact cell membranes and better nutritional status, while lower PhA values are frequently observed in individuals with inflammation, malnutrition, sarcopenia, or chronic disease [20,21]. Oxidative stress and pro-inflammatory cytokines such as tumour necrosis factor alpha (TNF-α), interleukin-6 (IL-6), and C-reactive protein (CRP) impair membrane structure and function, consequently resulting in lower PhA [22,23,24,25], rendering it as another inflammatory marker.
Some newer studies have linked PhA to body composition components, including lean mass, FM, and BMD [26,27,28,29,30]. In obesity or sarcopenic adiposity, chronic inflammation not only promotes fluid retention but also accelerates cellular and tissue degradation—evident through decreased PhA values and elevated ECW/TBW ratios [31,32]. Despite reflecting different physiological processes—fluid distribution (ECW/TBW) versus cellular integrity (PhA)—these two markers are interconnected. Both are shaped by inflammation and changes in body composition; elevations in ECW/TBW often coincide with reductions in PhA, pointing to shared disruptions in cellular and fluid homeostasis. Given their responsiveness to inflammation and oxidative stress, the ECW/TBW ratio has shown predictive value for clinical decline and compromised muscle function, particularly in aging populations, while PhA has been proposed as a prognostic biomarker for malnutrition [33], sarcopenia [34], and broader nutritional risk [35]. Therefore, metrics such as ECW/TBW and PhA are increasingly studied as indicators of hydration status, inflammation, nutritional adequacy, and cellular health [20,36], especially as both can easily be measured by BIA, a well-known non-invasive tool to assess body composition and related health risks.
Despite the growing use of ECW/TBW and PhA in clinical and research settings, their comparative diagnostic value for identifying body composition abnormalities and inflammation-related health risks has not been fully elucidated or studied. Most existing studies assess them independently, without directly comparing their associations with inflammation-driven changes in bone, muscle, and fat compartments. This is particularly true for the lack of comparative studies evaluating the diagnostic performance of these markers in predicting low bone or muscle mass or increased/redistributed adiposity in relation to inflammatory states. The aim of this study is to fill that gap by assessing sex differences in body composition and BIA-derived indices (ECW/TBW and PhA) in a generally healthy adult population (ages 18–90 years). Specifically, we evaluated the ability of ECW/TBW and PhA to predict low muscle and bone mass, as well as excess adipose tissue, and examine how physiological factors influence these associations through multivariate regression modelling. Understanding how ECW/TBW and PhA relate to basic body composition metrics and how these relationships differ by age, sex, or body mass index (BMI) is crucial. Therefore, these markers hold potential to enhance early, sex-adapted screening and inform intervention strategies.
2. Materials and Methods
This is a retrospective analysis of part of the data originally collected as part of a large multicenter cross-sectional study in Italy between 2010 and 2014. The characteristics of the participants and the methodology have been described previously [37]. Below is a brief summary.
Participants
The study population included Caucasian men and women aged 18 to 90 years who attended general medical practices across the country (total of 37). The primary objective was to evaluate bone health, body composition, and functional status in the general Italian population. All participants provided written informed consent and completed a comprehensive medical history questionnaire. The study received ethical approval from the Consortium for the Science and Technology Research AREA in Trieste, Italy, and was carried out in accordance with the ethical principles of the Declaration of Helsinki. Exclusion criteria included the presence of chronic illnesses (such as epilepsy, cancers, cardiovascular disorders, rheumatic conditions or psychiatric disorders), recent fractures (within the past 12 months), high alcohol consumption, use of bone-affecting treatments (e.g., steroids, bisphosphonates, calcium or vitamin D supplements, hormone therapies), pregnancy, and the presence of metal implants or electronic medical devices. The present post hoc analysis was approved by the Ethics Committee of the Institute for Medical Research and Occupational Medicine in Croatia (Approval No. 100-21/18-10).
Bioimpedance Measurements
Body composition was assessed using the dual frequency bioimpedance device BIA-ACC (BioTekna®, Marcon–Venice, Italy). Measurements were conducted with participants in a supine position, using four electrodes; two placed on the right wrist and two on the right ankle. The device measures bone mass and skeletal muscle mass yielding T-scores and S-scores, respectively and fat mass (FM; as % of total body mass), intramuscular fat mass (IMAT; as percentage of FM), PhA (0), ECW, and TBW. It is important to note that BIA-ACC provides a direct measurement of ECW at a low frequency of 1 kHz, and not as an estimate which could be obtained from classical bioimpedance devices. The ECW values measured by BIA-ACC have also previously been validated with classic inflammatory markers (e.g. cortisol, CRP) [38,39,40].
Low bone and muscle mass was identified based on the T-score and S-score respectively (< -1.0 for both), and obesity/adiposity based on total fat mass (> 25% for men and > 30% for women), according to the manufacturer's reference values.
Statistical analysis
The results are presented as mean ± standard deviation. The distribution of variables was tested using the Kolmogorov–Smirnov test. None of the variables were normally distributed, therefore, the difference in mean values of body composition parameters between men and women was tested using the Mann-Whitney test.
Receiver Operating Characteristic (ROC) curve analysis, based on logistic regression, was used to evaluate the diagnostic ability of two parameters, ECW/TBW and PhA, in detecting body composition deviations (from normal) in men and women. The Area Under the Curve (AUC) was calculated for each condition (low bone mass, low muscle mass, increased fat mass) to assess the discriminatory performance of each parameter. An AUC value close to 1.0 indicates excellent diagnostic accuracy, while an AUC of ≤ 0.5 suggests no better classification than random chance.
To compare the performance of two diagnostic models evaluated on the same subjects, we used the method proposed by Hanley and McNeil for comparing correlated ROC curves [41]. This approach applies a z-test based on the difference between the two AUCs, their standard errors, and an assumed correlation coefficient between them (r = 0.5). Two multiple regression models were created with each ECW/TBW and PhA as dependent variables and body composition parameters as predictors. The resulting R² explains the proportion of the variance in the dependent variable that is predictable from the independent variables. R² between 0 and 1: indicates the percentage of variance explained (e.g. R² = 0.943 means 94.3% of the variance is explained by the model). All analyses were performed using Statistica 15 (TIBCO Software Inc.). The level of significance in all analyses was set at p < 0.05.
3. Results
Women and men were of a similar mean age (47.6 vs. 47.8 years, respectively) (Table 1). The BMI in women was close to the upper reference (normal), while in men it was slightly elevated. Men had significantly higher values for weight, height, BMI, and IMAT% compared to women, with all differences being statistically significant (p < 0.001). Fat mass percentage (FM%) was slightly higher in women compared to men, with the statistically significant difference (p < 0.001). However, a higher proportion of men exceeded the reference values for FM% and IMAT% than women. The mean T-score and S-score values were within the normal reference range for each sex, with the exception of a borderline reduced T-score (-1.1) in women. However, both bone and skeletal muscle parameters showed notable and expected sex-based differences: men had significantly higher T-score and S-score values than women (p < 0.001 for both). ECW/TBW ratio, was significantly higher in women compared to men (p < 0.001). Men showed significantly higher phase angle values (p < 0.001). However, mean PhA was lower and mean ECW/TBW was higher compared to normal reference, in both sexes.
The diagnostic performance of ECW/TBW and PhA in predicting low muscle mass, low bone mass, and increased fat mass was assessed separately for women and men using the area under the ROC curve (AUC). The results are summarized in Table 2. Among women, ECW/TBW demonstrated great discriminatory ability for identifying low muscle mass (AUC = 0.922) and low bone mass (AUC = 0.885), significantly outperforming PhA in both cases (p < 0.001). Figure 1. (a) and (b). Neither ECW/TBW nor PhA proved to be good predictors of increased FM%, although ECW/TBW showed a moderately better AUC (0.713) compared to PhA (0.574), with the difference being statistically significant (p < 0.001).
In men, ECW/TBW also showed superior AUC values compared to PhA in detecting low muscle mass (0.845 vs. 0.719) and low bone mass (0.828 vs. 0.696), again with statistically significant differences (p < 0.001) Figure 2. (a) and (b). However, when predicting increased fat mass, the AUC values for ECW/TBW (0.647) and PhA (0.650) were nearly identical, and the difference was not statistically significant (p = 0.920).
Multiple linear regression models were conducted to identify association of ECW/TBW ratio and PhA with body composition parameters (Table 3). The model predicting ECW/TBW showed a high explanatory power (R² = 0.943), indicating that 94.3% of the variance in ECW/TBW was explained by the included variables. All associations in the model were statistically significant (p < 0.001). When controlling for age and sex, ECW/TBW was positively associated with BMI, and negatively associated with sex, fat mass, S-score, and T-score. These findings suggest that higher age and higher BMI are associated with increased ECW/TBW, while male sex, greater bone density, and higher fat mass are associated with lower ECW/TBW values. The regression model for PhA explained a smaller proportion of the variance (R² = 0.368). When controlling for age and sex, PhA was positively associated with FM%, T-score and S-score, while it was negatively associated with BMI (p < 0.001 for all predictors). These results indicate that although both models identified age, sex, BMI, fat mass, muscle and bone scores as significant predictors, the ECW/TBW was stronger determined by these factors than PhA, as reflected in the substantially higher R² value for the former.
ECW = extracellular water; TBW = total body water; PhA = Phase angle;
BMI = body mass index; FM = fat mass; R² = coefficient of determination
4. Discussion
This study revealed notable sex-related differences in body composition and bioimpedance parameters among a large sample of generally healthy adults, of which some were expected. Despite similar mean ages, men exhibited significantly higher values for body weight, height, BMI, and IMAT%, while women showed higher FM% values, consistent with known physiological differences in fat distribution and muscle mass between sexes [42,43]. Although average T-score and S-score values were within the normal range in both sexes, women had a borderline T-score, which is in line with the higher prevalence of osteopenia and osteoporosis generally observed in female populations [44,45]. The ECW/TBW and PhA also demonstrated distinct sex-specific trends – both findings consistent with literature suggesting that women, compared to men, typically have a higher extracellular water proportion and lower cellular integrity as reflected by PhA [17,46]. Importantly, both ECW/TBW and PhA were already altered in both sexes, potentially indicating early changes in tissue composition and hydration status, associated with aging and metabolic adjustments [25,47].
ROC analysis revealed the diagnostic utility of ECW/TBW, particularly in detecting low muscle and bone mass in both sexes, outperforming PhA in these domains. In women, ECW/TBW showed excellent discrimination for both low muscle mass (AUC = 0.922) and low bone mass (AUC = 0.885), and also outperforming PhA in men. There is a lack of studies directly comparing the associations of ECW/TBW and PhA with bone mass, muscle mass, and adipose tissue. One study reported the clinical relevance of PhA and ECW/TBW, noting that while PhA is useful, ECW/TBW provides additional insights, especially in conditions like sarcopenia [20]. Japanese researchers also demonstrated that ECW/TBW ratios were significantly higher in elderly men with reduced muscle function, indicating its utility in assessing sarcopenia [48]. Besides reporting that ECW/TBW increases with age these researchers also found that it is typically higher in women than in men, suggesting both age- and sex-related changes in fluid distribution and tissue composition, similarly as the results of our study showed. Another study revealed that individuals with ECW/TBW ≥ 40% had significantly higher prevalence of sarcopenia compared to those with lower ratios, suggesting a potential role of extracellular fluid imbalance in musculoskeletal decline [47]. All these findings, together with ours, highlight the relevance of fluid distribution metrics in the assessment of age-related body composition changes.
It is well known that chronic inflammation disrupts the bone remodeling, increasing bone resorption and consequently heightens the risk of osteoporosis [7,29,30,49]. Among other things, inflammation also alters the ECW distribution, and a higher ECW/TBW ratio may thus serve as a surrogate marker for such inflammatory states or hydration imbalances, both of which can adversely affect bone and muscle health [50]. Adipose tissue, particularly visceral fat, plays a central role in this inflammatory environment by secreting adipokines and cytokines that exacerbate systemic inflammation. In turn, this feedback loop contributes to further fluid retention and ECW expansion [51]. Additionally, chronic inflammation and adiposity may impair capillary permeability and lymphatic drainage, leading to a redistribution of fluids from intracellular to extracellular compartments [52]. According to these findings, it is suggested that ECW/TBW, due to its sensitivity to shifts in body fluid compartments and inflammation, could potentially outperform PhA as a marker for musculoskeletal deterioration, especially in aging populations [1], as found in our study.
Regarding the adipose tissue, both ECW/TBW and PhA showed limited ability to predict excess fat mass in our study. Although our results showed a positive association between fat mass and PhA after adjusting for confounding factors, this could be attributed to differences in population characteristics, such as metabolic health or fat distribution (e.g., visceral vs. subcutaneous fat). Barbosa-Silva et al. reported that higher PhA values may be associated with greater subcutaneous fat and preserved cell membrane integrity, particularly in individuals without chronic illness [17]. Conversely, other studies in populations with obesity or sarcopenia reported an inverse relationship between PhA and fat mass, highlighting the complexity and context-dependence of this marker [27]. However, both indicators may hold clinical relevance when used as part of a comprehensive body composition assessment, particularly given their utility in evaluating hydration status, cellular function, and the broader metabolic context of fat accumulation. On the other side, positive association between ECW/TBW and fat mass reflects relatively lower extracellular fluid volume in individuals with higher fat mass once lean mass and hydration status are considered.
The results from multiple regression models in our study supported the findings that ECW/TBW is influenced by key body composition parameters stronger than PhA, as reflected in higher explanatory power of the former. Katsura and colleagues found that the association between PhA and mortality in patients with cachexia was largely mediated by the ECW/TBW ratio and that adjusting PhA for the ECW/TBW ratio may improve its predictive value [53]. Overall, ECW/TBW appears to be a more sensitive and reliable marker than PhA for identifying unfavorable changes in muscle and bone mass, but less so in fat mass. These findings support the growing evidence advocating for its inclusion in body composition assessments alongside or even in place of PhA [16,47,54].
There are several limitations, as well as strengths of this study: the cross-sectional design limits causal interpretation, and the findings may not be generalizable to other clinical populations with some chronic diseases or to other ethnicities. Additionally, the utility ECW/TBW and PhA may vary depending on the individual's hydration status. However, key unique aspect of this study is its comprehensive approach, encompassing all three major body composition compartments: bone, muscle, and fat which allowed for a more nuanced interpretation of how hydration status and cellular health and integrity, reflected by ECW/TBW and PhA, predicted osteopenia and sarcopenia. Additionally, since the study included large sample size of over 9,000 generally healthy individuals of homogenous ancestry, the statistical power, reliability, and generalizability of the findings were strengthened.
5. Conclusions
This study provides the insights into sex-specific differences in body composition (bone, muscle, adipose tissue) and bioimpedance markers among healthy adults, highlighting the diagnostic potential of ECW/TBW and PhA. Both ECW/TBW and PhA are valuable BIA-derived parameters (especially the former) in identifying low muscle and bone mass and to a lesser degree fat mass (only in women). The borderline T-scores found in women indicate that bone health in this group may already have been compromised. Therefore, incorporating both measures can provide a more comprehensive, non-invasive risk assessment and screening for sarcopenia, osteopenia and, to a certain degree for adiposity, in this population segment.
Author Contributions
Conceptualization, S.C., J.Z.I., D.B., and N.V.; methodology, D.B., S.C. and J.Z.I; formal analysis, S.C.; investigation, D.B.; data curation, D.B.; writing—original draft preparation, S.C., J.Z.I.; H.S., A.R., and S.N.; writing—reviewing and editing, J.Z.I.; Writing graphical abstract, A.R. and S.N. All authors have read and agreed to the published version of the manuscript.
Funding
This retrospective post hoc analysis was supported by the European Union—Next Generation EU (Program Contract of 8 December 2023, Class: 643-02/23-01/00016, Reg. No. 533-03-23-0006).
Institutional Review Board Statement
The original study was approved in Italy by the Consortium for the Science and Technology Research AREA, Trieste, Italy, and conformed to the standards set by the Declaration of Helsinki. Our retrospective post hoc study was conducted in accordance with the Declaration of Helsinki and approved by the Ethics Committee of the Institute for Medical Research and Occupational Medicine (protocol code: 100-21/18-10; date of approval: 23 October 2018).
Informed Consent Statement
Informed consent was obtained from all subjects involved in the study.
Data Availability Statement
The raw data supporting the conclusions of this article will be made available by the authors upon request.
Conflicts of Interest
The authors state that they have no conflicts of interest. D.B. is an employee of the BioTeknaR, Marcon, Venice, Italy. BioTekna® had no role in the design, execution, interpretation, or witing of the study.
Abbreviations
The following abbreviations are used in this manuscript:
| ACC | Alternating Current Conductivity |
| AUC | Area Under the Curve |
| BIA | Bioelectrical Impedance Analysis |
| BIA-ACC | Bioelectric Impedance Analyzer-Alternating Current Conductivity |
| BMD | Bone Mineral Density |
| BMI | Body Mass Index |
| CRP | C-reactive Protein |
| ECW | Extracellular Water |
| ECW/TBW | Extracellular Water-to-Total Body Water Ratio |
| FM | Fat Mass |
| FM% | Fat Mass Percentage |
| IL-6 | Interleukin-6 |
| IMAT | Intramuscular Adipose Tissue |
| IMAT% | Intramuscular Adipose Tissue Percentage |
| PhA or PA | Phase Angle |
| ROC | Receiver Operator Characteristic |
| S-Score | Skeletal Muscle Score |
| TBW | Total Body Water |
| TNF-α | Tumor Necrosis Factor Alpha |
| T-Score | Bone Density Score |
References
- Martins, P.C.; Alves Junior, C.A.S.; Silva, A.M.; Silva, D.A.S. Phase angle and body composition: A scoping review. Clin Nutr ESPEN 2023, 56, 237–250. [CrossRef]
- Holmes, C.J.; Racette, S.B. The Utility of Body Composition Assessment in Nutrition and Clinical Practice: An Overview of Current Methodology. Nutrients 2021, 13, 2493. [CrossRef]
- Ilich, J.Z.; Pokimica, B.; Ristić-Medić, D.; Petrović, S.; Arsić, A.; Vasiljević, N.; Vučić, V.; Kelly, O.J. Osteosarcopenic adiposity in relation to cancer and chronic diseases: Implication for research to delineate mechanisms and improve clinical outcomes. Ageing Res Rev 2025, 103, 102601. [CrossRef]
- Ilich, J.Z.; Pokimica, B.; Ristić-Medić, D.; Petrović, S.; Arsić, A.; Vasiljević, N.; Vučić, V.; Kelly, O.J. Osteosarcopenic adiposity (OSA) phenotype and its connection with cardiometabolic disorders: Is there a cause-and-effect? Ageing Res Rev 2024, 98, 102326. [CrossRef]
- Lee, H.; Chung, H.S.; Kim, Y.J.; Choi, M.K.; Roh, Y.K.; Yu, J.M.; Oh, C.M.; Kim, J.; Moon, S. Association between body composition and the risk of mortality in the obese population in the United States. Front Endocrinol (Lausanne) 2023, 14, 1257902. [CrossRef]
- Zhu, S.; Wang, Z. Body composition: clinical implications and biological diversities. Int J Obes 2011, 35(Suppl 1), S1–S3. [CrossRef]
- Ilich JZ, Kelly OJ, Kim Y, Spicer MT. Low-grade chronic inflammation perpetuated by modern diet as a promoter of obesity and osteoporosis. Arch Industrial Hygiene Toxicol, 65:139-148, 2014. [CrossRef] [PubMed]
- Ilich, JZ. Nutritional and behavioral approaches to body composition and low-grade chronic inflammation management for older adults in the ordinary and COVID-19 times. Nutrients, 12(12): 3898, 2020. [CrossRef]
- Ilich JZ, Gilman JC, Cvijetic S, Boschiero D. Chronic stress contributes to osteosarcopenic adiposity via inflammation and immune modulation: The case for more precise nutritional investigation. Nutrients, 12: 989, 2020. [CrossRef]
- Serhan, C. N.; Levy, B. D. Resolvins in inflammation: emergence of the proresolving superfamily of mediators. J. Clin Invest 2018, 128, 26572669. [CrossRef]
- Granger, D.N.; Senchenkova, E. Inflammation and the Microcirculation. Morgan & Claypool Life Sciences: San Rafael (CA), 2010.
- Lawrence, T.; Gilroy, D.W. Chronic inflammation: a failure of resolution? Int J Exp Pathol 2007, 88, 85–94.
- Wiig, H., & Swartz, M. A. (2012). Interstitial fluid and lymph formation and transport: physiological regulation and roles in inflammation and cancer. Physiological reviews, 92(3), 1005–1060. [CrossRef]
- Hasan, A. (2016). Chronic inflammation: The enemy within. Journal of Medical & Allied Sciences, 6(2), 45–47. [CrossRef]
- Lukaski, H.C.; Vega Diaz, N.; Talluri, A.; Nescolarde, L. Classification of Hydration in Clinical Conditions: Indirect and Direct Approaches Using Bioimpedance. Nutrients 2019, 11, 809. [CrossRef]
- Malczyk, E.; Dzięgielewska-Gęsiak, S.; Fatyga, E.; Ziółko, E.; Kokot, T.; Muc-Wierzgon, M. Body composition in healthy older persons: role of the ratio of extracellular/total body water. J Biol Regul Homeost Agents 2016, 30, 767–772.
- Barbosa-Silva, M.C.; Barros, A.J.; Wang, J.; Heymsfield, S.B.; Pierson, R.N. Jr. Bioelectrical impedance analysis: population reference values for phase angle by age and sex. Am J Clin Nutr. 2005, 82, 49–52.
- Pérez-Morales, R.; Donate-Correa, J.; Martín-Núñez, E.; Pérez-Delgado, N.; Ferri, C.; López-Montes, A.; Jiménez-Sosa, A.; Navarro-González, J.F. Extracellular water/total body water ratio as predictor of mortality in hemodialysis patients. Ren Fail 2021, 43, 821–829. [CrossRef]
- Carlson-Newberry, S. J.; Costello, R. B. Bioelectrical Impedance: a history, research issues, and recent consensus. in emerging technologies for nutrition research: potential for assessing military performance capability; National Academies Press: Washington (DC), 1997. Available online: https://www.ncbi.nlm.nih.gov/books/NBK233766/.
- Norman, K.; Stobäus, N.; Pirlich, M.; Bosy-Westphal, A. Bioelectrical phase angle and impedance vector analysis—clinical relevance and applicability of impedance parameters. Clin Nutr 2012, 31, 854–861. [CrossRef]
- Tsuji, H.; Tetsunaga, T.; Misawa, H.; Nishida, K.; Ozaki, T. Association of phase angle with sarcopenia in chronic musculoskeletal pain patients: a retrospective study. J Orthop Surg Res 2023, 18, 87. [CrossRef]
- Vona, R.; Pallotta, L.; Cappelletti, M.; Severi, C.; Matarrese, P. The Impact of Oxidative Stress in Human Pathology: Focus on Gastrointestinal Disorders. Antioxidants 2021, 10, 201.
- König, D.; Oesser, S.; Scharla, S.; Zdzieblik, D.; Gollhofer, A. Specific collagen peptides improve bone mineral density and bone markers in postmenopausal women — a randomized controlled study. Nutrients 2018, 10, 97. [CrossRef]
- da Silva, B. R.; Gonzalez, M. C.; Cereda, E.; Prado, C. M. Exploring the potential role of phase angle as a marker of oxidative stress: A narrative review. Nutrition 2022, 93, 111493. [CrossRef]
- Gonzalez, M.C.; Barbosa-Silva, T.G.; Bielemann, R.M.; Gallagher, D.; Heymsfield, S.B. Phase angle and its determinants in healthy subjects: influence of body composition. Am J Clin Nutr. 2016, 103, 712–716. [CrossRef]
- Oliveira Silvino, V.; Raffaela Barbosa Barros, K.; Machado Brito, F.; Matheus Dias Magalhães, F.; Augusto Ferreira Carioca, A.; César Carneiro Loureiro, A.; Salvador Veras-Silva, A.; Daniel Motta Drummond, M.; Antonio Pereira Dos Santos, M. Phase angle as an indicator of body composition and physical performance in handball players. BMC Sports Sci Med Rehabil 2024, 16, 114. [CrossRef]
- Cancello, R.; Brunani, A.; Brenna, E.; Soranna, D.; Bertoli, S.; Zambon, A.; Lukaski, H.C.; Capodaglio, P. Phase angle (PhA) in overweight and obesity: evidence of applicability from diagnosis to weight changes in obesity treatment. Rev Endocr Metab Disord. 2023, 24, 451–464. [CrossRef]
- Duarte Martins, A.; Paulo Brito, J.; Batalha, N.; Oliveira, R.; Parraca, J.A.; Fernandes, O. Phase angle as a key marker of muscular and bone quality in community-dwelling independent older adults: A cross-sectional exploratory pilot study. Heliyon 2023, 9, e17593. [CrossRef]
- Antunes, M.; Cyrino, E.S.; Silva, D.R.P.; Tomeleri, C.M.; Nabuco, H.C.G.; Cavalcante, E.F.; Cunha, P.M.; Cyrino, L.T.; Dos Santos, L.; Silva, A.M.; Sardinha, L.B. Total and regional bone mineral density are associated with cellular health in older men and women. Arch Gerontol Geriatr. 2020, 90, 104156. [CrossRef]
- Tanaka, S.; Ando, K.; Kobayashi, K.; Hida, T.; Ito, K.; Tsushima, M.; Morozumi, M.; Machino, M.; Ota, K.; Seki, T.; Ishiguro, N.; Hasegawa, Y.; Imagama, S. A low phase angle measured with bioelectrical impedance analysis is associated with osteoporosis and is a risk factor for osteoporosis in community-dwelling people: the Yakumo study. Arch Osteoporos 2018, 13, 39. [CrossRef]
- Khan, M.; Xiaoming, Y.; Sun, H. Coupled behavior of voltage and phase angle during transients in modern power system. In 2018 International Conference on Power System Technology (POWERCON); Guangzhou, China, 2018; pp. 480–487. [CrossRef]
- Savulescu-Fiedler, I.; Mihalcea, R.; Dragosloveanu, S.; Scheau, C.; Baz, R.O.; Caruntu, A.; Scheau, A.-E.; Caruntu, C.; Benea, S.N. The Interplay between Obesity and Inflammation. Life 2024, 14, 856.
- Player, E. L.; Morris, P.; Thomas, T.; Chan, W. Y.; Vyas, R.; Dutton, J.; Tang, J.; Alexandre, L.; Forbes, A. Bioelectrical impedance analysis (BIA)-derived phase angle (PA) is a practical aid to nutritional assessment in hospital in-patients. Clin Nutr 2019, 38, 1700–1706. [CrossRef]
- Ruiz-Margáin, A.; Xie, J. J.; Román-Calleja, B. M.; Pauly, M.; White, M. G.; Chapa-Ibargüengoitia, M.; Campos-Murguía, A.; González-Regueiro, J. A.; Macias-Rodríguez, R. U.; Duarte-Rojo, A. phase angle from bioelectrical impedance for the assessment of sarcopenia in cirrhosis with or without ascites. Clin Gastroenterol Hepatol 2021, 19, 1941–1949.e2. [CrossRef]
- Ramos-Vázquez, A. G.; Reyes-Torres, C. A.; Castillo-Martínez, L.; Serralde-Zúñiga, A. E. Body composition by bioelectrical impedance, muscle strength, and nutritional risk in oropharyngeal dysphagia patients. Nutr Hosp 2021, 38, 315–320. [CrossRef]
- Barrea, L.; Muscogiuri, G.; Aprano, S.; Vetrani, C.; de Alteriis, G.; Varcamonti, L.; Verde, L.; Colao, A.; Savastano, S. Phase angle as an easy diagnostic tool for the nutritionist in the evaluation of inflammatory changes during the active stage of a very low-calorie ketogenic diet. Int J Obes (Lond). 2022, 46, 1591–1597. [CrossRef]
- Cvijetić, S.; Keser, I.; Boschiero, D.; Ilich, J.Z. Prevalence of Osteosarcopenic Adiposity in Apparently Healthy Adults and Appraisal of Age, Sex, and Ethnic Differences. J Pers Med. 2024, 14, 782. [CrossRef]
- Straub, R.H., Ehrenstein, B., Günther, F. et al. Increased extracellular water measured by bioimpedance and by increased serum levels of atrial natriuretic peptide in RA patients—signs of volume overload. Clin Rheumatol 36, 1041–1051 (2017). [CrossRef]
- Constantine Tsigos, Charikleia Stefanaki, George I. Lambrou, Dario Boschiero, George P. Chrousos. Stress and inflammatory biomarkers and symptoms are associated with bioimpedance measures. Eur J Clin Invest. 2014. [CrossRef]
- Chrousos, G.P., Papadopoulou-Marketou, N., Bacopoulou, F. et al. Photoplethysmography (PPG)-determined heart rate variability (HRV) and extracellular water (ECW) in the evaluation of chronic stress and inflammation. Hormones 21, 383-390 (2022). [CrossRef]
- Hanley, J. A.; McNeil, B. J. A method of comparing the areas under receiver operating characteristic curves derived from the same cases. Radiology 1983, 148, 839–843. [CrossRef]
- Kyle, U. G.; Schutz, Y.; Dupertuis, Y. M.; Pichard, C. Body composition interpretation: Contributions of the fat-free mass index and the body fat mass index. Nutrition 2003, 19(7–8), 597–604. [CrossRef]
- Schorr, M.; Dichtel, L.E.; Gerweck, A.V.; et al. Sex differences in body composition and association with cardiometabolic risk. Biol Sex Differ 2018, 9, 28. [CrossRef]
- Fan, Y.; Li, Q.; Liu, Y.; Miao, J.; Zhao, T.; Cai, J.; Liu, M.; Cao, J.; Xu, H.; Wei, L.; Li, M.; Shen, C. Sex- and Age-Specific Prevalence of Osteopenia and Osteoporosis: Sampling Survey. JMIR Public Health Surveill. 2024, 10, e48947. [CrossRef]
- Sarafrazi, N.; Wambogo, E.A.; Shepherd, J.A. Osteoporosis or Low Bone Mass in Older Adults: United States, 2017–2018. NCHS Data Brief 2021, 405, 1–8.
- Asano, Y.; Tsunoda, K.; Nagata, K.; Lim, N.; Tsuji, T.; Shibuya, K.; Okura, T. Segmental phase angle and the extracellular to intracellular water ratio are associated with functional disability in community-dwelling older adults: A follow-up study of up to 12 years. Nutrition 2025, 133, 112709. [CrossRef]
- Hioka, A.; Akazawa, N.; Okawa, N.; Nagahiro, S. Influence of aging on extracellular water-to-total body water ratio in community-dwelling females. Clin Nutr ESPEN 2024, 60, 73–78. [CrossRef]
- Yamada, Y.; Matsuda, K.; Björkman, M.P.; Kimura, M. Application of segmental bioelectrical impedance spectroscopy to the assessment of skeletal muscle cell mass in elderly men. Geriatr Gerontol Int 2014, 14 (Suppl 1), 129–134. [CrossRef]
- Luo, J.; Li, L.; Shi, W.; Xu, K.; Shen, Y.; Dai, B. Oxidative stress and inflammation: Roles in osteoporosis. Front Immunol 2025, Volume 16. [CrossRef]
- Kopiczko, A.; Adamczyk, J. G.; Gryko, K.; Popowczak, M. Bone mineral density in elite masters athletes: The effect of body composition and long-term exercise. Eur Rev Aging Phys Act 2021, 18, 7. [CrossRef]
- Kawai, T.; Autieri, M. V.; Scalia, R. Adipose tissue inflammation and metabolic dysfunction in obesity. Am J Physiol Cell Physiol 2021, 320, C375–C391. [CrossRef]
- Claesson-Welsh, L.; Dejana, E.; McDonald, D.M. Permeability of the Endothelial Barrier: Identifying and Reconciling Controversies. Trends Mol Med. 2021, 27, 314–331. [CrossRef]
- Katsura, N.; Yamashita, M.; Ishihara, T. Extracellular water to total body water ratio may mediate the association between phase angle and mortality in patients with cancer cachexia: A single-center, retrospective study. Clin Nutr ESPEN 2021, 46, 193–199. [CrossRef]
- Park, K.S.; Lee, G.Y.; Seo, Y.M.; Seo, S.H.; Yoo, J.I. The relationship between extracellular water-to-body water ratio and sarcopenia according to the newly revised Asian Working Group for Sarcopenia: 2019 Consensus Update. Aging Clin Exp Res 2021, 33, 2471–2477. [CrossRef]
Figure 1.
ROC curve for ECW/TBW-based prediction of low muscle mass (a) and low bone mass (b) in women. ROC = receiver operator characteristics; ECW/TBW = extracellular water total body water ratio; AUC = area under the curve.
Figure 1.
ROC curve for ECW/TBW-based prediction of low muscle mass (a) and low bone mass (b) in women. ROC = receiver operator characteristics; ECW/TBW = extracellular water total body water ratio; AUC = area under the curve.
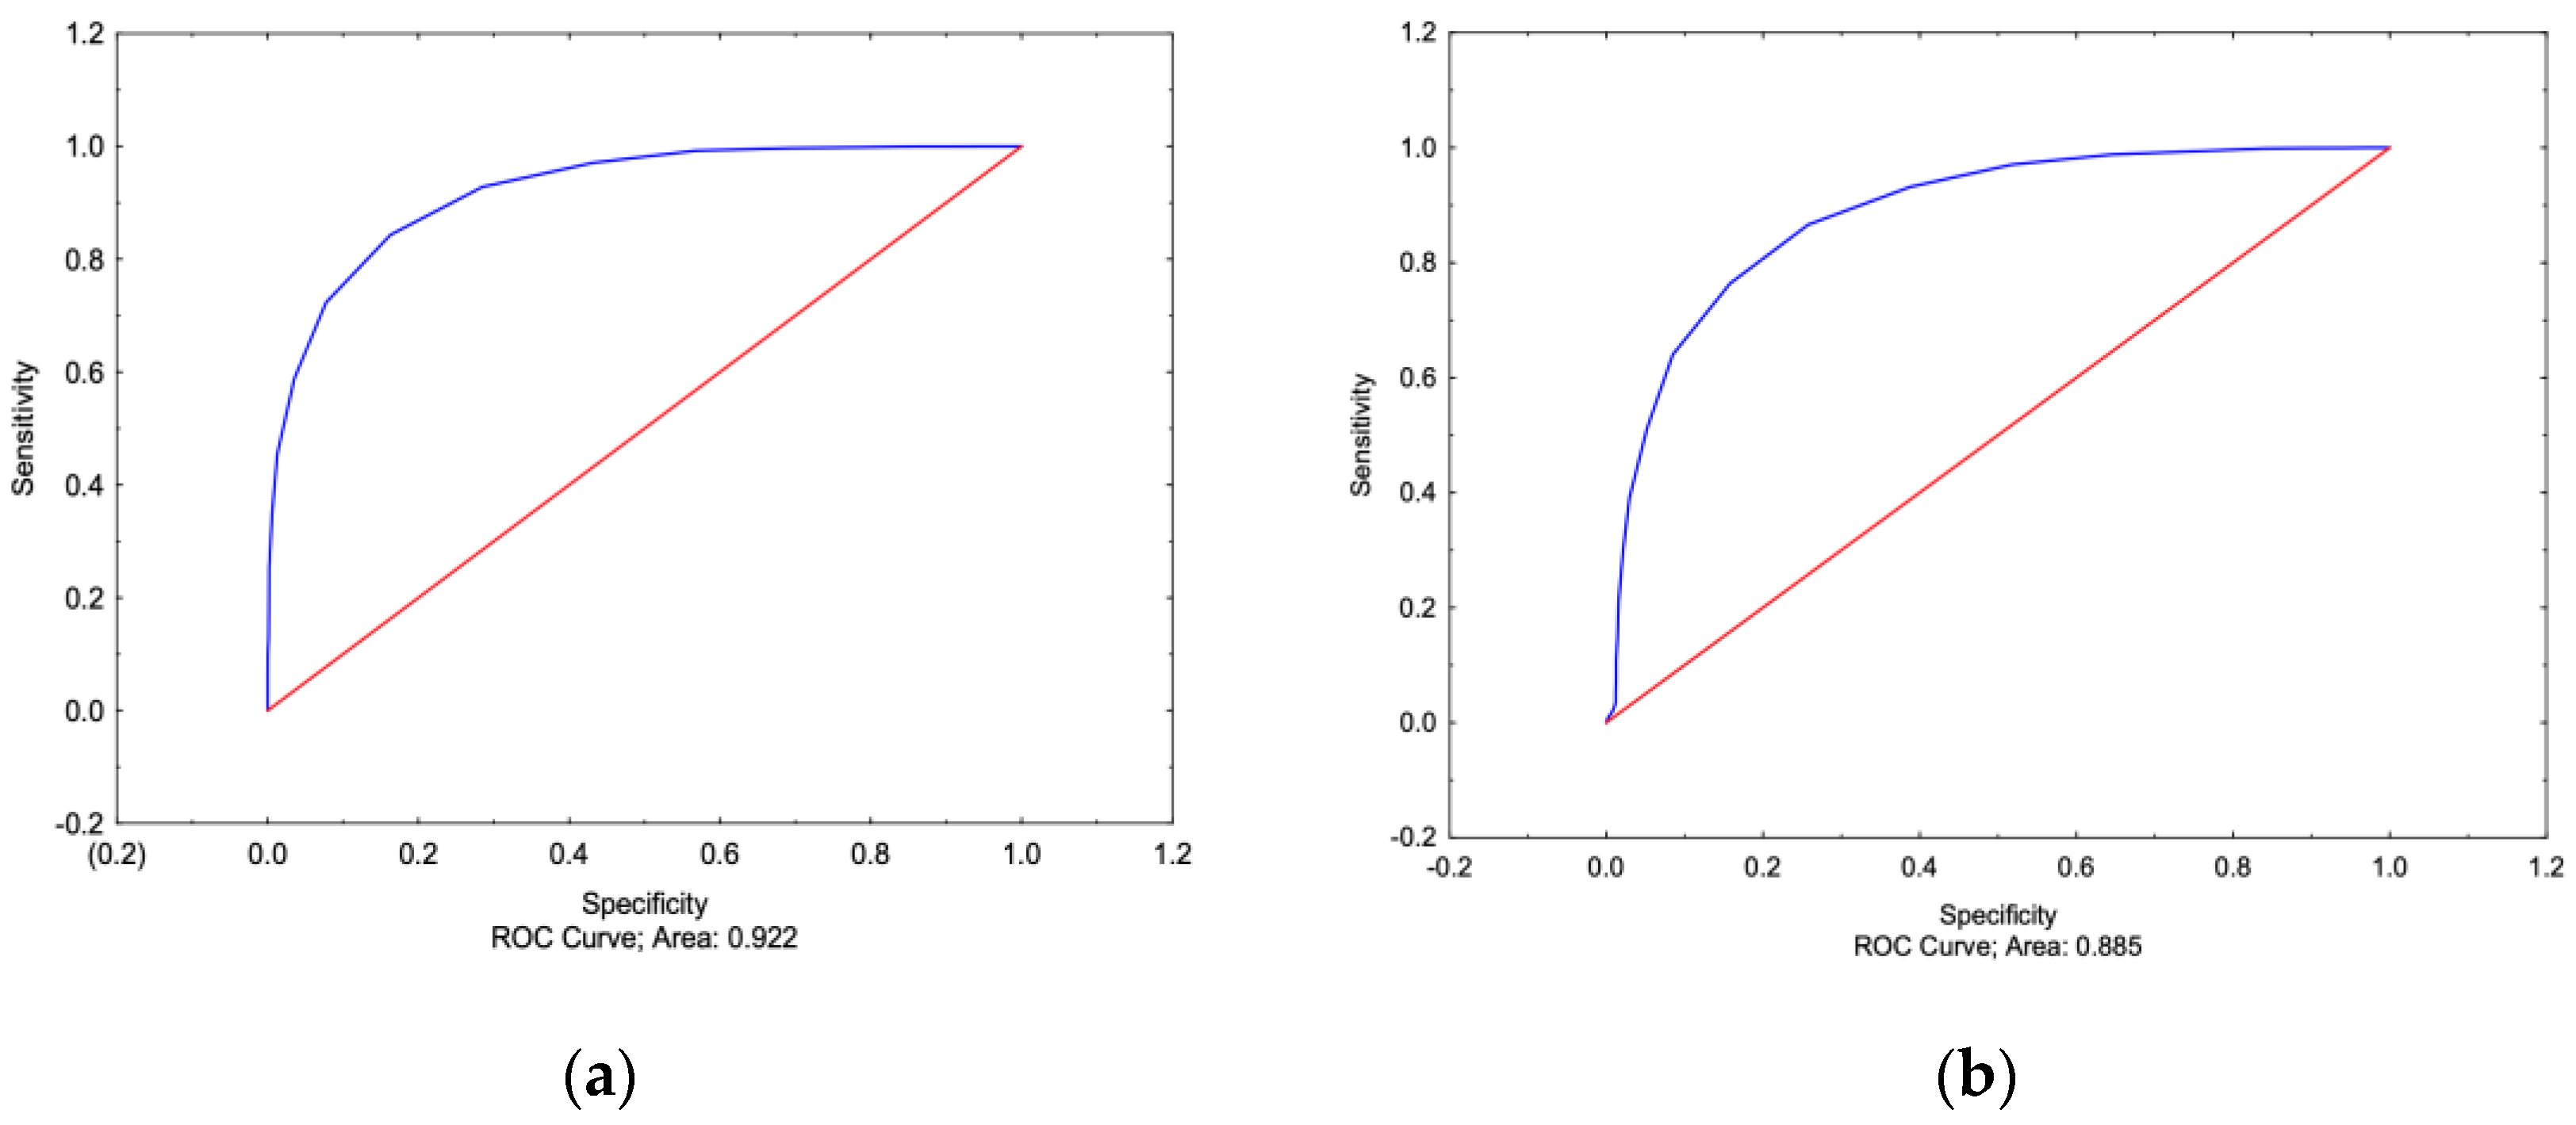
Figure 2.
ROC curve for ECW/TBW-based prediction of low muscle mass (a) and low bone mass (b) in men. ROC = receiver operator characteristics; ECW/TBW = extracellular water total body water ratio; AUC = area under the curve.
Figure 2.
ROC curve for ECW/TBW-based prediction of low muscle mass (a) and low bone mass (b) in men. ROC = receiver operator characteristics; ECW/TBW = extracellular water total body water ratio; AUC = area under the curve.
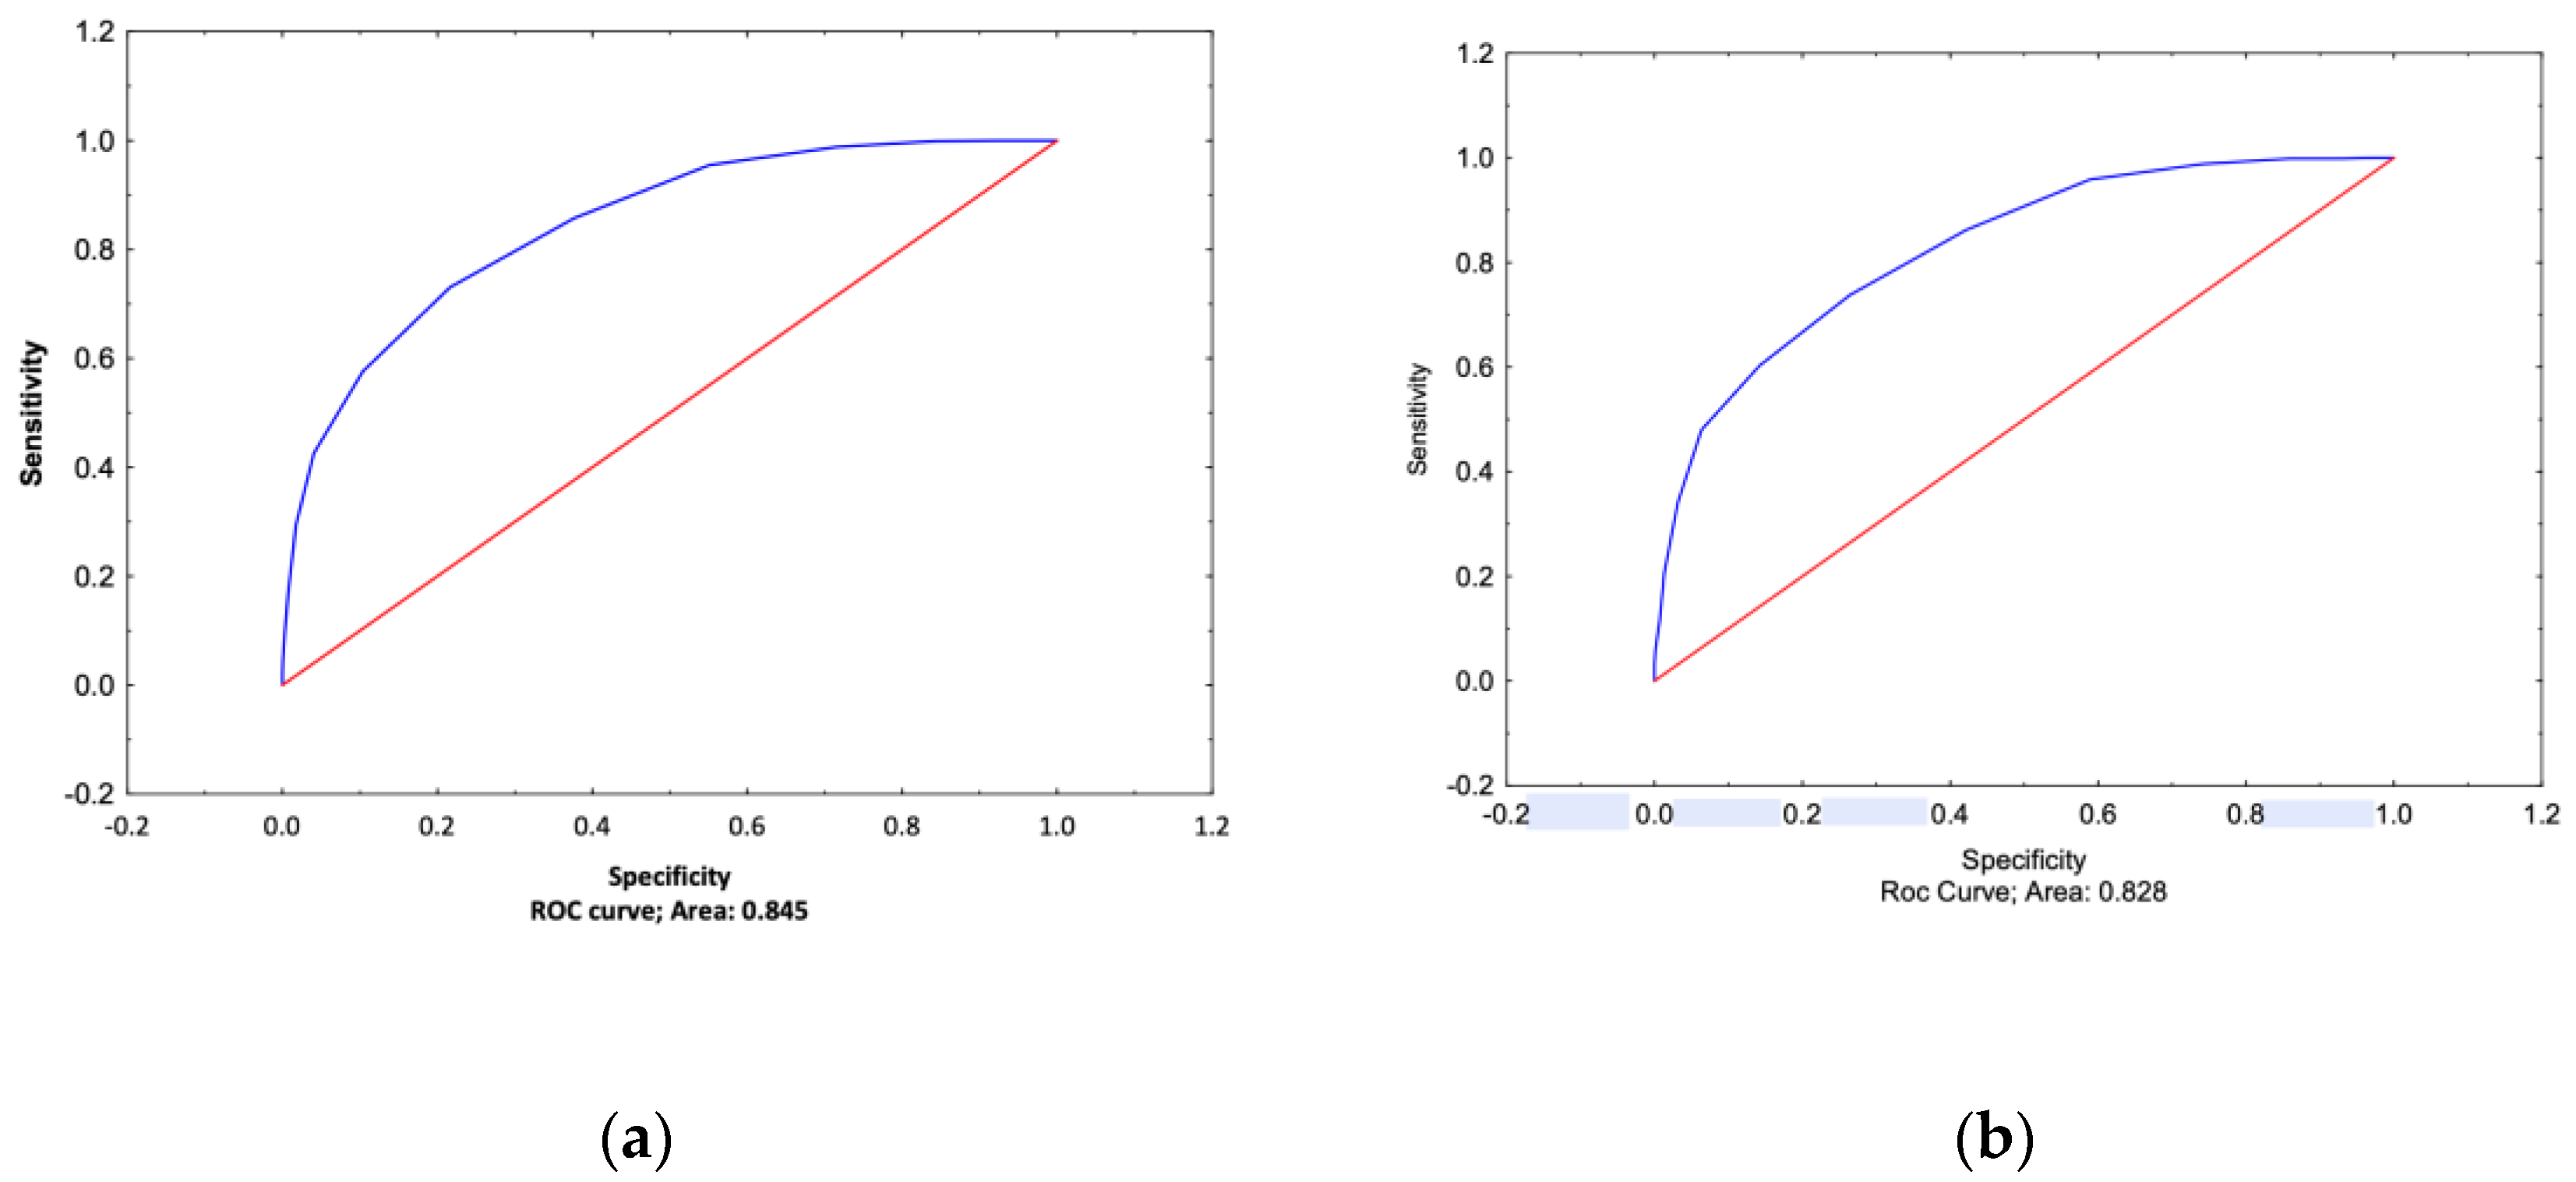

Table 1.
Age, anthropometry and bioimpedance-derived parameters in participants.
|
Variables |
Mean ± SD |
P* |
Range |
Percentile 25% - 75% |
Reference values |
|
| F (6412) | M (3305) | |||||
| Age (yrs.) | 47.6±13.5 | 47.8±14.1 | 0.430 | 20.0-90.0 | 38.0-57.0 | / |
| Weight (kg) | 66.7±14.4 | 82.9±15.1 | <0.001 | 40.0-149.0 | 60.0-82.0 | / |
| Height (cm) | 163.1+7.0 | 176.4±7.0 | <0.001 | 141.0-199.0 | 160.0-174.0 | / |
| BMI (kg/m2) | 25.1±5.4 | 26.6±4.6 | <0.001 | 14.5-57.2 | 21.9-28.3 | 18.5-29.9 |
| T-score | -1.1±0.8 | -0.3±0.7 | <0.001 | -3.3-5.2 | -1.5-(-0.3) | > -1 |
| S-score | -0.9±1.4 | -0.1±1.2 | <0.001 | -4.5-9.0 | -1.6-0.1 | > -1 |
| FM (%) | 33.2±8.6 | 32.5±7.3 | <0.001 | 5.0-57.0 | 27.0-39.0 | <30.0 (F) <25.0 (M) |
| IMAT (%) | 2.0±0.5 | 2.2±0.4 | <0.001 | 0-3.5 | 1.7-2.5 | < 2% |
| ECW/TBW (%) | 50.0±4.3 | 42.7±2.7 | <0.001 | 36.0-71.0 | 43.0-51.0 | 40 % |
| PhA (0) | 2.3±1.3 | 3.0±1.3 | <0.001 | -2.1-22.7 | 1.8-3.4 | >3.5 |
* Mann Whitney test; BMI = body mass index; FM = fat mass; IMAT = intramuscular adipose tissue; ECW = extracellular water; TBW = total body water; PhA = phase angle.
Table 2.
Differences between the two AUC in women and men.
| Area Under the Curve (AUC) | ||||
| ECW/TBW | PhA | p* | ||
|
Women |
Low/normal muscle mass | 0.922 | 0.608 | <0.001 |
| Low/normal bone mass |
0.885 | 0.577 | <0.001 | |
| Increased/normal fat mass | 0.713 | 0.574 | <0.001 | |
|
Men |
Low/normal muscle mass | 0.845 | 0.719 | <0.001 |
| Low/normal bone mass |
0.828 | 0.696 | <0.001 | |
| Increased/normal fat mass | 0.647 | 0.650 | 0.920 | |
* Hanley and McNeil method; ECW = extracellular water; TBW = total body water; PhA = Phase angle.
Table 3.
Association of ECW/TBW and PhA with fat mass, skeletal muscle mass and bone mass parameters.
Table 3.
Association of ECW/TBW and PhA with fat mass, skeletal muscle mass and bone mass parameters.
| Dependent variables | ||||
| ECW/TBW | PhA | |||
| b | p* | b | p* | |
| Intercept | 47.8 | <0.001 | 10.1 | <0.001 |
| Age | 0.14 | <0.001 | 0.01 | <0.001 |
| Sex | -6.18 | <0.001 | 0.82 | <0.001 |
| BMI | 0.46 | <0.001 | -0.45 | <0.001 |
| T-score | -1.14 | <0.001 | 1.22 | <0.001 |
| S-score | -1.58 | <0.001 | 2.13 | <0.001 |
| FM% | 0.38 | <0.001 | 0.08 | <0.001 |
| R² | 0.943 | 0.368 | ||
* Multiple regression (b = coefficient of regression) .
Disclaimer/Publisher’s Note: The statements, opinions and data contained in all publications are solely those of the individual author(s) and contributor(s) and not of MDPI and/or the editor(s). MDPI and/or the editor(s) disclaim responsibility for any injury to people or property resulting from any ideas, methods, instructions or products referred to in the content. |
© 2025 by the authors. Licensee MDPI, Basel, Switzerland. This article is an open access article distributed under the terms and conditions of the Creative Commons Attribution (CC BY) license (http://creativecommons.org/licenses/by/4.0/).
Copyright: This open access article is published under a Creative Commons CC BY 4.0 license, which permit the free download, distribution, and reuse, provided that the author and preprint are cited in any reuse.


