
Submitted:
09 November 2025
Posted:
10 November 2025
You are already at the latest version
Abstract
In January 2025, multiple wildfires erupted across the Los Angeles region, fueled by pro-longed dry conditions and intense Santa Ana winds. These events caused severe loss of life, extensive community damage, mass evacuations, and substantial air quality deterio-ration across Southern California and downwind regions through long-range smoke transport. This study integrates passive and active satellite observations to characterize the spatiotemporal and vertical distribution of wildfire emissions. TROPOMI (Sentinel-5P) and TEMPO provided high-resolution mapping of trace gases, including nitrogen dioxide (NO₂), carbon monoxide (CO), and formaldehyde (HCHO). Vertical column densities of NO₂ and HCHO reached 40 and 25 Pmolec/cm², respectively, representing more than a 250% increase in fire-affected zones. TEMPO observations revealed strong diurnal varia-bility and secondary photochemical production, offering insights into plume evolution on sub-daily scales. ATLID (EarthCARE) lidar profiling identified smoke layers concentrated between 1–3 km altitude, with optical properties characteristic of fresh biomass burning, and depolarization ratios indicating mixed particle morphology. The vertical profiling capability was critical for distinguishing transported smoke from boundary-layer pollu-tion and assessing radiative impacts. These findings demonstrate the value of synergistic passive–active satellite measurements in capturing the full extent of wildfire plumes and emphasize the need for integrated monitoring strategies as wildfire risk intensifies under climate change.
Keywords:
remote sensing
; smoke
; aerosols
; air quality
; Californian fires
; TROPOMI
; TEMPO
; EarthCare1.
1. Introduction
In early January 2025, an unprecedented series of wildfires erupted across the greater Los Angeles region, marking one of the most severe wildfire events in Southern California’s recent history. Between January 7 and 31, a series of destructive wildfires swept through the Los Angeles metropolitan area and San Diego County, leaving behind widespread devastation to communities, infrastructure, and natural ecosystems. Triggered by a combination of prolonged drought conditions, exceptionally high temperatures, and intense hurricane-force Santa Ana wind [1,2] episodes that in some regions exceeded 100 miles per hour (160 km/h), the fires rapidly spread through dense vegetation and dry urban-wildland interfaces. These intense winds rapidly accelerated fire spread, overwhelmed containment efforts, and created extremely hazardous conditions for both emergency responders and residents. The fires resulted in at least 30 fatalities, the evacuation of over 200,000 people, and the destruction of more than 18,000 homes and structures. In total, the wildfires scorched over 57,000 acres (23,000 hectares), with the most severe damage caused by the Eaton Fire in Altadena and the Palisades Fire in Pacific Palisades. These two megafires ranked among the most destructive in California’s history, with preliminary analyses indicating that the Los Angeles 2025 wildfires may have caused economic losses exceeding 250 billion U.S. dollars. Beyond the immediate destruction, the wildfires triggered a major atmospheric pollution event, injecting large volumes of trace gases and aerosols into the lower and middle atmosphere. The resulting smoke plumes transported hazardous pollutants across vast distances, significantly degrading air quality in both local and downwind urban centers.
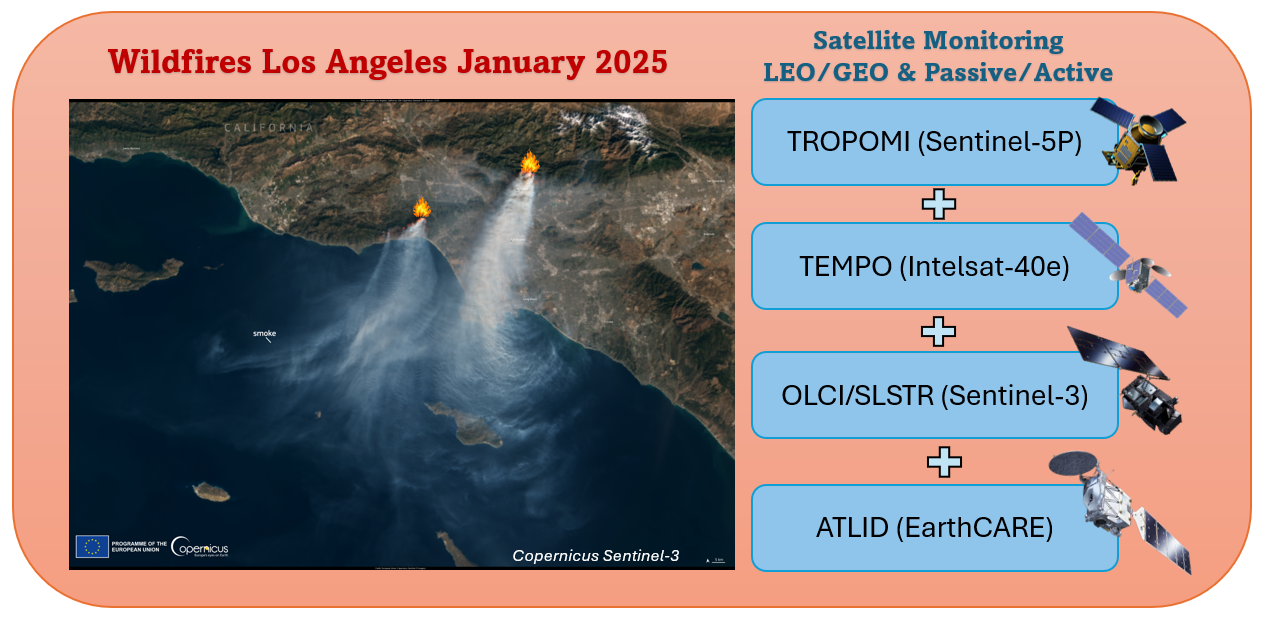
To assess the atmospheric impacts of the LA fires, we utilized a range of satellite datasets, including the TROPOspheric Monitoring Instrument (TROPOMI) onboard Sentinel-5P, which provides high-resolution measurements of nitrogen dioxide (NO₂), formaldehyde (HCHO), and absorbing aerosols. These pollutants serve as key tracers of combustion processes and secondary pollutant formation. Additionally, the recently launched TEMPO (Tropospheric Emissions: Monitoring of Pollution) geostationary instrument enhances temporal resolution by providing hourly measurements of NO₂ and HCHO over North America, allowing for real-time tracking of fire plume evolution and diurnal emission cycles. In addition to existing datasets, the newly deployed ESA/JAXA Earth Cloud Aerosol and Radiation Explorer (EarthCARE) mission—specifically the ATLID (ATmospheric LIDar) instrument—offers highly detailed vertical profiles of aerosols and thin clouds. This enhanced resolution enables more precise analysis of smoke plume heights and aerosol layering. Combining data from multiple satellite platforms, this research seeks to investigate pollutant emissions linked to wildfires, track the spatial (both vertical and horizontal) evolution of emitted smoke particles and gases and assess their effects on air quality across Southern California. The severity of the January 2025 wildfires provides a significant opportunity to explore the dynamic interaction between climate change and wildfire behavior in densely populated areas, highlighting the pressing need for better monitoring systems, models predictions, and response strategies.
2. Datasets and Methodology
2.1. Satellite Observations
Recent research has highlighted the efficacy of satellite measurements in detecting plumes and quantifying air pollutant concentrations stemming from forest fires and biomass burning. Notably, measurements of CO and NO₂ obtained from the S5P/TROPOMI satellite have been employed to estimate emissions during the wildfires in Australia from 2019 to 2020 [3] and to assess the relative atmospheric enhancements of these air quality indicators across fire-prone regions globally [4]. In Northern Greece, S5P/TROPOMI observations of NO₂, HCHO, and CO illustrated the dispersion of fire plumes, which significantly degraded air quality in Thessaloniki, located roughly 300 kilometers to the west of the fire event [5]. Furthermore, during the extreme wildfires in Portugal in 2018, S5P/TROPOMI measurements of CO and methane indicated pronounced trends and plumes, showcasing strong agreement with in-situ measurements [6]. The health impacts of the forest fires in the United States in 2020 and the Northern Greece fires in 2023 were evaluated through aerosol optical depth (AOD) and the ultraviolet aerosol index (UVAI), as derived from S5P/TROPOMI data [7,8].
2.1.1. Tropospheric Emissions Monitoring of Pollution (TEMPO)
The NASA Tropospheric Emissions Monitoring of Pollution (TEMPO) is a geostationary satellite program specifically created to oversee air quality across North America during daylight hours, achieving high spatial resolution of 2 × 4.75 km² at the center of its field of regard and a temporal resolution of one hour or less [9]. TEMPO is led by a principal investigator (PI) from the Smithsonian Astrophysical Observatory (SAO), with project management conducted at NASA Langley Research Center (LaRC) and the instrument development carried out by Ball Aerospace, which is now part of BAE Systems. TEMPO marks a significant advancement as it provides the first tropospheric trace gas measurements from geostationary orbit (GEO) for North America. This effort builds on the experience gained from six spectrometers that have operated in low Earth orbit (LEO): GOME/ERS-2 [10], SCIAMACHY/Envisat [11], OMI/Aura [12], GOME-2/Metop [13], MPS/Suomi-NPP [14], and TROPOMI/Sentinel-5P [15]. Additionally, the GEMS instrument [16], which was launched into GEO in 2020, was designed to measure air pollutants over eastern Asia. TEMPO is equipped to measure the spectra needed to derive essential mission baseline data products including total and profile ozone (O3), nitrogen dioxide (NO₂), formaldehyde (HCHO), cloud fraction, and cloud pressure. Moreover, the spectra collected by TEMPO can also be utilized for the extraction of bromine monoxide (BrO), sulfur dioxide (SO2), glyoxal (C2H2O2), nitrous acid (HNO₂), water vapor (H2O), aerosols and Ultraviolet B (UVB) radiation. This study presents Level-2 data for nitrogen dioxide tropospheric columns and formaldehyde columns. TEMPO Level 2 data products deliver trace gas information at the instrument’s inherent spatial resolution, approximately 10 km² at the core of the Field of Regard (FOR). These products are structured based on the scan number and granule number for each day. Each individual scan represents a sweep from the East to the West and typically lasts about one hour. However, shorter scans may occur over a more restricted East-West area, which happens during morning and evening periods (around 40 minutes) or under specific high temporal resolution operational circumstances. In this work, Level 2 NO₂ and HCHO provisional data were accessed via the NASA EarthData repository, https://www.earthdata.nasa.gov/ (last access 15 May 2025). The granules covering California were grouped per hour and then spatiotemporally gridded on a nominal grid of 0.1 x 0.1° for visualization purposes. All recommended filters were applied as per [17]. For more details on the NO₂ and HCHO retrievals and datasets refer to the TEMPO Algorithm Theoretical Baseline Document [18,19] and the TEMPO Product User Guide [17].
2.1.2. TROPOspheric Monitoring Instrument (TROPOMI)
The TROPOspheric Monitoring Instrument (TROPOMI), aboard the Sentinel-5 Precursor (S5P) satellite, operates in a Sun-synchronous orbit and was launched on October 13, 2017. It delivers daily global observations of atmospheric pollutants, with a local overpass time around 13:30 [15] and a spatial resolution of 3.5 × 5.5 km². TROPOMI captures data across multiple spectral bands, including the ultraviolet (UV), visible (VIS), near-infrared (NIR), and short-wave infrared (SWIR), enabling the detection of various atmospheric constituents such as nitrogen dioxide (NO₂), formaldehyde (HCHO), carbon monoxide (CO), methane (CH₄) and aerosol products e.g., [20,21,22,23,24].
TROPOMI/S5P Trace Gases Observations
In this study, we focus on two air quality-related species, nitrogen dioxide (NO₂) and formaldehyde (HCHO), as observed by the TROPOMI instrument. The data utilized are based on the reprocessed, homogenized, and open-source (RPRO) version 2.6 dataset [20]. According to the Quarterly Validation Report for the S5P/TROPOMI operational data products (ROCVR) [25], the overall median bias for tropospheric NO₂ is -28% when benchmarked against measurements from 29 MAX-DOAS stations. This represents a notable progress from the preceding version, which exhibited a bias of approximately -37%, and the current figures remain within the specified mission requirement of 50%. For HCHO, the reported bias shows -30% for high-emission stations and +32% for clean stations when compared to 29 FTIR stations, with these values also satisfying the mission's accuracy requirements, which range from 40% to 80%. For this analysis, we employed only near-cloud-free observations, applying quality assurance thresholds of 0.75 and 0.5 for NO₂ and HCHO, respectively, as recommended in the Product User Manuals (PUM) [26,27]. Specifically, for NO₂, we filtered for a cloud radiance fraction (CRF) lower than 0.5, ensuring snow-ice free observations and excluding any problematic retrievals. For HCHO, the lower quality assurance value permits the inclusion of data in cloudy scenarios, where sensitivity profiles are critical, supported by averaging kernels to enhance model simulations or vertical profile observations, including high-quality retrievals above clouds and snow/ice.
TROPOMI/S5P Aerosol Observations
In addition to trace gas measurements, we exploited aerosol-specific products from the TROPOMI instrument to enhance the characterization of smoke plume dispersion and vertical distribution during the LA wildfire event. Aerosols play a vital role in atmospheric chemistry and radiative processes. With lifetimes ranging from hours to days, aerosols impact air quality and climate by scattering and absorbing solar radiation, thus modifying the photolytic environment in the lower troposphere [28,29]. Their influence intensifies during summer months, when elevated temperatures and increased emissions of biogenic volatile organic compounds promote secondary aerosol formation, further altering atmospheric composition and photochemical activity [30,31]. To assess the presence and distribution of these atmospheric aerosols—particularly absorbing types such as those associated with biomass burning—we utilized the TROPOMI UV Aerosol Index (UVAI), a standard product derived from top-of-atmosphere (TOA) reflectance measurements [32]. The UVAI provides a qualitative indication of the presence of absorbing aerosols—such as biomass burning smoke, desert dust, or volcanic ash—based on differences between observed reflectance and theoretical clear-sky values across selected ultraviolet wavelength bands. Positive UVAI values are indicative of absorbing aerosol layers, while values near zero generally correspond to cloud presence, and negative values may reflect scattering aerosols or optically thin clouds. Given the sensitivity of UVAI to aerosol type and altitude, its interpretation requires careful contextual analysis [33]. In this study, we restricted the analysis to high-quality, cloud-free measurements by applying a quality assurance threshold of qa_value ≥ 0.75, as outlined in the official Product User Manual [34].
At the same time, to complement the UVAI data, we also used the TROPOMI Aerosol Layer Height (ALH) product, which determines the average height of elevated aerosol layers in the troposphere. This information is crucial in incidents involving smoke, mineral dust particles and volcanic ash, as the vertical distribution of the plume is critical for assessing transport dynamics. The ALH retrieval algorithm, part of the operational aerosol products from TROPOMI, was developed by the Royal Netherlands Meteorological Institute (KNMI) [35,36]. In this study, we utilized offline (OFFL) TROPOMI ALH data (version 02.08.00) corresponding to the wildfire events in January 2025. To reduce cloud interference and improve retrieval reliability, only data with a quality assurance value (qa_value) greater than 0.5 were included [37]. Comprehensive details on the development and validation of the algorithm can be found in the works of [35,38].
2.1.3. Fire Radiative Power from Sentinel-3 Polar-Orbiting Satellites
This study employs satellite-based fire data, emphasizing Fire Radiative Power (FRP) as described by [39]. The FRP measurements are derived from the Level 2 Near Real-Time (NRT) Collection 3 data of the Sentinel-3 SLSTR (Sea and Land Surface Temperature Radiometer [40]), available since 2016 for Sentinel-3A and since 2018 for Sentinel-3B (https://user.eumetsat.int/catalogue/EO:EUM:DAT:0417). The SLSTR-based FRP product provides a quantitative measure of the thermal energy released by active wildfires, expressed in megawatts (MW), by detecting radiative heat signals emitted from land and ocean surfaces. This data is captured at a spatial resolution of 1 km² for wildfires and 500 m² for gas flares, enabling fine-scale detection and localization of fire activity. The NRT S3 FRP processor ensures timely delivery, with fire events identified and characterized within approximately three hours of satellite overpass, which is crucial for near real-time fire monitoring and emergency response. To complement the thermal-based detection, Sentinel-3 Ocean and Land Colour Instrument (OLCI; https://ladsweb.modaps.eosdis.nasa.gov/missions-and-measurements/olci/; last accessed: 15 March 2025) imagery is used to visually confirm fire-affected areas through high-resolution true color images, offering contextual information on the surrounding landscape, smoke plumes, and burn scars. The integration of SLSTR thermal data and OLCI optical imagery, accessed and visualized through the Ocean Virtual Laboratory (https://ovl.oceandatalab.com; last accessed: 15 March 2025) provides a robust and comprehensive approach for assessing fire dynamics, spatial distribution, and the environmental impact of wildfires across the Los Angeles region [40].
2.1.4. ATmospheric LIDar (ATLID) Instrument Observations
Launched in May 2024, Earth Cloud Aerosol and Radiation Explorer (EarthCARE; [41]) is a joint ESA-JAXA mission dedicated to studying cloud-aerosol-radiation interactions and their influence on climate. A key instrument onboard is ATmospheric LIDar (ATLID; [42,43]), an advanced high-spectral-resolution lidar (HSRL), that provides vertical profiles of aerosols and thin clouds with unprecedented accuracy. ATLID operates using ultraviolet (at 355nm) laser pulses to detect backscattered signals from atmospheric particles, enabling precise discrimination between cloud layers and various aerosol types, such as wildfire smoke, urban pollution, and mineral dust, making it a crucial tool for improving climate models and weather prediction. This functionality is particularly valuable in wildfire studies, as it allows researchers to identify and monitor the vertical structure, optical properties, and transport pathways of smoke plumes—factors essential for assessing both local air quality degradation and the broader radiative impacts on climate. The ATLID data used in this study corresponds to the EarthCARE Level-2A Aerosol Product (A-AER) which provides geophysical aerosol optical properties retrieved from the ATLID HSRL measurements. Key parameters include the particle backscatter coefficient, particle extinction coefficient, lidar ratio, and linear particle depolarization ratio at 355 nm. These parameters are essential for characterizing aerosol vertical structure and type. The data were obtained from the EarthCARE Dissemination System-2 (https://ec-pdgs-dissemination2.eo.esa.int/oads/access/collection; last access: 15 March 2025) and are part of the Commissioning Phase release available to ESA Principal Investigators under the EarthCARE Validation Announcement of Opportunity. Comprehensive descriptions of these products and processing chains are detailed in [44] and [45].
3. Results and Discussion
Figure 1 illustrates the evolution and atmospheric impact of the Los Angeles wildfire event from January 8 to January 11, 2025, using satellite-based observations from VIIRS/Suomi-NPP and TROPOMI instruments. The top row presents true-color imagery from VIIRS/Suomi-NPP, capturing the visible spread of smoke plumes over Southern California and the adjacent Pacific Ocean. On January 8 and 9, left and middle panels, dense smoke is clearly visible drifting south-westward from the Los Angeles area, indicating active fire emissions and strong surface-to-atmosphere transport. By January 11, right panel, the smoke appears more diffuse and less concentrated, suggesting a decline in fire intensity or changes in meteorological conditions affecting plume dispersion. The middle row displays the TROPOMI-derived Aerosol Index (UVAI), which quantifies the presence of UV-absorbing aerosols such as smoke. A notable increase in aerosol index values is observed on January 9, with the highest concentrations centered over the Los Angeles region and extending westward over the ocean, pointing to intense fire activity and significant aerosol loading. While UVAI values are still noticeable on January 11, they show a significant decrease, indicating either a drop in fire-related emissions or more extensive dispersion of smoke. The lower panels illustrate Aerosol Layer Height (ALH) data retrieved by TROPOMI, which reflects the vertical positioning of aerosol particles in the atmosphere. On January 8 and 9, the smoke rose as high as 6 kilometers, showing strong upward movement into the upper troposphere. By January 11, ALH values fall, corresponding with diminished UVAI readings and reduced visual smoke presence. Overall, these data provide a clear picture of how fire evolved, emphasizing both the horizontal and vertical movement of smoke and offering valuable information about its broader atmospheric effects.
Figure 2 provides a detailed assessment of the smoke plume generated by the Los Angeles wildfires on 11 January 2025, utilizing observations from the ATLID instrument aboard the EarthCARE satellite. The panel (a) displays a MODIS/Aqua true-color image with the EarthCARE orbital ground track superimposed, illustrating the satellite’s close spatial coincidence with the smoke-laden region. The panel (b) illustrates the vertical distribution derived from EarthCARE’s Low-Resolution Target Classification, which reveals the structure and layering of the smoke plume as it extends through the lower troposphere. Complementing these spatial and vertical perspectives, panel (c) provides detailed vertical profiles of key aerosol optical properties retrieved by ATLID: i) backscatter coefficient, ii) extinction coefficient, iii) lidar ratio, and iv) depolarization ratio at 355nm. The backscatter profile indicates enhanced aerosol loading primarily between 1–2 km altitude, with maxima corresponding closely to the aerosol layer heights (ALH) derived from TROPOMI, as marked by horizontal reference lines. The extinction profile corroborates the presence of optically active particles in the same vertical range. The lidar ratio, with values peaking around 60 sr, is characteristic of fresh biomass burning aerosols, while moderate depolarization ratios suggest a mixture of spherical and irregularly shaped particles, consistent with aged smoke. Together, these lidar measurements yield a vertically resolved optical and microphysical characterization of the smoke plume.
TROPOMI and TEMPO Tropospheric Gases Monitoring
Nitrogen dioxide (NO₂) is a key atmospheric pollutant with significant environmental and health impacts, primarily emitted from anthropogenic combustion processes (e.g., vehicular exhaust, industrial activities, and power generation) and natural sources like lightning and soil emissions [30]. In the surface and lower troposphere, NO₂ plays a crucial role in tropospheric ozone (O₃) formation and contributes to secondary particulate matter (PM₂.₅) via nitrate aerosol production [47]. Its atmospheric lifetime is relatively short, typically ranging from hours to a day, depending on photochemical conditions, altitude, and the presence of oxidants like hydroxyl radicals (OH) [48]. Due to its short lifetime, NO₂ exhibits strong spatial variability, with high concentrations near urban and industrial regions, as observed by satellite instruments such as the Ozone Monitoring Instrument (OMI) and the TROPOspheric Monitoring Instrument (TROPOMI) [12,18]. Long-term trends in NO₂ emissions have been influenced by regulatory policies, technological improvements, and, more recently, changes in energy use patterns [49]. Despite reductions in some regions, rapidly developing areas continue to experience increasing NO₂ pollution, underscoring the need for sustained emission control strategies [50].
In this section, we investigate the evolution of the fire plume for the 8th, the 9th, and the 11th of January, by assessing the NO₂ (Figure 3) and HCHO (Figure 4) VCD enhancements as sensed from the polar-orbiting TROPOMI and the geostationary TEMPO instruments. The TEMPO L2 fields were selected at 20:00 UTC, approximating the TROPOMI overpass time. VCD enhancements are presented as absolute differences over a climatological mean extracted from the TROPOMI and TEMPO observations, respectively, and are used to enhance the fire signal and identify the plumes originating from the different fire hotspots. The TROPOMI VCD enhancements, for both NO₂ and HCHO, were estimated by subtracting the average daily observed columns from the January 2019- 2024 mean. Similarly, the TEMPO VCD enhancements were estimated after the subtraction of the 2024 January mean from the hourly average NO₂ and HCHO abundances for the three days discussed in this work.
Estimated uncertainties for both NO2 and HCHO are included in both TROPOMI & TEMPO product files. van Geffen et al. [20], report a comprehensive error estimation process which results in the TROPOMI tropospheric NO2 error to range from 20 to 50% of the tropospheric NO2 retrieved, while De Smedt et al. [52], also present an extensive error estimation process to finally account for a total error of 35% for polluted/elevated HCHO cases. Nowlan et al. [17], estimate that the TEMPO NO2 in biomass burning plumes have systematic uncertainties on the order of 20 to 50%, with even larger errors in some cases due to the presence of aerosols. The same issue also affects the TEMPO HCHO retrievals [19] whose estimated uncertainties of between 35% to 50% may increase by around ~20% as the calculations do not consider aerosols explicitly. The routine validation of both space-born products against ground-based remote sensing products can be found in [25] and [53].
Figure 3 demonstrates the evolution of the NO₂ plume for three fire days associated with the corresponding VCD enhancements estimated by the TROPOMI (upper) and TEMPO (lower) instruments. Both satellite sensors exhibit a common spatial distribution of the fire plume and enhancements of similar magnitude. More specifically, on January 8th (left panel) two fire hot spots, over the Palisades and Eaton counties, are distinguishable from both sensors with a southwestern dispersion of the fire plume. The impact of the quality flags used in the TROPOMI NO₂ retrievals is evident as grid cells within the plume are identified as clouds and hence no retrievals are available.
This phenomenon, referred to as aerosol shielding, arises from the light extinction caused by biomass burning aerosols in the ultraviolet and visible wavelength ranges. Notably, this light extinction is not adequately addressed in the TROPOMI/S5P operational retrieval algorithm [20]. TEMPO NO₂ retrievals are seemingly not affected by the aerosol shielding phenomenon. Negative enhancements are also observed from both sensors over the mainland in the vicinity of the fire hot spots, possibly indicating that anthropogenic activities and their related emissions have declined significantly during the fire days compared to the previous years, without excluding the effect of different meteorological conditions between years 2024 and 2025. On January 9th, both instruments show a southeastern dispersion of the plume with the aerosol shielding impact being prevalent in the TROPOMI NO₂ enhancements over an extended area of the dense plume. Finally, on January 11th the NO₂ plume dispersion is limited compared to the previous day’s stipulating the weakening of the fire event.
Formaldehyde (HCHO), recognized as the most abundant carbonyl compound in the troposphere, significantly contributes to photochemical reactions occurring in the lower troposphere. Its presence in the atmosphere can be attributed to various anthropogenic activities, including vehicle emissions, industrial operations, and biomass burning. Characteristically, HCHO exhibits a relatively short atmospheric lifetime of approximately 5 hours, primarily due to its photolytic degradation facilitated by hydroxyl (OH) radicals. The concentration levels of HCHO typically peak during the summer months, driven by increased biogenic isoprene emissions that promote its formation [54]. Additionally, HCHO is noted for its low optical density as its absorption characteristics in the ultraviolet (UV) spectrum overlap with those of other substances, leading to expectations of relatively high noise in satellite retrievals of HCHO.
Figure 4 shows the HCHO VCD enhancements observed by the TROPOMI (a,b,c) and TEMPO (d,e,f) instruments for the same fire days as for NO₂. The spatial distribution and orientation of the plume is similar to the NO₂ observed enhancements. On January 8th (a, d) both TROPOMI and TEMPO sense an extended HCHO plume, stemming mainly from the Palisades fire hotspot, with a west-southwestern direction over the Pacific Ocean. On January 9th, the main bulk of the HCHO plume accumulated over the coastal zone of Palisades, whereas on January 11th the HCHO VCD enhancements slightly declined compared to the previous days, following a southwestern direction. The aerosol shielding phenomenon is prevalent in the TROPOMI retrievals on January 11th. Part of the dispersed plume over the Pacific Ocean, clearly depicted in the TEMPO HCHO VCD enhancements (Figure 4), is not depicted in the TROPOMI HCHO retrievals due to the applied associated quality flags.
Figure 5 displays the spatial distribution and intensity of wildfires in the Los Angeles region on January 9th, 2025, captured by the Sentinel-3 OLCI true-color image overlaid with Fire Radiative Power (FRP) data from the Sea and Land Surface Temperature Radiometer (SLSTR) instrument aboard Sentinel-3A and 3B. Two prominent fire-affected zones, labeled Cluster 1 and Cluster 2, correspond to the Palisades and Eaton Canyon areas, respectively. These regions are outlined in red, with color-coded pixels indicating varying levels of FRP, a direct proxy for fire intensity. The FRP values range from as low as ~12 MW to peaks of 1180.99 MW in Cluster 1 and 1422.02 MW in Cluster 2. Cluster 1 contains 23 active fire pixels with an average FRP of 246.3 ± 358.66 MW, while Cluster 2 comprises 15 pixels with a higher average FRP of 385.85 ± 432.32 MW, signifying more intense combustion activity. The dense smoke plumes emanating from both clusters are clearly visible in the OLCI imagery, dispersing southwestward over the Pacific Ocean. This integrated analysis of true-color imagery and FRP highlights both the visual extent and quantitative energy output of the wildfires, enabling better assessment of fire dynamics and environmental impact.
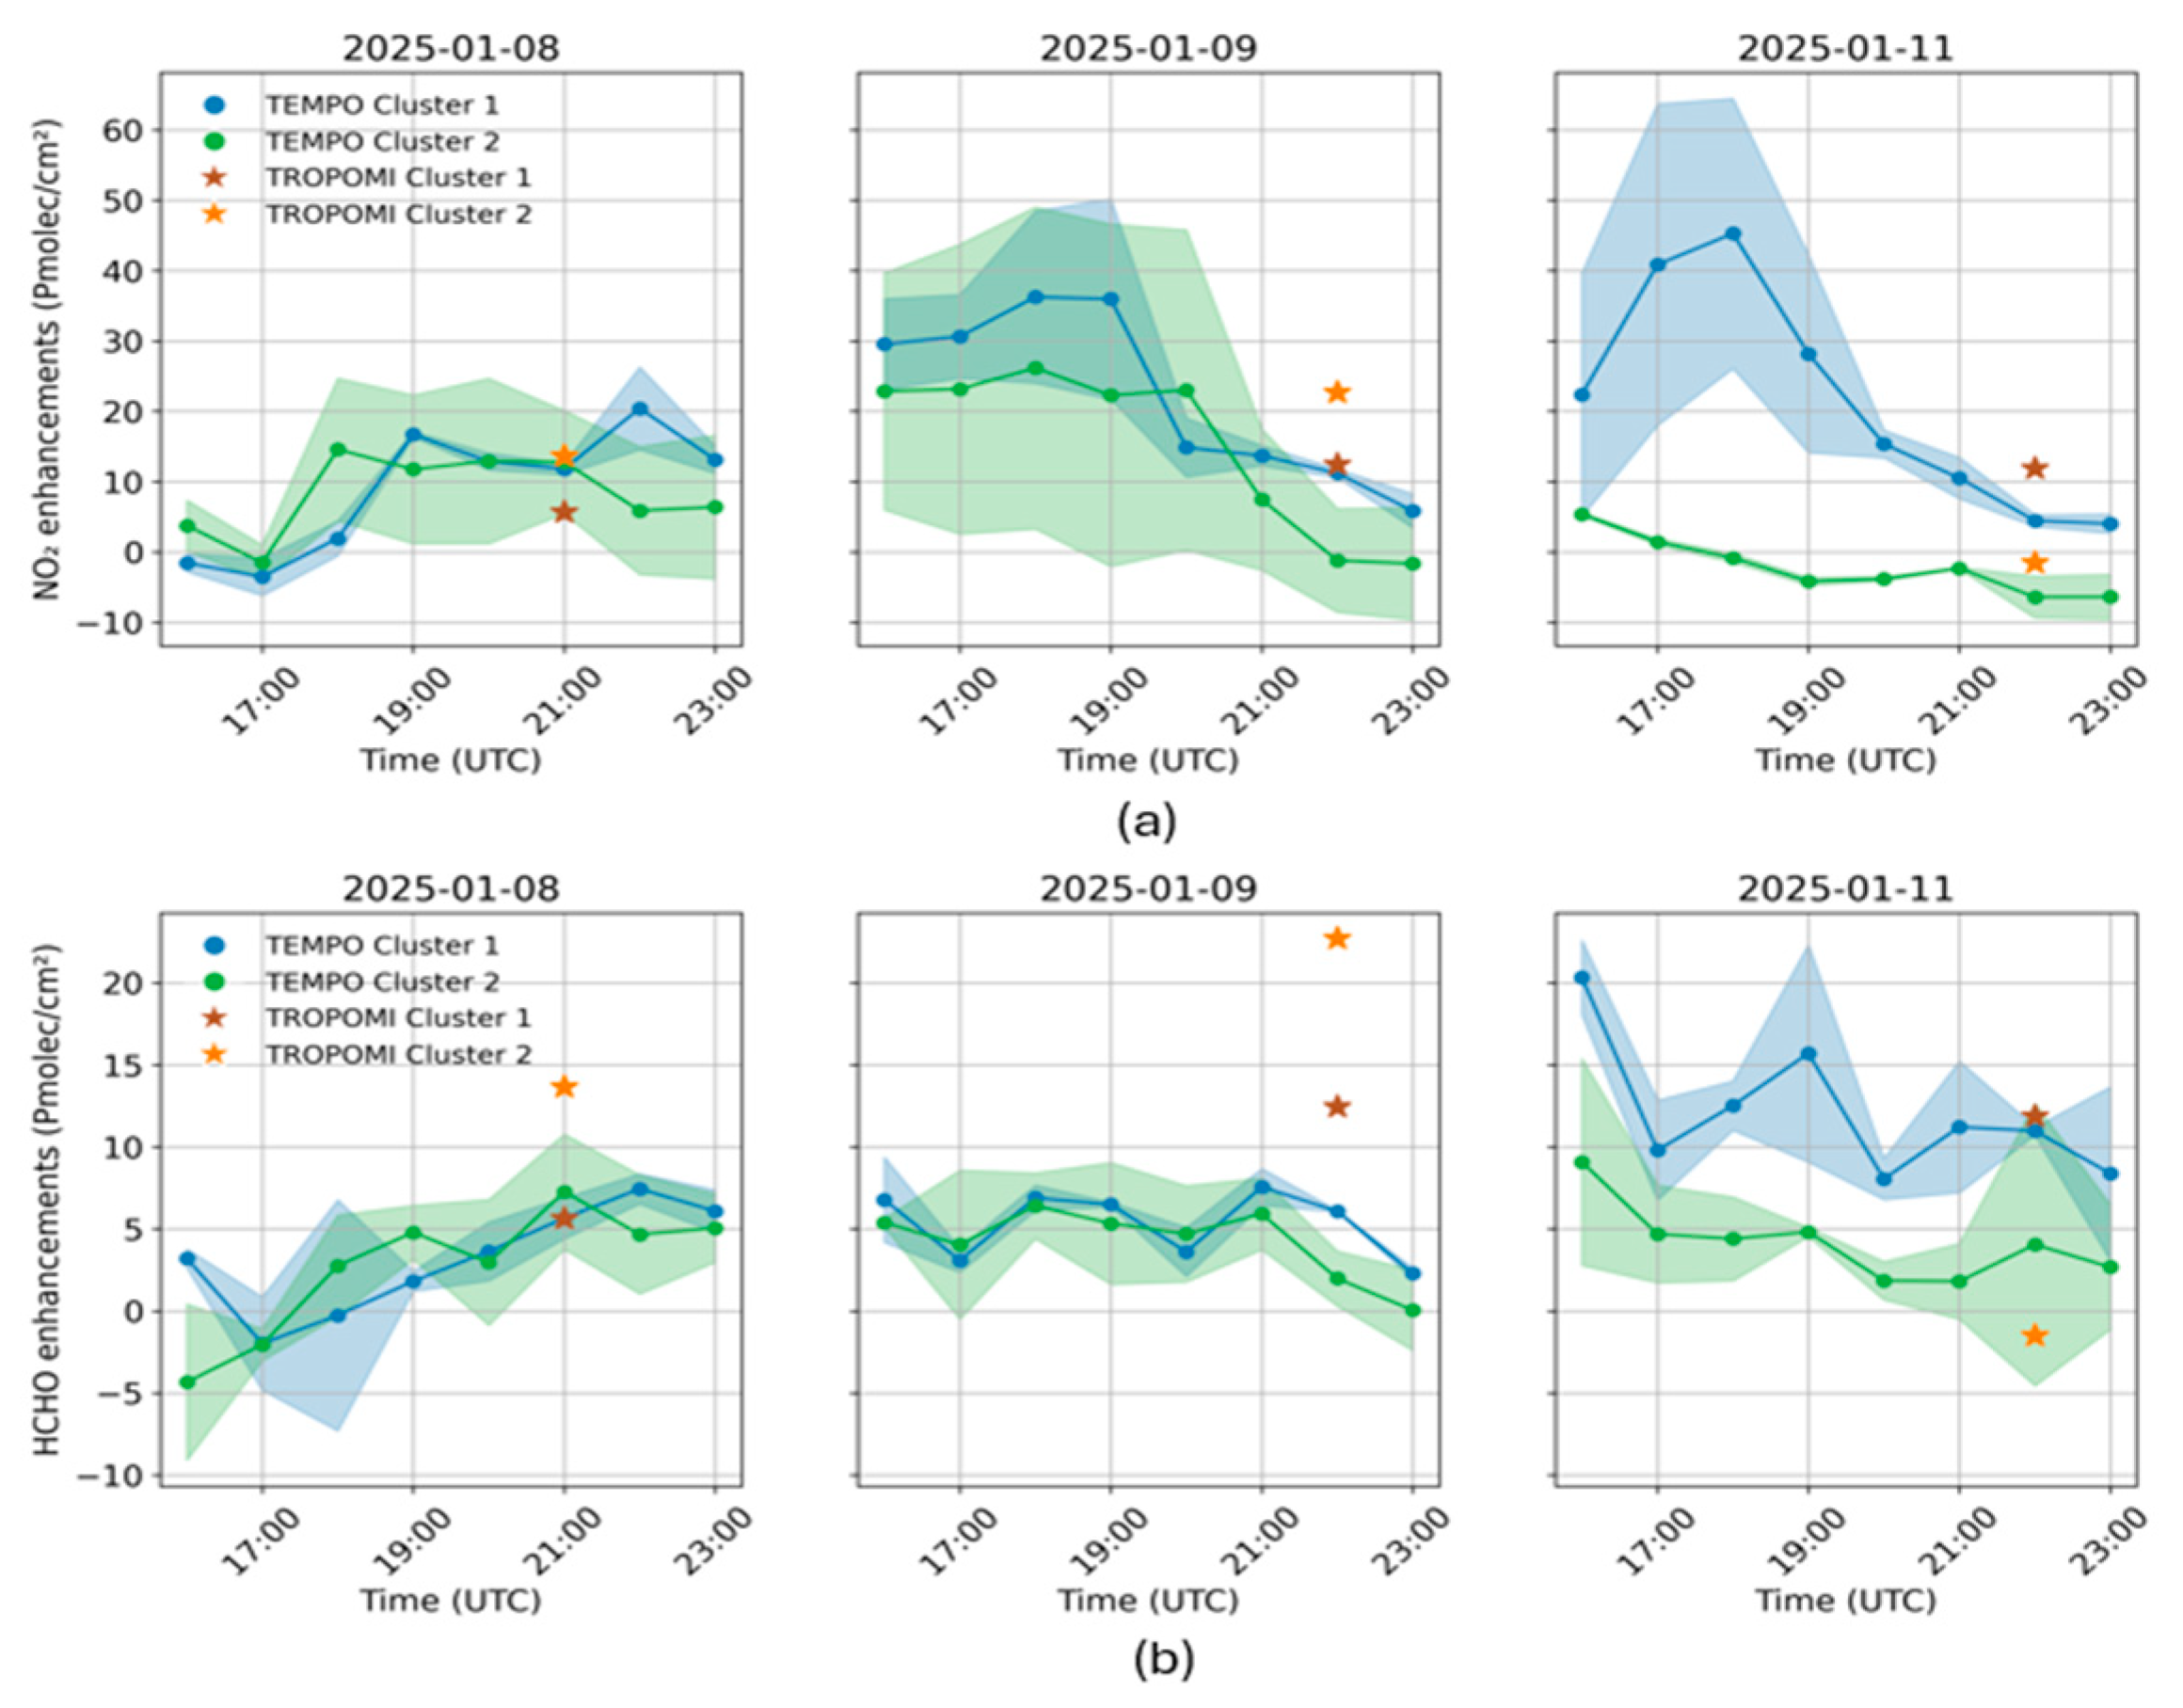
The diurnal variability of the TEMPO NO₂ and HCHO VCD enhancements within the fire-affected zones on January 8th, 9th and 11th are depicted in Figure 6, as blue lines for Cluster 1 and green lines for Cluster 2. Collocated average TROPOMI NO₂ and HCHO VCD enhancements are presented as brown (Cluster 1) and orange (Cluster 2) stars at the overpass time of the S5P satellite. A significant enhancement of the NO₂ columns is observed during all the examined fire days in Cluster 1, for both the TROPOMI and TEMPO instruments. Enhancements up to 20, 35 and 40 Pmolec/cm2 are reported on January 8th, 9th and 11th, respectively. TROPOMI NO₂ VCD enhancements in Cluster 1 (brown stars) are of similar magnitude with the corresponding TEMPO enhancements, approx. 10 Pmolec/cm2. TEMPO and TROPOMI NO₂ VCD enhancements in Cluster 2 (green line and orange stars) are stronger on January 8th and 9th, respectively, reaching up to 25 Pmolec/cm2, while the fire event seems to weaken on January 11th, resulting in negative enhancements over the Eaton cluster. The effect of photochemistry on the NO₂ VCDs during noon (20:00-23:00 UTC) on January 8th and 9th, respectively, is also noticeable when photolysis and reaction with the OH radical lead to the termination of NO₂. Overall, the strongest TROPOMI NO₂ VCD enhancements are reported on January 9th, with relative increments of ~161% and 255% for Cluster 1 and Cluster 2, respectively. TEMPO HCHO VCD enhancements (Figure 4) demonstrate a different diurnal distribution compared to the corresponding NO₂ enhancements. An increasing trend of HCHO VCD enhancements is observed on January 8th, peaking at 5 Pmolec/cm2, and remaining constant for both clusters on January 9th. HCHO VCD enhancements are significantly higher on January 11th, probably due to the consistent regeneration of HCHO from the breakdown of more enduring precursors within the fire plume [55]. TROPOMI HCHO VCD enhancements fall well in line within the TEMPO variability on January 8th and 11th, showcasing a strong agreement between the two sensors, but show stronger enhancements in both clusters on January 9 (up to ~25 Pmolec/cm2). TROPOMI HCHO VCD enhancements are stronger on January 9th, with increments of ~257% and 225% for Cluster 1 and Cluster 2, respectively. Differences between the enhancements of the two sensors should be expected due to the different implemented retrieval algorithms and the subtraction of different climatological averages from the observed columns. To the best of our knowledge, this is the first time that TEMPO observations have been utilized to analyze the diurnal profiles of atmospheric constituents due to wildfire events.
Complementary surface-based observations reported by [55] further substantiate the pronounced air-quality degradation associated with the Eaton Fire plume. Their analysis of PM₂.₅ and trace-gas relationships, based on both regulatory and low-cost sensor networks across the Los Angeles Basin, revealed highly elevated and spatially heterogeneous near-surface PM₂.₅ concentrations during the peak burning period. Daily mean PM₂.₅ levels reached 101.7 μg m⁻³ in downtown Los Angeles on January 8 and 52.3 μg m⁻³ in Compton on January 9. Meanwhile, neighborhood-scale PurpleAir sensors [56,57] located within a few kilometers of the fire perimeter reported concentrations exceeding 225 μg m⁻³, with hourly peaks surpassing 300 μg m⁻³—values classified as Hazardous by the U.S. EPA Air Quality Index [58].
4. Summary and Conclusions
The present study delivers a thorough analysis of the January 2025 Los Angeles wildfires, utilizing a synergistic suite of Earth observation tools, including TROPOMI, TEMPO, and ATLID from EarthCARE, complemented by ground-based AERONET sun photometers. The integration of these data sources enabled a detailed spatiotemporal and vertical characterization of the wildfire smoke plumes and their atmospheric impacts across Southern California and adjacent regions. In addition, auxiliary satellite observations from MODIS, OLCI, and Sentinel-3 were recognized as valuable complementary sources. These platforms provide enhanced temporal resolution, spectral diversity, and extended spatial coverage, which can support improved characterization of fire dynamic activity, surface reflectance changes, and aerosol interactions. We report substantial enhancements in tropospheric trace gases and aerosols directly linked to the fire events. Peak nitrogen dioxide (NO₂) vertical column densities (VCDs) reached 40 Pmolec/cm2, while formaldehyde (HCHO) enhancements were observed up to 25 Pmolec/cm2. These represented relative increases exceeding 250% in key burn clusters, as identified through Sentinel-3 fire radiative power (FRP) observations releasing thermal energy at levels above 1000 MW. The use of TEMPO’s high-temporal-resolution measurements captured these gas-phase pollutant variations on an hourly basis—revealing not only diurnal cycles of emissions but also chemical processing throughout the day, which would have otherwise remained unresolved with once-daily observations provided by polar orbiting sensors. Vertical profiling of aerosols from ATLID provided crucial insight into plume lofting, stratification, and aging. The smoke layers were found to be concentrated at altitudes between 1–3 km, with lidar ratio values peaking around 60 sr, indicative of fresh biomass-burning aerosols. Depolarization ratios further suggested a mixture of particles with spherical and non-spherical shapes —consistent with both primary smoke particles and secondary formation processes.
The combination of active and passive remote sensing, supported by ground observations, underscores the increasing utility of satellite data in characterizing complex wildfire events. The results emphasize the far-reaching impact of wildfires on regional air quality, especially under meteorological conditions such as strong Santa Ana winds that promote rapid fire spread and long-range pollutant transport. Observations indicated a temporary decline in anthropogenic emissions near the fire zones, likely due to large-scale evacuations and road closures—a phenomenon that further complicates emissions source attribution during extreme events. In light of increasing fire activity driven by climate change and urban expansion into fire-prone areas, this study reinforces the critical role of integrated remote sensing for atmospheric science, public health, and disaster management. The methodologies presented here offer a robust blueprint for future wildfire monitoring, rapid assessment, and policy-driven response in regions globally affected by extreme fire behavior.
Author Contributions
K.M.: Writing – review & editing, Writing – original draft, Supervision, Methodology, Investigation. A.P.: Writing – original draft, Visualization, Software, Investigation, Formal analysis. M.E.K: Writing – original draft, Visualization, Software, Investigation, Data processing. C.B.: Writing – original draft, Visualization, Software, Formal analysis, Data curation. D.B.: Review & editing, Supervision, Project administration, Funding acquisition, Conceptualization. All authors contributed by critically reviewing the manuscript during its preparation phase and gave final approval for publication.
Funding
This research received no external funding.
Institutional Review Board Statement
Not applicable.
Informed Consent Statement
Not applicable.
Data Availability Statement
The TROPOMI/S5P observations are currently publicly available from the Copernicus Data Space Ecosystem (https://dataspace.copernicus.eu/; Last access: 15 March 2025 (NO₂: http://doi.org/10.5270/S5P-9bnp8q8 and HCNO at: https://doi.org/10.5270/S5P-vg1i7t0). TEMPO L2 NO₂ tropospheric columns: NASA/LARC/SD/ASDC, TEMPO NO₂ tropospheric and stratospheric columns V03 (PROVISIONAL), available at: https://doi.org/10.5067/IS-40e/TEMPO/NO2_L2.003, accessed via: https://search.earthdata.nasa.gov/ (last access: 15 March 2025). EarthCARE ESA L2 collection (ATLID AER Level 2A, version AE; https://doi.org/10.57780/eca-bd87949) is available only to the EarthCARE Commissioning Team and to Principal and Co-Investigators of accepted proposals to the ESA Announcement of Opportunity for the Validation of EarthCARE (https://ec-pdgs-dissemination2.eo.esa.int/oads/access/; last access: 15 March 2025). The SLSTR/Sentinel-3 active fire data used in this study are available from (https://data.eumetsat.int/; last accessed: 15 March 2025). This work includes Copernicus Sentinel-3 OLCI data, accessed and visualized through the Ocean Virtual Laboratory (https://ovl.oceandatalab.com; last accessed: 15 March 2025), supported by the European Space Agency (ESA). We further acknowledge the use of imagery from the Worldview Snapshots application (https://wvs.earthdata.nasa.gov; last accessed: 15 March 2025) as part of the Earth Science Data and Information System (ESDIS).
Acknowledgments
Results presented in this work have been produced using the Aristotle University of Thessaloniki (AUTh) High Performance Computing Infrastructure and Resources. The authors would like to acknowledge the support provided by the IT Center of the Aristotle University of Thessaloniki (AUTh) throughout the progress of this research work.
Conflicts of Interest
The authors declare no conflicts of interest.
References
- Keeley Jon E., Flannigan Michael, Brown Tim J., Rolinski Tom, Cayan Daniel, Syphard Alexandra D., Guzman-Morales Janin, Gershunov Alexander: Climate and weather drivers in southern California Santa Ana Wind and non-Santa Wind fires. International Journal of Wildland Fire 33, WF23190, 2024. [CrossRef]
- Billmire Michael, French Nancy, H. F., Loboda Tatiana, Owen R. Chris, Tyner Marlene (2014) Santa Ana winds and predictors of wildfire progression in southern California. International Journal of Wildland Fire 23, 1119-1129. [CrossRef]
- Wan, N.; Xiong, X.; Kluitenberg, G. J., Hutchinson, J. M. S., Aiken, R., Zhao, H., and Lin, X.: Estimation of biomass burning emission of NO₂ and CO from 2019–2020 Australia fires based on satellite observations, Atmos. Chem. Phys., 23, 711–724, 2023. [CrossRef]
- van der Velde, I. R., van der Werf, G. R., Houweling, S., Eskes, H. J., Veefkind, J. P., Borsdorff, T., and Aben, I.: Biomass burning combustion efficiency observed from space using measurements of CO and NO₂ by the TROPOspheric Monitoring Instrument (TROPOMI), Atmos. Chem. Phys., 21, 597–616, 2021. [CrossRef]
- Koukouli, M.-E.; Pseftogkas, A.; Karagkiozidis, D.; Mermigkas, M.; Panou, T.; Balis, D. and Bais, A. (2025). Extreme wildfires over Northern Greece during Summer 2023 – Part B. Adverse effects on regional air quality. Atmospheric Research, [online] p.108034. [CrossRef]
- Magro, C.; Nunes, L.; Gonçalves, O.C.; Neng, N.R.; Nogueira, J.M.F.; Rego, F.C.; Vieira, P. Atmospheric Trends of CO and CH4 from Extreme Wildfires in Portugal Using Sentinel-5P TROPOMI Level-2 Data. Fire. 2021; 4(2):25. [CrossRef]
- Filonchyk, M.; Peterson, M.P. and Sun, D. (2022). Deterioration of air quality associated with the 2020 US wildfires. Science of The Total Environment, 826, p.154103. [CrossRef]
- Michailidis, K.; Garane, K.; Karagkiozidis, D.; Peletidou, G.; Voudouri, K.-A.; Balis, D. and Bais, A. (2024). Extreme wildfires over northern Greece during summer 2023 – Part A: Effects on aerosol optical properties and solar UV radiation. Atmospheric Research, [online] 311, p.107700. [CrossRef]
- Zoogman, P.; Liu, X.; Suleiman, R.; Pennington, W.; Flittner, D.; Al-Saadi, J. et al. (2017). Tropospheric Emissions: Monitoring of Pollution (TEMPO). Journal of Quantitative Spectroscopy and Radiative Transfer, 186, 17–39. [CrossRef]
- Burrows, J. P., Weber, M., Buchwitz, M., Rozanov, V., Ladstätter-Weißenmayer, A., Richter, A., DeBeek, R., Hoogen, R., Bramstedt, K., Eichmann, K.-U., Eisinger, M., & Perner, D. (1999). The Global Ozone Monitoring Experiment (GOME): Mission Concept and First Scientific Results. Journal of the Atmospheric Sciences, 56(2), 151–175.
- Bovensmann, H.; Burrows, J. P., Buchwitz, M., Frerick, J., Noël, S., Rozanov, V. V., Chance, K. V., & Goede, A. P. H. (1999). SCIAMACHY: Mission Objectives and Measurement Modes. Journal of the Atmospheric Sciences, 56(2), 127–150.
- Levelt, P. F., Joiner, J., Tamminen, J., et al. (2018). The Ozone Monitoring Instrument: overview of 14 years in space. Atmospheric Chemistry and Physics, 18(8), 5699-5745. [CrossRef]
- Munro, R.; Lang, R.; Klaes, D.; Poli, G.; Retscher, C.; Lindstrot, R.; Huckle, R.; Lacan, A.; Grzegorski, M.; Holdak, A.; Kokhanovsky, A.; Livschitz, J.; Eisinger, M. (2016). The GOME-2 instrument on the Metop series of satellites: Instrument design, calibration, and level 1 data processing—An overview. Atmospheric Measurement Techniques, 9(3), 1279–1301. [CrossRef]
- Flynn, L.; Long, C.; Wu, X.; Evans, R.; Beck, C. T., Petropavlovskikh, I., McConville, G., Yu, W., Zhang, Z., Niu, J., Beach, E., Hao, Y., Pan, C., Sen, B., Novicki, M., Zhou, S., & Seftor, C. (2014). Performance of the Ozone Mapping and Profiler Suite (OMPS) products. Journal of Geophysical Research: Atmospheres, 119, 6181–6195. [CrossRef]
- Veefkind, J. P., Aben, I., McMullan, K., et al., (2012). TROPOMI on the ESA Sentinel-5 Precursor: A GMES mission for global observations of the atmospheric composition for climate, air quality and ozone layer applications. Remote Sensing of Environment, 120, 70-83. [CrossRef]
- Kim, J.; Jeong, U.; Ahn, M. H., Kim, J. H., Park, R. J., Lee, H., Song, C. H., Choi, Y. S., Lee, K. H., Yoo, J. M., Jeong, M. J., Park, S. K., Lee, K. M., Song, C. K., Kim, S. W., Kim, Y. J., Kim, S. W., Kim, M., Go, S., … Choi, Y. (2020). New era of air quality monitoring from space: Geostationary environment monitoring spectrometer (GEMS). Bulletin of the American Meteorological Society, 101(1), E1–E22. [CrossRef]
- Nowlan, C. R., González Abad, G., Liu, X., Wang, H., & Chance, K. (2025). TEMPO Nitrogen Dioxide Retrieval Algorithm Theoretical Basis Document. NASA Algorithm Publication Tool. [CrossRef]
- González Abad G., Caroline Nowlan, Huiqun (Helen) Wang, Heesung Chong, John Houck, Xiong Liu and Kelly Chance, TROPOSPHERIC EMISSIONS: MONITORING OF POLLUTION (TEMPO) PROJECT, Trace Gas and Cloud Level 2 and 3 Data Products User Guide, December 9, 2024, version 1.2, TEMPO_Level-2-3_trace_gas_clouds_user_guide_V1.2.pdf, last access: 12.03.2025.
- González Abad, G.; Nowlan, C. R., Liu, X., Wang, H., & Chance, K. (2025), TEMPO Formaldehyde Retrieval Algorithm Theoretical Basis Document, NASA Algorithm Publication Tool. [CrossRef]
- van Geffen, J.; Eskes, H.; Compernolle, S.; Pinardi, G.; Verhoelst, T.; Lambert, J.-C.; Sneep, M.; ter Linden, M.; Ludewig, A.; Boersma, K. F., and Veefkind, J. P.: Sentinel-5P TROPOMI NO₂ retrieval: impact of version v2.2 improvements and comparisons with OMI and ground-based data, Atmos. Meas. Tech., 15, 2037–2060, 2022. [CrossRef]
- Vigouroux, C.; Langerock, B.; Bauer Aquino, C. A., Blumenstock, T., De Mazière, M., De Smedt, I., Grutter, M., Hannigan, J., Jones, N., Kivi, R., Lutsch, E., Mahieu, E., Makarova, M., Metzger, J. M., Morino, I., Murata, I., Nagahama, T., Notholt, J., Ortega, I., Palm, M., Pinardi, G., Röhling, A., Smale, D., Stremme, W., Strong, K., Sussmann, R., Té, Y., van Roozendael, M., Wang, P., and Winkler, H.: TROPOMI/S5P formaldehyde validation using an extensive network of ground-based FTIR stations, Atmos. Meas. Tech., 13, 3751–3767, 2020. [CrossRef]
- Landgraf, J., aan de Brugh, J., Scheepmaker, R., Borsdorff, T., Hu, H., Houweling, S., Butz, A., Aben, I., and Hasekamp, O.: Carbon monoxide total column retrievals from TROPOMI shortwave infrared measurements, Atmos. Meas. Tech., 9, 4955–4975, 2016. [CrossRef]
- Lorente, A.; Borsdorff, T.; Martinez-Velarte, M. C., Butz, A., Hasekamp, O. P., Wu, L., and Landgraf, J.: Evaluation of the methane full-physics retrieval applied to TROPOMI ocean sun glint measurements, Atmos. Meas. Tech., 15, 6585–6603, 2022. [CrossRef]
- de Graaf, M.; Sneep, M.; ter Linden, M.; Tilstra L. G., Donovan, D. P., van Zadelhoff, G.-J., and Veefkind, J. P.: Improvements in aerosol layer height retrievals from TROPOMI oxygen A-band measurements by surface albedo fitting in optimal estimation, Atmos. Meas. Tech., 18, 2553–2571, 2025. [CrossRef]
- Lambert, J.-C. A. Keppens, S. Compernolle, K.-U. Eichmann, M. de Graaf, D. Hubert, B. Langerock, M.K. Sha, E. van der Plas, T. Verhoelst, T. Wagner, C. Ahn, A. Argyrouli, D. Balis, K.L. Chan, M. Coldewey-Egbers, I. De Smedt, H. Eskes, A.M. Fjæraa, K. Garane, J.F. Gleason, J. Granville, P. Hedelt, K.-P. Heue, G. Jaross, M.E. Koukouli, E. Loots, R. Lutz, M.C Martinez Velarte, K. Michailidis, A. Pseftogkas, S. Nanda, S. Niemeijer, A. Pazmiño, G. Pinardi, A. Richter, N. Rozemeijer, M. Sneep, D. Stein Zweers, N. Theys, G. Tilstra, C. Topaloglou, O. Torres, P. Valks, J. van Geffen, C. Vigouroux, P. Wang, and M. Weber, Quarterly Validation Report of the Copernicus Sentinel-5 Precursor Operational Data Products #28: April 2018 – August 2025, S5P MPC Routine Operations Consolidated Validation Report series, Issue #28, Version 28.00.00, 227 pp., 15 September 2025. https://mpc-vdaf.tropomi.eu/ProjectDir/reports//pdf/S5P-MPC-IASB-ROCVR-28.00.00_FINAL_signed-jcl-AD.pdf last access: 04.11.2025.
- Eskes, H.; Jos van Geffen Folkert Boersma Kai-Uwe Eichmann Arnoud Apituley Mattia Pedergnana Maarten Sneep, J. Pepijn Veefkind, and Diego Loyola, Sentinel-5 precursor/TROPOMI Level 2 Product User Manual, S5P-KNMI-L2-0021-MA, CI-7570-PUM, 4.4.0, 2024-11-08. https://sentiwiki.copernicus.eu/web/s5p-products last access: 31 March 2025.
- Romahn, F., Pedergnana, M., Loyola, D., Apituley, D., Sneep, M., Veefkind, P., Sentinel-5 precursor/TROPOMI Level 2 Product User Manual Formaldehyde HCHO, Report S5P-L2-DLR-PUM-400F, version v.02.04.00, ESA, 2022. https://sentinel.esa.int/documents/247904/2474726/Sentinel-5P-Level-2-Product-User-Manual-Formaldehyde (last accessed on February 20, 2023).
- Zhou, S.; Collier, S.; Jaffe, D. A., Briggs, N. L., Hee, J., Sedlacek III, A. J., Kleinman, L., Onasch, T. B., and Zhang, Q.: Regional influence of wildfires on aerosol chemistry in the western US and insights into atmospheric aging of biomass burning organic aerosol, Atmos. Chem. Phys., 17, 2477–2493, 2017. [CrossRef]
- IPCC (2021). Climate Change 2021: The Physical Science Basis. Contribution of Working Group I to the Sixth Assessment Report of the Intergovernmental Panel on Climate Change. In: Masson-Delmotte, V.; Zhai, P.; Pirani, A.; Connors, S.L.; et al. (eds). Cambridge University Press. [CrossRef]
- Pandis, S. N., Harley R. A., Cass G. R. and Seinfeld J. H. (1992) Secondary Organic Aerosol Formation and Transport, Atmospheric Environment, 26, 2266 2282.
- Hallquist, M.; Wenger, J. C., Baltensperger, U., Rudich, Y., Simpson, D., Claeys, M., Dommen, J., Donahue, N. M., George, C., Goldstein, A. H., Hamilton, J. F., Herrmann, H., Hoffmann, T., Iinuma, Y., Jang, M., Jenkin, M. E., Jimenez, J. L., Kiendler-Scharr, A., Maenhaut, W., McFiggans, G., Mentel, Th. F., Monod, A., Prévôt, A. S. H., Seinfeld, J. H., Surratt, J. D., Szmigielski, R., and Wildt, J.: The formation, properties and impact of secondary organic aerosol: current and emerging issues, Atmos. Chem. Phys., 9, 5155–5236, 2009. [CrossRef]
- Stein Zweers, D.C, 2022. TROPOMI ATBD of the UV Aerosol Index, Royal Netherlands Meteorological Institute, S5P-KNMI-L2-0008-RP issue 2.1.0, 22 July 2022, TROPOMI ATBD of the UV Aerosol Index, (last access: 15 April 2025).
- de Graaf, M. and Stammes, P.: SCIAMACHY Absorbing Aerosol Index – calibration issues and global results from 2002–2004, Atmos. Chem. Phys., 5, 2385–2394, 2005. [CrossRef]
- Apituley, A.; Pedergnana, M.; Sneep, M.; Veefkind, J. P., Loyola, D., and Zweers, D. S.: Sentinel-5 precursor/TROPOMI level 2 product user manual UV aerosol index. https://sentinels.copernicus.eu/documents/247904/2474726/ Sentinel-5P-Level-2-Product-User-Manual-Aerosol-Index-product (last access: 2 July 2025), 2022.
- Nanda, S.; de Graaf, M.; Sneep, M.; de Haan, J. F., Stammes, P., Sanders, A. F. J., Tuinder, O., Veefkind, J. P., and Levelt, P. F.: Error sources in the retrieval of aerosol information over bright surfaces from satellite measurements in the oxygen A band, Atmos. Meas. Tech., 11, 161–175, 2018. [CrossRef]
- de Graaf, M.; Sneep, M.; ter Linden, M.; Tilstra L. G., Donovan, D. P., van Zadelhoff, G.-J., and Veefkind, J. P.: Improvements in aerosol layer height retrievals from TROPOMI oxygen A-band measurements by surface albedo fitting in optimal estimation, Atmos. Meas. Tech., 18, 2553–2571, 2025. [CrossRef]
- Apituley, A.; Pedergnana, M.; Sneep, M.; Veefkind, J. P., Loyola, D., Sanders, B., and de Graaf, M., 2024b. Sentinel-5 precursor/TROPOMI Level 2 Product User Manual Aerosol Layer Height, S5P-KNMI-L2-0022-MA, issue 2.8.0, 08 November 2024, CI-7570-PUM, [online]. https://sentiwiki.copernicus.eu/web/s5p-products(last access: 15 March 2025).
- Michailidis, K.; Koukouli, M.-E.; Balis, D.; Veefkind, J. P., de Graaf, M., Mona, L., Papagianopoulos, N., Pappalardo, G., Tsikoudi, I., Amiridis, V., Marinou, E., Gialitaki, A., Mamouri, R.-E., Nisantzi, A., Bortoli, D., João Costa, M., Salgueiro, V., Papayannis, A., Mylonaki, M., Alados-Arboledas, L., Romano, S., Perrone, M. R., and Baars, H.: Validation of the TROPOMI/S5P aerosol layer height using EARLINET lidars, Atmos. Chem. Phys., 23, 1919–1940, 2023. [CrossRef]
- Xu Weidong, Wooster Martin J., He Jiangping, Zhang Tianran, First study of Sentinel-3 SLSTR active fire detection and FRP retrieval: Night-time algorithm enhancements and global intercomparison to MODIS and VIIRS AF products, Remote Sensing of Environment, Volume 248, 2020, 111947, ISSN 0034-4257. [CrossRef]
- Donlon, C.; Berruti, B.; Buongiorno, A.; Ferreira, M.H.; Féménias, P. Frerick, F., Goryl, P., Klein, U., Laur, H., Mavrocordatos, C., Nieke, J., Rebhan, H., Seitz, B., Stroede, J., Sciarra R.: The Global Monitoring for Environment and Security (GMES) Sentinel-3 mission, Remote Sens. Environ., 120 (2012), pp. 37-57.
- Illingworth, A. J., Barker, H. W., Beljaars, A., Ceccaldi, M., Chepfer, H., Clerbaux, N., Cole, J., Delanoë, J., Domenech, C., Donovan, D. P., Fukuda, S., Hirakata, M., Hogan, R. J., Huenerbein, A., Kollias, P., Kubota, T., Nakajima, T., Nakajima, T. Y., Nishizawa, T., Ohno, Y., Okamoto, H., Oki, R., Sato, K., Satoh, M., Shephard, M. W., Velázquez-Blázquez, A., Wandinger, U., Wehr, T., and van Zadelhoff, G.-J.: The EarthCARE Satellite: The Next Step Forward in Global Measurements of Clouds, Aerosols, Precipitation, and Radiation, B. Am. Meteorol. Soc., 96, 1311–1332, 2015. [CrossRef]
- van Zadelhoff, G.-J.; Donovan, D. P., and Wang, P.: Detection of aerosol and cloud features for the EarthCARE atmospheric lidar (ATLID): the ATLID FeatureMask (A-FM) product, Atmos. Meas. Tech., 16, 3631–3651, 2023. [CrossRef]
- Wehr, T., Kubota, T., Tzeremes, G., Wallace, K., Nakatsuka, H., Ohno, Y., Koopman, R., Rusli, S., Kikuchi, M., Eisinger, M., Tanaka, T., Taga, M., Deghaye, P., Tomita, E., and Bernaerts, D.: The EarthCARE mission – science and system overview, Atmos. Meas. Tech., 16, 3581–3608, 2023. [CrossRef]
- Donovan, D. P., van Zadelhoff, G.-J., and Wang, P.: The EarthCARE lidar cloud and aerosol profile processor (A-PRO): the A-AER, A-EBD, A-TC, and A-ICE products, Atmos. Meas. Tech., 17, 5301–5340, 2024. [CrossRef]
- Eisinger, M., Marnas, F., Wallace, K., Kubota, T., Tomiyama, N., Ohno, Y., Tanaka, T., Tomita, E., Wehr, T., and Bernaerts, D.: The EarthCARE mission: science data processing chain overview, Atmos. Meas. Tech., 17, 839–862, 2024. [CrossRef]
- Seinfeld, J. H., & Pandis, S. N. (2016). Atmospheric Chemistry and Physics: From Air Pollution to Climate Change (3rd ed.). Wiley. [ISBN: 978-1-118-94740-1].
- Jacob, D.J. (2000). Heterogeneous chemistry and tropospheric ozone. Atmospheric Environment, 34(12-14), 2131-2159. [CrossRef]
- Lamsal, L. N., Krotkov, N. A., Celarier, E. A., et al. (2015). Evaluation of OMI operational standard NO₂ column retrievals using in situ and surface-based NO₂ observations. Atmospheric Chemistry and Physics, 14(21), 11587-11609. [CrossRef]
- Duncan, B. N., Lamsal, L. N., Thompson, A. M., et al. (2016). A space-based, high-resolution view of notable changes in urban NO₂ pollution around the world (2005–2014). Journal of Geophysical Research: Atmospheres, 121(2), 976-996. [CrossRef]
- Krotkov, N. A., McLinden, C. A., Li, C., Lamsal, L. N., et al. (2016). Aura OMI observations of regional SO₂ and NO₂ pollution changes from 2005 to 2015. Atmospheric Chemistry and Physics, 16(7), 4605-4629. [CrossRef]
- van Geffen, J.H.G.M., H.J. Eskes, K.F. Boersma and J.P. Veefkind, TROPOMI ATBD of the total and tropospheric NO2 data products, document number: S5P-KNMI-L2-0005-RP, CI identification:CI-7430-ATBD, issue: 2.8.0, date: 2024-11-18, status: released, TROPOMI ATBD of the total and tropospheric NO2 data products, last accessed: 04.11.2025.
- De Smedt, Isabelle, Nicolas Theys, Jonas Vlietinck, Huan Yu, Thomas Danckaert, Christophe Lerot, Michel Van Roozendael, S5P/TROPOMI HCHO ATBD, document number: S5P- BIRA-L2-400F-ATBD, CI identification: CI-400F-ATBD, issue: 2.7.0, date: 2024-10-01, status: Update for the version 2.7.0 of the operational processor, S5P Documents, last accessed: 04.11.2025.
- Szykman James, R. Bradley Pierce, Barron Henderson and Laura Judd, for the TEMPO Validation Team and TEMPO Ad-hoc Validation Working Group, Validation and Quality Assessment of the TEMPO Level-2 Trace Gas Products, SAO-DRD-XX, version: Baseline, release date: September 15, 2025. https://asdc.larc.nasa.gov/documents/tempo/TEMPO_validation_report_baseline_draft.pdf last accessed: 30.10.2025.
- Stavrakou, T., Müller, J.-F., Bauwens, M., De Smedt, I., Van Roozendael, M., De Mazière, M., Vigouroux, C., Hendrick, F., George, M., Clerbaux, C., Coheur, P.-F., and Guenther, A.: How consistent are top-down hydrocarbon emissions based on formaldehyde observations from GOME-2 and OMI?, Atmos. Chem. Phys., 15, 11861–11884, 2015. [CrossRef]
- Eke, M., Cingiroglu, F., Kaynak, B.: Investigation of 2021 wildfire impacts on air quality in southwestern Turkey,Atmospheric Environment,Volume 325, 2024, 120445,ISSN 1352-2310. [CrossRef]
- Schollaert, C.; Connolly, R.; Cushing, L.; Jerrett, M.; Liu, T.; Marlier, M. Air Quality Impacts of the January 2025 Los Angeles Wildfires: Insights from Public Data Sources. Environ. Sci. Technol. Lett. 2025, 12, 911–917. [CrossRef]
- Bi, J.; Wallace, L. A., Sarnat, J. A., and Liu, Y.: Characterizing outdoor infiltration and indoor contribution of PM2.5 with citizen-based low-cost monitoring data, Environ. Pollut., 276, 116763. [CrossRef]
- Wallace, L.; Bi, J.; Ott, W. R., Sarnat, J., and Liu, Y.: Calibration of low-cost PurpleAir outdoor monitors using an improved method of calculating PM2.5, Atmos. Environ., 256, 118432, 2021. [CrossRef]
- U.S. Environmental Protection Agency (EPA). Technical Assistance Document for the Reporting of Daily Air Quality – the Air Quality Index (AQI) (EPA-454/B-16-002). U.S. Environmental Protection Agency, Office of Air Quality Planning and Standards (2016).
Figure 1.
Satellite-based observations of wildfire smoke over Southern California from January 8 to 11, 2025. (Top row) True-color images taken by VIIRS aboard Suomi-NPP, illustrating the spread and movement of smoke plumes. (Middle row) Aerosol Index (UVAI) from TROPOMI/S5P indicating absorbing aerosol presence, with elevated values corresponding to dense smoke regions. (Bottom row): Aerosol Layer Height (ALH) retrieved from TROPOMI, revealing the vertical distribution of smoke plumes.
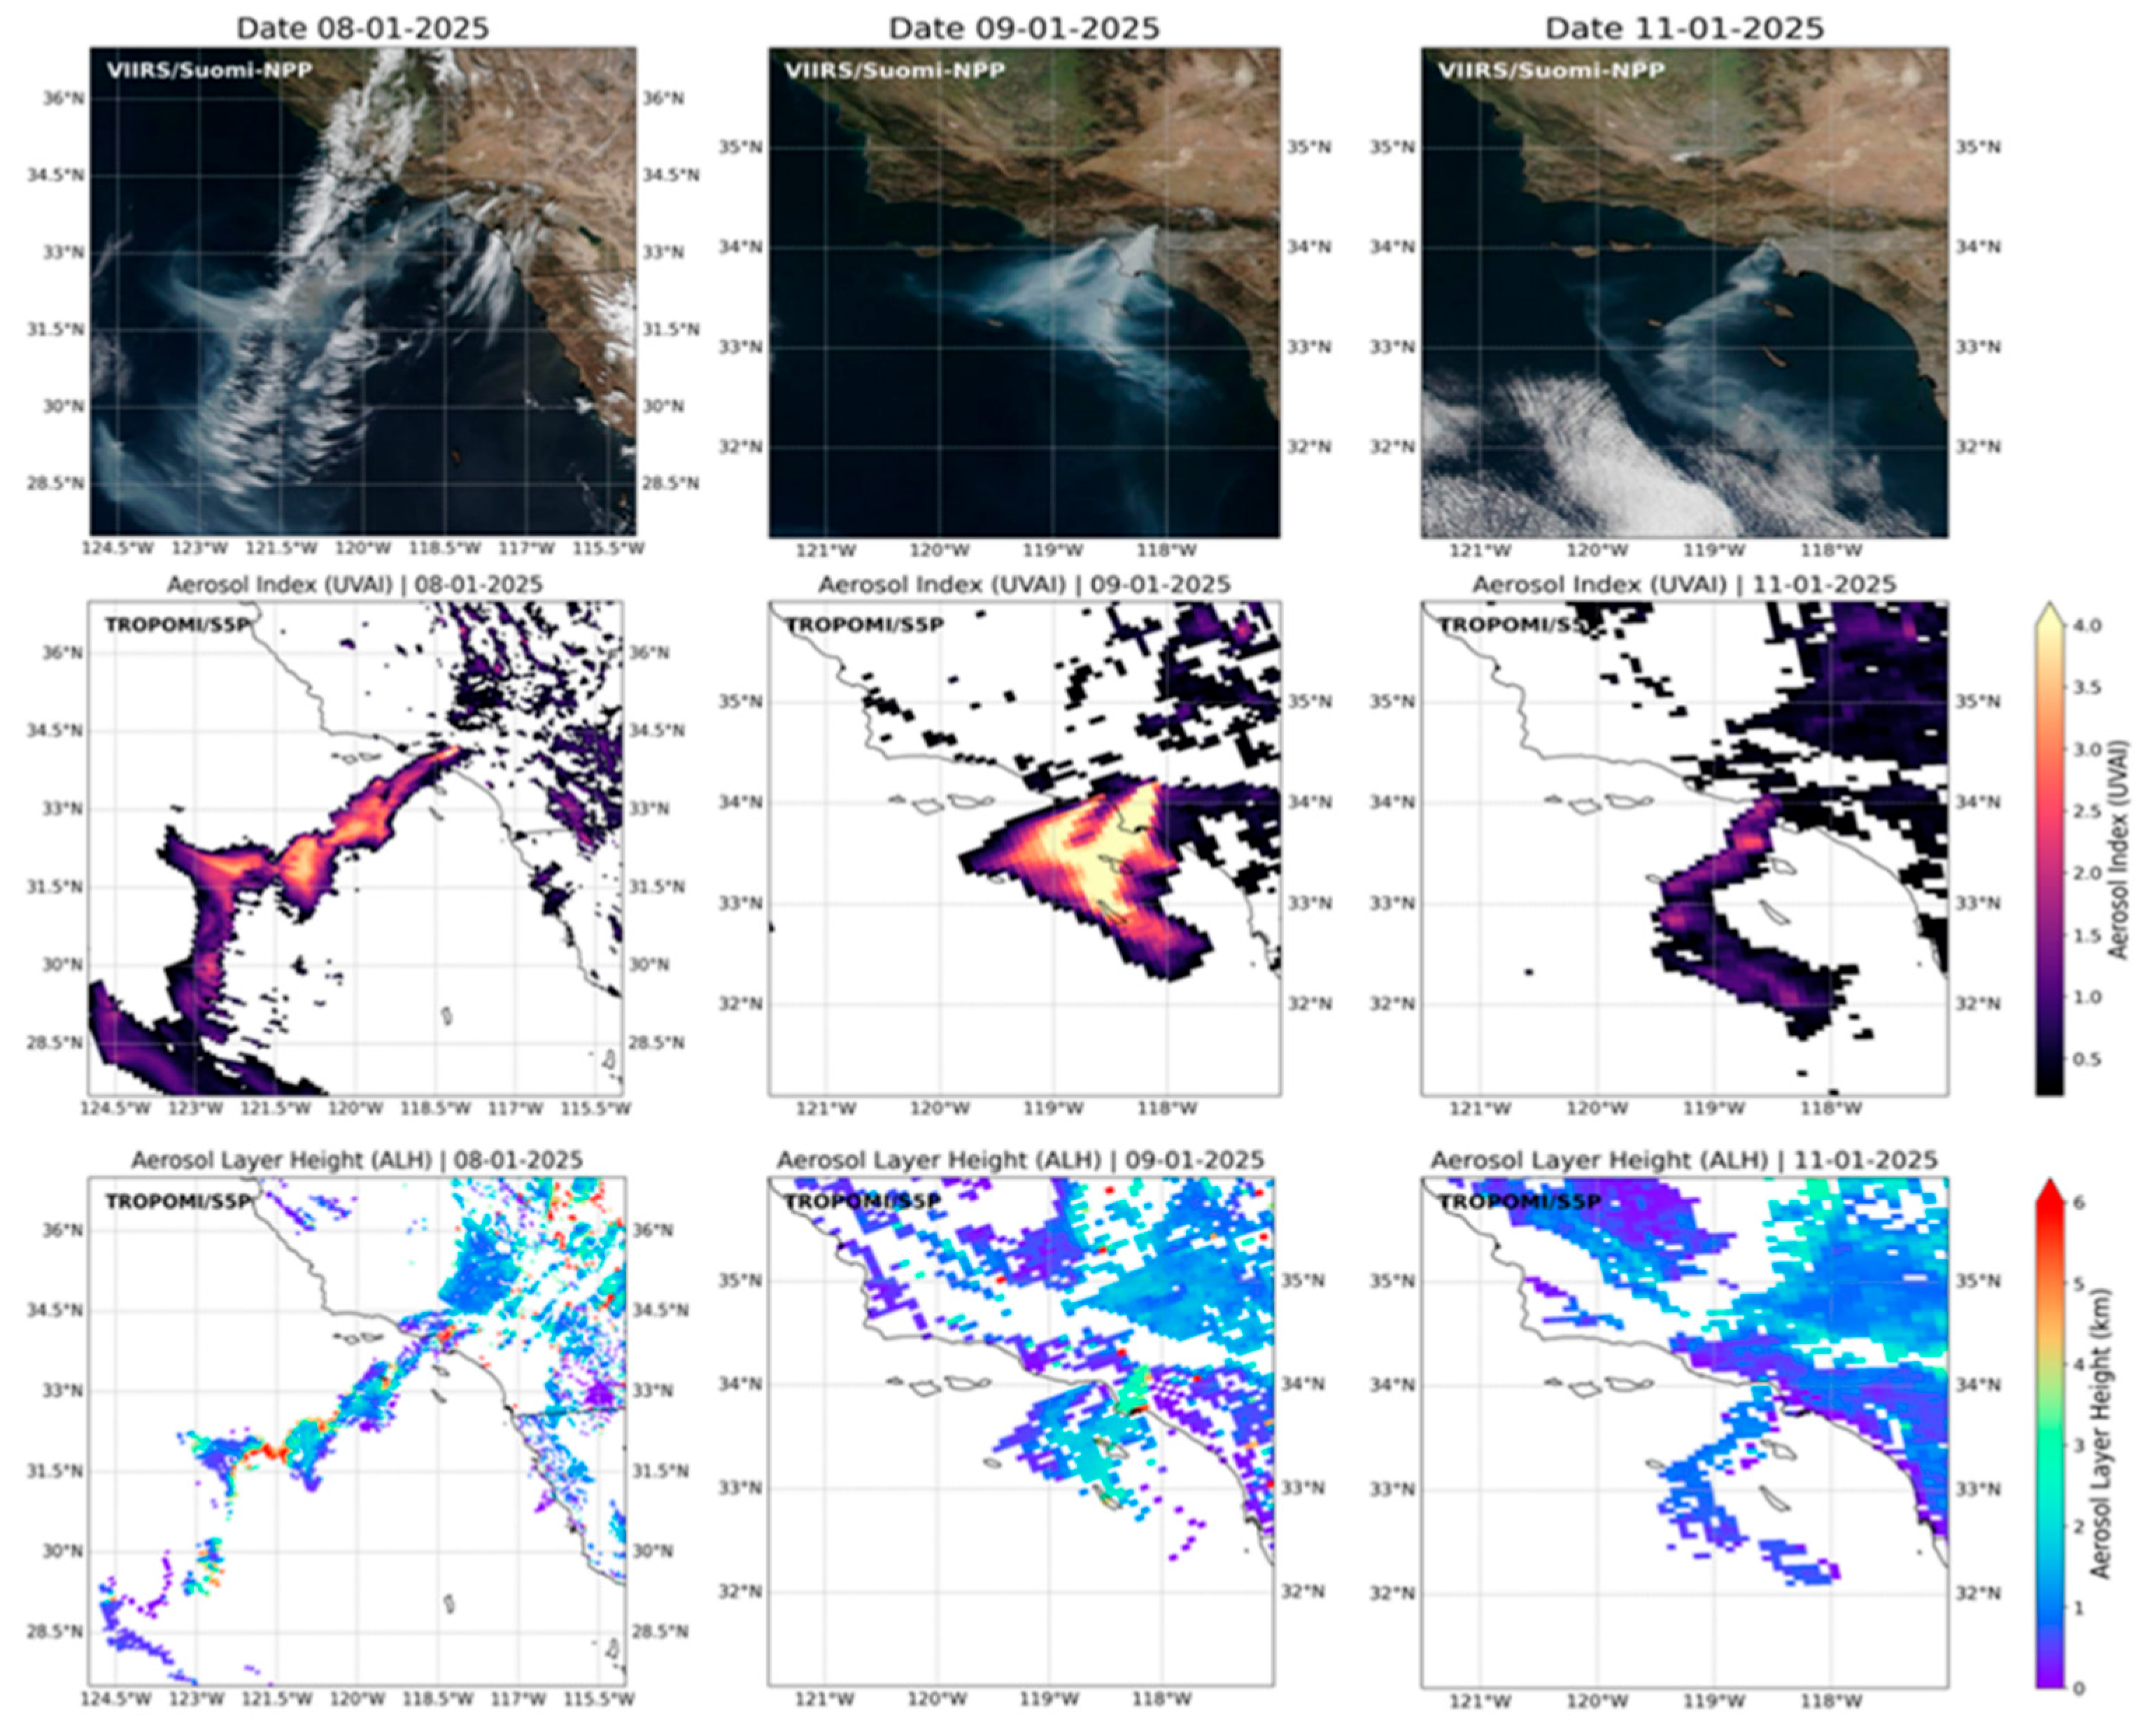
Figure 2.
(a) MODIS/Aqua true color map showing the associated EarthCare overpass on January 11, 2025. (b) Vertical distribution of EarthCare’s Low-Resolution Target Classification. The magenta line indicates the satellite orbit track in ascending mode. (c) Vertical distribution of ATLID aerosol products (from left to right: particle backscatter and extinction coefficients, lidar ratio and linear particle depolarization ratio at 355nm) at the same location as the dotted white color marked on the overpass.
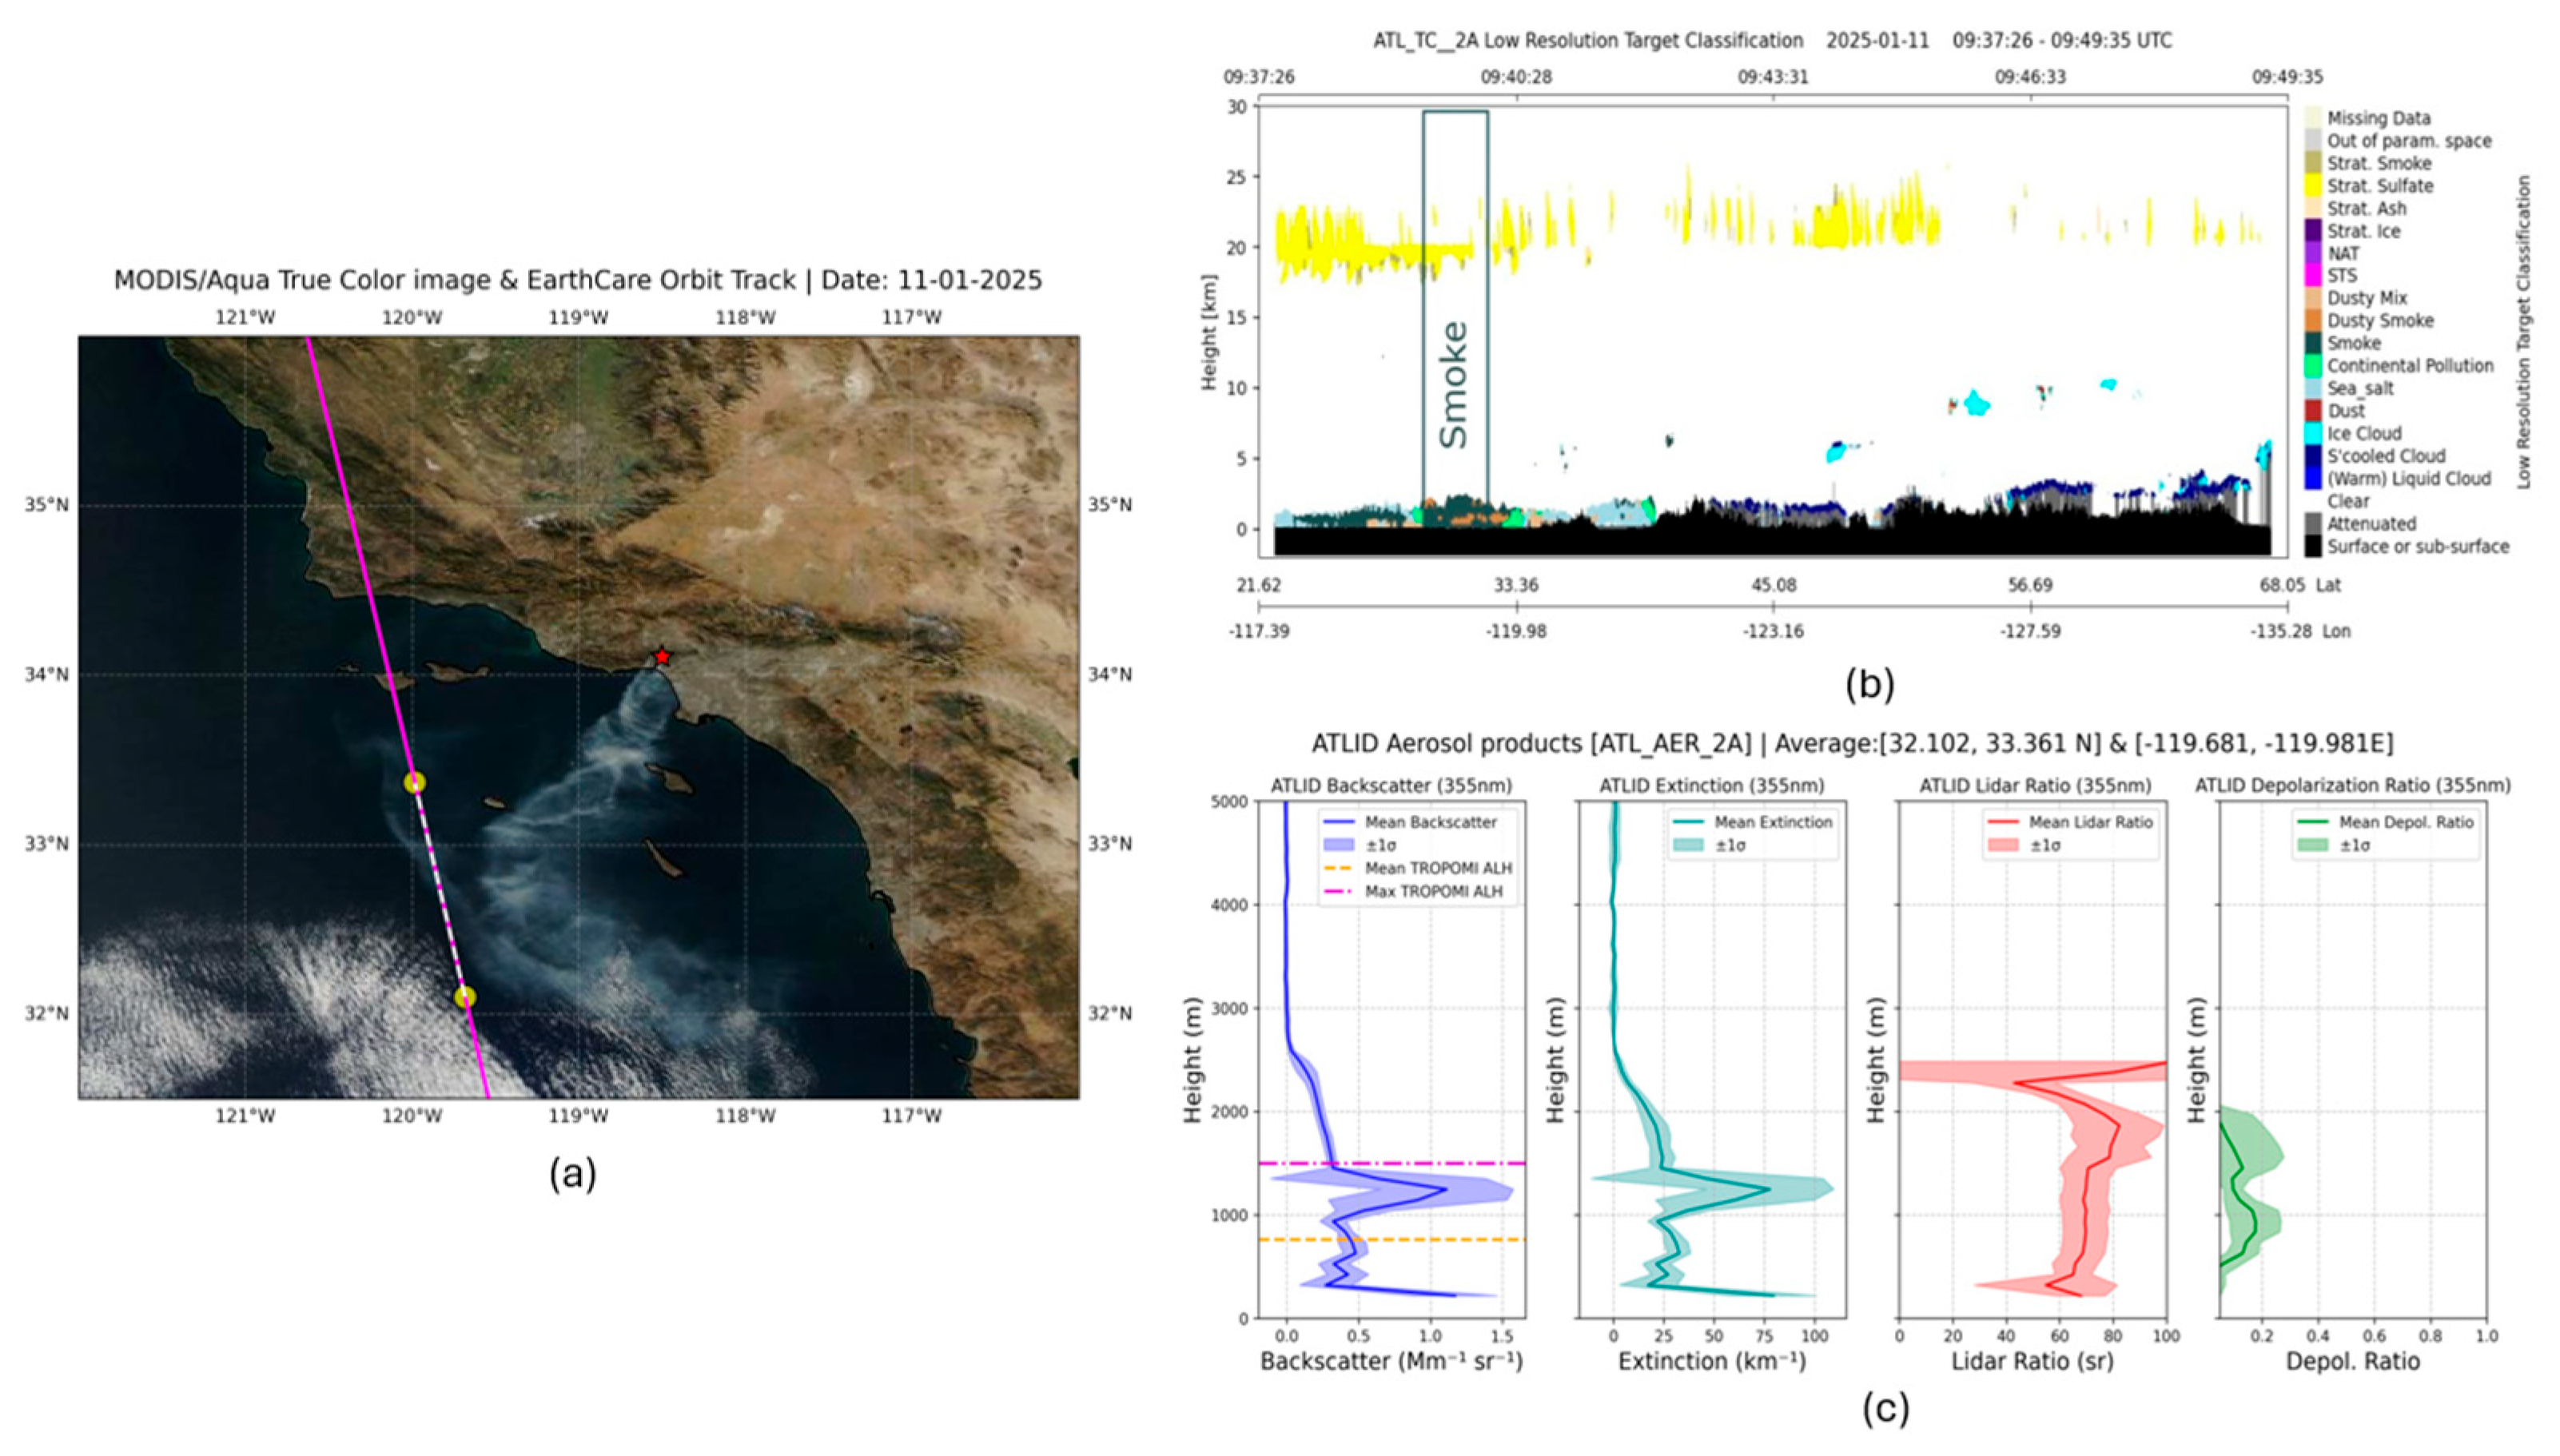
Figure 3.
Evolution of the tropospheric NO₂ plume from the L.A. January 2025 fires as seen by TROPOMI (a, b and c) & TEMPO (d, e and f) for 20:00 UTC on the 8th, the 9th and the 11th of January 2025. The NO₂ VCD is provided as an enhancement, i.e., an absolute difference from the climatological mean of January 2024, for visual purposes.
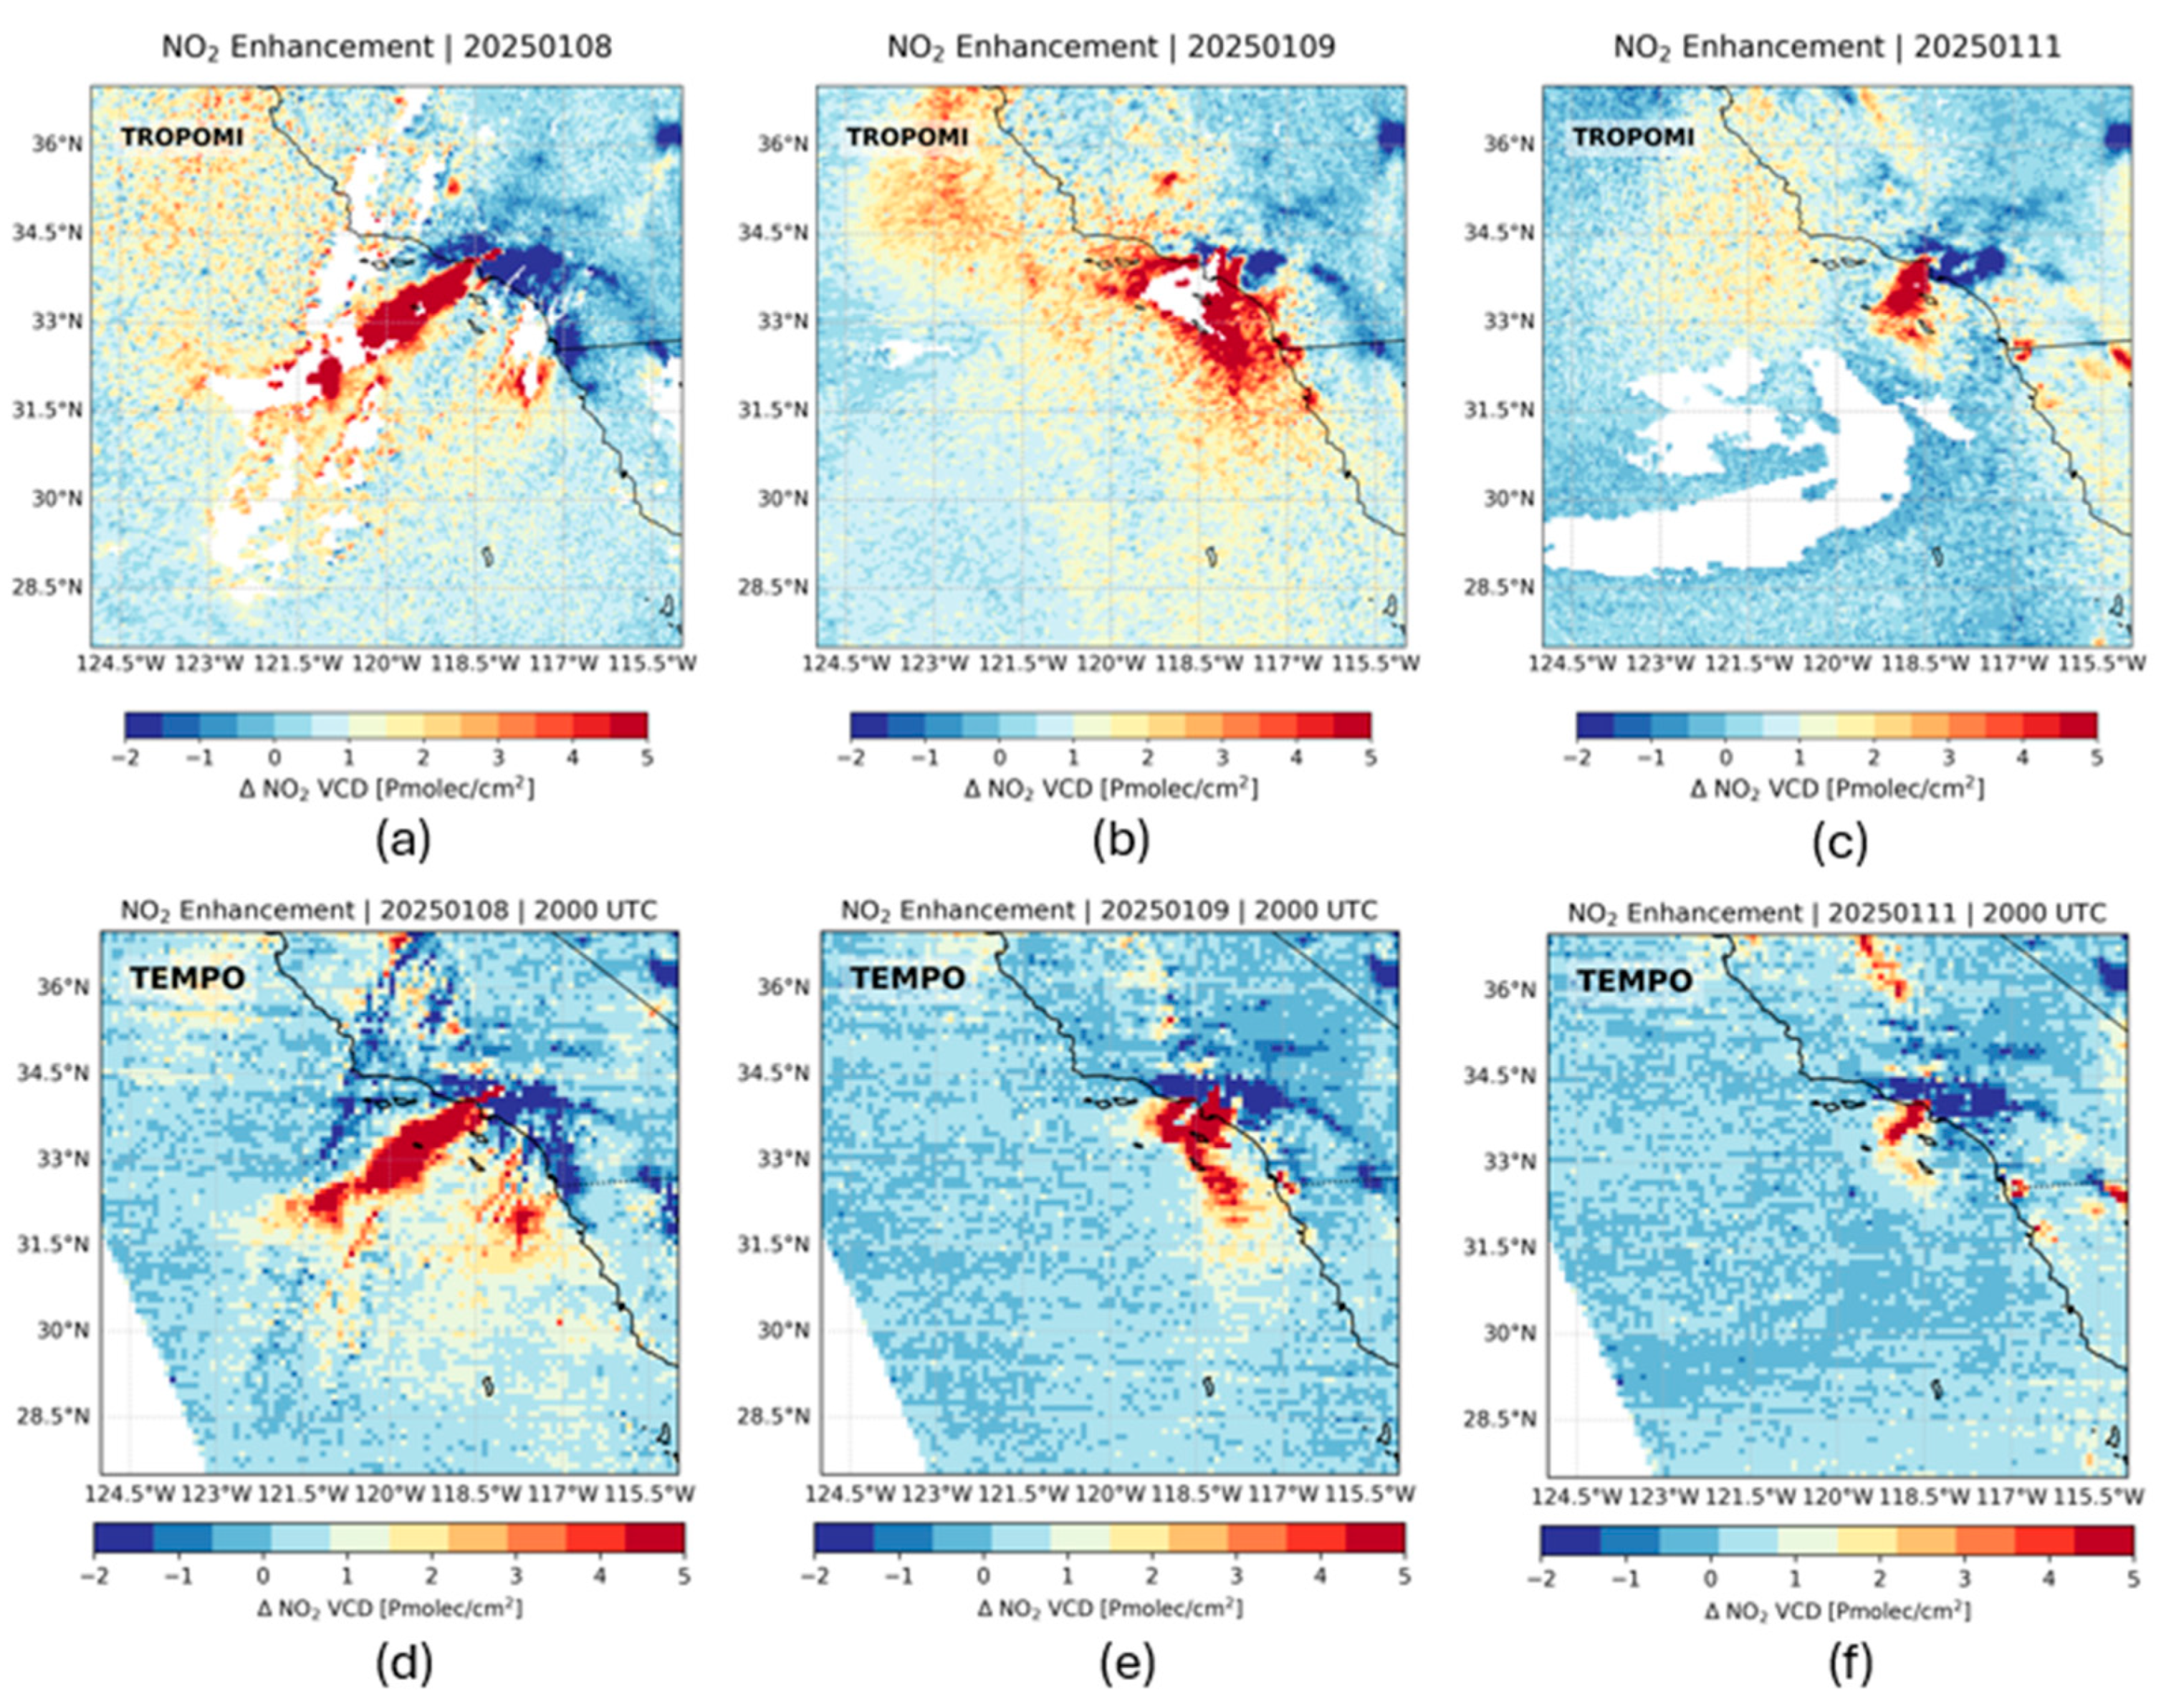
Figure 4.
Evolution of the formaldehyde plume from the L.A. January 2025 fires as seen by TROPOMI (a, b and c) & TEMPO (d, e and f) for 20:00 UTC on the 8th, the 9th and the 11th of January 2025. The HCHO VCD is provided as an enhancement, i.e., an absolute difference from the climatological means of January 2024, for visual purposes.
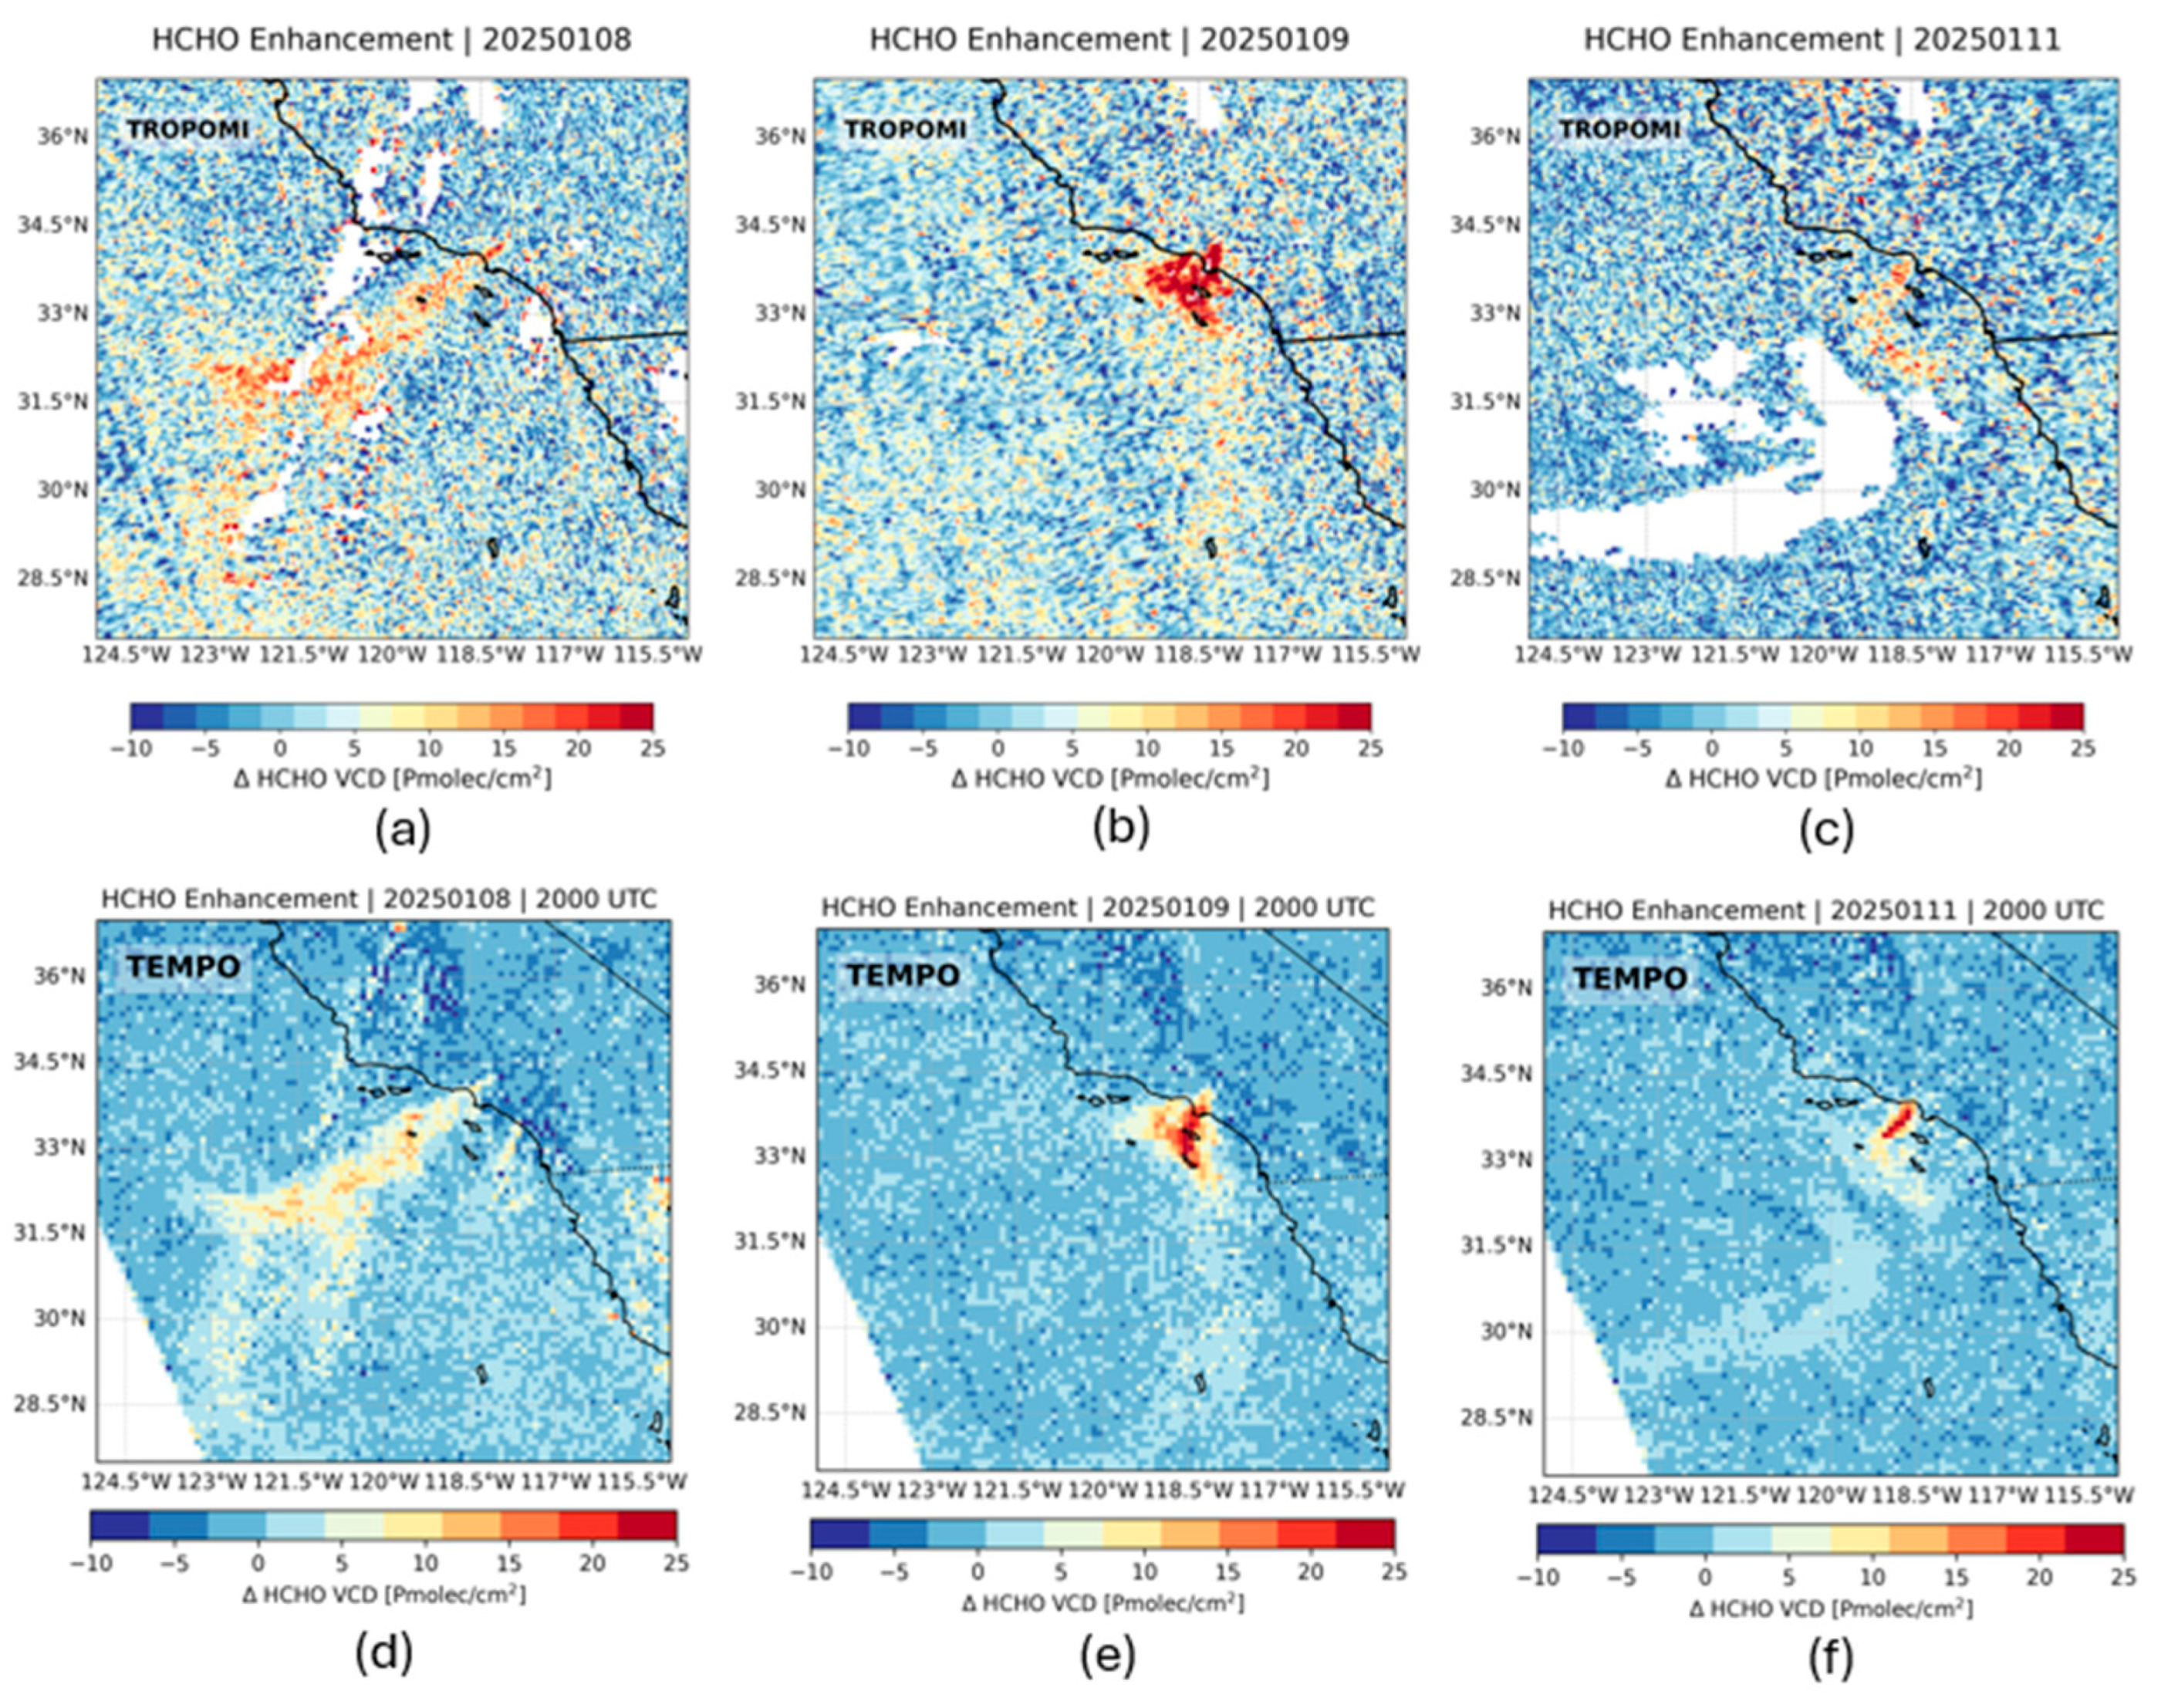
Figure 5.
Sentinel-3 OLCI true-color image of the Los Angeles wildfires on 9 January 2025, overlaid with SLSTR-derived fire radiative power (FRP). Clusters 1 (Palisades) and 2 (Eaton) indicate areas of intense fire activity.
Figure 5.
Sentinel-3 OLCI true-color image of the Los Angeles wildfires on 9 January 2025, overlaid with SLSTR-derived fire radiative power (FRP). Clusters 1 (Palisades) and 2 (Eaton) indicate areas of intense fire activity.
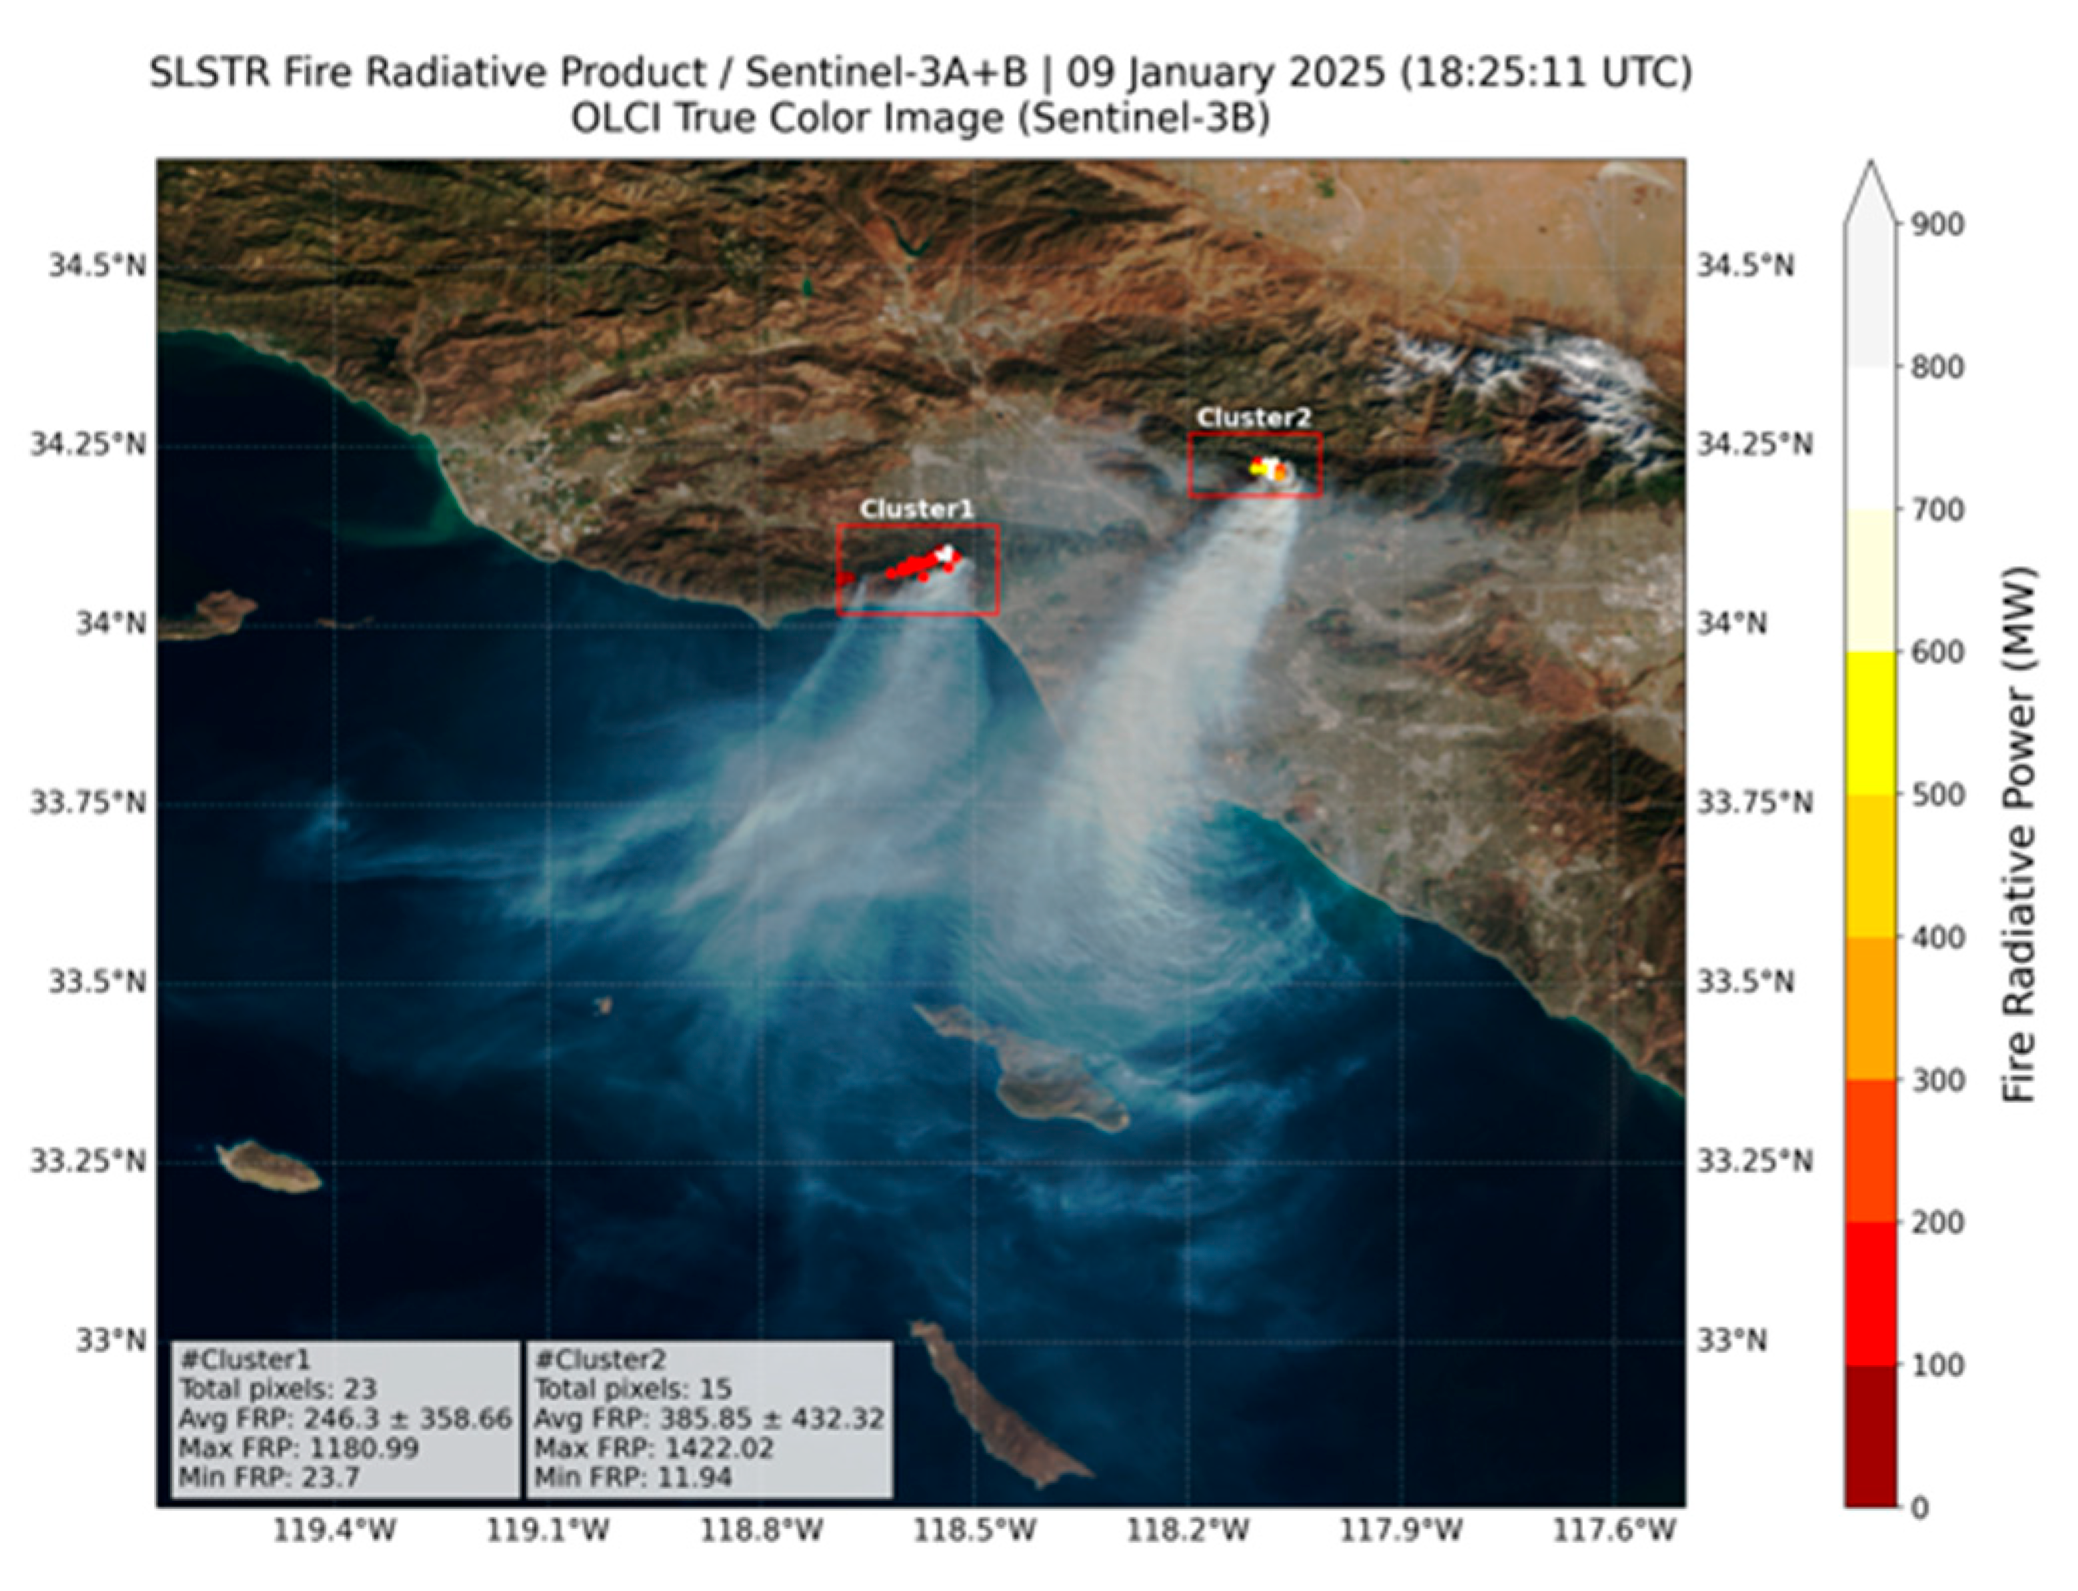
Figure 6.
Diurnal variability of TEMPO NO2 (a) and HCHO (b) VCD enhancements and TROPOMI NO2 and HCHO VCD enhancements averaged within Cluster 1 (TEMPO: blue line, TROPOMI: brown stars) and Cluster 2 (TEMPO: green line, TROPOMI: orange stars).
Figure 6.
Diurnal variability of TEMPO NO2 (a) and HCHO (b) VCD enhancements and TROPOMI NO2 and HCHO VCD enhancements averaged within Cluster 1 (TEMPO: blue line, TROPOMI: brown stars) and Cluster 2 (TEMPO: green line, TROPOMI: orange stars).
Disclaimer/Publisher’s Note: The statements, opinions and data contained in all publications are solely those of the individual author(s) and contributor(s) and not of MDPI and/or the editor(s). MDPI and/or the editor(s) disclaim responsibility for any injury to people or property resulting from any ideas, methods, instructions or products referred to in the content. |
© 2025 by the authors. Licensee MDPI, Basel, Switzerland. This article is an open access article distributed under the terms and conditions of the Creative Commons Attribution (CC BY) license (http://creativecommons.org/licenses/by/4.0/).
Copyright: This open access article is published under a Creative Commons CC BY 4.0 license, which permit the free download, distribution, and reuse, provided that the author and preprint are cited in any reuse.


