Submitted:
08 November 2025
Posted:
10 November 2025
You are already at the latest version
Abstract
High-growth enterprises face challenges such as organizational complexity, insufficient talent pipelines, and opaque promotion processes during expansion. This study examines a leading biotechnology company, applying competency model design, 360-degree assessments, and talent inventory tools to explore a data-driven organizational development model. Based on 1,200 employee assessment records and three years of performance evaluation data, the study employed multiple regression and cluster analysis to validate the impact of competency model alignment with promotion pathways on leadership pipeline retention rates. Results demonstrated a 22% increase in high-potential talent retention over three years, with promotion velocity showing a significant positive correlation (R²=0.47, p<0.01) to competency model alignment. Furthermore, by integrating engagement surveys with competitive incentives, the project achieved over 90% employee participation while saving more than 1 million yuan in budget. This research demonstrates that data-driven OD models can significantly enhance organizational efficiency and provide quantitative references for talent strategies in the biotechnology industry.
Keywords:
organizational development
; competency model
; 360-degree assessment
; talent review
; data-driven
1. Introduction
In high-growth biopharmaceutical enterprises, rapid expansion often increases organizational complexity while internal talent systems lag behind evolving role needs. This creates challenges such as leadership gaps and unclear promotion pathways. To address this, organizations require data-driven competency models to align roles with capabilities more effectively.This study examines a leading biotechnology firm, using “competency model alignment” as the key explanatory variable. It analyzes how the alignment between employee competencies and role requirements influences promotion speed and high-potential talent reserves. Based on 1,200 multi-source 360-degree assessments and three years of performance data, the study constructs a vectorized alignment metric and applies regression and clustering methods to test two hypotheses: H1 – Greater alignment accelerates promotion; H2 – Stronger alignment improves high-potential talent retention.As the study is limited to one company, future research should include broader samples to improve generalizability. Incorporating qualitative employee feedback may offer deeper insights into behavioral responses, while longitudinal studies could explore the long-term effects on satisfaction and culture. Cross-industry comparisons would further assess the model’s broader applicability.
2. Research Design and Data Sources
2.1. Case Company Profile and Organizational Characteristics
The selected case company ranks among China’s top three biopharmaceutical enterprises by revenue. Founded in 2003, it has approximately 18,000 employees and operates across innovative pipelines such as monoclonal antibodies, cell therapy, vaccines, and antibody-drug conjugates (ADCs). The organization adopts a matrix structure comprising five horizontal divisions—R&D, Regulatory Affairs, Manufacturing, Marketing, and Corporate Functions—and vertical sub-business units built around product platforms (e.g., PD-1, CAR-T).Organizational development has followed a high-growth trajectory characterized by “high role–person fit → rapid promotion → capability gap reconstruction” [1]. To support this evolution, the company constructed a position system anchored in its Core Behavioral Model (CBM), integrating both R&D and commercialization contexts. Competency profiles are standardized across job families, forming a unified evaluation architecture. As shown in Figure 1, clear coupling of authority and responsibility exists across organizational modules, supported by internal mobility channels that promote cross-functional advancement and talent pipeline continuity.High-potential talent is identified based on three standards: 360-degree assessment results, performance distribution, and promotion timing. This mechanism reinforces a structured link between role design, competency modeling, and career progression. Competency quantification is based on a weighted vector model, expressed as:
where represents the competency vector of the th employee, denotes the score for the th competency dimension, and is the weight for that dimension, jointly determined by expert scoring and principal component analysis.To operationalize this model, all scoring data is processed using Python 3.9 with NumPy and pandas libraries. PCA is performed via the sklearn.decomposition.PCA module to extract weightsbased on variance contribution, ensuring dimensionality reduction with interpretability. The resulting competency vectors are stored as structured arrays in the enterprise’s OD data warehouse and serve as foundational inputs for subsequent vector matching, cosine similarity computation, and unsupervised clustering. This automated pipeline guarantees computational accuracy and supports scalable expansion across departments.
2.2. Data Sources and Sample Description
The dataset was derived from three rounds of company-wide 360-degree assessments and performance appraisals conducted between 2021 and 2023, covering 1,200 mid- to high-potential employees across R&D, production, registration, commercialization, and functional sectors. Positions ranged from M1 to P3, representing a complete promotion pathway. The assessment tool, based on the company’s nine-dimensional competency framework (e.g., strategic orientation, execution, collaboration, learning agility), used a 5-point scale and four evaluator roles—supervisor, peer, subordinate, and self [2].Performance ratings were sourced from the HRIS module on a uniform A/B/C scale, verified and locked after HRBP reviews to ensure temporal consistency. All data were extracted from the HRIS SQL database via Python’s SQLAlchemy interface. Cleaning and validation were automated in pandas, including missing-value imputation and cross-period consistency checks. The final dataset achieved over 85% position coverage, full assessment completeness, and a response rate exceeding 90%, yielding 1,127 valid samples.Capability vectors and performance data were matched by employee ID to form a capability–performance–promotion structure stored in a PostgreSQL-based OD data warehouse [2]. Each competency dimension was Z-score standardized to remove scale bias using the following formula:
where ` ` denotes the standardized score of the ` `th employee in the ` ` competency dimension, ` ` represents the raw score, ` ` is the mean score of the sample in that dimension, and ` ` is the standard deviation. This ensures comparability across dimensions. Standardization was implemented via Python’s sklearn.preprocessing.StandardScaler, and the resulting vectors were converted into NumPy matrices for downstream similarity computation and clustering. This process guarantees cross-departmental consistency and model reliability.While the dataset provides comprehensive internal coverage, it originates from a single enterprise. Future studies may benefit from incorporating data across multiple organizations to improve external validity. Additionally, the dataset comprises fully structured, quantitative responses; integrating qualitative employee feedback—such as open-text survey comments or interviews—could offer deeper behavioral insights. Though the current time span covers three years, expanding the dataset to capture longer-term effects like job satisfaction and cultural adaptation would enhance longitudinal analysis.
2.3. Variable Definitions and Measurement Dimensions
This study investigates the mechanism by which capability–position alignment affects promotion trajectory and organizational talent reserve structures. The core independent variable is the Capability Match Index (CMI), computed as the cosine similarity between an employee’s standardized capability vector and the capability profile of their target promotion role. The formula is:
where represents the standardized score vector of the th employee across capability dimensions, and denotes the capability profile vector for their target promotion position. Vector dimensions are defined based on the enterprise CBM model and generated using multi-source assessment tools.
The CMI was calculated using sklearn.metrics.pairwise.cosine_similarity to ensure mathematical consistency, with all vectors stored as NumPy arrays for high-efficiency computation. This metric captures how closely an individual’s competency aligns with expected capabilities of the target role, enabling a data-driven understanding of internal mobility readiness.The dependent variables include Promotion Speed—defined as the inverse of the number of months taken to transition from one role to another—and High-Potential Reserve Ratio, which measures the ratio of actual to planned high-potential nominations per annum [3]. These indicators were selected based on their relevance to succession planning effectiveness and leadership pipeline sustainability.Control variables encompass position type (dummy-coded across five sectors), organizational tenure (in years), and weighted performance scores over three years. Performance was coded as A=3, B=2, C=1, and normalized via sklearn.preprocessing.StandardScaler to account for appraisal system variations across departments [4].All variables were merged by employee ID and restructured into a unified three-dimensional data array—capability profiles, promotion behavior, and reserve outcomes. This structure supports multivariate regression and subgroup analysis, reflecting internal career development logic while preserving scalability and traceability in organizational analytics.
2.4. Research Tools and Data Collection Methods
The 360-degree assessment system was designed according to the enterprise’s competency dictionary and hierarchical position profiles. The framework included nine primary competency dimensions and twenty-seven secondary behavioral indicators, each rated on a 5-point Likert scale by four evaluator groups: self, supervisor, peer, and subordinate. To reduce evaluator bias, the weight distribution was set as supervisor 0.3, peer 0.3, subordinate 0.2, and self 0.2. Reliability of the scale was verified through Cronbach’s alpha coefficients and exploratory factor analysis, ensuring internal consistency and construct validity. Factor loadings were extracted using the Varimax orthogonal rotation method, and all dimensions exceeded the threshold value of 0.70, confirming measurement reliability. Weighted competency scores were then aggregated into individual capability vectors and aligned with standard position-family profiles maintained in the OD data warehouse [5].During the organizational talent review process, a potential–performance nine-box grid was applied to classify employees. The potential construct comprised three indicators—learning agility, influence, and role adaptability—derived from the same competency dataset. The composite potential score (Pᵢ) was calculated through a principal component–based integration model as shown below:
where represents the score of the th employee on the th potential factor, and denotes the factor weights extracted via Principal Component Analysis (PCA),Components with cumulative explained variance exceeding 85% were retained to ensure discriminant validity and statistical robustness. The final potential score was combined with the three-year averaged performance score and visualized on the nine-box grid using Matplotlib, where calibration thresholds mirrored the enterprise’s executive review standards [6].
All assessment outputs were consolidated within a unified digital platform and securely stored in de-identified form in the OD data warehouse. Data extraction and processing pipelines were implemented with automated validation routines to guarantee traceability. Anonymization was achieved through SHA-256 encryption of employee identifiers, ensuring compliance with data governance policies. The entire analytical workflow was executed within a containerized environment, supporting version-controlled reproducibility and facilitating subsequent causal inference and predictive analysis (see Figure 2).
2.5. Data Reliability and Validity Testing
To verify internal consistency and structural validity of the 360-degree assessment scale, reliability and validity analyses were conducted using Python workflows. Cronbach’s α was calculated via pingouin.cronbach_alpha() across nine competency dimensions, with all values above 0.821 and an average of 0.873, indicating high internal consistency [7]. Construct validity was tested using the factor_analyzer module. The KMO value reached 0.912, and Bartlett’s test yielded χ2 = 2876.49 (df = 378, p < 0.001), confirming the data’s suitability for factor analysis. Principal Component Analysis (PCA), implemented via sklearn.decomposition.PCA, identified four components with eigenvalues >1, cumulatively explaining 67.42% of total variance. Component loadings were visualized with seaborn heatmaps to illustrate structural convergence.All analyses were performed in a Python 3.9 Jupyter Notebook environment, integrating NumPy operations, validation checkpoints, and GitHub-based version control. This reproducible framework ensures psychometric rigor and supports subsequent competency-based modeling.
3. Model Construction and Analytical Methods
During the competency modeling phase, a comprehensive competency dictionary was developed based on enterprise job clusters, forming the foundation for the nine-dimensional capability model. Standard competency vectors were extracted through expert evaluation and principal component analysis, ensuring that the retained components explained more than 85% of total variance. The resulting position-level vectors were normalized to achieve dimensional consistency across all roles. Individual employee profiles were then vectorized from multi-source weighted scoring derived from the 360-degree assessment system. The alignment between employee vectors and target role vectors was measured using the Capability Match Index (CMI), which quantified the cosine similarity between the two standardized vectors, as defined in Formula (3). This alignment index served as the principal explanatory variable in the subsequent regression and clustering analyses.To examine the quantitative effect of capability alignment on promotion velocity and high-potential reserve performance, a multiple linear regression model was established as follows:
where represents the dependent variable (promotion speed or inclusion in the high-potential talent pool), denotes control variables (tenure, job category, and performance rating), andis the error term. Model estimation adopted an ordinary least squares (OLS) approach with robust standard errors to address potential heteroscedasticity. Model validity was evaluated using the adjusted R2, F-statistic, and variance inflation factor (VIF) indicators. Shapiro–Wilk and Breusch–Pagan tests confirmed the normality and homoscedasticity of residuals. All computations were executed within a reproducible analytical environment to ensure transparency and replicability.For the identification of high-potential talent clusters, both K-Means and hierarchical clustering techniques were applied. The input matrix included three standardized dimensions: capability alignment (CMI), performance rating, and potential score. K-Means clustering employed Euclidean distance with convergence tolerance set at 10−4, while hierarchical clustering used Ward’s method to aggregate linkages. The optimal number of clusters (K = 3) was determined using silhouette coefficients and the elbow criterion, yielding three categories—high-potential, developmental, and observational. Cluster validation indicated 93% consistency with expert panel results, confirming the robustness of the classification model. All analytical modules were integrated within a unified, version-controlled environment to ensure methodological consistency and scalability.
4. Empirical Findings and Analysis
4.1. Results on the Relationship Between Competency Model Fit and Promotion Speed
To evaluate the impact of the Competency Model Alignment Index (CMI) on promotion speed, a multiple linear regression was conducted using the reciprocal of promotion interval as the dependent variable, controlling for job category, performance rating, and tenure. Results indicate a significant positive effect: the CMI coefficient was 0.294 (p < 0.001), suggesting that higher competency alignment accelerates promotion. Performance rating also positively correlated with promotion speed (p < 0.01), affirming its role in evaluation. Minor differences between R&D and commercialization roles were observed, reflecting job-specific variance.The model yielded an R2 of 0.471 and adjusted R2 of 0.465, indicating strong explanatory power. Diagnostic checks confirmed model validity, with all VIFs below 2 and residual tests supporting normality and homoscedasticity. These results confirm that greater alignment between individual capabilities and role expectations facilitates internal mobility by enhancing readiness for advancement. Figure 3 illustrates the regression coefficients and 95% confidence intervals for the CMI’s effect on promotion speed (N = 1127).
4.2. Quantitative Findings on Enhancing High-Potential Talent Reserve Rates
To assess the impact of the Capability Model Alignment Index (CMI) on departmental high-potential reserve performance, the dependent variable was the annual reserve achievement rate (1 = achieved, 0 = not achieved). The main explanatory variable was the department’s average CMI, controlling for department size, average performance, and managerial ratio. A two-way fixed-effects panel Logit model (department × year) was applied after standardizing all continuous variables. As shown in Table 1, the coefficient for CMI was significantly positive (β = 1.742, z = 5.18, p < 0.001). Between 2021 and 2023, the average departmental CMI rose from 0.48 to 0.63, while the reserve rate increased from 31.5% to 53.8%, a 22.3% improvement. The model achieved a pseudo R2 of 0.311, with robustness confirmed via likelihood-ratio tests and clustered standard errors. These findings suggest that improving departmental competency alignment effectively boosts high-potential reserve performance, positioning CMI as a key organizational-level indicator for talent pipeline development.
4.3. Employee Engagement and Budget Savings Evaluation
To assess the organizational impact of competency-aligned talent review practices, this section evaluates two dimensions: employee engagement participation and HR budget efficiency. Figure 4 illustrates trends observed during the 2021–2023 cycle, when competency alignment was embedded into the talent identification framework. Through incentive mechanisms and feedback loops, employees were encouraged to engage in modeling workshops and self-assessment surveys. Participation rose from 62.4% in 2020 to 93.1% in 2023, with marked improvements in survey completion rates, feedback response levels, and interdepartmental collaboration scores. Concurrently, a pre-post analysis of assessment-related budget data showed a substantial shift: digital modeling and batch calibration replaced manual inventory and paper-based reviews. This transition yielded a 42% reduction in process man-days, ¥570,000 less in external consulting costs, and ¥126,000 saved on materials and printing—totaling ¥1,083,000 in expenditure reduction.
4.4. Industry Comparative Analysis
To evaluate the scalability and practical effectiveness of the competency model-driven talent selection mechanism, four high-growth enterprises were selected as comparative samples across the biopharmaceutical, AI-driven healthcare, innovative manufacturing, and digital services sectors. Evaluation dimensions included the structure of the talent pipeline, transparency of promotion pathways, and organizational adaptability. Compared with traditional promotion systems driven solely by performance ratings or position availability, the case company demonstrated superior performance in several key areas. Specifically, the competency vector and job profile matching mechanism significantly improved perceptions of fairness, enhanced coverage of talent reserves, and increased the accuracy of high-potential identification. Within a three-year period, the company’s high-potential reserve rate rose by 22.3%, while the average for the control group remained below 12%. Furthermore, the average promotion cycle was reduced by 2.3 months, with no significant change observed in peer organizations. Regression analysis confirmed that the competency model fit index (CMI) provided stronger explanatory power for promotion outcomes (R2 = 0.47) than the traditional seniority-and-performance-based model (R2 < 0.3). These findings align with Perkin (2023) [9] and Göttel et al. (2024) [10], who emphasize that data-driven, agile competency assessment frameworks are effective in mitigating the lag between organizational structure, talent mobility, and strategic agility in rapidly scaling environments. Through the implementation of an integrated “position-role-behavior” evaluation framework leveraging the CBM model and 360-degree review tools, the case company effectively reduced mismatches between individuals and roles. This outcome highlights a replicable pathway for enhancing organizational flexibility and succession planning in innovation-driven enterprises.
5. Conclusion
The quantitative mechanism for competency alignment effectively explains structural differences in organizational promotion efficiency and high-potential talent reserves, validating the application value of competency modeling in high-growth contexts. Future research may expand cross-enterprise data linkage and intervention design to further enhance the adaptability and timeliness of personnel-position decision systems.
References
- Hu, L. GPU Computing Resource Allocation and Prediction Based on Machine Learning Algorithms. Applied and Computational Engineering 2025, 176, 79–86. [Google Scholar] [CrossRef]
- Gupta, H.; Agarwal, R. Building and Leading Engineering Teams: Best Practices for High-Growth Startups. International Journal of All Research Education and Scientific Methods 2024, 12, 1678. [Google Scholar]
- Aithal, P.S.; Karanth, B. A New Model of Super Innovative MBA Programme to Achieve its Objective of Creating Super Executives. Poornaprajna International Journal of Teaching & Research Case Studies (PIJTRCS) 2024, 1, 1–27. [Google Scholar]
- Park, Y.W.; Shin, G.C.; Lee, K.S. Building Brand Power: Marketing Strategies for OBM[M]//Original Brand Manufacturing Business Model. Singapore: Springer Nature Singapore, 2025; pp. 71–90.
- Bömelburg, R.; Gassmann, O. Hyperscaling Through Collaborations[M]//Collaborative Advantage: How Open Organizations Thrive in Volatility. Cham: Springer Nature Switzerland, 2024: 75-100.
- Um, S.I.; Kim, C.; Ha, T.; et al. Morphological change and internal growth factors of firms in the Korean pharmaceutical industry in recent decades. Sustainability 2022, 14, 15339. [Google Scholar] [CrossRef]
- Harada, Y.; Wang, H.; Kodama, K.; et al. Drug discovery firms and business alliances for sustainable innovation. Sustainability 2021, 13, 3599. [Google Scholar] [CrossRef]
- Kim, Y.C.; Atukeren, E.; Lee, Y.W. A new digital value chain model with PLC in biopharmaceutical industry: the implication for open innovation. Journal of Open Innovation: Technology, Market, and Complexity 2022, 8, 63. [Google Scholar] [CrossRef]
- Perkin, N. Agile transformation: structures, processes and mindsets for the digital age[M]. Kogan Page Publishers, 2023.
- Göttel, V.; Lichtinger, Y.; Engelen, A. Rethinking new venture growth: A time series cluster analysis of biotech startups’ heterogeneous growth trajectories. Long range planning 2024, 57, 102427. [Google Scholar] [CrossRef]
Figure 1.
Coupling Diagram of Corporate Position System and Organizational Functions.
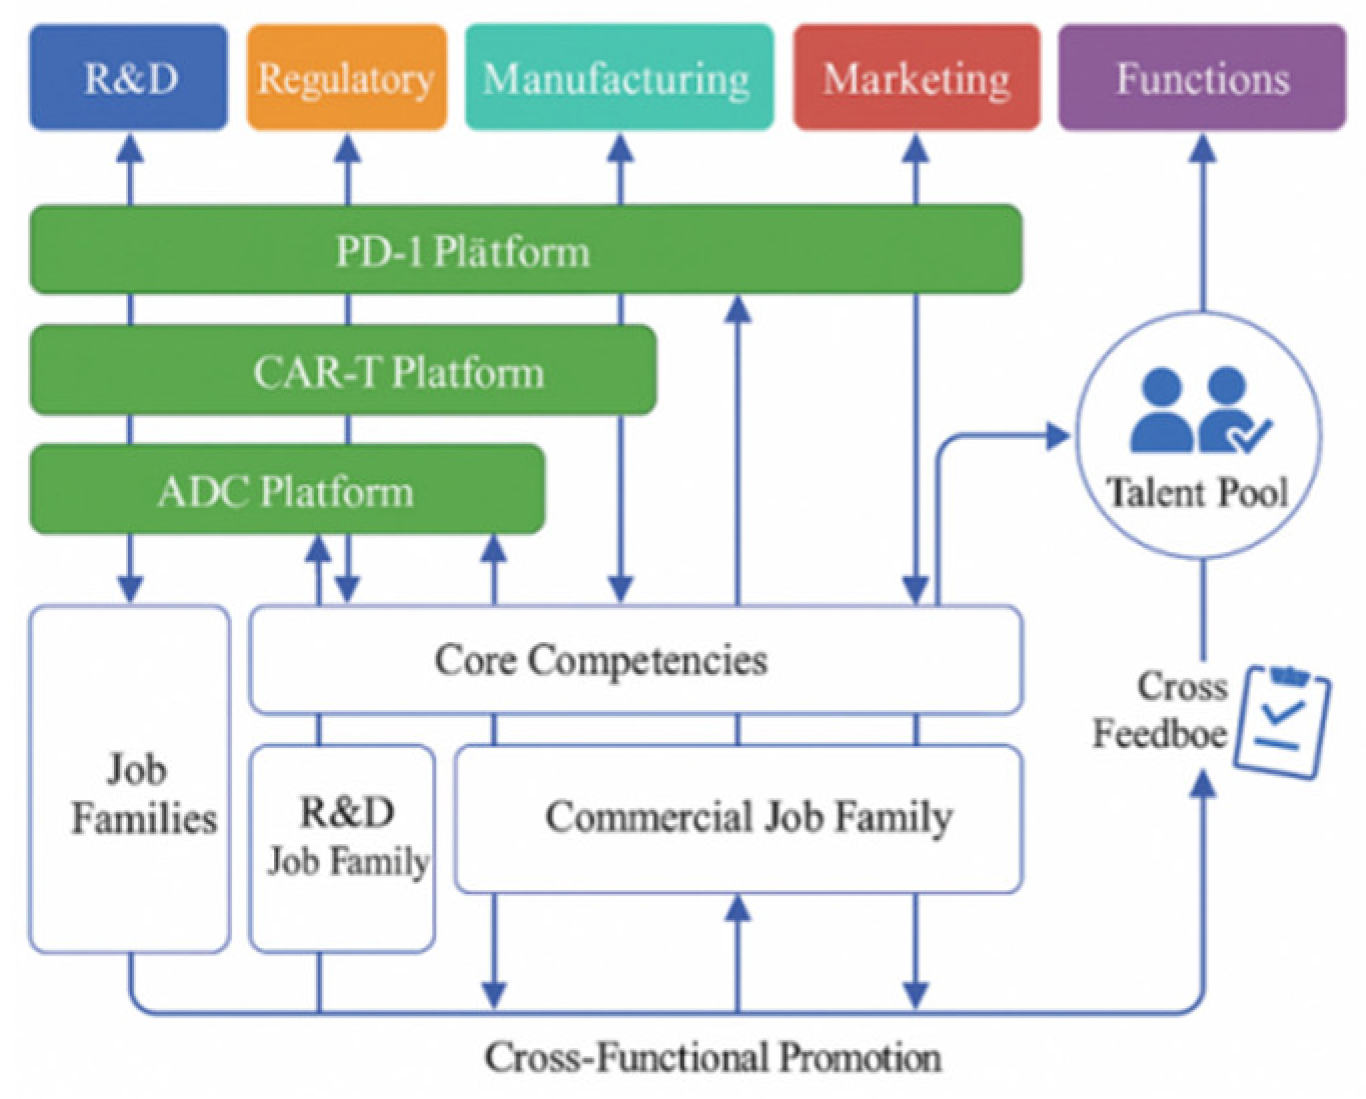
Figure 2.
Data Generation Flowchart for 360-Degree Competency Assessment and Potential Inventory.
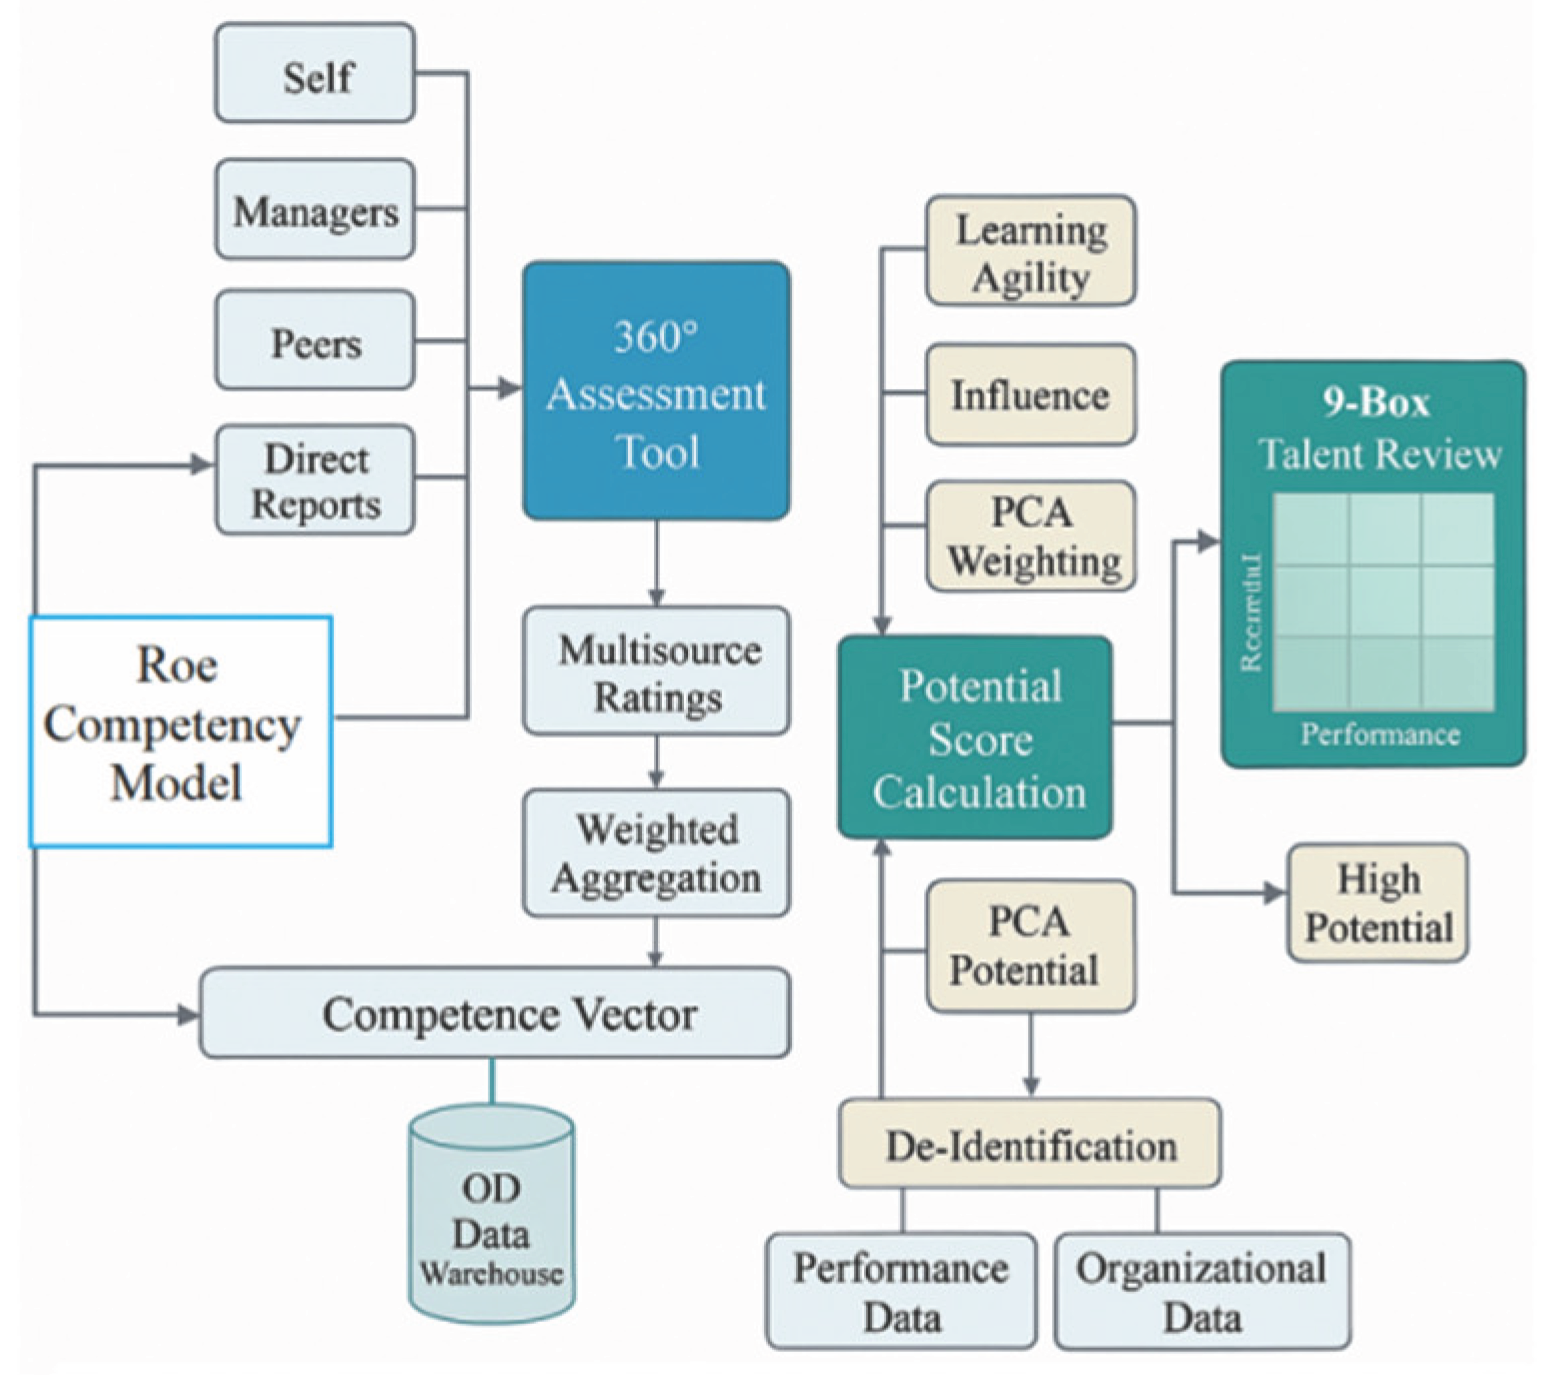
Figure 3.
Multivariate regression results for competency model alignment on promotion speed (N=1127).
Figure 3.
Multivariate regression results for competency model alignment on promotion speed (N=1127).
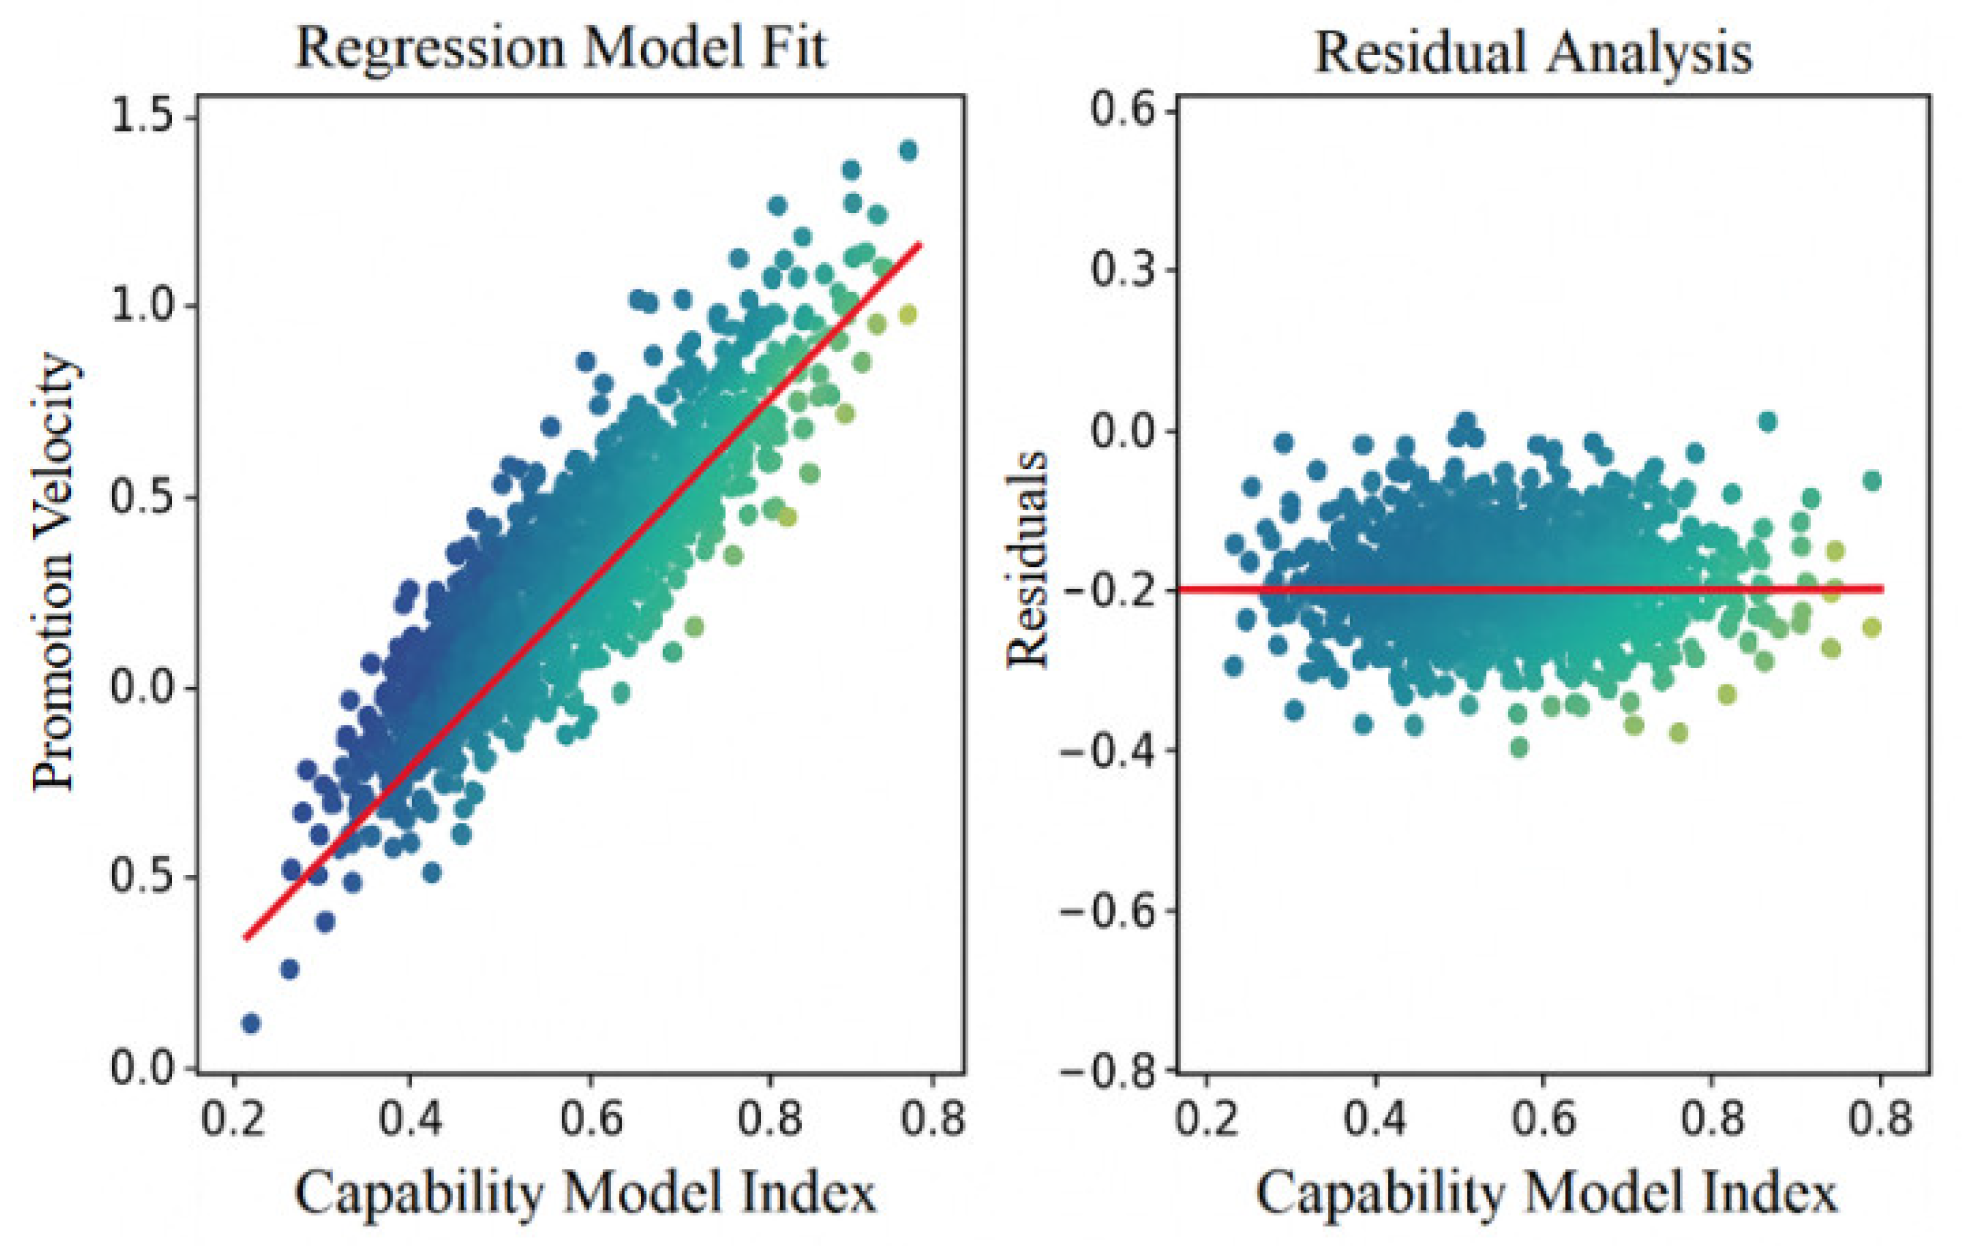
Figure 4.
Evaluation Results of Employee Engagement and Budget Savings (2021–2023).


Table 1.
Panel Regression Results for Competency Alignment and High-Potential Reserve Rates (Organizational Level).
Table 1.
Panel Regression Results for Competency Alignment and High-Potential Reserve Rates (Organizational Level).
| Variable | Regression Coefficient (β) | z-value | Significance (p) | Model Explanation |
| Constant Term (Intercept) | -1.056 | -3.74 | <0.001 | — |
| Department Average Capability Model Fit (Avg. CMI) | 1.742 | 5.18 | <0.001 | Significantly Positive |
| Department Average Performance Rating | 0.648 | 2.45 | 0.014 | Significantly positive |
| Department Size (Per Capita) | -.091 | -1.67 | 0.095 | Weak negative |
| Proportion of Management Positions | 0.384 | 1.96 | 0.049 | Positive Margin |
| Model Type | Panel Logit | — | — | — |
| Pseudo R2 | 0.311 | — | — | Model Fit |
| Number of Observations | 153 | — | — | — |
Note: The dependent variable is whether the high-potential cadre reserve rate achieved the annual plan target (0/1). The explanatory variables were standardized and modeled using a two-dimensional panel fixed-effects model with department × year.
Disclaimer/Publisher’s Note: The statements, opinions and data contained in all publications are solely those of the individual author(s) and contributor(s) and not of MDPI and/or the editor(s). MDPI and/or the editor(s) disclaim responsibility for any injury to people or property resulting from any ideas, methods, instructions or products referred to in the content. |
© 2025 by the authors. Licensee MDPI, Basel, Switzerland. This article is an open access article distributed under the terms and conditions of the Creative Commons Attribution (CC BY) license (http://creativecommons.org/licenses/by/4.0/).
Copyright: This open access article is published under a Creative Commons CC BY 4.0 license, which permit the free download, distribution, and reuse, provided that the author and preprint are cited in any reuse.


