Submitted:
09 November 2025
Posted:
13 November 2025
You are already at the latest version
Abstract
Due to their chemical structure and convenient, tunable physicochemical properties, intermetallic alloys and materials are promising for use in various fields, such as gas sensors. The aim of this study was to perform DFT GGA calculations of the adsorption energy of atomic nitrogen and the properties of partially substituted metal atoms with nitrogen in Ti3Sb supercells with an A15 cubic structure. Adsorption and doping at various adsorption sites and crystallographic orientations (110; 111; 100), as well as their electronic properties, were studied in 2 × 2, 3 × 3, and 5 × 5 supercells. The density of states (DOS) of Ti3Sb–N supercells with two different positions of partial substitution of nitrogen for Ti3Sb metal atoms was calculated: N/Ti and N/Sb. Comparative data show that the structural and energetic properties of Ti3Sb–N vary compared to pure Ti3Sb. Controlled incorporation of nitrogen atoms and partial substitution of Ti3Sb atoms allow for tuning of the properties of Ti3Sb–N. These data can be used to optimize and predict the electronic structure and response characteristics of such materials for electronics and catalysis. They are also important as potential sensor materials with exceptional properties and promising applications for nitrogen detection in targeted developments.
Keywords:
calculation of electronic properties
; cubic structure
; Ti3Sb supercell
; nitrogen adsorption
; partial substitution with nitrogen
; DFT method
1. Introduction
Intermetallic compounds (IC) possess a unique ability to bond with other elements, resulting in the creation of practically important structures for a wide range of applications. One way to improve the performance of materials is through adsorption and doping with metals and non-metallic elements. Understanding these processes requires considering, in particular, the role of electron affinity, orbital chemistry, band gap chemistry, conductivity, bond type, and spin redistribution. Therefore, gaining fundamental knowledge about the relationship between the electronic, physical, and chemical properties of materials and their structural features remains an important task. ICs are a promising alternative to, for example, superconductors and catalysts based on metals or metal oxides. ICs offer advantages such as low cost, structural flexibility beyond the atomic scale, excellent electronic conductivity, high specific surface area, and good stability.
Electron ICs such as the Laves phase and Hume-Rothery phase have structures characteristic of metallic elements. In these compounds, the structure of the resulting phases is primarily determined by the electron concentration, i.e., the ratio of the number of valence electrons to the number of atoms in the unit cell. When these compounds form, transition metals exhibit variable valence, due to the overlap of the d- and s-levels.
When the ratio of the number of valence electrons to the number of atoms in the lattice changes, intermetallic compounds form various structures, including those with a cubic lattice (e.g., Ti3Sb, FeAl, CoAl, NiAl and alloys based on them). These intermetallic compounds possess metallic properties, but the participation of d-electrons in the interatomic bonding predetermines the appearance of a covalent component.
From the above, it follows that the electronic structure of intermetals can be tuned using different types of adsorbates and doping. This makes them attractive for use in various fields, such as electronics, catalysis, and so on. The change in properties upon adsorption and alloying significantly alters the structures with a multivalent element, where the lattice symmetry changes, allowing such compounds to be used as functional materials in electronics and industry.
As a result, absorption and doping has become a common strategy for controlling the properties of source materials. First, let’s review some results from studies of nitrogen adsorption on the surfaces of alloys and intermetallic compounds. We’ll focus on solving the problem using DFT calculations and new methods.
The authors of work [1] studied the adsorption of N₂ and atomic N on the ZrMnFe(110) surface using the DFT method, including the barriers of dissociation and penetration of the atom into the surface. It was indicated that the best adsorption site is “vacancy Hollow 1 composed of 4Zr1Fe”. The adsorption energy of the N atom is ≈ 6.057 eV, and N2 ≈ 10.215 eV, the barriers are 1.129 eV (dissociation) and 0.766 eV (penetration).
The influence of atomic composition and environment on nitrogen adsorption on high-entropy alloy (HEA) surfaces is examined in [2]. The authors investigate the adsorption of molecular N2 on HEA surfaces from the perspective of the influence of the local environment (the first and second shells of neighboring atoms) on the bond strength. DFT calculations with van der Waals corrections and Bayesian error estimation methods are used. The main conclusion is that the d-band of the active atom’s center is regulated by neighboring atoms, and this “influence shell” can be used as a “designer” for tuning nitrogen binding.
In order to model the influence of local structural variations on the adsorption of nitrogen atoms, the authors of work [3] studied the adsorption of atomic nitrogen on the bimetallic surface Ni/Pt(111) with different Ni configurations (on the surface, in the subsurface, in clusters). The proposed model is: binding energy = base (on Pt) + linear correction from Ni neighbors to the third nearest order. The model was used to parameterize the adsorption energy as a perturbation of the adsorption energy on the host metal relative to the coordination number of the guest metal. The model was applied to N adsorption on the Ni/Pt(111) system, using a parameterization with a small number of surface and subsurface Ni structures on Pt(111) and Ni clusters in the first and/or second Pt layer.
The DFT-D3 method was used to study the chemisorption of H2 and N2 on cobalt-promoted Ta3N5-(100), (010), and (001) surfaces [4]. The adsorption (including molecular, with the possibility of activation) of N2 on the faces of the nitride surface of Ta3N5, with the participation of added Co, is considered. It is shown that N2 is adsorbed molecularly (not completely dissociated) in various orientations (side-on, end-on, tilt), and the interaction with transition elements of Co is discussed. It was shown that the formation energies of nitrogen vacancies were relatively high compared to other metal nitrides and were 2.89 eV, 2.32 eV, and 1.95 eV for cobalt coadsorbed on the surface and cobalt coadsorbed under the surface of Ta3N5-(010).
The authors of work [5] use a combination of DFT and machine learning to screen HEA catalytic surfaces (Co, Mo, Fe, Ni, Cu) for H, N, NHᵪ adsorption properties. They attempt to find a composition at which the binding of N (and intermediate nitrogen species) is not stringent, but sufficient for activation. Using a computational approach based on first-principles calculations, combined with data analytics and machine learning, a model is proposed for rapidly calculating the adsorption energies of H, N, and NHx ions (x = 1, 2, 3) on CoMoFeNiCu alloy surfaces with different alloy compositions and atomic arrangements. A Co/Mo ratio of 25/45, experimentally identified as the most active for ammonia decomposition, increases the probability that the surface adsorbs nitrogen equivalent to the adsorption
The study in [6] examines the influence of interstitial nitrogen on oxygen adsorption on the iron surface. It is shown that the presence of N atoms within the Fe lattice alters the surface electron density and enhances/weakens the adsorption of other atoms [7,8,9,10].
Intermetallic compounds, including type A3B A15, form the basis of industrial alloys due to their variable composition, unique active-site properties, and adjustable crystal structure with a characteristic electronic spectrum (cubic, tetragonal, and hexagonal structure).
However, the electronic structure affecting the catalytic activity of pure binary A3B A15 compounds in reactions that evolve gases such as nitrogen has been poorly studied. This problem can be addressed by DFT calculations involving the doping of A3B A15 crystals. Studying the doping process allows for the adjustment of the electronic structure of the material, the Gibbs free energy of phase formation, and the structure of the d-band center to improve the kinetics of catalytic reactions.
Therefore, for example, atomic doping of Ti3Sb crystals with nitrogen is of scientific and practical interest. Let us briefly review some similar studies on nitrogen doping of alloys. This is important for the development and creation of highly effective intermetallic materials, for example, for catalytic processes.
2. Materials and Methods
A. General Settings
Density functional theory (DFT) calculations [11,12,13,14,15,16,17,18,19,20,21,22,23,24] of Ti3Sb–N supercells with a cubic structure (a = 5.2228 Å, A15 phase, Cr3Si prototype, space group, no. 223) were performed using the Vienna Ab initio Simulation Package (VASP) based on plane waves and the Atomistic Toolkit (ATK) [25,26]. The threshold value of the plane wave kinetic energy was fixed at 500 eV. Γ-centered grids (2 × 2 × 1, 3 × 3 × 3, 5 × 5 × 5) with the same k-point spacing were used to select the Brillouin zones. Energy band calculations for A3B A15 were performed along L–Γ–X trajectories. Noncollinear calculations took into account the spin–orbit coupling (SOC) effect.
The electron configurations of the atoms had the following valence states of the orbitals in the calculations: Ti–[Ar] 3d24s2, Sb–[Kr] 4d105s25p3, and N–[He] 2s22p3. Integration over the Brillouin zone was performed using the Monkhorst–Pack scheme with a grid step of 0.03 Å−1. The convergence threshold for the kinetic energy of the wave functions was less than 0.1 meV/atom. The BFGS minimization scheme [26] was used for geometric optimization of the crystal A15 structure.
The following threshold values were used for the calculations: maximum residual force acting on an atom of 1 × 10⁻⁷ eV, maximum displacement of atoms of 1 × 10⁻⁴ eV/Å and maximum stress of less than 0.001 GPa along the crystallographic directions to optimize the A15 structure, respectively. The lattice constant of Ti3Sb optimized by the DFT GGA PBE method was found to be a = 5.215 Å, which is in good agreement with the known value [26].
B. Calculating Adsorption Energy
Adsorption Energy
Calculated values of the mechanical properties of metals typically differ from experimental data depending on the crystal orientation and the locations where adsorbed particles can be located on the facet surface (top-T, bridge-B, hollow-H). DFT calculations of Ti3Sb–N adsorption showed that the difference in the calculated adsorption energies (per potential adsorption barrier) between the different crystallographic surfaces of the cubic Ti3Sb crystal is insignificant. For ease of comparison of the calculated nitrogen atom adsorption energies across crystal sites, only the (110) surface of the A15 cubic cell of the Ti3Sb compound was considered (Figure 1).
In the (100; 110; 111) planes of an ideal cubic lattice, the number of particles should be the same, since crystal anisotropy is absent. The surface energy of crystals with an ideal cubic lattice depends primarily on the valence, electron charge, lattice constant, ionic radius, and electron work function. The surface energies calculated by the DFT method for different orientations (100; 110; 111) of cubic crystals, depending on the number of layers in the crystal plate, differ little from each other, and there is no surface energy anisotropy [26].
Atomic nitrogen N was used as the adsorbate rather than molecular nitrogen N2 for the following reasons:
1. Simplicity of modeling. Atomic nitrogen is easier to model due to its simpler electronic structure. The N2 molecule consists of two atoms with additional electronic interactions, which are more difficult to describe in the context of adsorption.
2. Reaction kinetics. Nitrogen adsorption on a surface can occur in atomic form, since N2 molecules can dissociate at the surface, converting into atomic nitrogen. This is relevant for processes such as nitrogen diffusion, catalytic reactions, or nitration reactions, where atomic nitrogen can participate in the reaction.
3. Energetic considerations. Adsorption of atomic nitrogen should be more stable than adsorption of molecular N2, since N2 can dissociate at the active sites of catalysts or other surfaces.
4. Simplification of calculations. In DFT calculations, it was assumed that the adsorbed nitrogen particles (atom or molecule) had already gone through intermediate stages (dissociation, etc.), and only the atomic form of nitrogen actively interacts with the surface.
Surface coverage
Dependence of adsorption energy on surface coverage . This is one of the fundamental factors influencing adsorption energy. Surface coverage, usually expressed as a fraction of a monolayer (ML), determines the number of adsorbed atoms (in our case, nitrogen) per unit surface area.
Interaction between adsorbate particles. At high coverage (approximately 1 ML), adsorbed atoms can begin to interact with each other (repulsion or attraction), changing the overall energy of the system.
Occupancy of various active sites. At low coverages, nitrogen can only occupy energetically favorable (active) sites, but as coverage increases, it can occupy less favorable sites, which increases the adsorption energy (in absolute terms, it will decrease–that is, adsorption is less favorable).
Charge and structural effects. A large number of adsorbate atoms can alter the charge distribution, local electronic structure, and even lead to changes in surface symmetry. Taking this into account, we determined the optimal coverage, which characterizes the adsorption capacity of Ti3Sb. A low coverage ( = 1/9 ML in the supercell) minimizes interactions between adsorbed atoms and allows energy to be obtained for a single adsorbed atom near the ideal location. In this case, the dependence of the adsorption energy on the degree of coverage has a minimum, which is the optimal coverage for the stable phase.
In the calculations, a series of models were constructed for different coatings based on adsorption configurations at different sites. The (001), (100), or (110) adsorption planes were selected.
To study the most densely packed and stable surface, the (111) plane in Ti3Sb was chosen. The properties of the (111) plane is well known. It is energetically stable. In many cubic structures (FCC, cubic intermetallic), (111) is one of the most stable surfaces.
3. Results and Discussion
The creation of nanoscale materials based on A15 phases, particularly those containing Ti, is important for improving their physicochemical properties. Such doped materials could be important for superconducting and adsorption-catalytic systems.
A. Adsorption energy
A literature review (2022–2025) revealed no DFT data on the adsorption energy of atomic nitrogen on titanium alloys. The existing studies consider either metals, alloys with other metals, molecular nitrogen, or conditions different from those for atomic nitrogen adsorption on the titanium alloy surface. Furthermore, to compare adsorption data with existing studies, the nitrogen adsorption conditions (temperature, coating, surface structure) must be similar. We are interested in the adsorption energy of atomic nitrogen N on the surface of titanium-containing alloys. For example, the adsorption and diffusion of atomic nitrogen in cubic α-Ti (α-Ti(0001)) were studied in [27]. It was shown that the N atom is adsorbed on the surface of α-Ti(0001) in FCC and HCP structures. The FCC structure has a lower adsorption energy for nitrogen N atom. Doping α-Ti with aluminum (Al) reduces the adsorption capacity. However, the adsorption energy of N in α-Ti was not reported.
No such data are available for the Ti3Sb–N system. DFT calculations of N adsorption in the Ti3Sb–N supercell were considered at different surface sites (T, B, H-site). We considered four different N adsorption sites on the Ti3Sb surface. They were located: (i) directly above the surface titanium atom (T-site); (ii) midway between two nearest neighboring surface titanium atoms (bridge site); (iii) in the hollow above the titanium atom in the second layer (H-site); and (iv) in the hollow above the titanium atom in the third layer.
The nitrogen adsorption energy (N) was calculated as the difference between the total energy of the supercell with the adsorbed nitrogen atom Ti3Sb–N, the energies of the Ti3Sb surface and the nitrogen atom N in vacuum:
where is the total energy of the Ti3Sb–N system with an adsorbed N atom, is the energy of the Ti3Sb plate surface, n is the number of adsorbed N atoms, is the energy of N atoms, respectively.
Lower adsorption energies of N atoms on the Ti3Sb surface correspond to more stable adsorption centers or sites. N adsorption on the Ti3Sb surface has a negative value.
Nitrogen-containing cubic metallic structures are known to have two highly symmetric interstitial positions (octahedral (O) and tetrahedral (T)). These positions are energetically more probable for the location of adsorbed or doping nitrogen in the cubic lattice. The arrangement of the various planes in a cubic unit cell is shown in Figure 1.
As noted above, the adsorbate coverage is a key parameter in adsorption studies. Monolayer fractions (0 ≤ ≤ 1) were used in DFT calculations. The coverage was determined by the number of adsorbed atoms on the model surface
where is the number of adsorbed nitrogen atoms, and is the total number of active sites on the surface. Using the cubic Ti3Sb surface cell model, the number of sites suitable for adsorption was determined, and nitrogen atoms N 1, 2, 3, etc., were added to these sites. Each added N atom corresponded to its own = 1/n, 2/n, etc. The periodicity of the cell model was taken into account. Adding one N atom to a given region, for example, a 2 × 2 cell, results in a coverage of = 0.25 ML. Experimental methods for determining coverage are often used in surface physical chemistry. Coverage is determined, for example, by pressure and Langmuir isotherms
where is the adsorption equilibrium constant, and is the partial pressure of the adsorbate (in our case, nitrogen).
We investigated the adsorption energy on the Ti3Sb surface at low nitrogen concentrations. The equilibrium adsorption parameters of Ti3Sb–N are presented in Table 1 for a 2 × 2 supercell and a coverage of = 0.25 ML. The values for relaxed Ti3Sb–N structures differ from the of hydrogen in the Ti3Sb–H supercell [26].
Using the Nudged Elastic Band (NEB) method [28], the transition state energy of nitrogen atom adsorption was determined. The distance from the Ti3Sb surface for the adsorption of nitrogen atoms was varied in the range of 1–3 Å. The transition state structures were localized as the structures with the highest energy along the reaction coordinate, characterized by a single imaginary frequency. The adsorption activation energies differ for different faces. The activation energies for adsorption on Ti3Sb (111), Ti3Sb (110), and Ti3Sb(100) are negative and are -0.07, 0.17, and -0.11 eV, respectively.
Thus, the stable N adsorption configuration on the studied Ti3Sb faces is N adsorption on top of Ti3Sb (111), with an adsorption energy of –3.11 eV. The N adsorption energies on Ti3Sb (100) and Ti3Sb (110) are –0.87 and –0.15 eV, respectively. For the Ti3Sb (100) and (110) crystallographic faces, the energetically favorable N adsorption trajectory is the bridged adsorption form (located near two adjacent Ti3Sb atoms).
The adsorption energy of atomic nitrogen on Ti3Sb is significantly lower than that of hydrogen (Table 1). This may be due to several physicochemical factors.
1. Different nature of the chemical bond. Atomic nitrogen has five valence e⁻ orbitals (2s22p3 configuration), making it nucleophilic and allowing it to form a variety of bonds, including triple bonds. However, efficient nitrogen adsorption on the surface requires accessible d-orbitals with a specific energy and spatial orientation. Hydrogen, in contrast, has one electron orbital (1s), which interacts more readily with the surface, even on a metal with a low-activity substrate. It readily adsorbs on many metallic surfaces through simple donor-acceptor interactions. Conclusion: atomic nitrogen has difficulty finding a compatible orbital on the Ti3Sb surface, while hydrogen atoms easily do so.
2. Composition and electronic structure of Ti3Sb. Ti3Sb is an intermetallic compound, where Ti, a transition metal, produces d-orbitals; Sb is a semimetal with high electronegativity (~2.05), which can be considered a “sink” for Ti’s electron density. As a result, the Ti3Sb surface may be charge- and orbitally suboptimal for strong nitrogen adsorption. The d-orbitals of Ti may be partially filled and may not be available for strong bonding with N. Conclusion: the electronic state of Ti on the surface is not capable of effectively capturing and stabilizing nitrogen (including due to the strong π-electron nature of N).
3. Differences in radii and steric effects. Atomic nitrogen is larger than hydrogen but has a lower tendency to form strained bonds. However, steric effects and the arrangement of the Ti and Sb atoms may not favor a stable geometry for N. Conclusion: geometrically, Ti3Sb can be considered a substrate that does not prefer N (no convenient sites, weak orbital match, steric hindrance).
4. Thermodynamic properties of N and H. Nitrogen prefers to form N2, a molecule with high bound energy (~9.8 eV), so atomic nitrogen is very unstable and does not tend to remain alone. Hydrogen H does not have this problem, and its atomic form is easily adsorbed, in some ways “preferably” than H2. Conclusion: even if atomic N is brought to the surface, it energetically prefers to leave it or form an N2 molecule rather than create a stable adsorption configuration.
Taking into account the above reasons for the low (N) on Ti3Sb, we can conclude. There is weak orbital bonding between the N and d-orbitals of Ti, and therefore the accessibility of donor-acceptor orbitals is low. Energetically, nitrogen prefers to remain in its molecular form (N2) rather than in its atomic form. Hydrogen is more easily adsorbed on various types of surfaces. Therefore, the Ti3Sb surface is a site for very weak fixation of atomic nitrogen.
Based on these data, it can be concluded that Ti3Sb is selective and resistant to surface poisoning. Weak N adsorption means that the Ti3Sb surface will be resistant to nitrogen-containing pollutants such as NO, NO2, NH3, etc. Therefore, Ti3Sb may be a suitable material for gas-selective sensors, such as water sensors in the presence of N2, NO, NH3, etc.
On the other hand, hydrogen will be readily captured by the Ti3Sb surface, which is important for systems requiring selective H2 capture. In other words, strong H2 adsorption on the surface may indicate the potential of Ti3Sb as a material for hydrogen storage (if desorption is possible under suitable conditions) or for water separation in membrane systems.
B. Relationship between adsorption energy and activation energy
Let us consider the relationship between the nitrogen adsorption energy and the activation energy of the surface of a cubic Ti3Sb crystal. The adsorption and surface activation energies are related through the electron-structural changes in the crystal during adsorption. This demonstrates how nitrogen interacts with the surface of the Ti3Sb crystal lattice.
It is known that adsorption energy is the energy released (or absorbed) when an atom or molecule (in our case, nitrogen) attaches to a surface. depends on the nature of the surface (coordination numbers, local electron density), the type of adsorbent (N atom, N2 molecule), the presence of defects, doping, etc.
The activation energy of a surface is the barrier for a certain reaction (e.g., dissociation of N2, migration of atoms, or further doping). The stronger the nitrogen atom’s bond to the surface (the higher the ), the greater the contribution of its orbitals to the local electronic structure of the Ti3Sb surface. This can alter (decrease or increase) for the next step (reaction or nitrogen atom migration), depending on the nature of the bond (covalent, ionic, donor-acceptor).
For some simple surface reactions (especially on metals and semiconductors), there is a so-called linear Brønsted–Evans–Polanyi (BEP) relationship:
where is the energy effect of the reaction (can be related to ), , are empirical constants for a given material and reaction.
In the case of nitrogen doping, if nitrogen is adsorbed with high energy and readily diffuses into the crystal, this can be considered a low activation energy for doping. For example, on the surface of cubic TiN or ZrN, where nitrogen is adsorbed with strong covalent bonds, a low energy barrier to nitrogen diffusion into the crystal bulk can be expected. On inert surfaces (e.g., oxides), weak nitrogen adsorption can correspond to a high energy barrier to N2 dissociation.
Thus, there is a relationship between and via the local electron structure and the BEP rules. However, this relationship is usually nonlinear and depends on the reaction context.
B. Alloying
Alloying and heat treatment are known to significantly improve the mechanical properties (e.g., antifriction) of titanium alloys. However, chemical-thermal nitriding can improve these properties [19,20,21].
Ti3Sb 2×1×1 supercells were modeled by doping with N atoms, where N atoms individually replace Sb (Figure 2) and Ti (Figure 3) atoms.
The cubic three-dimensional structure of Ti3Sb A15 can be represented as a single Ti atom bonded to two other Ti atoms and four Sb atoms in a lattice. The Ti–Ti bond length is 2.61 Å, and the Ti–Sb bond length is 2.92 Å. In this lattice, a given Sb atom is bonded to twelve Ti atoms, forming SbTi12 cuboctahedra that share edges and faces.
Figure 4 shows the Brillouin zone of the cubic Ti3Sb structure, where the Γ–X–M–X plane corresponds to the Fermi surface.
Partial replacement of Ti or Sb atoms with nitrogen atoms at the Ti3Sb crystal lattice sites alters the structural parameters (bond lengths, electronic properties). This may be due to differences in the oxidation states and ion sizes of the components of the Ti3Sb–N system: Ti+3 (0.67 Å), Sb+3 (0.76 Å), and N+3 (0.16 Å). Thus, it has been established that partial nitrogen doping affects the interatomic distances between Ti and Sb atoms near the N atom in Ti3Sb–N and the electronic structure (Table 2).
In the ordered crystal structure of the Ti3Sb compound, Sb is a p-element (5 valence electrons), and Ti is a transition metal (4 valence electrons; 3d24s2). In compounds, antimony can exhibit oxidation states of -3, +3, and +5, while Ti can exhibit oxidation states of +2, +3, and +4.
Consider doping the Ti3Sb–N system with nitrogen N. Nitrogen has 5 valence electrons (2s22p3), like Sb, but the nitrogen atom is significantly smaller than the Sb atom. N has a higher electronegativity (~3.0 for N and ~2.05 for Sb). Therefore, the electron density of Ti3Sb–N(doped) can change with partial substitution of N for Sb. In this case, N more strongly attracts electrons from Ti3Sb, which can be considered as local electron depletion of the neighboring Sb (or Ti) atom. This nitriding can be considered as -alloying in the Ti3Sb crystal structure, where Ti donates electrons to the Sb atom.
C. Density of States
The effect of nitrogen doping on the electronic structure of Ti3Sb is manifested in the density of states DOS spectra. The introduction of a nitrogen atom into the Ti3Sb–N(doped) lattice alters the electronic structure of Ti3Sb, leading to an increase in the binding energy difference between the Ti–N and Ti–Sb chemical bonds. Energetically, this manifests itself as a slight increase in the band gap of the Ti3Sb semimetal and a shift in the Fermi level (depending on the N dopant concentration) in the band structure. The partial DOS peaks of the Ti3Sb–N(doped) supercells, associated with the p-orbitals of Sb atoms and/or d-orbitals of Ti, are replaced by the low-energy orbitals of the nitrogen impurity atoms (Figures 7, 8).
The Ti3Sb–N DOS spectra along the Γ–X direction of the wave vector differ from each other, as can be seen in Figure 7 and Figure 8. The Ti3Sb–N DOS and PDOS spectra also differ from the PDOS spectra of the pure Ti3Sb supercell [25]. The valence band contains Sb-[Kr]4d105s25p3 states, approximately 5 eV below the Fermi energy . Furthermore, the Ti3Sb–N DOS and PDOS peaks become intense near at the Γ point (Figure 8). This may be due to the 3d-t2g states characteristic of Ti-[Ar]3d24s2 (Figure 9), occupied by electrons of the N-[He]2s22p3 dopant.
D. Surface anisotropy
Surface anisotropy in cubic crystals arises from differences in the atomic structure and electronic properties of the various crystallographic faces (e.g., (100), (110), (111), even if the crystal has high symmetry in the bulk.
In general, electron anisotropy in crystals with a cubic structure can arise due to:
- anisotropy of the electron effective mass (near band minima);
- the crystal potential, which, although symmetrical on average, can lead to a directional dependence of properties (for example, due to the band structure);
- spin-orbit interaction;
- crystal deformations (mechanical stress);
- the presence of impurities or defects that break symmetry.
Cubic structures (FCC, BCC, SC, DC, NaCl, TiN, etc.) have high volumetric symmetry. Different faces have different numbers of neighbors, angular bonds, packing density, etc. As soon as the crystal is destroyed and a surface is created, the symmetry of the bulk crystal is broken. In other words, the formation of a surface disrupts the symmetry of the crystal.
As an example, let’s consider the FCC structure. The (111) surface direction is the region with the highest packing density, is stable, and has a low (100) is a finer packing, with more uncanceled bonds → higher (110) has even more bond breaks → higher These differences lead to different surface energies . This is called surface energy anisotropy.
After the surface is formed, the atoms relax, changing the interatomic distances and local electron density. The (111) face can relax differently than the (100) face; this is called electron anisotropy. In metallic systems (e.g., FCC Ni, Cu), anisotropy is formed due to d-electrons, which are distributed differently on different faces. In ionic crystals (e.g., NaCl, TiN), anisotropy is formed due to the uneven distribution of ions on different garnets. In covalent crystals (e.g., C, Si, Ge, Sb), anisotropy is formed due to the different topologies of chemical bonds (for (111) and (100)).
The higher the atomic density at the boundary (Miller indices and packing density), the higher the protection of the surface atoms and the lower the surface energy of the crystal, i.e., the more stable the facet. The general dependence of surface energy on facet and packing density for the FCC cubic structure is presented in Table 3.
Thus, surface anisotropy is the difference in surface energies of different planes:
The value of γ can be calculated using the DFT method for each plane of the supercell:
Although cubic symmetry theoretically implies isotropy, real crystals exhibit anisotropic behavior due to:
- differences in the effective mass of electrons along different directions;
- electron bands, which can have an ellipsoidal shape (for example, in silicon, the conduction bands have six ellipsoids along the [100] axes);
- spin-orbit splitting, especially in heavy elements.
Conclusion. Surface anisotropy of cubic crystals is due to differences in geometry (atomic density, bond cleavages), electronic properties (local density of states, relaxation), and crystallography (face indices).
Let’s consider the DOS taking into account crystallographic directions, for example, in a cubic crystal. DOS is a scalar quantity that depends on energy but not direction. However, the anisotropy of the band structure means that the contribution to DOS from different crystallographic directions can differ.
That is, the DOS itself does not explicitly depend on direction, but the group velocity, dispersion , and other crystal characteristics can be significantly directional. In the isotropic case (e.g., free electrons) is independent of direction. In a crystal, due to the complex shape of the bands, the bands can be denser in states in certain directions. For example, if the dispersion in [111] is flatter than in [100], then there are more states at the same energy.
The influence of cubic crystal directions manifests itself in the following cases: Partial density of states (PDOS) – if we consider the contribution from specific atomic directions (orbitals). Fermi surface orientation – different directions produce different surface cross-sections, which influence the electron density. Anisotropy of transport properties – for example, thermoelectric properties or thermal conductivity of the crystal.
Thus, electron anisotropy arises from differences in the dispersion of despite cubic symmetry; this is determined experimentally or through band calculations. The DOS is generally a scalar, but the band shape and dispersion anisotropy contribute to the DOS, making it directionally dependent. This manifests itself in the transport properties and DOS spectra.
There is no universal formula for the DOS for anisotropic electrons. For this, we will use the theory and the effective mass tensor. The DOS for the isotropic case of free electrons with parabolic dispersion is
Then in three dimensions for the kinetic energy density of an electron we can write:
where is the bottom of the zone or the level relative to which the energy is calculated. This expression assumes that the effective mass is the same in all directions.
The DOS for the anisotropic case will include the anisotropic effective mass and the mass tensor. If the dispersion is anisotropic, then for small deviations from the zone minima:
where are the components of the inverse effective mass tensor.
If the system allows the selection of principal axes, the mass tensor becomes diagonal:
where , are the effective masses along the principal directions.
In a cubic crystal, with complete symmetry, should be true. However, due to the peculiarities of the zone, there may be cases where different directions of the crystal are poorly approximated by a single mass.
Therefore, let’s consider the DOS for the anisotropic case in terms of the mass tensor. For the case with a diagonal mass tensor, the DOS expression is:
where the integration is over the surface of constant energy .
Substituting the parabolic anisotropic form into this expression, we obtain:
After transformations, the final result for small deviations is obtained in the form:
or:
That is, the effective DOS mass in the anisotropic case is the geometric mean of the masses in three directions in the crystal:
Taking this into account, the DOS expression in the anisotropic case can be written similarly to the isotropic case, but with the contribution of .
Notes and limitations. This formula is valid only near the band minimum, when the dispersion can be considered parabolic in three directions of the crystal. If the dispersion is significantly non-parabolic, or if the bands are significantly curved, then exact integration over the surface =const or numerical methods (e.g., DFT, special packages for DOS calculations) should be used.
The DOS spectra of Ti3Sb–N along the Γ–X direction of the wave vector differ from each other, as can be seen from Figure 7 and Figure 8. They also differ from the DOS spectra of the pure Ti3Sb supercell [25]. In addition to the Sb 5p valence bands located approximately 5 eV below the Fermi energy , the intensity of the peaks near at the Γ point (Figure 9) can be due to the 3d-t2g states (Figure 10) characteristic of Ti, occupied by the electrons of the N dopant.
The anisotropic dispersion of the electron pocket bands t2g of cubic crystals containing titanium [29] can be expressed in terms of the effective mass model:
where ℏ is the reduced Planck constant.
Taking this into account, as well as the sixfold degeneracy of the t2g bands due to spin and orbital degrees of freedom, the electron carrier density for occupied states in Ti3Sb–N can be estimated as:
The stability of the obtained Ti3Sb–N structures with partial substitution of Ti3Sb components with nitrogen was estimated by calculating the formation energy:
where is the formation energy, and are the total energies of nitrogen-doped Ti3Sb and pure Ti3Sb, respectively; are the chemical potentials of the dopant nitrogen and the Ti and/or Sb components, respectively; is the number of Ti or Sb atoms replaced by the dopant nitrogen atom.
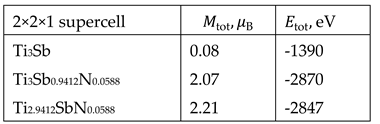
The calculations assume that the dopant nitrogen atoms replace Ti or Sb atoms. The ratio of the chemical potential [30] is defined as . Calculation results showed that partial replacement of Ti or Sb in the Ti3Sb lattice with nitrogen impurity atoms leads to a negative formation energy for Ti3Sb–N structures. On average, = -0.32 eV for these structures. This indicates favorable incorporation of nitrogen impurity atoms into the Ti3Sb crystal lattice. DFT LSDA calculated of pure Ti3Sb is = -0.38 eV/atom [25].
The calculated energy levels remain nearly identical for both spin-up and spin-down states in the density-of-state spectra of Ti3Sb–N (Figures 8, 9). That is, these energies for both spin orientations differ little from each other in Ti3Sb–N. The band gap for Ti3Sb–N, calculated based on highly symmetric k-points, is 0.009 eV. A local magnetic moment was detected in Ti3Sb–N using the Mulliken method (Table 4).
Both nitrogen adsorption on the surface and the incorporation of the nitrogen atom into the lattice of the cubic Ti3Sb A15 crystal can also depend on the anisotropy and crystallographic orientation of the structural planes. These data can be used to specifically control the electronic, mechanical, and catalytic properties of Ti3Sb-based materials. These findings are important for the development of new nitrogen-containing functional materials that are resistant to oxidation and suitable for applications such as electronics, catalysis, and sensors.
5. Conclusions
Supercell models of cubic Ti3Sb crystals containing atomic nitrogen were created, taking into account the effects of coating, various surface orientations (111), (100), and (110), as well as the activation energy of the Ti3Sb surface. The adsorption properties of nitrogen, as well as the partial substitution of Ti and Sb atoms by an impurity of atomic nitrogen, were calculated using the DFT GGAS PBE method taking into account the spin polarization for different parts of the Ti3Sb surface (top – T, bridge – B, hollow – H).
1. It was shown that low coverage (e.g., (N) = 1/9 ML in a 3 × 3 Ti3Sb(111)–N(ads) supercell) minimizes the interaction between adsorbed nitrogen atoms. This allows us to determine the energy for a single adsorbed N(ads) atom near a given position in the Ti3Sb–N supercell.
2. Calculations show that the dependence of the adsorption energy on coverage has a minimum, which corresponds to the optimal nitrogen coverage on Ti3Sb. The adsorption energy of atomic nitrogen differs significantly from the adsorption energy of atomic hydrogen on similar 2 x 2 Ti3Sb(110)–H supercells with a coating thickness of = 0.25 ML.
3. The activation energies of nitrogen adsorption differ for different faces: Ti3Sb(111), Ti3Sb(110), and Ti3Sb(100). The most stable nitrogen adsorption configuration is the (111) face on Ti3Sb, with an adsorption energy of –3.11 eV (nitrogen adsorption in the octahedral interstitial site in Ti3Sb with an average N–Ti distance of 2.111 Å). The adsorption energies of nitrogen on Ti3Sb(100) are lower than on Ti3Sb(110), at –0.87 and –0.15 eV, respectively.
4. The energetically favorable adsorption trajectory for atomic N is the hollow site adsorption form located near two adjacent Ti3Sb atoms.
5. It was established that, like the behavior of the nitrogen adatom on the surface, the effect of the admixture of atomic nitrogen in the bulk of the Ti3Sb lattice depends on the crystallographic directions, which is associated with the anisotropy of the local atomic environment of Ti3Sb–N. Partial substitution of Sb and/or Ti by nitrogen in their various positions in the Ti3Sb structure leads to a change in the band structure and local magnetic moment in Ti3Sb–N.
6. The calculated band gap, based on highly symmetric k-points, is 0.009 eV for Ti3Sb–N. A change in the electron density distribution creates local magnetic states in Ti3Sb when it is doped with atomic nitrogen. The partial magnetic moment with partial substitution of Ti sites by atomic nitrogen in Ti3Sb–N was 2.21 . The partial magnetic moment with partial substitution of Sb sites by nitrogen was lower than with Ti substitution and was 2.07 .
Thus, the new data obtained on the electron density of states DOS and adsorption energy for Ti3Sb–N play a key role in understanding the functions of Ti3Sb–N and serve as the basis for its applied evaluation in sensors, catalysis, and energy. Furthermore, they are important for predicting the surface behavior and bulk properties of Ti3Sb under real-world conditions and serve as a basis for the development of new, more effective adsorbents and doped systems.
Author Contributions
M.M.A.: Data Curation (Lead); Formal Analysis (Equal); Investigation (Equal); Validation (Equal); Visualization (Lead); Writing – Original Draft (Equal). SN.M.: Conceptualization (Lead); Formal Analysis (Equal); Investigation (Equal); Methodology (Lead); Software (Lead); Supervision (Equal); Visualization (Equal); Writing – Original Draft (Equal); Writing – Review and Editing (Equal). S.O.M.: Methodology (Associated); Software (Equal); Visualization (Equal).
Funding
This research received no external funding.
Conflicts of Interest
The authors declare no conflicts of interest.
References
- Yang, Q.; Zeng, F.; Chen, M.; Dai, Y.; Gao, Y.; Huang, R.; Gu, Y.; Song, I. First-principles study of nitrogen adsorption and dissociation on ZrMnFe(110). Surface. Materials. 2023, 16, 3323. [Google Scholar] [CrossRef] [PubMed]
- Araujo, R.B.; Edvinsson, T. N2 adsorption on high-entropy alloy surfaces: unveiling the role of local environments. J. Mater. Chem. A. 2023, 11(4), 12973–12983. [Google Scholar] [CrossRef]
- Guo, W.; Vlachos, D.G. Effect of local metal microstructure on adsorption on bimetallic surfaces: Atomic nitrogen on Ni∕Pt(111). J. Chem. Phys. 2013, 138(17), 174702. [Google Scholar] [CrossRef]
- Zeinalipour-Yazdi, C.D.; Catlow, V. DFT-D3 study of H2 and N2 chemisorption over cobalt promoted Ta3N5-(100), (010) and (001) surfaces. Phys. Chem. Chem. Phys. 2017, 19, 11968. [Google Scholar] [CrossRef] [PubMed]
- Shadid, W.; Veser, G. Optimization of high-entropy alloy catalyst for ammonia decomposition and ammonia synthesis. J. Phys. Chem. Lett. 2021, 12, 5185−5192. [Google Scholar] [CrossRef] [PubMed]
- Fei, Y.F.; Wang, Y.K.; Xu, F.F.; Ke, T. Effects of interstitial nitrogen atoms on atomic oxygen adsorption on Fe (001) surface from Ab Initio calculations. Trans Tech Publications Ltd. Mater. Sci. Forum. 2017, 898, 849–855. [Google Scholar] [CrossRef]
- Domain, C.; Becquart, C.C.; Foct, J. Ab initio study of foreign interstitial atom (C, N) interactions with intrinsic point defects in 𝑎 − Fe . Phys. Rev. B. 2004, 69(14), 144112. [CrossRef]
- Gollapalli, P.; Varalakshmi, J.; Kishor, P.; Oza, P. , Yadav, S. K. Atomically chemically graded Ti/TiN interface. Appl. Surf. Sci. 2022, 597, 153637. [Google Scholar] [CrossRef]
- Yeo, S.C.; Han, S.S.; Lee, H.M. Adsorption, dissociation, penetration, and diffusion of N2 on and in bcc Fe: firstprinciples calculations. Phys. Chem. Chem. Phys. 2013, 15(14), 5186–5192. [Google Scholar] [CrossRef] [PubMed]
- Ghosh, S.; Nath, P.; Sanyal, D. Adsorption and evolution of N2 molecules over ZnO monolayer: a combined DFT and kinetic Monte-Carlo insight. Adsorption. 2024, 30, 2255–2265. [Google Scholar] [CrossRef]
- Bai, H.; Chen, D.; Ma, Q.; Qin, R.; Xu, H.; Zhao, Y.; Chen, J.; Mu, S. Atom doping engineering of transition metal phosphides for hydrogen evolution reactions. Electrochem. Energy Rev. 2022, 5(2), 24. [Google Scholar] [CrossRef]
- Zou, L.; Zhu, Y.; Cen, W.; Jiang, X.; Chu, W. N-doping in graphdiyne on embedding of metals and its effect in catalysis. Appl. Surf. Sci. 2021, 557, 149815. [Google Scholar] [CrossRef]
- Yu, Q.; Qiu, S.; Jiao, Z.B. Atomic-scale understanding of interstitial-strengthened highentropy alloys. Rare Met. 2025, 44(9), 6002–6014. [Google Scholar] [CrossRef]
- Jana, D.; Sun, C.-L.; Chen, L. –C.; Chen, K.-H. Effect of chemical doping of boron and nitrogen on the electronic, optical, and electrochemical properties of carbon nanotubes. Prog. Mater. Sci. 2013, 58(5), 565–635. [CrossRef]
- Yang, S.; Liu, Y.; Lei, G.; Xie, Y.; Peng, L.; Xu, H.; Wang, Z.; Gu, Z. A DFT study on the hydrogen storage performance of MoS2 monolayers doped with group 8B transition metals. Int. J. Hydrog. Energy. 2021, 46, 24233–24246. [Google Scholar] [CrossRef]
- Zhao, P.; Zheng, J.; Guo, P.; Jiang, Z.; Cao, L.; Wan, Y. Electronic and magnetic properties of Re-doped single-layer MoS2: A DFT study. Comput. Mater. Sci. 2017, 128, 287–293. [Google Scholar] [CrossRef]
- Zhu, J.; Zhang, H.; Tong, Y.; Zhao, L.; Zhang, Y.; Qiu, Y.; Lin, X. First-principles investigations of metal (V, Nb, Ta)-doped monolayer MoS2: Structural stability, electronic properties and adsorption of gas molecules. Appl. Surf. Sci. 2017, S0169433217311820. [Google Scholar] [CrossRef]
- Zhang, L.; Liu, T.; Li, T. ; Hussain,S. A study on monolayer MoS2 doping at the S site via the first principal calculations. Physica E: Low-dimensional Systems and Nanostructures. 2017, S1386947717308275. [CrossRef]
- Lee, D.B.; Pohrelyuk, I.; Yaskiv, O.; Lee, J.C. Gas nitriding and subsequent oxidation of Ti-6Al-4V alloys. Nanoscale Res. Lett. 2012, 7(1), 21. [Google Scholar] [CrossRef] [PubMed]
- Wang, C.; Zhang, K.; Song, P.; Hu, X.; Mu, J.; Miao, Z.; Zhou, J.; He, H. First-principles study of nitrogen adsorption and dissociation on PuH2 (111) surface. Molecules. 2020, 25(8), 1891. [Google Scholar] [CrossRef]
- Zhecheva, A.; Malinov, A.; Sha, W. Titanium alloys after surface gas nitriding,” Surf. Coat. Technol. 2006, 201(6), 2467–2474.
- Baguer, N.; Bogaerts, A.; Gijbels, R. Hollow cathode glow discharge in He: Monte Carlo-Fluid model combined with a transport model for the metastable atoms. J. Appl. Phys. 2003, 93(1), 47–55. [Google Scholar] [CrossRef]
- Mane, R.B.; Sahoo, R.B.; Reddy, K.S.; Ravula, V. ; Panigrahi,B. B.; Borse, P.H.; Chakravarty, D. Doping-induced coloration in titania. J. Am Ceram Soc. 2021, 104, 2932–2936. [Google Scholar] [CrossRef]
- Miller, G.J.; Dissanayaka Mudiyanselage, R.S.; Xie, W. Theoretical investigations of hydrogen absorption in the A15 intermetallics Ti3Sb and Ti3Ir. Z. fur Naturforsch. Sect. B-A. J. Chem. Sci. 2021, 7, 819–826. [Google Scholar] [CrossRef]
- Asadov, M.M.; Mammadova, S.O.; Guseinova, S.S.; Mustafaeva, S.N.; Lukichev, V.F. Ab initio calculation of the band structure and properties of modifications of the Ti3Sb compound doped with lithium. Phys. Solid State. 2022, 64(11), 1594–1609. [Google Scholar] [CrossRef]
- Asadov, S.M.; Mustafaeva, S.N.; Mammadova, S.O. Modeling of hydrogen atom adsorption and diffusion in Ti3Sb intermetallic crystal with A15 cubic structure. Surfaces. 2025, 8(17), 1–28. [Google Scholar] [CrossRef]
- Liu, G.; Chen, H.; Gao, W.; Huang, Z.; Yang, Y.; Li, Z.; Yan, M.; Fu, Y. First-principles analysis on the nitrogen adsorption and diffusion in Ti alloy towards clarified diffusion mechanism in nitridin. J. Mater. Res. Technol. 2022, 21, 1479–1489. [Google Scholar] [CrossRef]
- Wakabayashi, Y.K.; Munakata, A.; Taniyasu, Y.; Kobayashi, M. Orbital-resolved anisotropic electron pockets in electrondoped SrTiO3 observed by ARPES. J. Appl. Phys. 2025, 138, 115107–7. [Google Scholar] [CrossRef]
- Henkelman, G.; Uberuaga, B.P.; Jónsson, H. A climbing image nudged elastic band method for finding saddle points and minimum energy paths. J. Chem. Phys. 2000, 113(22), 9901–9904. [Google Scholar] [CrossRef]
- Job, G.; Ruffler, R. Physikalische Chemie: Eine Einführung nach neuem Konzept mit zahlreichen Experimenten Studienbücher Chemie. Ed. 2, Springer Fachmedien Wiesbaden, 2021. 601 p ISBN9783658329358.
Figure 1.
The arrangement of different planes in a cubic unit cell.
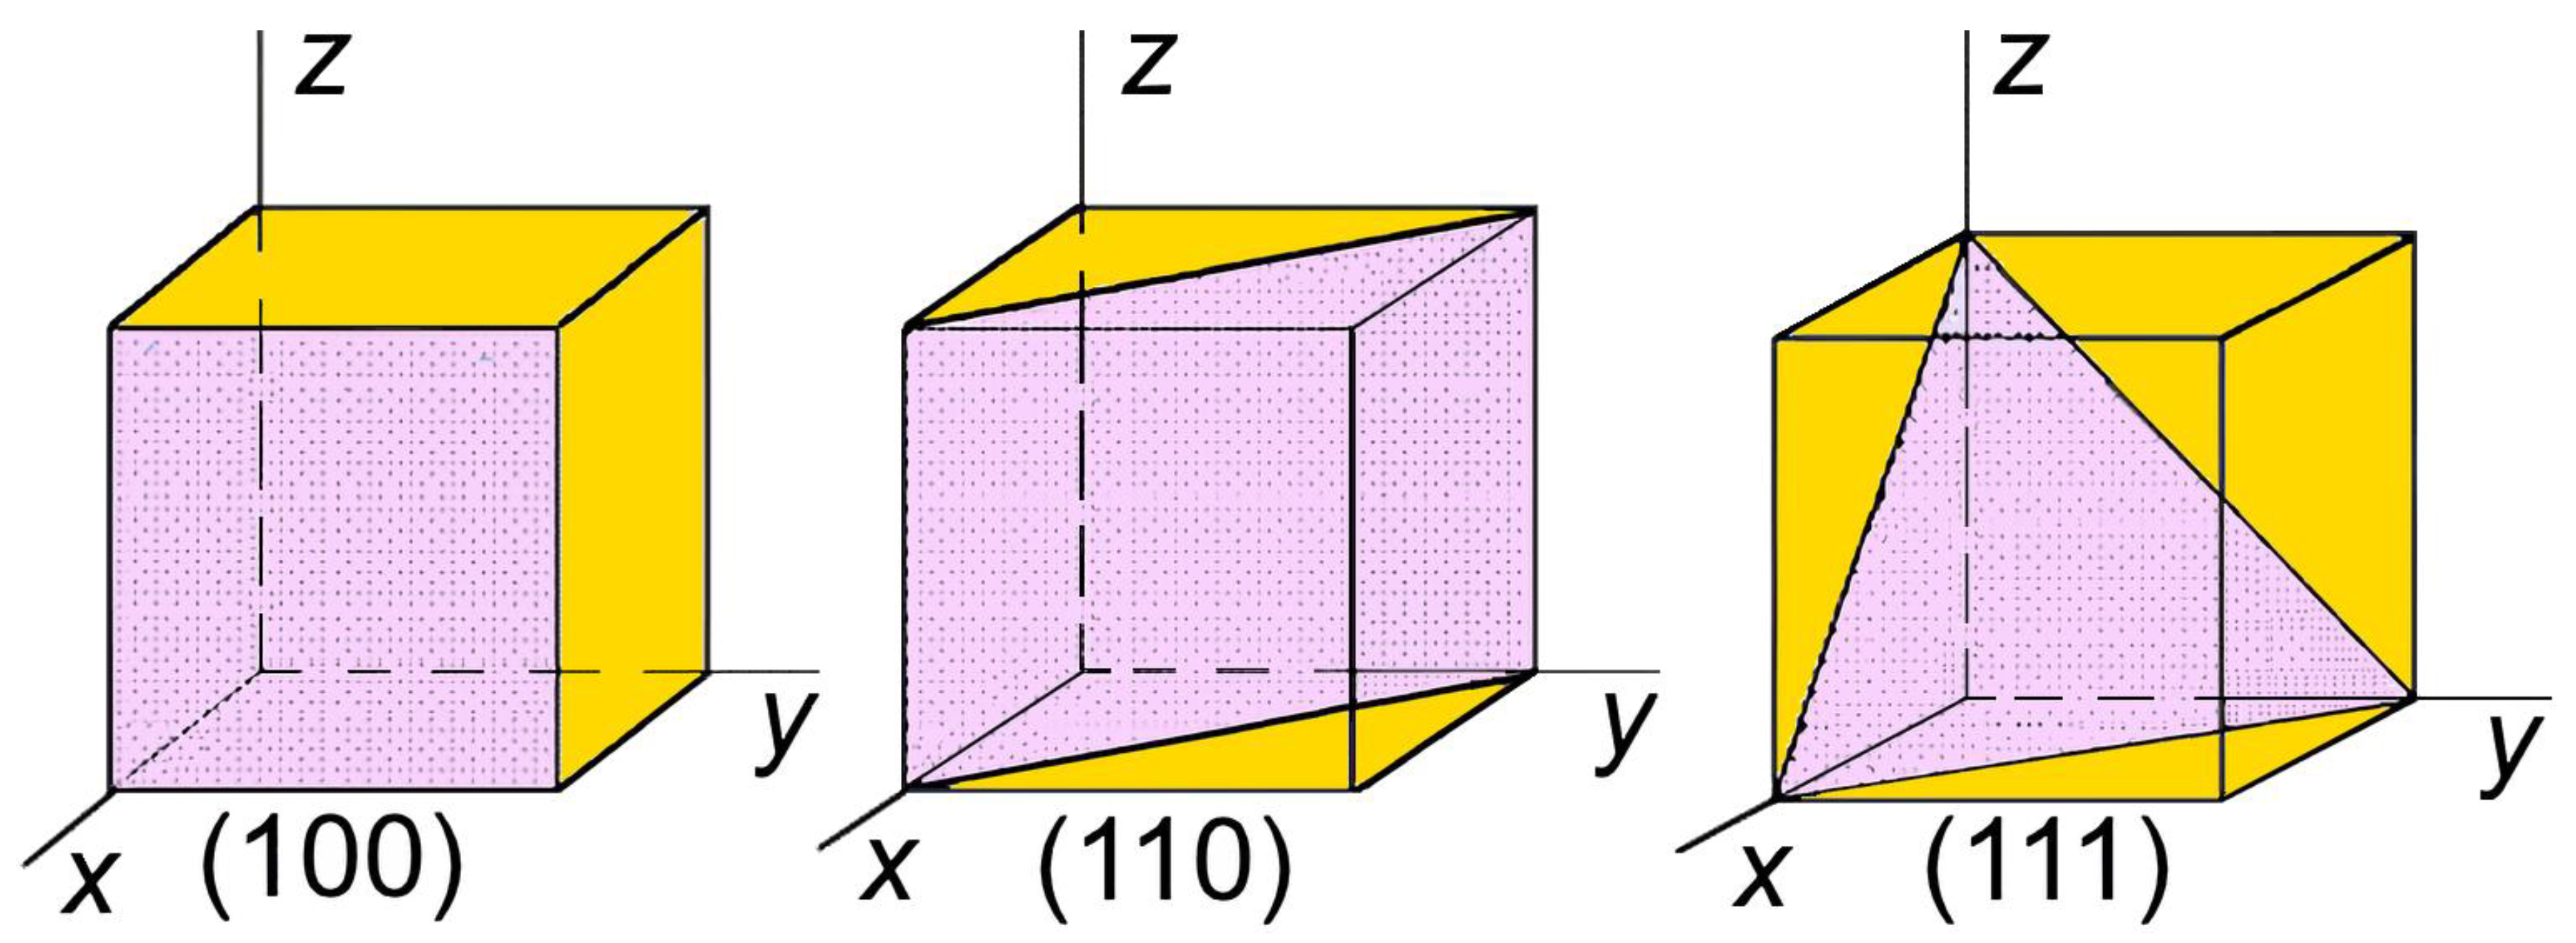
Figure 2.
Atomic structure of the cubic Ti3Sb supercell 2 × 2 × 1: a) supercell of pure Ti3Sb; supercell of Ti3Sb doped with N (Sb), b) before relaxation and c) after relaxation of the structure corresponding to the minimum energy of the Ti3Sb–N lattice.
Figure 2.
Atomic structure of the cubic Ti3Sb supercell 2 × 2 × 1: a) supercell of pure Ti3Sb; supercell of Ti3Sb doped with N (Sb), b) before relaxation and c) after relaxation of the structure corresponding to the minimum energy of the Ti3Sb–N lattice.
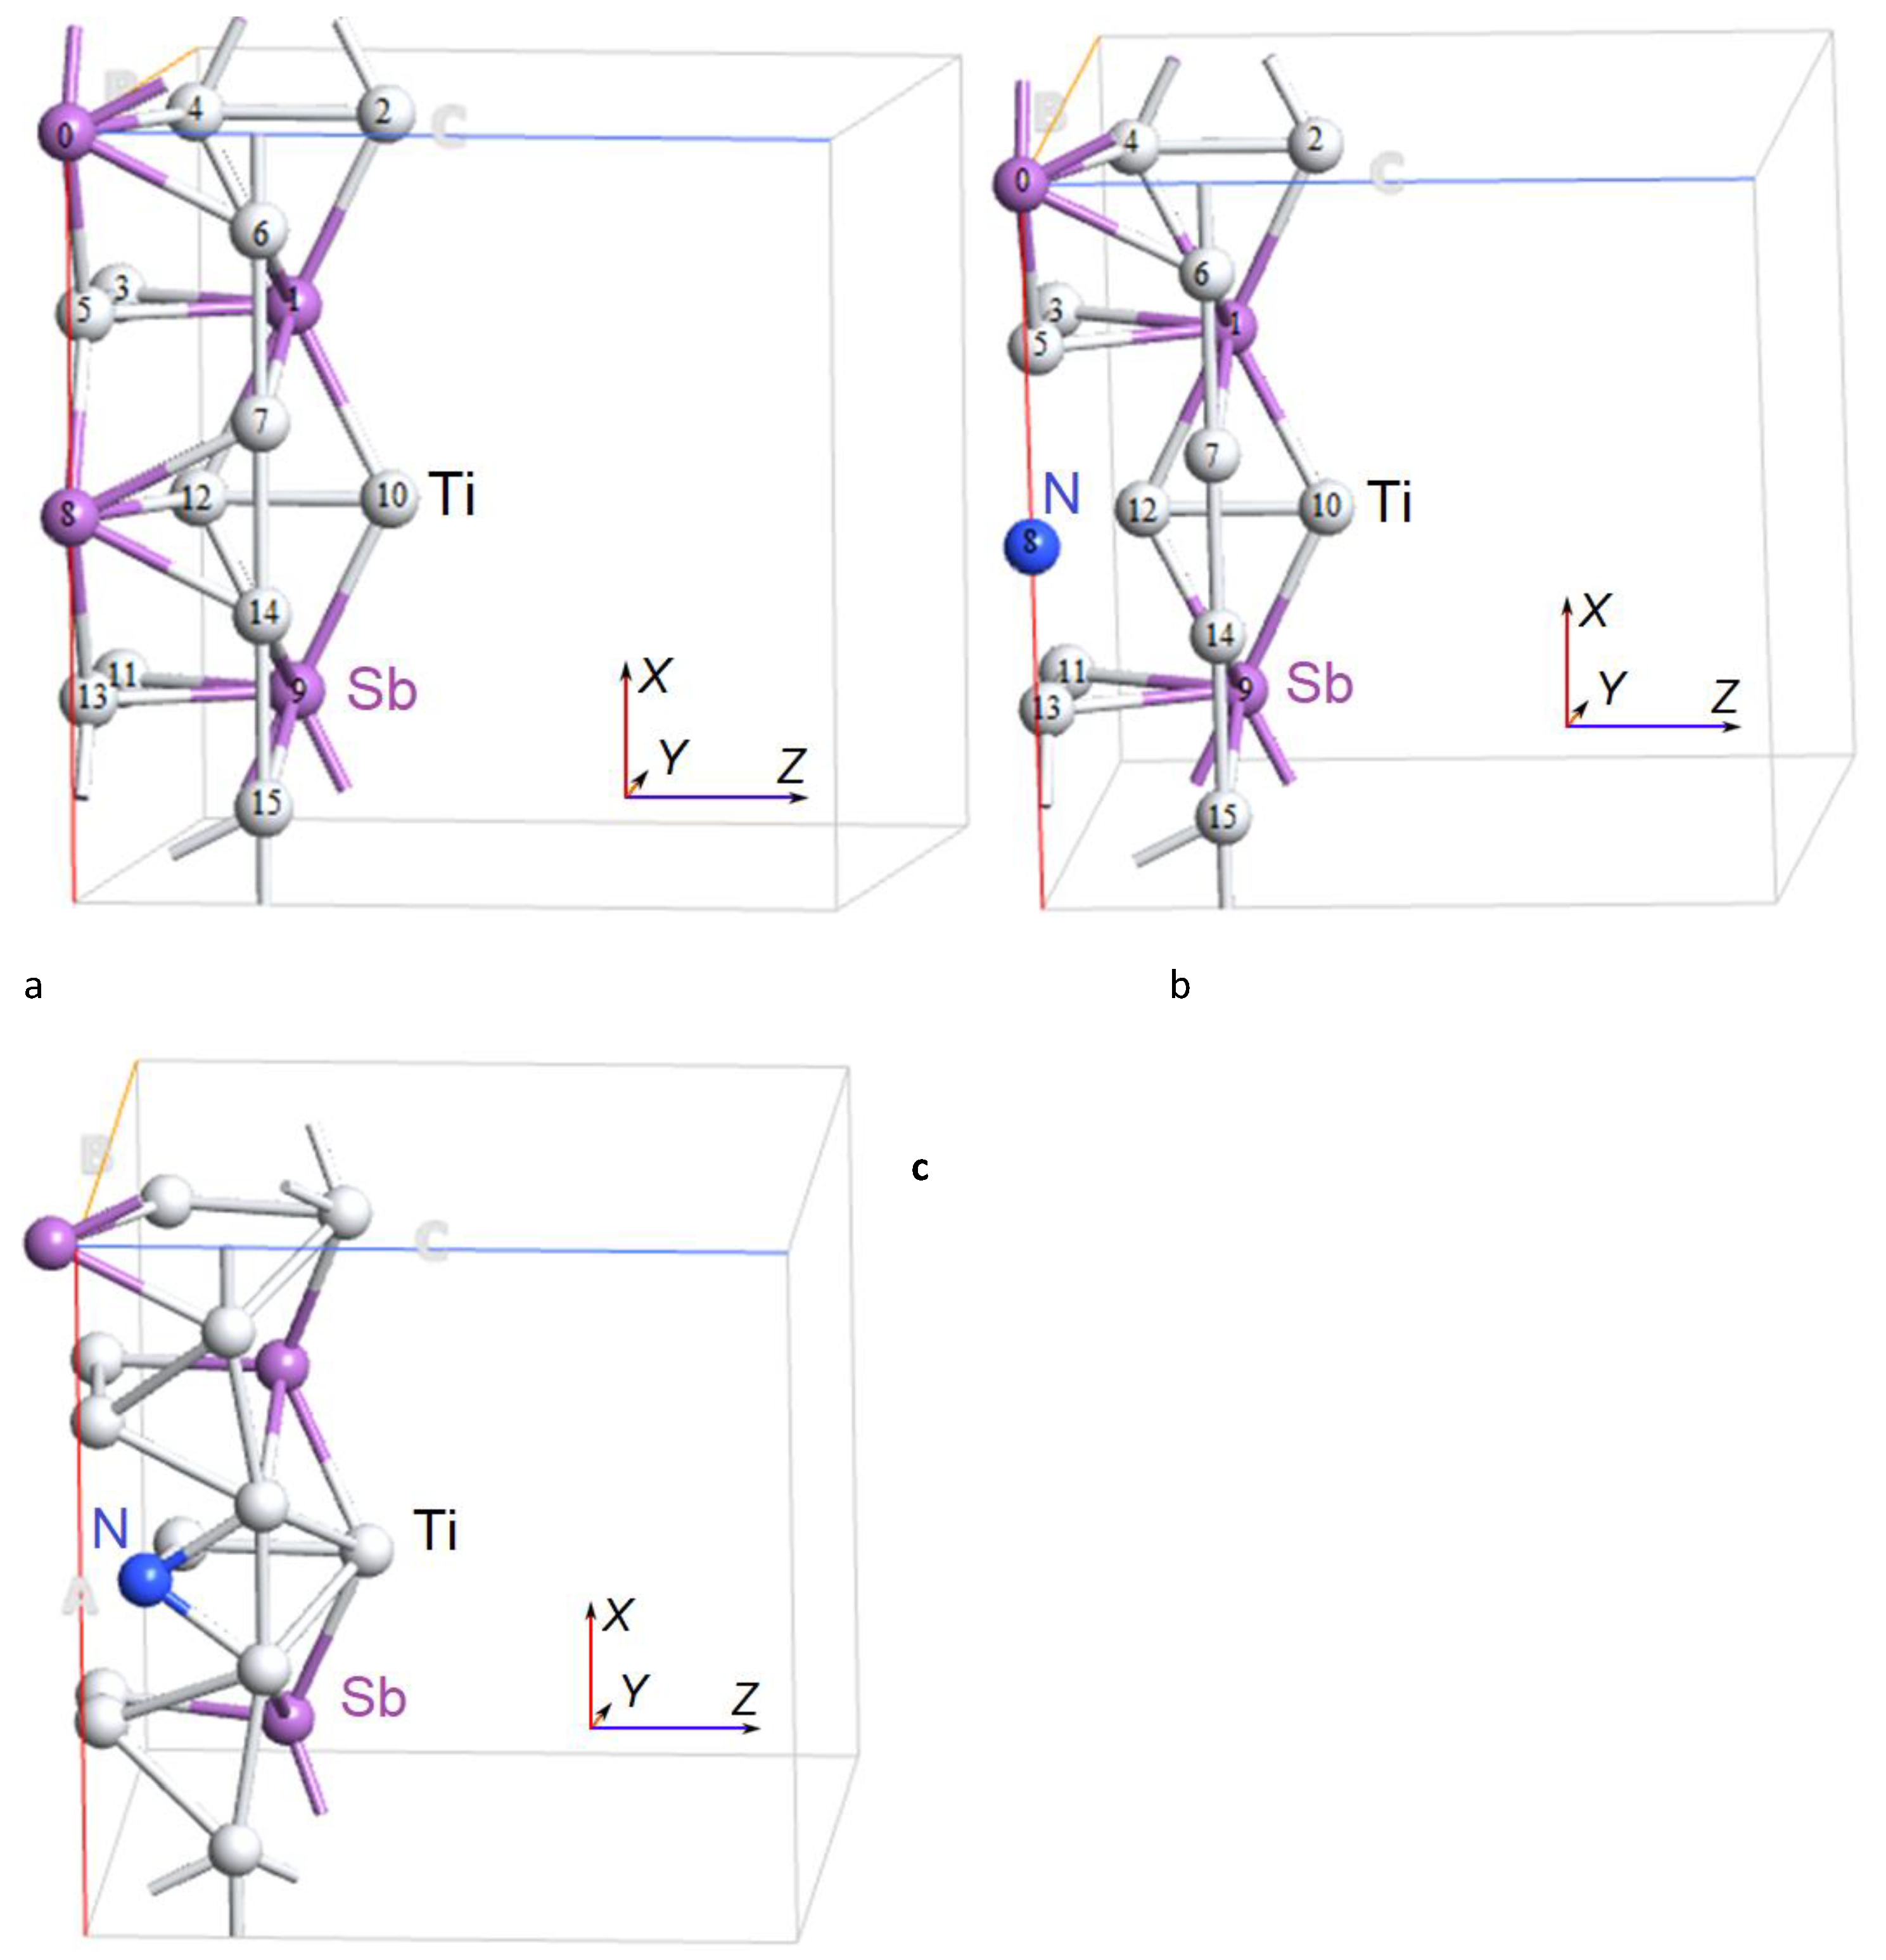
Figure 3.
Atomic structure of the Ti3Sb 2×2×1 supercell doped with N (Ti), a) before relaxation and b) after relaxation of the Ti3Sb–N structure.
Figure 3.
Atomic structure of the Ti3Sb 2×2×1 supercell doped with N (Ti), a) before relaxation and b) after relaxation of the Ti3Sb–N structure.
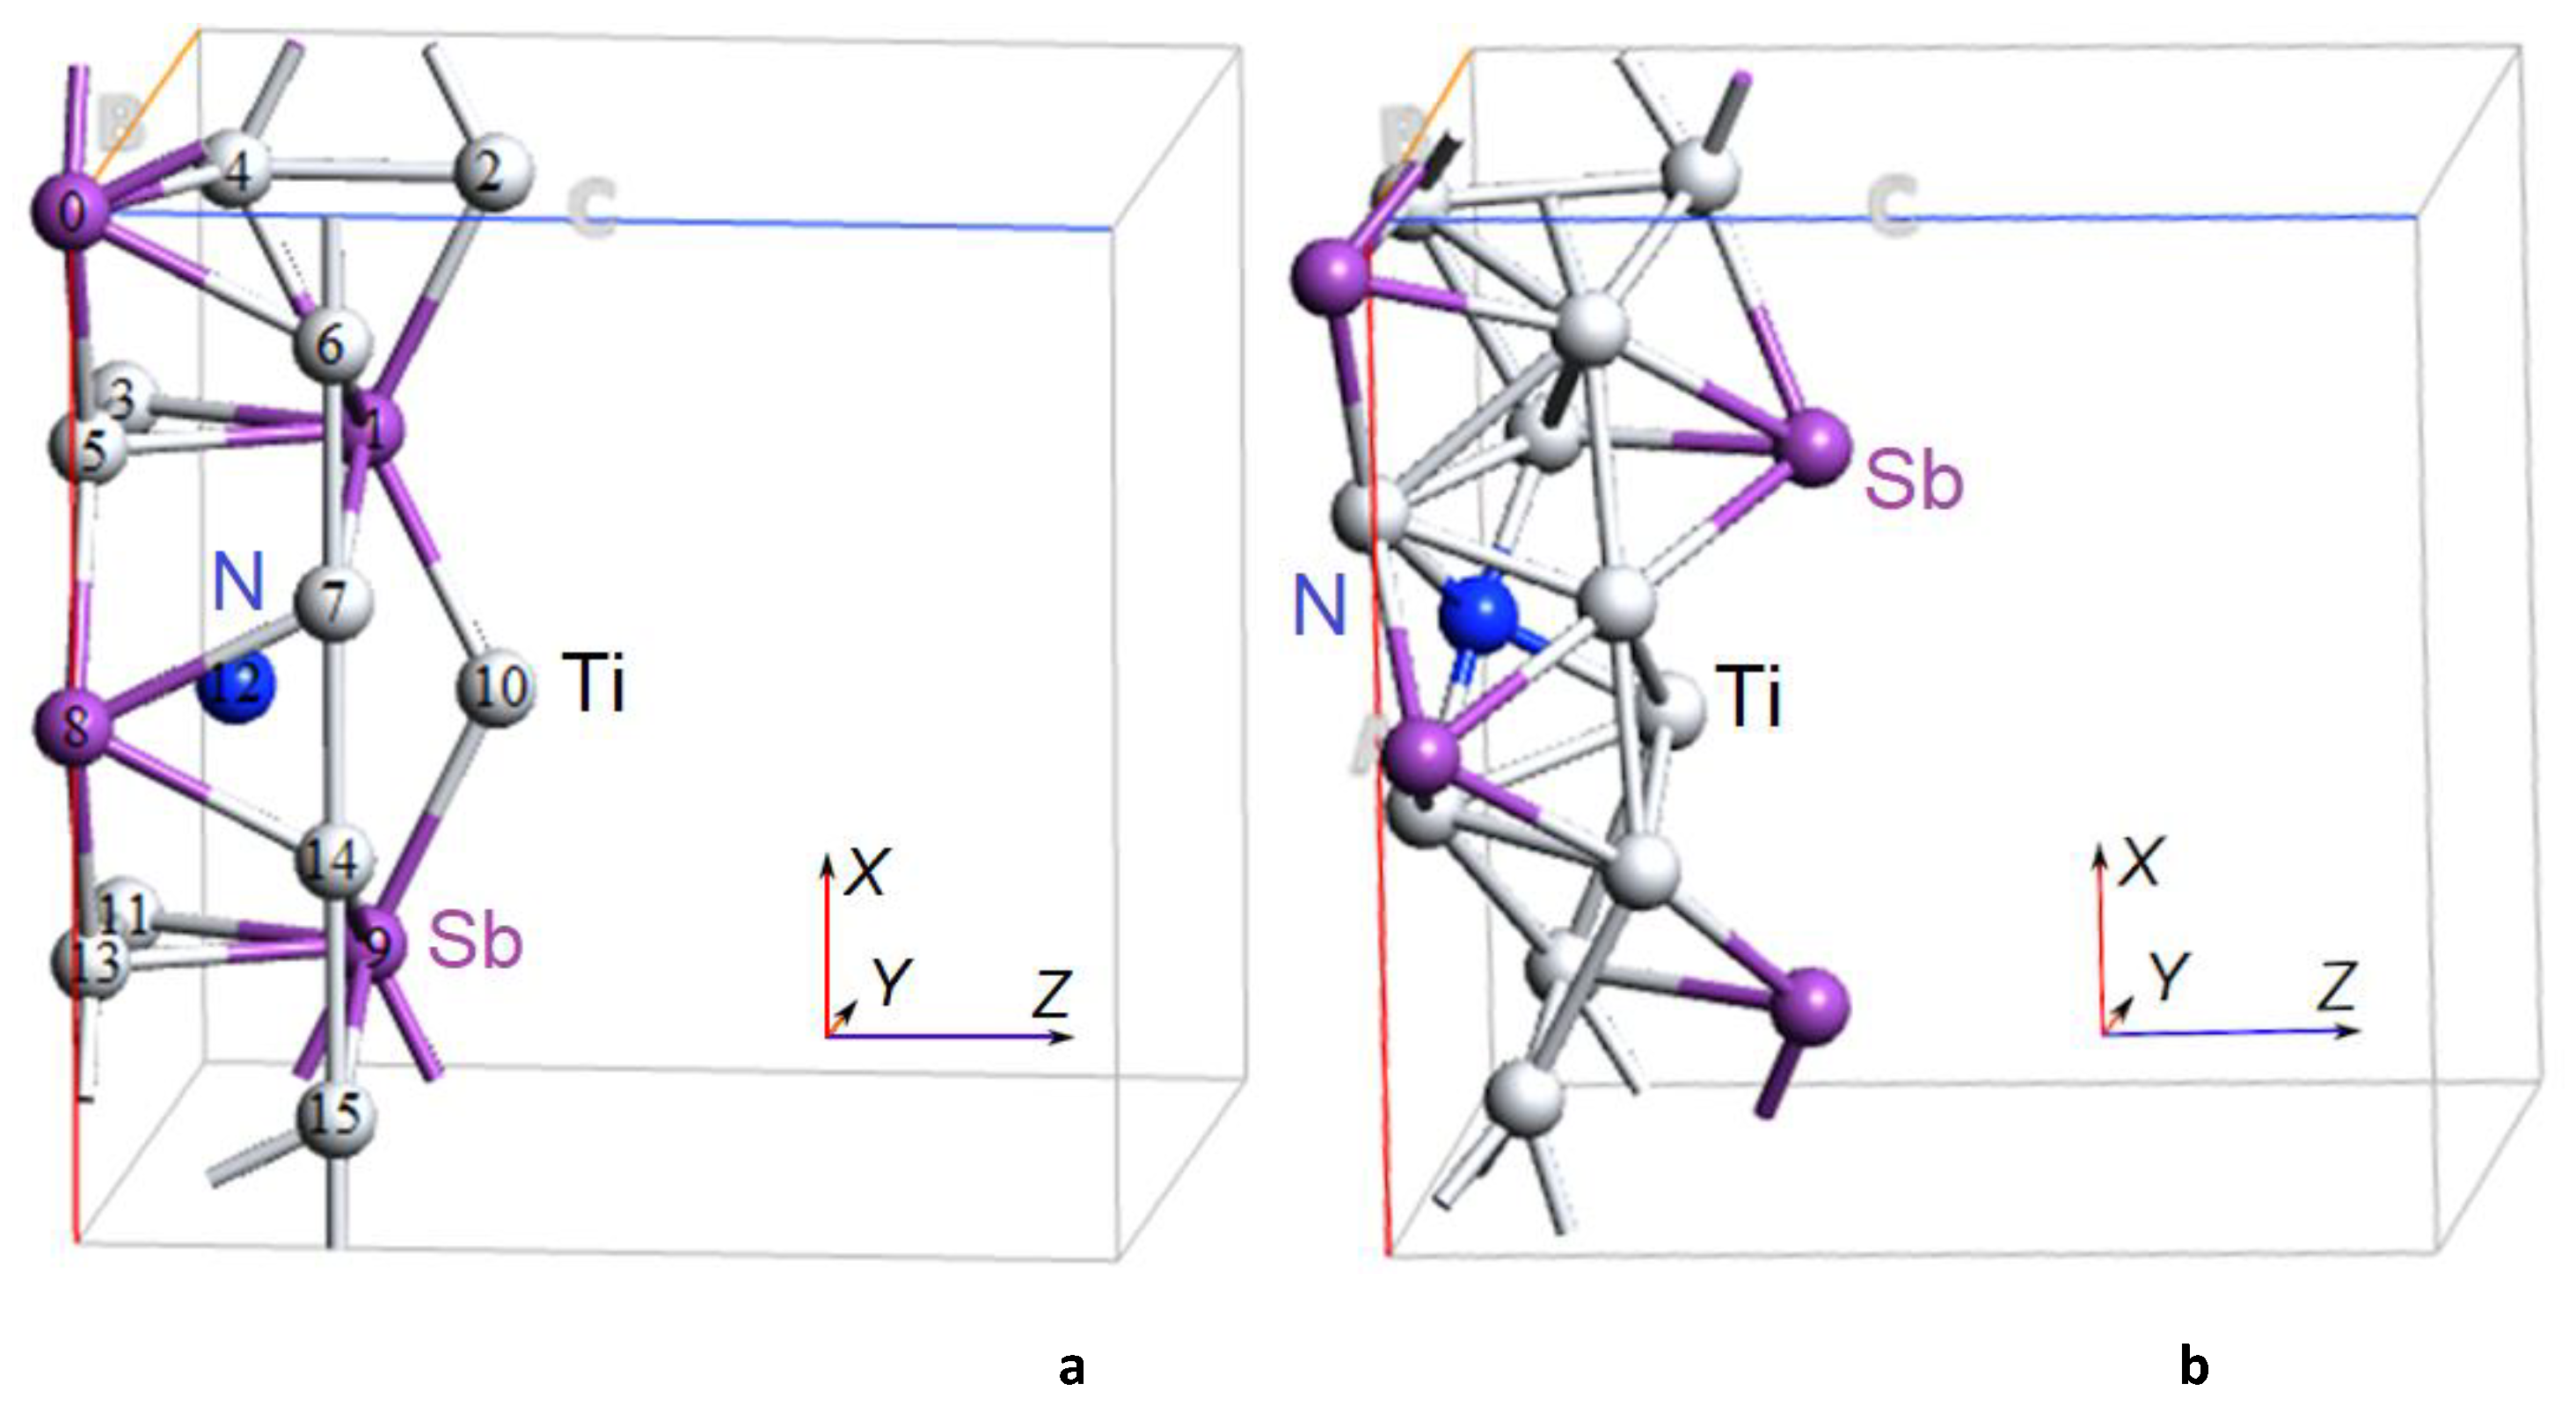
Figure 4.
a) Brillouin zone of the cubic structure of Ti3Sb with characteristic points, b) the Γ–X–M–X plane corresponds to the Fermi surface.
Figure 4.
a) Brillouin zone of the cubic structure of Ti3Sb with characteristic points, b) the Γ–X–M–X plane corresponds to the Fermi surface.
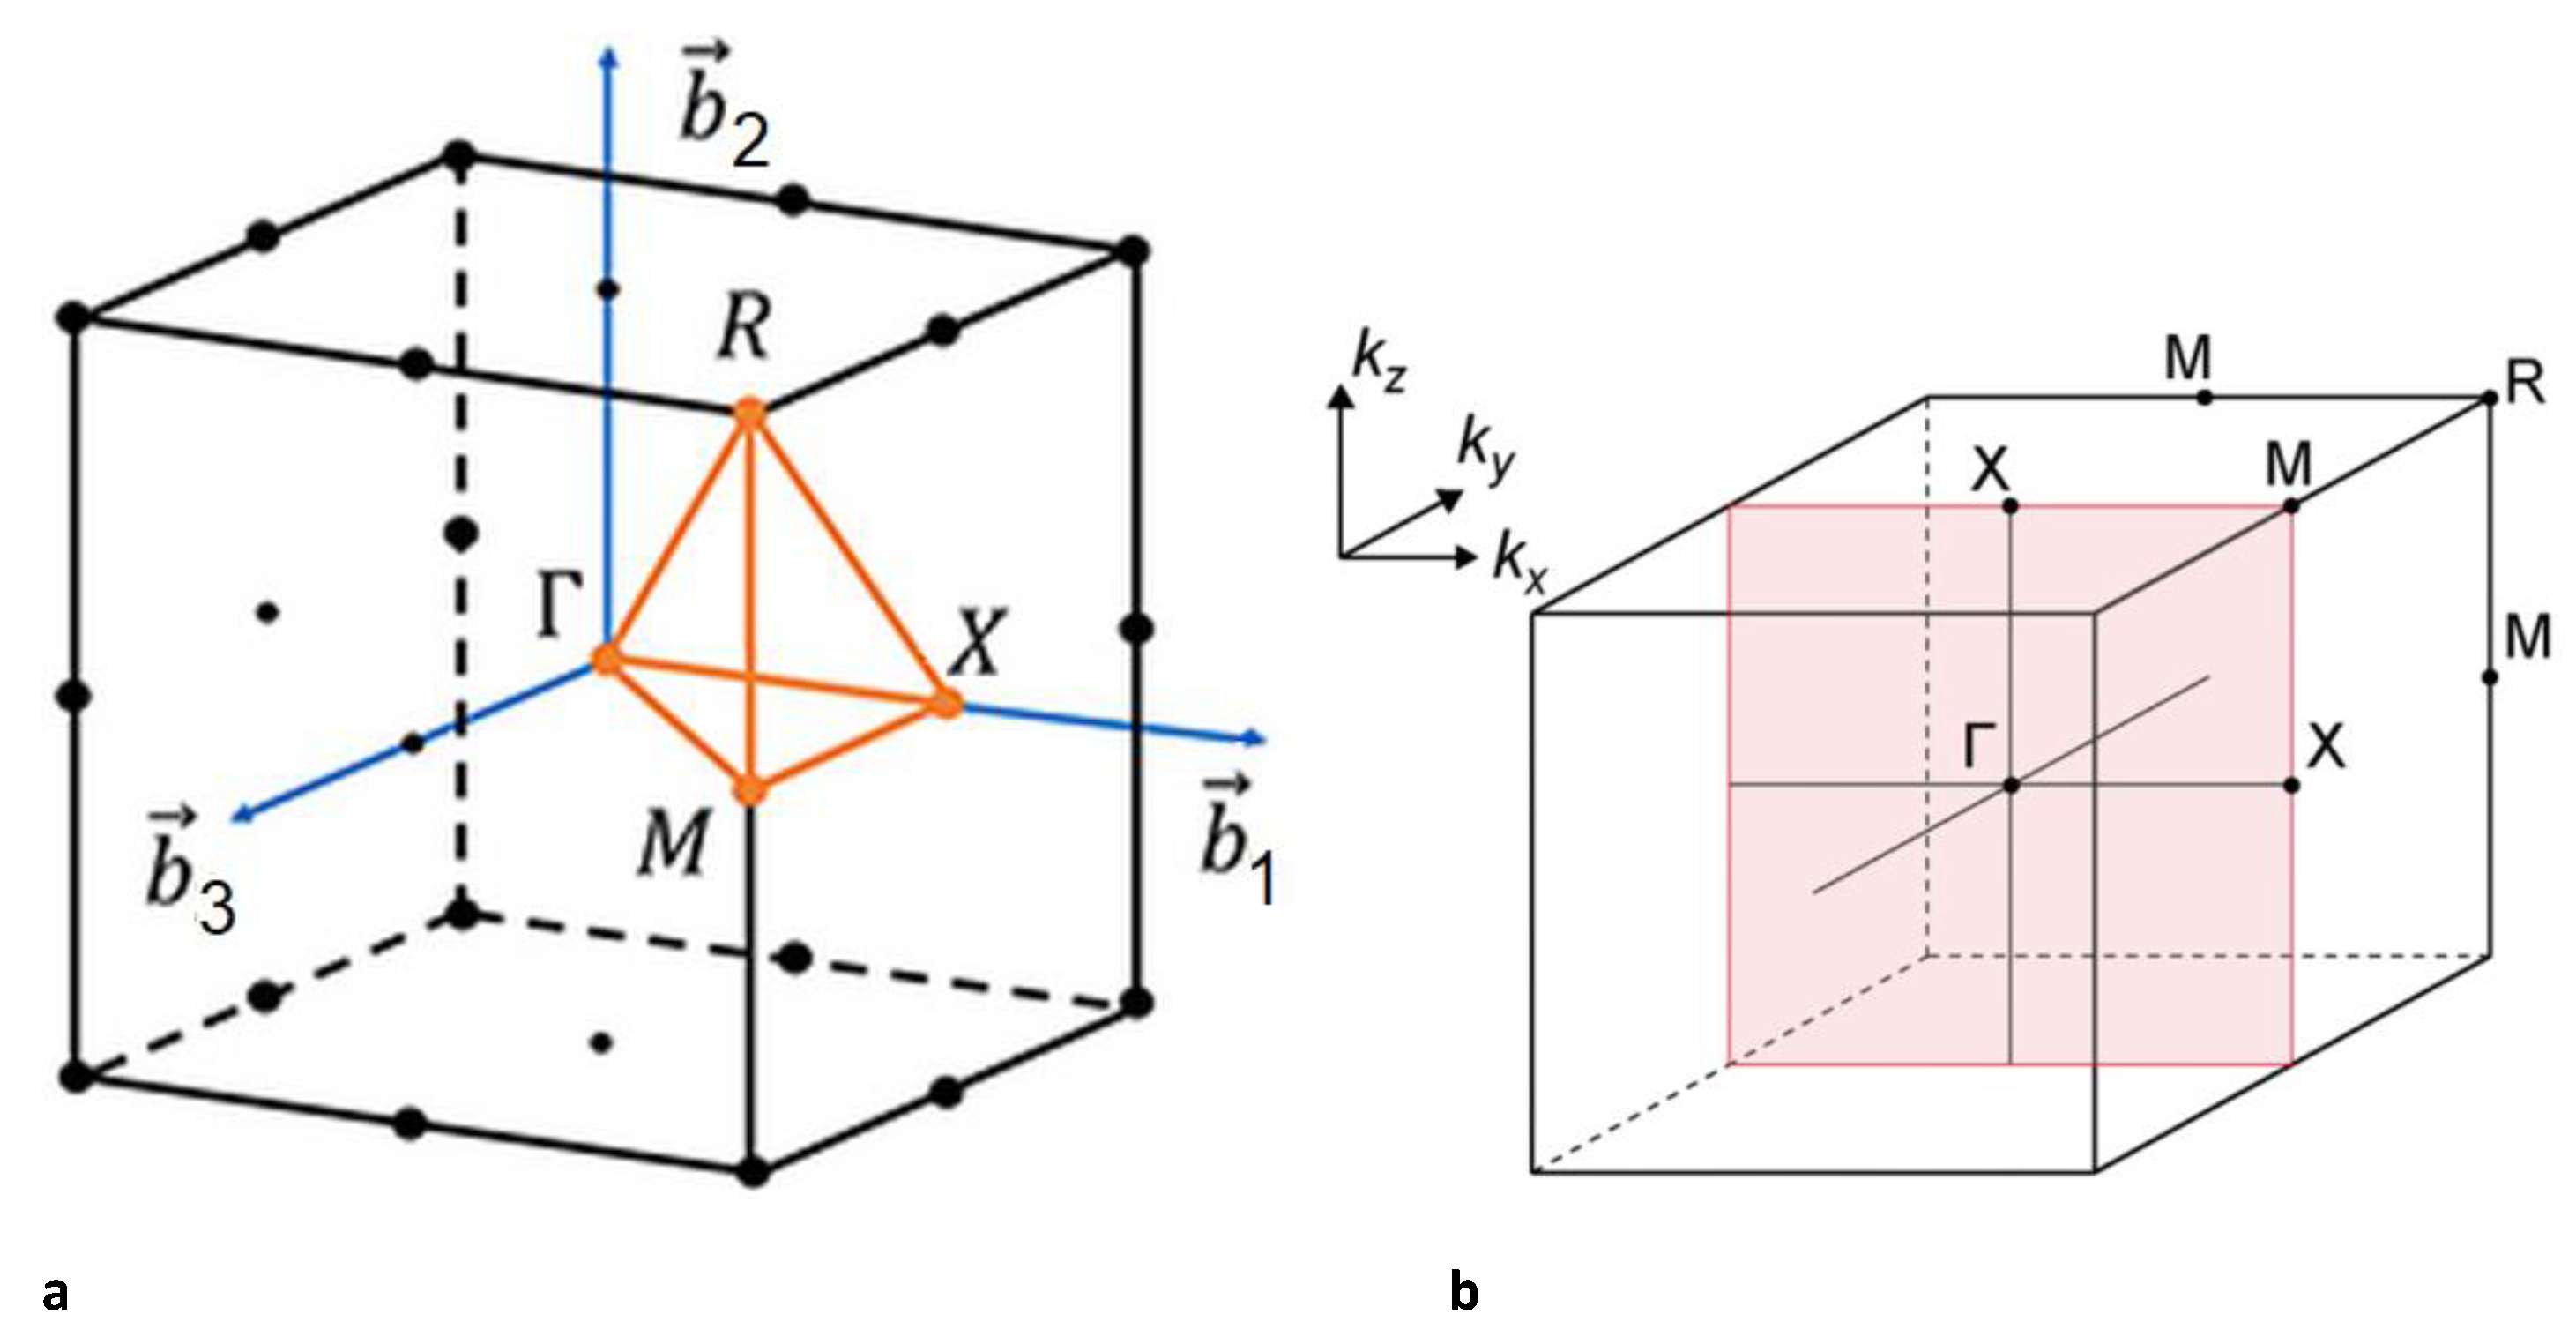
Figure 5.
Band structure of N-doped 2×2×1 Ti3Sb supercell including the spin effect. a) N(Sb) and b) energy region near the Fermi level. Surface coverage = 0.25 ML.
Figure 5.
Band structure of N-doped 2×2×1 Ti3Sb supercell including the spin effect. a) N(Sb) and b) energy region near the Fermi level. Surface coverage = 0.25 ML.
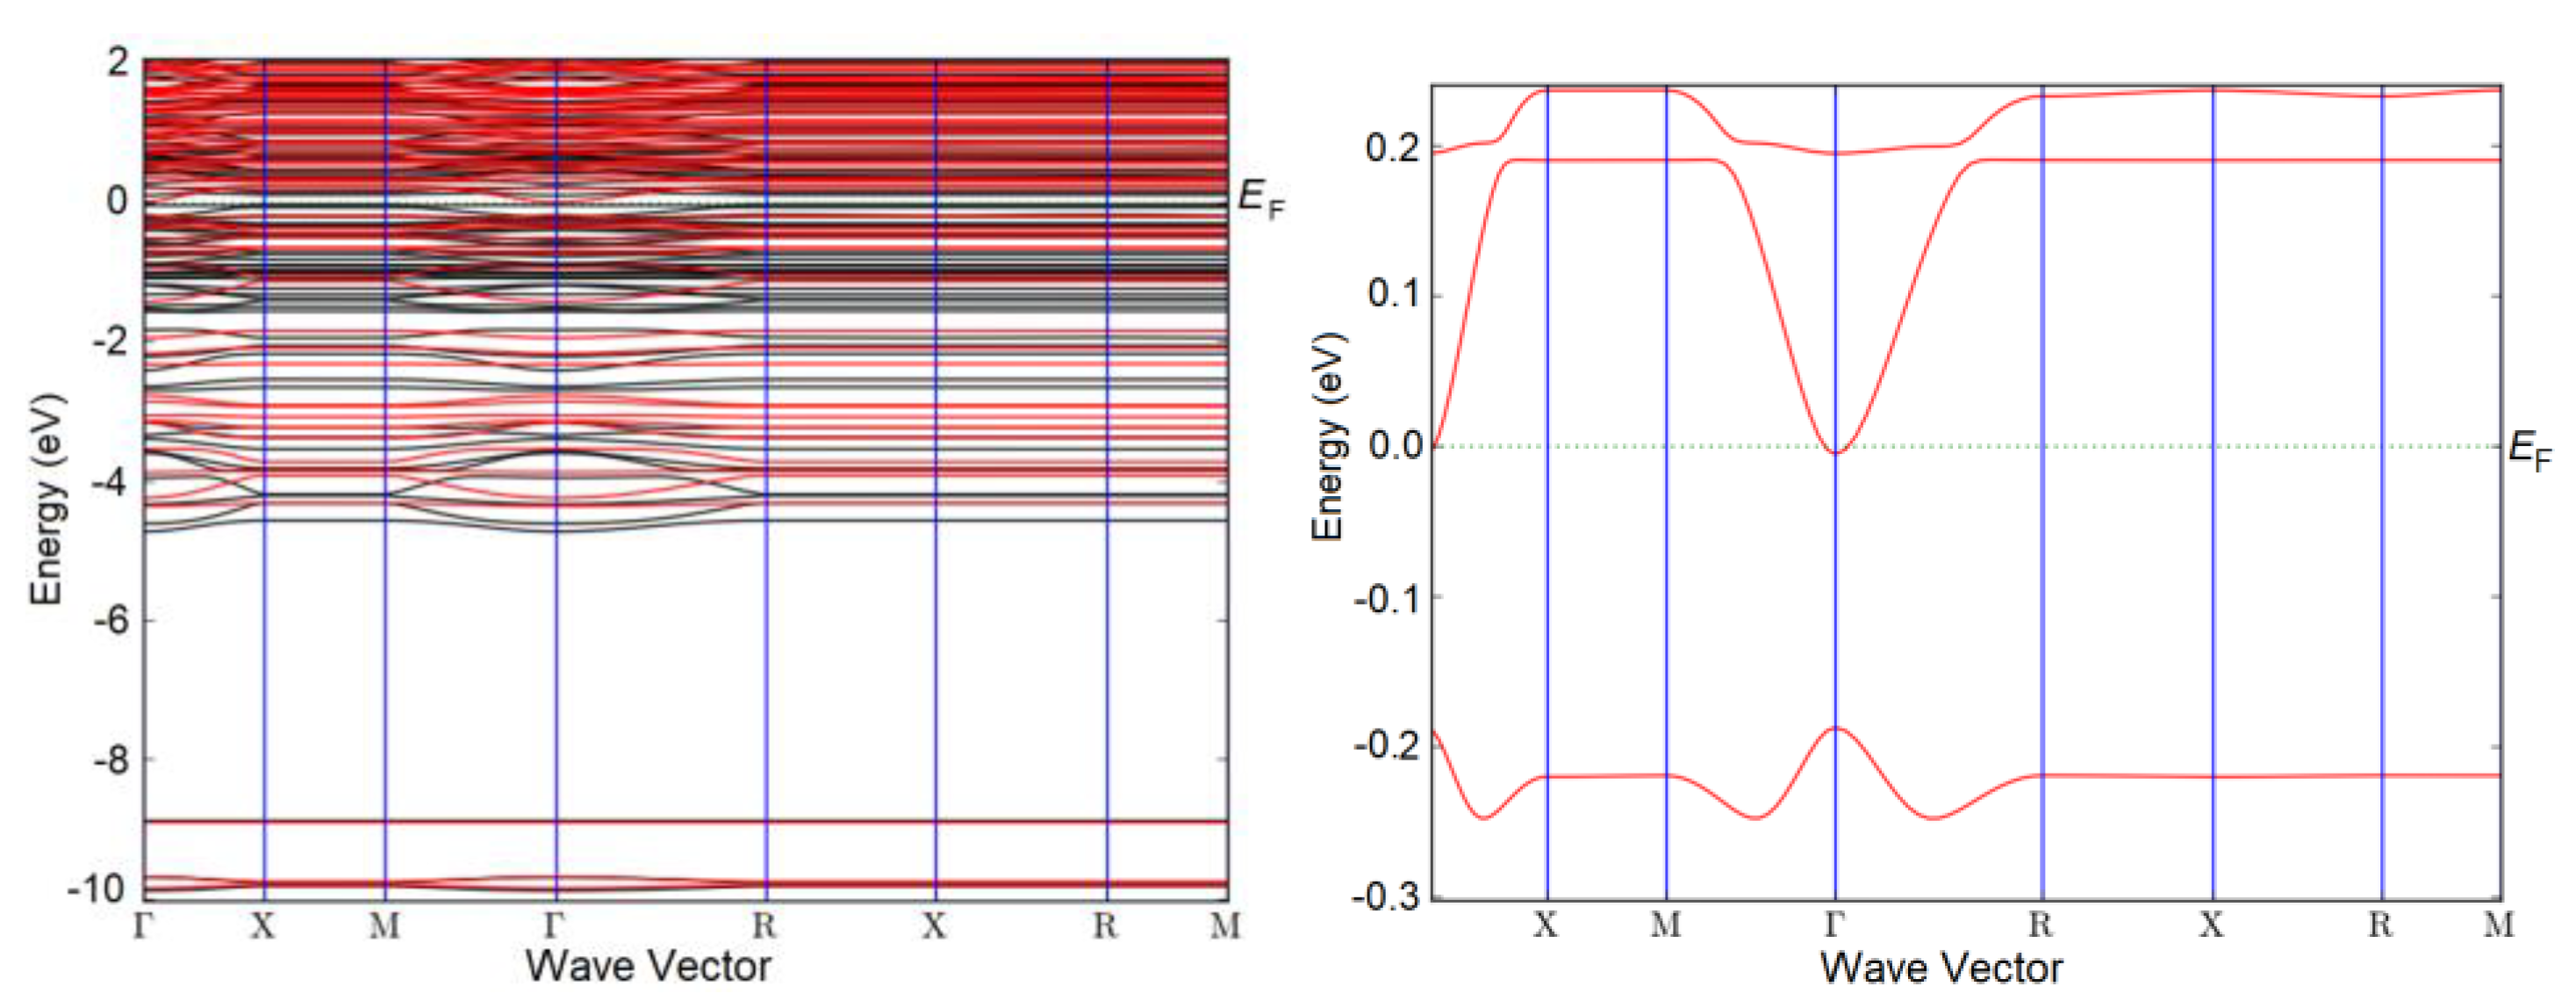
Figure 6.
Band structure of N-doped 2×2×1 Ti3Sb supercell including the spin effect. N partially replaces Ti in the lattice. Surface coverage = 0.25 ML.
Figure 6.
Band structure of N-doped 2×2×1 Ti3Sb supercell including the spin effect. N partially replaces Ti in the lattice. Surface coverage = 0.25 ML.
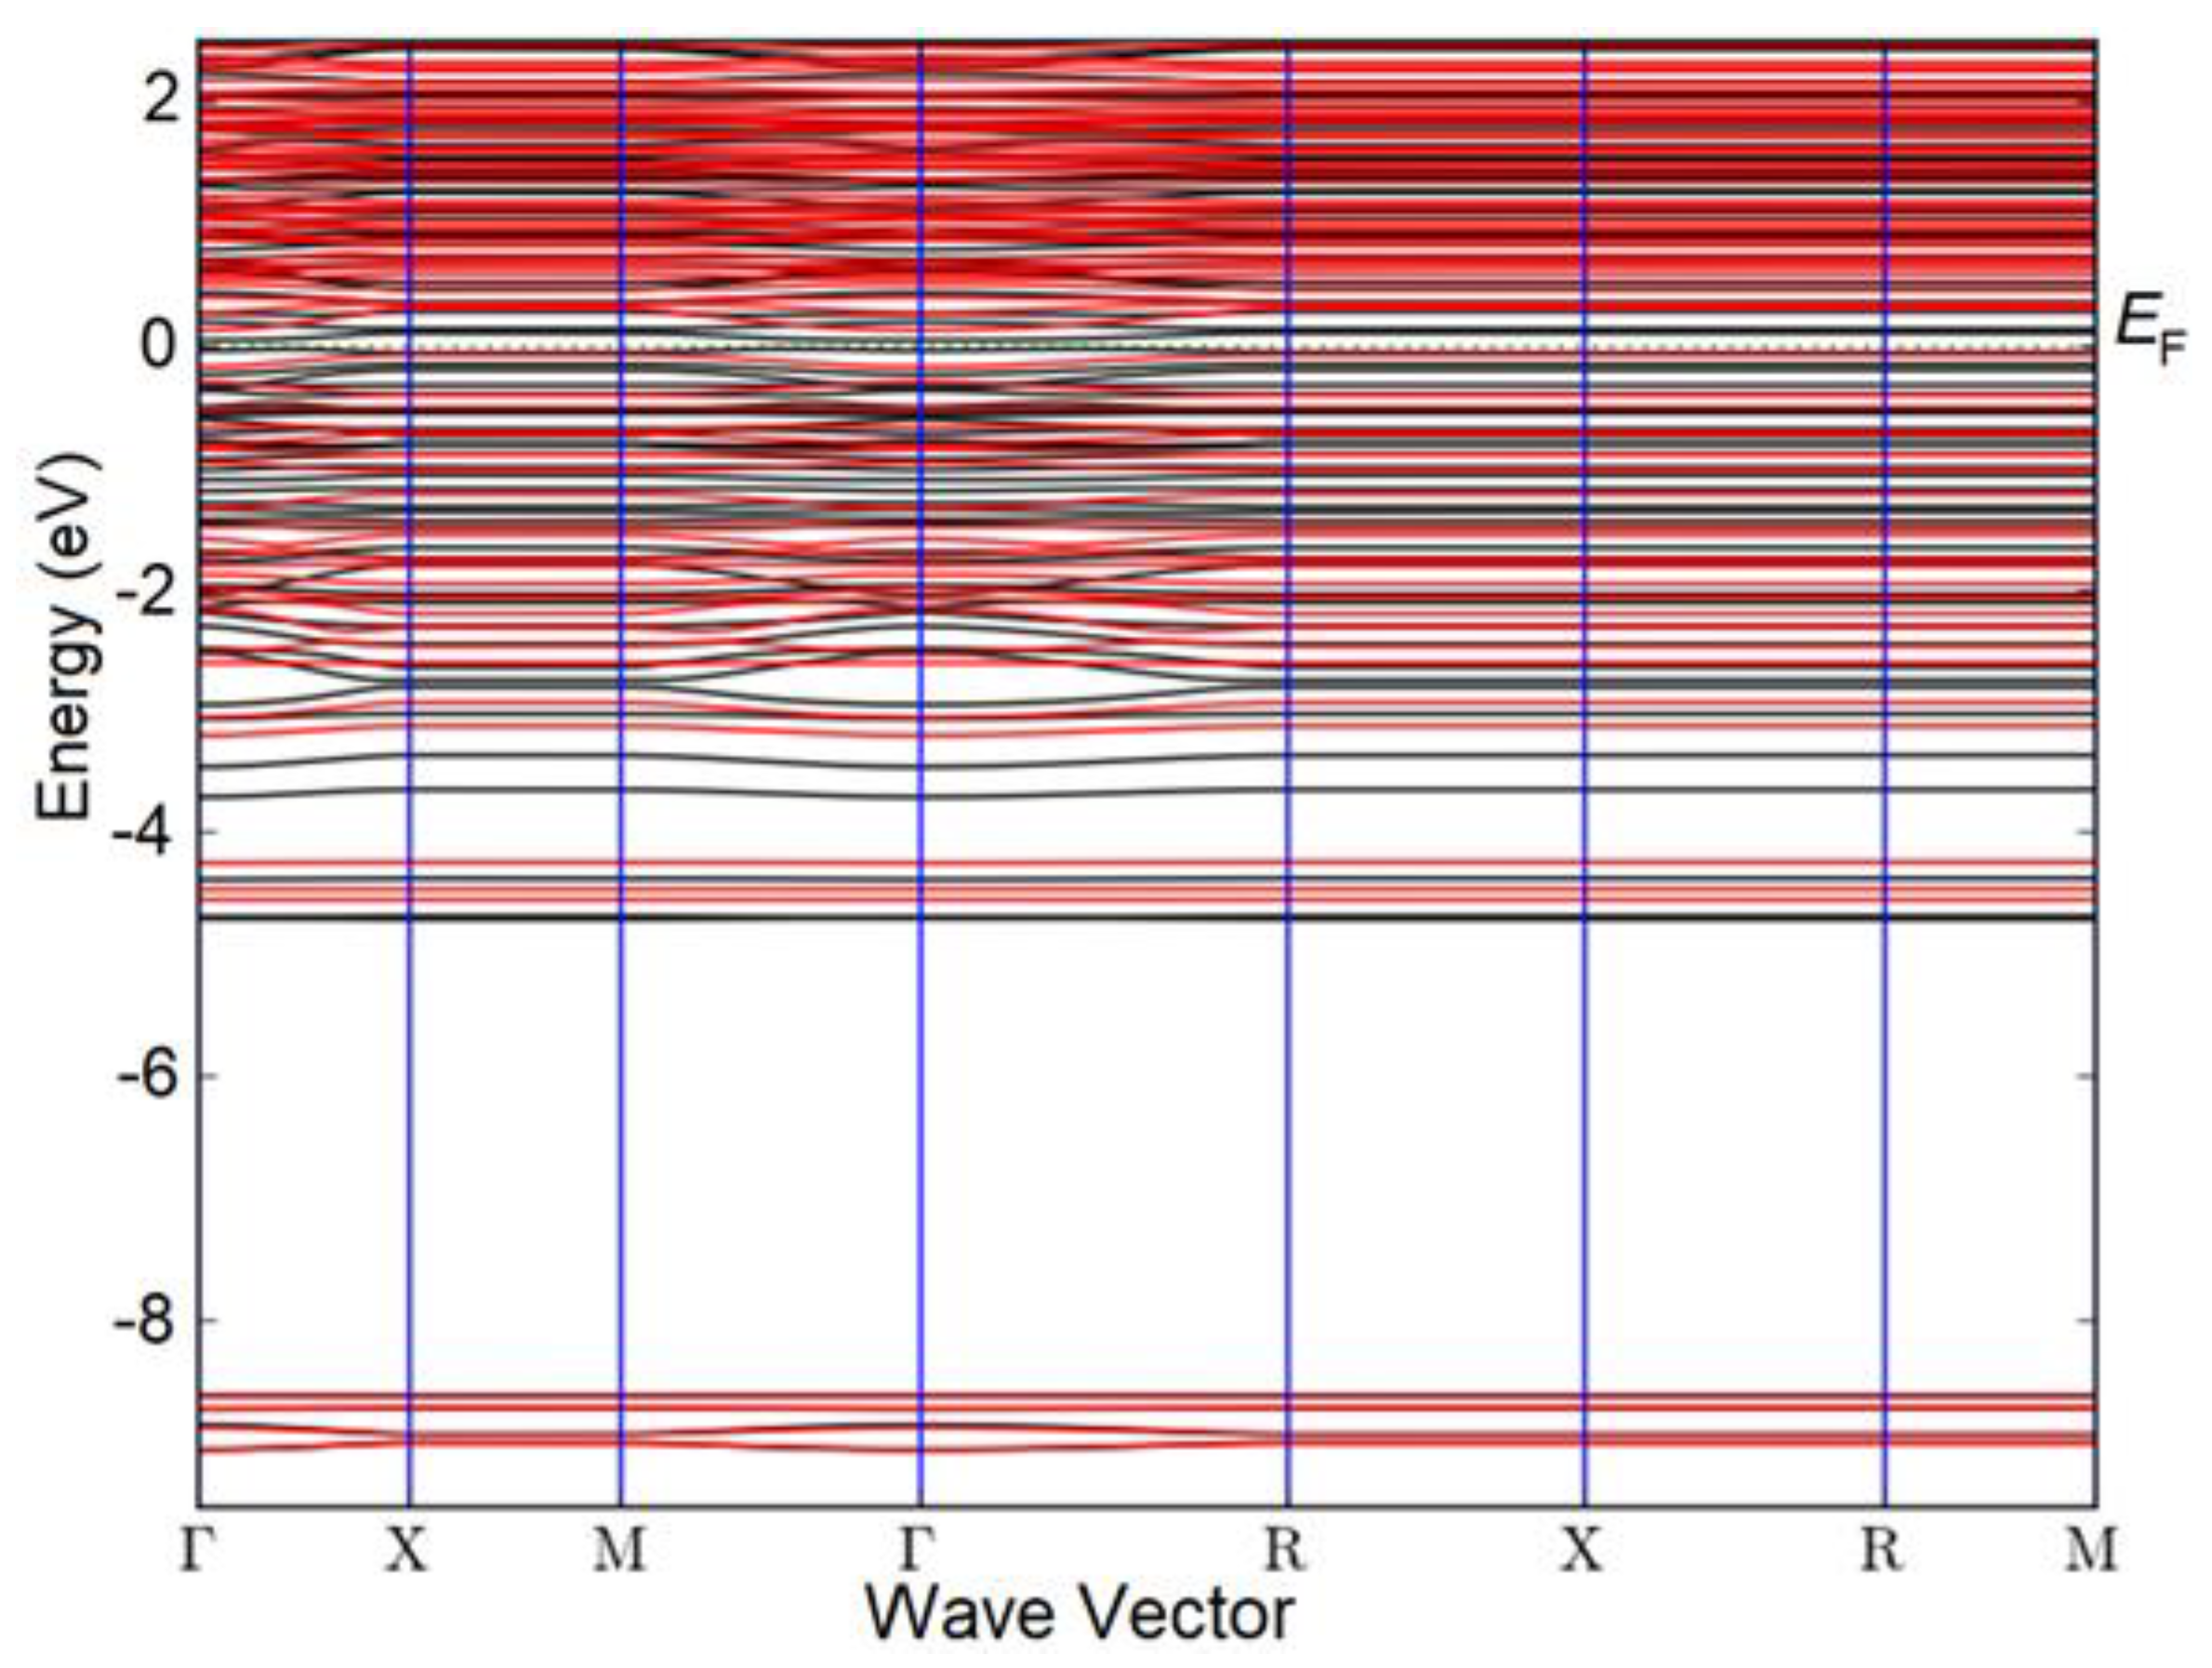
Figure 7.
DOS (a) and partial PDOS (b) of a 2×2×1 Ti3Sb supercell doped with nitrogen (N replaces Sb).
Figure 7.
DOS (a) and partial PDOS (b) of a 2×2×1 Ti3Sb supercell doped with nitrogen (N replaces Sb).
Figure 8.
DOS (a) and partial PDOS (b) of a 2×2×1 Ti3Sb supercell doped with nitrogen (N replaces Ti).
Figure 8.
DOS (a) and partial PDOS (b) of a 2×2×1 Ti3Sb supercell doped with nitrogen (N replaces Ti).

Figure 9.
The location of the initial t2g orbital of Ti 3d along the directions, where , and are the wave vectors along the x, y and z directions, respectively.
Figure 9.
The location of the initial t2g orbital of Ti 3d along the directions, where , and are the wave vectors along the x, y and z directions, respectively.
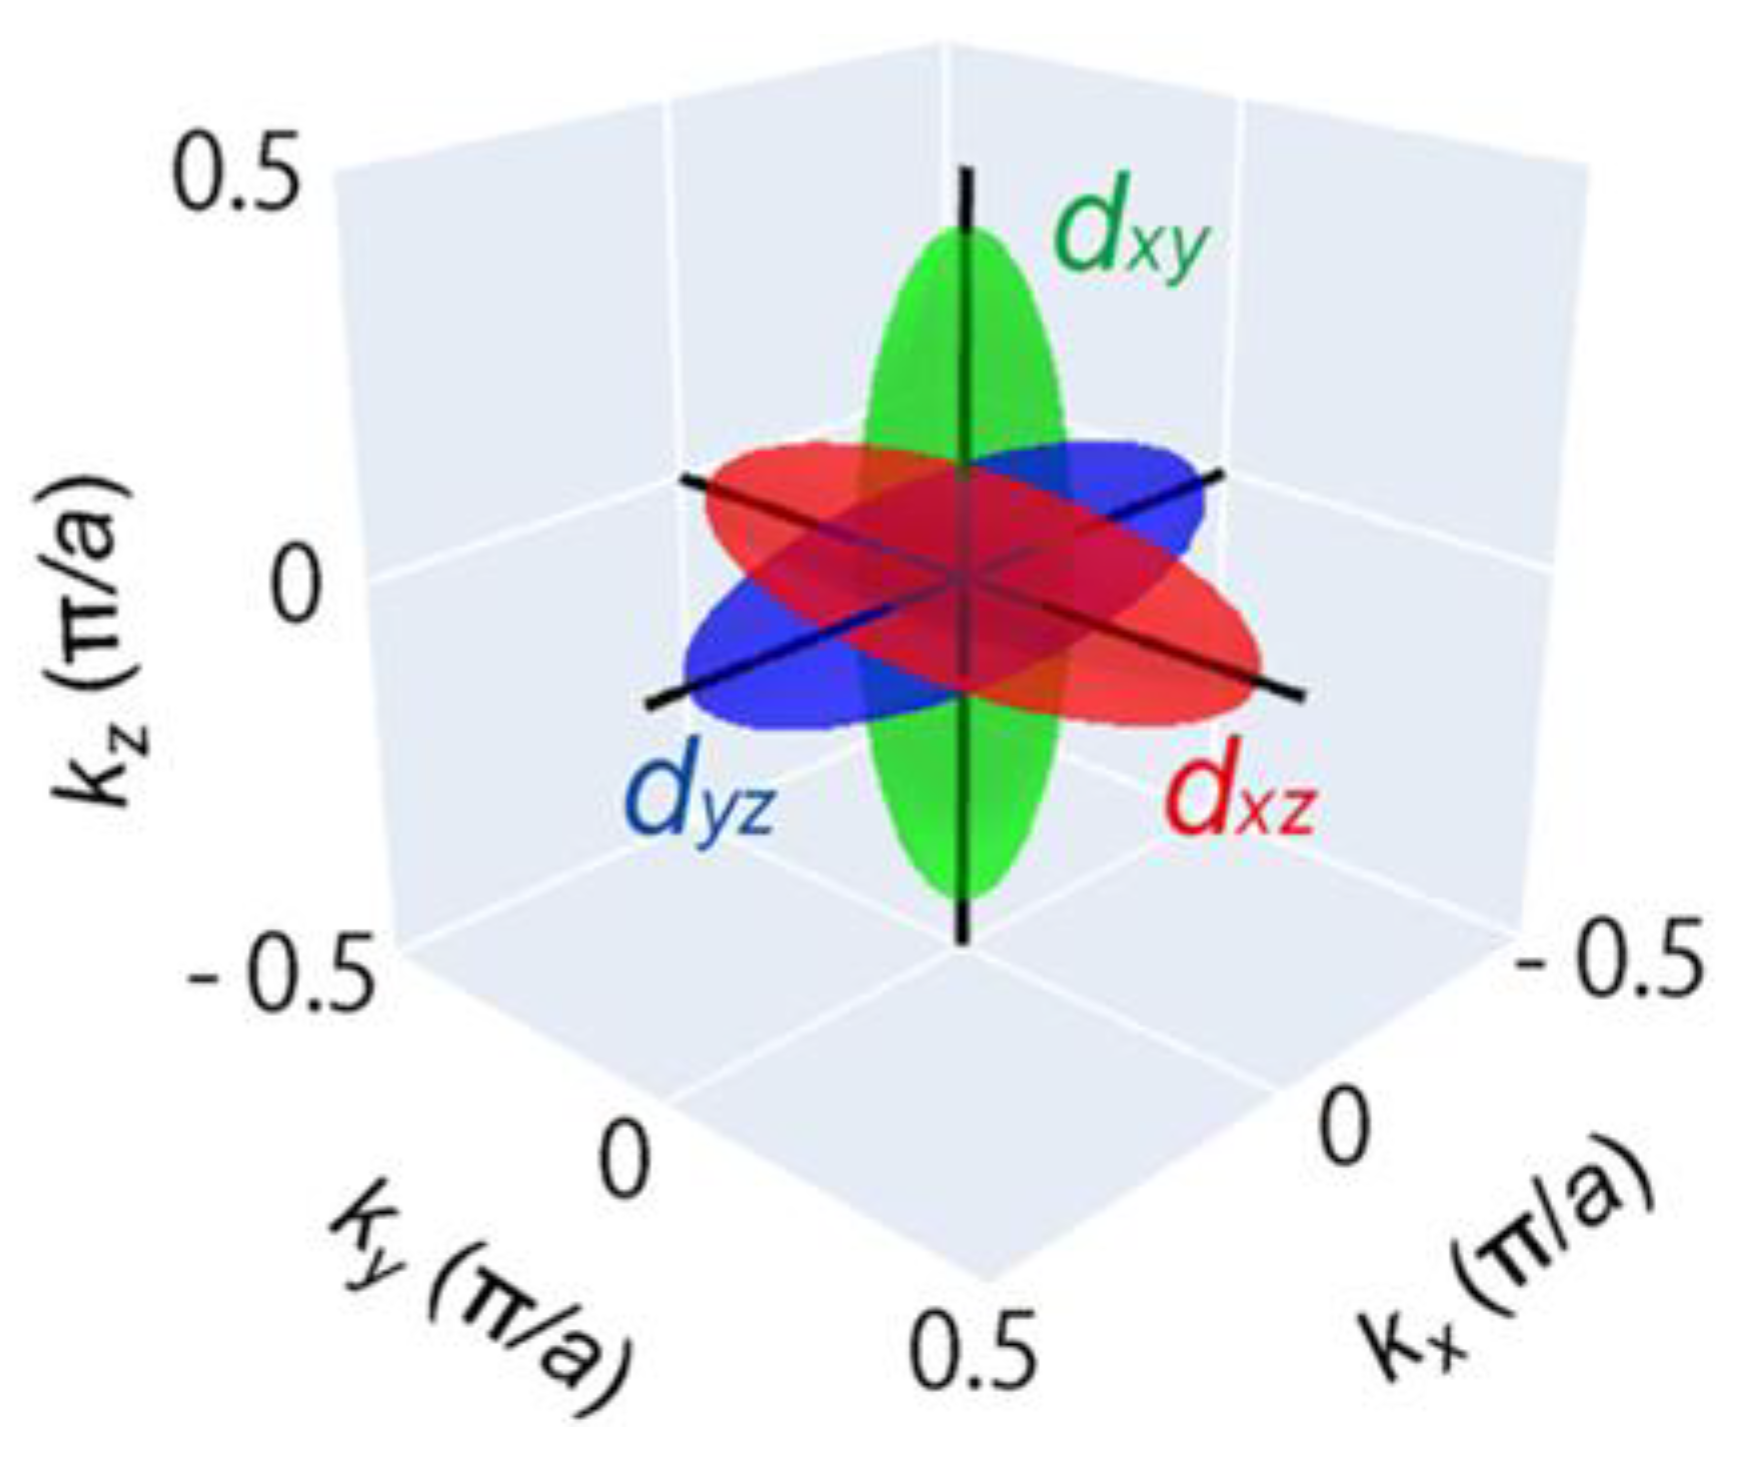
Figure 10.
Direction of the magnetic moment in a 2×2×1 Ti3Sb supercell doped with nitrogen: a) N replaces Ti, b) N replaces Sb.
Figure 10.
Direction of the magnetic moment in a 2×2×1 Ti3Sb supercell doped with nitrogen: a) N replaces Ti, b) N replaces Sb.
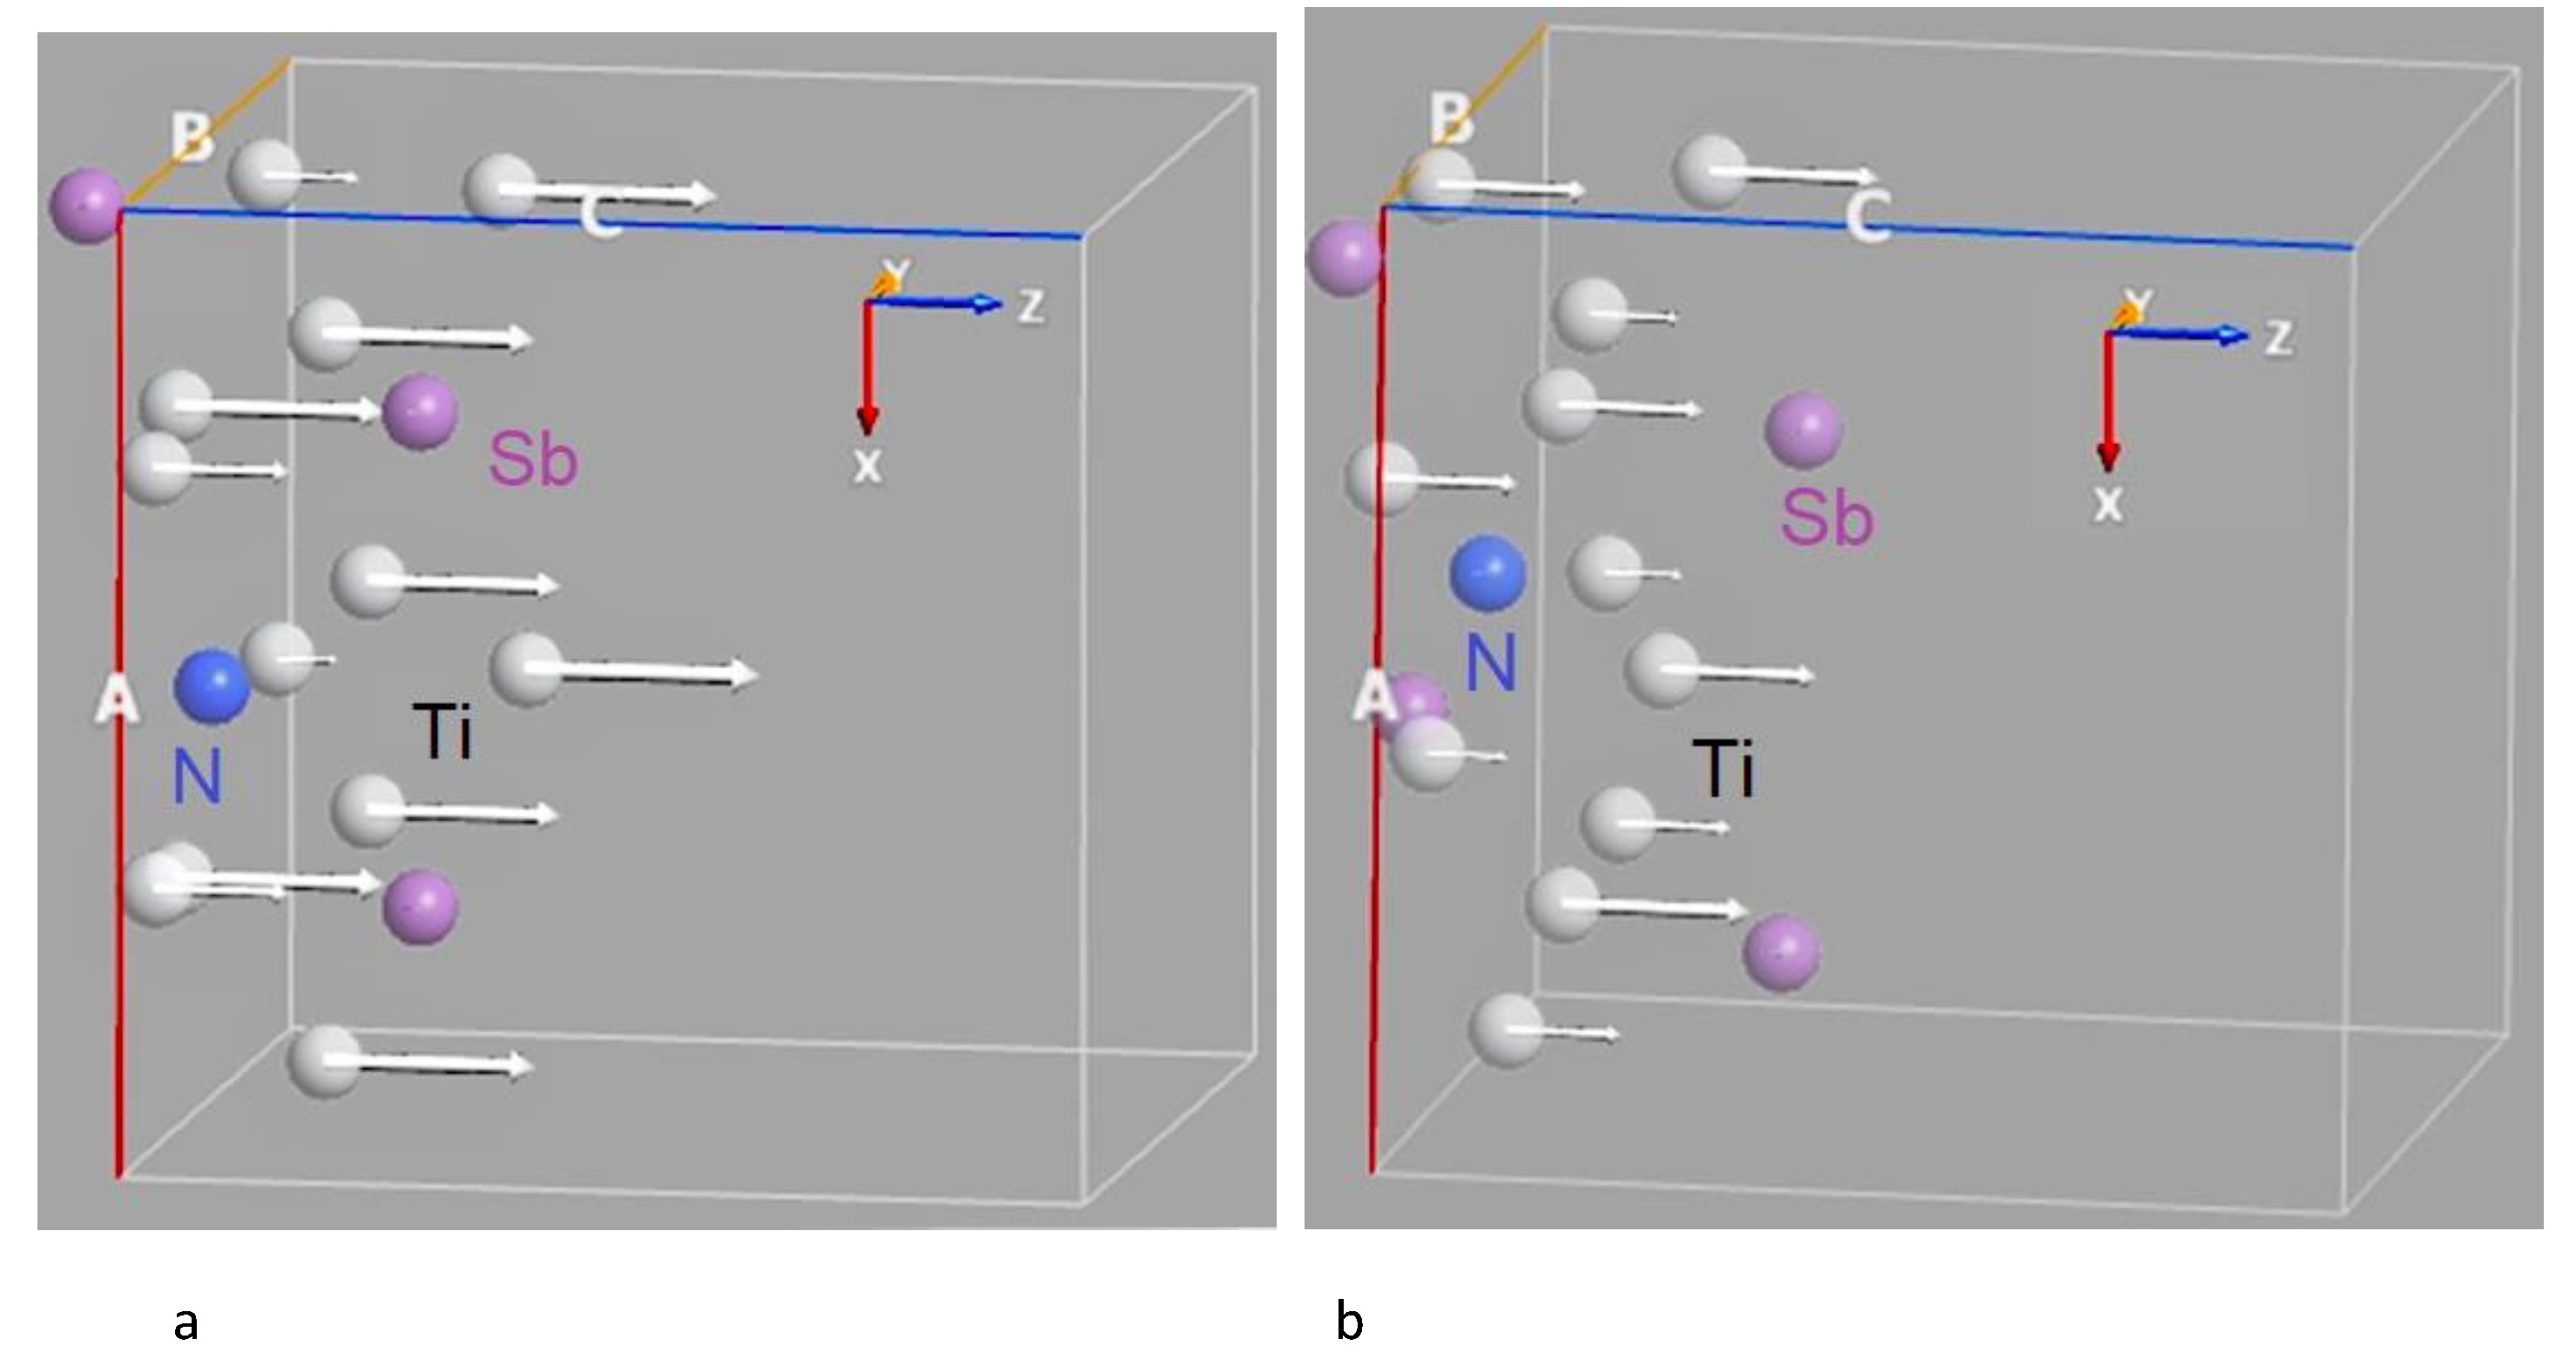

Table 1.
Calculated equilibrium energy of nitrogen absorption for the 2 × 1 × 1 Ti3Sb(111) supercell. = 0.25 ML.
Table 1.
Calculated equilibrium energy of nitrogen absorption for the 2 × 1 × 1 Ti3Sb(111) supercell. = 0.25 ML.
Table 2.
Change in atomic distances in N-doped structure based on 2×2×1 Ti3Sb supercell.
|
Supercell 2×2×1 Ti3Sb |
Interatomic distance (Ti–Sb, Ti–Ti or Ti–N), Å | ||
| Ti–Sb |
Ti–Ti |
Ti–N | |
| Pure Ti3Sb | Ti7–Sb8 (2.917) | Ti7–Ti14 (2.609) |
|
| Ti3Sb–N(Sb) | Ti14–Sb9 (2.911) Ti10–Sb9 (2.971) Ti12–Sb9 (3.072) |
Ti7–Ti14 (2.473) Ti10-Ti12 (2.757) Ti7–Ti6 (2.724) |
Ti7–N8 (2.171) Ti14–N8 (2.171) Ti12–N8 (2.052) |
Table 3.
Dependence of surface energy on facet and packing density for the fcc cubic structure.
| Facet | Packing Density (FCC) | Surface Energy |
| (111) | Maximum | Low |
| (100) | Medium | High |
| (110) | Minimum | Highest |
Table 4.
DFT GGAS calculated values of the magnetic moment and total energy of N-doped 2×1×1 Ti3Sb supercells with N/Sb and N/Ti substitution sites.
Table 4.
DFT GGAS calculated values of the magnetic moment and total energy of N-doped 2×1×1 Ti3Sb supercells with N/Sb and N/Ti substitution sites.
Disclaimer/Publisher’s Note: The statements, opinions and data contained in all publications are solely those of the individual author(s) and contributor(s) and not of MDPI and/or the editor(s). MDPI and/or the editor(s) disclaim responsibility for any injury to people or property resulting from any ideas, methods, instructions or products referred to in the content. |
© 2025 by the authors. Licensee MDPI, Basel, Switzerland. This article is an open access article distributed under the terms and conditions of the Creative Commons Attribution (CC BY) license (http://creativecommons.org/licenses/by/4.0/).
Copyright: This open access article is published under a Creative Commons CC BY 4.0 license, which permit the free download, distribution, and reuse, provided that the author and preprint are cited in any reuse.


