Submitted:
09 November 2025
Posted:
11 November 2025
You are already at the latest version
Abstract
This paper proposes an innovative framework for analyzing execution times in distributed systems. This evaluation framework is designed to support both software development and production monitoring by providing valuable insights into how the application's response time is broken down by operations. In addition, it should also help to spot abnormal behavior. Due to the large popularity of the Spring Framework for enterprise systems and its mature ecosystem, the evaluation framework is designed on top of it, and implicitly functions as a Java application.
The evaluation framework integrates seamlessly with the popular metrics collectors, such as Prometheus, and provides the flexibility to export to other data sinks, such as Apache Kafka, enabling the clients to fully customize the flow of metrics through the system. The evaluation framework is purposefully designed to have a very flat learning curve, coupled with minimal CPU and RAM overhead. This means it is inexpensive to integrate into both new and existing projects, as well as to run.
Keywords:
distributed systems
; evaluation framework
; execution time analysis
; Java
; Spring
; metrics collector
1. Introduction
Significant transformations marked the evolution of software architecture since the introduction of early computing systems. In particular, web application architecture has suffered major structural changes. The deployment of a single, monolithic application instance in a production environment is used less and less. Traditional monolithic systems have gradually evolved into modular monoliths and, more recently, into microservice-based architectures. Deploying applications on physical hardware has been replaced with the usage of virtual machines and containerized environments, with orchestrators such as Kubernetes increasingly dominating the deployment landscape.
These architectural and infrastructural changes have emerged under the influence of growing demands in a digitalized and globalized world. Limitations in scalability and latency prohibit the use of single servers for large, geographically distributed users. The emergence of cloud service providers—such as Amazon Web Services (AWS), Google Cloud Platform, and Microsoft Azure—has also favored this transformation by enabling the deployment of scalable, fault-tolerant, and globally available applications with minimal investment. Consequently, the management of the infrastructure is now frequently delegated to cloud platforms to reduce operational burden on development teams.
Modern deployments commonly consist of hundreds or even thousands of individual services. For example, as of 2024, the multinational mobility company Bolt reported operating more than 1,000 services in its production environment [1]. Working in such complex ecosystems without sufficient monitoring can lead to service degradation or systemic failure, often resulting in financial losses and diminished user satisfaction. This operational fragility has led to the increasing prominence of observability as a critical aspect of software system management.
Observability tools, such as Prometheus and Grafana, are now essential components in contemporary software development workflows. These tools allow the collection, visualization, and analysis of system metrics, while also providing alerting mechanisms that notify operators of potential anomalies. Industry surveys, such as the ones conducted by Grafana Labs, emphasize the importance of observability [2,3,4], identifying it as one of the most rapidly expanding trends in software engineering. Distributed systems grow in complexity, with the effect of a higher demand for comprehensive visibility into system behavior, as undetected faults and inefficiencies can propagate and amplify across service boundaries.
Another factor supporting the adoption of observability practices is the economic model employed by cloud infrastructure providers. Using Infrastructure-as-a-Service (IaaS) and Platform-as-a-Service (PaaS), users are billed based on their actual consumption. Consequently, performance optimizations in cloud-hosted applications can save direct costs, especially as data processing and user interactions are increasing.
The same industry surveys [2,3,4] highlight a strong preference for open-source solutions in observability stacks. However, they also reveal that system complexity and maintenance pose many challenges. Horizontal scaling —adding more resources to handle increased load rather than upgrading individual machines— strongly supports the capabilities of cloud platforms. Selecting and applying the software development methodology plays an important role [5], while distributed systems improve scalability and fault tolerance, but also reduce latency by bringing services geographically closer to users.
Performance optimization in distributed environments can lower system resource consumption and strongly the reduce operational overhead. However, optimization efforts should be driven by analysis rather than intuition. Developers should adopt a scientific approach by establishing baseline performance metrics and evaluating changes in conditions that mirror production settings [6]. This methodology ensures that performance improvements are both measurable and reliable.
2. The Problem
System-level metrics such as CPU and memory utilization are generally straightforward to collect across most technology stacks, but they often fail to provide the granularity required for diagnosing performance issues in complex applications. Considering RESTful APIs or stream processing systems, measuring the total processing time per request is relatively simple. However, such coarse-grained measurements do not reveal much about the internal distribution of time across different components or operations inside the request lifecycle.
When a systemic increase in request processing time is observed, identifying the underlying cause can be particularly challenging. The source of the performance reduction may be hidden by the layered architecture of applications. Potential causes include, but are not limited to: increased database response latency, file I/O bottlenecks, network problems, or particular spikes in computational complexity. Localizing the precise source of latency may become difficult in the absence of the ability to isolate and measure the execution time of discrete functional units.
An easy approach may seem to capture the execution times at specific code points, but the practical implementation introduces several challenges. Mixing the application code with the timing logic represents a cross-cutting concern and is generally intrusive. Simply embedding such logic can lead to code that grows and is both difficult to understand and to maintain. In the regular scenarios where the timing of an operation spans multiple classes or layers, additional complexity may arise, such as the need to modify method signatures or propagate timing data across component boundaries. These types of changes are typically undesirable in production-grade systems.
Even if accurate measurements are achieved, further challenges concern the aggregation and analysis of the resulting metrics. A common but naïve approach is to log the timing data directly. However, in high-throughput or computational-intensive systems, where fine-grained measurements are needed, the volume of generated logs may quickly become unmanageable, reducing their utility and potentially introducing performance overhead. These limitations emphasize the necessity for a dedicated tool capable of efficiently collecting, aggregating, and exposing execution time metrics in a non-intrusive and scalable manner.
3. Objectives
This paper introduces a novel framework for measuring execution times of individual operations within distributed systems. Considering the large adoption of Java and the Spring Framework for the development of enterprise applications [7], the proposed framework is implemented using this technological stack to support broad compatibility and ease of integration.
The primary requirement of the framework is the interoperability with widely used metrics collection and data processing systems. Capturing execution metrics is not useful without the ability to persist and analyze them through established tools. In this context, systems such as Prometheus [8] and Graphite [9] serve as natural endpoints for time-series data collection. Also, the framework is designed to support export to several platforms, including event-driven streaming systems as Apache Kafka [10] and RabbitMQ [11], traditional relational databases, and logging systems. This flexibility allows users to integrate the framework with components very likely to already be present in their operational environments, consequently reducing both the cost and complexity of adoption.
A second core requirement is ease of use. The framework targets software developers as its primary users, and its design promotes a minimal configuration and a low integration overhead. Observability tools are often considered auxiliary to the core business logic of an application; therefore, the framework aims to reduce the time and learning curve necessary to adopt it. The integration process should be straightforward, and the instrumentation of application code should be non-intrusive. Collecting metrics should involve minimal boilerplate code and avoid cluttering the primary logic of the application.
A third requirement is low resource overhead. The framework should preserve the original CPU and memory footprint of the host application to the greatest extent possible. This requirement is mainly important in resource-constrained environments or cost-sensitive deployments, such as those utilizing container orchestration platforms or operating under strict service-level objectives. Some performance cost is unavoidable, as additional processing is required for metric collection, but the framework is designed to minimize its impact on both execution time and system utilization.
To put these constraints in context, it is useful to consider the typical resource profile of a Spring-based application. Idle memory consumption can range from tens to hundreds of megabytes, depending on the presence of additional libraries and middleware. For instance, the default Tomcat thread pool can consume approximately 200 MB of RAM even in idle conditions. CPU usage is more variable and depends heavily on workload and hardware, making absolute measures less meaningful. Instead, relative metrics—such as the percentage increase in the usage of the CPU —are more appropriate. Latency under tens of milliseconds is typically considered acceptable, especially in web-based applications. Accordingly, the framework targets a few operational thresholds: a maximum memory overhead of 1 MB and an added sequential processing time of no more than 1 ms per measured operation.
The interpretation of the added processing time needs to be clarified in this context. Some portions of the logic of the framework necessarily execute in the critical path of the monitored operation, thereby increasing its latency. This is the segment of processing that the framework intends to minimize. Other components of the framework, such as data export or aggregation routines, may operate asynchronously or in parallel with the application logic. While the performance of these asynchronous components is also relevant, they have a lower impact on the responsiveness of the application.
4. Related Work
As of 2025, examining the observability concept cannot miss referencing the contributions of Grafana Labs and their widely adopted LGTM+ Stack. This stack—including Loki for log aggregation, Grafana for visualization, Tempo for distributed tracing, Mimir for metrics collection, and Pyroscope for profiling—has imposed itself as a cornerstone in modern observability infrastructures. Grafana has become the de facto standard for time-series data visualization, while the other tools of the same stack provide specialized support for logs, traces, and performance profiling, supporting interoperability and scalability in cloud-native environments.
4.1. Metrics Collection
Grafana is commonly used together with Prometheus, an open-source time-series database designed for monitoring and alerting. Prometheus examines the metrics exposed by applications, and Grafana retrieves this data for visualization through customizable dashboards. In large-scale environments, the single-node design of Prometheus may become a limitation; to address this, Grafana Labs developed Mimir, a distributed and horizontally scalable metrics backend that supports PromQL and integrates with multiple Prometheus instances. Integration with Java-based applications is straightforward due to Spring Actuator, which can expose application metrics in a Prometheus-compatible format. Additionally, widely used middleware components such as Apache Tomcat and HikariCP already expose operational metrics relevant to connection pooling and request handling, enabling immediate observability without extensive instrumentation.
4.2. Centralized Logging
The core component of the centralized logging stack is Grafana Loki. This is a log aggregation system optimized for scalability and low storage overhead. Unlike traditional log aggregators that index log content, Loki indexes only log metadata. This approach significantly reduces storage costs while maintaining fast retrieval in structured environments [12]. This architecture is particularly appropriate for observability infrastructures where debugging issues does not rely only on the logs.
Logs arrived in Loki via Promtail, but this one was deprecated as of February 13, 2025, to Grafana Alloy—a versatile OpenTelemetry-compatible collector. Alloy supports both push and pull models and is capable of collecting logs from a variety of sources, including message queues such as Apache Kafka. Also, Alloy allows pre-processing of log data, such as enriching it with metadata or filtering messages, before forwarding it to Loki. This capability enhances the flexibility and efficiency of log collection in distributed systems, facilitating better integration into existing pipelines.
4.3. Distributed Tracing
Distributed tracing is essential for visualizing the flow of requests across multiple services in a distributed application. It allows tracing the path of a request from the client through the various backend components, identifying performance bottlenecks, and diagnosing faults. Trace data is typically organized into spans, which represent operations or service boundaries. Spans may contain nested sub-spans and associated metadata.
Grafana Tempo is a high-performance distributed tracing backend that supports open protocols such as OpenTelemetry, Zipkin, and Jaeger. Tempo is optimized for low-cost storage and ease of integration within the Grafana ecosystem. Unlike traditional tracing solutions that rely on databases like Cassandra or Elasticsearch, Tempo uses scalable object storage systems such as Amazon S3 or Azure Blob Storage. Tempo avoids trace indexing and thus minimizes operational complexity and cost.
One of Tempo’s key strengths lies in its native integration with the broader Grafana stack. Traces can be visualized directly in Grafana dashboards and correlated with logs stored in Loki, thereby providing a comprehensive view of both control flow and system state during specific execution paths. This deep integration enables efficient root-cause analysis by linking logs to specific spans and traces.
4.4. OpenTelemetry Integration
OpenTelemetry has emerged as a standard framework for observability, aiming to unify and standardize the instrumentation and collection of telemetry data across platforms and vendors. It abstracts the observability logic of the application from specific backend implementations, reducing the risk of vendor lock-in. Avoiding a vendor lock-in is important, as this is a situation in which the cost of migrating to a different vendor outweighs the benefits due to proprietary dependencies [13].
OpenTelemetry currently supports 4 categories of telemetry signals: traces, metrics, logs, and baggage. These signals can be correlated using context propagation, which allows developers to link metrics, traces, and logs generated by the same transaction or user action across different services and components. This correlation is critical in distributed systems, where events spanning multiple services need to be analyzed collectively for effective debugging and performance tuning.
5. System Design
5.1. Overview
Java maintains backwards compatibility but generally lacks forward compatibility. Therefore, selecting an appropriate target version is critical: it must be modern enough to include essential developer features, but also sufficiently established to ensure integration with a wide array of existing applications. Within the Java ecosystem, it is advisable to use Long-Term Support (LTS) versions [14], narrowing the choices to Java 8, 11, 17, and 21. Versions before Java 17 are excluded, as Spring Framework 6 requires Java 17 or higher [15]. On the other hand, Java 21, being around 2 years old, has limited enterprise adoption, as many organizations have not yet completed migration. Consequently, Java 17 represents an optimal balance.
The library will be developed targeting Java 17 and specifically optimized for integration with the Spring Framework. It will be distributed as a set of JAR [16] artifacts compatible with mainstream build tools such as Maven [17] and Gradle [18]. The configuration will be minimized, limited to declaring dependencies and specifying properties, to avoid tight coupling between client code and library internals.
To enforce loose coupling, principles such as Aspect-Oriented Programming (AOP) and Spring’s Dependency Injection [19] will be leveraged. Using the Spring context requires the registration of proper components and the creation of a dedicated configuration class, which client applications must import.
5.2. Aspect-Oriented Programming
Aspect-Oriented Programming (AOP) [20] addresses cross-cutting concerns, which impact multiple distinct parts of an application. If an application is divided into horizontal layers, cross-cutting concerns form vertical slices across these layers. Examples of cross-cutting functionality include logging and exception handling, orthogonal to the core business logic.
Traditional procedural and object-oriented paradigms lack efficient mechanisms for managing cross-cutting concerns, often resulting in code scattering and tangling. AOP mitigates these challenges through weaving techniques.
An initial approach introduced AOP using annotations (e.g., @TimedMethod) to automate method execution timing. Both Spring AOP [21] and AspectJ [22] may be used for this purpose.
AspectJ, a prominent open-source extension maintained by the Eclipse Foundation, introduces join points [23] representing program execution points such as method calls or field accesses. AspectJ supports compile-time, binary (bytecode), and load-time weaving. Compile-time weaving requires a specialized compiler that integrates aspect code into application classes. Binary weaving modifies the compiled JARs. Load-time weaving employs a custom class loader [24] for runtime weaving.
Despite performance advantages, AspectJ comes with several setup complexities, including special compilers and class loaders, which may hinder adoption. Also, its integration with Spring beans can be cumbersome. Consequently, this complexity renders AspectJ unsuitable for a user-friendly library.
In contrast, Spring AOP offers easy integration with Spring applications [25]. It shares core AOP semantics such as join points, pointcuts, and advices [26], but employs proxy-based weaving rather than bytecode manipulation. Proxies, implementing the same interfaces as target beans, intercept method calls to execute additional logic before or after the invocation of a method. This proxy mechanism simplifies the configuration but introduces limitations: it only intercepts method calls, excludes the field access interception, and cannot intercept self-invocation within the same class [27].
These constraints are significant. The inability to intercept private methods and self-invocations reduces the ability to fully monitor performance, which is critical for this library. The @TimedMethod annotation may remain an additional feature, while the enumerated limitations require alternative approaches.
Finally, AOP fundamentally restricts timing operations to entire method boundaries, conflicting with the library’s goal of enabling fine-grained, arbitrarily scoped performance measurement.
5.3. Class Structure
The metrics reporting system includes two main components: the Metrics Reporter and the Metrics Exporter. The Metrics Reporter is responsible for collecting performance data across the application, while the Metrics Exporter exposes this data to various aggregators and communication channels. Manual timing tasks must be removed; this responsibility falls to the Metrics Reporter.
The Metrics Reporter is implemented as a Spring bean offering a simple interface for metric collection, forwarding data to the exporter. The Metrics Exporter is designed as a modular, plug-and-play component adaptable to different backend solutions. A selection of exporters will be provided, with extensibility for custom implementations.
5.4. The Metrics Reporter
The MetricsReporter interface aims for simplicity and minimal developer overhead, exposing 2 primary methods: one to start an operation and another to end it. An operation is a unit of work defined by the developer, potentially spanning multiple lines of code and classes. Each operation instance requires a unique identification to measure execution time precisely.
The initial signature of the methods void startOperation(String operationName) and void endOperation(String operationName) is enough for single-threaded scenarios, but fails in concurrent contexts due to ambiguity in matching operation instances. If multiple threads execute the same operation in parallel, relying solely on the operation name makes it impossible to distinguish between different invocations. This can lead to incorrect measurements, such as ending the wrong operation instance or aggregating unrelated timings. To resolve this, each operation instance must receive a unique identifier.
The choice of the identifier creation is a trade-off: if the reporter generates it, the uniqueness is guaranteed, but the developers must propagate the identifier throughout the operation, complicating the code. Alternatively, developers may supply identifiers, which may already exist intrinsically within the domain objects (e.g., user IDs). This approach simplifies the usage at the expense of incorrect identifiers, leading to inaccurate metrics and misuse.
For clarity, the identifier type is standardized as a String. The user can choose whether to generate the identifier randomly or use an intrinsic identifier. Methods are thus refined to: void startOperation(String operationName, String operationId) and void endOperation(String operationName, String operationId).
Upon the invocation of startOperation, the reporter records the current time. Correctness demands the use of a monotonic clock to avoid skew-related errors. System.currentTimeMillis(), representing wall-clock time, is vulnerable to system clock adjustments [29,30]. Conversely, System.nanoTime() provides a monotonic, high-resolution time source [30], albeit at a higher computational cost.
A concurrent data structure (ConcurrentHashMap) is employed to track active operations efficiently and safely in multi-threaded environments. The map key combines the operation name and identifier, mapping to the recorded start time.
Time is captured immediately upon method entry, preceding parameter validation, ensuring accuracy.
Exception handling covers two scenarios: ending a non-existent operation and starting an already running instance. The former results in a null retrieval from the map, potentially causing NullPointerExceptions. To avoid disrupting core application logic, such exceptions are caught, and a warning is logged. The latter overwrites the existing start time, risking silent data corruption; this is similarly logged at the WARN level.
Currently, metrics export is performed synchronously on the application thread, risking performance degradation if exporters conduct costly I/O operations. To mitigate this, exporting is offloaded to a dedicated SingleThreadExecutor [31]. Metrics submission and cache management occur on this thread, eliminating synchronization bottlenecks and isolating exporter latency.
This approach introduces new challenges: heavy concurrent workloads may overwhelm the single exporter thread, causing export delays, memory bloat due to queued metrics, and delayed application shutdown. Future improvements may involve multi-threaded exporters.
5.5. Caching Statistics
Immediate metric export imposes a continuous system load. Caching metrics and exporting them periodically addresses this, but introduces configuration complexity.
Export intervals must be developer-configurable, as no universal setting fits all applications. A minimum interval of 500 milliseconds is enforced; no maximum limit is imposed.
Caching size limits complement time-based export triggers. A maximum cache size, configurable between 1 and 1000 entries, ensures memory consumption remains bounded. Metrics are exported when either the time interval elapses or the cache size limit is reached.
Upon operation completion, elapsed time data is encapsulated and added to the cache, which is cleared after each export.
To prevent loss of cached metrics on application shutdown, export logic is integrated into the Spring lifecycle via the DisposableBean interface [32]. The destroy method triggers a final export upon application context termination.
6. Exporters
6.1. Apache Kafka Exporter
6.1.1. Overview and Architecture
Apache Kafka is a distributed event streaming platform developed and maintained by the Apache Software Foundation. Its features include high throughput, fault tolerance, scalability, and robust integration capabilities, and it is suitable for deployment in containerized environments, on bare-metal systems, and in cloud-based infrastructures [33,34].
The core concept of Kafka is the event, which is essentially a stream of bytes. Events are generated by producers and consumed by consumers, both of which interact with Kafka brokers, as illustrated in Figure 2.
Events are categorized into topics, which are logical groupings of related data. For instance, a financial application may use separate topics for account creation and payment transactions. Each topic is divided into partitions, which are immutable, append-only logs that facilitate parallel processing and scalability.
Kafka ensures resilience via replication. Each partition has a leader and one or more followers. The leader handles all read and write operations, while followers replicate its data. In case of failure, a follower may be elected as the new leader using a consensus algorithm.
Producers determine which partition an event is written to, typically based on a round-robin approach or a partitioning key [35]. On the consumer side, consumer groups allow for horizontal scaling, with the following properties:
- A single partition may only be consumed by one consumer within a group.
- Events within a partition are strictly ordered, and no guarantees exist across partitions.
Kafka tracks consumer progress through offsets, which record the last acknowledged message per partition. This enables consumers to resume accurately in the case of interruption.
Kafka was selected as an exporter for this project due to the following attributes:
- Flexibility: Users can define message formats and decide how to process consumed events—either through custom software or integrations like Apache Flink.
- Performance: Kafka demonstrates high throughput and low latency [36], making it suitable for high-frequency metric reporting.
- Widespread Adoption: Kafka is used by over 80% of Fortune 100 companies, which facilitates adoption and integration in existing infrastructures [37].
6.1.2. Implementation
The Kafka exporter is implemented as a Maven module:
com.alexg.performance:kafka-exporter.
It depends on the com.alexg.performance:timer module and the Kafka client library org.apache.kafka:kafka-clients.
The KafkaExporter class extends PerformanceExporter and initializes a Kafka producer instance. For correct operation, users must:
- Register the KafkaExporter as a Spring-managed bean.
-
Define configuration properties:
- ○
- kafka.monitoring.bootstrap.servers: the Kafka bootstrap server addresses.
- ○
- kafka.monitoring.topic: the topic to which metrics are published.
The topic must preexist, as many Kafka clusters restrict automatic topic creation.
6.1.3. Experimental Setup
Traditionally, Kafka required Apache Zookeeper for cluster orchestration. Ever since version 3.1, Kafka has introduced the KRaft mode, meant to replace Zookeeper. Zookeeper was deprecated in release 3.5, and the support was dropped entirely in release 4.0. Nevertheless, this experimental setup uses Zookeeper.
Kafka and Zookeeper are deployed in Docker containers using the confluentinc/cp-kafka and confluentinc/cp-zookeeper images. A single broker configuration with plaintext communication is employed. Topic creation is scripted to run at container startup, and a health check mechanism ensures the application does not start until the broker is available.
For event inspection, Kafka UI is deployed in a separate container.
6.2. Prometheus Exporter
6.2.1. Overview and Architecture
Prometheus is an open-source monitoring and alerting system, originally developed by SoundCloud and later adopted by the Cloud Native Computing Foundation (CNCF) [8]. Prometheus is well-suited for observability in distributed systems due to its scalability, simplicity, and native support for multi-dimensional time-series data.
Unlike Kafka, which relies on a push-based model, Prometheus uses a pull-based approach. It periodically scrapes metrics from configured targets via HTTP. These metrics are stored in a time-series database and queried via the Prometheus UI or third-party tools such as Grafana.
Queries are written using PromQL [38], a purpose-built language for time-series data.
The Prometheus ecosystem consists of:
- Prometheus Server: It is the central component with the time-series database and HTTP scraping service.
- Alertmanager: Manages alert routing and notifications based on PromQL queries.
- Web UI: Provides interactive data exploration.
- Pushgateway (optional): Allows short-lived services to expose metrics, though its use is discouraged by the Prometheus maintainers [39].
6.2.2. Implementation
Prometheus supports several metric types [40]: counter, gauge, summary, and histogram. From these, the gauge and histogram are most appropriate for capturing performance metrics.
- Gauge: Captures the latest value at the time of a scrape, suitable for instantaneous measurements but susceptible to missing outliers.
- Histogram: Aggregates values into configurable buckets and stores cumulative counts and sums. Histograms are best used for the analysis of execution durations.
Given the nature of metric collection via scraping, some values may be lost if the application terminates before a scheduled scrape. This data loss is illustrated in Figure 3.
To expose metrics, the exporter starts an embedded HTTP server, which serves data on the /metrics endpoint.
6.2.3. Experimental Setup
Prometheus is deployed using the official Docker image (prom/prometheus:latest). Scraping targets and intervals are specified via a YAML configuration file mounted into the container. The web interface is exposed on host port 9000.
Each test application instance exposes metrics on a unique port (8082 and 8083) due to local conflicts. Prometheus is configured to scrape these endpoints every 5 seconds and verify their health status.
For visualization, Prometheus is paired with Grafana (grafana/grafana:latest). Dashboards are persisted via Docker volumes. The Grafana dashboard includes:
- Two heatmaps showing the evolution of request time distributions.
- A comparative panel for the two test instances.
- A liveliness monitor for service availability.
The architecture validation imposes a series of tests to prove the ability of the created application to adapt and deliver an available service even under harsh conditions.
6.3. RabbitMQ Exporter
6.3.1. Architectural Overview
RabbitMQ is a widely adopted open-source message broker that implements the Advanced Message Queuing Protocol (AMQP) [41]. It serves as a fundamental component in distributed systems, facilitating asynchronous communication through a message-driven architecture. The core architectural entities in RabbitMQ include Producers, Exchanges, Queues, and Consumers.
Producers are responsible for publishing messages to the message broker. These messages are not sent directly to queues; instead, they are initially directed to Exchanges, which act as routing intermediaries. Exchanges determine the routing of messages based on their type and routing configuration.
RabbitMQ supports 4 types of exchanges:
- Direct exchanges perform exact routing based on the routing key of the message.
- Topic exchanges enable pattern-based routing, providing flexible matching of routing keys.
- Fanout exchanges disregard the routing key entirely and broadcast messages to all bound queues.
- Headers exchanges route messages based on the attributes in the message headers instead of the routing keys.
Queues serve as the primary message buffers, temporarily storing messages until they are retrieved and acknowledged by consumers. Queues may be transient (memory-based and non-persistent) or durable (persisted to disk and resilient across broker restarts).
Consumers are applications that subscribe to queues to retrieve and process messages. Unlike the pull-based approach of Kafka, RabbitMQ employs a push model in which the broker actively delivers messages to consumers. Although polling is technically supported, it is discouraged due to performance implications [42]. Consumers must explicitly acknowledge messages upon successful processing. In cases of consumer failure or message rejection, unacknowledged messages are either requeued or discarded, depending on the acknowledgment mode.
6.3.2. Implementation Details
For integration with Spring-based applications, the org.springframework.amqp:spring-rabbit Maven artifact was employed. The RabbitMqPerformanceExporter class was developed to implement the PerformanceExporter interface. This class is designed to receive a RabbitTemplate instance, which is automatically provisioned by the Spring IoC container when using the library above.
Two configuration properties govern the runtime behavior of the exporter:
- metrics.rabbitmq.exchange It specifies the name of the exchange to which metric messages are dispatched.
- metrics.rabbitmq.routingKey: It specifies the routing key accompanying each message.
- These parameters ensure precise and flexible routing of performance metrics within the messaging infrastructure of RabbitMQ.
6.3.3. Experimental Setup
The RabbitMQ broker was deployed using the official Docker image rabbitmq:3-management, which exposes both the AMQP port (5672) and the management console on port 15672. These were mapped directly to the host machine to facilitate configuration and monitoring.
A configuration file defining the object definitions of the broker was mounted into the container, along with a JSON-based definitions file. This file provisioned a durable queue, a direct exchange, a binding between them, and a default guest user for administrative access.
To ensure that the broker is fully initialized before starting the containers of the test application, a health check mechanism was implemented. This mechanism executes the rabbitmqctl status command at 10-second intervals until the container reports a healthy state. Following this, the test containers are initialized.
6.4. SQL Exporter
6.4.1. Theoretical Background
Relational databases, introduced conceptually in 1970 [43], remain a cornerstone of enterprise and transactional data management in 2025. Commonly used RDBMSs include MySQL [44], Oracle [45], Microsoft SQL Server [46], and PostgreSQL [47].
These databases adhere to the relational model, wherein data is represented as a collection of tables (relations). Each table comprises rows (tuples) and columns (attributes). Primary keys uniquely identify the rows. Foreign keys establish referential relationships across tables. These relationships may be one-to-one, one-to-many, many-to-one, or many-to-many. The many-to-many case typically necessitates an intermediate join table to maintain associations.
Interaction with relational databases is performed using Structured Query Language (SQL) [48]. SQL is a declarative language where users express the desired outcome without specifying the procedural details of data retrieval or manipulation. SQL queries utilize keywords such as SELECT, UPDATE, and INSERT, and are executed by the underlying Relational Database Management System (RDBMS), which optimizes the execution plans accordingly.
The Java Database Connectivity (JDBC) API [49] provides an abstraction for interacting with relational databases from Java applications. JDBC operates using a driver-based architecture, with each RDBMS vendor supplying a compliant driver (e.g., Microsoft provides drivers for SQL Server and Azure SQL Database). The JDBC DriverManager handles driver selection and manages the establishment of Connection objects, which represent live connections to the database.
Statements may be executed using either Statement or PreparedStatement objects. The latter provides parameterized queries, and it mitigates the risk of SQL injection [50] by avoiding direct string concatenation.
Query results are retrieved in the form of a ResultSet, which enables row-wise navigation and data extraction.
JDBC is limited by the object-relational impedance mismatch [51]. Application-level objects are more complex and hierarchical than the flat tabular structures in relational databases. Object-relational mapping (ORM) frameworks such as the Java Persistence API (JPA) [52] reduce this issue by automating the conversion between Java objects and database rows. JPA introduces concepts like the persistence context, entity classes, and the Java Persistence Query Language (JPQL). Implementations such as Hibernate enhance JPA with additional features and are widely integrated in enterprise Spring applications.
However, in the context of the SQL exporter developed for this work, the additional overhead and abstraction introduced by ORMs were deemed unnecessary. Therefore, a direct JDBC-based approach was adopted.
6.4.2. Performance Optimization Strategies
The exporter periodically inserts multiple metric entries into the database, corresponding to the size of the internal metric cache. Performing individual insert operations for each entry would result in significant network overhead due to repeated round trips.
To address this, two optimization alternatives were evaluated:
Although bulk inserts are straightforward to implement, they are subject to limitations imposed by RDBMS vendors. For example, Microsoft SQL Server limits insert statements to 1,000 rows. Consequently, if the cache size exceeds this threshold, execution failure may occur. Therefore, batching was selected as the preferred approach. Empirical studies [53] have shown that batch sizes of 50 yield a substantial reduction in insertion latency while maintaining robustness.
Another performance consideration involves database connection management. Establishing a new connection requires both TCP and TLS handshakes, which, though individually fast, can accumulate substantial latency when repeated. Connection pooling mitigates this by maintaining a pool of pre-established connections, reducing connection overhead.
Popular pooling libraries such as HikariCP are commonly used in conjunction with frameworks like Hibernate. Nevertheless, in this implementation, connection pooling was intentionally avoided. The exporter operates on a single thread and maintains a relatively small number of connections. Moreover, pooled connections could impair the performance of the hosting application, particularly if the pool size is tightly constrained.
Although integrating with an existing application-level pool is theoretically feasible, doing so risks overutilizing shared resources. As a compromise, a static Connection object could be retained within the exporter for its entire lifecycle. However, this approach introduces state management complexity and potential long-lived resource leaks. As long as the exporter performs adequately without pooling, additional complexity will be avoided.
6.4.3. Implementation Details
The SQL-based exporter is implemented within a Maven module identified as com.alexg.performance:sql-exporter. This module declares a dependency on org.springframework.boot:spring-boot-starter-data-jpa to facilitate database connectivity via the Java Persistence API (JPA). Additionally, it depends on the com.alexg.performance:performance-timer module, which provides the foundational PerformanceExporter interface.
Within the module, the primary component is a class named SqlExporter, which implements the PerformanceExporter interface. The constructor of SqlExporter requires three parameters: a DataSource object, a string denoting the application instance name, and another string specifying the name of the metrics table. These parameters can be injected by Spring’s dependency injection mechanism. The DataSource is automatically instantiated by Spring when the JPA starter is present in the classpath and when the appropriate connection properties are defined in the application’s configuration file. The instance name and table name must be explicitly provided in the properties file under keys such as instance.name and db.metrics.table.
Internally, SqlExporter employs a PreparedStatement to persist metric data into the specified table. The SQL statement includes three placeholders corresponding to the following parameters: an operation name (String), the execution time in nanoseconds (Long), and the application instance identifier (String). The implementation assumes the target table includes at least three columns: operation_name (text), execution_ns (numeric), and instance (text). Although additional columns are permitted, the absence of any of these 3 required columns results in a runtime failure.
The exact column data types may vary depending on the database dialect, and users must ensure that the lengths of text columns are sufficient to store the largest possible values. Failure to do so could result in data truncation or runtime exceptions, compromising correctness.
In addition to the parameters required by the SqlExporter, Spring mandates the presence of the following properties to correctly instantiate the DataSource: spring.datasource.url, spring.datasource.username, and spring.datasource.password. The URL must conform to the JDBC format for the selected database. The JDBC driver is typically inferred from the structure of the URL.
6.4.4. Test Setup
To evaluate the functionality of the SQL exporter, PostgreSQL (version 15) was selected as the underlying database due to its widespread adoption and open-source nature. The database was deployed using a Docker container based on the postgres:15 image. Port 5432, the default PostgreSQL port, was mapped to the host to enable communication. Container initialization was configured via environment variables to set a database name (metrics_db) and provide authentication credentials.
An SQL script (init.sql) is run for the schema initialization and is authored to create the required metrics table. This script was mounted into the container at /docker-entrypoint-initdb.d/init.sql, a path recognized by the PostgreSQL image for automatic execution during startup. As a result, the database is immediately prepared to receive metrics upon application launch.
The application was configured to use the following JDBC URL:jdbc:postgresql://postgres:5432/metrics_db.
This format comprises the protocol, driver, host reference, port, and database name.
To verify database insertions, there are several options: querying from a command-line interface, utilizing the database view in IntelliJ IDEA, or employing a graphical management interface such as pgAdmin. The latter was selected for its comprehensive UI and ease of use. pgAdmin was deployed in a separate Docker container using the image dpage/pgadmin4:latest, thereby avoiding local installation.
6.5. Cassandra Exporter
6.5.1. Background and Characteristics
Non-relational databases, though conceptually established for decades [54], gained prominence under the collective term “NoSQL” in the early 21st century. This term encompasses a broad spectrum of databases that diverge from the relational model, addressing the evolving scalability and flexibility demands of modern data-intensive applications.
NoSQL databases differ significantly in design and application. MongoDB uses a document-oriented approach, storing data as JSON-like structures [55]. Key-value stores such as Redis [56] and Memcached [57] serve high-throughput caching needs. Graph databases like Neo4j [58] prioritize relationships, using node-edge models well-suited to GraphQL-enabled architectures [59]. Wide-column stores, including Apache Cassandra [60], blend row-based storage with schema flexibility, also allowing dynamic column definitions across rows.
A notable contrast between NoSQL and relational systems lies in their adherence to ACID properties. While traditional RDBMSs typically enforce transactional guarantees to maintain atomicity, consistency, isolation, and durability, NoSQL databases often relax these constraints to improve scalability. Many NoSQL systems favor eventual consistency and exhibit diverse trade-offs within the CAP theorem [61]. According to the CAP theorem, no distributed system can simultaneously achieve consistency, availability, and partition tolerance. Relational databases often support CA configurations (consistency and availability), whereas NoSQL databases—Cassandra being a notable example—typically prioritize availability and partition tolerance (AP).
Apache Cassandra, released by Facebook in 2008, exemplifies this trade-off. It achieves high availability and fault tolerance through a masterless architecture, employing a gossip protocol to synchronize cluster state across nodes. Seed nodes play a critical role in cluster initialization and stability.
Cassandra’s data model bears surface similarity to relational databases, albeit with key distinctions. Instead of databases, Cassandra uses “keyspaces,” which contain tables with loosely defined schemas. Rows within a table are identified by a composite primary key, comprising a partition key used to distribute data across nodes. The query language of Cassandra (CQL) borrows SQL-like syntax but omits features like joins, necessitating careful denormalization during data modeling to align with its distributed nature.
6.5.2. Implementation Details
The Cassandra-based metrics exporter was implemented within a dedicated Maven artifact named com.alexg.performance:cassandra-exporter. This module depends on the core performance instrumentation module com.alexg.performance:performance-timer, which provides the base interface PerformanceExporter. In addition, it includes the com.datastax.oss:java-driver-core dependency to enable programmatic interaction with a Cassandra database (Figure 5).
The primary class within this module, CassandraExporter, implements the PerformanceExporter interface. Its constructor requires several parameters essential for establishing connectivity and ensuring correct metric storage: a string representing the contact point address of the Cassandra node, an integer indicating the port number (typically 9042), a keyspace name, a table name for metric storage, and the logical identifier of the exporting application instance. These values are externally configurable and retrieved at runtime via Spring properties:
- cassandra.contact.point (Cassandra host),
- cassandra.port (port number),
- cassandra.keyspace (Cassandra keyspace name),
- cassandra.exporter.table (metrics table name), and
- INSTANCE_NAME (application instance identifier).
Using these parameters, the exporter constructs a CqlSession object, which serves as the main communication channel with the Cassandra database for the lifetime of the exporter instance. For data insertion, the exporter utilizes a Cassandra-specific PreparedStatement class provided by the DataStax driver (com.datastax.oss.driver.api.core.cql.PreparedStatement). This statement is configured as an INSERT operation targeting the specified metrics table, with parameters corresponding to the operation name (text), execution duration (numeric), application instance (text), and the timestamp of insertion (temporal value). The name of the target table is dynamically resolved based on the value of the cassandra.metrics.table configuration property.
The exporter thereby enables seamless and consistent insertion of performance metrics into a Cassandra store using a parametrized, strongly typed, and precompiled query mechanism, which is robust under high-throughput workloads.
6.5.3. Test Setup
For the evaluation of the Cassandra exporter, the Apache Cassandra database (version 4.1) was deployed in a containerized environment using the official Docker image cassandra:4.1. The standard Cassandra communication port (9042) was exposed and mapped directly to the host system to facilitate external access.
To ensure proper initialization of the keyspace and schema before metric ingestion, a secondary container, named cassandra-provision, was introduced. This auxiliary container, also based on the cassandra:4.1 image, was designed exclusively for executing provisioning scripts. It was configured to run a shell script that repeatedly attempts to connect to the main Cassandra container using cqlsh in a loop. The delay interval between attempts is 2 seconds. Once a successful connection is established, the script executes a secondary CQL file that contains the statements required to create the schema, including the keyspace metrics_keyspace and the associated metrics table. The provisioning logic is initiated through the entrypoint directive of the container in the Docker Compose configuration.
This approach eliminates the need for separate container health probes, as the provisioning logic itself implicitly handles availability checks. However, the test application responsible for exporting metrics must not start prematurely, as failure to connect to a fully initialized Cassandra instance would result in runtime errors. To address this, the container orchestration logic enforces a dependency: the exporter application containers are only launched once the provisioning container reaches a terminal state of service_completed_successfully.
Once the test environment is operational, verification of metric insertion is performed using cqlsh, the native Cassandra command-line interface.
7. Testing
7.1. Test Application
To evaluate the performance of exporters, a minimal Spring Boot application was developed [62]. The application creates a fixed-size thread pool and continuously submits two operations labeled opname1 and opname2, both instrumented by the metrics collection framework. These operations simulate computational work by invoking a sleep function for a randomly determined duration. Unless otherwise specified, the sleep duration is sampled from a normal distribution with a mean of 400 ms and a standard deviation of 100 ms.
The test environment was containerized to ensure repeatability, portability, and system isolation. Docker containers were used to simulate a distributed environment, with orchestration handled via Docker Compose [63]. The test application container image is derived from openjdk:17-jdk-slim. Two instances of the application are deployed to better replicate a distributed system’s behavior. Each exporter under evaluation is deployed in its own dedicated container, as described in the relevant subsections of Chapter 6.
7.2. Measurement Accuracy
Quantifying the accuracy of execution time measurements presented significant challenges, primarily due to the difficulty of establishing a ground truth for timekeeping. One natural candidate, Thread.sleep(long millis), offers limited precision due to its dependence on operating system-level schedulers and timers [64], rendering it unsuitable as an absolute reference. Similarly, comparing the custom MetricsReporter to Java’s System.nanoTime() is infeasible, as the framework internally relies on System.nanoTime() for its own measurements.
Ultimately, the approach adopted in this study assumes that Thread.sleep() introduces a negligible error and attributes any measurement discrepancy entirely to the framework. To facilitate accuracy testing, a specialized exporter—StatisticsExporter—was implemented. This component records the number of invocations and computes the average duration reported by the framework over a fixed number of samples (n = 5000). Measurements were conducted for 3 sleep durations: 2 ms, 20 ms, and 200 ms. The results are summarized below:
- 2 ms reference: mean reported time = 2.9 ms
- 20 ms reference: mean reported time = 21.5 ms
- 200 ms reference: mean reported time = 202.1 ms
The relative error decreases with increasing sleep duration: ~45% for the 2 ms reference, <10% for 20 ms, and approximately 1% for 200 ms. These findings indicate that the framework’s accuracy improves substantially for operations with non-trivial execution durations. Although some observed error may stem from inaccuracies inherent in Thread.sleep(), the results are satisfactory for performance monitoring purposes, where identifying trends is more critical than achieving nanosecond-level precision.
7.3. Impact on Throughput
To assess the runtime overhead introduced by instrumentation, throughput was measured in 3 scenarios: (i) without timing instrumentation, (ii) using the legacy single-threaded MetricsReporter, and (iii) using the new asynchronous reporter. The test involved performing Thread.sleep(20 ms) sequentially across 5000 invocations. The Kafka exporter served as the target backend in all scenarios. Total execution times were recorded as follows:
- Without instrumentation: 111,900 ms
- With synchronous reporter: 112,126 ms
- With asynchronous reporter: 111,266 ms
The asynchronous reporter incurs no noticeable overhead, with the measured difference well within the margin of error. In contrast, the synchronous reporter introduces a measurable slowdown (~226 ms), attributable to blocking operations. It is important to note that these experiments were conducted in a local Docker environment. In a real-world distributed system—where the Kafka broker is deployed remotely—network latency and contention would likely amplify this performance degradation.
7.4. Resource Consumption
In practical software engineering, every additional framework or module is evaluated against its resource cost. This cost includes (i) integration effort, (ii) maintenance overhead, and (iii) runtime resource consumption. The first 2 aspects have been addressed through the design philosophy of this framework, which emphasizes simplicity and non-invasiveness. The focus here is on evaluating the third component—specifically, the additional CPU and memory overhead introduced by the instrumentation logic.
To this end, the same Spring Boot 3.2 test application was used, with no functional logic apart from metrics collection and export. This setup serves as a proxy for real-world applications in which the framework is expected to be integrated. The test application was executed inside a Docker container on a host machine equipped with an Apple M1 CPU.
Accurately measuring CPU usage across hardware platforms is non-trivial due to architectural and manufacturing differences. Therefore, results should be interpreted as relative performance comparisons rather than absolute metrics. Developers can replicate the baseline (i.e., an idle Spring Boot application) on their own hardware to estimate the expected overhead introduced by the framework. CPU and memory statistics were collected using Docker Desktop’s container-level reporting tools. Since the test container was the sole active application, differences in resource usage across configurations are attributable to instrumentation.
The baseline resource footprint is presented in Figure 6 and Figure 7. With no activity beyond framework initialization, CPU utilization hovers near 0%, and memory consumption remains stable around 243 MB. Occasional minor spikes are observed and are attributed to periodic garbage collection events.
7.4.1. Worst-Case Resource Utilization
To evaluate the upper bounds of resource consumption, a stress test was conducted under a synthetic worst-case scenario in which all exporters were active simultaneously. While such a configuration is unlikely in production deployments, it provides a conservative estimate of the exporters’ combined demand on system resources.
In this scenario, metrics were generated artificially through two continuously active threads, each submitting a metric at fixed intervals. The first configuration involved one metric submission every 400 milliseconds per thread, while maintaining the default maximum of 10 cached metrics.
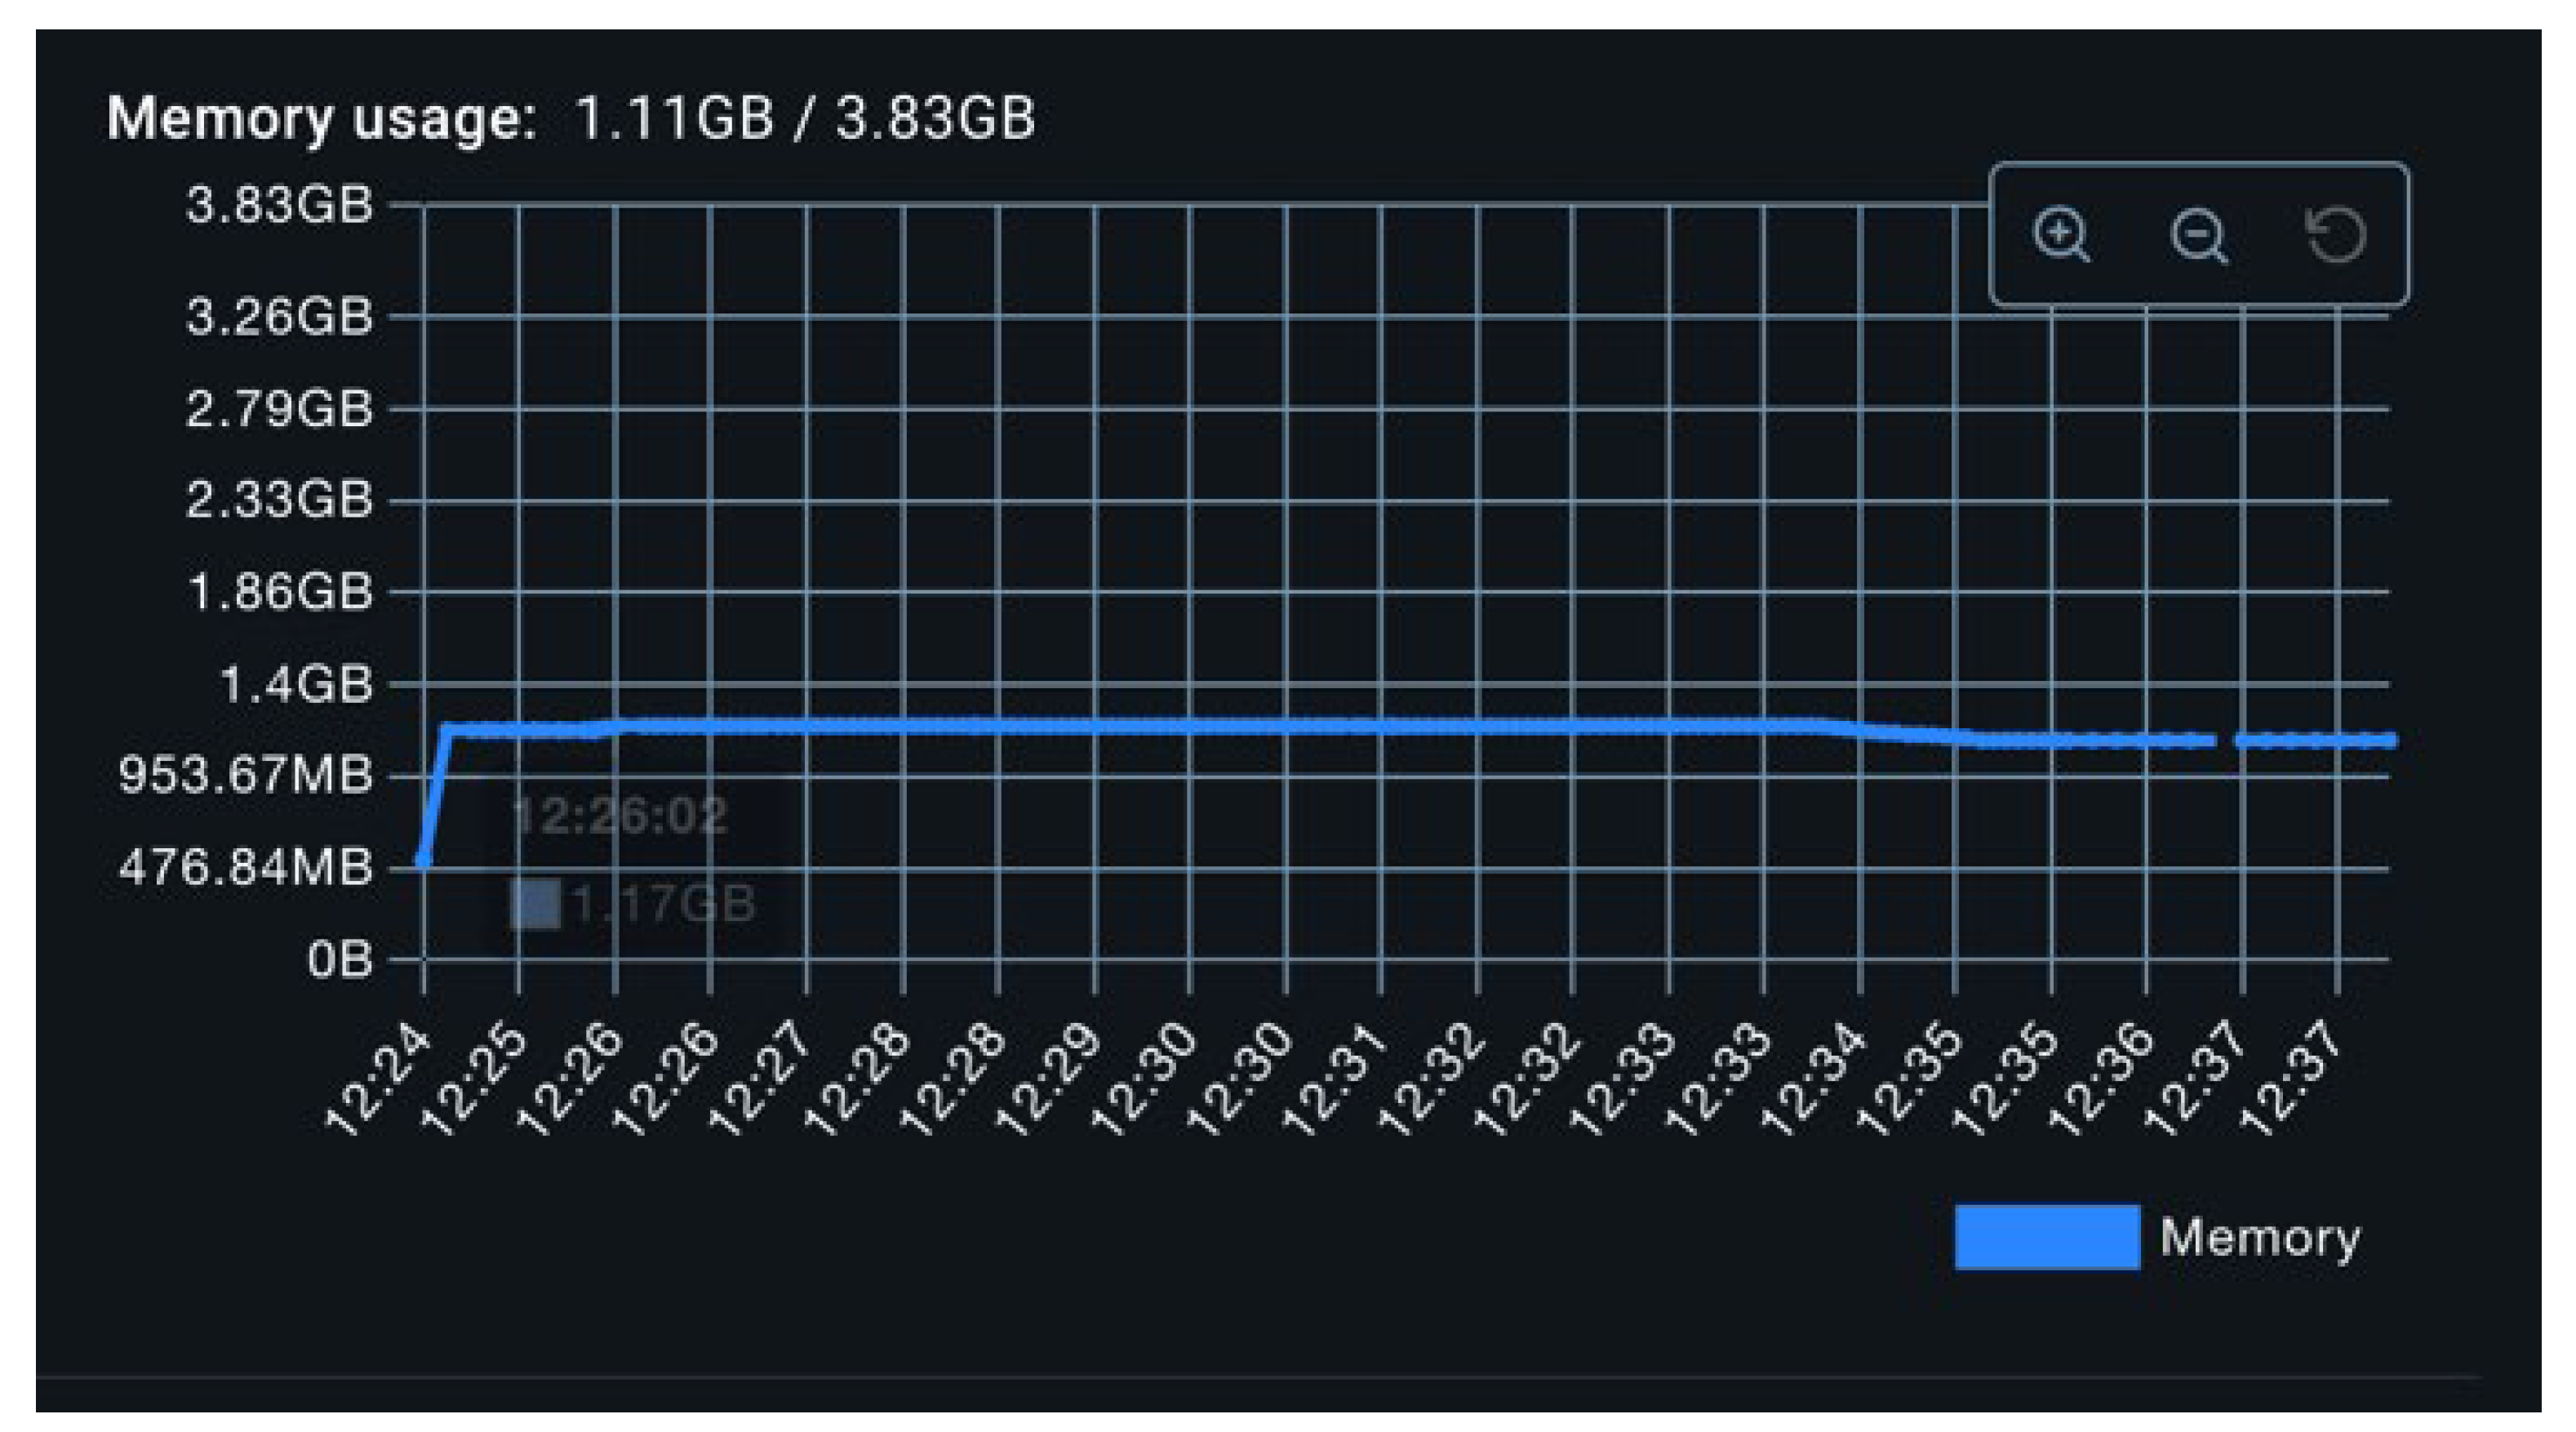
As illustrated in Figure 8, CPU utilization in this configuration remained around 3%, with periodic spikes reaching 20%. These spikes are attributed to synchronized metric flush operations across all exporters. As seen in Figure 9, memory consumption increased from the baseline to approximately 300 MB, an expected outcome due to the initialization of exporter-related data structures, including caches and thread pools.
To intensify the load, the metric production interval was reduced to 40 milliseconds. Under this configuration, CPU usage increased to approximately 6%, while peak values during flush events remained consistent with previous observations (Figure 10). Memory usage remained largely unchanged (Figure 11). This plateau in memory utilization suggests that memory consumption is dominated by static components (e.g., beans, thread pools, buffer structures), and is largely invariant to the frequency of metric creation. Fluctuations observed during the experiment are likely attributable to the operation of the Java garbage collector.
7.4.2. Per-Exporter Resource Profiling
To further refine the analysis, each exporter was profiled individually to assess its isolated impact on resource consumption. Results are summarized in Table 1. At a fixed metric production interval of 400 ms, all exporters exhibited low baseline CPU usage. When the load was increased tenfold (i.e., 40 ms intervals), CPU consumption roughly doubled, consistent with a linear scaling behavior.
Among the evaluated exporters, the Prometheus exporter demonstrated the lowest resource consumption. This efficiency is primarily due to its passive architecture: it exposes metrics via an HTTP endpoint, placing the responsibility of retrieval on the external Prometheus server via periodic scraping. This model offloads computational effort and is less resource-intensive compared to exporters that actively push metrics (e.g., Kafka, SQL, Cassandra).
It is important to emphasize that the measurements in Table 2 should be interpreted qualitatively rather than quantitatively. Actual resource usage is influenced by a variety of factors, including runtime environment, container configuration, host system architecture, and workload characteristics. Consequently, developers are advised to evaluate exporter performance in staging environments that closely mirror production deployments. This includes using realistic metric volumes and exporter configurations, reflective of expected operational conditions.
8. Addressing the Limitations of a Single-Threaded Exporter
The single-threaded approach to metrics reporting and exporting presents several significant advantages. The most important thing is its conceptual simplicity and reduced likelihood of implementation defects. In software engineering, minimizing complexity is a key design principle. However, under certain operational conditions—particularly high-throughput scenarios—this design may prove inadequate. This section explores the inherent limitations of the single-threaded model and examines potential strategies for enhancing performance and scalability.
In environments characterized by high-frequency metric generation, the processing capacity of the exporter may become a bottleneck. For stable system behavior, the rate of metric production must not exceed the average export rate. Caching can temporarily mask discrepancies between production and consumption rates, but persistent imbalances will eventually exhaust available memory resources.
To illustrate this point, we consider a simplified scenario in which a single producer thread generates a metric every 10 milliseconds, and the cache holds up to 10 entries. Assuming an export time of 10 milliseconds per metric, the exporter will operate at full capacity, expending 100 milliseconds to process a full cache. As long as export and production rates remain balanced, the system is stable. However, when export latency exceeds the production interval, metrics will accumulate indefinitely, eventually leading to resource exhaustion.
Such conditions pose a critical threat to application stability. Unbounded growth in queued metrics—particularly in memory-constrained environments—will culminate in out-of-memory (OOM) errors. Crucially, this failure mode is difficult to detect preemptively, as standard logging mechanisms may not capture indicators of resource pressure. From the perspective of the operator, the only observable symptom may be a gradual increase in memory usage.
Several strategies can be employed to mitigate this issue. A naïve yet effective solution involves rejecting new metrics once the internal queue of the exporter surpasses a predefined threshold. While this method guarantees bounded memory usage and is trivial to implement, it suffers from a significant drawback: loss of data. Metrics rejected under such conditions are irretrievable, which compromises the accuracy of the observability of the system. Furthermore, this behavior introduces non-determinism into monitoring, as neither the presence nor the absence of a given metric can be guaranteed.
An alternative approach involves parallelizing the exporter using a multi-threaded architecture. In theory, this should improve throughput by distributing workload across multiple threads. In practice, however, such an approach introduces considerable implementation complexity and heightened susceptibility to concurrency-related defects. Moreover, the extent of performance gains is difficult to predict, as it depends on numerous factors, including JVM behavior, hardware characteristics, the number of available database connections, and I/O latency.
The challenge of determining an optimal thread count is non-trivial. A fixed-size thread pool must be appropriately dimensioned for the target environment, a task made difficult by the heterogeneity of deployment configurations. Delegating this decision to the framework’s users via configuration parameters may alleviate the problem, but it also places the burden of tuning and performance validation on the developers integrating the framework.
Dynamic thread management, such as that offered by cached thread pools, provides an appealing compromise. Cached pools dynamically adjust the number of active threads in response to load, offering increased flexibility compared to fixed pools. However, this approach introduces new risks: excessive thread creation under sustained load can lead to memory pressure and degraded performance due to increased context switching. These considerations are particularly remarkable in I/O-bound workloads where concurrency does not always translate into improved performance, especially when backend resources (e.g., database connections) are saturated.
A more modern alternative is the use of Java’s virtual threads, introduced in version 21. Virtual threads are lightweight and well-suited for I/O-intensive workloads. They can be effectively managed using the Executors.newVirtualThreadPerTaskExecutor(), which schedules tasks onto a shared pool of platform threads [65]. This model mitigates the cost of context switching and reduces the memory overhead associated with thread management. However, adoption of this feature is currently limited by the conservative upgrade cycles of the industry. Many production systems continue to rely on Java 11 or 17, both of which remain under long-term support. As a result, reliance on Java 21 features may restrict the applicability of the framework.
To empirically evaluate the performance implications of the previously mentioned threading models, a worst-case scenario was constructed. A thread pool comprising 50 threads was tasked with generating 100,000 metrics per thread, yielding a total of 5 million operations per test container. The SQL exporter was selected as the benchmark. Under the single-threaded model, memory usage surged from approximately 200 MB to 1.2 GB, as shown in Figure 13, and remained elevated. Notably, garbage collection failed to reclaim memory for an extended duration. Meanwhile, CPU utilization remained modest, with occasional spikes likely attributable to garbage collection activity (Figure 12). Total export duration was approximately 25 minutes.
Figure 12.
CPU while Stress Testing the Single Threaded Exporter.
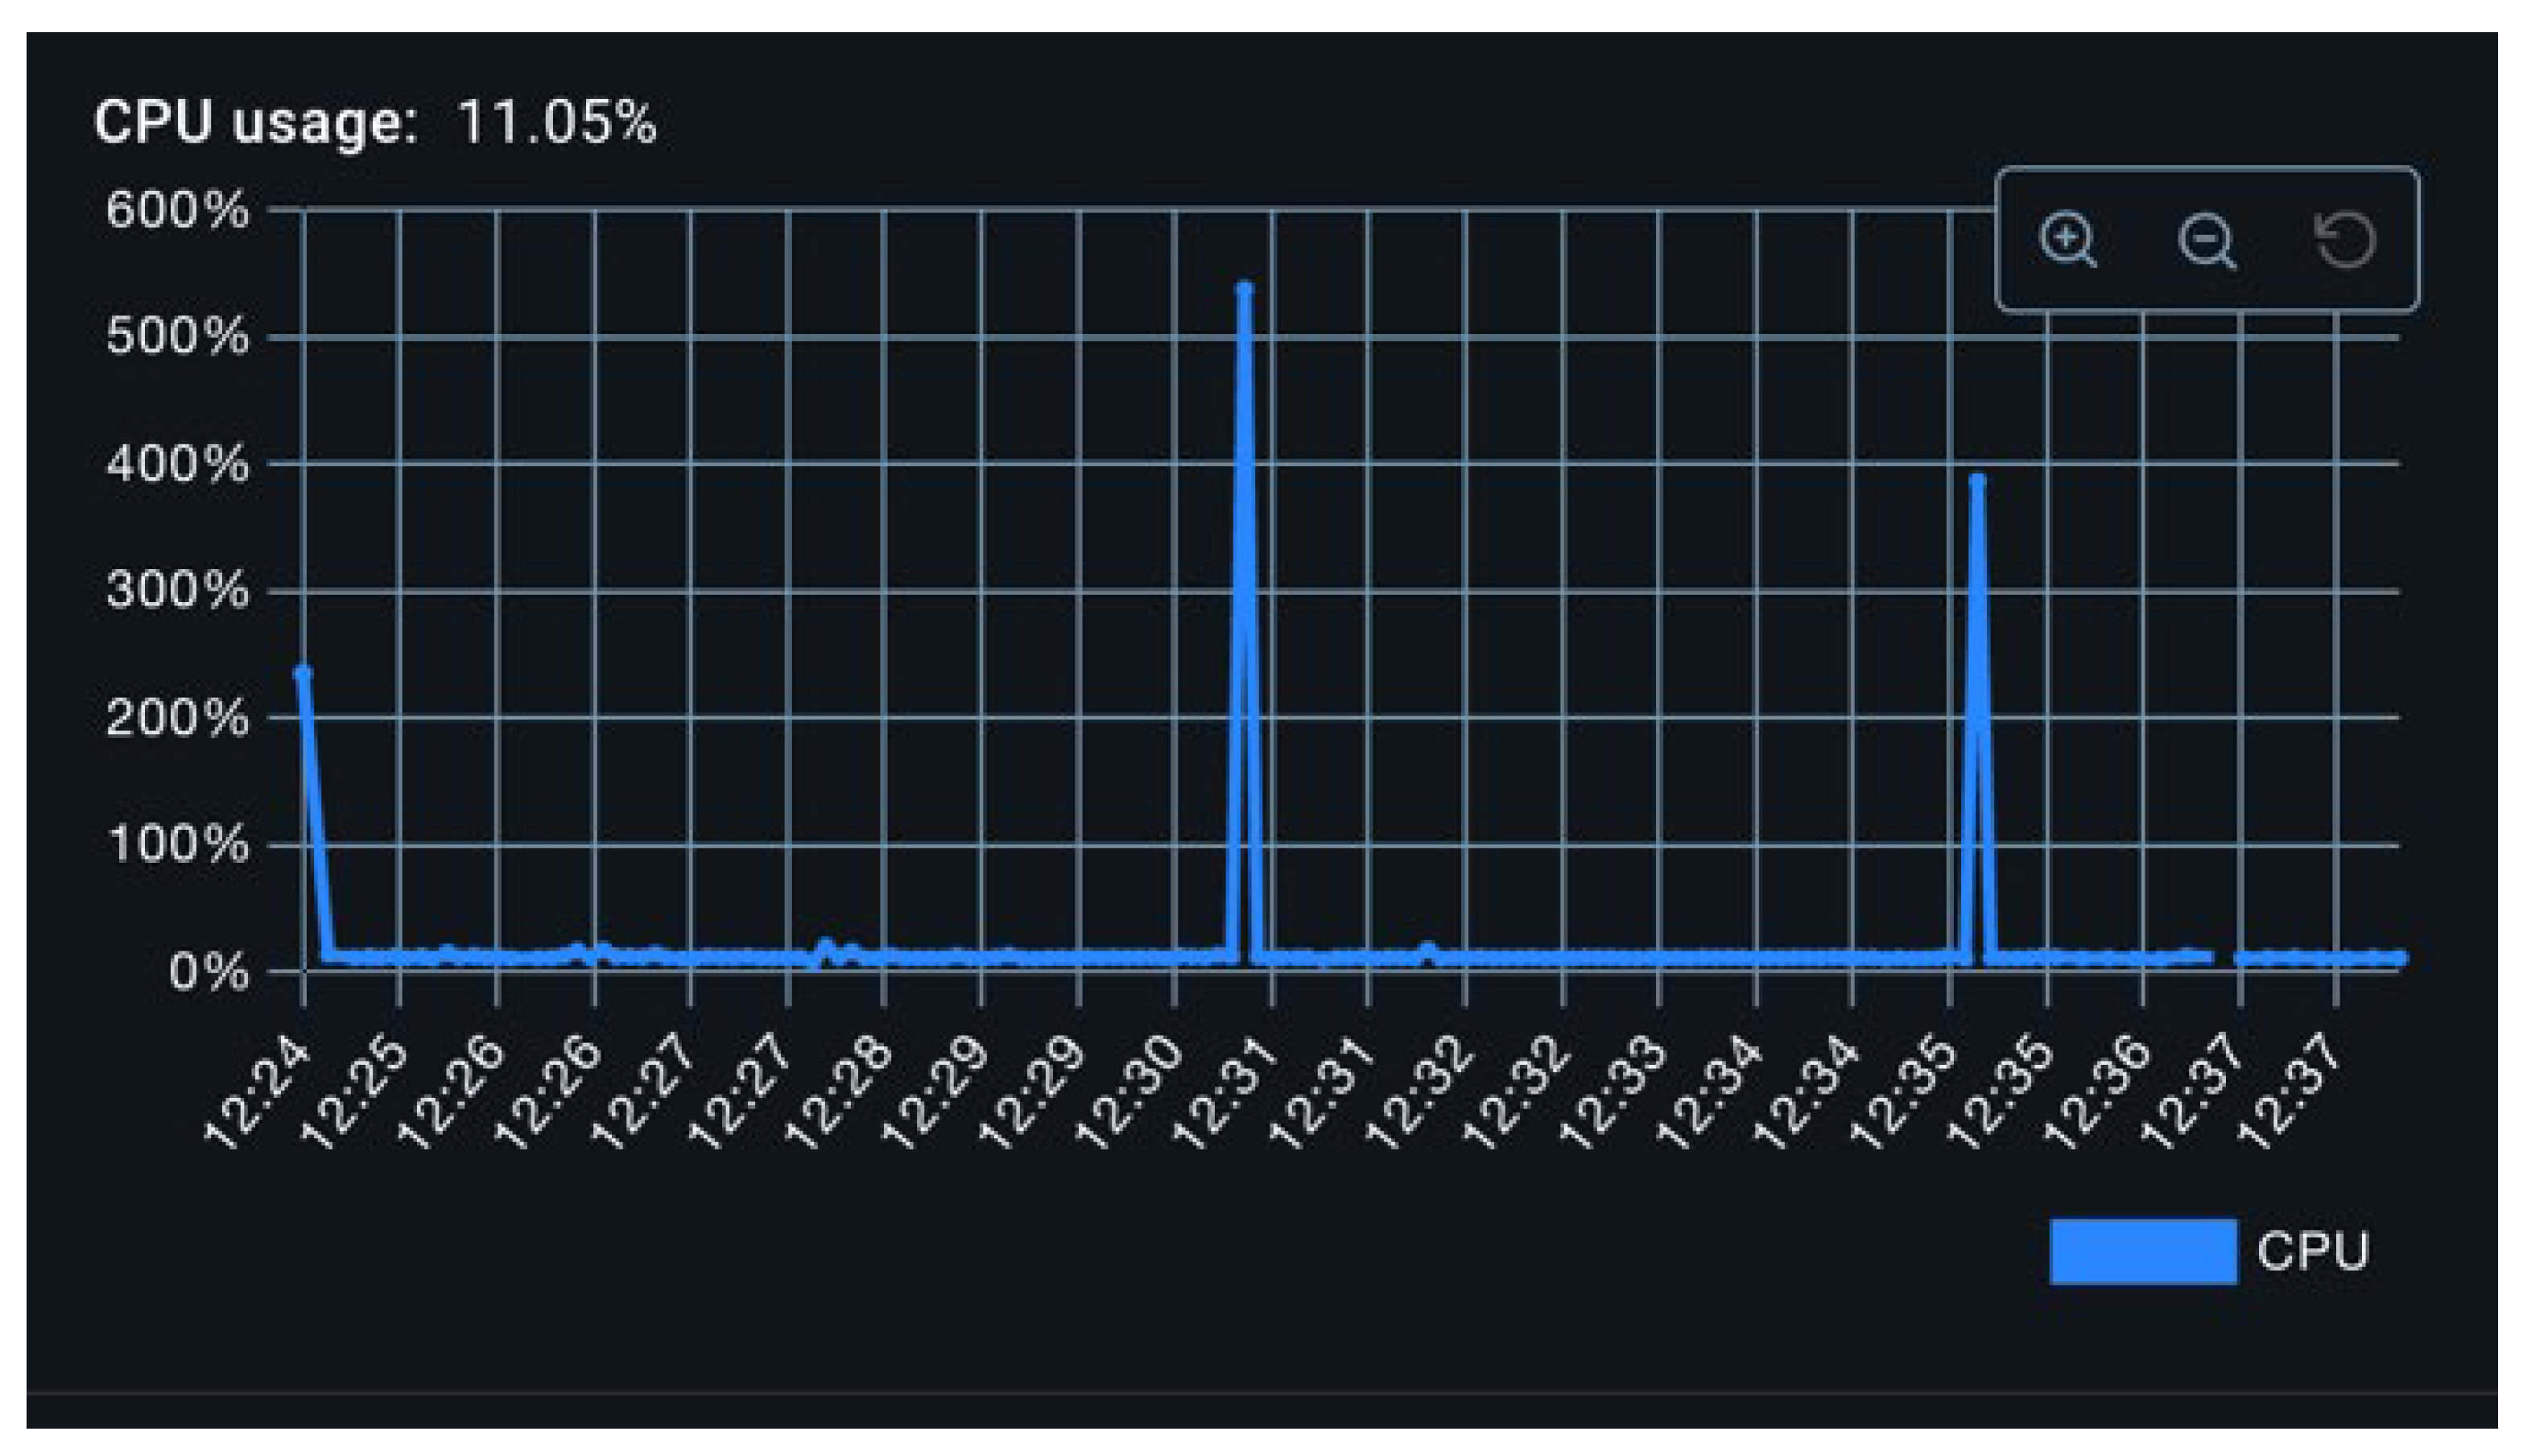
Figure 13.
Memory while Stress Testing the Single Threaded Exporter.
Contrary to expectations, replacing the single-threaded exporter with a fixed thread pool (2 or 5 threads), a cached thread pool, or a virtual thread executor led to application crashes due to memory exhaustion. This result appears to stem from differences in queuing behavior. In the single-threaded model, lightweight tasks (e.g., list insertions) are queued within the metrics reporter. In contrast, the multi-threaded models queue heavier operations, such as those involving database connections, directly in the exporter. Consequently, memory usage scales more aggressively with load in the latter case.
An alternative mitigation strategy involves adaptive metrics merging. In overload scenarios, incoming metrics of the same type could be aggregated (e.g., by computing mean execution times) rather than enqueued individually. This would reduce queue size but at the cost of metric fidelity. Such an approach is best regarded as a fallback mechanism, suitable only when complete observability is infeasible. Moreover, defining a principled threshold for initiating this behavior remains an open challenge.
Overall, the empirical evaluations demonstrate that the proposed framework meets all initially defined objectives. While certain edge cases (e.g., multi-threaded exporter scalability) revealed potential optimization areas, the core goals of interoperability, ease of integration, and efficiency have been fully realized.
9. Conclusions and Future Directions
The primary objective of this project was to develop a lightweight and non-intrusive runtime observability framework, capable of providing accurate performance measurements with minimal configuration overhead and low system resource usage. This goal has been successfully achieved. The resulting framework offers a user-effective interface that is both intuitive and minimalistic, requiring very limited setup while ensuring ease of integration into existing systems. Furthermore, it maintains compatibility with a diverse range of backend systems, including various relational and non-relational databases, monitoring platforms, and metric aggregation tools. Despite its modest resource footprint, the framework consistently delivers reliable and precise metrics, fulfilling its central role in enabling effective application monitoring in production and testing environments.
A key insight gained during the development and evaluation phases of this work pertains to the importance of empirically validating theoretical assumptions—particularly those related to concurrency, memory management, and exporter performance. A particularly illustrative example emerged during the design and testing of multi-threaded exporters. While preliminary theoretical considerations suggested that multi-threading would enhance throughput and responsiveness, empirical testing revealed an unexpected consequence: the relocation of task queuing from the metric reporters to the exporters introduced a substantial memory burden, in some cases leading to out-of-memory (OOM) conditions. This finding highlights a broader principle in systems engineering: even seemingly straightforward architectural optimizations must be rigorously tested under realistic and stress-inducing conditions, as performance trade-offs are often nonlinear and context-dependent.
Revisiting the objectives defined in Chapter 3, the developed framework has demonstrably achieved its intended goals. The interoperability objective was validated through multi-platform exporter implementations; ease of use was confirmed by successful integration in minimal Spring applications; and low overhead was verified through quantitative CPU and memory analysis. These results confirm that the proposed design effectively balances functionality and performance, fulfilling the research aims of this study.
Looking ahead, there are several important directions for future improvement. The most important of them is expanding the interoperability of the framework by increasing the number of supported exporters. Enhancing compatibility with a broader array of monitoring and storage systems will significantly improve the applicability of the framework across diverse software ecosystems and deployment scenarios. Another critical enhancement concerns the implementation of a robust backpressure mechanism to manage overload conditions in exporter components. As examined in Chapter 8, such a mechanism is non-trivial to design, especially in a system prioritizing low overhead and high reliability. It will require careful architectural consideration to ensure that the system remains resilient even under conditions of extreme metric generation.
Ultimately, the work presented in this project demonstrates that efficient and developer-friendly observability is attainable through careful design, empirical validation, and thoughtful trade-offs. The lessons learned and the architectural foundations laid herein serve as a solid basis for ongoing enhancements aimed at achieving greater scalability, extensibility, and robustness in real-world monitoring systems.
Author Contributions
Conceptualization, A.Gh. and C.T.; formal analysis, A.Gh. and C.T.; investigation, A.Gh..; methodology, A.Gh.; software, A.Gh.; supervision, C.T.; validation, A.Gh. and C.T.; writing—original draft, A.Gh.; writing—review and editing, C.T. All authors have read and agreed to the published version of the manuscript.
Funding
This research received no external funding.
Informed Consent Statement
Not Applicable
Data Availability Statement
Data available in publicly accessible repository. The data presented in this study are openly available in GitHub at https://github.com/LucianGherghe/observability-code-measurements
Conflicts of Interest
The authors declare no conflicts of interest.
References
- Why do we use Node.JS at Bolt. Available online: https://bolt.eu/en/blog/why-we-use-node-js/ (accessed on October 1st 2025).
- Observability Survey 2023. Available online: https://grafana.com/observability-survey/2023/ (accessed on October 1st 2025).
- Observability Survey 2024. Available online: https://grafana.com/observability-survey/2024/ (accessed on October 1st 2025).
- Observability Survey 2025. Available online: https://grafana.com/observability-survey/2025/ (accessed on October 1st 2025).
- Anghel, I.I.; Calin, R.S.; Nedelea, M.L.; Stanica, I.C.; Tudose, C.; Boiangiu, C.A. Software development methodologies: A comparative analysis. UPB Sci. Bull. 2022, 83, 45–58. [Google Scholar]
- Bloch, J. Effective Java; Addison-Wesley: Boston, MA; 2018.
- Spring Framework Overview. Available online: https://spring.io/why-spring (accessed on October 1st 2025).
- Prometheus Overview. Available online: https://prometheus.io/docs/introduction/overview/ (accessed on October 1st 2025).
- Graphite Overview. Available online: https://graphiteapp.org/#overview (accessed on October 1st 2025).
- Apache Kafka Introduction. Available online: https://kafka.apache.org/intro (accessed on October 1st 2025).
- RabbitMQ Introduction. Available online: https://www.rabbitmq.com (accessed on October 1st 2025).
- Loki Architecture. Available online: https://grafana.com/oss/loki/ (accessed on October 1st 2025).
- Alhosban, A.; Pesingu, S.; Kalyanam, K. CVL: A Cloud Vendor Lock-In Prediction Framework. Mathematics, Basel, 2024, 12(3), 387.
- Java SE Support Roadmap. Available online: https://www.oracle.com/java/technologies/java-se-support-roadmap.html (accessed on October 1st 2025).
- A Java 17 and Jakarta EE 9 baseline for Spring Framework 6. Available online: https://spring.io/blog/2021/09/02/a-java-17-and-jakarta-ee-9-baseline-for-spring-framework-6 (accessed on October 1st 2025).
- Jar Files. Available online: https://docs.oracle.com/javase/8/docs/technotes/guides/jar/jarGuide.html (accessed on October 1st 2025).
- Maven Overview. Available online: https://maven.apache.org/what-is-maven.html (accessed on October 1st 2025).
- Gradle Overview. Available online: https://docs.gradle.org/current/userguide/userguide.html (accessed on October 1st 2025).
- Dependency Injection. Available online: https://docs.spring.io/spring-framework/reference/core/beans/dependencies/factory-collaborators.html (accessed on October 1st 2025).
- Kiczales, G.; Lamping, J.; Mendhekar, A.; Maeda, C., Lopes, C.V.; Loingtier, J.M.; Irwin J. Aspect-oriented programming. ECOOP’97 — Object-Oriented Programming. ECOOP 1997. Lecture Notes in Computer Science, vol 1241. Springer, Berlin, Heidelberg.
- Spring AOP. Available online: https://docs.spring.io/spring-framework/reference/core/aop.html (accessed on October 1st 2025).
- Laddad, R. (2010). AspectJ in Action: Enterprise AOP with Spring Applications (2nd ed.). Manning; New York, NY, USA, 2024.
- AspectJ Semantics Introduction. Available online: https://eclipse.dev/aspectj/doc/released/progguide/semantics.html#semantics-intro (accessed on October 1st 2025).
- Load-Time Weaving. Available online: https://eclipse.dev/aspectj/doc/released/devguide/ltw.html (accessed on October 1st 2025).
- AOP Goals. Available online: https://docs.spring.io/spring-framework/reference/core/aop/introduction-spring-defn.html (accessed on October 1st 2025).
- AspectJ Support. Available online: https://docs.spring.io/spring-framework/reference/core/aop/ataspectj.html (accessed on October 1st 2025).
- AOP Documentation - Proxies. Available online: https://docs.spring.io/spring-framework/reference/core/aop/proxying.html (accessed on October 1st 2025).
- Kleppmann, M. Designing Data-Intensive Applications: The Big Ideas Behind Reliable, Scalable, and Maintainable Systems. O’Reilly; 2018.
- System Javadoc. Available online: https://docs.oracle.com/en/java/javase/17/docs/api/java.base/java/lang/System.html (accessed on October 1st 2025).
- ConcurrentHashMap Javadoc. Available online: https://docs.oracle.com/en/java/javase/17/docs/api/java.base/java/util/concurrent/ConcurrentHashMap.html#%3Cinit%3E() (accessed on October 1st 2025).
- Executors. Available online: https://docs.oracle.com/en/java/javase/17/docs/api/java.base/java/util/concurrent/Executors.html (accessed on October 1st 2025).
- Spring Doc - DisposableBean. Available online: https://docs.spring.io/spring-framework/docs/current/javadoc-api/org/springframework/beans/factory/DisposableBean.html (accessed on October 1st 2025).
- What is Event Streaming. Available online: https://www.confluent.io/learn/event-streaming/ (accessed on October 1st 2025).
- Apache Kafka Introduction. Available online: https://kafka.apache.org/intro (accessed on October 1st 2025).
- Kafka Partitioning Keys. Available online: https://www.confluent.io/learn/kafka-partition-key/ (accessed on October 1st 2025).
- Wu H.; Shang Z.; & Wolter, K. Performance Prediction for the Apache Kafka Messaging System. 2019 IEEE 21st International Conference on High Performance Computing and Communications.
- Companies Using Kafka. Available online: https://kafka.apache.org/powered-by (accessed on October 1st 2025).
- Querying Prometheus. Available online: https://prometheus.io/docs/prometheus/latest/querying/basics/ (accessed on October 1st 2025).
- When to Use Pushgateway. Available: https://prometheus.io/docs/practices/pushing/ (accessed on October 1st 2025).
- Prometheus Metric Types. Available online: https://prometheus.io/docs/concepts/metric_types/ (accessed on October 1st 2025).
- OASIS Advanced Message Queuing Protocol (AMQP) Version 1.0 Part 0: Overview. https://docs.oasis-open.org/amqp/core/v1.0/os/amqp-core-overview-v1.0-os.html (accessed on October 1st 2025).
- RabbitMQ Consumers. Available online: https://www.rabbitmq.com/tutorials/amqp-concepts#consumers (accessed on October 1st 2025).
- Codd E.F. A Relational Model of Data for Large Shared Data Banks. Communications of the ACM, 1970, 13 (6), 377-387.
- Grippa, V.; Kuzmichev, S. Learning MySQL: Get a Handle on Your Data, 2nd ed.; O’Reilly Media: Sebastopol, CA, USA, 2021. [Google Scholar]
- O’Hearn, S. OCA Oracle Database SQL Exam Guide (Exam 1Z0-071) (Oracle Press); McGraw Hill: New York, NY, USA, 2017. [Google Scholar]
- Kirshteyn, M. Mastering SQL Server Database Administration. A Comprehensive Guide to Perfection and Productivity; Independently Published, 2024.
- Ferrari, L.; Pirozzi, E. Learn PostgreSQL: Use, Manage, and Build Secure and Scalable Databases with PostgreSQL 16, 2nd ed.; Packt Publishing: Birmingham, UK, 2023. [Google Scholar]
- Information Technology — Database Languages SQL. Available on;ine: https://www.iso.org/standard/76583.html (accessed on October 1st 2025).
- Java JDBC API. Available online: https://docs.oracle.com/javase/8/docs/technotes/guides/jdbc/ (accessed on October 1st 2025).
- Sadeghian, A.; Zamani, M.; Abdullah, S. M. A Taxonomy of SQL Injection Attacks 2013 International Conference on Informatics and Creative Multimedia, Kuala Lumpur, Malaysia, 2013, 269-273.
- Fowler, M. Patterns of Enterprise Application Architecture; Addison-Wesley Professional: Boston, MA, USA, 2002. [Google Scholar]
- Jakarta Persistence API Reference. Available online: https://jakarta.ee/specifications/persistence/3.2/ (accessed on October 1st 2025).
- Mihalcea, V. High-Performance Java Persistence; Self-Published: Cluj-Napoca, Romania, 2019. [Google Scholar]
- Paterno, G. NoSQL Tutorial: A comprehensive look at the NoSQL database Linux Journal 1999, 67, 2-es.
- Chauhan, A. A review on various aspects of MongoDB databases. International Journal of Engineering Research & Technology (IJERT), 2019, 8(5), 90-92.
- Carlson, J. Redis in Action Manning; New York, NY, USA, 2013.
- Fitzpatrick, B. Distributed Caching with Memcached Linux Journal 2004, 124, 5.
- Guia, J; Soares, V. G.; Bernardino, J. Graph Databases: Neo4j analysis. In Proceedings of the 19th International Conference on Enterprise Information Systems (ICEIS 2017) - Volume 1, pages 351-356.
- Buna, S. GraphQL in Action Manning; New York, NY, USA, 2021.
- Carpenter, J.; Hewitt, E. Cassandra: The Definitive Guide, Distributed Data at Web Scale, 3rd ed.; O’Reilly Media: Sebastopol, CA, USA, 2022. [Google Scholar]
- Lee, E. A.; Bateni, S.; Lin, S.; Lohstroh, M.; Menard, C. Quantifying and generalizing the CAP theorem . Available online: https://arxiv.org/abs/2109.07771 (accessed on October 1st 2025).
- Spring Boot Overview. Available online: https://docs.spring.io/spring-boot/index.html (accessed on October 1st 2025).
- Docker Compose. Available online: https://docs.docker.com/compose/ (accessed on October 1st 2025).
- Thread Class. Available online: https://docs.oracle.com/javase/8/docs/api/java/lang/Thread.html (accessed on October 1st 2025).
- Beronić, D., Pufek, P., Mihaljević, B., & Radovan, A. (2021, September). On Analyzing Virtual Threads–a Structured Concurrency Model for Scalable Applications on the JVM. In 2021 44th International Convention on Information, Communication and Electronic Technology (MIPRO).
Figure 1.
Inverting the Exporter dependency.
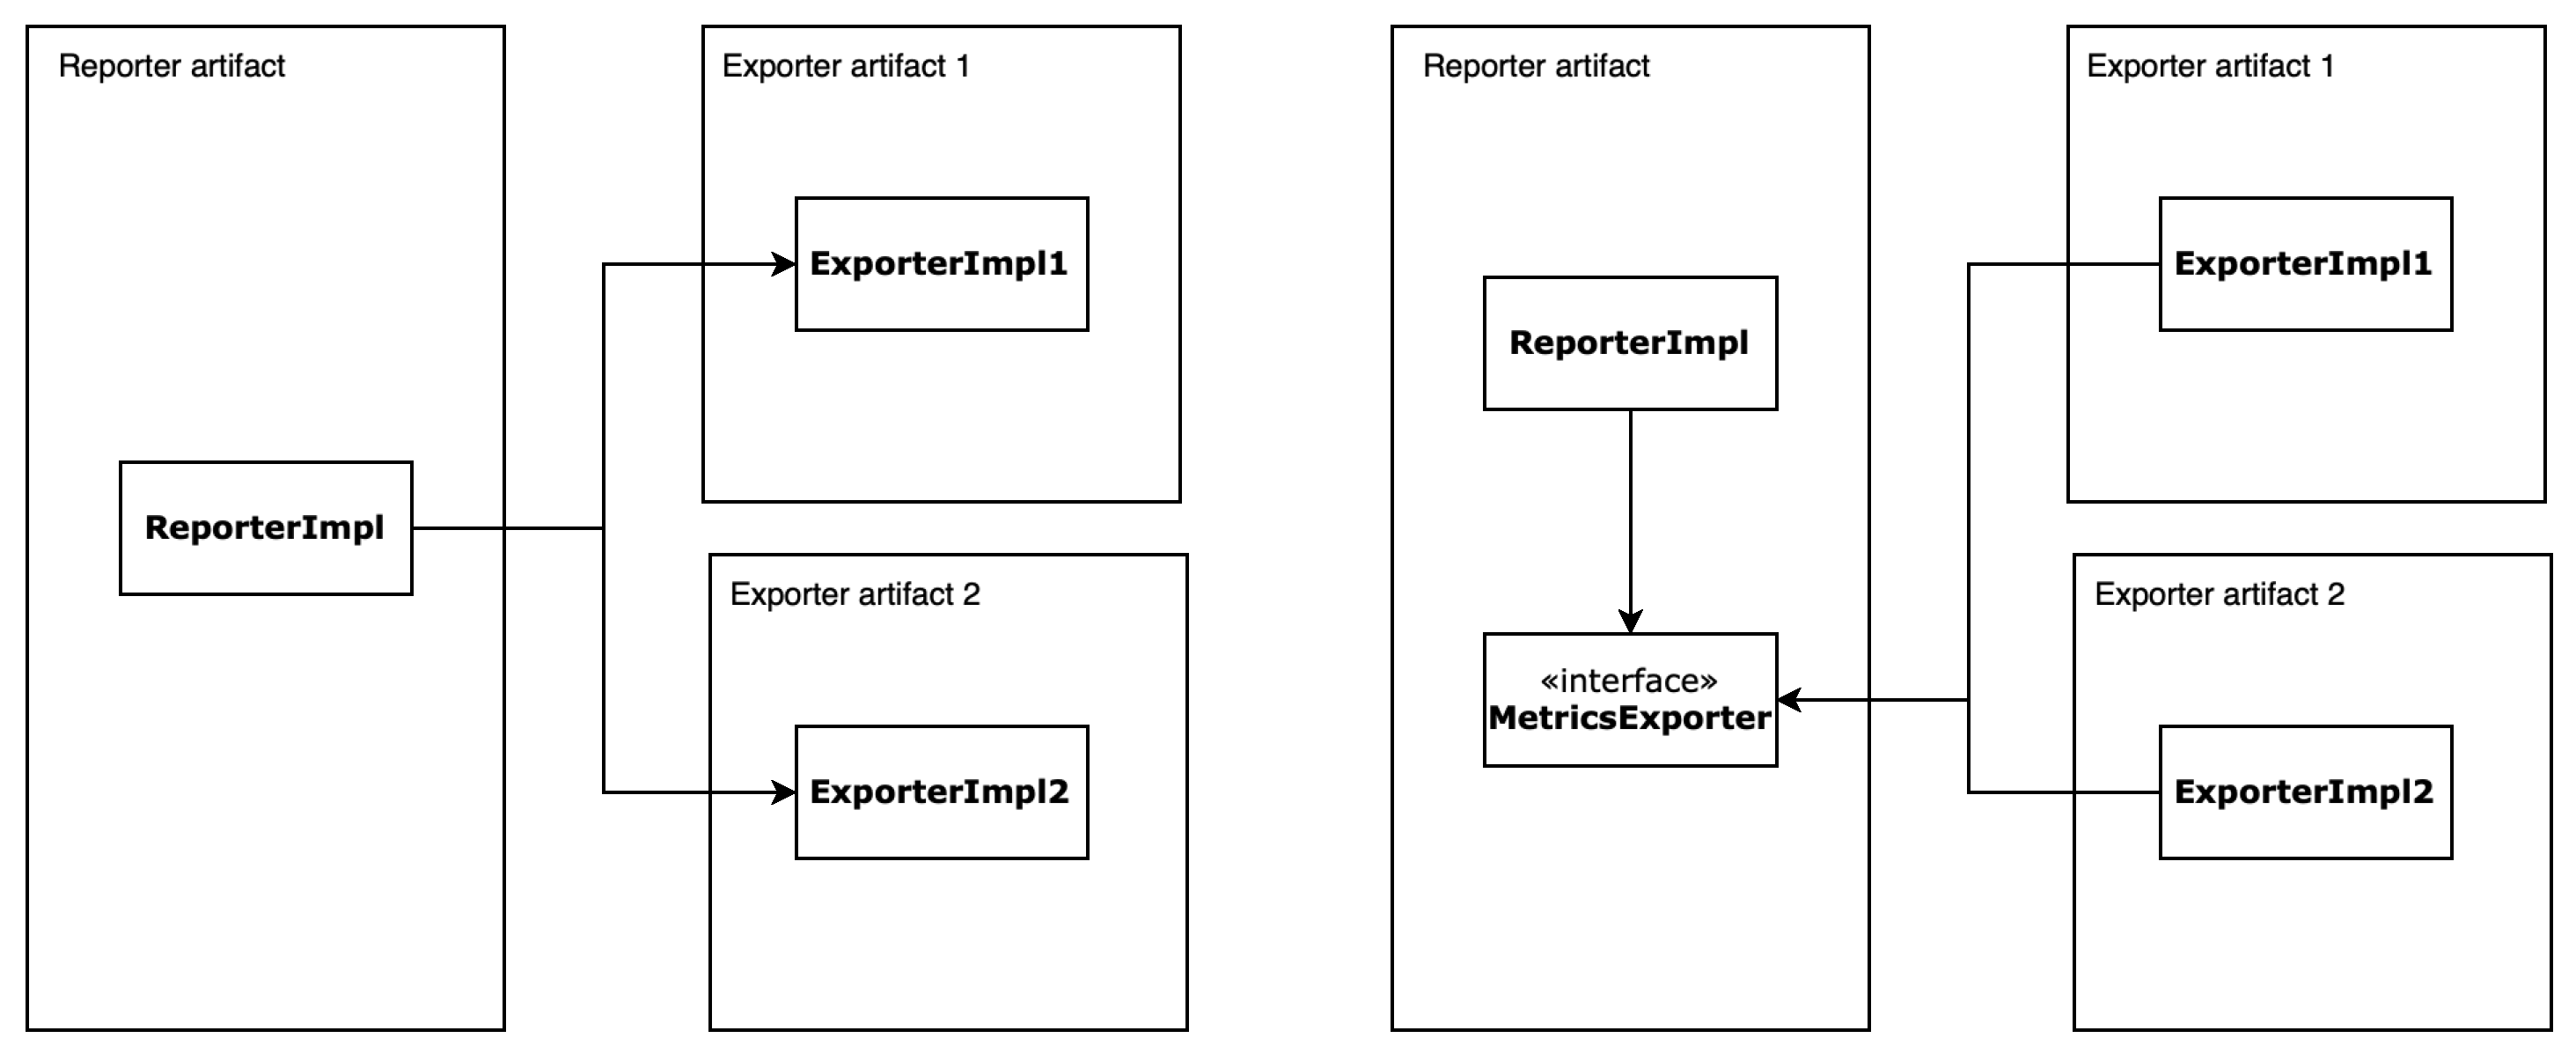
Figure 2.
High-level architecture of Apache Kafka. Producers send events to brokers, which store them in partitioned topics. Consumers retrieve events from partitions based on offset tracking.
Figure 2.
High-level architecture of Apache Kafka. Producers send events to brokers, which store them in partitioned topics. Consumers retrieve events from partitions based on offset tracking.
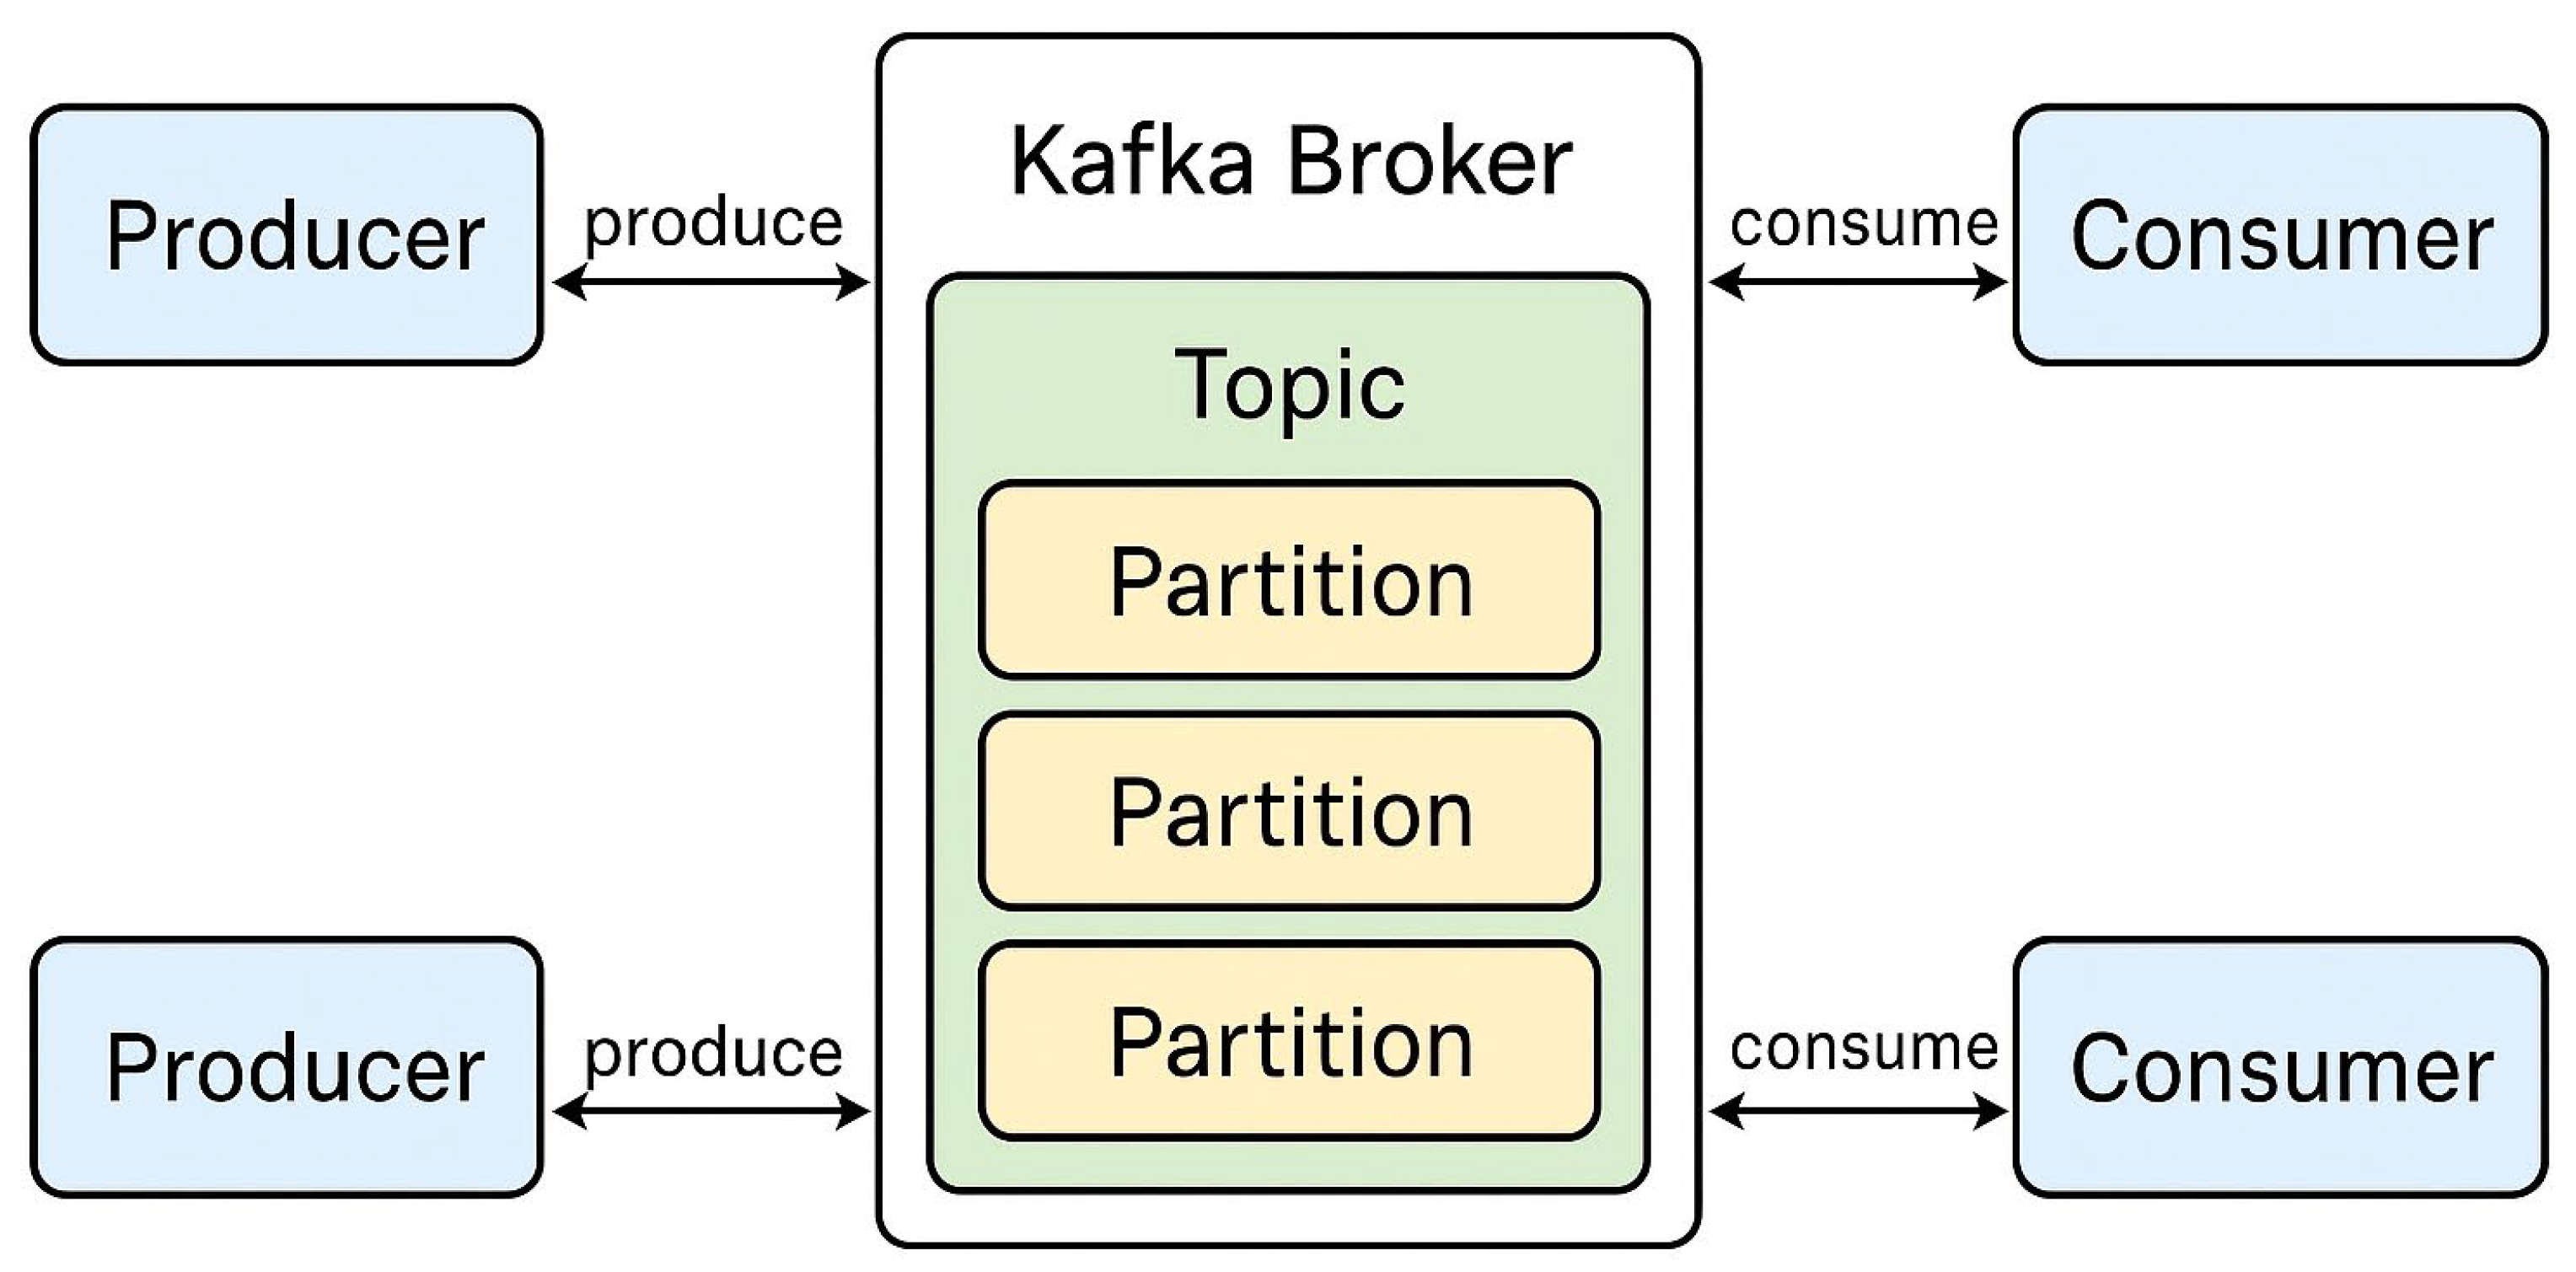
Figure 3.
Time window showing lost metrics due to missed scrapes during application shutdown.

Figure 4.
Single statement vs batches.
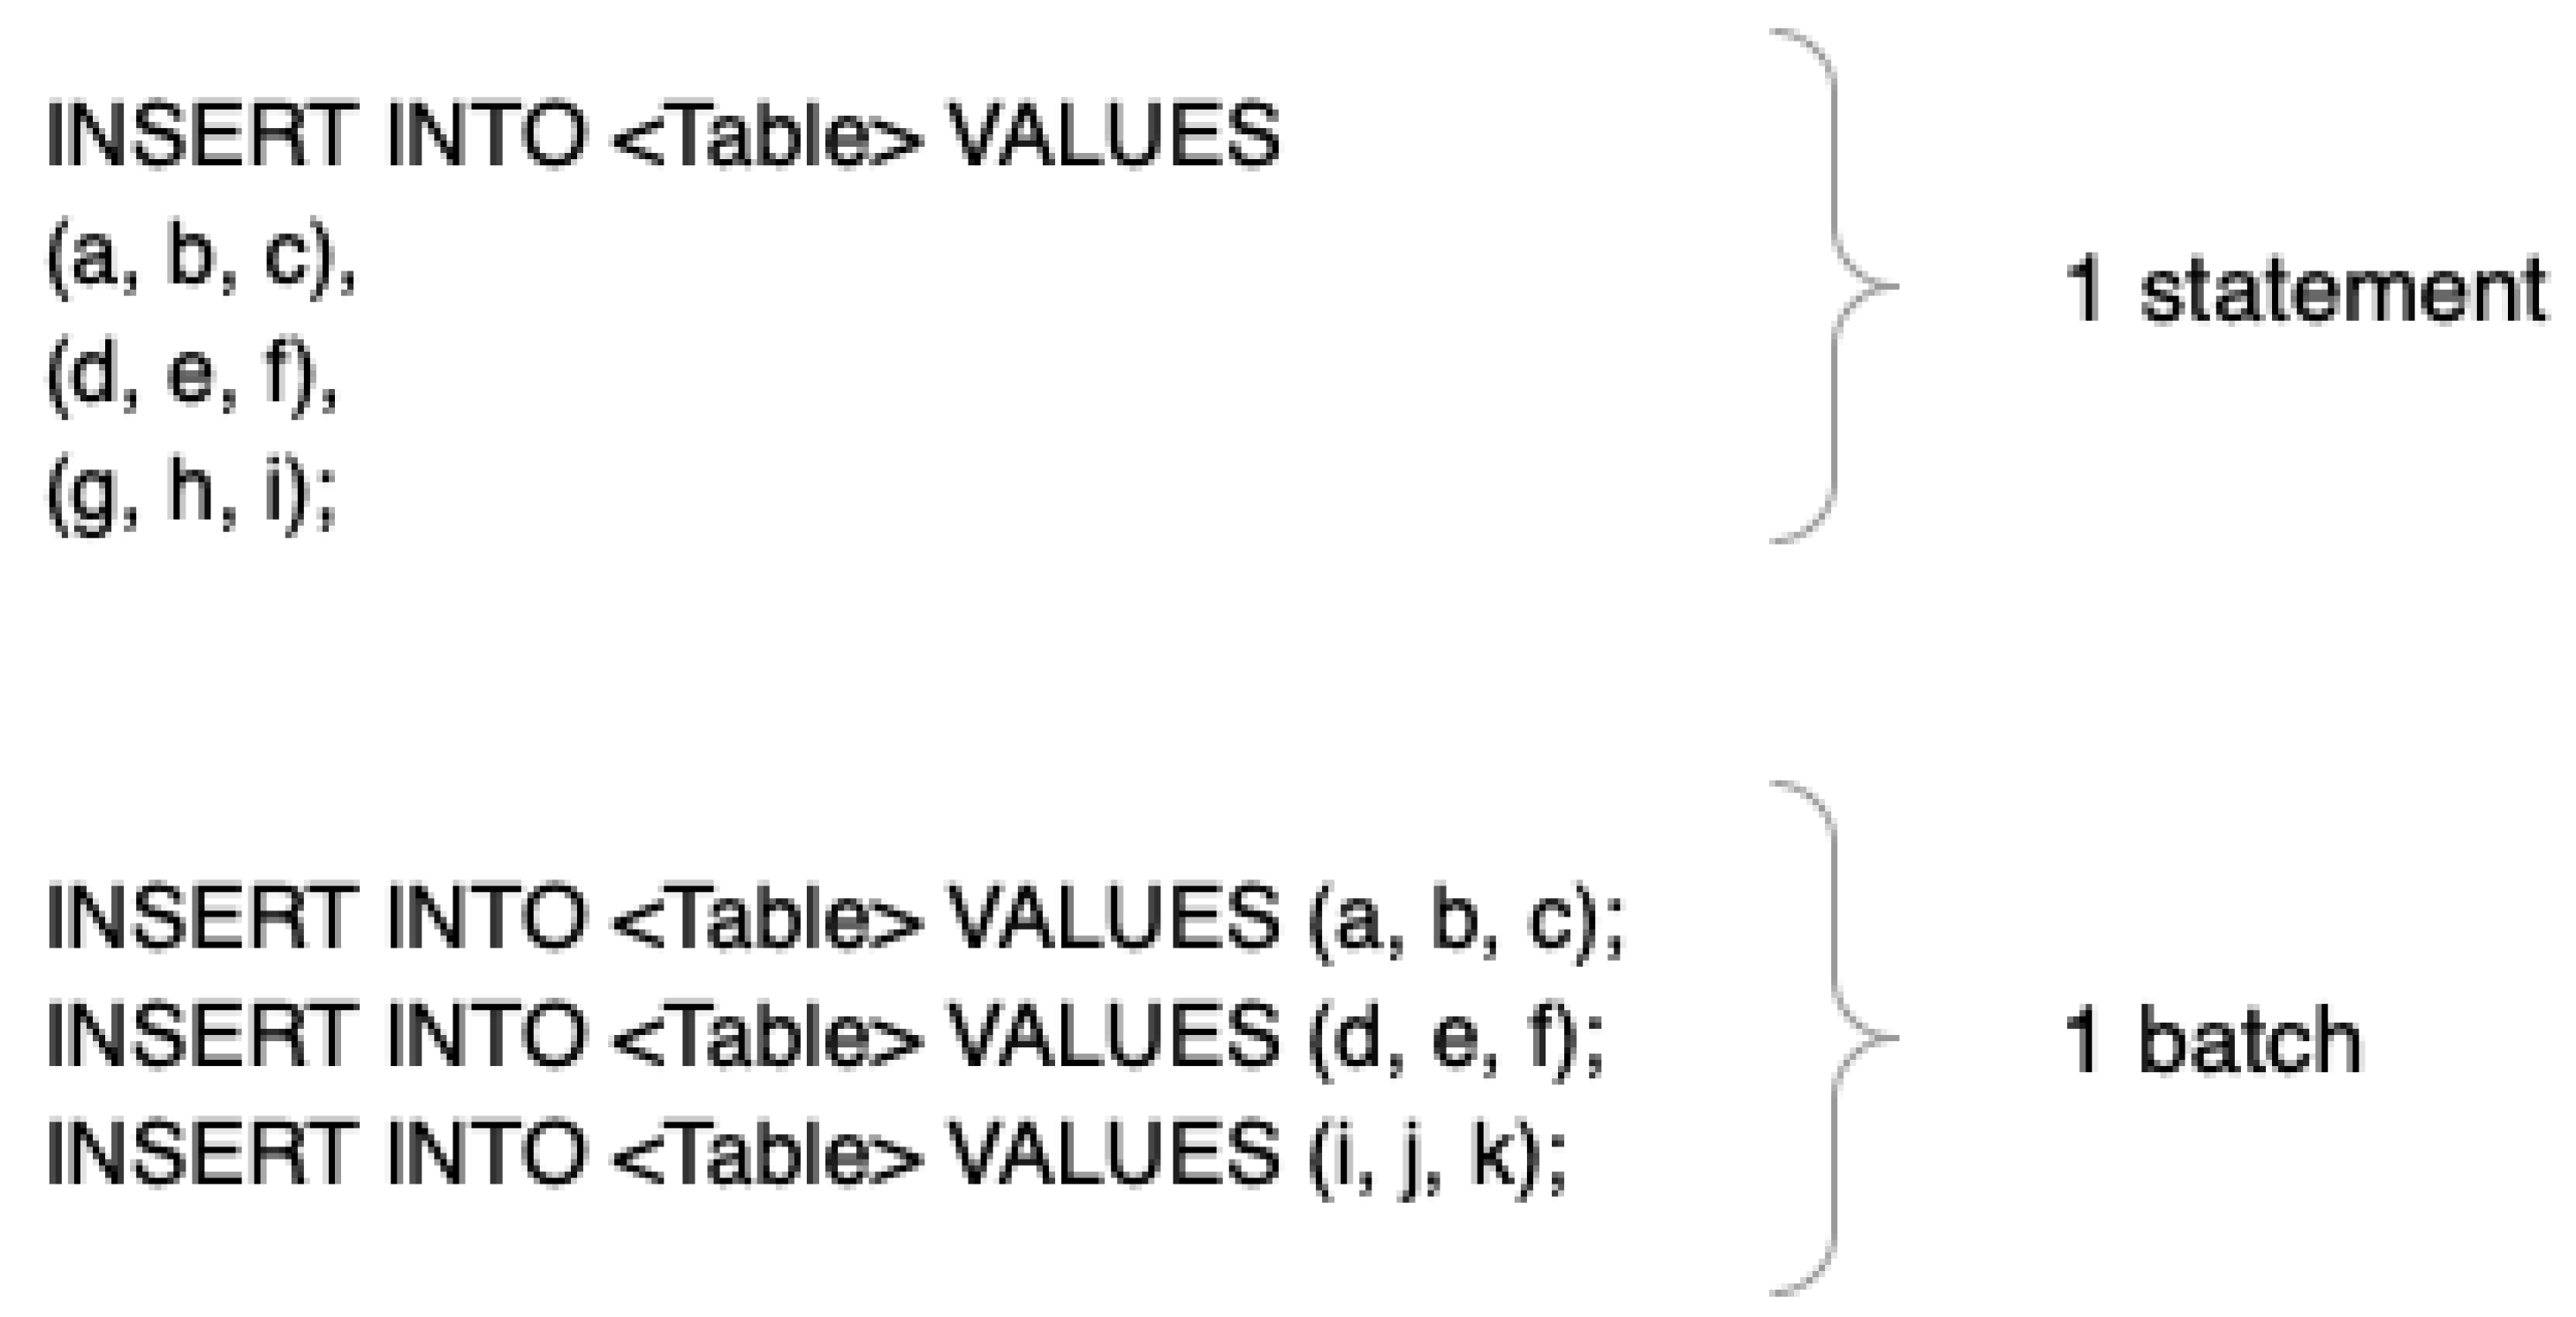
Figure 5.
Cassandra Exporter Dependencies.
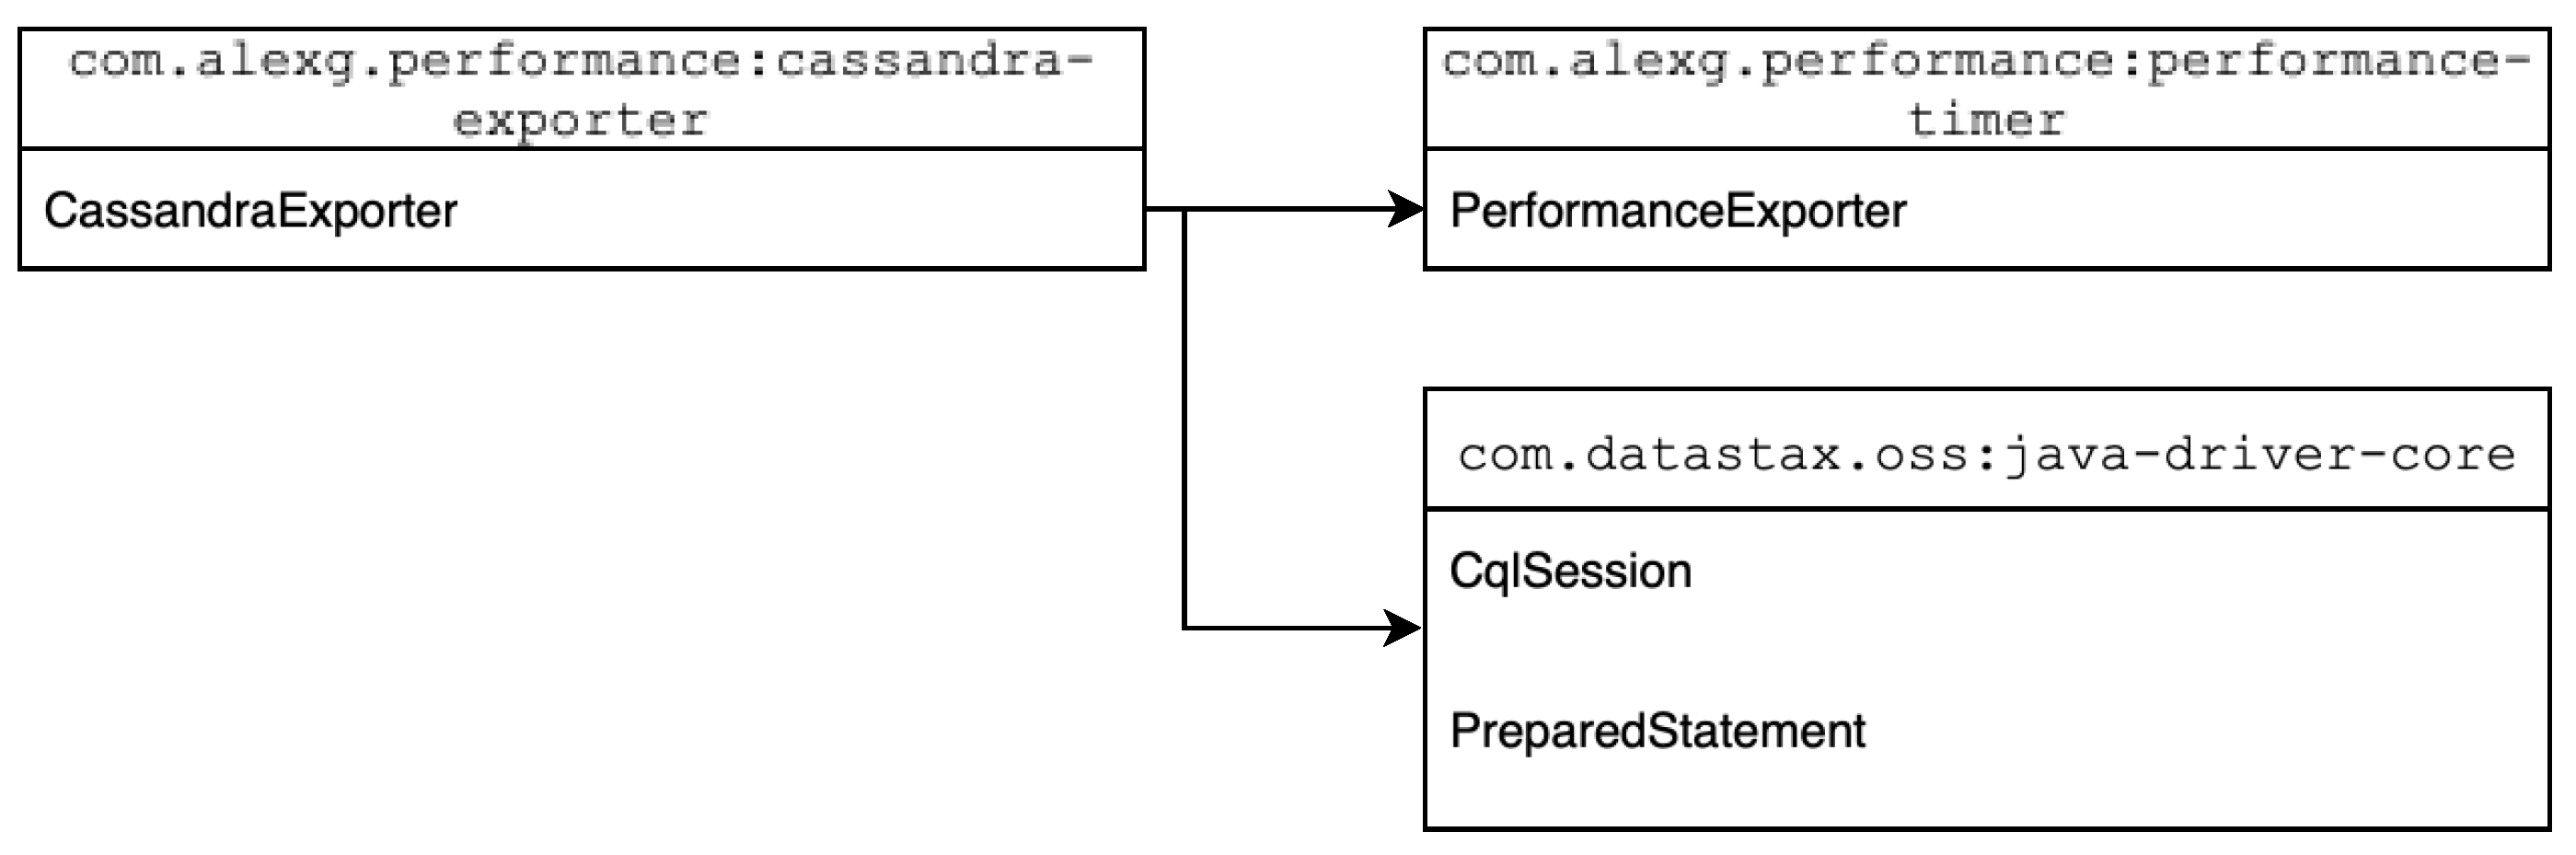
Figure 6.
Baseline CPU Measurements.
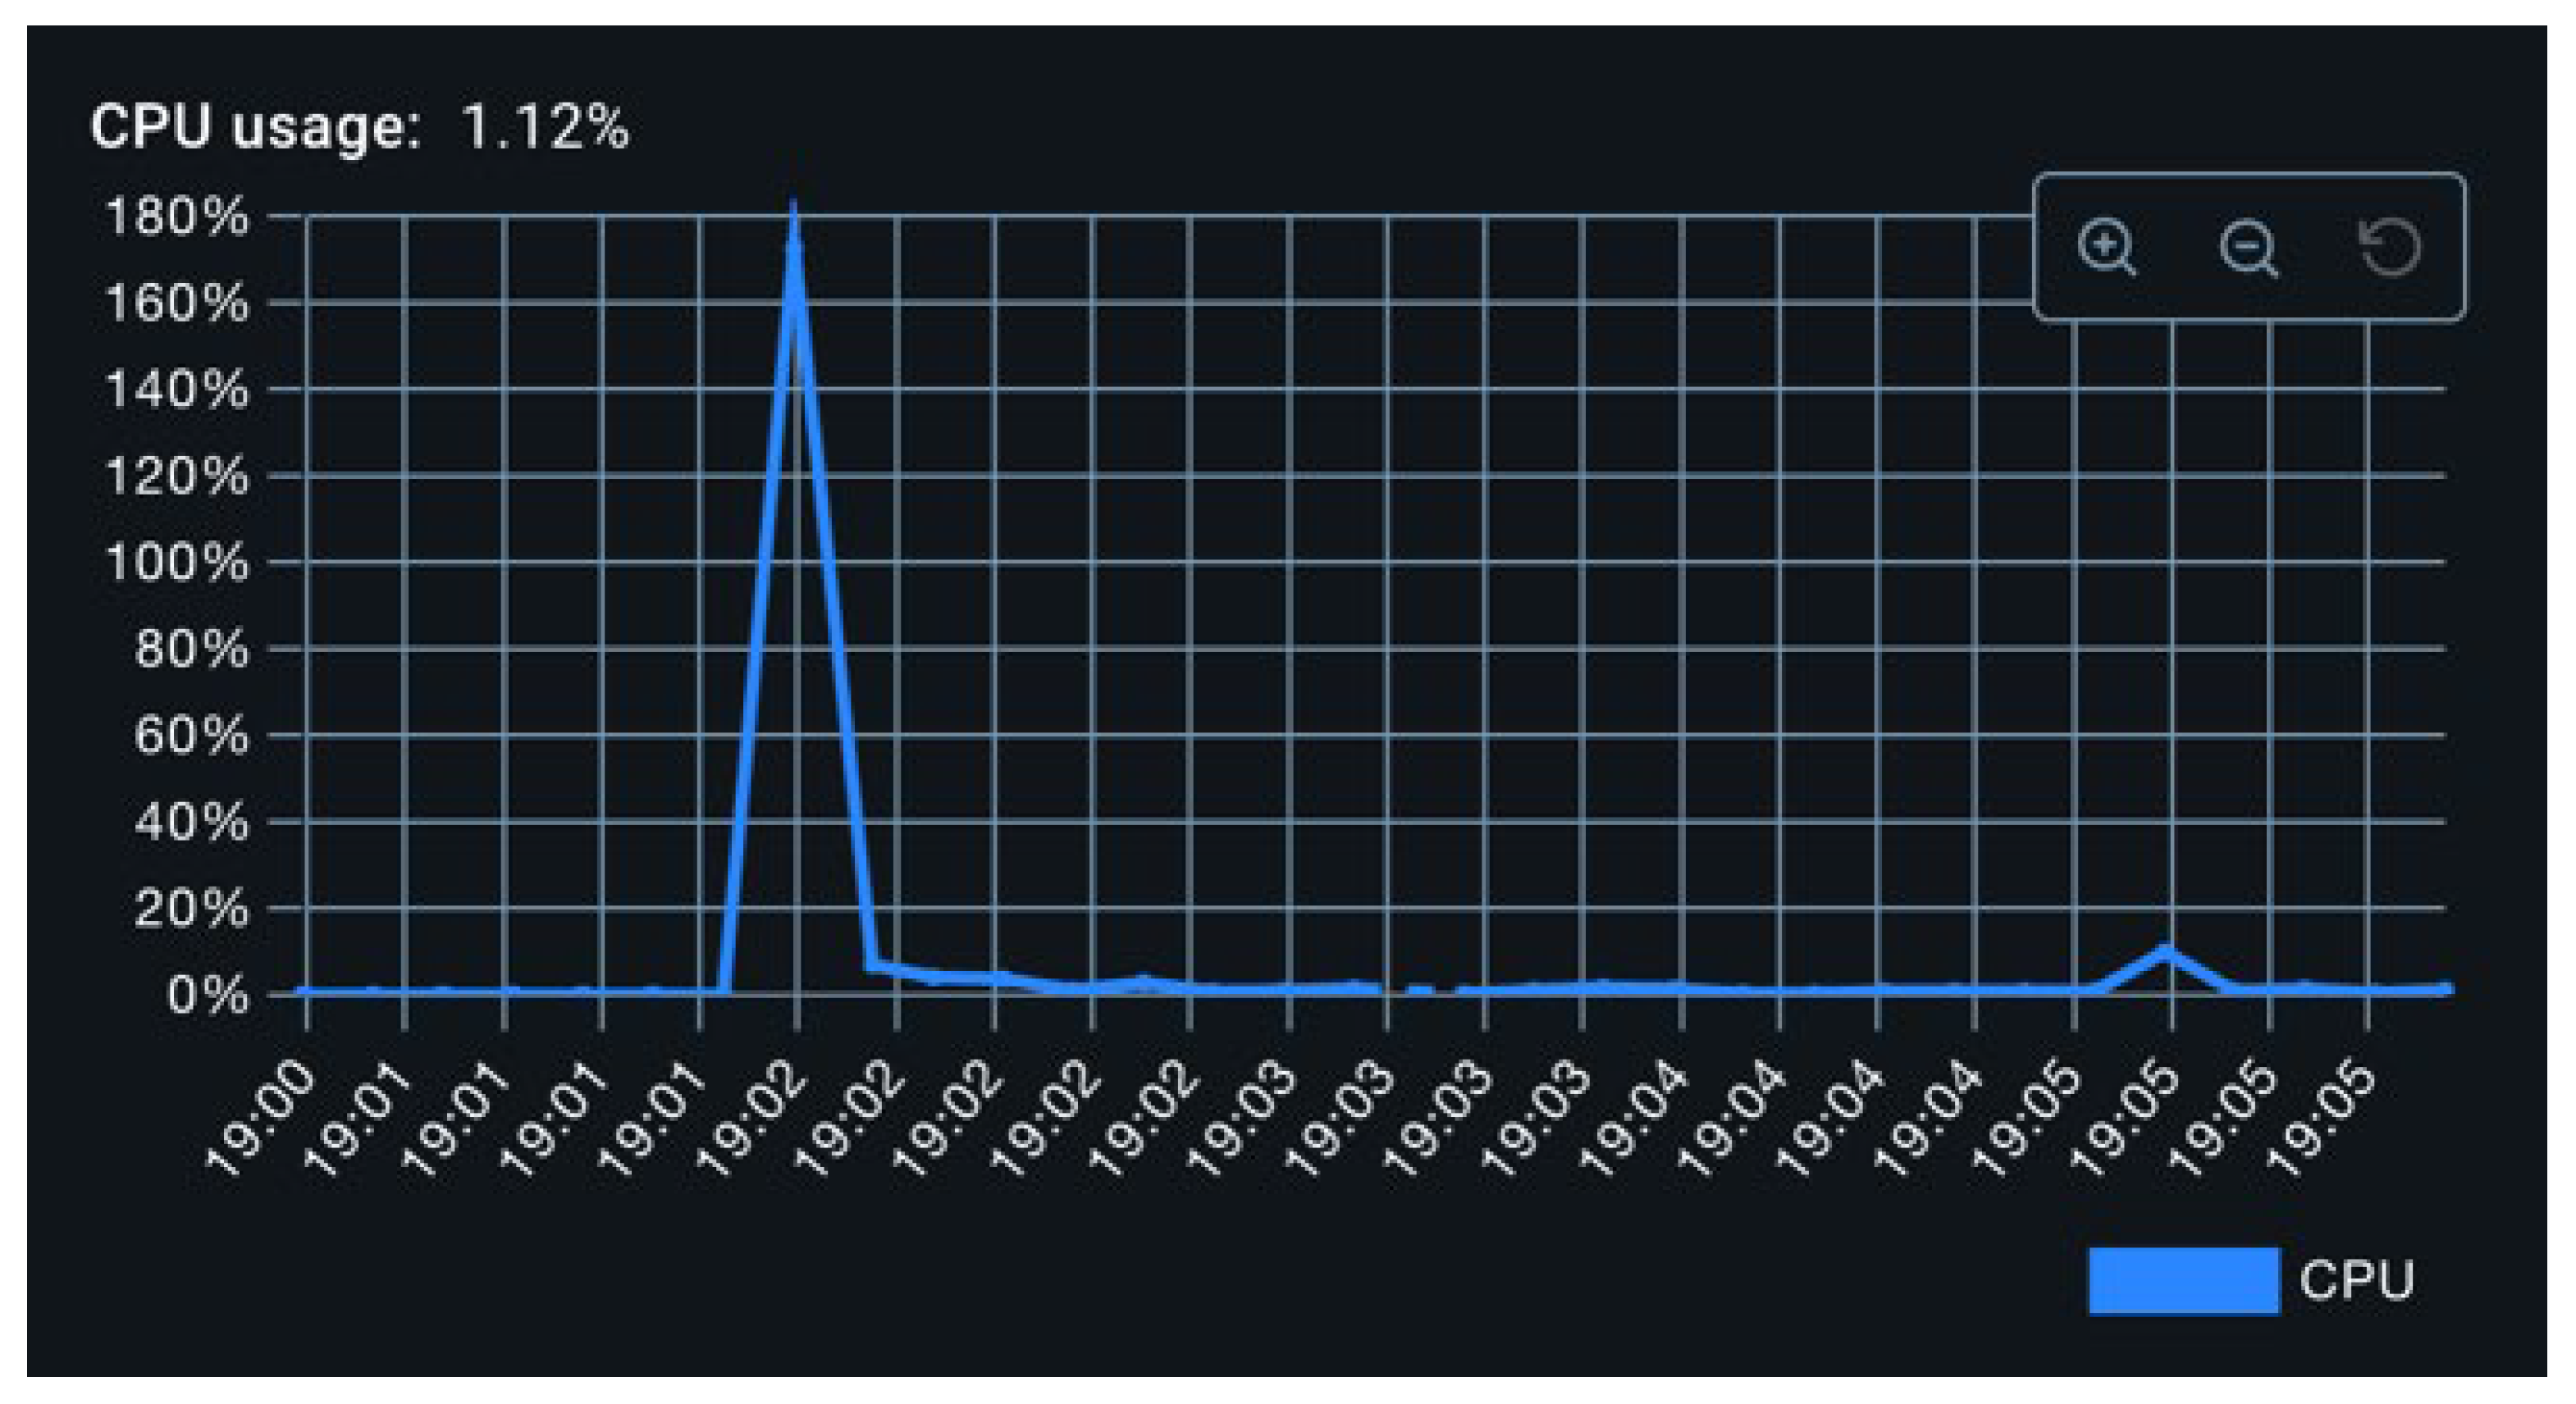
Figure 7.
Baseline Memory Measurements.
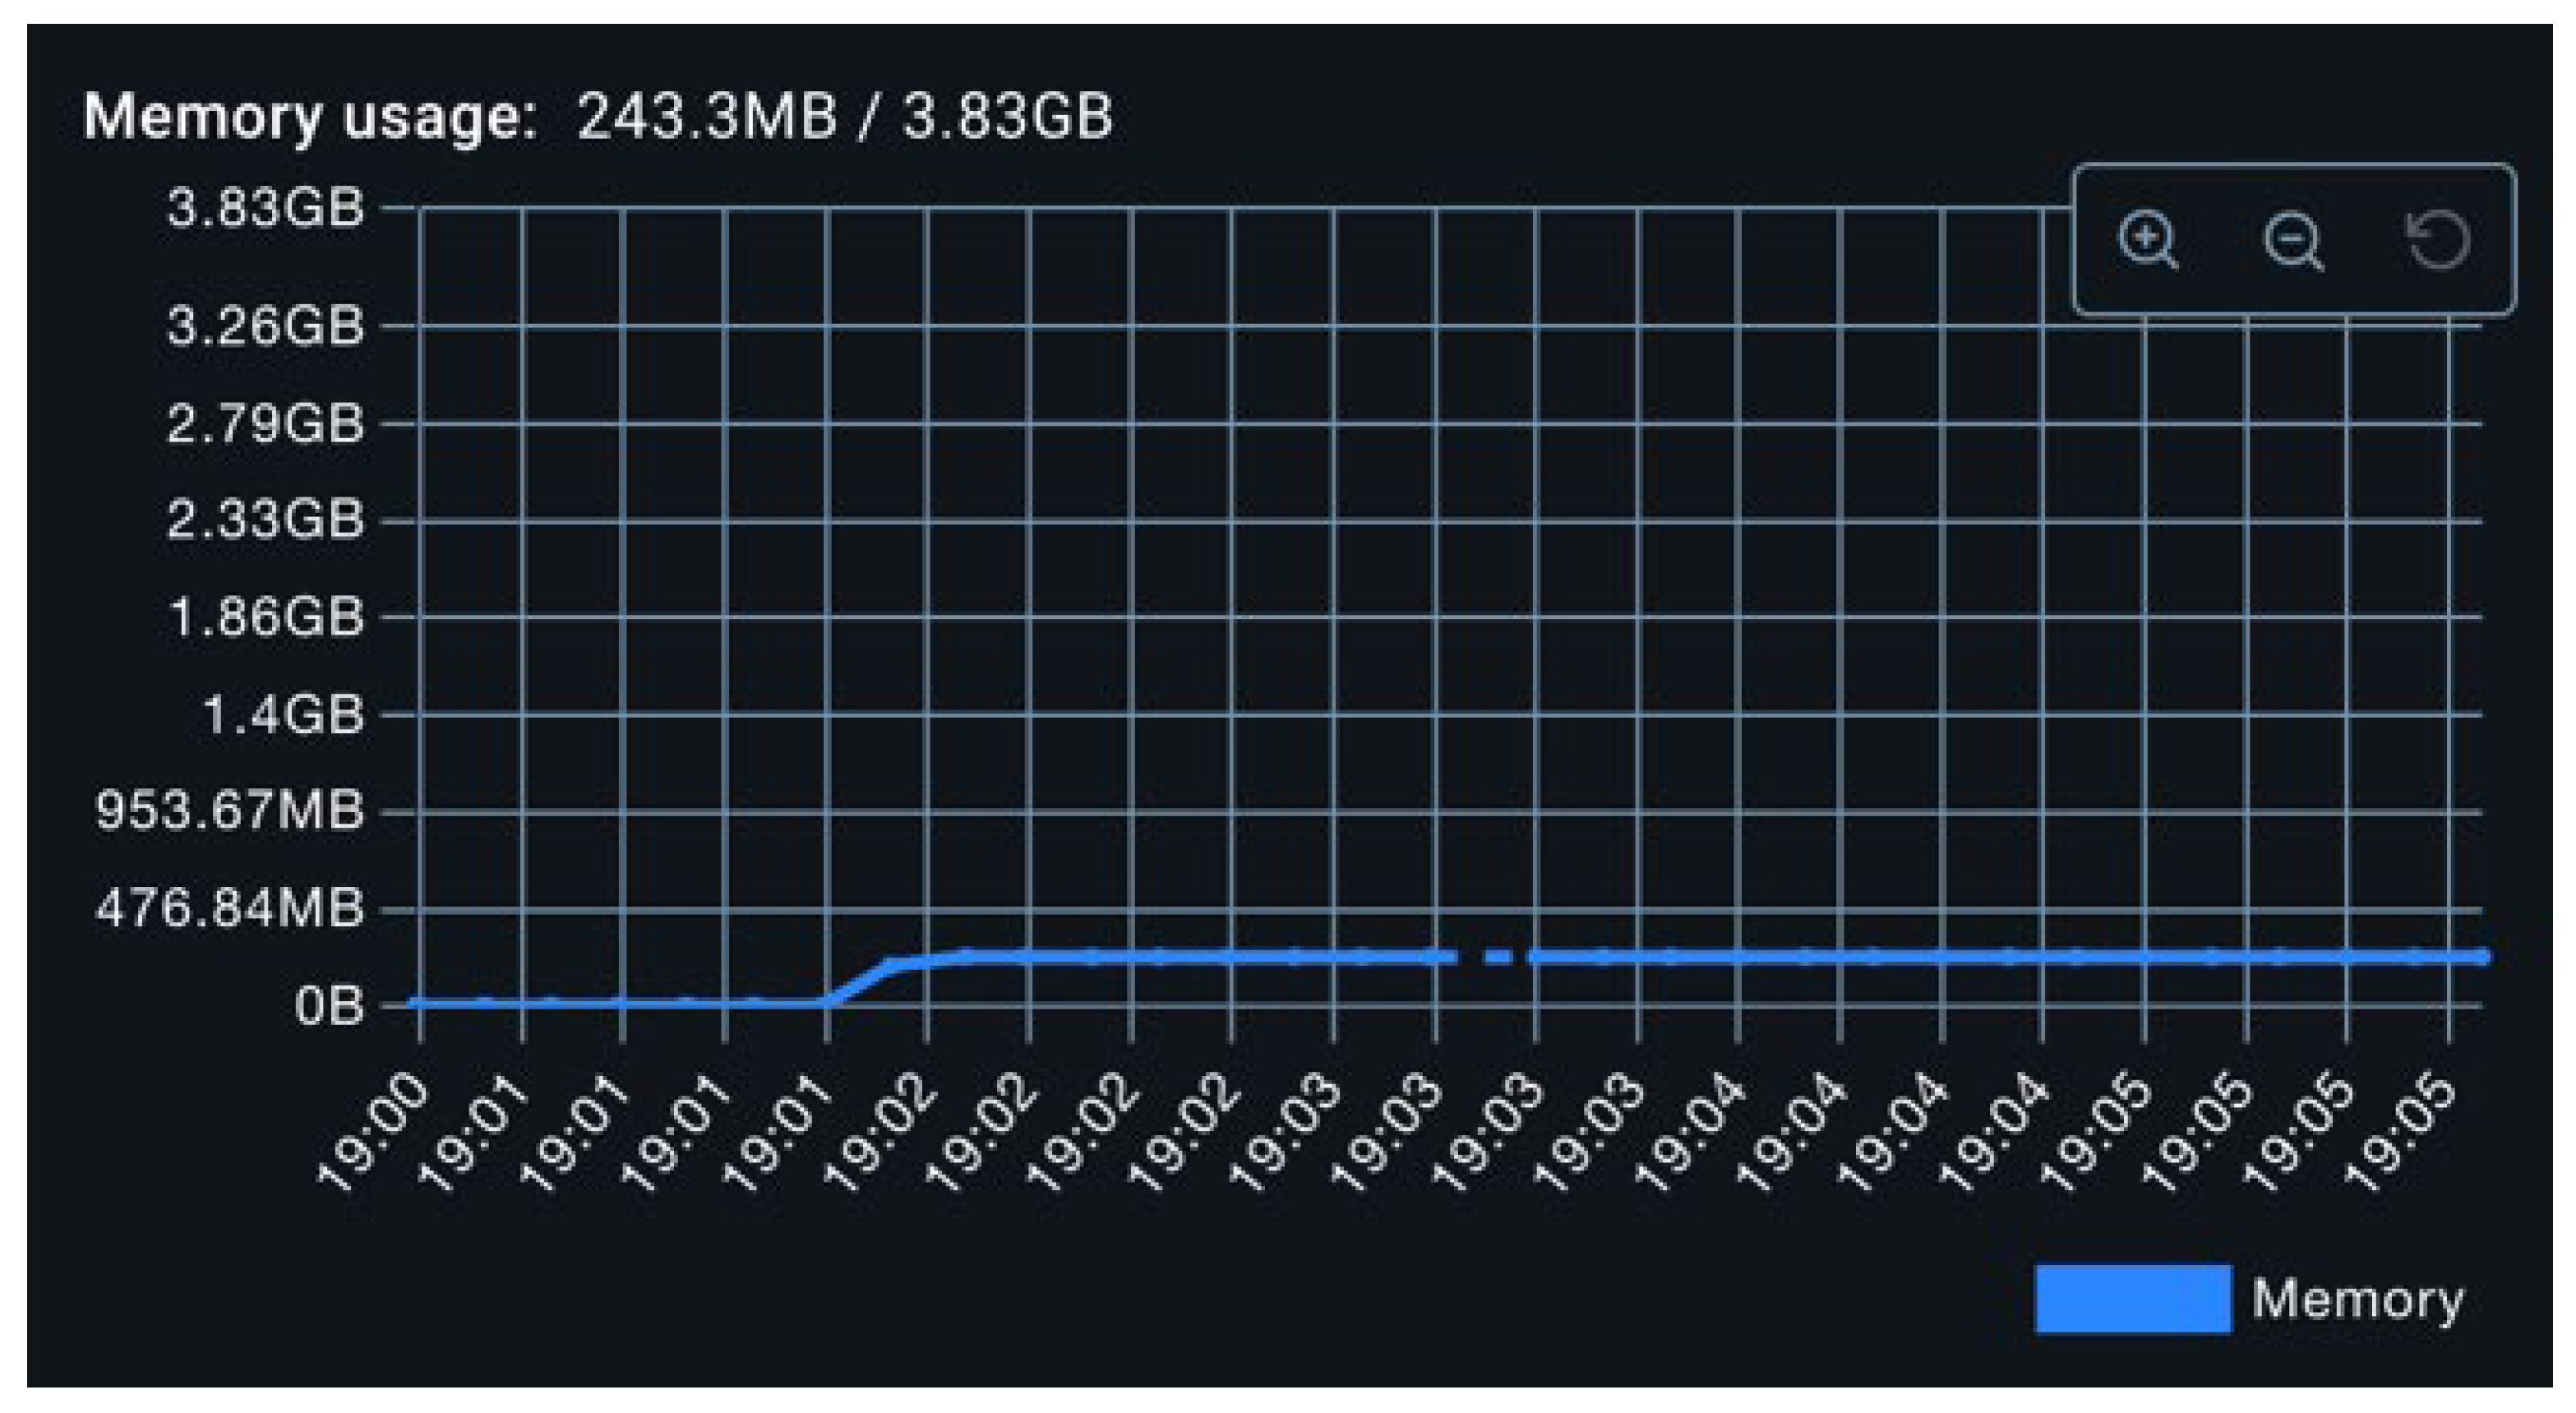
Figure 8.
CPU Metrics for Slow Operations.
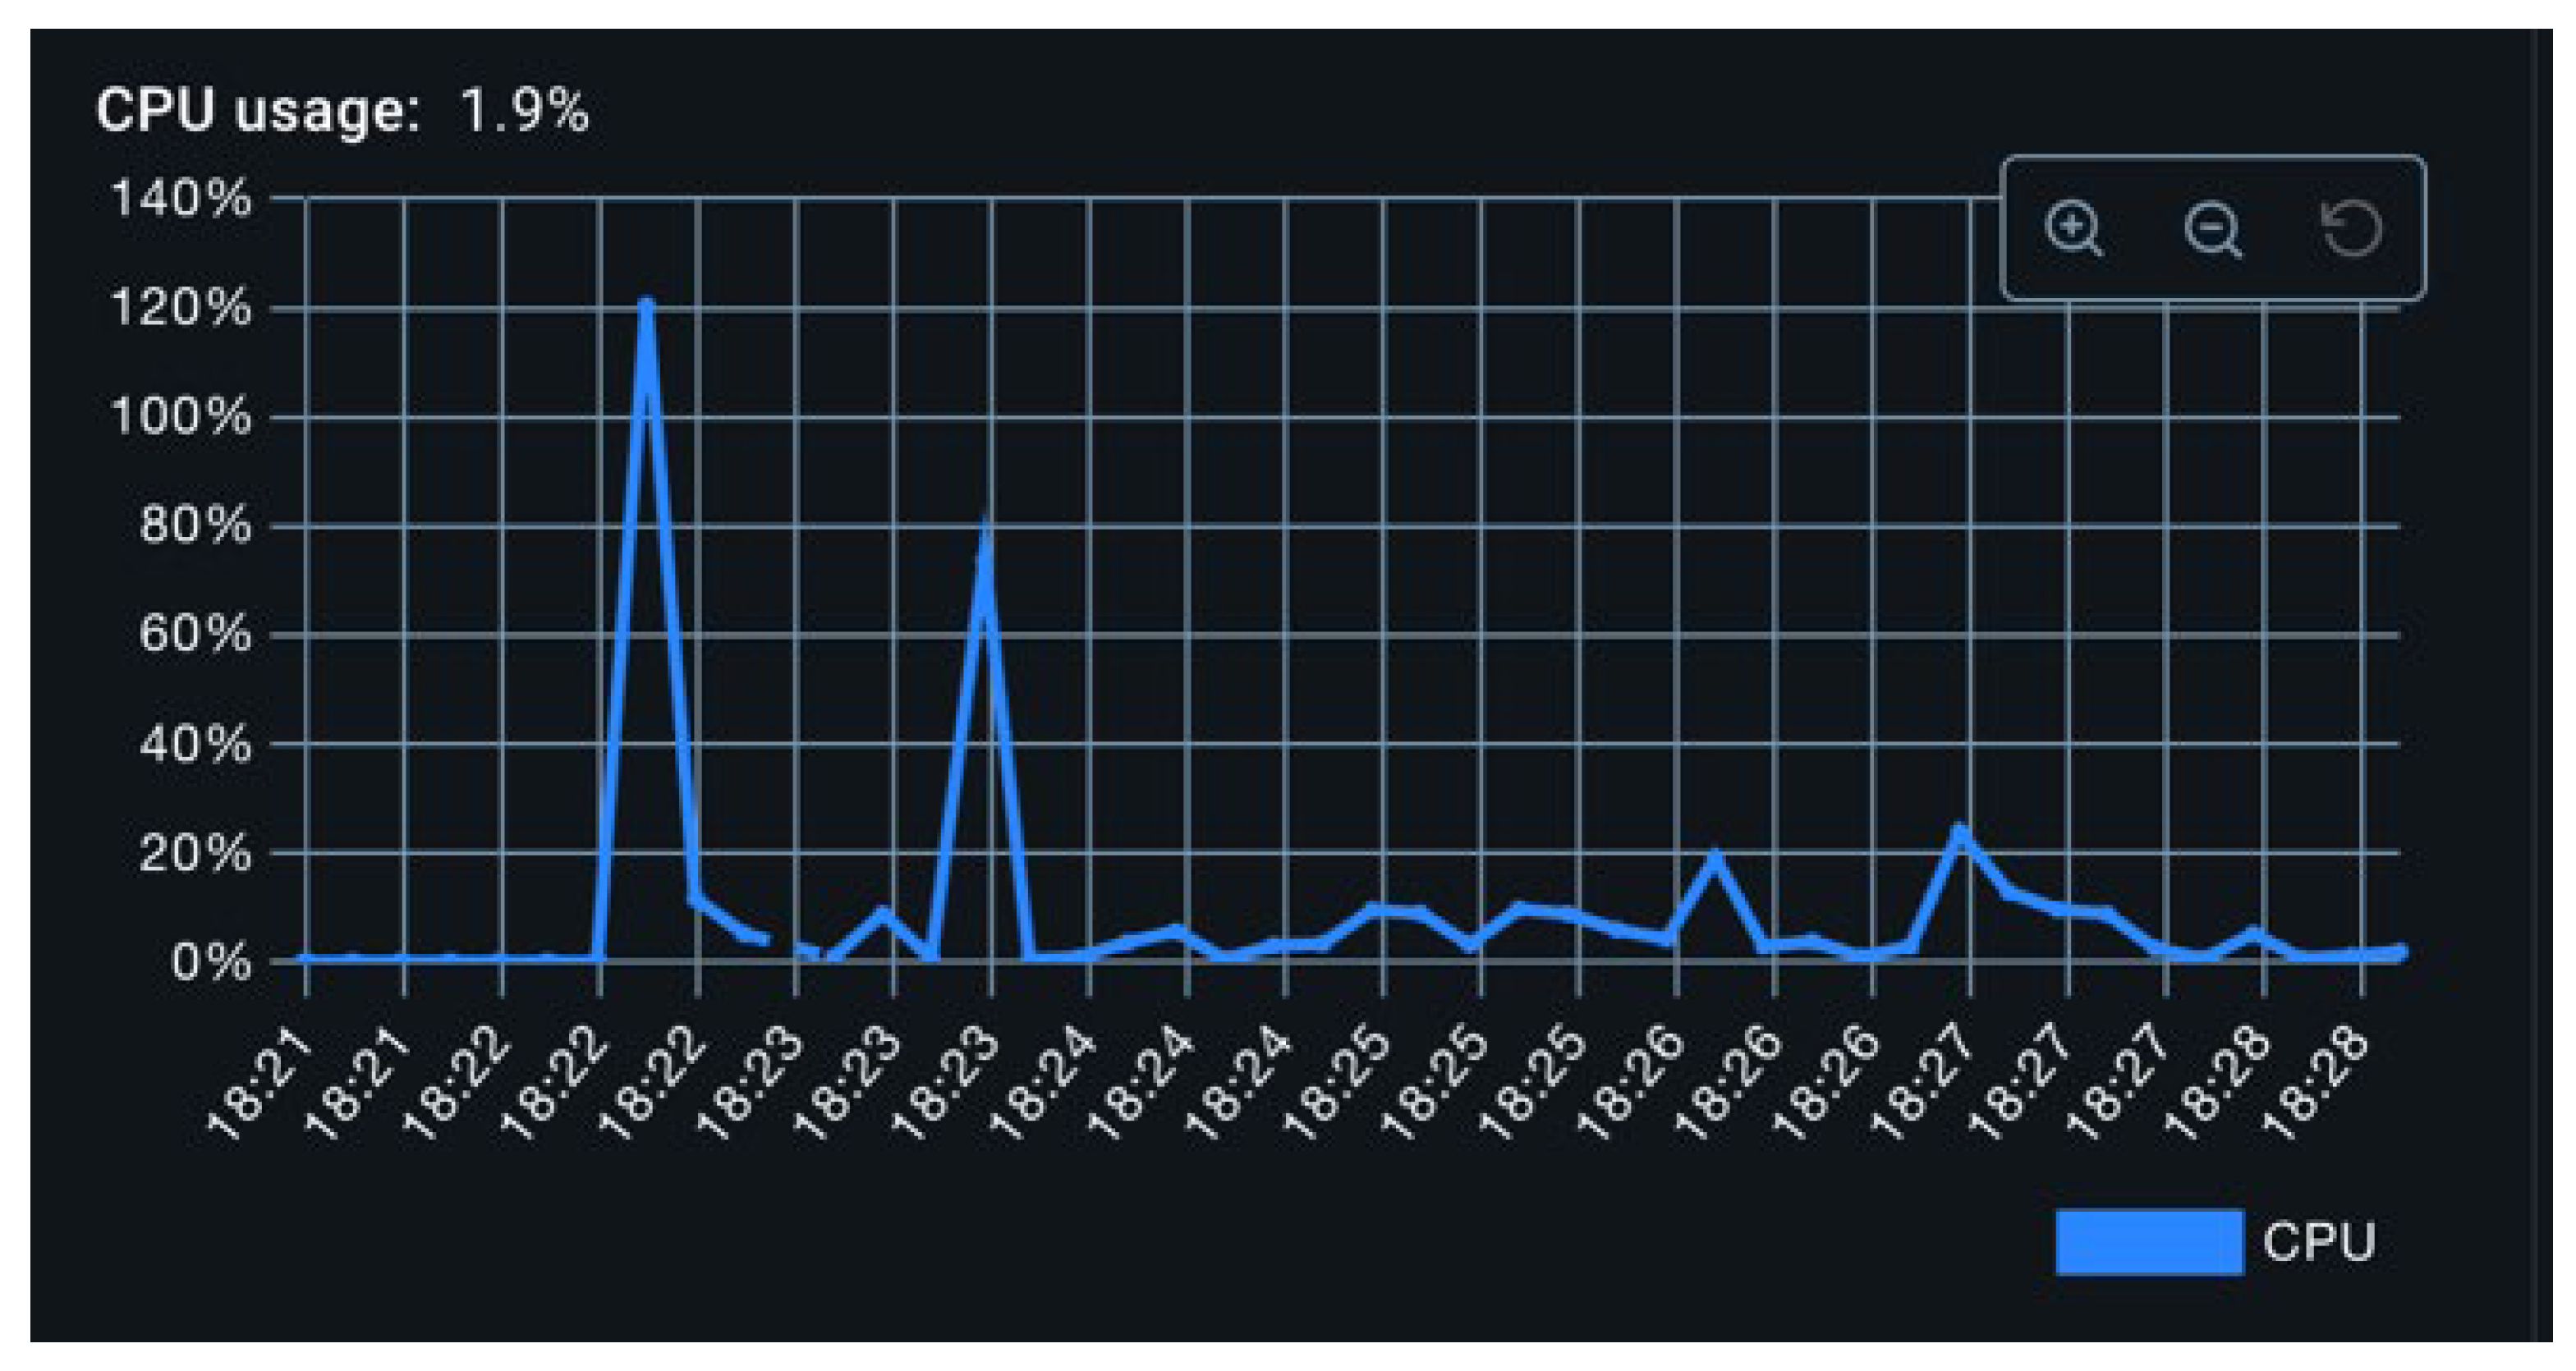
Figure 9.
Memory Metrics for Slow Operations.
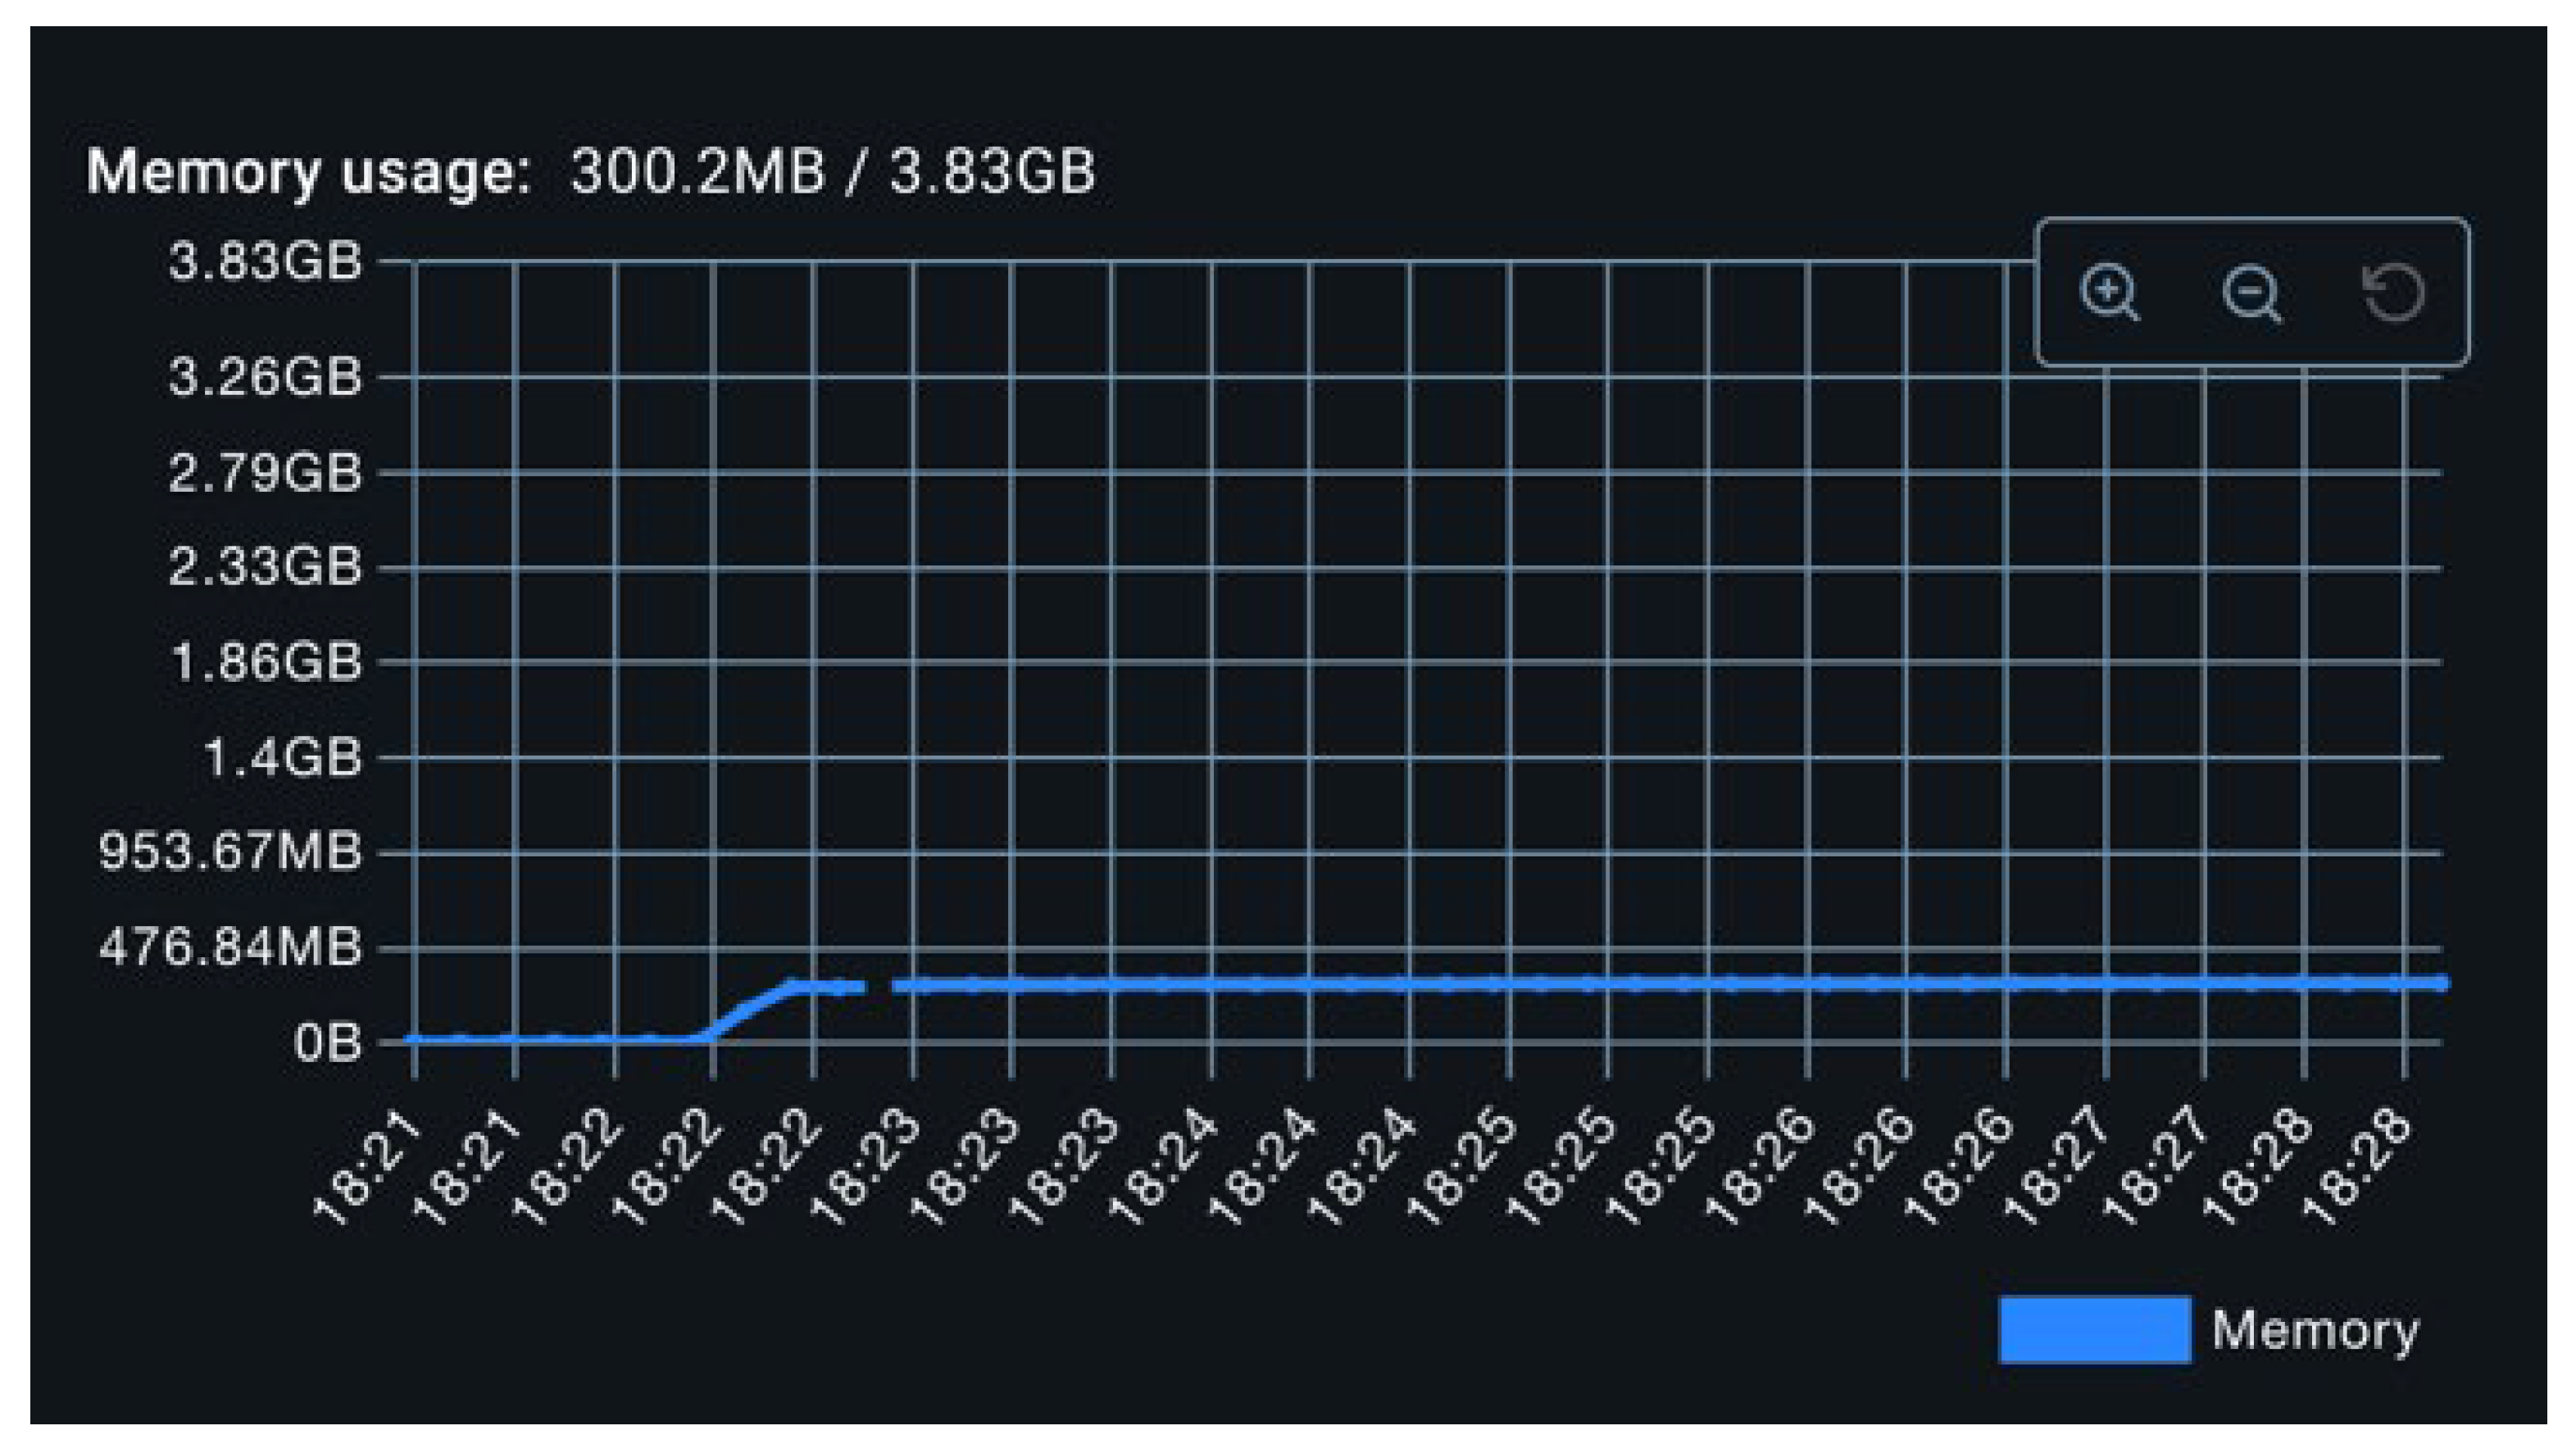
Figure 10.
CPU Metrics for Fast Operations.
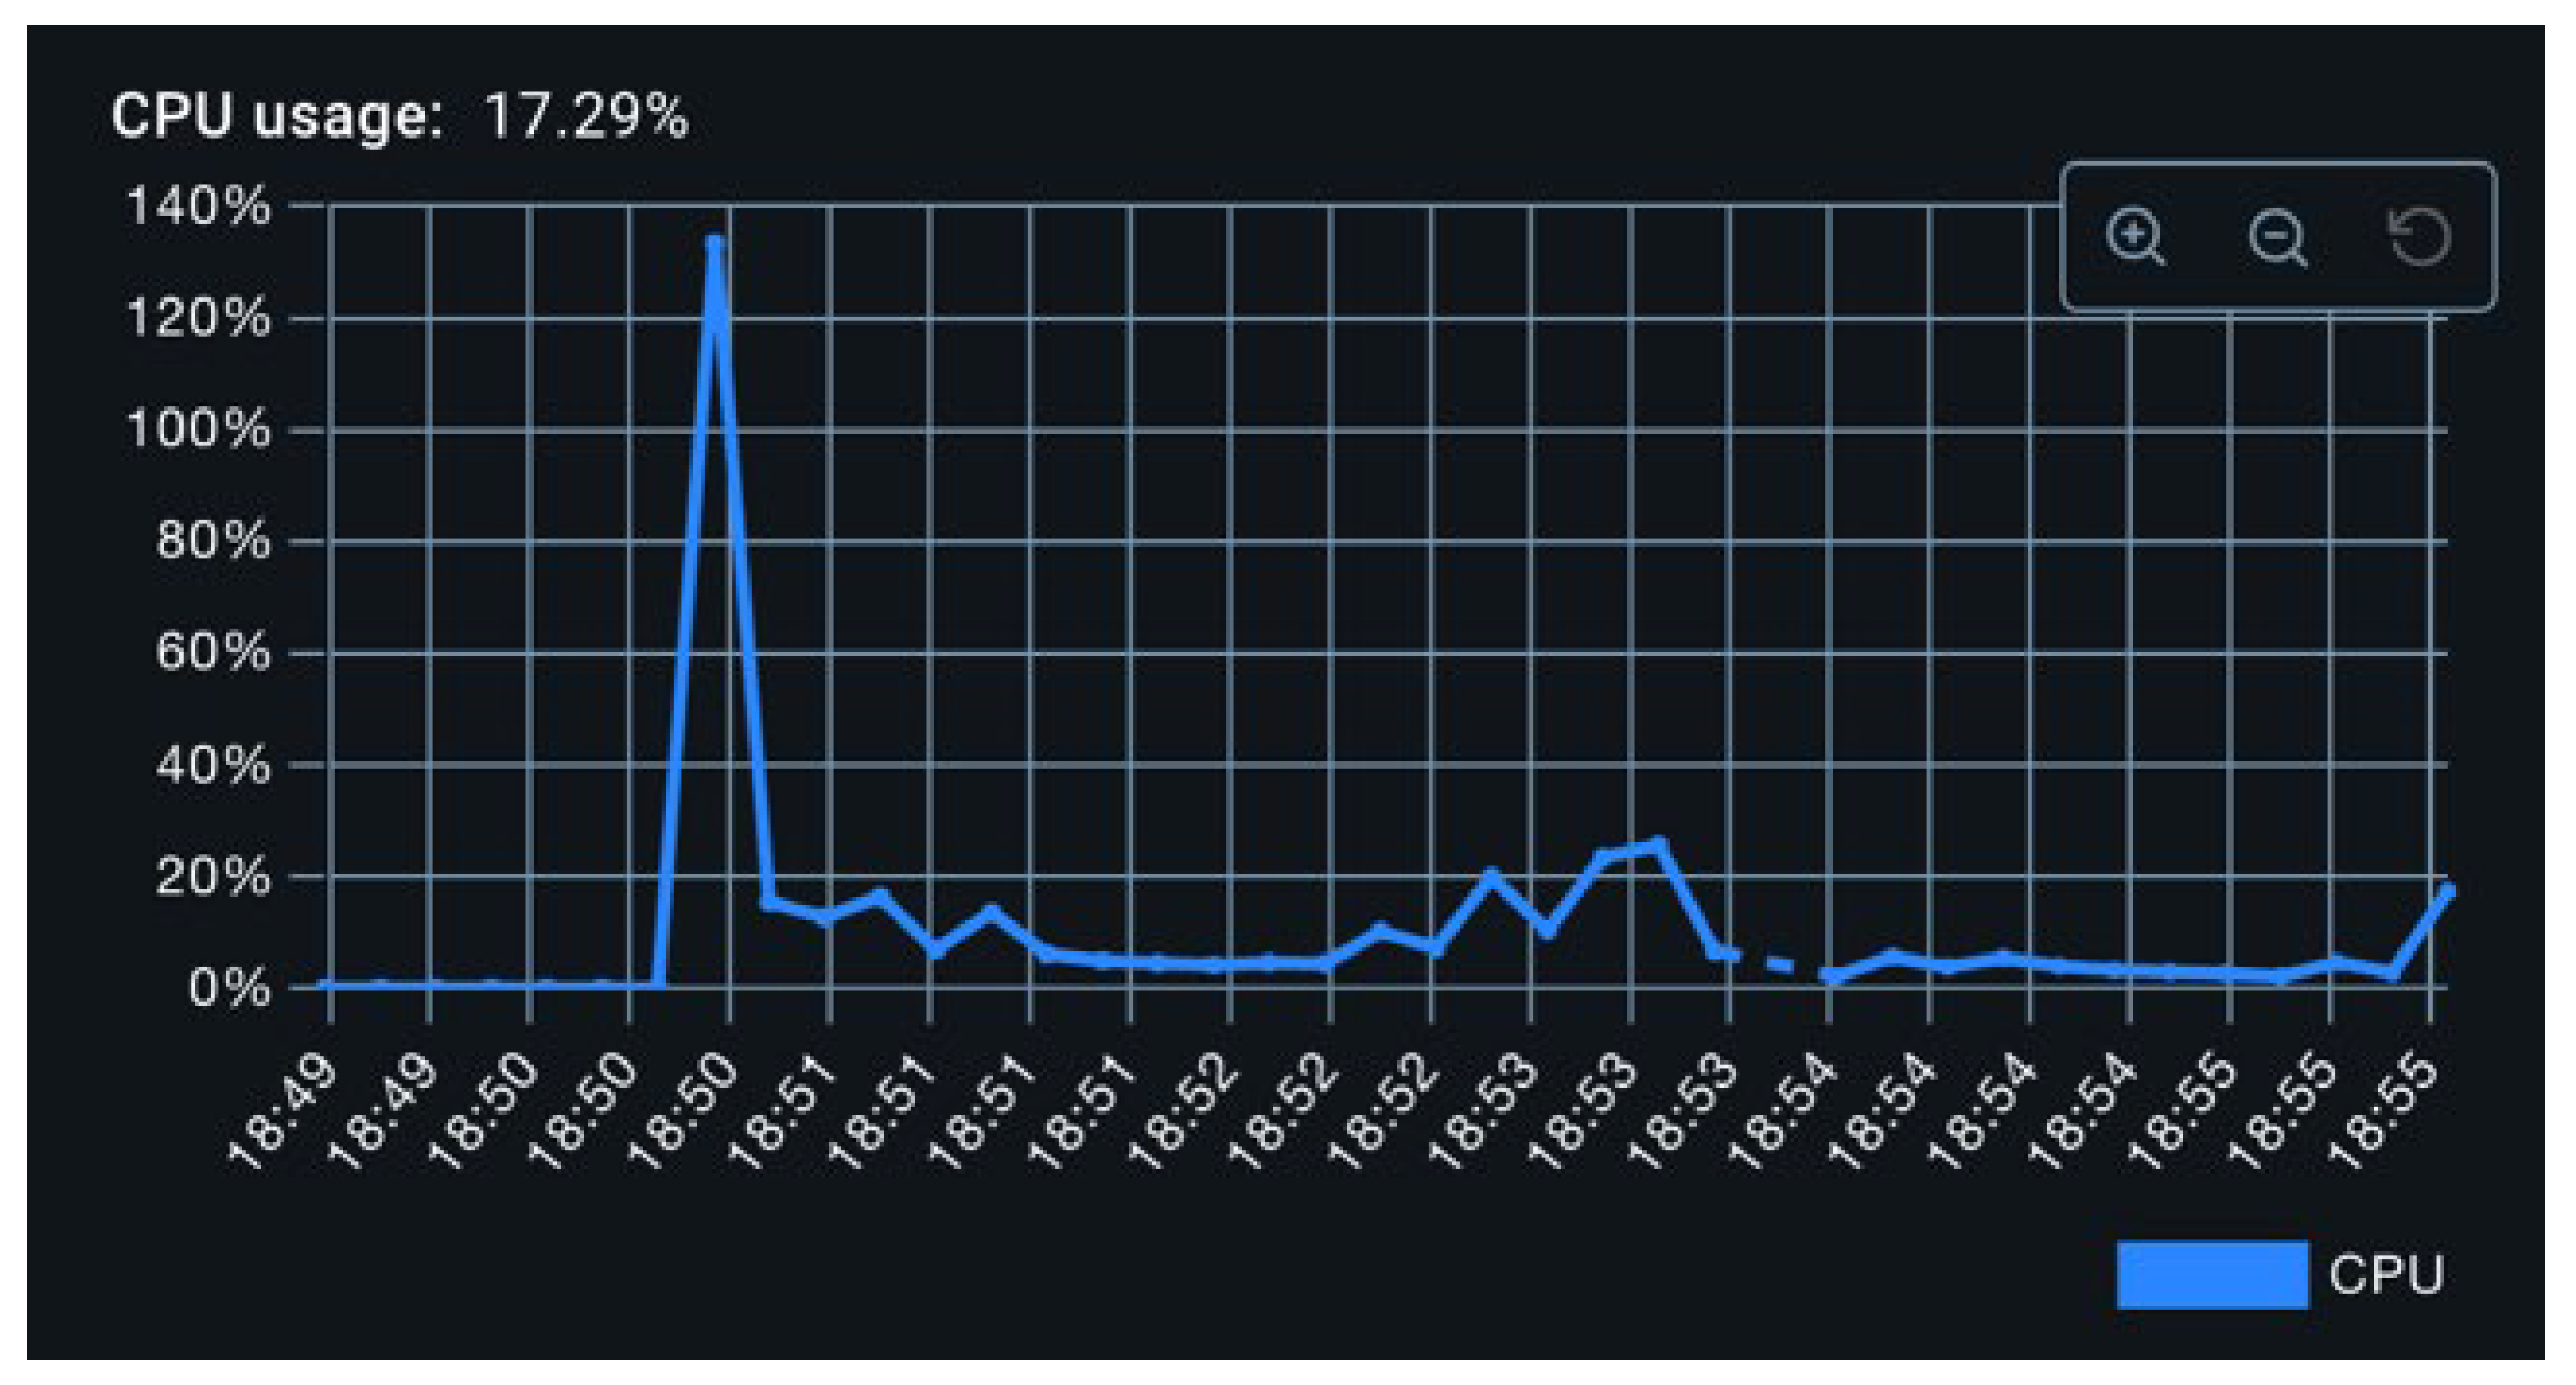
Figure 11.
Memory Metrics for Fast Operations.
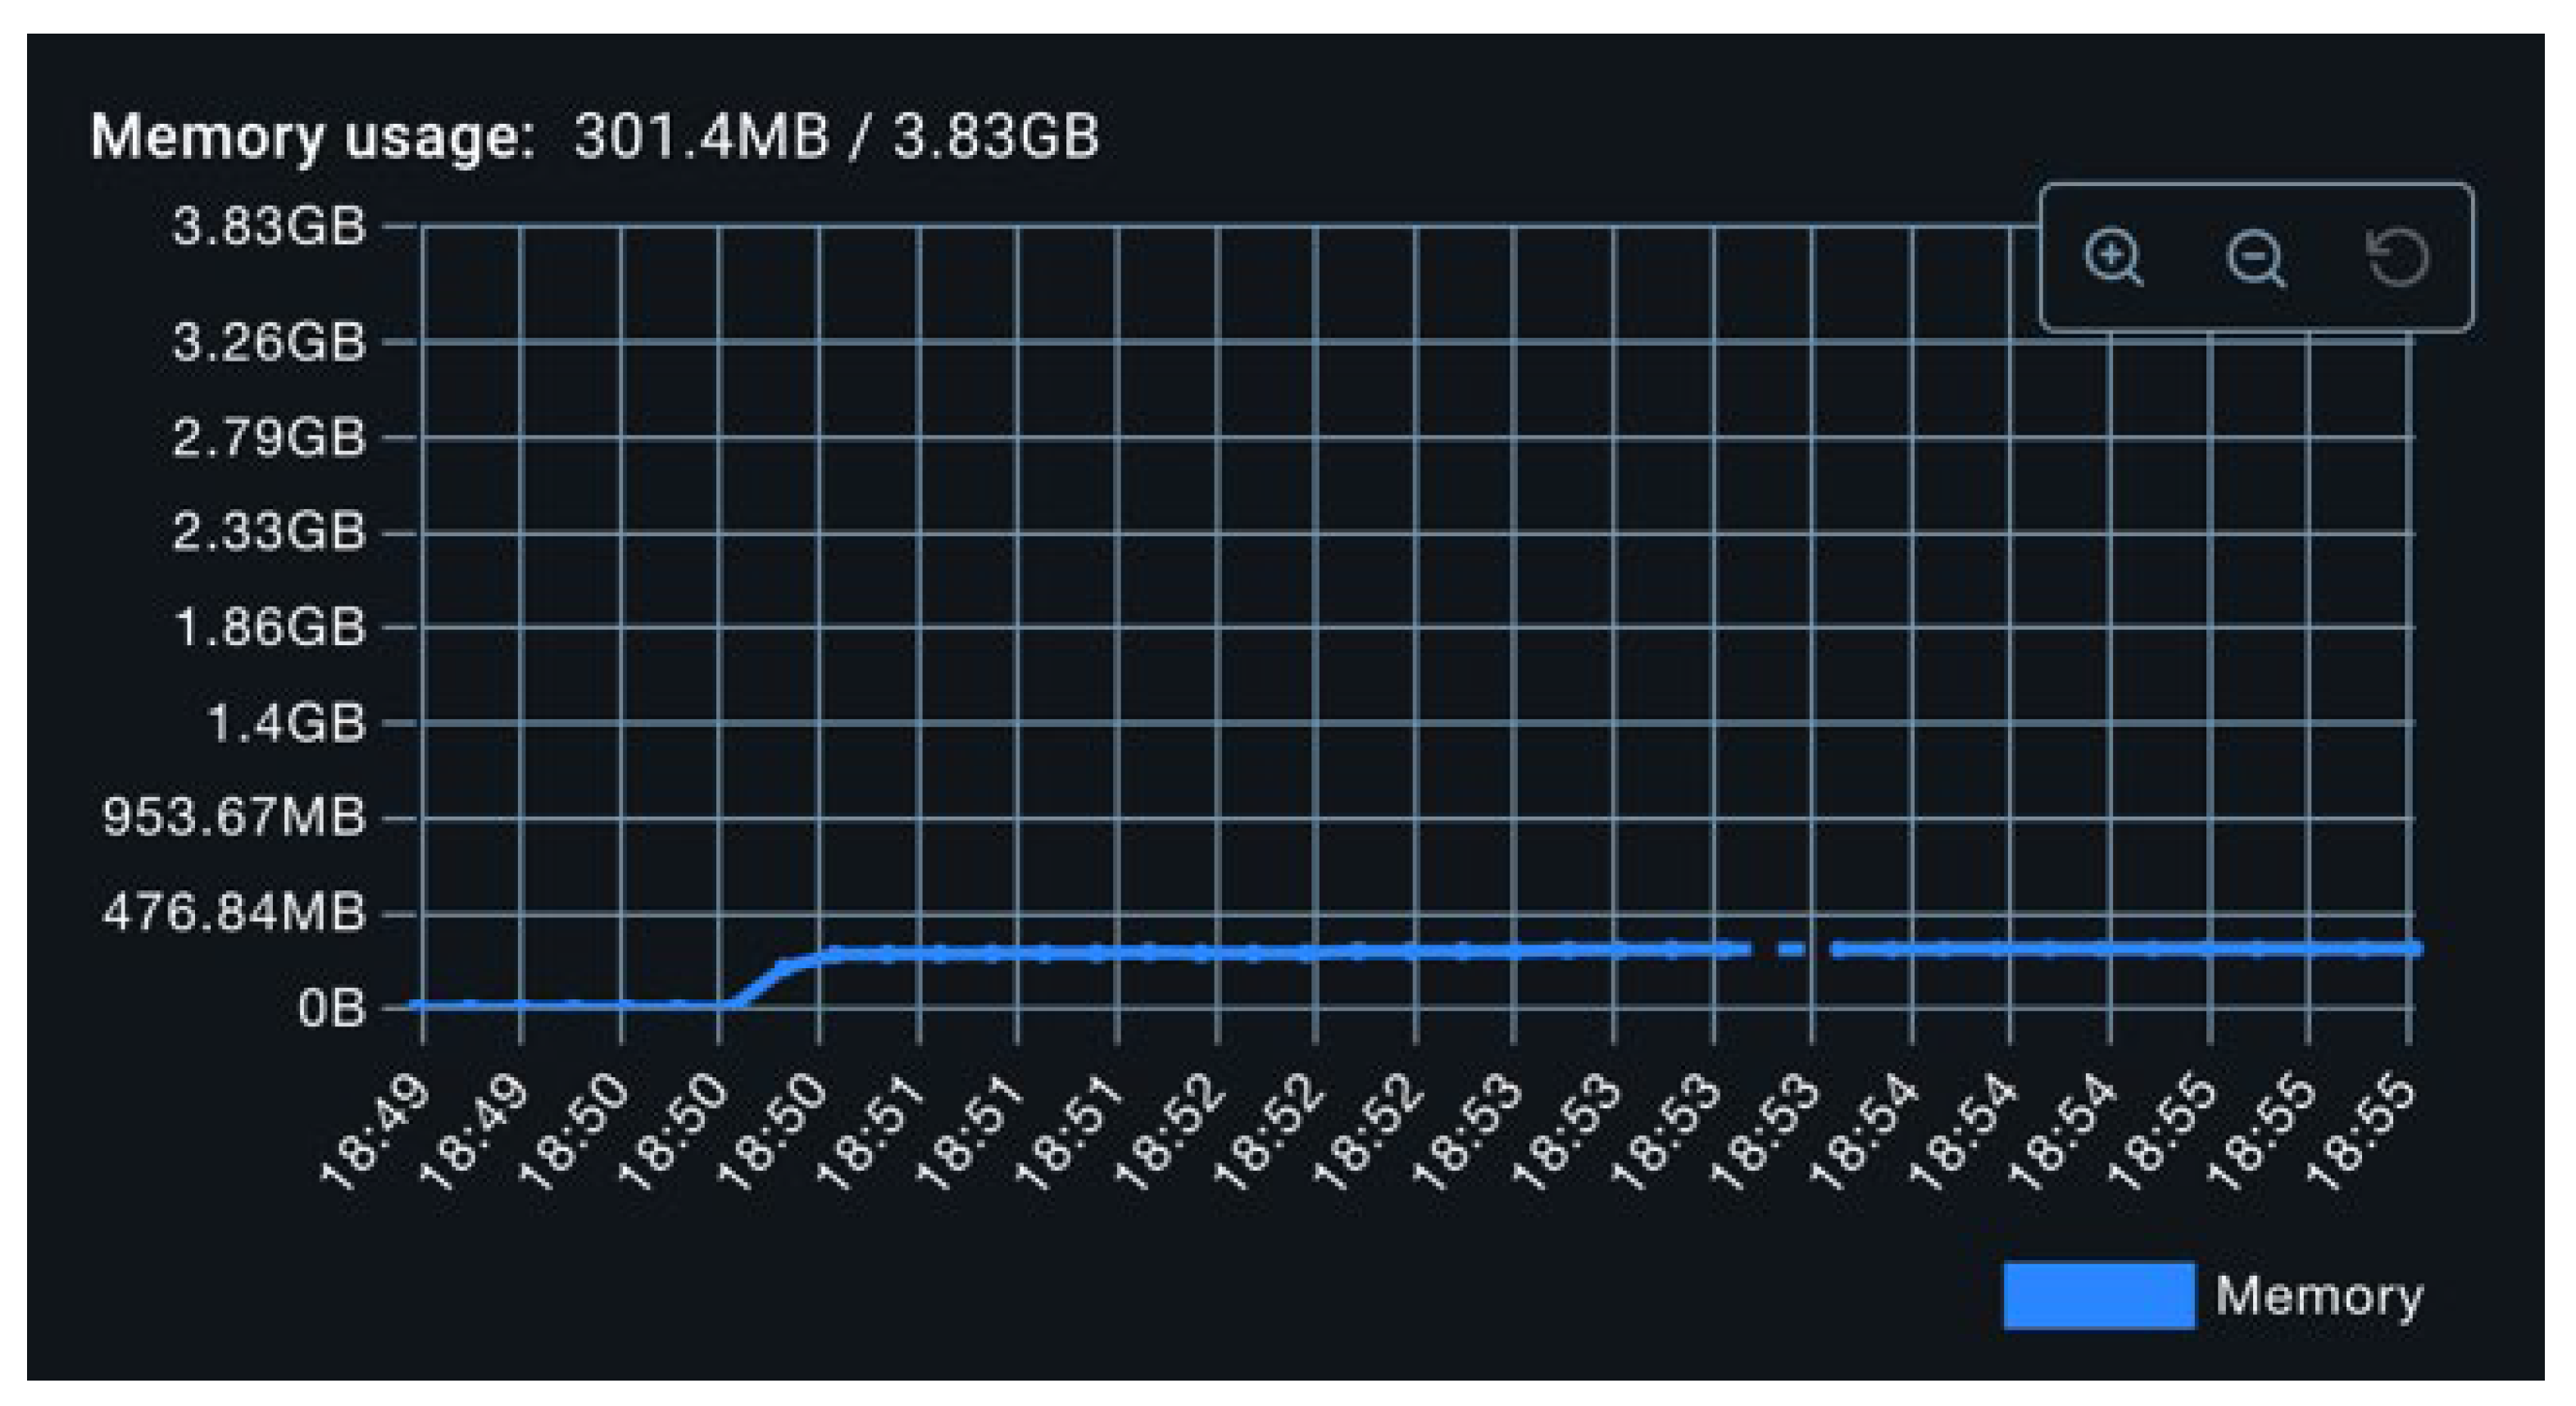

Table 1.
Table definition with required columns.
| db.metrics.table | ||
| Operation_name | text | Not null |
| Execution_ns | numeric | Not null |
| instance | text | Not null |
| [additional columns] | [column type] | [constraints] |
Table 2.
CPU Consumption for Exporters.
| 400 ms | 40 ms | |
| Logger | 1,5% | 3% |
| Kafka | 0,6% | 4,4% |
| Prometheus | 0,65% | 1,1% |
| RabbitMQ | 0,9% | 1,4% |
| SQL | 1,5% | 2,8% |
| Cassandra | 0,7% | 3,3% |
Disclaimer/Publisher’s Note: The statements, opinions and data contained in all publications are solely those of the individual author(s) and contributor(s) and not of MDPI and/or the editor(s). MDPI and/or the editor(s) disclaim responsibility for any injury to people or property resulting from any ideas, methods, instructions or products referred to in the content. |
© 2025 by the authors. Licensee MDPI, Basel, Switzerland. This article is an open access article distributed under the terms and conditions of the Creative Commons Attribution (CC BY) license (https://creativecommons.org/licenses/by/4.0/).
Copyright: This open access article is published under a Creative Commons CC BY 4.0 license, which permit the free download, distribution, and reuse, provided that the author and preprint are cited in any reuse.


