
Submitted:
06 November 2025
Posted:
10 November 2025
You are already at the latest version
Abstract
The optimization of BiVO4-based structures significantly contributes to the development of a global system towards clean, renewable, and sustainable energies. Enhanced photocatalytic performance has been reported for numerous doped BiVO4 materials. Bi3+-based compounds can be easily doped with rare earth (RE3+) ions due to their equal valence and similar ionic radius. This means that RE3+ ions could be regarded as active co-catalysts and dopants to enhance the photocatalytic activity of BiVO4. In this study, a simple microwave-assisted approach was used for preparing nanostructured Bi1-xEuxVO4 (x = 0, 0.03, 0.06, 0.09, and 0.12) samples. The materials are characterized by X-ray diffraction (XRD), transmission electron microscopy (TEM), ultraviolet-visible-near infrared diffuse reflectance spectroscopy (UV-Vis-NIR DRS), photoluminescence spectroscopy (PL), and micro-Raman techniques. Effects of the different Eu3+ ion concentrations incorporated into the BiVO4 matrix on the formation of the monoclinic scheelite or tetragonal zircon-type BiVO4 structure, on the photoluminescent intensity, on the decay dynamics of europium emission, and photocatalytic efficiency in degradation of Rhodamine B, were studied in detail.
Keywords:
microwave-assisted synthesis
; BiVO4
; Eu3+-doping
; tetragonal structure
; monoclinic structure
; degradation of Rhodamine B
; luminescence
; micro-Raman
; decay dynamics
; photocatalytic properties
1. Introduction
Recent advances in modern technology indicate an intense acceleration in the pace of nanomaterials` progression. In their ongoing effort to expand the boundaries of what is now possible, the scientists are increasingly focusing on developing valuable semiconducting nanomaterials [1,2]. One of the finest bismuth-based semiconducting materials is bismuth vanadate (BiVO4) due to its non-toxic nature, distinct physical and chemical properties, and a good response to visible-light excitation [3,4,5,6,7]. Additionally, various morphologies of BiVO4 have been developed, exhibiting excellent visible-light photocatalytic efficiency in degrading wastewater contaminants [4,5,6,7]. However, the limited separation (higher recombination rate) and transport capabilities of photogenerated electron–hole pairs severely restrict the commercial-scale application of BiVO4. Overcoming these limitations through surface modification, morphology control, or doping elements can enhance the photocatalytic performance of this valuable nanomaterial [8,9,10].
The rare earth ions are crucial in several applications in nanotechnology [11] and photonics, for instance as a luminescent thermometer [12,13,14], or as a bioimaging contrast agent [15,16]. Doping rare earth metals into Bi-based photocatalysts has been demonstrated to effectively enhance their photocatalytic activity [10]. In fact, the lanthanide elements with their partially filled 4f electronic orbits can participate in the electronic structure, effectively capturing photogenerated electrons (e̶) or holes (h+), further blocking carrier recombination. Additionally, rare earth ions possess remarkable upconversion properties, enabling the transformation of near-infrared light into visible light [17]. In the case of BiVO4, several studies have reported substituting Bi3+ with Nd [13,18], Gd [19,20], or co-doping with trivalent lanthanide ions as Yb/Tm [21], Nd/Er [22], Yb/Er [12], Er/Tm/Yb [23,24], or Tm/Er, Yb, Y [25]. Rare earth doping, such as Eu³⁺ ions in BiVO₄, has emerged as a promising strategy to enhance the photocatalytic performance of this material [26]. Using the hydrothermal approach, Zhang et al. produced Eu-doped BiVO4 with a maximum Eu-doping concentration of 7.30 wt%, resulting in the maximum degradation of methyl orange (MO) [27]. Additionally, Shan et al. confirmed that Eu-doped BiVO4 showed higher photocatalytic performance in degrading Rhodamine B (RhB) and methylene blue (MB) compared to bare BiVO4 [28]. On the other hand, BiVO4 co-doped with Eu/B [29] and KCl [30] exhibited synergistic effects, attributed to an increased surface area and enhanced separation efficiency of photo-generated charge carriers. Some tri-modified BiVO4 photocatalysts (co-doped with Ag, B, and Eu) have also shown enhanced catalytic performance in degrading methyl orange (MO) and tetracycline (TC) [31]. Importantly, such improved semiconducting materials exhibit noticeable phase modification, as demonstrated by Dhakal et al. In the case of Yb³⁺/Tm³⁺ co-doped BiVO₄, studies have shown that doping promotes a high proportion of the tetragonal phase (approximately 80%), resulting in a marked enhancement of photocatalytic efficiency compared to undoped monoclinic scheelite (ms-) BiVO₄ [32].
The hydrothermal method is widely employed for synthesizing rare-earth-doped Bi-based photocatalysts, and the microwave-assisted synthesis of these nanomaterials has been reported only in a limited number of studies [24,32,33]. There are several advantages in the use of microwave-assisted synthesis. Microwave irradiation plays a crucial role by accelerating reaction kinetics, enabling rapid initial heating, and ultimately increasing reaction rates. This approach yields cleaner products, promotes faster consumption of starting materials, and enhances overall yield [34,35]. Furthermore, uniform heating and better control over process parameters contribute to greater reproducibility of reaction conditions and constitute another pro of this technique [36,37]. However, in the synthesis of nanomaterials, the microwave heating method is a novel and poorly penetrating synthesis technique, whose advancement should be pursued as the use of greener reaction media significantly reduces chemical waste and reaction time [38,39].
In this study, we employed a simple microwave-assisted approach to prepare nanostructured Bi1-xEuxVO4 (x = 0, 0.03, 0.06, 0.09, and 0.12) samples. The combined effects of nanostructure and Eu3+ ions doping enhance luminescent and photocatalytic performance. This approach not only optimizes the photocatalytic activity in degradation of RhB and deepen the understanding of the role of Eu3+ doping in improving the optical properties, but also induces the formation of both monoclinic scheelite and/or tetragonal zircon (tz) type of BiVO4 structure. Both obtained structures are of great importance in terms of their photocatalytic performances and applications for the degradation of organic contaminants [4,5].
2. Results
2.1. Structural and Morphological Properties of the Bi1-xEuxVO4 (x = 0, 0.03, 0.06, 0.09 and 0.12) Samples
2.1.1. X-Ray Diffraction (XRD) Analysis
The powder samples were yellow; their crystalline structures were identified by XRD analysis. The XRD patterns together with card references (JCPDS Card No. 01-074-4894) for ms-BiVO4 and (JCPDS Card No. 00-014-0133) for tz-BiVO4 are presented in Figure 1.
The XRD pattern of undoped BiVO4 (Bi1-xEuxVO4 (x = 0)) synthesized via microwave-assisted synthesis matches well with that of standard bulk monoclinic clinobisvanite crystalline system, (space group: I2/b; a = 5.1935, b = 5.0898, c = 11.6972 Å and β=90.3871◦). The peaks at approximately 2θ=18.9°, 29.1°, 30.5°, 35.2°, and 39.7° are assigned to the (011), (112), (004), (020), and (211) crystal planes, respectively, confirming the high crystallinity of the microwave-prepared ms-BiVO4 powder.
In the case of Eu3+-doped BiVO4 samples, Bi1-xEuxVO4 (x = 0.03, 0.06, 0.09, and 0.12), the XRD patterns show the presence of a mixture of monoclinic scheelite, ms-BiVO4, (JCPDS Card No. 01-074-4894), and tetragonal zircon tz-BiVO4 (JCPDS card no. 14–00133) phases. The main peaks at approximately 2θ = 29.1° and 2θ = 24.3° are characteristic peaks of the ms and tz phases, respectively. In addition, the relative intensity of the of the ms-related peak at approximately 29.1° decreases with increasing content of the Eu3+ ions. In contrast, the relative intensity of the tz-related peak at approximately 24.3° increases with increases in content of the Eu3+ ions, so that the tz-type structure becomes dominant in sample Bi1-xEuxVO4 (x = 0.12). This phase transition may be attributed to the stability of lattice constant of BiVO4 when Bi3+ ions (ionic radius = 1.17 Å, coordination VIII) are substituted with Eu3+ ions (ionic radius=1.066 Å, coordination VIII). Literature overview of formation of ms- or tz- crystalline phase in the Bi1-xEuxVO4 samples in comparison with results obtained in this work is given later in Section 3.1.
The crystallite size was determined using Scherrer’s equation (Eq. 1), applied to the most intense peak in the XRD diffraction pattern [40]:
where D is the crystallite size, k represents the shape factor constant with value of 0.9, λ is the wavelength of the X-ray radiation (0.15406 nm), β is the full-width half-maximum (FWHM), and θ is Bragg’s angle of reflection. With reference to the peak of maximum intensity at 2theta diffraction angle of 29.1°, the average crystallite size for microwave-synthesized ms-BiVO4 was found to be 16 nm according to this equation. The crystallite size increases with the Eu³⁺ ion content, reaching up to 55 nm for Bi0.88Eu0.12VO₄, as determined at a 2θ diffraction angle of 24.3°, corresponding to the dominant tz-BiVO₄ phase. The main aim was to obtain an optimized tz-BiVO4 nanostructure, which was presented in recently published papers as a structure exhibiting better photocatalytic performance than ms-BiVO4 with respect to pollutants removal [4,5].
2.1.2. Transmission Electron Microscopy (TEM)
Representative TEM images for BiVO4 and Bi0.88Eu0.12VO4 samples are given in Figure 2a,b, respectively. Both samples consist of well-crystallized irregular spheroidal nanoparticles with a size of approximately 20-50 nm. The particle size assessed using TEM is similar to the crystallite size obtained from XRD measurements, suggesting that each particle comprises a single crystallite.
2.2. Optical Properties of the Bi1-xEuxVO4 (x =0, 0.03, 0.06, 0.09, and 0.12) Samples
2.2.1. Fourier Transform Infrared Spectroscopy (FTIR)
To identify the functional groups in the prepared Bi1-xEuxVO4 (x = 0, 0.03, 0.06, 0.09 and 0.12) samples, the FTIR spectra were measured and presented in Figure 3.
The FTIR analysis of undoped BiVO4 shows the characteristic peaks of BiVO4 in the range of around 500-820 cm−1. A strong absorption band at 609 cm−1 with a shoulder at 816 cm−1 is associated with asymmetric and symmetric stretching vibrations of the VO43− tetrahedron, respectively. Additionally, the peak observed at 510 cm−1 can be assigned to the Bi‒O bond stretching vibrations.
On the other side, the FTIR analysis of Bi1-xEuxVO4 (x = 0.03, 0.06, 0.09, and 0.12) samples shows the same characteristic peaks as undoped BiVO4 in the range of around 500-820 cm−1, while two new peaks appear at 471 cm−1 and 720 cm−1 assigned to Eu-O stretching vibrations. A small peak observed in all samples at 1369 cm-1 can be assigned to nitrates from the nitric acid used during synthesis or from Bi(NO3)3. These results are also in agreement with previously reported literature [41].
2.2.2. Diffuse Reflectance Spectroscopy (DRS)
The diffuse reflectance spectra of Bi1-xEuxVO4 samples presented in Figure 4a are used to estimate energy band gaps through the Tauc`s plot method (Figure 4b). The absorption observed below 350 nm for all studied samples is assigned to the absorption of vanadate groups. An additional weak peak observed at approximately 424 nm in the Bi₁₋ₓEuₓVO₄ samples is attributed to electronic transitions of Eu³⁺ ions. Figure 4b presents the energy dependence of (FKM(R)hν)2 for Bi1-xEuxVO4 samples.
The band gap, Eg, was estimated from the absorption edge wavelength of the inter-band transition according to the following equation:
where FKM(R) is the Kubelka–Munk function, with FKM(R) = (1-R)2/2R, R is the observed reflectance in the UV–vis spectra, n = 2 for a direct allowed transition, and n=1/2 for an indirect allowed transition, A is a proportionality constant, and hν is the photon energy. BiVO4 is a direct gap semiconductor; therefore, n = 2 [42,43]. According to Eq. (2), the Eg values were determined by extrapolating the linear portion of the (FKM(R)hν)2 curve to the intersection with the X-axis. As can be seen in Figure 4b, the optical band gap shifts to higher energy with increasing Eu3+ contents. The Eg values, ranging from approximately 2.55 to 2.80 eV, are in full agreement with recently published results [44].
2.2.3. Optical Absorption
The UV-visible absorption spectra are shown in Figure 5. The samples exhibit an absorption band in the UV and Visible light range with the absorption edge at 470 nm. The absorption is stronger in the ultraviolet (UV) region with an absorption tail extending up to 800 nm. The absorption curves display a sharp decrease in absorbance at the transition region between UV and visible wavelengths, as highlighted by the dashed line in Figure 5. Interestingly, the Eu³⁺-doped samples exhibit a slight reduction in absorption within the visible region (>500 nm) compared to the undoped BiVO₄
2.2.4. Photoluminescence (PL) Emission Measurements Using Continuous-Wave Lasers
The photoluminescence (PL) emission spectra of the undoped and Eu3+ doped BiVO4 samples for the excitation wavelengths of 375 nm and 518 nm are presented in Figures 6a,b, respectively. For Eu3+ doped BiVO4 samples, peaks corresponding to typical europium emission, i.e., 5D0 → 7FJ (J= 1-4) transitions, are present, with 5D0 → 7F2 transition being the dominant one for both 375 nm and 518 nm excitation wavelengths. The emission spectrum shows a gradual increase in intensity value with the increase of Eu3+ doping. These sharp spectral features of the typical Eu3+ emission plot indicate that the europium ions are uniformly doped in the BiVO4 matrix [45]. For Eu3+ doped BiVO4 samples under both 375 nm and 518 nm excitation, a peak is present at ~595.5 nm (16795 cm-1): it indicates 5D0 → F71 transition corresponding to magnetic dipole (MD) transition. Intense and clearly resolved peaks at 620 nm (16117 cm-1), 616 nm (16217 cm-1) indicate a 5D0 →F72 transition corresponding to an electric dipole (ED) transition. In addition to this, 5D0 → F73,4 transition peaks are also present. Being the samples excited, besides the charge transfers of orbitals O 2p, V 3d, and Bi 6s, the transfer of energy to Eu3+ ions results in the PL emission [46]. The narrow peak at 690 nm (14450 cm-1) for 375 nm excitation is a spurious structure; similarly, the broad emission after 18000 cm-1 is due to the background emission from the cuvette. The f-f transitions in europium involve electron jumps within the shielded 4f subshell of the Eu3+ ion, leading to sharp, characteristic UV-Vis absorption and emission spectra. While f-f transitions are formally "forbidden" by spin and parity selection rules, their intensities can be significantly enhanced by the ligand environment, especially through asymmetry in the coordination sphere [25,47,48].
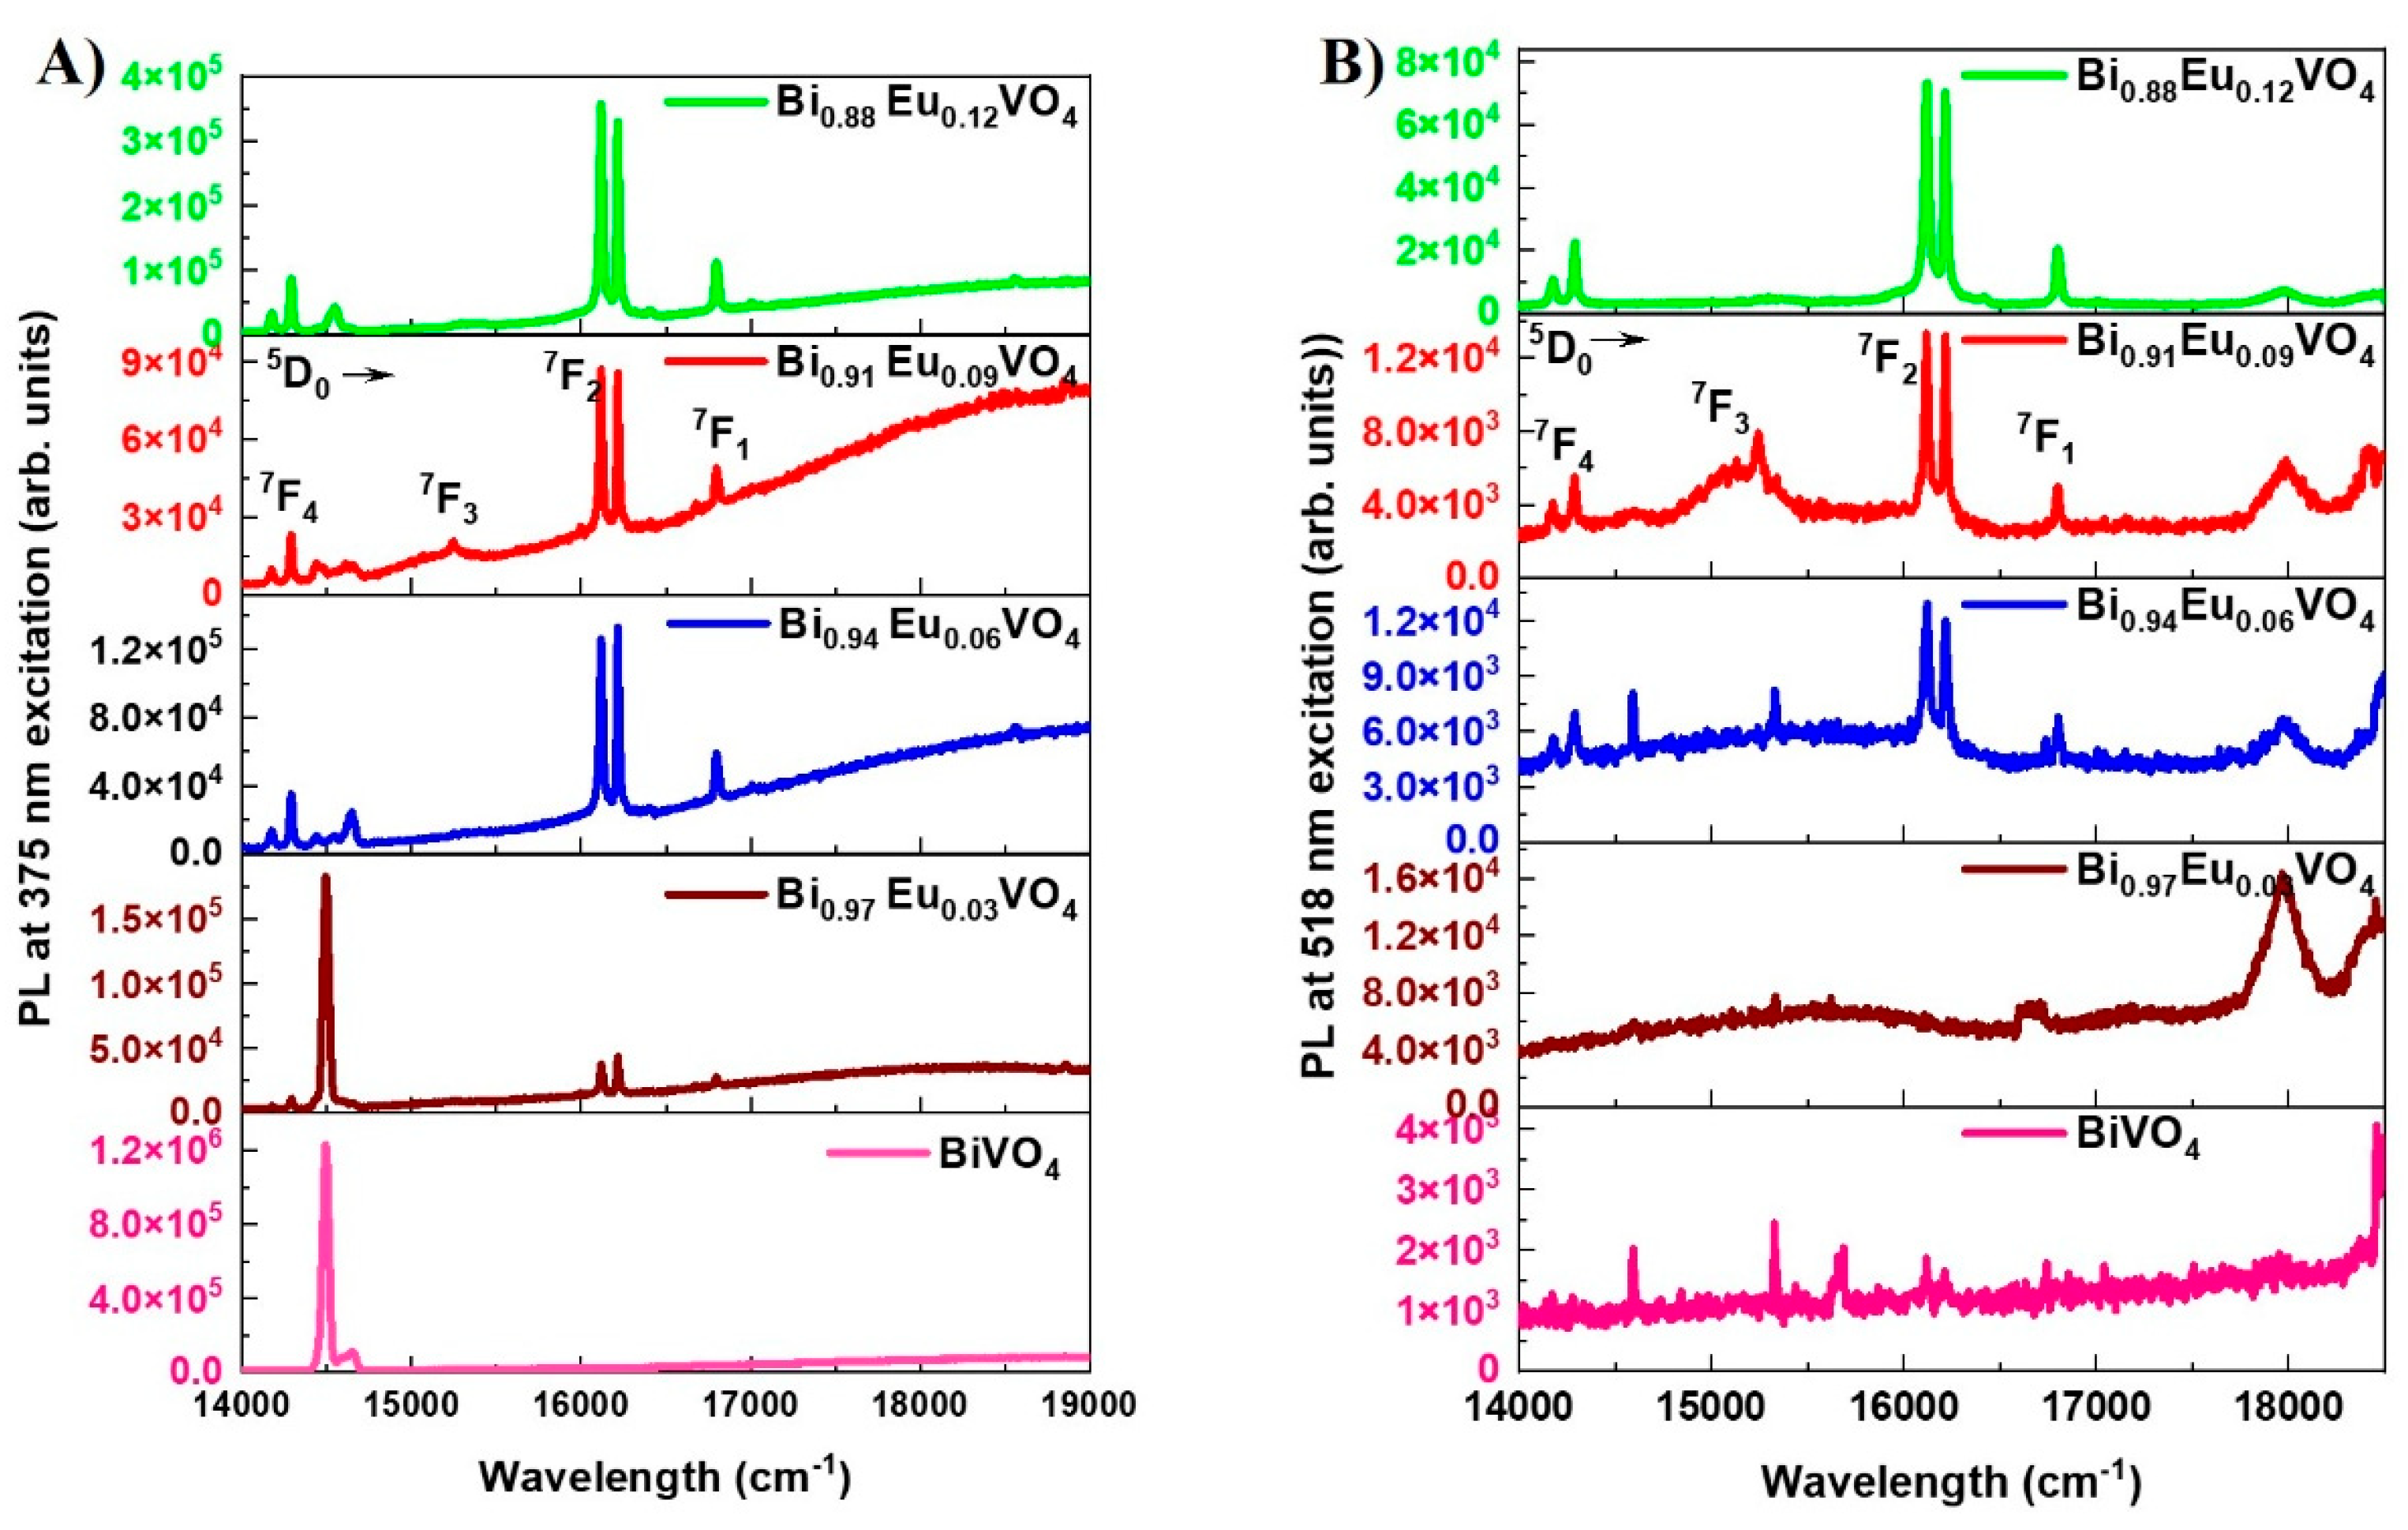
Figure 6.
PL emission spectra of Bi1-x EuxVO4 (x =0,0.03,0.06,0.09,0.12) samples at (a) 375 nm, and (b) 518 nm excitation wavelength. For the 0.09 mol.% of Eu3+ in the BiVO4 sample, 5D0 → 7FJ (J= 1-4) transitions are labeled for easy identification.
Figure 6.
PL emission spectra of Bi1-x EuxVO4 (x =0,0.03,0.06,0.09,0.12) samples at (a) 375 nm, and (b) 518 nm excitation wavelength. For the 0.09 mol.% of Eu3+ in the BiVO4 sample, 5D0 → 7FJ (J= 1-4) transitions are labeled for easy identification.
2.2.5. Time-Resolved Fluorescence Spectroscopy (TRS)
Time-resolved photoluminescence measurements were performed to study the decay dynamics of europium emission in the BiVO4 matrix. For this purpose, the sample was excited using the second harmonic (355 nm) of a Nd:YAG pulsed laser (repetition rate ~ 10Hz, pulse-width ~ 8 ns) and the PL emission was collected using a home-built collection geometry configured with a time-resolved setup and multi-channel counters [46]. The PL spectra obtained for Bi1-x EuxVO4 samples display dominant emission corresponding to the 5D0 → 7F2 transition, whereas BiVO4 does not show any emission. The decay curve is obtained for each Eu3+ doped sample and shown in Figure 7b. In general, decay curves follow stretched exponential decay characteristics because of the local environment of Eu3+ in the BiVO4 matrix [49]. Here, the relaxation refers to the active non-radiative channels such as quenching centers in the lattice, possible energy migration among the activators, and surface localization. Hence, the stretched exponential or Kohlrausch model [45,49,50] is used to fit the decay curves as given by the equation:
where, <1 is the stretching parameter and is the radiative lifetime.
The radiative lifetime , for Eu3+ doped samples corresponding to 5D0→7F2 transition is obtained from the fit of the decay curves in Figure 7b–e using Eq.3 and reported in Table 1. The decay curves of Eu³⁺ do not exhibit a single-exponential behavior. The lifetime can be evaluated correctly only for the sample with the lowest Eu3+ content. As Eu3+ doping increases, the lifetime drops quickly with a very fast decay; similar behavior has been observed in BiVO4 nanoparticles activated by Eu3+ ions [51]. This deviation is attributed to nonradiative energy transfer from the excited states to quenching centers within the lattice, as well as possible energy migration among activator ions. These energy losses introduce additional decay pathways, resulting in the observed nonexponential decay profiles that are correctly fitted by a stretched exponential. The contribution from surface-localized Eu³⁺ in BiVO₄ should be also considered. In fact, the lifetime of surface-localized Eu³⁺ in BiVO₄ is notably shorter than the typical millisecond-scale lifetime of Eu³⁺ ions in host lattices [51]. Asabove, the deviation is attributed to a nonradiative energy transfer to some quenching centers in the lattices, or possible energy migrations among the activators [51]. The excitation energy losses provide some extra decay channels inducing the nonexponential decay natures.
2.2.6. Micro-Raman Spectroscopy Measurements
Raman spectra of undoped and Eu³⁺-doped BiVO₄ exhibit characteristic peaks, labeled with letters as shown in Figure 8a, and marked with vertical lines in the magnified section views of Figure 8b,c for clarity. The assigned letters correspond to the following wavenumbers: (a) 179 cm⁻¹; (b) 197 cm⁻¹; (c) 211 cm⁻¹; (d) 247 cm⁻¹; (e) 327 cm⁻¹; (f) 367 cm⁻¹; (g) 708 cm⁻¹; (h) 778 cm⁻¹; (i) 829 cm⁻¹; and (l) 854 cm⁻¹. XRD analysis confirms that the samples comprise a mixture of ms-BiVO₄ and tz-BiVO₄ phases. Consequently, Raman modes corresponding to both phases are present, as summarized in Table 2.
Figure 8 further highlight Raman peaks that track the structural phase evolution with increasing Eu doping. The peak at ~211 cm⁻¹ (c in the Figures), present across all samples, including the undoped one, corresponds to an external lattice mode common to both phases. In contrast, the two peaks at 179 cm⁻¹ (a) and 197 cm⁻¹ (b), which appear predominantly at higher Eu concentrations (especially at x = 0.12), are characteristic of monoclinic distortions or phase coexistence. The increasing intensity of these lower-frequency peaks with Eu content indicates enhanced lattice distortion and possibly the persistence of local monoclinic-like environments, despite overall doping-induced structural changes. The 247 cm⁻¹ peak (d), primarly associated with Bi–O stretching vibrations in the tetragonal phase, is absent in the undoped sample but becomes prominent at higher doping, confirming the phase transition. The peak shifts near 254 cm⁻¹ at x = 0.06 suggests lattice distortion linked to coexistence with a dominant monoclinic phase and strain.
Monoclinic phase signatures include peaks at 708 cm⁻¹ (g) and 829 cm⁻¹ (i), corresponding to antisymmetric and symmetric V–O stretching modes, respectively. These peaks decrease in intensity at x = 0.12, while tetragonal-phase peaks at 778 cm⁻¹ (h) and 854 cm⁻¹ (l) increase, marking the phase transition. Intermediate doping levels (x = 0.06 and 0.09) exhibit coexistence of both phases, as evidenced by the simultaneous presence of monoclinic and tetragonal peaks with varying intensities.
Several peaks display doping-dependent shifts. The 327 cm⁻¹ peak (e), related to asymmetric deformation of the VO₄³⁻ tetrahedron, shifts to higher wavenumbers up to x = 0.09, likely due to substitution of Bi by smaller Eu ions, causing lattice contraction. This shift diminishes at x = 0.12, possibly due to lattice softening as the monoclinic phase diminishes. The 367 cm⁻¹ (f) and 829 cm⁻¹ (i) peaks also show a variable red shift indicative of doping-induced strain or disorder [47,50,52,53]. The shifts observed at (b) and (c) in the Raman spectra (together with the XRD results) confirm that the dopants caused distortions in the BiVO4 crystal lattice. These distortions likely happened by replacing Bi3+ with Eu3+ ions [47]. On the other hand, if Eu3+ was replacing V5+ instead, a shift toward lower wavenumbers should be expected, as Eu3+ has a greater atomic mass than V5+, according to [52,54].
Overall, the Raman spectral evolution clearly demonstrates a doping-driven structural transition from monoclinic to tetragonal BiVO₄, with associated shifts reflecting changes in lattice dynamics and phase.
2.3. Photocatalytic Activity of Bi1-xEuxVO4 (x = 0, 0.03, 0.06, 0.09, 0.12) Samples
Photodegradation of RhB was employed to evaluate the photocatalytic activities of all microwave-synthesized Bi1-xEuxVO4 samples. UV-Vis absorption spectra over irradiation time of photocatalytic degradation of 5 ppm RhB in the presence of 40 mg of the appropriate Bi1-xEuxVO4 photocatalyst are presented in Figure 9. The change in the absorption spectra of RhB solution during the photodegradation process at different irradiation times is presented in Figure 9a for the undoped BiVO4 photocatalyst. The absorbance of RhB at 554 nm decreased gradually after 100 minutes of irradiation in the presence of undoped BiVO4, indicating that microwave-synthesized catalysts are effective for dye removal in wastewater treatment. Compared with the undoped BiVO4, the RhB photocatalytic degradation shows lower absorbance intensities as the concentration of Eu3+-dopant increases (Figure 9c–f). The removal efficiency curves presented in Figure 9b illustrate the relative concentration of the RhB solution over irradiation time for blank dye (RhB) and all microwave-synthesized Bi1-xEuxVO4 (x =0, 0.03, 0.06, 0.09, and 0.12) photocatalysts. In contrast to the undoped BiVO4, with a removal efficiency of 81% within 100 minutes of irradiation, Eu3+-doped BiVO4 samples exhibited higher efficiencies of 89%, 87%, and 91% for Bi0.97Eu0.03VO4, Bi0.94Eu0.06VO4, and Bi0.91Eu0.09VO4, respectively. The degradation rate of 97% for RhB dye was observed with the highest Eu3+-doped BiVO4 sample, Bi0.88Eu0.12VO4.
It can be noted that, in comparison with the undoped BiVO4, the Eu3+-doped BiVO4 photocatalysts exhibit much higher photocatalytic activity in the degradation of RhB under visible light irradiation. There are two different possibilities for enhanced photocatalytic performances with increasing concentration of Eu3+ ions in BiVO4 matrix: i) an appropriate amount of Eu3+ ions can improve the separation efficiency of photogenerated electron–hole pairs and hinder their recombination, and ii) the dominant tz-BiVO4 structure exhibited better photocatalytic performance than ms-BiVO4 with respect to RhB removal.
3. Discussion
The Formation of ms- or tz- Crystalline Phase in Bi1-xEuxVO4 (x = 0, 0.03, 0.06, 0.09, and 0.12) Samples
Recently, control over the crystalline phases, i.e., transformation from the tz-type to the ms-type, and morphology of BiVO4 samples has been successfully obtained using microwave-hydrothermal (MWHT) conditions, without any template/surfactant, doping of metal ions or pH change of the reaction solution [55]. Also, doping with RE ions such as Er3+, Yr3+, Gd3+, Sm3+, Tb3+, Nd3+ and Ce3+ resulted in phase transitions in BiVO4 and significant improvement of photocatalytic properties [18,53,56,57,58,59,60,61,62,63]. A comparison of the literature on the formation of either ms- or tz- crystalline phases, as well as luminescent and photocatalytic properties as a function of the Eu3+/Bi3+ molar ratio in Bi1-xEuxVO4 samples, is presented alongside our results in Table 3.
4. Materials and Methods
4.1. Materials
The following chemicals were used as received: bismuth nitrate pentahydrate, (Bi(NO3)3·5H2O (99 %, Merck), ammonium metavanadate, NH4VO3 (99 %, Merck), Europium (III) acetate hydrate, Eu(CH3COO)3·H2O (99.9 %, Alfa Aesar), nitric acid, HNO3 (99 %, Merck), sodium hydroxide, NaOH (95 %, Merck), Rhodamine B, C28H31CIN2O3, RhB (95 %, Merck).
4.2. Synthesis of Bi1-xEuxVO4 (x = 0.03, 0.06, 0.09 and 0.12) Samples
In a typical microwave-assisted synthesis method, the aqueous solutions of ammonium metavanadate, NH4VO3 (6 mL, 0.05 M) and bismuth(III) nitrate pentahydrate, Bi(NO3)3·5H2O (5 mL, 0.05 M) were uniformly mixed in a 20 mL process vial equipped with a stirring bar. Additionally, the appropriate amount (0.03, 0.06, 0.09, and 0.12 mmol) of the respective europium (III) acetate hydrate, Eu(CH3COO)3·H2O, was added to the starting Bi(NO3)3 for each (of four) prepared solution individually. The reaction mixtures were heated in a closed vessel system of a microwave reactor at 170 °C for a duration of 10 minutes. The reaction mixtures were cooled down before being transferred to centrifugal tubes and then centrifuged for 20 minutes at 12,000 rpm to produce a light yellow powder, that was washed three times using deionized water. Powder samples were finally obtained upon drying them in the air at 70 °C for three hours. The obtained powder samples in yellow color will be denoted through the text as Bi0.97Eu0.03VO4, Bi0.94Eu0.06VO4, Bi0.91Eu0.09VO4 and Bi0.88Eu0.12VO4 corresponding to 3 mmol, 6 mmol, 9 mmol and 12 mmol of added Eu3+ ions in starting (Bi3+) solutions, respectively.
4.3. Synthesis of BiVO4 Samples
A undoped BiVO4 sample was prepared by applying identical reaction procedures of microwave synthesis as in the absence of Eu3+ precursors, Eu(CH3COO)3·H2O. Briefly, the reaction mixture containing aqueous solutions of NH4VO3 (6 mL, 0.05 M) and Bi(NO3)3·5H2O (5 mL, 0.05 M) was transferred into microwave reactor vial equipped with a stirring bar, it was heated in a closed vessel system at 170 °C for during 10 minutes, then cooled down to room temperature and centrifuged for 20 minutes to produce a light yellow powder, that was washed three times using deionized water. Powder sample was finally obtained after drying at 70 °C for 3 hours. The light yellow powder of the BiVO4 sample has been denoted simply as BiVO4.
4.4. Characterization Instrumentation
A high-density microwave field chemical synthesis reactor, the Monowave 300 from Anton Paar GmbH, with a maximum magnetron output power of 850 W, was used for the microwave heating studies. With a working temperature of up to 300 °C, an integrated infrared temperature sensor was used to monitor the reaction temperature. PEEK snap caps and conventional silicone septa covered with polytetrafluoroethylene (PTFE) are used to seal the reusable 20 mL Pyrex vials (G30). Every experiment was conducted at a maximum pressure of 30 bar and a stirring rate of 600 rpm. The powder X-ray diffraction (XRD) analysis was performed using a BRUKER AXS GMBH A24A10 X-ray diffractometer. Patterns were collected at room temperature over a 2θ range of 15–70°, with a scan rate of 3°/min and a divergent slit of 0.5 mm, operating at 40 kV and 30 mA. Attenuated total reflectance Fourier transform infrared (ATR-FTIR) measurements were conducted in the 400-4000 cm-1 range with a spectral resolution of 4 cm-1 at room temperature, using a Thermo Scientific Nicolet iS50 FT-IR spectrometer equipped with a built-in all-reflective ATR diamond. In the 200–800 nm range, the Shimadzu 1800 UV–Vis spectrophotometer with a temperature controller was used to record the ultraviolet–visible (UV–Vis) absorption spectra. The Spectrophotometer Shimadzu UV–Visible UV-2600 (Shimadzu Corporation, Tokyo, Japan) with an integrated sphere (ISR-2600 Plus (for UV-2600)) with a 300–800 nm range and a 1 nm step was used to quantify diffuse reflection. The morphology of the obtained samples was studied using a Tecnai F20 TEM/STEM microscope (FEI Company, now Thermo Fisher Scientific) at 200 kV electron acceleration voltage after dry-transfer of sample material on lacey carbon TEM grids. The UV-visible absorption spectrum, photoluminescence quantum yield (PLQY), and excitation wavelength dependence and PL excitation spectra were recorded using absolute PL quantum yield spectrometer (Quantaurus-QY, C11347 series, Hamamatsu). A LabRAM HR Evolution confocal Raman microscope (Horiba France SAS) was used to investigate the influence of Eu³⁺ doping on the crystal structure of BiVO₄ samples. Raman spectra were recorded in backscattering configuration using a 532 nm continuous-wave (CW) laser operated at low power (1 mW). The laser was focused on the sample through a 100× microscope objective (NA = 0.9), and the scattered light was analyzed with a diffraction grating of 1800 lines/mm.
4.5. Photocatalytic Test
Photocatalytic activities of the as-prepared samples were determined by the decolorization of RhB under visible light irradiation. The experiments were conducted in a 100 mL glass reactor equipped with a 300 W lamp as the light source, positioned 30 cm from the reaction mixture. An Osram Vitalux lamp (300 W, white light: UVB radiated power from 280 to 315 nm 3.0 W; UVA radiated power 315-400 nm 13.6 W; the rest is visible light and IR) was used as the simulated sunlight source. Optical power was measured using R-752 Universal Radiometer read out with sensor model PH-30, DIGIRAD and it was ∼ 30 mWcm−2.
In a standard experiment, 50 mL of RhB solution with a 5 ppm concentration was mixed with 40 mg of the appropriate Bi1-xEuxVO4 (x =0, 0.03, 0.06, 0.09, and 0.12) sample. Before illumination, the mixture was treated with an ultrasonic bath for 15 minutes and then left in the dark for one hour to reach adsorption-desorption equilibrium between RhB and the appropriate Bi1-xEuxVO4 sample. At given time intervals, the collected mixture samples (1 mL) were centrifuged at 12 000 rpm for 20 minutes to remove the catalyst. The samples` concentration was determined by recording the absorbance at 554 nm using a UV-1800 spectrophotometer. The degradation efficiency (D) was calculated using Eq. (4):
where C0 is the initial concentration of the dye solution, Ct is the concentration of the dye solution after a certain time of illumination (t).
5. Conclusions
In this manuscript, a simple microwave-assisted approach was used for preparing nanostructured Bi1-xEuxVO4 (x = 0, 0.03, 0.06, 0.09 and 0.12) samples with enhanced photoluminescent and photocatalytic properties. Effects of the Eu3+ ions concentration incorporated into the BiVO4 matrix on the formation of the monoclinic scheelite or tetragonal zircon-type BiVO4 structure, on the photoluminescent intensity, on the decay dynamics of europium emission and photocatalytic efficiency in degradation of Rhodamine B, were studied in detail. The main aim was to obtain the optimized tz-BiVO4 nanostructure which had been presented in our recently published papers as a structure exhibiting better photocatalytic performance than ms-BiVO4 with respect to pollutants removal.
The FTIR analysis of Bi1-xEuxVO4 (x = 0.03, 0.06, 0.09, and 0.12) samples showed the characteristic peaks as undoped BiVO4 in the range of around 500-820 cm−1, while two new peaks appeared at 471 cm−1 and 720 cm−1, assigned to Eu-O stretching vibrations. The band gap, Eg, estimated from the absorption edge wavelength of the inter-band transition, shifted to higher energy with increasing Eu3+ contents and ranged from approximately 2.55 to 2.80 eV. The PL spectra of samples contained Eu3+ ions displayed dominant emission corresponding to 5D0 → 7F2 transition whereas BiVO4 does not show any emission. Also, the Eu3+-doped BiVO4 exhibited much higher photocatalytic activity in the degradation of RhB than undoped BiVO4.
In our future works, research will be focused on the photocatalytic degradation of other organic pollutants when using the Eu3+ doped-BiVO4 photocatalyst and different rare earth/dopant ions in a wide range of their concentration.
Author Contributions
Conceptualization, D.M. and M.F.; methodology, B.V., N.T. and A.C.; software, N.T., S.V., B.C.B. and B.F.; validation, D.M., T.B. and M.F.; formal analysis, B.V., S.M.L.S. and R.D.A.; investigation, D.M., S.V. and M.F.; resources, D.M., A.C. and M.F.; data curation, T.B., B.C.B. and B.F..; writing—original draft preparation, D.M., B.V., G.C.R., S.M.L.S., R.D.A. and M.F.; writing—review and editing, D.M., G.C.R. and M. F.; visualization, D.M., A.C., G.C.R. and M. F; supervision, D.M. and M.F.; project administration D.M. and M. F.; funding acquisition, D.M. and M. F.. All authors have read and agreed to the published version of the manuscript.
Funding
“This research was funded by the Ministry of Science, Technological Development and Innovation of the Republic of Serbia, grant number 451-03-136/2025-03/200017. Author A.C. thank Project PNRR "Nano Foundries and Fine Analysis – Digital Infrastructure (NFFA-DI)" IR0000015”.
Institutional Review Board Statement
“Not applicable”.
Informed Consent Statement
“Not applicable.”.
Data Availability Statement
The original contributions presented in this study are included in the article. Further inquiries can be directed to the corresponding authors.
Acknowledgments
The authors are grateful to Dušan Mijin for FTIR measurements, Nadica Abazović, and Milica Carević for DRS measurements. The use of facilities at the University Service Facility for Transmission Electron Microscopy (USTEM) of TU Wien for parts of this work is acknowledged. This work is dedicated to the memory of Dragana Marinković's husband.
Conflicts of Interest
“The authors declare no conflicts of interest.”.
References
- Jabbar, Z.H.; Graimed, B.H.; Ammar, S.H.; Sabit, D.A.; Najim, A.A.; Radeef, A.Y.; Taher, A.G. The Latest Progress in the Design and Application of Semiconductor Photocatalysis Systems for Degradation of Environmental Pollutants in Wastewater: Mechanism Insight and Theoretical Calculations. Mater. Sci. Semicond. Process. 2024, 173, 108153. [CrossRef]
- Ahmad, I.; Zou, Y.; Yan, J.; Liu, Y.; Shukrullah, S.; Naz, M.Y.; Hussain, H.; Khan, W.Q.; Khalid, N.R. Semiconductor Photocatalysts: A Critical Review Highlighting the Various Strategies to Boost the Photocatalytic Performances for Diverse Applications. Adv. Colloid Interface Sci. 2023, 311, 102830. [CrossRef]
- Q. Alijani, H.; Iravani, S.; Varma, R.S. Bismuth Vanadate (BiVO4) Nanostructures: Eco-Friendly Synthesis and Their Photocatalytic Applications. Catalysts 2023, 13, 59. [CrossRef]
- Marinković, D.; Righini, G.C.; Ferrari, M. Synthesis, Optical, and Photocatalytic Properties of the BiVO4 Semiconductor Nanoparticles with Tetragonal Zircon-Type Structure. Photonics 2025, 12, 1–15. [CrossRef]
- Marinković, D.; Righini, G.C.; Ferrari, M. Advances in Synthesis and Applications of Bismuth Vanadate-Based Structures. Inorganics 2025, 13, 1–25. [CrossRef]
- Tot, N.; Vasiljević, B.; Davidović, S.; Pustak, A.; Marić, I.; Prekodravac Filipović, J.; Marinković, D. Facile Microwave Production and Photocatalytic Activity of Bismuth Vanadate Nanoparticles over the Acid Orange 7. Processes 2025, 13, 3485; [CrossRef]
- Bulut, D.T. Exploring the Dual Role of BiVO4 Nanoparticles: Unveiling Enhanced Antimicrobial Efficacy and Photocatalytic Performance. J. Sol-Gel Sci. Technol. 2025, 114, 198–222. [CrossRef]
- Lalrindiki, F.; Premjit Singh, N.; Mohondas Singh, N. A Review of Synthesis, Photocatalytic, Photoluminescence and Antibacterial Properties of Bismuth Vanadate-Based Nanomaterial. Inorg. Chem. Commun. 2024, 168, 112846. [CrossRef]
- Kamble, G.S.; Natarajan, T.S.; Patil, S.S.; Thomas, M.; Chougale, R.K.; Sanadi, P.D.; Siddharth, U.S.; Ling, Y.C. BiVO4 As a Sustainable and Emerging Photocatalyst: Synthesis Methodologies, Engineering Properties, and Its Volatile Organic Compounds Degradation Efficiency. Nanomaterials 2023, 13, 1528, doi.org/10.3390/nano13091528.
- Ding, H.; Peng, B.; Wang, Z.; Han, Q. Advances in Metal or Nonmetal Modification of Bismuth-Based Photocatalysts. Wuli Huaxue Xuebao/ Acta Phys. - Chim. Sin. 2024, 40, 2305048. [CrossRef]
- Mohamed, N.A.; Kiong, T.S.; Ismail, A.F. Pioneering Sustainable Energy Solutions with Rare-Earth Nanomaterials: Exploring Pathways for Energy Conversion and Storage. Int. J. Hydrogen Energy 2024, 93, 607–649. [CrossRef]
- Sun, J.; Zhang, Z.; Suo, H.; Chen, Y.; Xiang, J.; Guo, C. Temperature Self-Monitoring Photothermal Nano-Particles of Er3+/Yb3+ Co-Doped Zircon-Tetragonal BiVO4. Ceram. Int. 2021, 47, 409–415. [CrossRef]
- Gschwend, P.M.; Starsich, F.H.L.; Keitel, R.C.; Pratsinis, S.E. Nd3+-Doped BiVO4 Luminescent Nanothermometers of High Sensitivity. Chem. Commun. 2019, 55, 7147–7150. [CrossRef]
- Nexha, A.; Carvajal, J.J.; Pujol, M.C.; Díaz, F.; Aguiló, M. Lanthanide Doped Luminescence Nanothermometers in the Biological Windows: Strategies and Applications. Nanoscale 2021, 13, 7913–7987. [CrossRef]
- Starsich, F.H.L.; Gschwend, P.; Sergeyev, A.; Grange, R.; Pratsinis, S.E. Deep Tissue Imaging with Highly Fluorescent Near-Infrared Nanocrystals after Systematic Host Screening. Chem. Mater. 2017, 29, 8158–8166. [CrossRef]
- Jurga, N.; Runowski, M.; Grzyb, T. Lanthanide-Based Nanothermometers for Bioapplications: Excitation and Temperature Sensing in Optical Transparency Windows. J. Mater. Chem. C 2024, 12, 12218–12248. [CrossRef]
- Richards, B.S.; Hudry, D.; Busko, D.; Turshatov, A.; Howard, I.A. Photon Upconversion for Photovoltaics and Photocatalysis: A Critical Review. Chem. Rev. 2021, 121, 9165–9195. [CrossRef]
- Tian, K.; Wu, L.; Han, T.; Gao, L.; Wang, P.; Chai, H.; Jin, J. Dual Modification of BiVO4 Photoanode by Rare Earth Element Neodymium Doping and Further NiFe2O4 Co-Catalyst Deposition for Efficient Photoelectrochemical Water Oxidation. J. Alloys Compd. 2022, 923, 166352. [CrossRef]
- Bashir, S.; Jamil, A.; Khan, M.S.; Alazmi, A.; Abuilaiwi, F.A.; Shahid, M. Gd-Doped BiVO4 Microstructure and Its Composite with a Flat Carbonaceous Matrix to Boost Photocatalytic Performance. J. Alloys Compd. 2022, 913, 165214. [CrossRef]
- Orona-Návar, C.; Park, Y.; Srivastava, V.; Hernández, N.; Mahlknecht, J.; Sillanpää, M.; Ornelas-Soto, N. Gd3+ Doped BiVO4 and Visible Light-Emitting Diodes (LED) for Photocatalytic Decomposition of Bisphenol A, Bisphenol S and Bisphenol AF in Water. J. Environ. Chem. Eng. 2021, 9. [CrossRef]
- Liu, Y.; Yin, X.; Zhao, H.; Shu, W.; Xin, F.; Wang, H.; Luo, X.; Gong, N.; Xue, X.; Pang, Q.; et al. Near-Infrared-Emitting Upconverting BiVO4 Nanoprobes for in Vivo Fluorescent Imaging. Spectrochim. Acta - Part A Mol. Biomol. Spectrosc. 2022, 270, 120811. [CrossRef]
- Liu, T.; Tan, G.; Zhao, C.; Xu, C.; Su, Y.; Wang, Y.; Ren, H.; Xia, A.; Shao, D.; Yan, S. Enhanced Photocatalytic Mechanism of the Nd-Er Co-Doped Tetragonal BiVO4 Photocatalysts. Appl. Catal. B Environ. 2017, 213, 87–96. [CrossRef]
- Regmi, C.; Kshetri, Y.K.; Jeong, S.H.; Lee, S.W. BiVO4 as Highly Efficient Host for Near-Infrared to Visible Upconversion. J. Appl. Phys. 2019, 125. [CrossRef]
- Regmi, C.; Kshetri, Y.K.; Ray, S.K.; Pandey, R.P.; Lee, S.W. Utilization of Visible to NIR Light Energy by Yb+3 , Er+3 and Tm+3 Doped BiVO4 for the Photocatalytic Degradation of Methylene Blue. Appl. Surf. Sci. 2017, 392, 61–70. [CrossRef]
- Obregón, S.; Colón, G. On the Origin of the Photocatalytic Activity Improvement of BIVO4 through Rare Earth Tridoping. Appl. Catal. A Gen. 2015, 501, 56–62. [CrossRef]
- Pei, Z.; Jia, H.; Zhang, Y.; Wang, P.; Liu, Y.; Cui, W.; Xu, J.; Xie, J. A One-Pot Hydrothermal Synthesis of Eu/BiVO4 Enhanced Visible-Light-Driven Photocatalyst for Degradation of Tetracycline. J. Nanosci. Nanotechnol. 2019, 20, 3053–3059. [CrossRef]
- Zhang, A.; Zhang, J. Effects of Europium Doping on the Photocatalytic Behavior of BiVO4. J. Hazard. Mater. 2010, 173, 265–272. [CrossRef]
- Shan, L.; Ding, J.; Sun, W.; Han, Z.; Jin, L. Core–Shell Heterostructured BiVO4/BiVO4:Eu3+ with Improved Photocatalytic Activity. J. Inorg. Organomet. Polym. Mater. 2017, 27, 1750–1759. [CrossRef]
- Wang, M.; Che, Y.; Niu, C.; Dang, M.; Dong, D. Effective Visible Light-Active Boron and Europium Co-Doped BiVO4 Synthesized by Sol-Gel Method for Photodegradion of Methyl Orange. J. Hazard. Mater. 2013, 262, 447–455. [CrossRef]
- Praxmair, J.; Creazzo, F.; Tang, D.; Zalesak, J.; Hörndl, J.; Luber, S.; Pokrant, S. Hydrothermally Synthesized BiVO4 : The Role of KCl as Additive for Improved Photoelectrochemical and Photocatalytic Oxygen Evolution Activity. ChemElectroChem 2025, 202500280, 10–11. [CrossRef]
- Wang, M.; Han, J.; Lv, C.; Zhang, Y.; You, M.; Liu, T.; Li, S.; Zhu, T. Ag, B, and Eu Tri-Modified BiVO4 Photocatalysts with Enhanced Photocatalytic Performance under Visible-Light Irradiation. J. Alloys Compd. 2018, 753, 465–474. [CrossRef]
- Dhakal, D.R.; Kshetri, Y.K.; Chaudhary, B.; Choi, J. hyuk; Murali, G.; Kim, T.H. Enhancement of Upconversion Luminescence in Yb3+/Er3+-Doped BiVO4 through Calcination. Mater. Today Commun. 2023, 37, 107258. [CrossRef]
- Lenczewska, K.; Szymański, D.; Hreniak, D. Control of Optical Properties of Luminescent BiVO4:Tm3+ by Adjusting the Synthesis Parameters of Microwave-Assisted Hydrothermal Method. Mater. Res. Bull. 2022, 154. [CrossRef]
- Kumar, A.; Kuang, Y.; Liang, Z.; Sun, X. Microwave Chemistry, Recent Advancements, and Eco-Friendly Microwave-Assisted Synthesis of Nanoarchitectures and Their Applications: A Review. Mater. Today Nano 2020, 11. [CrossRef]
- Krishnan, R.; Shibu, S.N.; Poelman, D.; Badyal, A.K.; Kunti, A.K.; Swart, H.C.; Menon, S.G. Recent Advances in Microwave Synthesis for Photoluminescence and Photocatalysis. Mater. Today Commun. 2022, 32, 103890. [CrossRef]
- Devi, N.; Sahoo, S.; Kumar, R.; Singh, R.K. A Review of the Microwave-Assisted Synthesis of Carbon Nanomaterials, Metal Oxides/Hydroxides and Their Composites for Energy Storage Applications. Nanoscale 2021, 13, 11679–11711. [CrossRef]
- Saleem, Q.; Torabfam, M.; Fidan, T.; Kurt, H.; Yüce, M.; Clarke, N.; Bayazit, M.K. Microwave-Promoted Continuous Flow Systems in Nanoparticle Synthesis - A Perspective. ACS Sustain. Chem. Eng. 2021, 9, 9988–10015. [CrossRef]
- Dhaffouli, A. Eco-Friendly Nanomaterials Synthesized Greenly for Electrochemical Sensors and Biosensors. Microchem. J. 2025, 217, 115051. [CrossRef]
- Reda, A.T.; Park, Y.T. Sustainable Synthesis of Functional Nanomaterials: Renewable Resources, Energy-Efficient Methods, Environmental Impact and Circular Economy Approaches. Chem. Eng. J. 2025, 516, 163894. [CrossRef]
- Fatimah, S.; Ragadhita, R.; Al Husaeni, D.F.; Nandiyanto, A.B.D. How to Calculate Crystallite Size from X-Ray Diffraction (XRD) Using Scherrer Method. ASEAN J. Sci. Eng. 2022, 2, 65–76. [CrossRef]
- Akhter, P.; Shafiq, I.; Ali, F.; Hassan, F.; Rehman, R.; Shezad, N.; Ahmed, A.; Jamil, F.; Hussain, M.; Park, Y.K. Montmorillonite-Supported BiVO4 Nanocomposite: Synthesis, Interface Characteristics and Enhanced Photocatalytic Activity for Dye-Contaminated Wastewater. J. Ind. Eng. Chem. 2023, 123, 238–247. [CrossRef]
- Dolić, S.D.; Jovanović, D.J.; Štrbac, D.; Far, L.Đ.; Dramićanin, M.D. Improved Coloristic Properties and High NIR Reflectance of Environment-Friendly Yellow Pigments Based on Bismuth Vanadate. Ceram. Int. 2018, 44, 22731–22737. [CrossRef]
- Dolić, S.D.; Jovanović, D.J.; Smits, K.; Babić, B.; Marinović-Cincović, M.; Porobić, S.; Dramićanin, M.D. A Comparative Study of Photocatalytically Active Nanocrystalline Tetragonal Zyrcon-Type and Monoclinic Scheelite-Type Bismuth Vanadate. Ceram. Int. 2018, 44, 17953–17961. [CrossRef]
- Xie, M.; Zhang, Z.; Han, W.; Cheng, X.; Li, X.; Xie, E. Efficient Hydrogen Evolution under Visible Light Irradiation over BiVO4 Quantum Dot Decorated Screw-like SnO2 Nanostructures. J. Mater. Chem. A 2017, 5, 10338–10346. [CrossRef]
- Lukowiak, Anna; Chiasera, Alessandro; Chiappini, Andrea; Righini, Giancarlo C.; Ferrari, M. Active Sol-Gel Materials, Fluorescence Spectra, and Lifetimes. In Handbook of Sol-Gel Science and Technology: Processing, Characterization and Applications; Lisa Klein, Mario Aparicio, A.J., Eds.; Publisher: Springer Cham 2018; pp. 1607–1649 ISBN 9783319321011.
- Duverger, C.; Ferrari, M.; Mazzoleni, C.; Montagna, M.; Pucker, G.; Turrell, S. Optical Spectroscopy of Pr3+ Ions in Sol-Gel Derived GeO2-SiO2 Planar Waveguides. J. Non. Cryst. Solids 1999, 245, 129–134. [CrossRef]
- Rodrigues, M.H. de M.; Borges, K.C.M.; de Fátima Gonçalves, R.; Carreno, N.L.V.; Alano, J.H.; Teodoro, M.D.; Godinho Junior, M. Exposed (040) Facets of BiVO4 Modified with Pr3+ and Eu3+: Photoluminescence Emission and Enhanced Photocatalytic Performance. J. Alloys Compd. 2023, 934, 167925. [CrossRef]
- Kaczkan, M.; Kowalczyk, M.; Szostak, S.; Majchrowski, A.; Malinowski, M. Transition Intensity Analysis and Emission Properties of Eu3+: Bi2ZnOB2O6 Acentric Biaxial Single Crystal. Opt. Mater. (Amst). 2020, 107, 110045. [CrossRef]
- Huber, D.L.; Vlad, M.O. Statistical Model for Stretched Exponential Relaxation with Backtransfer and Leakage. Phys. A Stat. Mech. its Appl. 1997, 242, 81–89. [CrossRef]
- Huber, D.L. Stretched Exponential Relaxation and Optical Phenomena in Glasses. Mol. Cryst. Liq. Cryst. Sci. Technol. Sect. A Mol. Cryst. Liq. Cryst. 1996, 291, 17–21. [CrossRef]
- Wei, D.; Huang, Y.; Bai, J.; Seo, H.J. Manipulating Luminescence and Photocatalytic Activities of BiVO4 by Eu3+ Ions Incorporation. J. Phys. Chem. C 2020, 124, 11767–11779. [CrossRef]
- Gu, S.; Li, W.; Wang, F.; Li, H.; Zhou, H. Substitution of Ce(III, IV) Ions for Bi in BiVO4 and Its Enhanced Impact on Visible Light-Driven Photocatalytic Activities. Catal. Sci. Technol. 2016, 6, 1870–1881. [CrossRef]
- Xue, S.; He, H.; Wu, Z.; Yu, C.; Fan, Q.; Peng, G.; Yang, K. An Interesting Eu,F-Codoped BiVO4 microsphere with Enhanced Photocatalytic Performance. J. Alloys Compd. 2017, 694, 989–997. [CrossRef]
- Regmi, C.; Kim, T.H.; Ray, S.K.; Yamaguchi, T.; Lee, S.W. Cobalt-Doped BiVO4 (Co-BiVO4) as a Visible-Light-Driven Photocatalyst for the Degradation of Malachite Green and Inactivation of Harmful Microorganisms in Wastewater. Res. Chem. Intermed. 2017, 43, 5203–5216. [CrossRef]
- Dabodiya, T.S.; Selvarasu, P.; Murugan, A.V. Tetragonal to Monoclinic Crystalline Phases Change of BiVO4 via Microwave-Hydrothermal Reaction: In Correlation with Visible-Light-Driven Photocatalytic Performance. Inorg. Chem. 2019, 58, 5096–5110. [CrossRef]
- Obregón, S.; Lee, S.W.; Colón, G. Exalted Photocatalytic Activity of Tetragonal BiVO4 by Er3+ Doping through a Luminescence Cooperative Mechanism. Dalt. Trans. 2014, 43, 311–316. [CrossRef]
- Usai, S.; Obregón, S.; Becerro, A.I.; Colón, G. Monoclinic-Tetragonal Heterostructured BiVO4 by Yttrium Doping with Improved Photocatalytic Activity. J. Phys. Chem. C 2013, 117, 24479–24484. [CrossRef]
- Wang, M.; Wu, L.; Zhang, F.; Gao, L.; Geng, L.; Ge, J.; Tian, K.; Chai, H.; Niu, H.; Liu, Y.; et al. Doping with Rare Earth Elements and Loading Cocatalysts to Improve the Solar Water Splitting Performance of BiVO4. Inorganics 2023, 11. [CrossRef]
- Zhao, K.; Liu, X.; He, Q.; Zhou, W.; Yang, K.; Tao, L.; Li, F.; Yu, C. Preparation and Characterization of Sm3+/Tm3+ Co-Doped BiVO4 Micro-Squares and Their Photocatalytic Performance for CO2 Reduction. J. Taiwan Inst. Chem. Eng. 2023, 144, 104737. [CrossRef]
- Chen, W.S.; Wu, M.H.; Wu, J.Y. Effects of Tb-Doped BiVO4 on Degradation of Methylene Blue. Sustain. 2023, 15. [CrossRef]
- Wang, Y.; Liu, F.; Hua, Y.; Wang, C.; Zhao, X.; Liu, X.; Li, H. Microwave Synthesis and Photocatalytic Activity of Tb3+ Doped BiVO4 Microcrystals. J. Colloid Interface Sci. 2016, 483, 307–313. [CrossRef]
- Dai, D.; Bao, X.; Zhang, Q.; Wang, Z.; Zheng, Z.; Liu, Y.; Cheng, H.; Dai, Y.; Huang, B.; Wang, P. Construction of Y-Doped BiVO4 Photocatalysts for Efficient Two-Electron O2 Reduction to H2O2. Chem. - A Eur. J. 2023, 29. [CrossRef]
- Guardiano, M.G.; Ribeiro, L.K.; Gonzaga, I.M.D.; Mascaro, L.H. Effect of Cerium Precursors on Ce-Doped BiVO4 Nanoscale-Thick Films as Photoanodes: Implications for Water Splitting. ACS Appl. Nano Mater. 2024, 7, 19569–19578. [CrossRef]
- Ghamri, J.; Baussart, H.; Le Bras, M.; Leroy, J.-M. Spectroscopic Study of BixEu1−xVO4 and BiyGd1−yVO4 Mixed Oxides. J. Phys. Chem. Solids 1989, 50, 1237–1244.
- Blin, J.L.; Lorriaux-Rubbens, A.; Wallart, F.; Wignacourt, J.P. Synthesis and Structural Investigation of the Eu1-XBixVO4 Scheelite Phase: X-Ray Diffraction, Raman Scattering and Eu3+ Luminescence. J. Mater. Chem. 1996, 6, 385–389. [CrossRef]
- Yi, J.; Zhao, Z.; Wang, Y.; Zhou, D.; Ma, C.; Cao, Y.; Qiu, J. Monophasic Zircon-Type Tetragonal Eu1 - XBixVO4 Solid-Solution: Synthesis, Characterization, and Optical Properties. Mater. Res. Bull. 2014, 57, 306–310. [CrossRef]
- Zhang, L.Y.; Gao, D.M.; Xu, Z.Z.; Gao, Y. Synthesis, Characterization, and Photocatalytic Activities of Eu3+-Doped BiVO4 Catalysts. Dig. J. Nanomater. Biostructures 2025, 20, 179–189, doi.org/10.15251/DJNB.2025.201.179.
- Yadav, R.S.; Rai, S.B. Structural Analysis and Enhanced Photoluminescence via Host Sensitization from a Lanthanide Doped BiVO4 Nano-Phosphor. J. Phys. Chem. Solids 2017, 110, 211–217. [CrossRef]
Figure 1.
XRD patterns for Bi1-xEuxVO4 (x = 0, 0.03, 0.06, 0.09, and 0.12) samples together with vertical bars from card references (No. 01-074-4894) for ms-BiVO4 and (No. 00-014-0133) for tz-BiVO4.
Figure 1.
XRD patterns for Bi1-xEuxVO4 (x = 0, 0.03, 0.06, 0.09, and 0.12) samples together with vertical bars from card references (No. 01-074-4894) for ms-BiVO4 and (No. 00-014-0133) for tz-BiVO4.
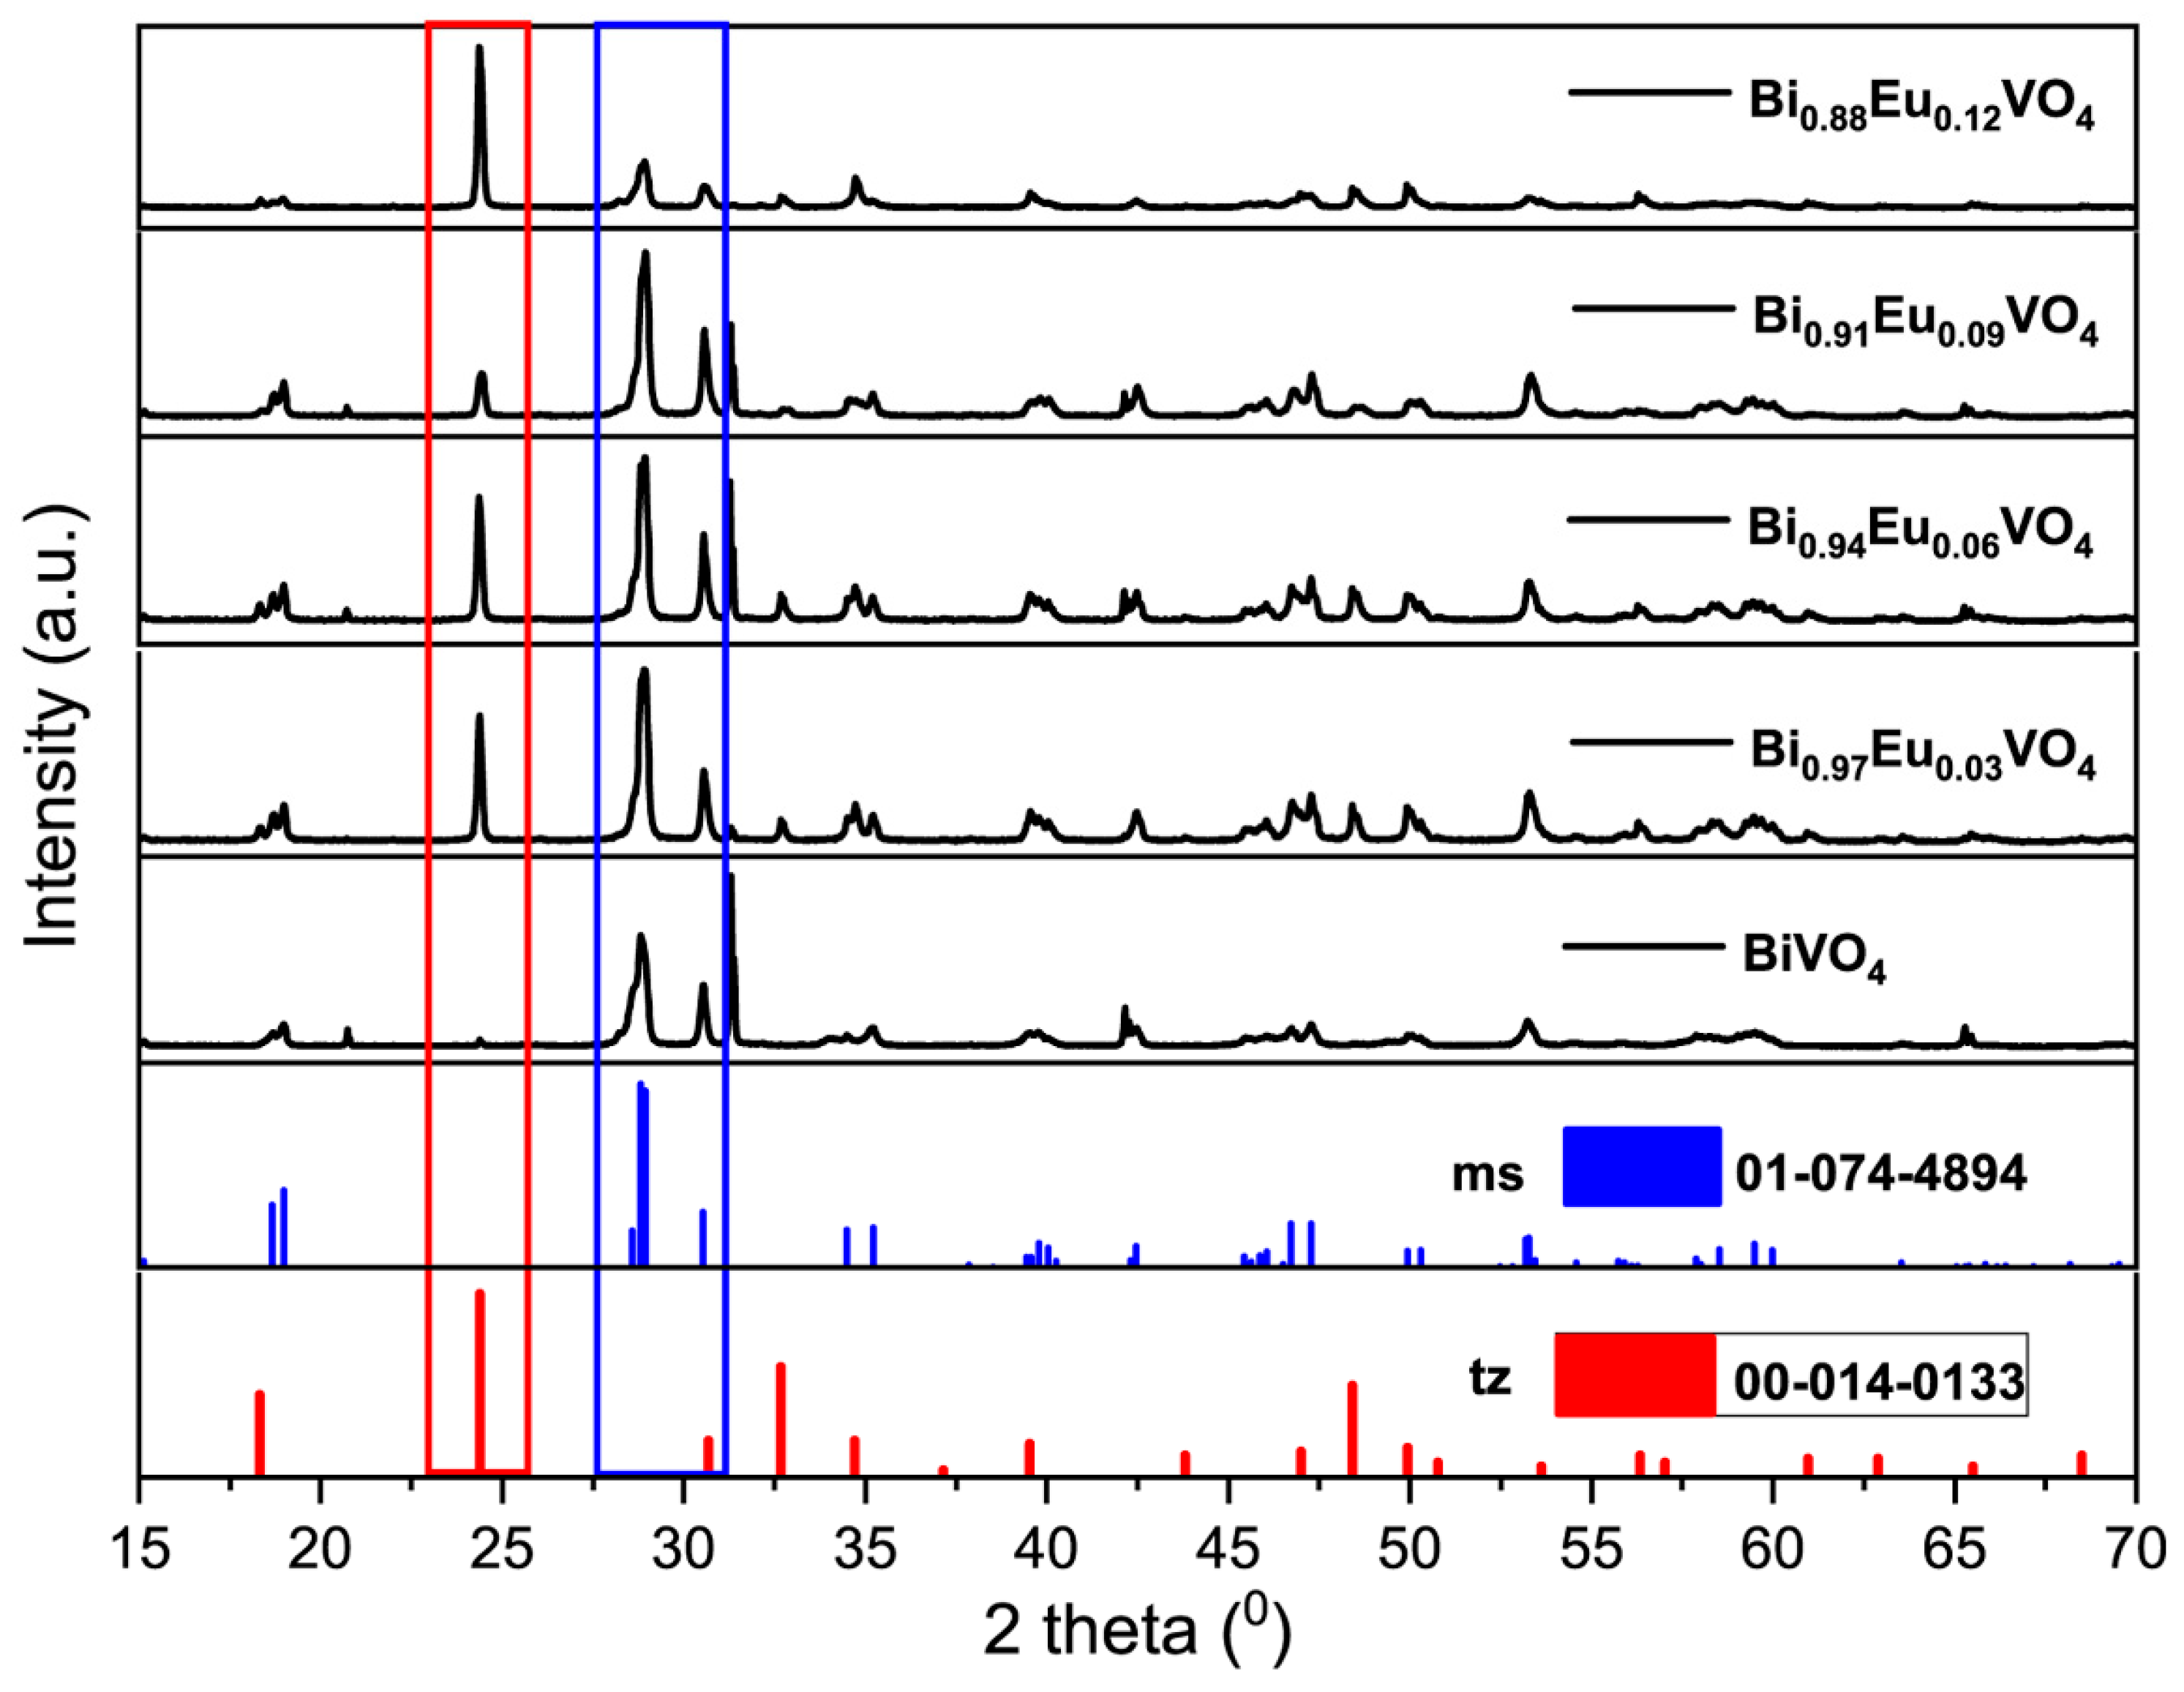
Figure 2.
Representative TEM images for: a) BiVO4 and b) Bi0.88Eu0.12VO4 samples.
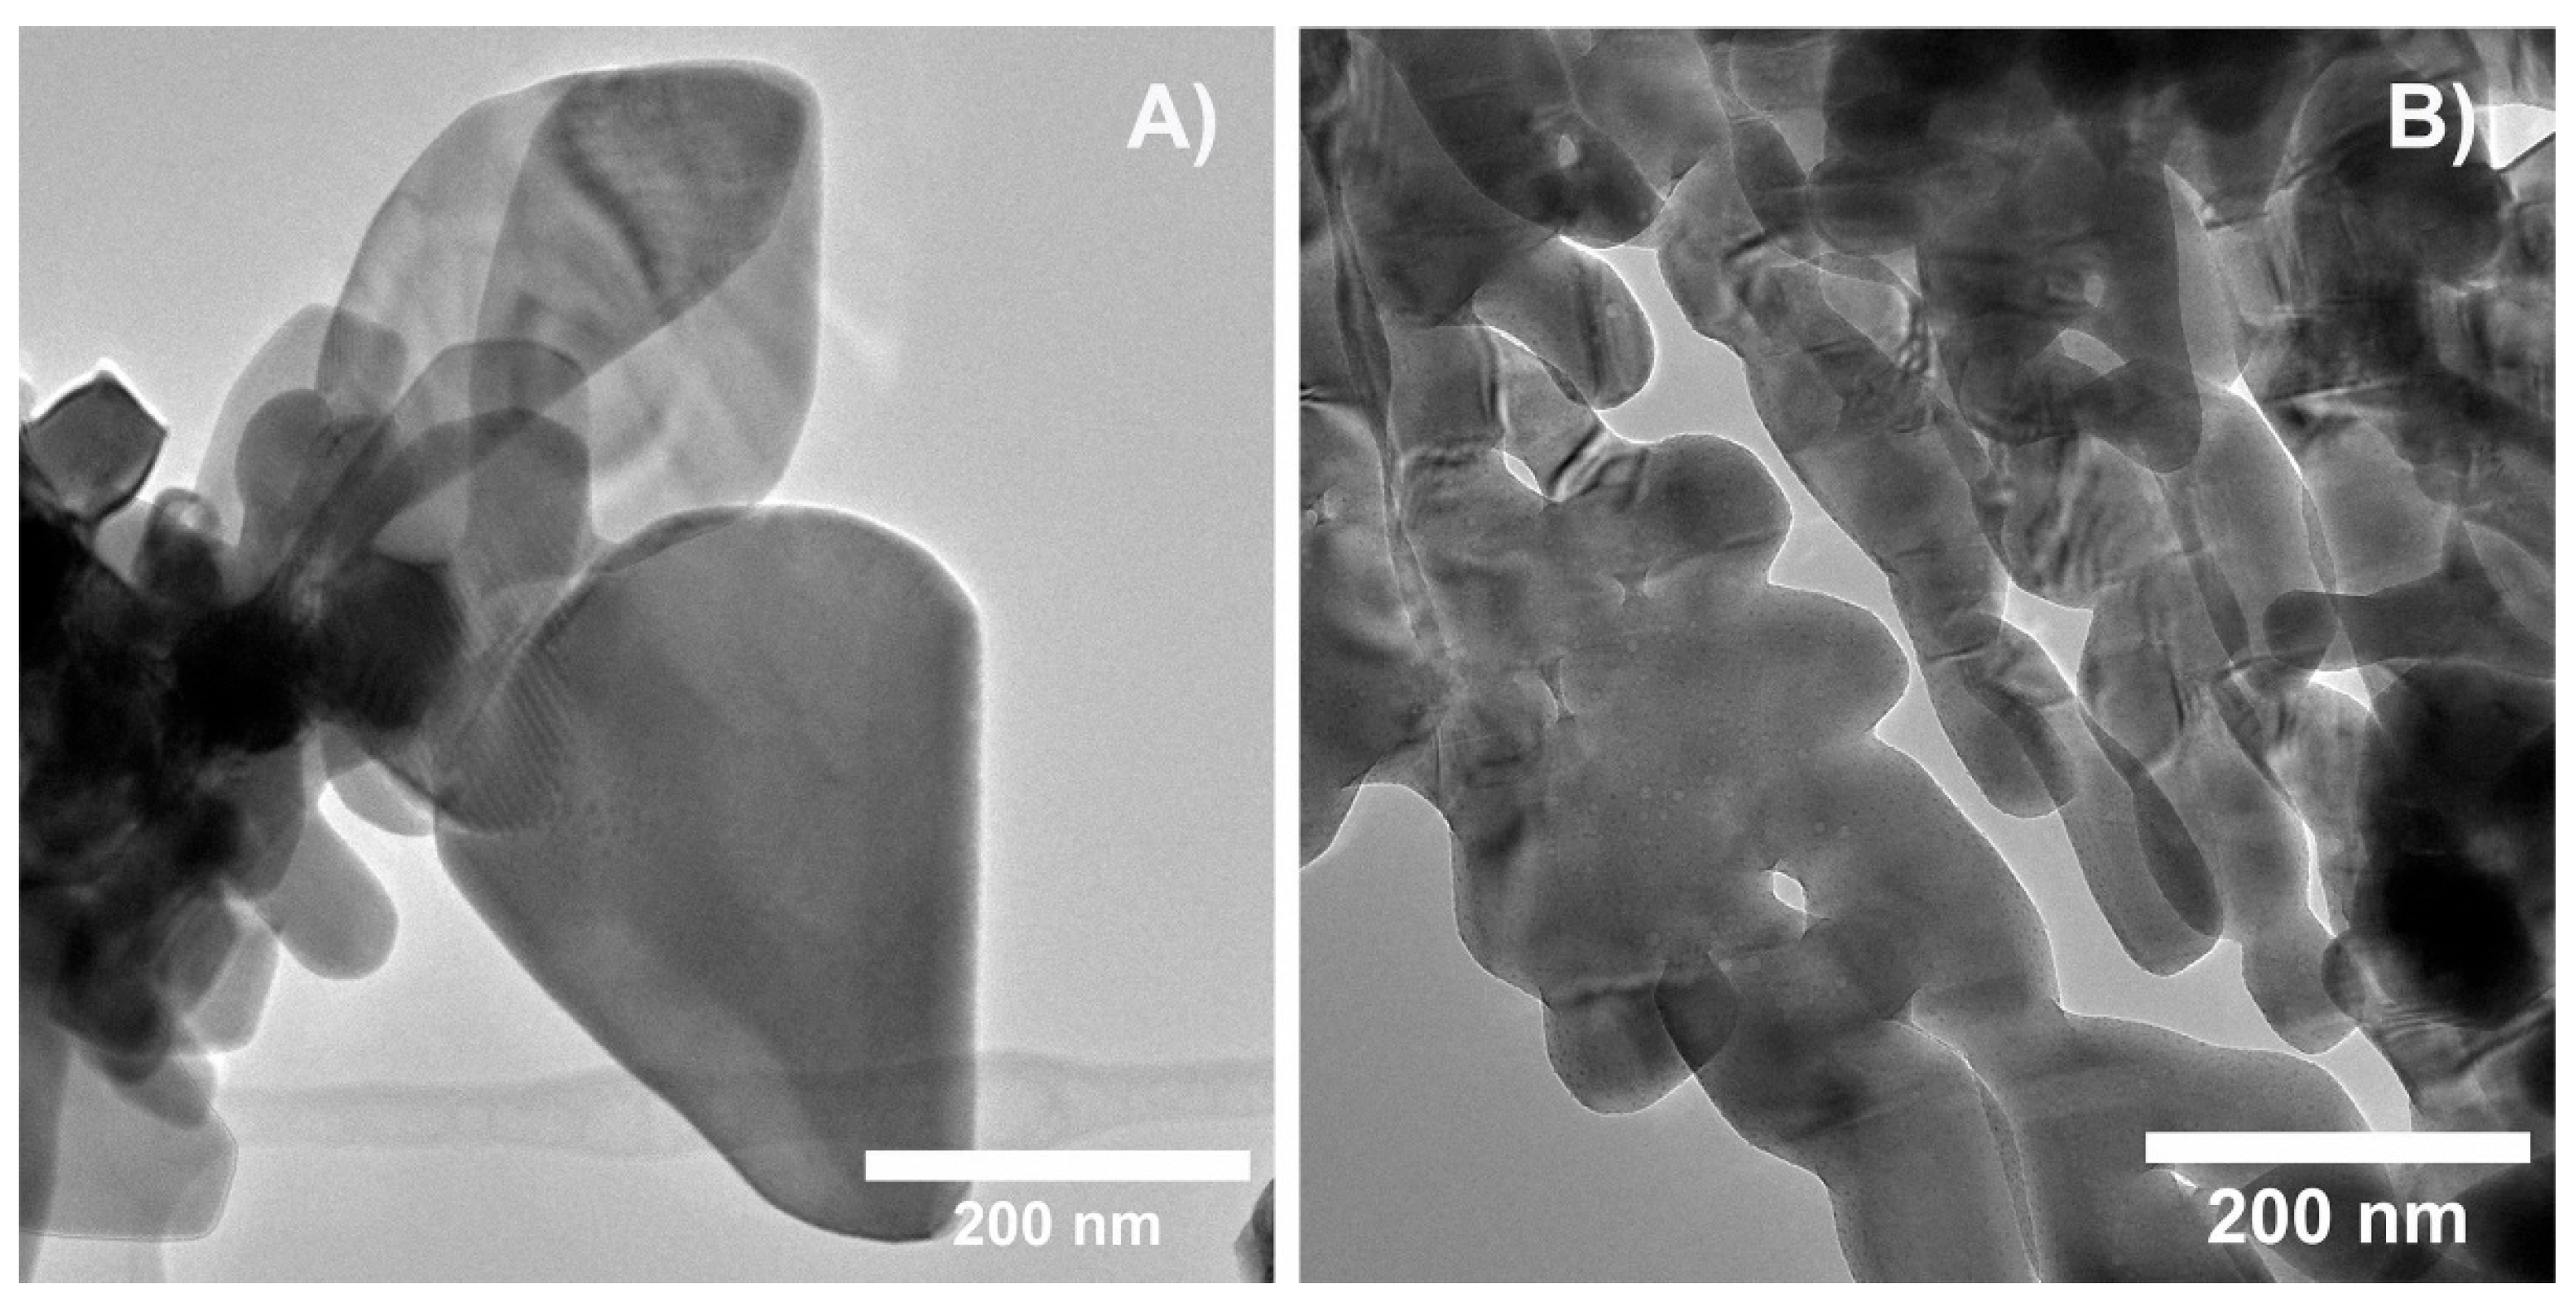
Figure 3.
FTIR spectra for the Bi1-xEuxVO4 (x = 0, 0.03, 0.06, 0.09, and 0.12) samples.
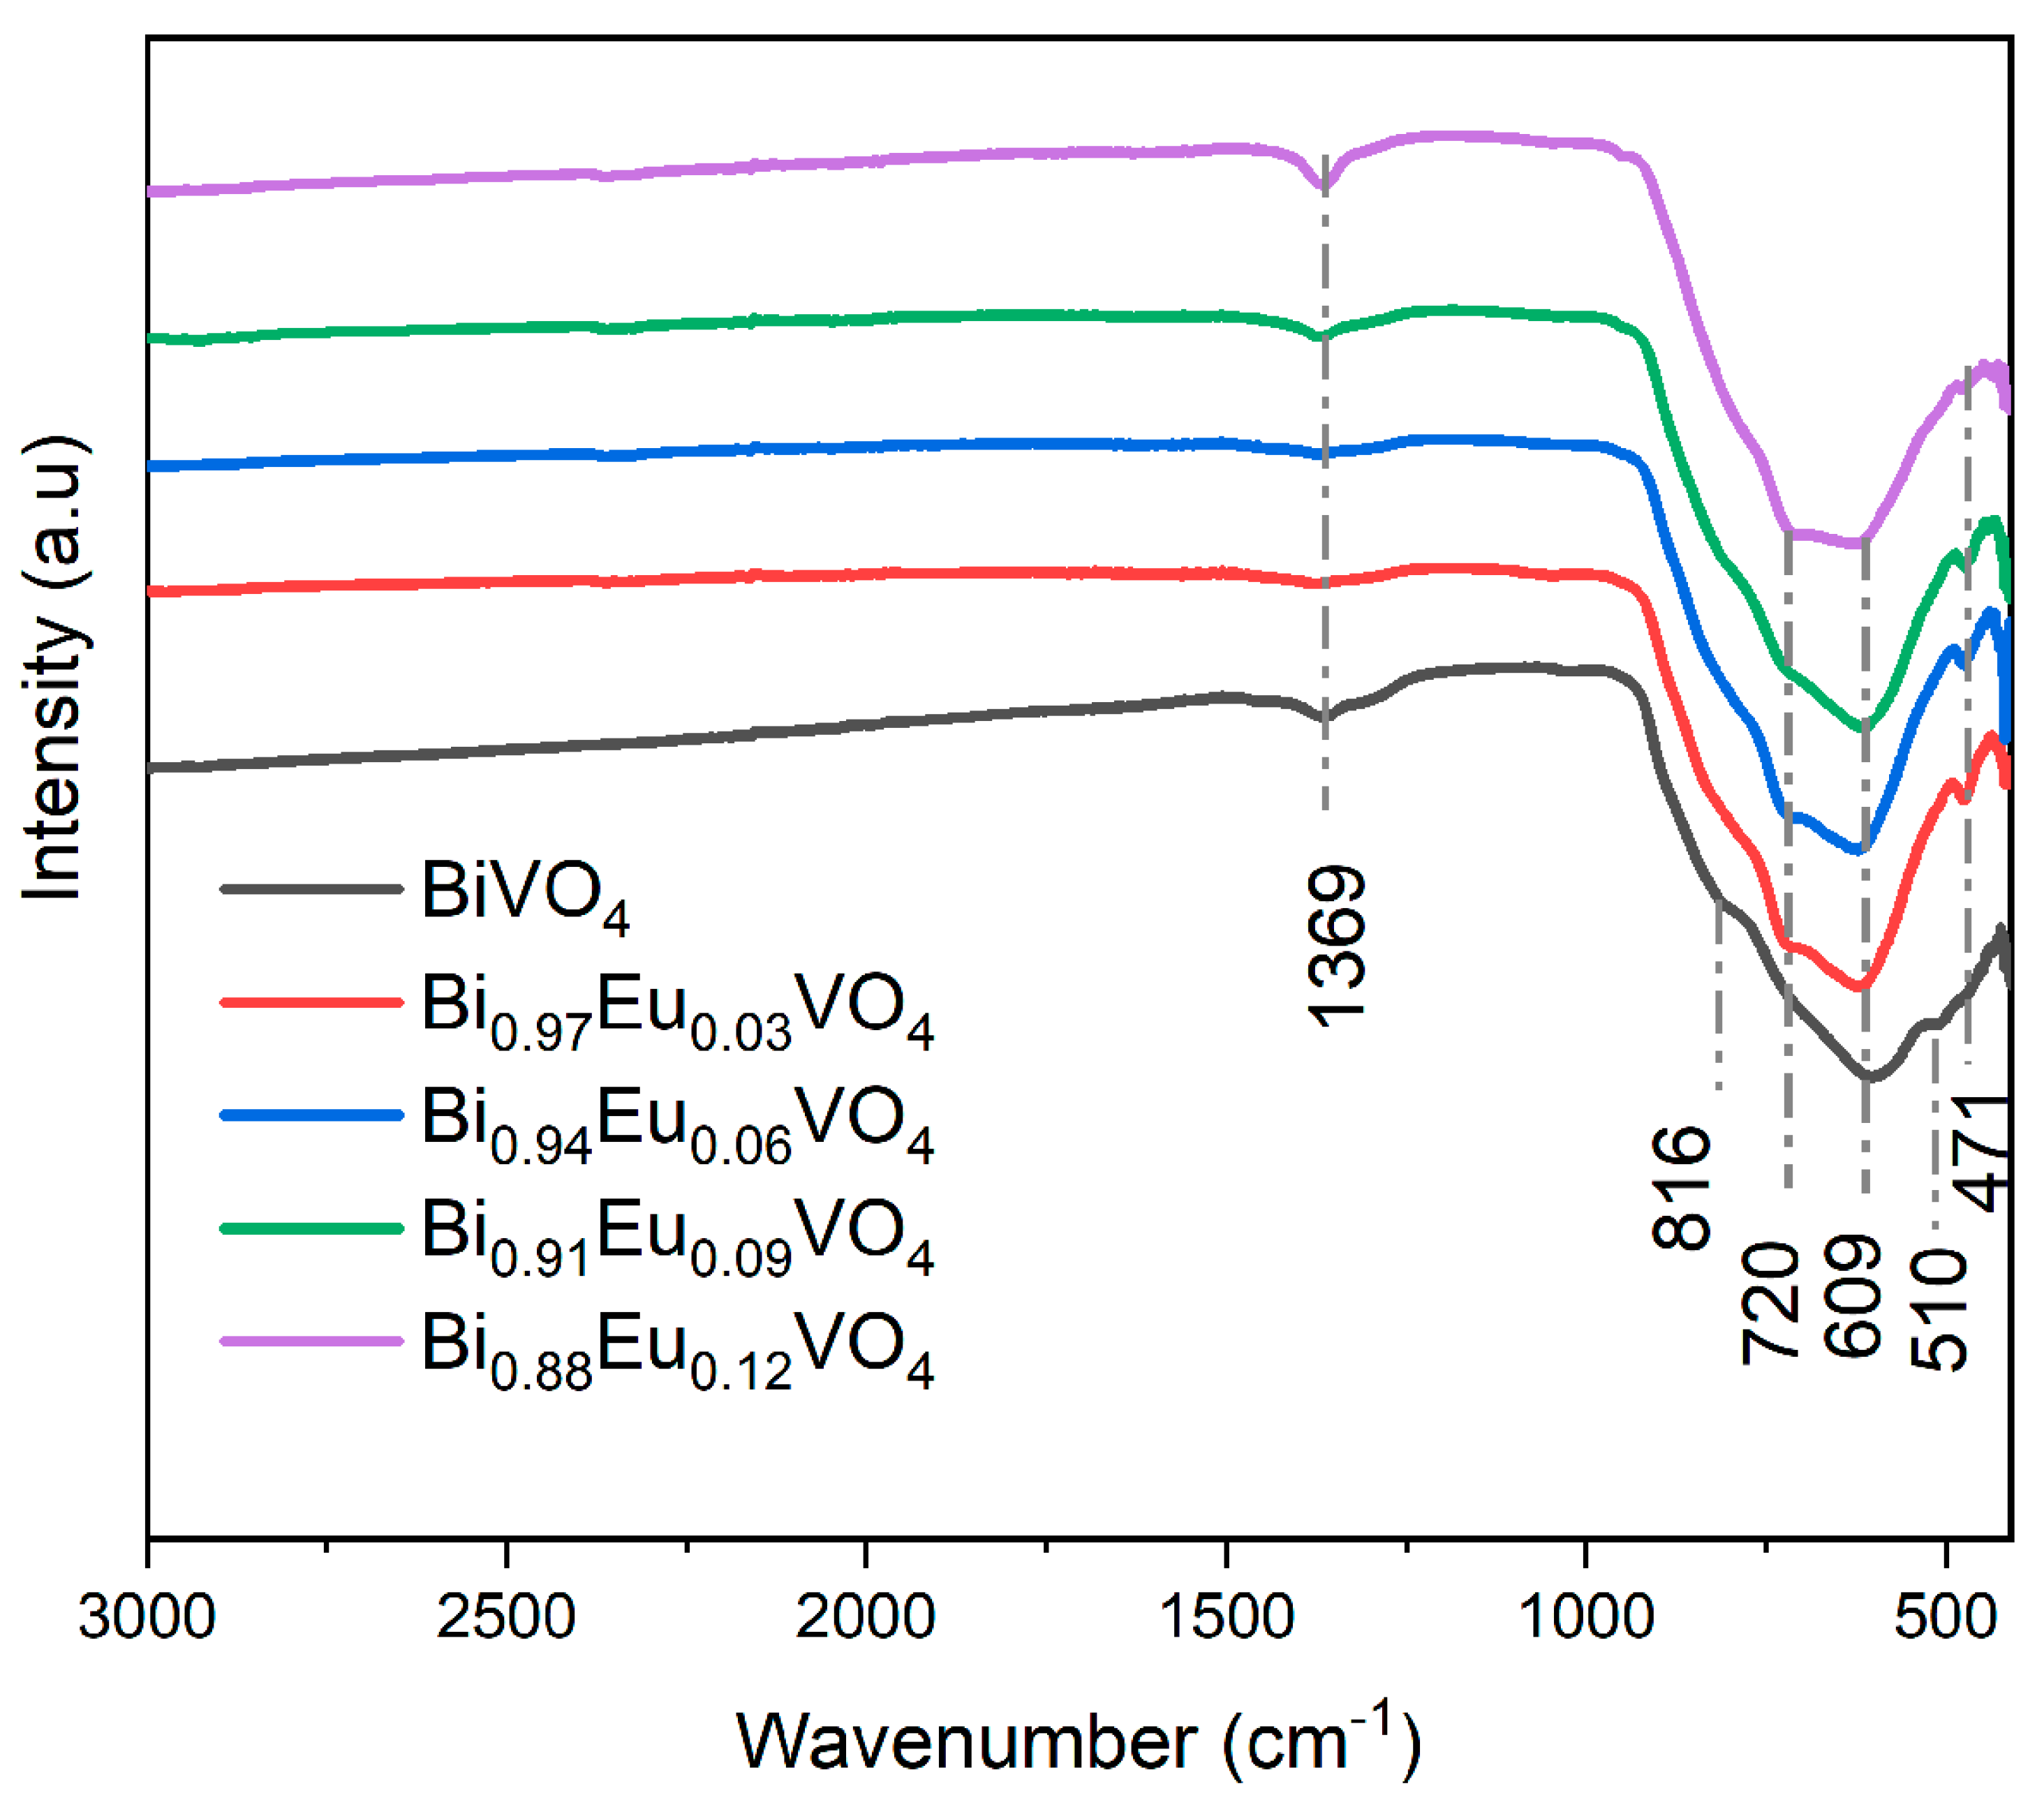
Figure 4.
a) The diffuse reflectance spectra, and b) Energy dependence of (FKM(R)hν)2 for Bi1-xEuxVO4 (x = 0, 0.03, 0.06, 0.09, and 0.12) samples.
Figure 4.
a) The diffuse reflectance spectra, and b) Energy dependence of (FKM(R)hν)2 for Bi1-xEuxVO4 (x = 0, 0.03, 0.06, 0.09, and 0.12) samples.
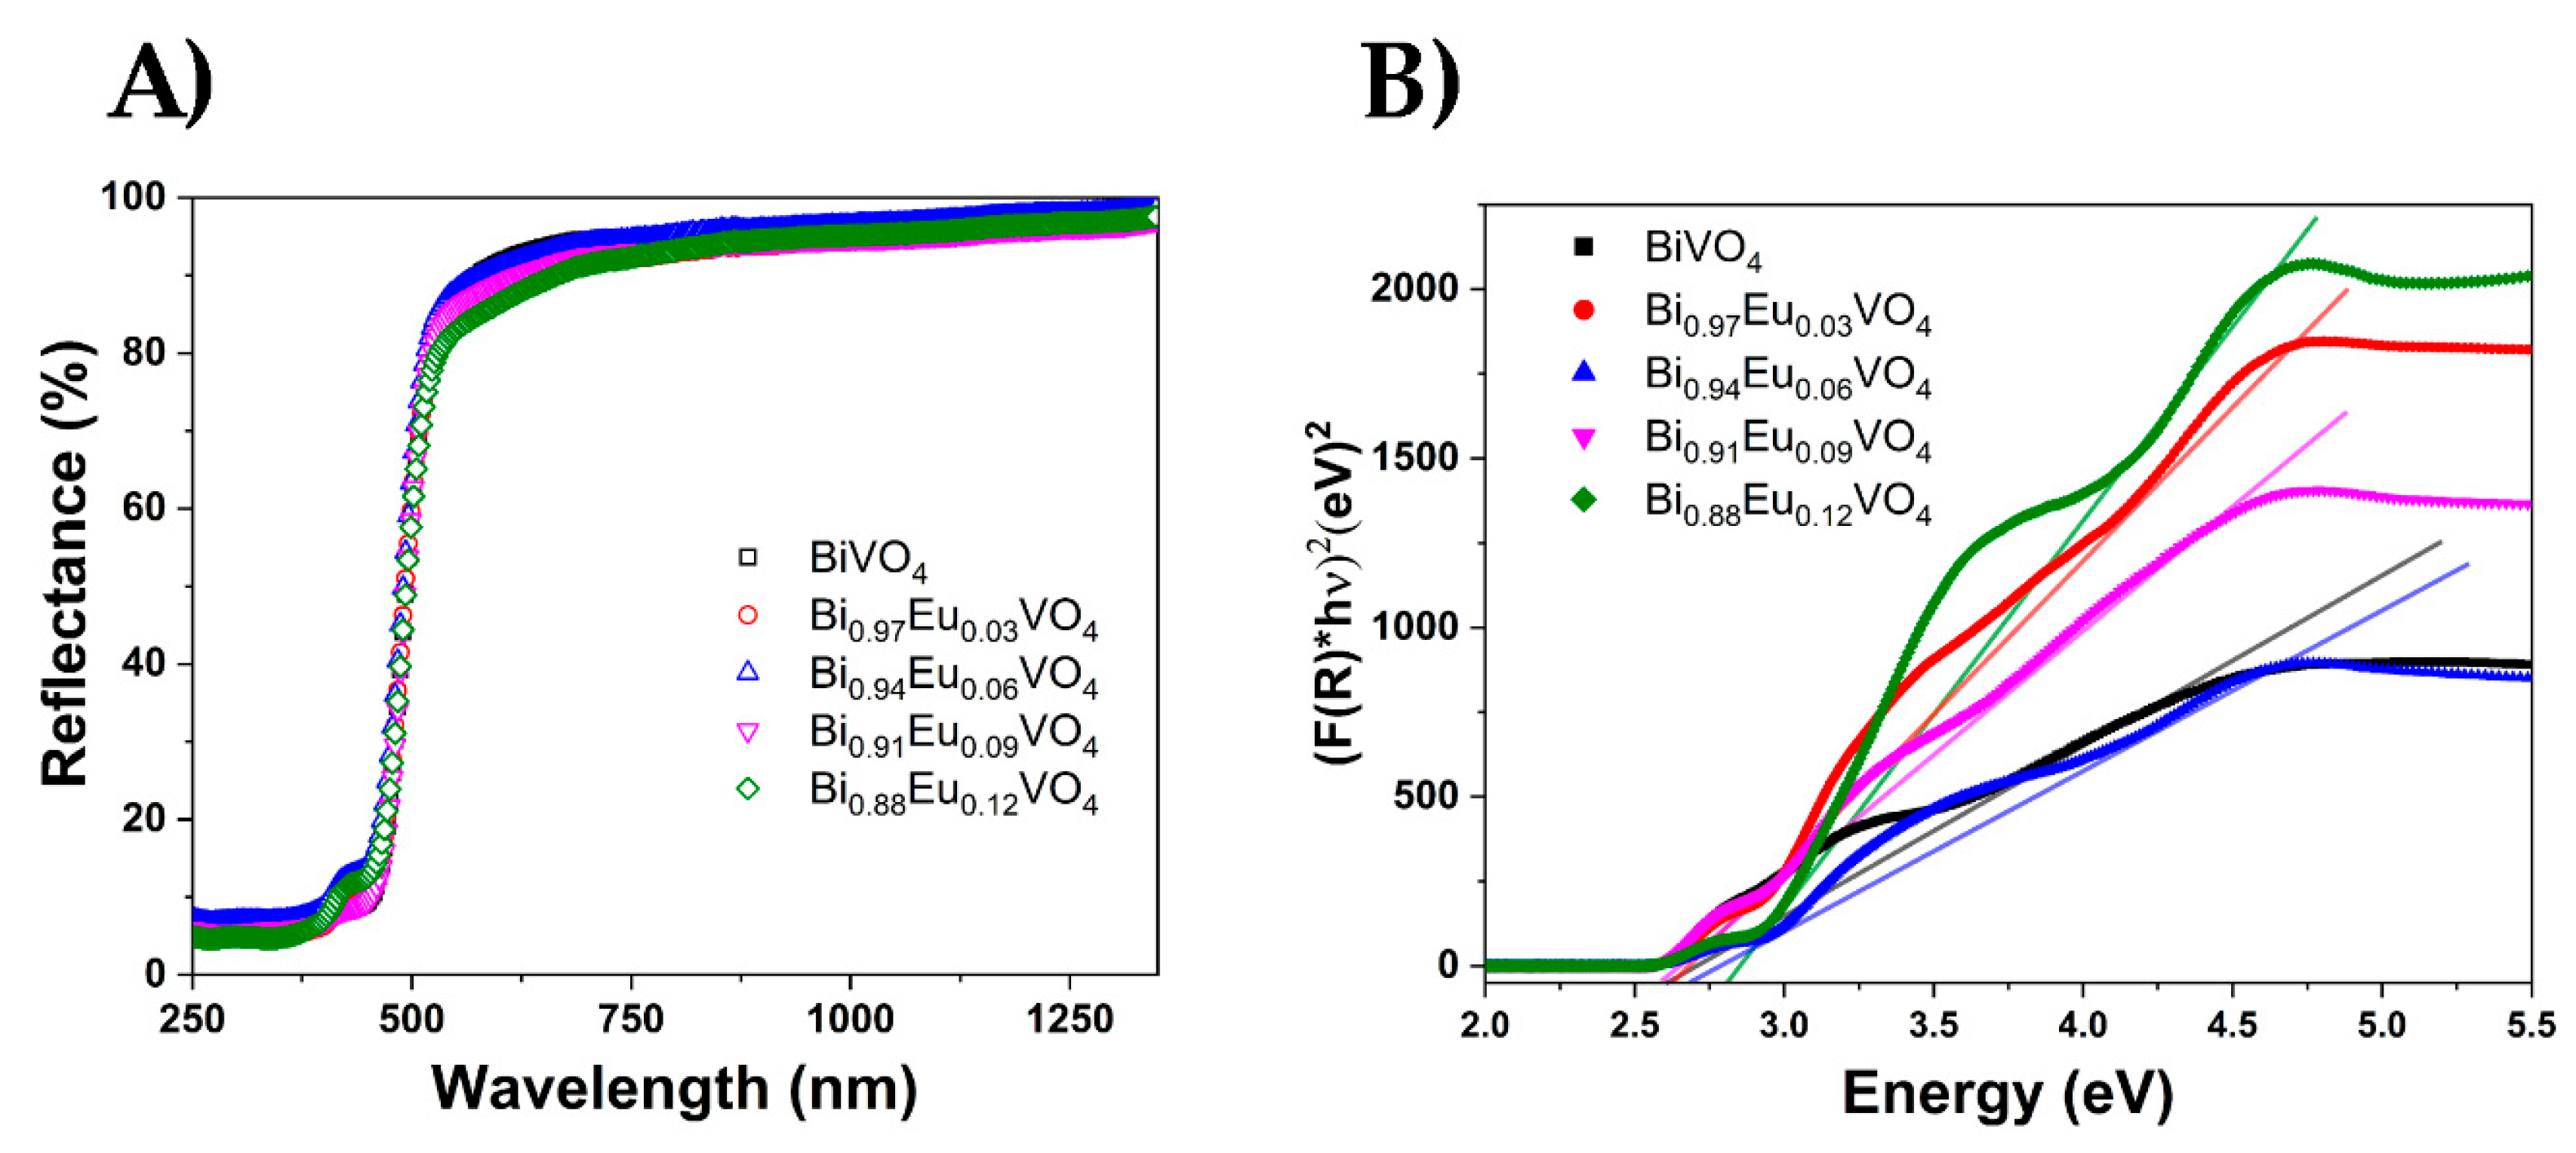
Figure 5.
Absorption spectra of Bi1-x EuxVO4 (x = 0, 0.03, 0.06, 0.09, and 0.12) powder samples.
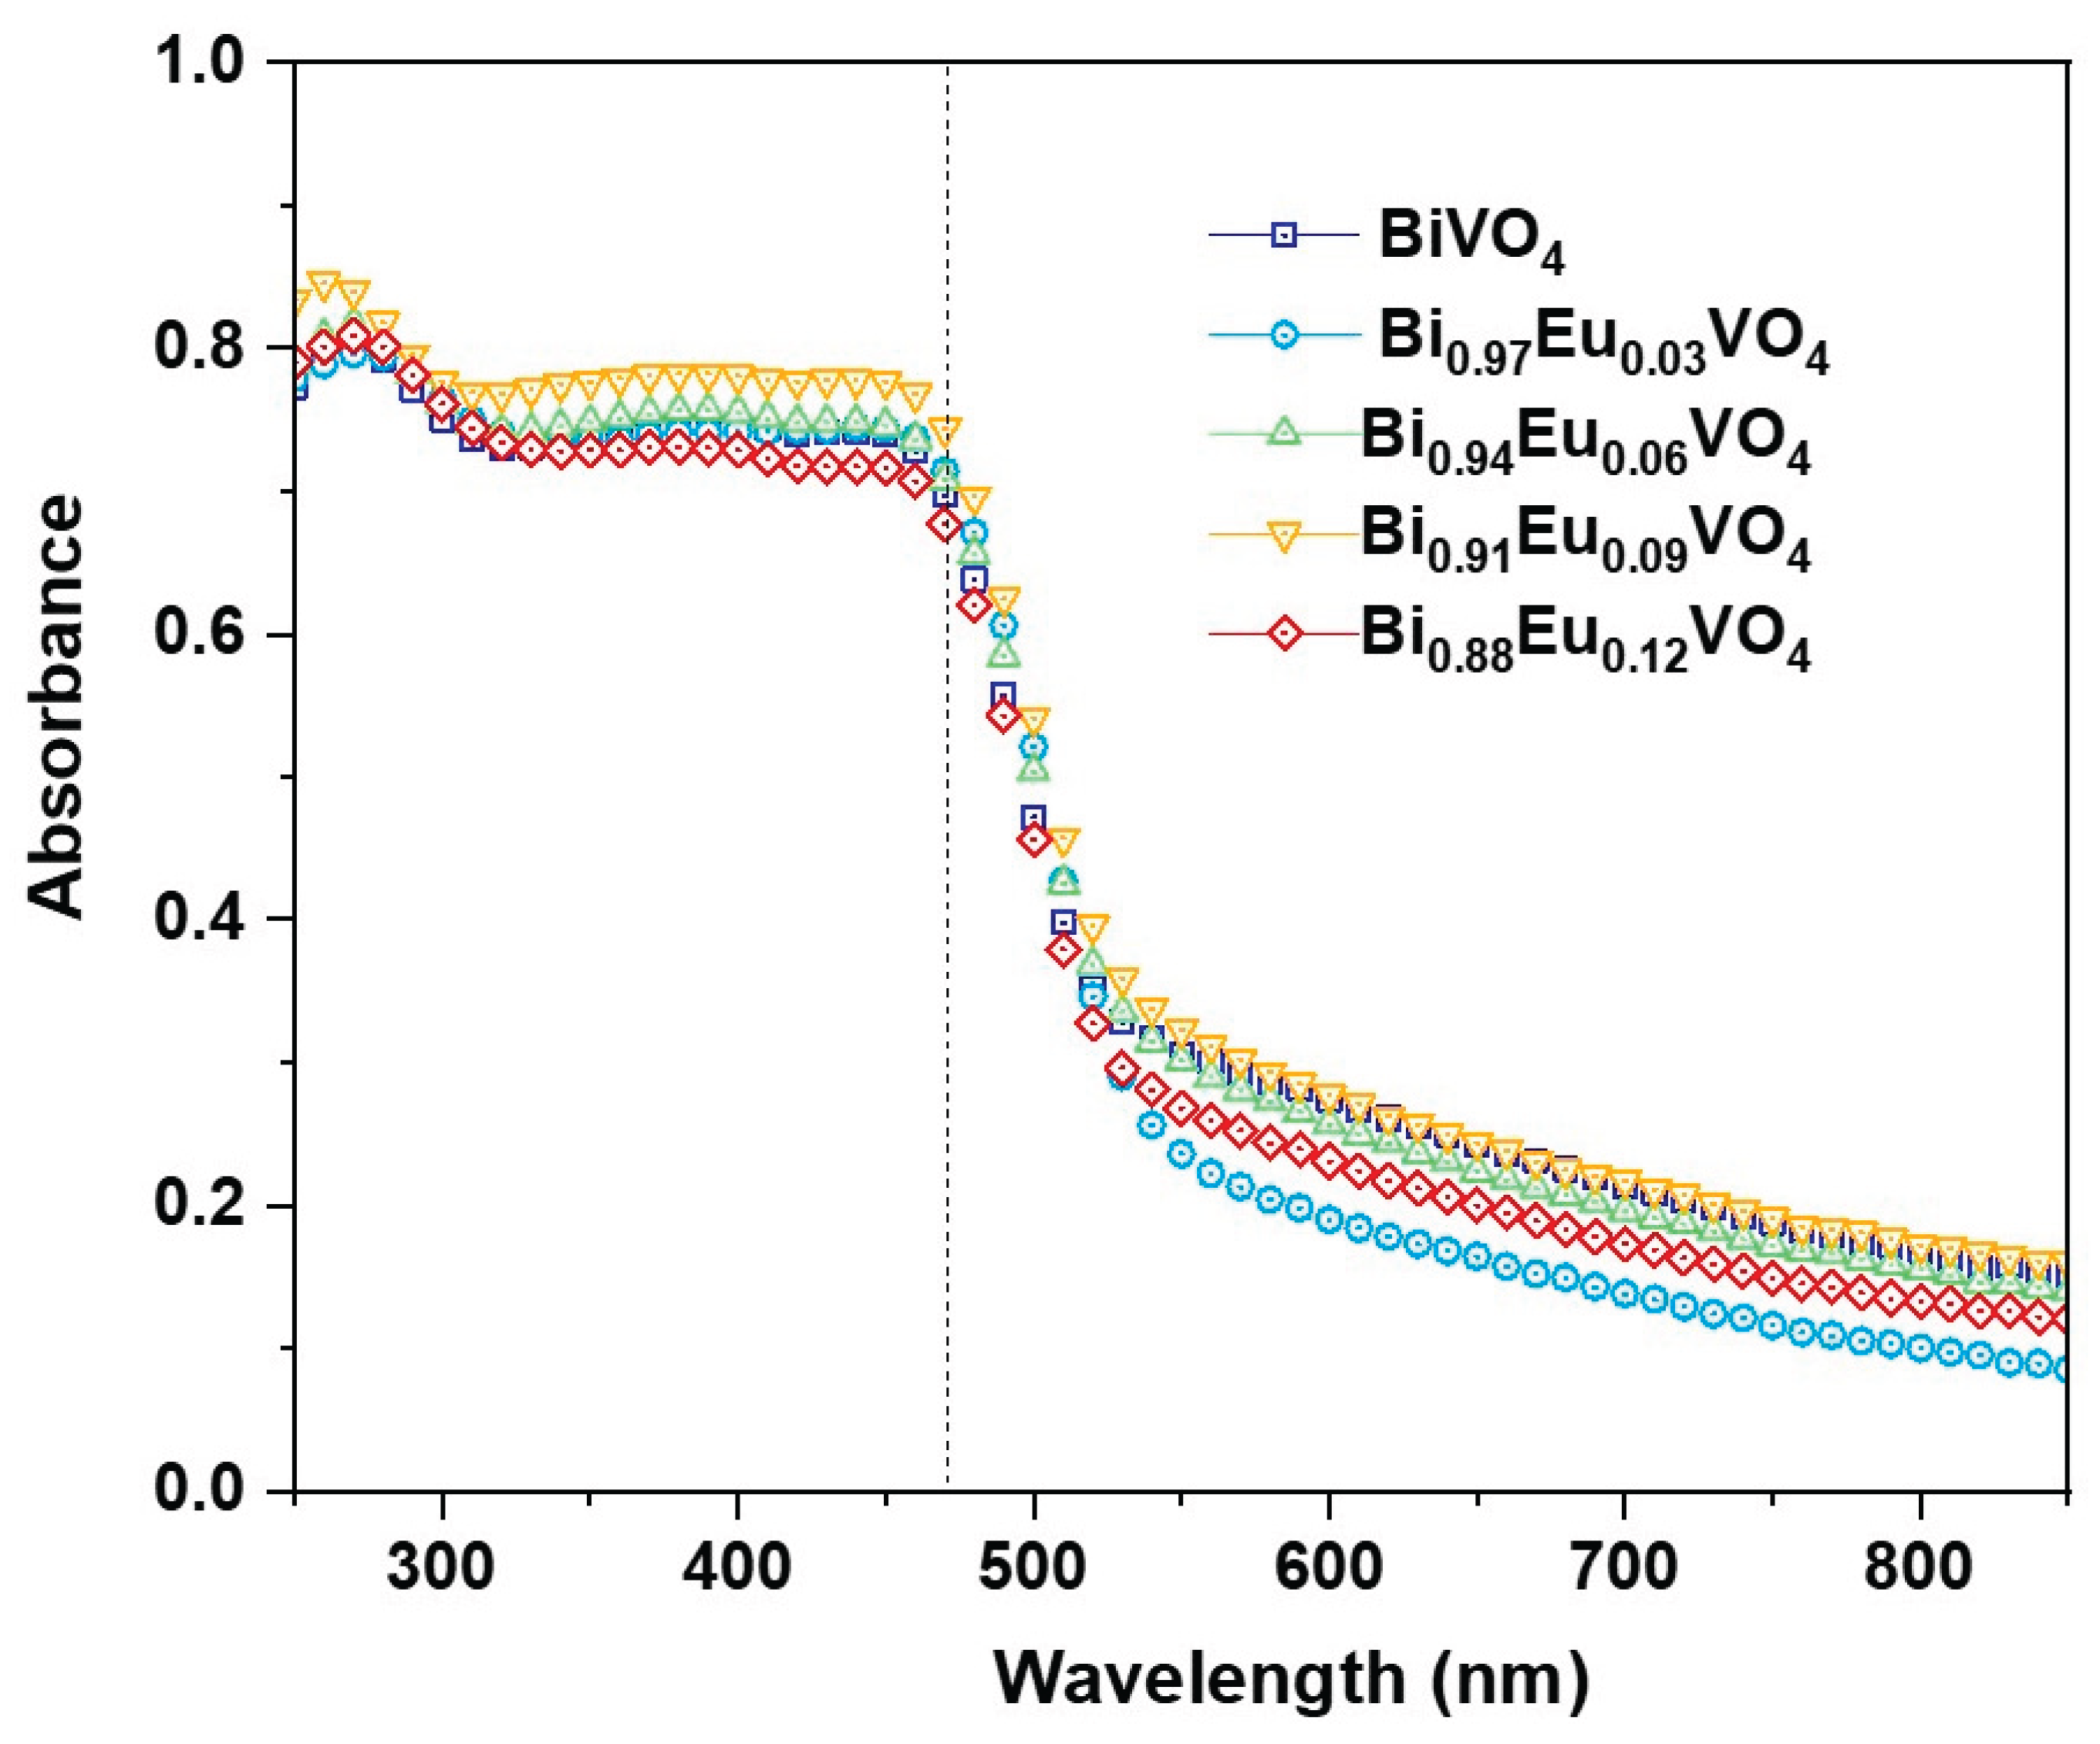
Figure 7.
(a) PL emission spectrum of Bi1-x EuxVO4 (x = 0.03,0.06,0.09,0.12) samples under 355 nm pulsed excitation. Decay curve corresponding to the 5D0→7F2 transition in case of (b) Bi0.97 Eu0.03VO4 , (c) Bi0.94 Eu0.06VO4 , (d) ) Bi0.91 Eu0.09VO4 and (e) Bi0.88 Eu0.12VO4 samples.
Figure 7.
(a) PL emission spectrum of Bi1-x EuxVO4 (x = 0.03,0.06,0.09,0.12) samples under 355 nm pulsed excitation. Decay curve corresponding to the 5D0→7F2 transition in case of (b) Bi0.97 Eu0.03VO4 , (c) Bi0.94 Eu0.06VO4 , (d) ) Bi0.91 Eu0.09VO4 and (e) Bi0.88 Eu0.12VO4 samples.
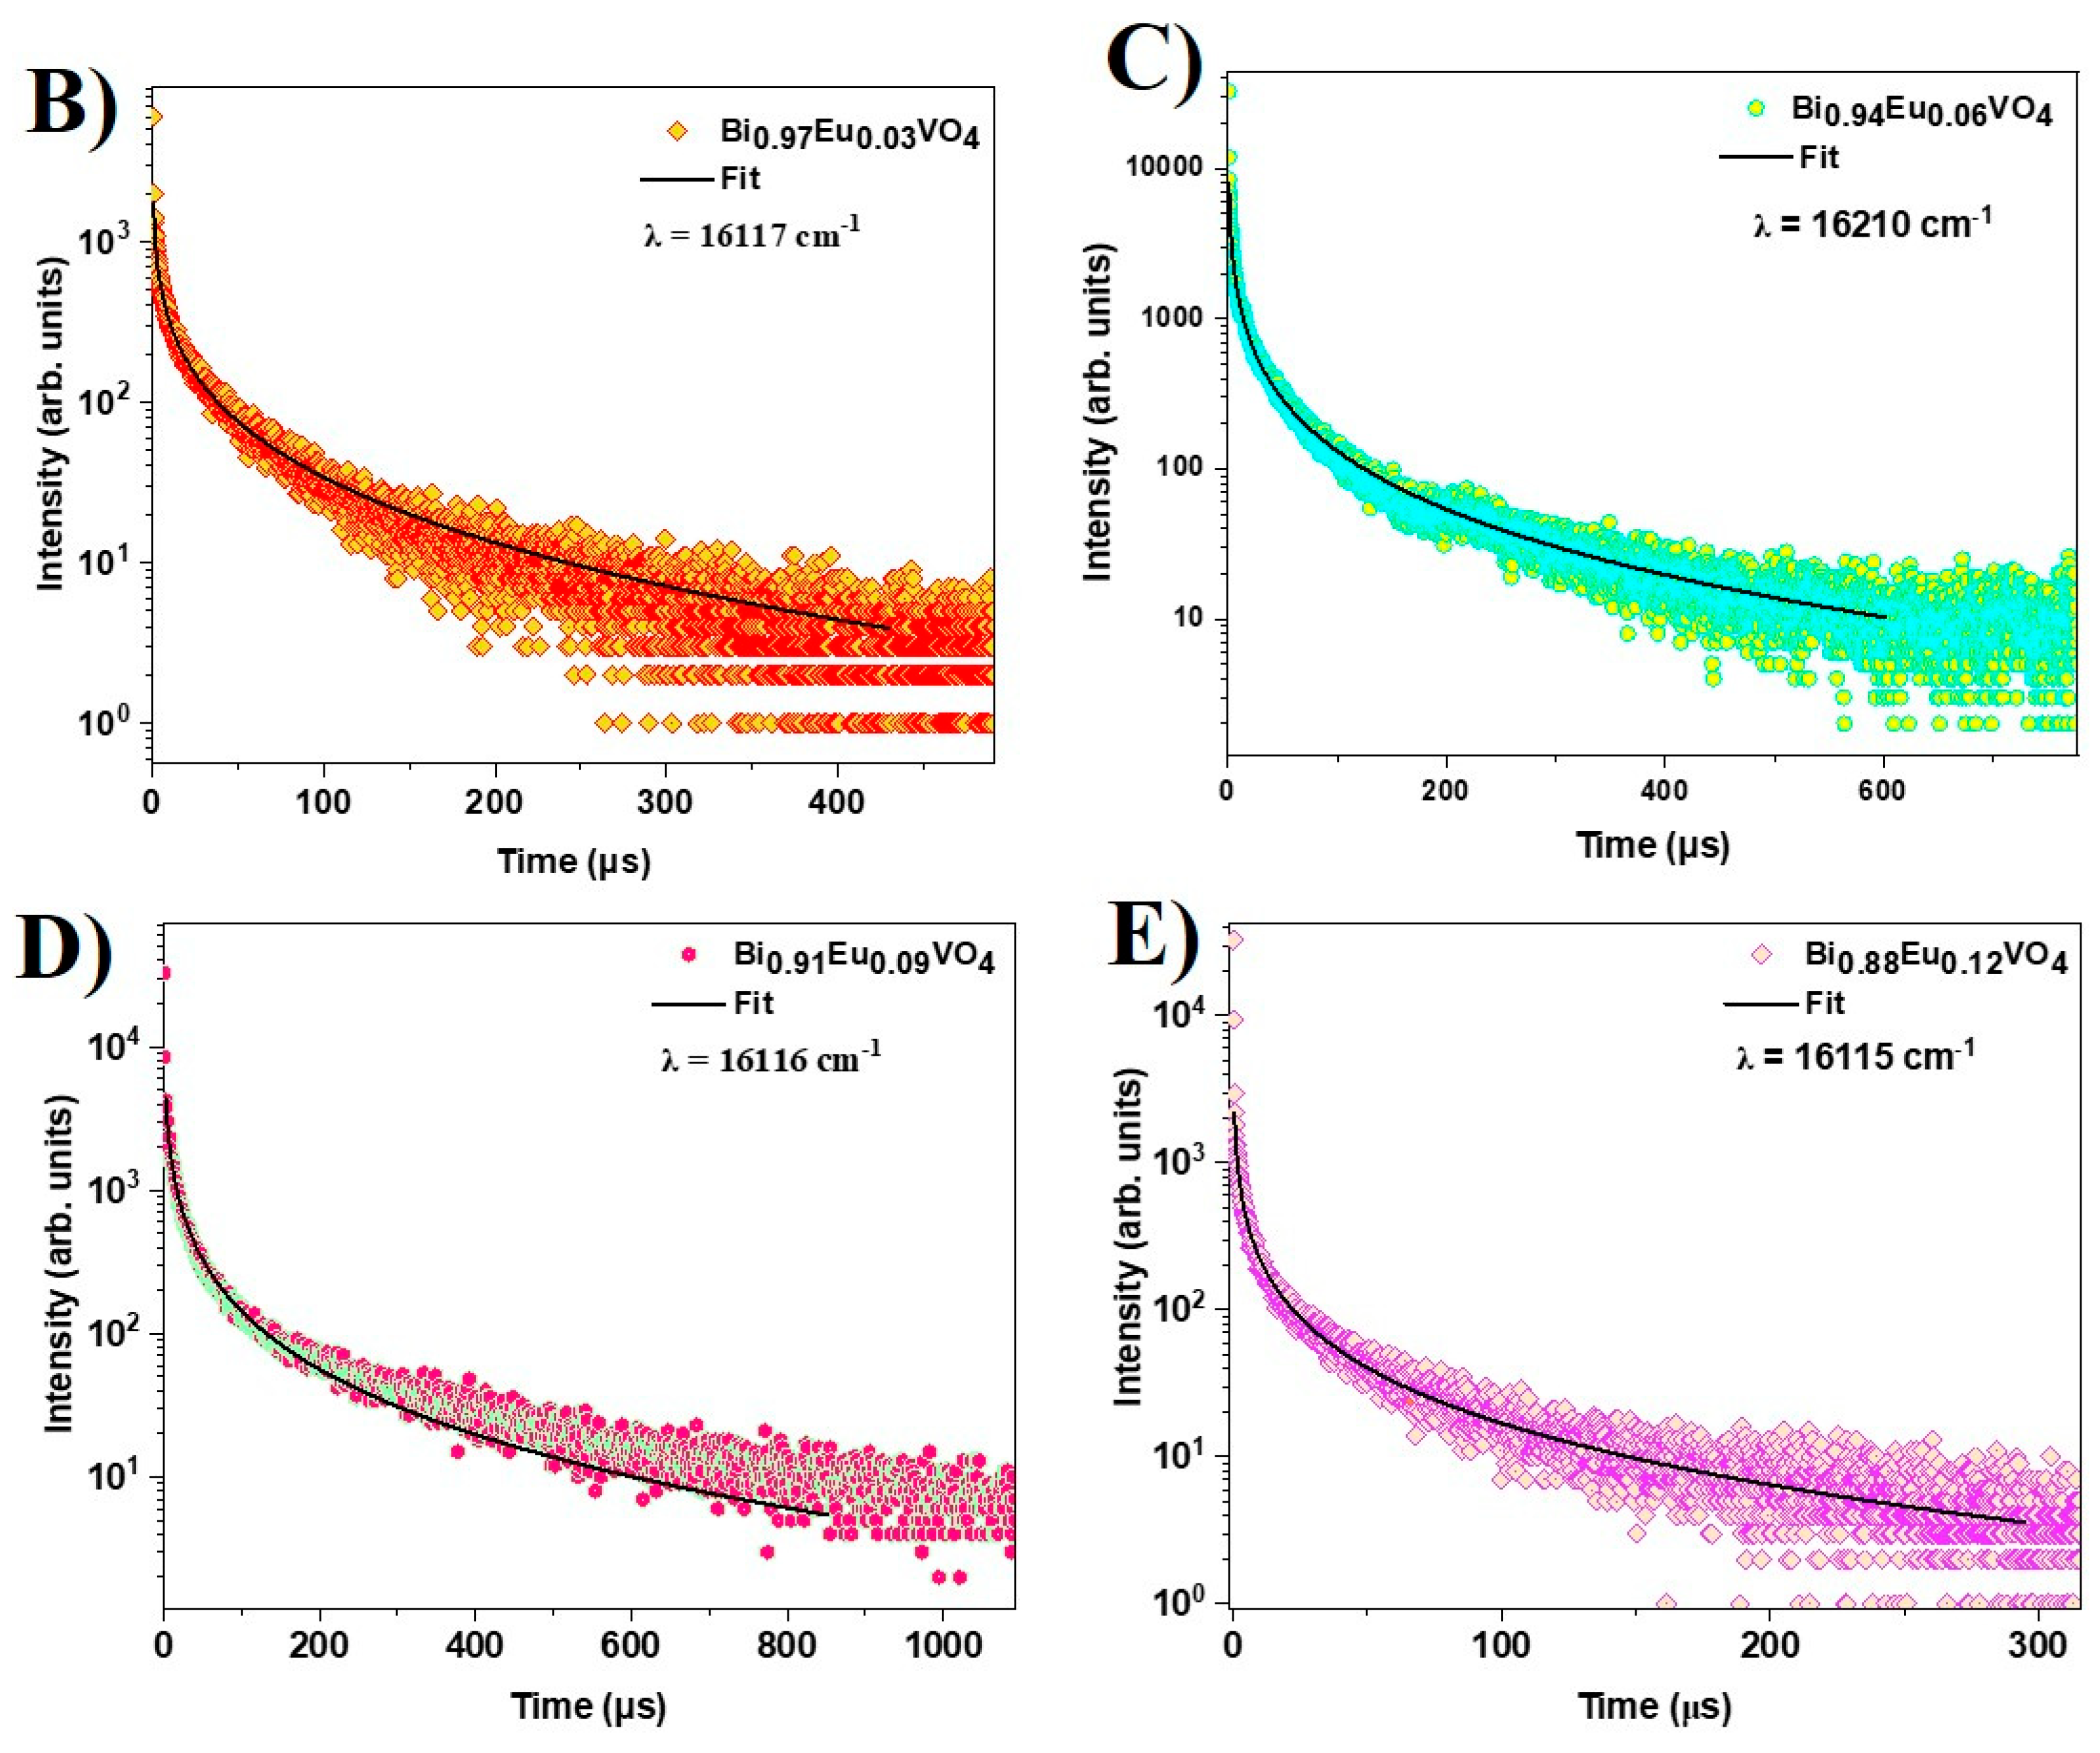
Figure 8.
(a) Raman spectra of Bi1-x EuxVO4 (x = 0.0, 0.03, 0.06, 0.09, and 0.12) samples. For more clarity, the zoomed-in views of the spectra are shown as (b) and (c).
Figure 8.
(a) Raman spectra of Bi1-x EuxVO4 (x = 0.0, 0.03, 0.06, 0.09, and 0.12) samples. For more clarity, the zoomed-in views of the spectra are shown as (b) and (c).
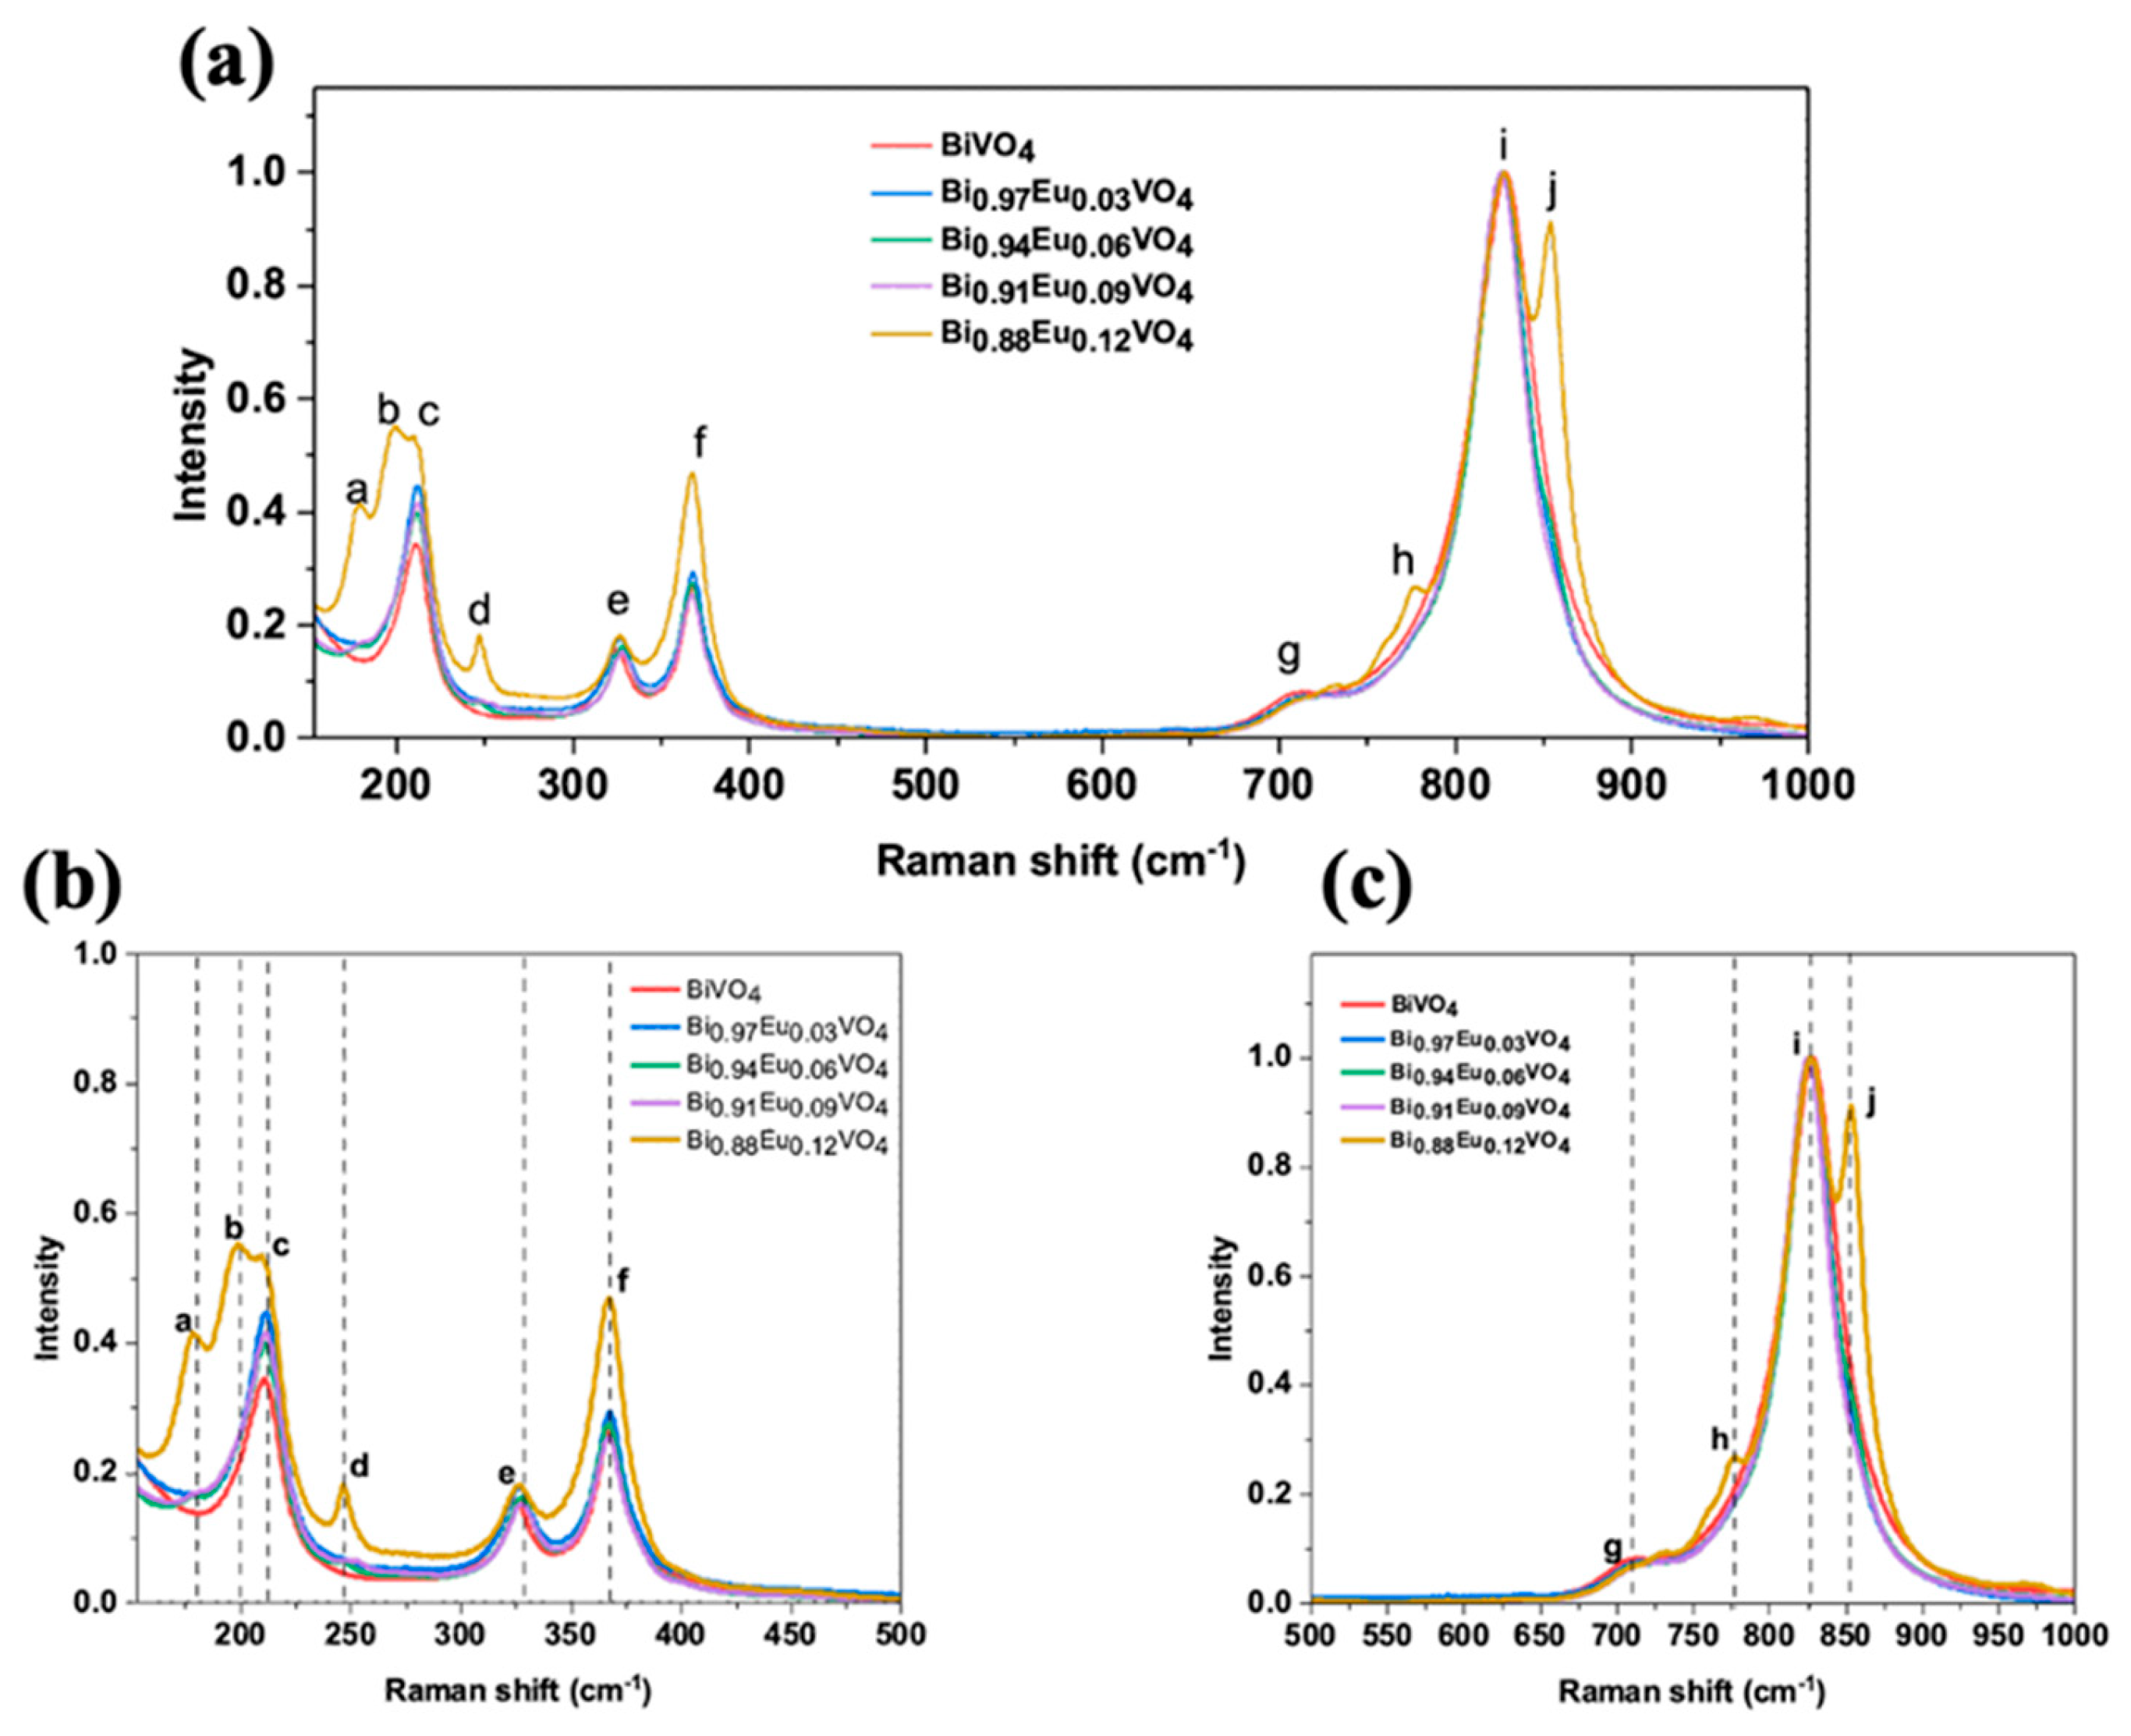
Figure 9.
UV-Vis absorption spectra over irradiation time of photocatalytic degradation of 5 ppm RhB in the presence of 40 mg of: (A) BiVO4, (C) Bi0.97Eu0.03VO4, (D) Bi0.94Eu0.06VO4, (E) Bi0.91Eu0.09VO4, and (F) Bi0.88Eu0.12VO4. photocatalyst and B) the corresponding photocatalytic degradation rate curves for blank dye (RhB) and all microwave-synthesized Bi1-xEuxVO4 (x=0, 0.03, 0.06, 0.09, 0.12) photocatalysts.
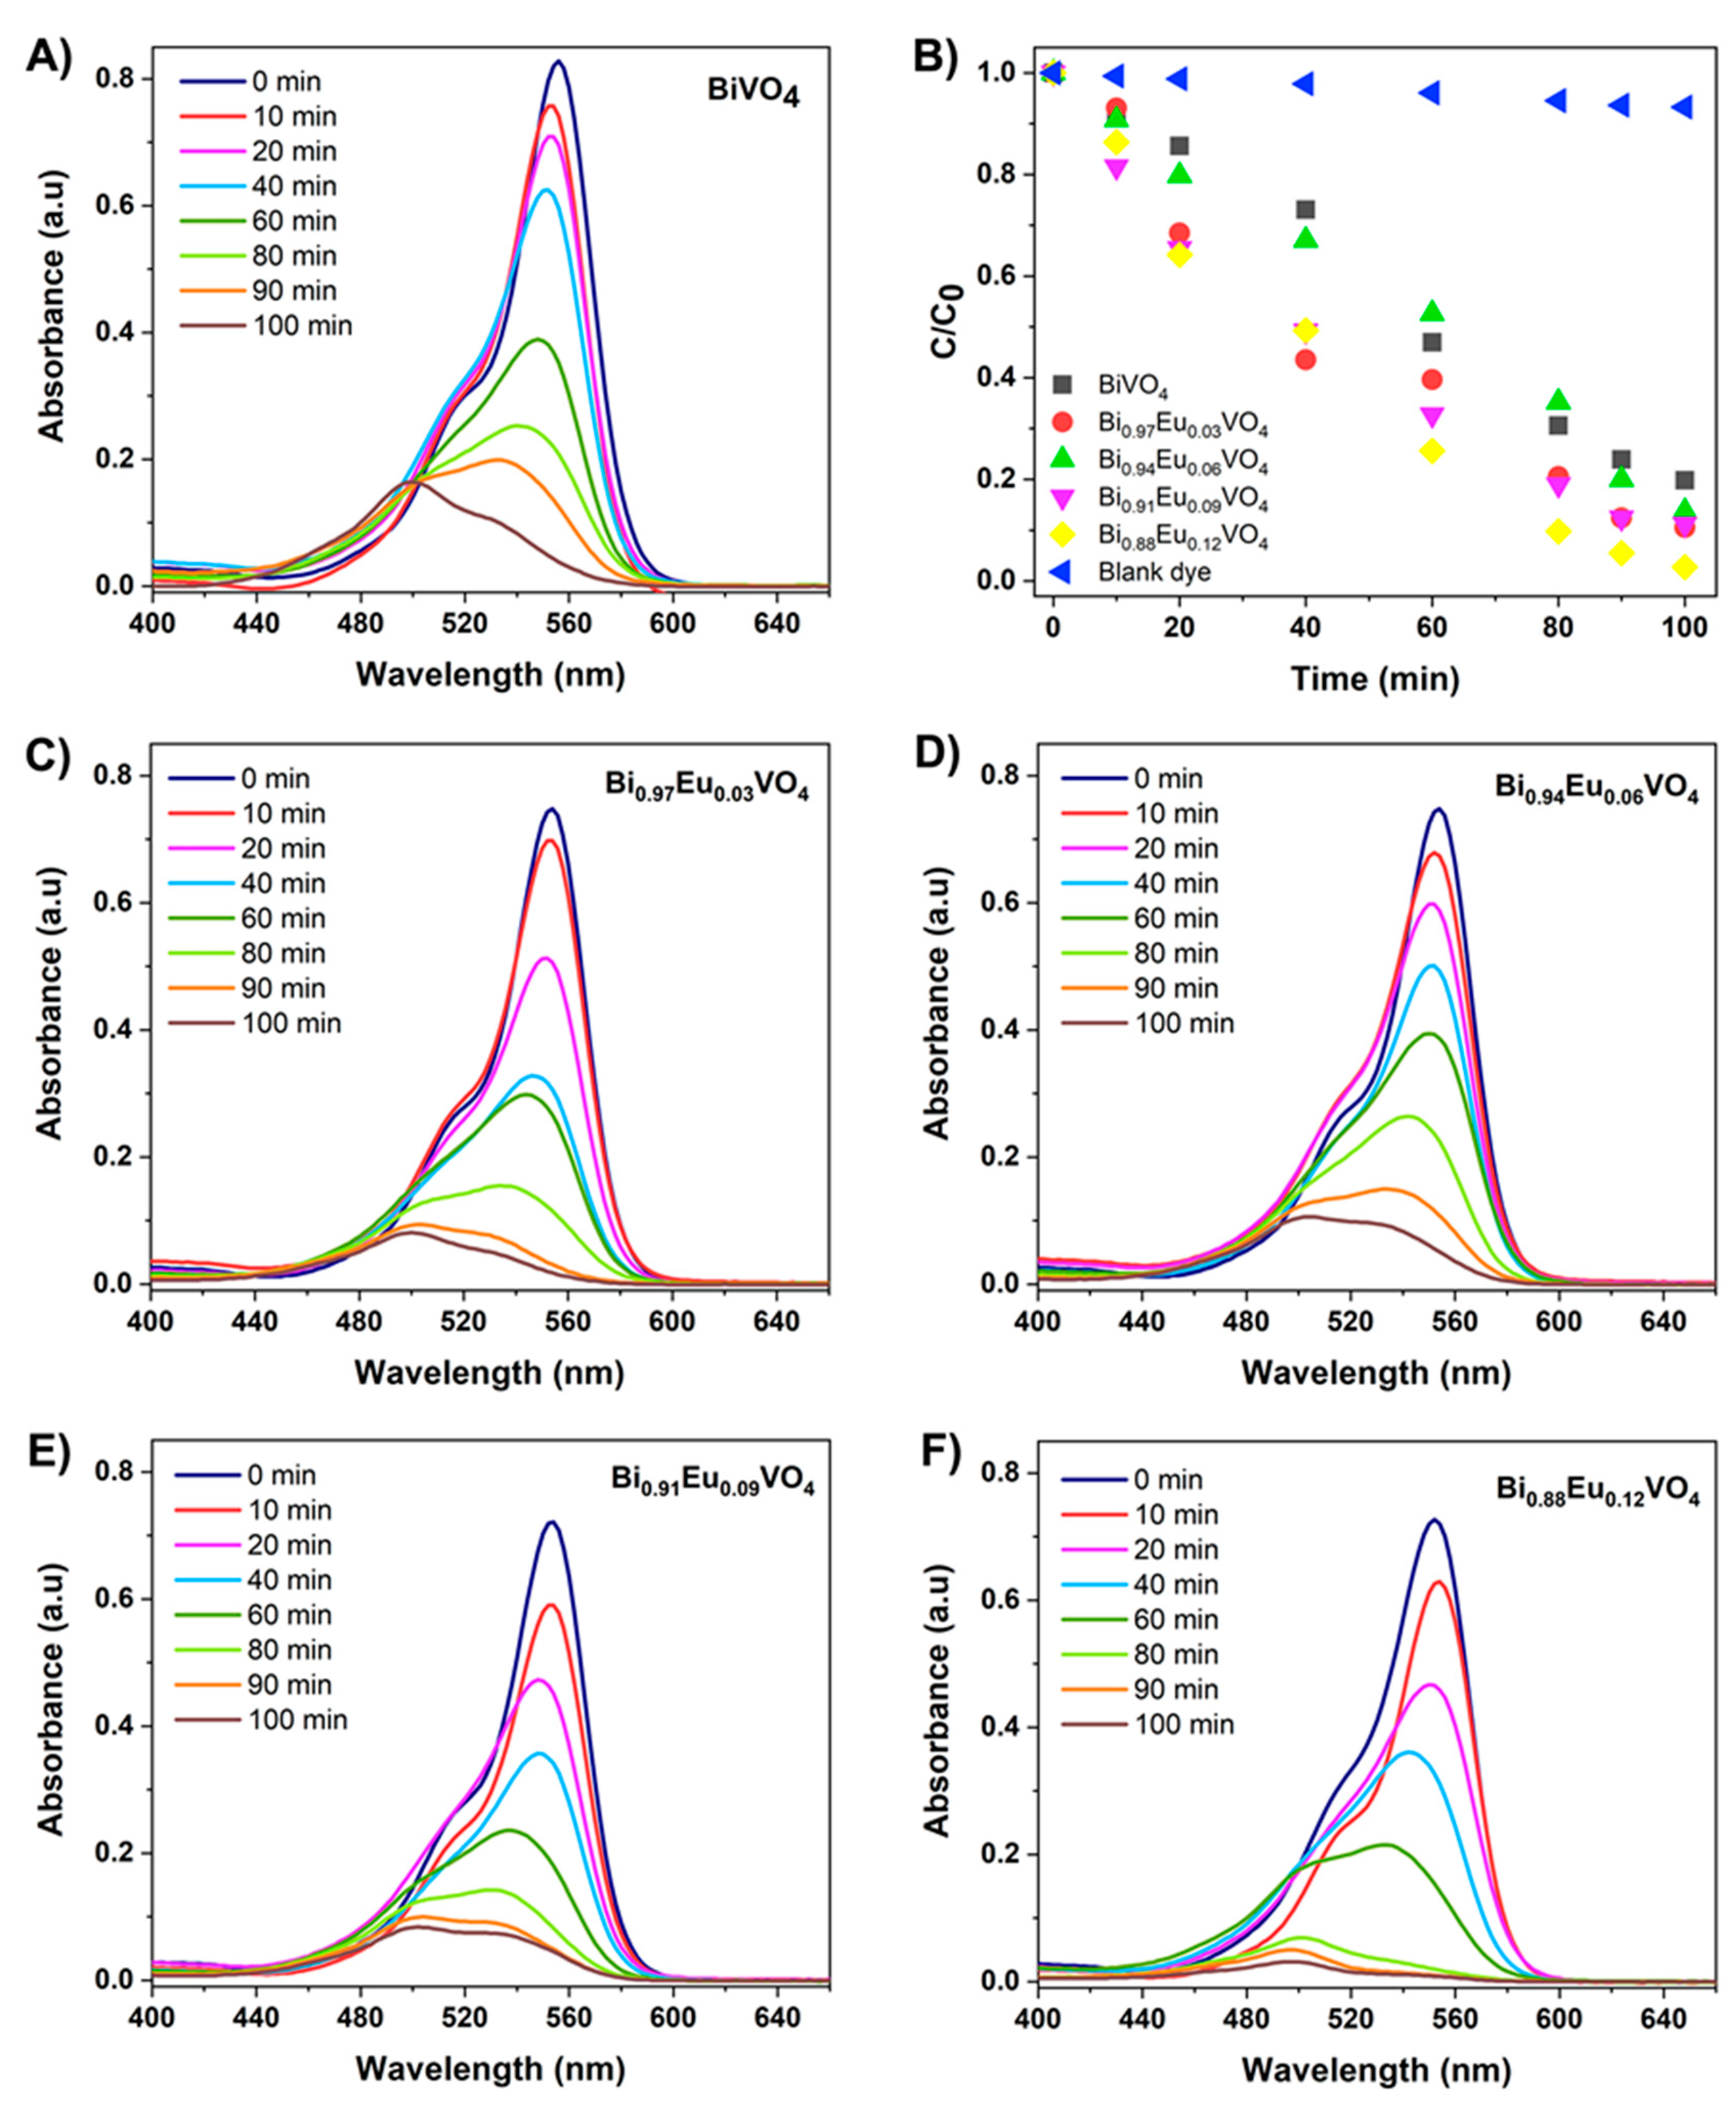

Table 1.
Recorded fluorescence decays corresponding to the 5D0→7F2 transition for Bi1-x EuxVO4 (x = 0.03, 0.06, 0.09, 0.12) samples under 355 nm pulsed excitation.
Table 1.
Recorded fluorescence decays corresponding to the 5D0→7F2 transition for Bi1-x EuxVO4 (x = 0.03, 0.06, 0.09, 0.12) samples under 355 nm pulsed excitation.
| 1. Sample | 2. Lifetime [ns] |
| 3. Bi0.97Eu0.03VO4 | 4. 80 |
| 5. Bi0.94Eu0.06VO4 | 6. <10 |
| 7. Bi0.91Eu0.09VO4 | 8. <10 |
| 9. Bi0.88Eu0.12VO4 | 10. <10 |
Table 2.
Raman peak positions and vibrational mode assignments in Bi₁₋ₓEuₓVO₄ samples, showing contributions from monoclinic (ms) and tetragonal (tz) phases.
Table 2.
Raman peak positions and vibrational mode assignments in Bi₁₋ₓEuₓVO₄ samples, showing contributions from monoclinic (ms) and tetragonal (tz) phases.
| Wavelength [cm-1] | Description | Attribution |
| (a) 179 | External lattice mode | ms -BiVO4 distorsions |
| (b) 197 | External lattice mode | ms -BiVO4 distorsions |
| (c) 211 | External lattice mode | ms/tz-BiVO4 |
| (d) 247 | Bi–O stretching mode | tz-BiVO4 |
| (e) 327 | symmetric bending mode of VO43 | ms/tz-BiVO4 |
| (f) 367 | asymmetric bending mode of VO43 | ms/tz-BiVO4 |
| (g) 708 | asymmetric stretching mode of V-O bond |
ms-BiVO4 |
| (h) 778 | antisymmetric stretching mode V-O bond |
tz-BiVO4 |
| (i) 829 | symmetric stretching mode of V-O | ms-BiVO4 |
| (i) 854 | symmetric stretching mode V-O bond | tz-BiVO4 |
Table 3.
Literature comparison of formation of ms- or tz- crystalline phase, luminescent and photocatalytic properties of Bi1-xEuxVO4 samples with results of this work.
Table 3.
Literature comparison of formation of ms- or tz- crystalline phase, luminescent and photocatalytic properties of Bi1-xEuxVO4 samples with results of this work.
|
Sample/ Method of synthesis |
xEu3+ x = conc.(Eu3+) (mmol) |
Crystalline phase |
Luminescent and photocatalytic properties |
Ref. |
| Eu3+-uniformly doped BiVO4 NPs * |
x = 0.0-0.5 | ms |
5D0→7F0,1,2,3,4 PL quenched; cutoff edge 530 nm and ~518 nm. |
|
| x = 0.6-0.9 | mixture ms-tz |
Blue-shift appears of the absorption edges. |
[66] | |
| x = 0.9-1.0 | tz | 5D0→7F0,1,2,3,4 PL observed; Blue-shift appears of the absorption edges. | ||
| Eu3+-surface- localized BiVO4 NPs |
x = 0~0.6 |
ms | Enhanced Eu3+-PL and improved photocatalysis. | [66] |
|
BixEu1-xVO4 |
0<x<0.60 | tz | DRS: The broad bands attributed to charge transfer processes; The sharp peaks are ascribed to intra-configurational 4f – 4f transitions of the Eu3+ ion in BixEu1−xVO4. |
[67] |
| 0.94<x<1 | ms | |||
| EuVO4–BiVO4 | 0.35<x<0.70 | tz | - | [68] |
| 0.75<x<0.90 | mixture ms-tz | - | ||
| Eu1−xBixVO4/P | x = 0.05 | tz | PL: The energy transfer and modifying the lifetime of the electron/hole pair formation of the Eu1−xBixVO4; Higher photocatalytic degradation efficiency of MB compared to the undoped material. | [47] |
| Eu1−xBixVO4/ MWHT | x = 0.05 | ms | ||
| Eu1−xBixVO4/P-HT | 0<x<1 | tz | Strong red emission under both near UV and Vis excitation. | [69] |
| BixEu1-xVO4/SG | x = 0, 0.01, 0.03, 0.05, 0.07 and 0.10 | ms | DRS: reduction in Eg from 2.43 to 2.38 eV with Eu3+ doping, indicating the formation of new low-energy level transitions within the band gap; Eu3+ doping significantly improved photocatalytic efficiency. | [70] |
| BixEu1-xVO4/NPss /SC | x = 0.5, 1.0 and 1.5 | ms | PL: An intense red emission at 615 nm under excitation wavelength with 266 and 355 nm. |
[71] |
| BixEu1−xVO4/MW | x = 0 | ms |
PL: The Bi1-xEuxVO4 samples display dominant emission corresponding to 5D0 → 7F2 transition, the BiVO4 does not show any emission. Photocalysis: The Bi1-xEuxVO4 samples exhibit much higher photocatalytic activity in the degradation of RhB than undoped BiVO4. |
This work |
| x = 0.3, 0.06, 0.09 | mixture ms-tz | |||
| x = 0.12 | dominant tz |
* ms-monoclinic scheelite structure; tz- tetragonal zircon structure; NPs- nanoparticles; PL-photoluminescence; DRS Diffuse reflectance spectroscopy; P-precipitation; MWHT microwave-assisted hydrothermal; P-HT –precipitation- hydrothermal; MB-methylene blue; SG-sol-gel; UV-ultra-violet; Vis-visible; Eg-energy gap; SC-solution combustion; MW-microwave.
Disclaimer/Publisher’s Note: The statements, opinions and data contained in all publications are solely those of the individual author(s) and contributor(s) and not of MDPI and/or the editor(s). MDPI and/or the editor(s) disclaim responsibility for any injury to people or property resulting from any ideas, methods, instructions or products referred to in the content. |
© 2025 by the authors. Licensee MDPI, Basel, Switzerland. This article is an open access article distributed under the terms and conditions of the Creative Commons Attribution (CC BY) license (http://creativecommons.org/licenses/by/4.0/).
Copyright: This open access article is published under a Creative Commons CC BY 4.0 license, which permit the free download, distribution, and reuse, provided that the author and preprint are cited in any reuse.


