Submitted:
05 November 2025
Posted:
06 November 2025
You are already at the latest version
Abstract
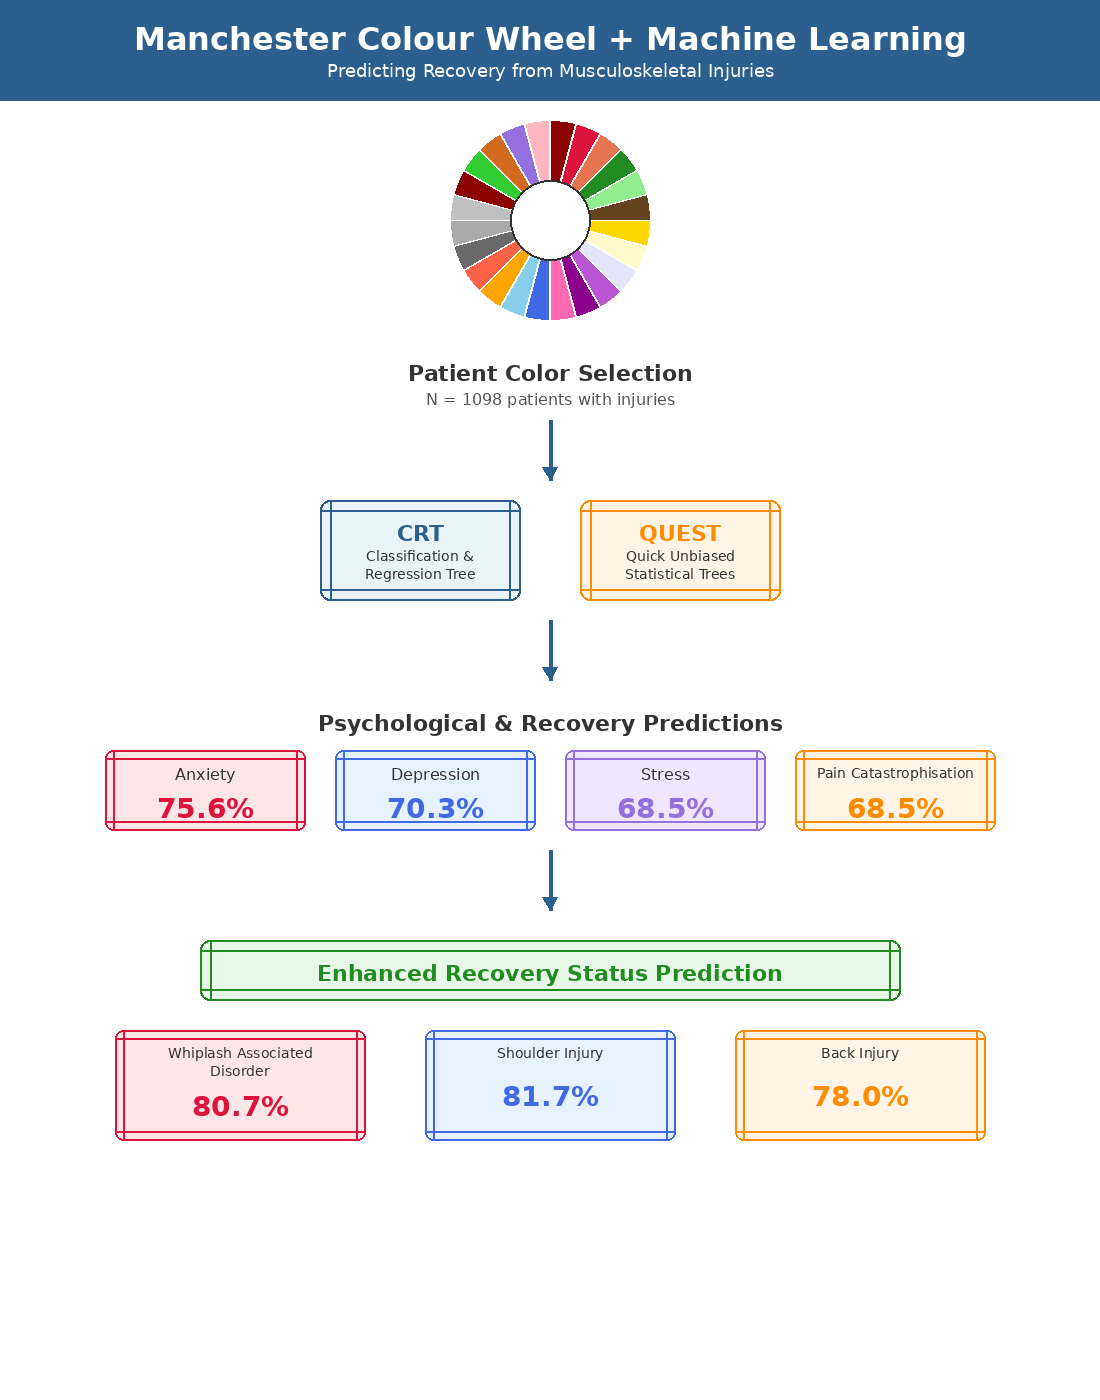
Background/Objectives: The Manchester Colour Wheel (MCW) was developed as an alternative way of assessing health status, mood and treatment outcomes by Carruthers et al in 2010. There has been a dearth of research on this alternative assessment ap-proach. The present study examines the sensitivity of the MCW to pain, psychological factors and recovery status in 1098 people with insured injuries treated in an interdis-ciplinary clinic. Methods: A deidentified data set of clients treated in a multidiscipli-nary clinic were conveyed to the researchers containing results of MCW and injury specific psychometric tests at intake, and recovery status at discharge. Systematic ma-chine modeling was applied. Results: There were no significant differences between the four injury types studied, being motor crash related Whiplash Associated Disorder (WAD) and workplace related Shoulder Injury (SI), Back Injury (BI) and Neck Injury (NI) on the MCW. Augmenting the MCW with Machine Learning (ML) models showed overall classification rates for Classification and Regression Tree (CRT) of 75.6% for anxiety, 70.3% classified for depression, and 68.5% for stress, and Quick Unbiased Ef-ficient Statistical Trees could identify 68.5% of pain catastrophisation and 62.7% of kinesiophobia. Combining MCW with psychometric measurements markedly in-creased the predictive power with a CRT model predicting WAD recovery status with 80.7% accuracy, SI recovery status 81.7% accuracy, BI recovery status with 78% accu-racy. A Naïve Bayes Classifier predicted recovery status in NI with 96.4% accuracy. However, this likely represents overfitting. Conclusions: Overall, MCW augmented with ML offers a promising alternative to questionnaires and the MCW appears to measure some unique psychological features that contribute to recovery from injury.
Keywords:
Manchester colour wheel
; machine learning
; compensable injury
; whiplash associated disorder
; back injury
; shoulder injury
1. Introduction
In injury rehabilitation questionnaires are used to inform about the needs and likelihood of recovery and to personalize treatment. Cattel [1] makes the point that, although an ancient approach, asking questions is not necessarily a reliable method of assessment and criticizes psychology because other more novel methods may have greater utility. The Manchester Colour Wheel (MCW) was developed in 2010 as an alternative way of assessing health status, mood and treatment outcomes [2]. It has been applied along with questionnaires to predict the recovery of people with irritable bowel syndrome [3] but there have been few other clinical applications of this measure. It has been validated with adults and adolescents [4]. This research shows that depressed adults and adolescents prefer dark shades, so called “negative colours” with black being the most favoured colour. The studies on the MCW showed this mood colour preference was subject to change in the short-term after interventions. In a multilingual society such as Australia, a valid and reliable measure minimally dependent on English language comprehension with simple instructions, easily translatable, and with less time burden than questionnaires, would improve clinical practice.
Variations in wording of the MCW were noted to improve its sensitivity to mood disorders [5]. Mood disorders have been associated with changes in subjective report of colours with a decrease in colour sensitivity [6]. People associate different colours with different attitudes and emotions, and they may also have cultural connotations and associations [7]. Imagery and colour are important factors in approaches to treating psychosomatic conditions where there is a psychological overlay contributing to the experience of the physical condition, or complicating recovery from the condition. Both hypnosis [8,9] and eye movement desensitization and reprocessing therapy (EMDR) [10] use these mental features as targets for change to transform the injured person’s experience of their condition. This imagery has been shown to change with treatment of conditions including irritable bowel syndrome [11] and chronic pain [12]. The verbal or written suggestions made about colour selection in the MCW are important to how colour and imagery are related too by the individual, and these can be altered by therapeutic interventions.
The relationship between the left and right hemispheres of the brain and their roles in emotion and trauma is a nuanced topic that has been extensively studied [13]. The lateralization of brain functions indicates that each hemisphere contributes differently to these processes [14]. Historically the right hemisphere is predominantly associated with the processing of emotions, particularly negative emotions such as fear and sadness. This hemisphere is also linked to the vividness and intensity of traumatic memories, mediates retrieval of autobiographical memories, and regulates body states, making it particularly relevant in trauma-related disorders [15,16]. The left hemisphere is more involved in language and analytical processing, playing a significant role in the regulation and expression of positive emotions, and construction of the narrative of a person’s life [16]. It contributes to the cognitive appraisal and verbalization of emotional experiences, which is particularly important in therapeutic contexts where verbal communication is essential, and also the interpretation and self-appraisal required in the answering of questionnaires. The interaction between the hemispheres is critical for balanced emotional processing. Recent research suggests that emotional processing involves multiple interrelated networks, each associated with different components of emotion generation, perception, and regulation [17].
Machine Learning (ML) and Artificial Intelligence have been applied to a multitude of medical problems including imaging and diagnosis [20], triage and recovery prediction [21,22,23,24,25,26,27] and links diverse data, such as newer research on Posttraumatic Stress Disorder (PTSD) [28,29,30], and in chronic pain [31]. Gozzi et al [32] used machine learning models to show patients with high subjective reported pain relative to physiological variables were characterised by long-term disability, poor recovery, and distress expressed as anxiety and depression.
According to Safework Australia the most common work-related injuries are the upper limbs, trunk, lower limbs, non-physical injuries, head and neck injuries (NI) [33]. According to the New South Wales (NSW) State Insurance Regulatory Authority the most common motor vehicle related injury is Whiplash Associated Disorder (WAD) [34]. Digital Intervention (DI) has been demonstrated to be as effective as treatment as usual for chronic back pain [35]. The Active Recovery Clinics (ARC) were developed to treat high frequency physical injuries that respond to active treatment, by augmenting an interdisciplinary clinic with DI to ensure exercise adherence. SWORD Phoenix is a DI system that uses a tablet to demonstrate exercises to clients and sensors to monitor motion and give immediate feedback on the exercise performance and compliance [36]. This DI has been used in the successful treatment of chronic shoulder pain [37], chronic lower back pain [38] and hip pain [39] and in telerehabilitation of acute musculoskeletal conditions [40]. The ARC combines this DI system with assessment and interdisciplinary oversight by a medical specialist, psychologist and physiotherapist. Anxiety and depression are associated with poor active program adherence [38] and generally with poor outcomes in rehabilitation of injury. In ARC the psychosocial barriers to recovery including anxiety, depression and accident and injury related trauma symptoms, are addressed with the psychological intervention of EMDR.
Through retrospective data mining use of ML to derive insights, the first aim of this study was to evaluate and compare the recovery dynamics in the interdisciplinary treatment of WAD, Shoulder Injury (SI), Back Injury (BI) and NI injuries. The second aim was to see if the MCW has sensitivity to factors important to adjustment to injury including pain, depression, anxiety, stress, kinesophobia and pain catastrophizing relative to an established question protocol [41]. A further aim of this study is to identify the questions that lead to clinically meaningful responses on the MCW for people with musculoskeletal injuries presenting for treatment and developing ML systems for interpretation of the MCW. Finally, the identification of prognostic indicators will be used to derive insights into the dynamics that underpin these injuries, potentially integrating the left-hemisphere verbally mediated sense of injury and the right-hemisphere visuospatial mediated sense of injury.
2. Materials and Methods
2.1. Participants
Participants were 1098 personal injury claimants who had suffered injury in the course of their work (n=827) or in motor vehicle crashes (n=271) who opted into treatment with the Active Recovery Clinic (ARC) when offered the specialist treatment clinic by the insurer or scheme agent. The research period was from 1st January 2022 to 8th February 2024. The mean age was 42.4-years (SD=13.3, range = 18-74), 51.9% were female, 2.7% were unemployed or retired, 0.6% were students, 10.1% were in professions, 11.4% were frontline workers in health or law enforcement, and the remaining 75.27% were in general employment. Participants were reviewed at initial onboarding at a clinic locations across Australia. The participants suffered Back injury (BI, n = 359, 32.7%), Shoulder Injury (SI, n = 391, 35.6%), Neck Injury (NI, n = 59, 5.4%), and Whiplash Associated Disorder (WAD, n = 287, 26.1%) and non-specified in two clients who were subsequently excluded (n=2, 0.02%). All clients were English speaking sufficiently to complete the questionnaires. Clients were deemed “Unsuitable for Clinic (USC)” if they had complicating injuries or medical conditions which warranted more intensive intervention or prevented engagement in active rehabilitation. Those who required surgery were coded as “Surgical Withdrawals (SW)”. Those who attended assessment but opted out of the program during the onboarding process were coded as “did not commence (DNC)”. Those who the insurer declined claim after referral were coded as “Administrative Withdrawals (AW)”. Clients who commenced the program and did not complete were coded as “did not complete (DNCP). Clients were deemed “fully recovered (FR)” if there were no clinically significant symptoms and they were certified fit to return to pre-injury duties, “partially recovered (PR)” if there was improvement in symptoms and return to restricted duties, and “no recovery (NR)” if there was either no clinically significant improvement in their condition and no return to duties.
2.2. Procedure
The ARC programs are technology augmented interdisciplinary clinics of up to 12-weeks in duration. All note keeping and data were held in a local data warehoused instance of Salesforce Health Cloud. The programs consist of reviews by an interdisciplinary panel consisting of an orthopaedic surgeon or sports medicine physician, a psychologist, and a physiotherapist, at onboarding and weeks 4, 8 and 12. Prior to each clinic attendance clients completed a brief psychometric screening consisting of Vaegter’s screening questions [41], the Visual Analogue Pain Scale [(VAS) 42], and the MCW [2] administered by secure portal interface via the client’s smart device. Client’s optimism about recovery was assessed by asking if they thought they were going to get better with responses “yes”, “unsure” and “no”. Each professional spent 30-minutes with each participant at each review. The medical examination involved a general history taking of the injury and medical background, medical assessment of the injury including range of motion and symptoms, and an orientation to the interdisciplinary program. The psychological assessment involved a semi-structured clinical interview inquiring about history of mental disorder, previous trauma exposure and assessment of the presenting issue. Clients with significant psychological trauma or symptoms were provided with psychological therapy by way of EMDR by “Weekend 2” certified practitioners [43]. The physiotherapy review included an assessment of physical capacity and orientation to and configuring of the SWORD Phoenix exercise system with a program of exercises from a pre-programed catalogue customized to the client’s injury and goals. The exercises for BI and SI were prescribed from SWORD Phoenix library [37,38] of exercises. For BI this was in combination with lower limb strengthening exercises, if required, for fear of reinjury and return-to-work hardening [44]. The catalogue of exercises for WAD and NI were taken from the State Insurance Regulatory Authority Guidelines [34] for the management of Acute Whiplash Associated Disorders which were generated and ported into the SWORD Phoenix Platform. A de-identified database was created and supplied to the researchers by the Head of Data and Analytics of Navigator Group.
2.3. Measures
2.3.1. Pain
The VAS [42] was administered to assess pain and has been validated for use on digital platforms [45]. There have been attempts to develop cutoffs for “mild”, “moderate” and “severe pain” with systems by Jensen et al. [46] and Boonstra et al. [47]. Three different sets of cutoffs were applied to compare the utility and predictive validity of the cut-points. Clinically significant differences on the VAS were considered 12mm [42] or greater than 33% [44].
2.3.2. Psychological Distress
Vaegter et al [41] developed a 6-item screening questionnaire based on the closed-ended items rated from 0 to 10, with classifying cut-points on single items for clinically significant symptoms of Anxiety (SE = 80.8%, SP = 72.2%), Stress (SE = 71.2%, SP = 70.6%), Pain Catastrophisation (SE = 90.7%, SP = 60.9%), or with Kinesiophobia (SE 75.7%, SP = 74.4%); and with two items to classify significant Depression (SE 77.2%, SP = 73.1%). The items were derived from the Generalized Anxiety Disorder Scale [48], the Perceived Stress Scale [49], the Pain Catastrophization Scale [50], the Tampa Scale for Kinesiophobia [51], and the Patient Health Questionnaire-9 [52] respectively. These were the minimal number of items to separate between people classified by each of these scale as being significantly elevated on the test construct or not. This measure was used to classify the presence of these psychological features in presenting clients.
2.2.3. Optimism About Recovery
The question “Do you think you are going to get better?” was rated by participants as “yes”, “unsure” and “no” to assess optimism about recovery, with optimism being considered “yes”.
2.3.4. Manchester Colour Wheel
The MCW is requires the examinee to rate the test construct on the basis of 38-colours which vary in hue, tint, shade, and tonality. It consists of six hues red, orange, yellow, green, blue and purple, with 4-gradations of shade, and 6-tints from black through greys to white. In early research the colours of the MCW have were clustered into eleven “Positive”, eighteen “Neutral”, and nine “Negative” colours [3]; hereafter referred to as “Permutation 0”. Later research [2] developed a further 8-colour permutations of positive, neutral and negative colours with varying sensitivity to mood and interest with increasing restriction on the positive and negative ends of the spectrum. Permutations 5 and 6, and permutations 7 and 8 were collapsed together due to significant redundancy [2]. The individual colours and permutation categories were used to interpret the colour choice. Participants were asked to respond on the MCW to the following questions:
- Which colour do feel most drawn to?
- What colour is your favourite colour?
- What colour represents your day-to-day mood?
- What colour represents your day-to-day pain?
2.4. Software and data analysis
IBM SPSS 28 was used to calculate all statistics. Chi-Square Tests were used to compare groups on categorical variables such as optimism about recovery, the MCW colours and permutations of colours. Cramer’s V was used to calculate effect size. Given the uneven samples sizes and non-normality of variance, Kruskal-Wallis H-tests were used to compare continuous and ordinal variables between groups with 2-sided asymptotic significance, and Bonferroni adjusted significance for multiple Pairwise Comparisons were used for significance testing. While means and standard deviations are reported, given the small size of the AW group (n = 5) these were removed from latter analyses, and the SW group was collapsed into the USC group for analysis to increase power for recovery results. ANOVA was used to compare pre- and post-testing within groups that participated in treatment (FR, PR, NR). Given the presence of “0” endorsement on cells in the MCW selections for the different injuries, Monte Carlo Simulations were employed alongside the Chi-Square Test to generate approximate Р-values where indicated [53]. Given the size of the matrices for calculation (4 x 38, 2 x 38) it was computationally infeasible to use a Fischer’s Exact calculation. Machine learning models of Chi-square Automatic Interaction Detector (CHAID [54]), Exhaustive CHAID (Ex-CHAID), Classification and Regression Tree (CRT [55]) analysis, and Quick Unbiased Efficient Statistical Tree (QUEST [56]) algorithms and Naïve Bayesian Classifier (NBC [57]) models were generated to explore relationships between variables and to operationalise the interpretation of the MCW on 80% training data and 20% testing data. Julius.AI was used to generate the figures displayed below.
3. Results
3.1. Clinical Findings
3.1.1. Onboarding Statistics
Examining the onboarding scores of outcome groups showed multiple significant differences in personal and psychological characteristics. Table 1 contains the clinical results of from those initially referred at the time of onboarding. Kruskal-Wallis H-Test showed there was a significant difference in age across the outcome groups, χ2 (df = 7, N = 1015) = 39.13, p <0.001. Pairwise comparison, with adjusted Bonferroni correction for multiple tests, showed that Surgical Withdrawal group were older than DNCP (ρ = 0.031), DNC (ρ = 0.14) and FR (ρ = 0.08) groups. Kruskal-Wallis H-Test showed significant difference in Injury to Onboard Interval, χ2 (df = 7, N = 1096) = 17.91, ρ = 0.012. Pairwise comparison showed that PR had longer injury to onboard intervals than FR, but this only approached significance on post-hoc testing (ρ = 0.061). Kruskal-Wallis H-Test showed significant differences in VAS scores between outcome groups, χ2 (df = 7, N = 1096) = 153.24, ρ <0.001. Pairwise comparison showed that USC (ρ = 0.003), PR (ρ < 0.001), DNC (ρ < 0.001), NR (ρ = 0.019), and DNCP (ρ < 0.001) were significantly higher than FR, and using 12mm reliable change indicator [42], those with FR had clinically significantly less pain. Kruskal-Wallis H-Test showed significant differences in Stress scores between outcome groups χ2 (df = 7, N = 1096) = 76.62, ρ <0.001. Pairwise comparison showed that USC (ρ = 0.004), PR (ρ < 0.001), DNC (ρ < 0.001), NR (ρ = 0.019), and DNCP (ρ < 0.001) were significantly more stressed than FR. Kruskal-Wallis H-Test showed significant differences in Anxiety scores between outcome groups χ2 (df = 7, N = 1096) = 53.52, ρ <0.001. Pairwise comparison showed that PR (ρ < 0.002), DNC (ρ < 0.001), NR (ρ = 0.019), and DNCP (ρ < 0.001) were significantly more anxious than FR. Kruskal-Wallis H-Test showed significant differences in Hopelessness scores between outcome groups χ2 (df = 7, N = 1096) = 76.67, ρ <0.001. Pairwise comparison showed that PR (ρ < 0.001), DNC (ρ < 0.001), NR (ρ = 0.001), and DNCP (ρ < 0.001) were significantly more hopeless than FR. Kruskal-Wallis H-Test showed significant differences in Low Interest scores between outcome groups χ2 (df = 7, N = 1096) = 69.53, ρ <0.001. Pairwise comparison showed that PR (ρ = 0.001), DNC (ρ < 0.001), NR (ρ = 0.001), and DNCP (ρ < 0.001) were bothered by Low Interest compared to FR. Kruskal-Wallis H-Test showed significant differences in Pain Catastrophizing scores between outcome groups χ2 (df = 7, N = 1096) = 102.25, ρ <0.001. Pairwise comparison showed that PR (ρ < 0.001), DNC (ρ < 0.001), NR (ρ = 0.010), and DNCP (ρ < 0.001) had significantly more Pain Catastrophising than FR. Kruskal-Wallis H-Test showed significant differences in Kinesiophobia scores between outcome groups χ2 (df = 7, N = 1096) = 91.36, ρ <0.001. Pairwise comparison showed that PR (ρ < 0.001), DNC (ρ < 0.001), SW (ρ < 0.001), PR (ρ < 0.001), DNCP (ρ < 0.001) and NR (ρ < 0.001) had significantly more Kinesiophobia than FR, and that DNC (ρ < 0.001) had more Kinesiophobia than PR. Chi-Square Test (χ2 = 116.388, ρ < 0.001) revealed significant differences between groups on outcomes for optimism about recovery with those in FR more optimistic about recovery than other groups, with a medium effect size (Cramer’s V = 0.23, ρ < 0.001). ANOVA revealed no significant differences between pre- and post-intervention testing on psychometric measures for NR, PR and FR.
3.1.2. Onboarding Statistics by Injury Types
Table 2 contains the means and standard deviations at onboarding of the four program groups. Comparing between the clinical groups Kruskal-Wallis H-Test showed there was a significant difference in Age between program types, χ2 (df = 3, N = 1015) = 26.75, ρ <0.001. Pairwise comparison showed that WAD (ρ < 0.001) and BI (ρ = 0.001) were younger than SI. Kruskal-Wallis H-Test showed there was a significant difference in Injury to Onboard Interval between program types, χ2 (df = 3, N = 1096) = 87.69, ρ <0.001. Pairwise comparison showed that WAD Injury to Onboard Interval was shorter than BI (ρ < 0.001), NI (ρ = 0.001) and SI (ρ = 0.001). Kruskal-Wallis H-Test showed there was a significant difference in between program types on the VAS, χ2 (df = 3, N = 1096) = 8.42, ρ = 0.038. Pairwise Comparison showed WAD rating to be higher than SI (ρ = 0.031) in pain rating. Kruskal-Wallis H-Test showed there was a significant difference in between program types for Stress, χ2 (df = 3, N = 1096) = 27.38, ρ < 0.001. Pairwise comparison showed BI (ρ = 0.009), NI (ρ = 0.004) and WAD (ρ < 0.001) were more stressed than SI. Kruskal-Wallis H-Test showed there was a significant difference in between program types on Anxiety, χ2 (df = 3, N = 1096) = 24.426, ρ < 0.001. Pairwise comparison showed WAD (ρ < 0.001) were more anxious than SI. Kruskal-Wallis H-Test showed there was a significant difference in between program types on Hopelessness, χ2 (df = 3, N = 1096) = 23.607, ρ < 0.001. Pairwise comparison showed that WAD (ρ < 0.001), NI (ρ < 0.035) and BI (ρ = 0.005) were more hopeless than SI. Kruskal-Wallis H-Test showed there was a significant difference in between program types on Pain Catastrophising, χ2 (df = 3, N = 1096) = 9.000, ρ = 0.29. Pairwise comparison showed NI was more Pain Catastrophising the SI. Chi-Square Test (χ2 = 6.259, ρ = 0.395) revealed no difference between programs on optimism about recovery.
3.1.3. Program Outcomes by Injury Type
Table 3 contains the Outcomes by Injury Type. Chi-Square Test (χ2 = 51.729, N=1091, df = 15) ρ < 0.001) showed significant differences between groups on outcomes on recovery status, with a small effect size (Cramer’s V = 0.115, ρ < 0.001). NI and SI had more participants found not suitable for clinic compared to WAD and BI. Inspection showed more SW in SI than other groups. NI had fewer DNC than other groups, but had more DNCP. SI had more FR compared to other groups and a lower percentage of PR.
3.2. Construct Validity of the Manchester Colour Wheel
3.2.1. Sensitivity to Injury Type
Chi-Square Test enhanced with Monte Carlo Simulations showed no significant differences in colour selection between injuries in response to colour Drawn To colour (χ2 = 129.299, N=1091, df = 111, ρ = 0.113) , Favourite colour (χ2 = 130.347, N=1091, df = 111, ρ = 0.101), Day-to-Day Mood (χ2 = 103.319, N=1091, df = 111, ρ = 0.686) or Day-to-Day Pain. However, day-to-day pain approached significance (χ2 = 132.650, N=1091, df = 111, ρ = 0.079) with a small to effect size (Cramer’s V = 0.078, CI = 99%: Lower Bound 0.071, Upper Bound = 0.85) perhaps reflecting a pain differential between SI and WAD.
3.2.2. Sensitivity to Pain Severity Classification
Chi-Square Test showed clients with pain severity classified as “no pain”, “mild pain”, “moderate pain” and “severe pain” using Jensen’s cut-scores showed significant differences in colour “Drawn To” (χ2 = 138.252, N=1091, df = 111, p = 0.041) with a moderate degree of association (Cramer’s V = 0.041) between colour choice and pain severity. Figure S1 in the supplementary materials shows the percentage of “Drawn To” colour choices by pain severity classification. This was equivalent with Monte Carlo Simulation (CI = 99%: Lower Bound = 0.041, Upper Bound = 0.052]. Pain severity classification also showed significant differences in “Day-to-Day Mood” colour selection (χ2 = 159.970, N=1091, df = 111, p = 0.002) with a moderate degree of association (Cramer’s V = 0.221, ρ = 0.002). This was equivalent with Monte Carlo Simulation (CI = 99%: Lower Bound = 0.002, Upper Bound = 0.005]. Figure S2 in the supplementary materials shows the percentage of “Day to Day Mood” colour selection by pain severity classification. Pain severity classification also showed significant differences on colour selection for “Day-to-Day Pain” (χ2 = 202.753, N=1091, df = 111, p < 0.001) with a moderate degree of association (Cramer’s V = 0.249, ρ < 0.001). This was equivalent with Monte Carlo Simulation (CI = 99%: Lower Bound < 0.001, Upper Bound < 0.001). Figure S3 in the supplementary materials shows the percentage of “Day to Day Mood” colour selection by pain severity classification. Chi-Square analysis showed there were no differences between pain severity classification and “Favourite Colour”. Repeating the analysis with Boonstra et al’s pain classification systems [47] did not improve or significantly change the results. Comparing the Permutations of Positive, Negative and Neutral Colours as outlined by Carruthers et al [2,3] for classifications of pain severity showed the Permutations had different sensitivities to pain severity. Favourite colour showed no differences between pain severity, however “Drawn to”, “Day-to-Day Mood” and “Day-to-day Pain” across permutations were different across pain severity classification levels.
Augmenting with ML models showed an NBC which classified Jensen Pain Severity Classification on the basis of Drawn To colour with 57.8 % accuracy on training. The best DT’s on training were both CRT models which used MCW ratings in order of contribution: Day to Day Pain, Day to Day Mood, Favourite Colour and Drawn To Colour. On testing an Ex-CHAID (5/2) model performed best and classified on the basis of Day to Day Pain only with “mild pain” rating colours greater than 35, and “moderate pain” rating pain as colours less than or equal to 11, and colours 31 and 35 with 49.5% accuracy showing poor performance for discriminating pain intensity.
3.2.3. Sensitivity to Anxious Classification
Chi-Square Test showed clients classified as anxious using Vaegter’s [41] cut-score had showed significant difference in colour Drawn To colour (χ2 = 73.202, N=1091, df = 37, ρ < 0.001), with moderate degree of association (Cramer’s V = 0.259, ρ < 0.001, Eta = 0.249), Favourite colour (χ2 = 54.379, N=1091, df = 37, ρ = 0.033), with a moderate degree of association (Cramer’s V = 0.233, ρ = 0.033), Day to Day Mood (χ2 = 189.001, N=1091, df = 37, ρ < 0.001), with strong association (Cramer’s V = 0.416, ρ < 0.001), and Day to Day Pain (χ2 = 102.643, N=1091, df = 37, ρ < 0.001), with moderate association (Cramer’s V = 0.307, ρ < 0.001). Figure S4 in the supplementary materials shows the percentage of colour selection by Anxiety classification for the four questions. Comparing the permutations of Positive, Negative and Neutral Colours as outlined by Carruthers et al [2,3] for sensitivity to anxiety classification showed the permutations had different sensitivities to anxiety. Favourite colour permutations 1 and 3 showed some sensitivity to anxious classification, however “Drawn to”, “Day-to-Day Mood” and “Day-to-day Pain” across permutations were sensitive to anxious classification.
Augmenting with ML models showed NBC model was the best correctly classifying 78% of cases using Drawn To colour in training. Of the DT’s a CRT (10/2) model classified 75.6% of cases on testing with 29 terminal nodes and tree depth of 5 and used Favourite Colour; Day to Day Mood; Day to Day Pain; and Drawn to Colour. Table 4 contains the performance of the different models generated for Anxiety, Stress, Depression, Pain Catastrophization and Kinesiophobia. Including the Permutations made minimal improvement in classification. However, a Ex-CHAID model classified 77.6% of cases on testing with 11 terminal nodes and tree depth of 3 and used Day to Day Mood Permutation 0; Drawn To Colour; Day to Day Pain Permutation 7&8; Day to Day Mood Permutation 1: Day to Day Mood; and Drawn To Permutation 2. Table 10 contains the performance of the different ML models generated including Permutations.
3.2.4. Sensitivity to Stress Classification
Chi-Square Test showed clients classified as stressed using Vaegter’s [41] cut-score showed significant difference in Drawn To colour (χ2 = 86.038, N=1091, df = 37, ρ < 0.001), with moderate degree of association (Cramer’s V = 0.281, ρ < 0.001, Eta = 0.281), Favourite colour (χ2 = 54.943, N=1091, df = 37, ρ < 0.029) with a moderate degree of association (Cramer’s V = 0.224, ρ < 0.001, Eta = 0.224), Day to Day Mood (χ2 = 183.707, N=1091, df = 37, ρ < 0.001) with a moderate-to-strong degree of association (Cramer’s V = 0.410, p <0.001, Eta = 0.410), and Day to Day Pain (χ2 = 98.818, N=1091, df = 37, ρ < 0.001) with moderate degree of association (Cramer’s V = 0.301, ρ < 0.001, Eta = 0.301). Figure S5 in the supplementary materials shows the percentage of colour selection for each question by Stressed classification. Comparing the permutations of Positive, Negative and Neutral Colours as outlined by Carruthers et al [2,3] for sensitivity to stressed classification showed the permutations had different sensitivities to anxiety severity. Favourite colour permutation 1 showed some sensitivity to stressed classification, however Drawn to, Day-to-Day Mood and Day-to-day Pain across permutations were sensitive to stress classification.
Augmentation with ML models showed NBC was best on training correctly classifying 74.1% of cases. The best DT model was a CRT (5/2) model which classified 72.0% on training classifying with 20-terminal nodes and tree depth of 5. However, on testing an Ex-CHAID model identified 71.6% of cases with 16 terminal nodes and tree depth of 3 and used Day to Day Mood Permutation 1; Day to Day Mood Permutation 2; Day to Day Mood; Day to Day Pain Permutation 5&6, 7&8; Favourite Colour; and Day to Day Pain.
3.2.5. Sensitivity to Depressed Classification
Chi-Square Test showed clients classified as depressed using Vaegter’s [41] cut-score had showed significant difference in Drawn To colur (χ2 = 79.419, N=1091, df = 37, ρ < 0.001), with moderate degree of association (Cramer’s V = 0.270, ρ < 0.001, Eta = 0.270), Day to Day Mood (χ2 = 203.154, N=1091, df = 37, ρ < 0.001) with a moderate-to-strong degree of association (Cramer’s V = 0.432, p <0.001, Eta = 0.410), and Day to Day Pain (χ2 = 90.779, N=1091, df = 37, ρ < 0.001) with small degree of association (Cramer’s V = 0.288, ρ < 0.001, Eta = 0.288). Figure S6 shows the percentage of colour selection for each question by Depressed classification. There was no significant difference for favourite colour. Comparing the permutations of Positive, Negative and Neutral Colours as outlined by Carruthers et al [2,3] for sensitivity to depressed classification showed the permutations had different sensitivities to depression classification. Favourite colour permutation 1 showed some sensitivity to depressed classification. “Drawn to”, “Day-to-Day Mood” and “Day-to-day Pain” across permutations were sensitive to depressed classification.
Augmentation with ML showed in training a CRT (5/2) Model based on Permutations and Colours was best on training correctly classifying 75.4% of cases with 27 terminal nodes and a tree depth of 5. On testing a CRT (5/2) Model based on colours was best with 27 terminal nodes and a tree depth of 5 using Day to Day Mood; Day to Day Pain; Drawn To Colour; and Favourite Colour.
3.2.6. Sensitivity to Pain Catastrophisation Classification
Chi-Square Test showed clients classified as pain catastrophising using Vaegter’s [41] cut-score had showed significant difference in Drawn To colour (χ2 = 75.527, N=1091, df = 37, ρ < 0.001) with small to moderate degree of association (Cramer’s V = 0.256, ρ < 0.001, Eta = 0.256), Favourite colour (χ2 = 53.278, N=1091, df = 37, ρ < 0.001) with small to moderate degree of association (Cramer’s V = 0.221, ρ = 0.041), Day to Day Mood (χ2 = 120.876, N=1091, df = 37, ρ < 0.001) with a moderate degree of association (Cramer’s V = 0.333, ρ < 0.001, Eta = 0.333), and Day to Day Pain (χ2 = 104.204, N=1091, df = 37, ρ < 0.001) with a moderate degree of association (Cramer’s V = 0.309, ρ < 0.001, Eta = 0.309). Figure S7 in the supplementary materials shows the percentage of colour selection for each question by Pain Catastrophising classification. Comparing the permutations of Positive, Negative and Neutral Colours as outlined by Carruthers et al [2,3] for sensitivity to pain catastrophising classification showed the permutations had different sensitivities to pain catastrophising classification. Favourite colour permutation 1 showed some sensitivity to pain catastrophising classification. “Drawn to”, “Day-to-Day Mood” and “Day-to-day Pain” across permutations were sensitive to pain catastrophisation classification.
Augmenting with ML showed in training an NBC model correctly classified 74.6% of cases on the basis of Day to Day Mood. A QUEST (10/2) model was best on testing and correctly classified 69.4% of cases with 10 terminal nodes and a tree depth of 5 using in order Day to Day Pain, Day to Day Mood, Drawn To Colour and Favourite Colour.
3.2.7. Sensitivity to Kinesiophobia Classification
Chi-Square Test showed clients classified as kenesiophobic using Vaegater et al’s [41] cut-score had showed significant difference in Drawn To colour (χ2 = 57.807, N=1091, df = 37, ρ = 0.016) with small to moderate degree of association (Cramer’s V = 0.230, ρ = 0.016, Eta = 0.230), Day to Day Mood (χ2 = 79.066, N=1091, df = 37, ρ < 0.001) with a small to moderate degree of association (Cramer’s V = 0.269, ρ < 0.001, Eta = 0.269), and Day to Day Pain (χ2 = 59.835, N=1091, df = 37, ρ = 0.010) with a small to moderate degree of association (Cramer’s V = 0.234, ρ = 0.010, Eta = 0.309). There was no significant difference for favourite colour. Figure S8 in the supplementary materials shows percentage of colour selection for each question by Kinesiophobia classification. Comparing the permutations of Positive, Negative and Neutral Colours as outlined by Carruthers et al [2,3] for sensitivity to kenesiophobia classification showed the permutations had different sensitivities to pain catastrophising classification. Favourite colour showed no sensitivity to kinesiophobia classification. “Drawn to”, “Day-to-Day Mood” and “Day-to-day Pain” across permutations were sensitive to kinesiophobia classification.
Augmenting with ML models showed an NBC classified 73.1 % of cases during training on the basis of Drawn to Colour. On testing the best model was a CRT (10/2) model that had 25 terminal nodes and a tree depth of 5, and used Day to Day Mood Permutations 0 – 7&8; Day to Day Mood, Day to Day Pain Permutations 0 – 7&8; Drawn To Colour; Drawn to Colour Permutations; and Favourite Colour Permutations 0 - 7&8.
3.3. Predictive Validity of the MCW
For a detailed description of the features from the recovery models, please see the supplementary materials “3.3.1 Recovery Models with Features”.
3.3.1. Recovery Models
ML models for predicting recovery status as USC/NR, PR, and FR using all psychometric, demographic and MCW variables were calculated and compared for classification accuracy on 80% training data and 20% testing data. The best model in training was an NBC model using automatic Gaussian binning of two continuous variables Interval from Injury to Onboarding and VAS which predicted outcomes with 71.5% accuracy. The best model in testing was a QUEST (5/2) model with 4 terminal nodes, a tree depth of 3 with 53.8% overall accuracy.
ML models using psychometric test scores, age, optimism about recovery and Injury to Onboard Interval were calculated to predict recovery status. The best ML model in training was an Ex-CHAID (5/2) model with 28 terminal nodes and tree depth of 3 with 67.8% accuracy. The best ML Model in testing was a QUEST (10/2) model with 6 terminal nodes and tree depth of 4 which predicted recovery with 56.8% accuracy.
3.3.2. Whiplash Associated Disorder Recovery Prediction Models
ML Models using all variables were calculated to predict recovery status from WAD. The best model in training was a CRT (10/2) model with 17 terminal nodes and a tree depth of 5 with 80.7% accuracy. In testing a QUEST (10/2) model was most successful testing with a 2 terminal nodes and a tree depth of 1 with 64.4% accuracy.
3.3.3. Back Injury Recovery Prediction Models
ML models using all variables were calculated to predict recovery status from BI. The best model in training was a CRT (10/2) model with 16 terminal nodes and a tree depth of 5 with 78% accuracy. The best model on testing was a QUEST (10/2) model with 5 terminal nodes and a tree depth of 3 with 59.7% accuracy.
3.3.4. Shoulder Injury Recovery Prediction Models
ML models using all variables were calculated to predict recovery status in SI. The best model in training was a CRT (10/2) model with 18 terminal nodes and a tree depth of 5 with 81.7% accuracy. The best model in testing a CHAID (5/2) model with 11 terminal nodes and a tree depth of 3 with 62.2% accuracy.
3.3.5. Neck Injury Recovery Prediction Models
ML Models using all variables were calculated to predict recovery status in NI. Given the small number of NI cases, no testing was conducted to retain power in training. The best model was a NBC which used variables Interval from Date of Injury to Onboard, kinesiophobia rating, VAS, Day to Day Mood and Favourite Colour with 96.4% accuracy.
3.3.6. Comparison of Features in Recovery Prediction Models
General models across injury types emphasized pain and the injury to onboard interval as primary features for predicting recovery. However, WAD models relied on psychological variable first, while BI, SI and NI models relied on pain measurements first, emphasizing the different dynamics at play in WAD.
4. Discussion
This study provides a comprehensive evaluation of the Manchester Colour Wheel (MCW) as a clinical tool for assessing psychological states individuals undergoing rehabilitation from insured injuries. The findings underscore the MCW's potential as a non-verbal, intuitive method for gauging emotional well-being, particularly in settings where traditional questionnaire-based assessments may fall short due to language barriers. The MCW demonstrated significant sensitivity to various psychological constructs, such as anxiety, depression, and pain catastrophizing. This aligns with earlier studies by Carruthers et al. (2010), which indicated that individuals with mood disorders exhibit distinct colour preferences. In the present study, specific colours and their permutations were consistently associated with emotional states, with darker shades often linked to negative emotions such as anxiety and depression. The study leveraged machine learning (ML) algorithms to enhance the interpretation of the MCW. NBC and decision trees (e.g., CRT, QUEST) were employed to classify psychological states based on colour choices. The NBC models achieved a classification accuracy of up to 78% for anxiety and depression, suggesting that the integration of ML can significantly enhance the diagnostic precision of the MCW. This approach resonates with the work of Gozzi et al. (2024), highlighting the integration of psychological and other data to tailor interventions more effectively. The study highlights the intricate relationship between psychological states and pain perception. It confirms that emotional distress can exacerbate pain experiences, a phenomenon well-documented by Puntillo et al. (2021). The MCW's ability to capture these nuances through colour preferences offers a novel perspective in understanding how patients relate to their pain, thus providing a more holistic view of their recovery process. The MCW, when combined with ML, showed promise in predicting recovery outcomes. The study found that colour selections could be used alongside traditional psychometric measures to forecast recovery trajectories. For example, permutations of colour responses to specific questions (e.g., "Day-to-Day Mood") were predictive of recovery status, indicating that the MCW can serve as a valuable prognostic tool in clinical settings.
Other features of recovery were identified through comparison within the research cohort. At onboarding Surgery Withdrawal occurred more often in older participants than those who made a full recovery or did not complete the program. People with SI were older than BI and WAD, perhaps reflecting the different dynamics of these injuries with BI and WAD being injuries from incidents while SI may be due to overuse and metabolic or age related structural changes. Injuries that required surgery, or were deemed unsuitable for clinic, or did not commence the program when offered, and did not complete the treatment program, were significantly more painful injuries as measured by the VAS. These clients were significantly more stressed and hopeless, and had lower levels of interest than those who recovered, lending credence to aphorism that “pain and stress being opposite sides of the same coin”. This impression is furthered, that the best ML models using only the MCW relied on Day to Day Pain and Day to Day Mood ratings to predict recovery. It also emphasises the role of pre-morbid psychological factors in response to treatment echoing the findings of other researchers [35,37,38], as no significant difference was found in measurements of mood before and after treatment.
ML models based on the MCW and Vaegater et al’s questions had roughly equal accuracy for predicting outcomes of treatment. Different injuries had different recovery dynamics, and MCW and the psychometric measurements appear to have some unique construct value as evidenced by the improvement in predictive accuracy for ML models using both sets of variables. Close examination of the variables in the ML models for each injury showed that the models for each injury used both the MCW and Vaegater et al’s questions and that these two methods of measuring psychological distress and pain have some overlap. There appears to be some unique contribution from Favorite Colour and Drawn To colour as these appear in models as often as other variables. For example, the NBC for Jensen Pain Classification relied on Drawn To colour with some sensitivity to classifying 58.3% with mild pain, 75.8% of those with moderate pain and 12.9% with severe pain. This perhaps suggests that there is some common process or parallel process affecting perception of pain and visual attraction. The MCW Permutations, clustering colours differentially as “positive”, “neutral” and “negative”, added to the accuracy of ML models. Similarly, different ML models relied on cutoffs on psychometric ratings as well as treating these measurements as continuous variables. This suggests that these classifying cutoffs are clinically meaningful and contribute to construct validity of these measurements.
The performance of ML models in training and testing for this kind of health data appear to reflect greater training accuracy in models which are more complex, with simpler models like QUEST better maintaining accuracy in testing of prediction. This may reflect that the testing case series length was not big enough for more complex models to reach their baseline efficacy or that more complex DT models were overfitting. ML models based on the rating of the four questions on the MCW had weak capacity to classify pain (49.2%), but had good classification of Anxiety (75.6%) and Depression (70.3%), and moderate classification for Pain Catastrophisation (69.4%), Stress (68.5%), and Kinesiophobia (62.7%) on testing. The most successful models on testing were CRT models suggesting that these were not overfitting.
Limitations to the study include that the intervention period was relatively brief, a maximum of 12-weeks, and long-term outcomes cannot be inferred from the data. There were also overlaps in colour selections in response to questions on the MCW by people classified with different types of psychological distress, and future research is required to distinguish between the factors measured by colour selection. Another limitation was that only four questions were used to elicit ratings on the MCW and all these questions had some discriminant value in classification and prediction problems. Further research is required to see what other questions and suggestions might improve the discriminant value of the MCW. Another limitation was that this research relied on a natural clinical sample and there were markedly different numbers of people in the different injury groups and recovery status of these groups. In particular, there were very few people in the NI group. Greater equivalence between comparison groups would improve the quantification of the contribution of the test constructs to classification and prediction problems they were applied too. Another limitation was that there was no information relating to the cultural backgrounds of clients and future research could compare possible cultural contributions to colour preference. The MCW's sensitivity to the different test factors measured psychometrically supports its potential utility as a non-verbal assessment method. Further research is required using valid translations of questionnaires could assist in clarifying the construct validity of the MCW. The MCW may access right-hemisphere mediated aspects of the injury experience that are less accessible through traditional verbal measures, however only some inferences can be made from apparent correlation on the basis of the current research. Further research is required to clarify the process of making a rating on the MCW and possible avenues of inquiry could be FMRI scanning during rating, TMS interference of left hemisphere processing during rating, or split-brain study type protocols to see if there is some unique process for MCW type ratings versus questionnaire type rating. Other future research would be to apply more sophisticated machine learning methods such as ensemble models like extreme gradient boosting regression and random forest, to larger data sets to see what other classifications and predictions can be made with MCW and psychometric data.
Other future research could use the MCW with clients undergoing EMDR to rate distress and body sensations with associated colours during the processing phase of therapy to see if there are constant relationships between colours and emotional processing. This also could show how psychological complexes and emotions can be changed with appropriate therapy. An important finding is that psychological factors, appear to remain relatively unchanged despite treatment in an interdisciplinary clinic. It may be that not enough treatment was provided during the treatment period to address the psychological factors, or that the treatment was not as efficacious as expected. Future research could address improving psychological treatment protocols or making the treatment of psychological factors primary to treatment of physical factors may improve recovery rates. This paper represents a first step towards validating the MCW as an alternative or adjunct to questionnaires especially when augmented with ML.
5. Conclusions
In conclusion, this study provides evidence for the clinical utility of the MCW in assessing psychological adjustment to injury and predicting recovery outcomes. The tool's sensitivity to various psychological states and its contribution to improved predictive modelling suggest it may be a valuable addition to existing clinical assessment protocols. Future research should focus on validating these findings in diverse populations and further exploring the practical implementation of the MCW and ML in clinical settings.
Supplementary Materials
Figures S1-S8 and paragraphs 3.3.1-3.3.5 listing all the variables utilized by the ML models.
Author Contributions
Conceptualization, methodology, statistical analysis, original draft preparation, and rewriting were conducted by J.E.M. A.C. and I.D.C. reviewed methods and statistics and edited and reviewed drafts.
Funding
Not subject to funding.
Institutional Review Board Statement
The research using a de-identified retrospective database of discharged clients for which permission was sought for the use of their data in such a fashion was approved by the University of Sydney Research Integrity & Ethics Committee on 24th March 2021 as meeting the National Human Research Council’s criteria for Negligible Risk: The National Statement defines negligible risk: “The expression ‘negligible risk research’ describes research in which there is no foreseeable risk of harm or discomfort; and any foreseeable risk is no more than inconvenience.” (National Statement 2.1.7).
Informed Consent Statement
Informed consent was obtained from all subjects involved in the study.
Data Availability Statement
The data presented in this study are available on request from the corresponding author. As the data was collected by Navigator Group Pty Ltd as part of business, it reserves the right to determine access to the data and the intent of the use of the data.
Conflicts of Interest
J.E.M. was the Director of Science, a Board Director and a Shareholder of Navigator Group Pty Ltd., the entity operating the Active Recovery Clinics, during the period of study, and this may constitute a conflict of interest. The staff of the ARC were paid employees of Navigator Group Pty Ltd and were not involved in the research. I.D.C and A.C. have no conflict of interest.
Abbreviations
The following abbreviations are used in this manuscript:
| AI | Artificial Intelligence |
| ARC | Active Recovery Clinics |
| AW | Administrative Withdrawal |
| BI | Back Injury |
| CHAID | Chi-Square Automatic Interaction Detector |
| CRT | Classification and Regression Tree Model |
| DI | Digital Intervention |
| DNC | Did Not Commence |
| DNCP | Did Not Complete |
| EMDR | Eye Movement Desensitization and Reprocessing Therapy |
| FR | Full Recovery |
| MCW | Manchester Colour Wheel |
| ML | Machine Learning |
| MVC | Motor Vehicle Crash |
| NBC | Naïve Bayesian Classifier |
| NI | Neck Injury |
| NR | No Recovery |
| PR | Partial Recovery |
| PTSD | Posttraumatic Stress Disorder |
| QUEST | Quick Unbiased Efficient Statistical Tree |
| SD | Standard Deviation |
| SI | Shoulder Injury |
| SW | Surgical Withdrawals |
| USC | Unsuitable for Clinic |
| VAS | Visual Analogue Pain Scale |
| WAD | Whiplash Associated Disorder |
References
- Cattel, R.B. Personality Structure: Principles in Common to Q-, L- and T-Data. In: Cattel RB. Personality and mood by questionnaire. Jossey-Bass: San Fransciso CA, USA, 1973; pp. 1-23.
- Carruthers, H.R.; Morris, J.; Tarrier, N.; Whorwell, P.J. The Manchester Colour Wheel: development of a novel way of identifying color choice and its validation in healthy, anxious and depressed individuals. BMC Med Res Methodol 2010, 10, 12–21. [Google Scholar] [CrossRef] [PubMed]
- Carruthers, H.R.; Morris, J.; Tarrier, N.; Whorwell, P.J. Mood colour choice helps to predict response to hypnotherapy in patients with irritable bowel syndrome. BMC Complement Med Ther 2010, 10, 75–84. [Google Scholar] [CrossRef] [PubMed]
- Carruthers, H.R.; Magee, L.; Osborne, S.; Hall, L.K.; Whorwell, P.J. The Manchester Colour Wheel: validation in secondary school pupils. BMC Med Res Methodol 2012, 12, 136–148. [Google Scholar] [CrossRef] [PubMed]
- Carruthers, H.R.; Whorwell, P.J. The Manchester Colour Wheel: enhancing its utility. Percept Mot Skills 2013, 116, 761–72. [Google Scholar] [CrossRef]
- Barrick, C.B.; Taylor, D.; Correa, E.I. Colour sensitivity and mood disorders: biology or metaphor. J Affect Disord 2002, 68, 67–71. [Google Scholar] [CrossRef]
- Kaya, N.; Epps, H. Relationship between color and emotion: A study of college students. Coll Stu J 2004, 38, 1–11. [Google Scholar]
- Miller, V.; Carruthers, H.R.; Moors, J.; Hasan, S.S.; Archbold, S.; Whorwell, P.J. Hypnotherapy for irritable bowel syndrome: an audit of one thousand adult patients. Aliment Pharmacol Ther 2015, 41, 844–855. [Google Scholar] [CrossRef]
- Carruthers, H.R. Imagery colour and illness: A review. J Vis Comm 2011, 34, 104–112. [Google Scholar] [CrossRef]
- Grant, M. Mark Grant’s EMDR Pain Protocol. 2016: https://emdrtherapyvolusia.com/wpcontent/uploads/2016/12/Mark_Grants_Pain_Protocol.pdf.
- Carruthers, H.; Miller, V.; Morris, J.; Eveans, R.; Tarrier, N.; Whorwell, P.J. Using art to help understand the imagery of irritable bowel syndrome and its response to hypnotherapy. Int J Clin Exp Hypn 2009, 57, 162–173. [Google Scholar] [CrossRef]
- Grant, M.; Threlfo, C. EMDR in the treatment of chronic pain. J Clin Psychol 2002, 58, 1505–1520. [Google Scholar] [CrossRef]
- Demaree, H.A.; Everhart, D.E.; Youngstrom, E.A.; Harris, D.W. Brain lateralization of emotional processing: historical roots and future incorporating “dominance”. Beh Cogn Neurosci Rev 2005, 4, 3–20. [Google Scholar] [CrossRef]
- Wager, T.D.; Phan, K.L.; Liberzon, I.; Taylor, S.F. Valence, gender, and lateralization of functioning brain anatomy in emotion: a meta-analysis of findings from neuroimaging. NeuroImage 2003, 19, 513–531. [Google Scholar] [CrossRef]
- Siegal, D.J. An interpersonal neurobiology of psychotherapy: The developing mind and the resolution of trauma. In: Solomon M, Siegle DJ, editors. Healing Trauma. W.W. Norton, New York, USA 2002; pp. 1-56.
- Wyczesany, M.; Capotosto, P.; Zappadsodi, F.; Prete, G. Hemispheric asymmetries and emotions: evidence from effective connectivity. Neuropsychologia 2018, 121, 98–105. [Google Scholar] [CrossRef] [PubMed]
- Palomero-Gallagher, N.; Amunts, K. A short review on emotion processing: a lateralized network of neuronal networks. Brain Struct Funct 2022, 227, 673–684. [Google Scholar] [CrossRef] [PubMed]
- Abdallah, C.G.; Geha, P. Chronic pain and chronic stress: two sides of the same coin. CS 2017, 1, 1–10. [Google Scholar] [CrossRef] [PubMed]
- Puntillo, F.; Giglio, M.; Paladini, A.; Perchiazzi, G.; Viswanath, O.; Urits, I.; Sabba, C.; Varrassi, G.; Brienza, N. Pathophysiology of musculoskeletal pain: a narrative review. Ther Adv Musculoskelet Dis 2021, 13, 1–12. [Google Scholar] [CrossRef] [PubMed] [PubMed Central]
- Khalifa, M.; Albadawy, M. AI in diagnostic imaging: revolutionising accuracy and efficiency. Comput Methods Programs in Biomed Update 2024, 5, 12. [Google Scholar] [CrossRef]
- Hunter, O.F.; Perry, F.; Salehi, M.; Bandurski, H.; Hubbard, A.; Ball, C.G.; Hameed, S.M. Science fiction or clinical reality: a review of the applications of artificial intelligence along the continuum of trauma care. World J Emerg Surg 2023, 18, 16–39. [Google Scholar] [CrossRef]
- Tagliaferrie, S.D.; Angelova, M.; Zhao, X.; Owen, P.J.; Miller, C.T.; Wilkin, T.; Belavy, D.L. Artificial intelligence to improve back pain outcomes and lessons learnt from clinical classification approaches: Three systematic reviews. NPJ Digit Med 2020, 3, 93–109. [Google Scholar] [CrossRef]
- Corban, J.; Lorange, J.-P.; Lavereiere, C.; Khoury, J.; Richevsky, G.; Burman, M.; Marineau, P.A. Artificial Intelligence in the management of anterior cruciate ligament injuries. Orhop J Sports Med 2021, 9, 1–12. [Google Scholar] [CrossRef]
- Kokkotis, C.; Moustakidis, S.; Tsatalas, T.; Ntakolia, C.; Chalatsis, G.; Konstadakos, S.; Hantes, M.E.; Giakis, G.; Tsaopoulous, D. Leveraging explainable machine learning to identify gait biomechanical parameters associated with anterior cruciate ligament injury. Sci Rep 2022, 12, 6647–6659. [Google Scholar] [CrossRef] [PubMed]
- Rajaei, F.; Cheng, S.; Williamson, C.A.; Wittrup, E.; Najarian, K. AI-based decision support system for traumatic brain injury: A survey. Diagn 2023, 13, 1640–1660. [Google Scholar] [CrossRef] [PubMed]
- Awasthi, A.; Bhaskar, S.; Panda, S.; Roy, S. A review of brain injury at multiple time scales and its clinical pathological correlation through in silico modelling. Brain Metaphysics, 2024, 5, 100146–100158. [Google Scholar] [CrossRef]
- Sigurdon, H.; Chan, J.H. Machine learning applications to sports injury: a review. icsSPORTS 2021, 157–168. [Google Scholar]
- Schultebraucks, K.; Chang, B.P. The opportunities and challenges of machine learning in the acute care setting for precision prevention of posttraumatic stress sequelae. Exp Neurol 2021, 336, 1–16. [Google Scholar] [CrossRef]
- Siegel, C.E.; Laska, E.M.; Lin, Z.; Xu, M.; Abu-Amara, D.; Jeffers, M.K.; Meng, Q.; Milton, N.; Flory, J.D.; Hammamieh, R.; Diagle BJJr Gautam, A.; Dean, K.R.; Reus, V.I.; Wokowitz, O.M.; Mellon, S.H.; Ressler, K.J.; Yehuda, R.; Wang, K.; Hood, L.; Doyle, I.I.I.F.J.; Jett, M.; Marmar, C. Utilization of machine learning for identifying symptom severity military-related PTSD subtypes and their biological correlates. Transl Psychiatry 2021, 11, 227–239. [Google Scholar] [CrossRef]
- Park, A.H.; Mirabelli, P.H.; Elder, S.; Steyrl, D.; Lueger-Shuster, B.; Scharnowski, F.; O’Connor, C.; Martin, P.; Lanius, R.A.; Mckinnon, M.C.; Nicholson, A.A. Machine learning models predict PTSD severity and functional impairment: A personalized medicine approach for uncovering complex associations among heterogenous symptom profiles. Psychol Trauma: Theory Res Pract Policy 2023, 17, 372–386. [Google Scholar] [CrossRef]
- Kutcher, M.E.; Goodin, B.R.; Rao, U.; Mooris, M.C. Predicting pain among female survivors of recent interpersonal violence: A proof-of-concept machine-learning approach. PLOSOne. 2021. [Google Scholar] [CrossRef]
- Gozzi, N.; Preatoni, G.; Ciotti, F.; Hubli, M.; Schweinhardt, P.; Curt, S.; Raspopovic, S. Unravelling the physiological and psychosocial signatures of pain by machine learning. Med 2024, 13, 1495–1509. [Google Scholar] [CrossRef]
- Worksafe Australia. Workers’ Compensation-Bodily Location [Internet]. 2022 [cited 20th November 2024]. Available from: https://data.safeworkaustralia.gov.au/interactive-data/topic/workers-compensation.
- State Insurance Regulatory Authority. Guidelines for the management of acute whiplash associated disorders for health professionals. Sydney: third edition 2014.
- Cui, D.; Janela, D.; Costa, F.; Molinos, M.; Areias, A.C.; Moulder, R.G.; Scheer, J.K.; Bento, V.; Cohen, S.P.; Yanamadala, V.; Correia, F.D. Randomized-controlled trial assessing a digital care program versus conventional physiotherapy for chronic low back pain. NPJ Digit Med 2023, 6, 1–10. [Google Scholar] [CrossRef]
- Sword Health Inc. Sword [Internet]. 2024 [Cited 30 November 2024]. Available from: https://swordhealth.com/.
- Janela, D.; Costa, F.; Molinos, M.; Moulder, R.G.; Lains, J.; Francisco, G.E.; Bento, V.; Cohen, S.P.; Correia, F.D. Asynchronous and tailored digital rehabilitation of chronic shoulder pain: A prospective longitudinal cohort study. J Pain Res 2022, 8, 53–66. [Google Scholar] [CrossRef] [PubMed]
- Areias, A.; Costa, F.; Janela, D.; Molinos, M.; Moulder, R.G.; Lains, J.; Scheer, J.K.; Bento, V.; Yanamadala, V.; Cohen, S.P.; Correia, F.D. Impact on productivity impairment of a digital care program for chronic low back pain: A prospective longitudinal cohort study. Musculoskelet Sci Pract 2023, 63, 1–9. [Google Scholar] [CrossRef] [PubMed]
- Janela, D.; Costa, F.; Areias, A.C.; Molinos, M.; Moulder, R.G.; Lains, J.; Bento, V.; Scheer, J.K.; Yanamadala, V.; Cohen SPet, a.l. Digital care programs for chronic hip pain: A prospective longitudinal cohort study. Healthcare 2022, 10, 1–16. [Google Scholar] [CrossRef] [PubMed]
- Costa, F.; Janela, D.; Molinos, M.; Lains, J.; Franscisco, G.E.; Bento, V.; Correia, F.D. Telerehabilitation of acute musculoskeletal multi-disorders: Prospective, single arm, interventional study. BMC Musculoskeletal Disorders 2022, 23, 29–41. [Google Scholar] [CrossRef]
- Vaegter, H.B.; Handberg, G.; Kent, P. Brief psychological screening questions can be useful for ruling out psychological conditions in patients with chronic pain. Clin J Pain 2018, 35, 113–121. [Google Scholar] [CrossRef]
- Kelly, A.-M. The minimum clinically significant difference in visual analogue scale pain score does not differ with severity of pain. Emerg Med J 2001, 18, 205–207. [Google Scholar] [CrossRef]
- Shapiro, F. EMDR Institute Basic Training Course Weekend 2 Training of The Two Part EMDR Therapy Basic Training. 1990-2022. EMDR Institute Inc.
- Vlaeyen, J.W.; Kole-Snijders, A.M.; Boeren RGet, a.l. Fear of movement/(re)injury in chronic low back pain and its relation to behavioural performance. Pain 1995, 62, 363–372. [Google Scholar] [CrossRef]
- Delgado, D.A.; Lambert, B.S.; Boutris, N.; McCulloch, P.C.; Robbins, A.B.; Moreno, M.R.; Harris, J.D. Validation of Digital Visual Analog Scale Pain scoring with a traditional paper-based visual analog scale in adults. JJAAOS Glob Res Rev 2018, 2, e088–e094. [Google Scholar] [CrossRef]
- Jensen, M.P.; Chen, C.; Brugger, A.M. Interpretation of visual analog scale ratings and change scores: a reanalysis of two clinical trials of postoperative pain. J Pain 2003, 4, 407–414. [Google Scholar] [CrossRef]
- Boonstra, A.M.; Schiphorst Preuper, H.R.; Balk, G.A.; Stewart, R.E. Cut-off points for mild, moderate, and severe pain on the visual analogue scale for pain in patients with chronic musculoskeletal pain. Pain 2014, 155, 2545–2550. [Google Scholar] [CrossRef]
- Spitzer, R.L.; Kroenke, K.; Williams JBet, a.l. A brief measure for assessing generalized anxiety disorder: the GAD-7. Arch Intern Med 2006, 166, 1092–1097. [Google Scholar] [CrossRef]
- Cohen, S.; Williams, G. Perceived stress in a probability sample of the United States. In Spacapan S, Oskamp S Editors. The Social Psychology of Health. Newbury park, CA: Sage; 1988: 31-66.
- Sullivan, M. The Pain Catastrophizing Scale. 2009 Available at: https://www.oregon.gov/oha/HPA/dsi-pmc/PainCareToolbox/Pain%20Catastrophizing%20Scale.pdf.
- Kroenk, K.; Spitzer, R.L.; Williams, J.B. The PHQ-9: validity of a brief depression severity measure. J Gen Intern Med 2001, 16, 606–613. [Google Scholar] [CrossRef]
- Vlayen, J.; Kole-Snijders, A.; Boeran, R.; van Eek, H. Fear of movement/(re) injury in chronic low back pain and its relation to behavioural performance. Pain 1995, 62, 363–372. [Google Scholar] [CrossRef]
- Mehta, C.R.; Patel, N.R. Exact Tests in SPSS: Fisher’s Exact Test and Monte Carlo Methods. IBM Spess Exact Tests. Uk: IBM Corporation; [accessed 2024 Jan 5] Available from: https://www.sussex.ac.uk/its/pdfs/PASW_Exact_Tests.pdf.
- Kass, G.V. An exploratory technique for investigating large quantities of categorical data. J Royal Stat Soc (Appl Stat), 1980. [Google Scholar] [CrossRef]
- Brieman, L.; Friedman, J.H.; Olshen, R.A.; Stone, C.J. Classification and regression trees. Wodsworth & Brooks/Cole Advanced Books & Software, Monterey CA, USA 1987.
- Loh, W.; Shih, Y. Split selection methods for classification trees. Statistica sinica 1997, 7, 815–840. [Google Scholar]
- Vijaykumar B, Vikramkumar, Trilochan. Bayes and Naïve Bayes Classifier. Arixiv 2014, arXiv:1404.0933. [CrossRef]

Table 1.
Outcomes, means and standard deviations at onboarding and discharge.
| Status | N (%) | 1a | 2 | 3 | 4 | 5 | 6 | 7 | 8 | 9 | 10 |
| USC | 39 (3.37) | 47.43 (12.73) |
33.79 (45.59) |
57.7 (25.4) |
6.28 (2.63) |
7.13 (2.70) |
6.08 (3.36) |
5.87 (3.07) | 5.85 (3.44) |
5.51 (3.54) | 41.0/41.0/18.0 |
| SW | 38 (3.7) | 49.57 (13.00) | 14.29 (19.64) | 62.4 (19.9) | 5.55 (3.49) | 6.11 (3.29) | 5.55 (3.19) | 5.29 (3.12) | 5.58 (2.83) | 6.24 (3.07) | 7.9/71.1/21.0 |
| DNC | 153 (13.9) | 40.97 (13.33) | 13.27 (18.74) | 59.2 (22.8) | 6.21 (2.93) | 6.68 (2.63) | 6.24 (2.96) | 5.84 (2.73) | 5.72 (3.05) | 6.04 (3.09) | 30.1/66.0/3.9 |
| DNCP | 97 (8.9) | 40.92 (12.52) | 18.33 (28.61) | 65.2 (19.3) | 6.54 (3.01) | 7.46 (2.38) | 6.79 (2.97) | 6.51 (2.88) | 6.98 (2.81) | 6.80 (2.75) | 23.7/70.1/6.2 |
| AW | 5 (0.5) | 55.40 (7.37) | 7.40 (3.78) | 44.0 (20.7) | 4.20 (4.03) | 5.20 (3.11) | 4.40 (4.04) | 5.20 (4.09) | 3.60 (2.41) | 4.40 (2.41) | 40.0/60.0/0.0 |
| NR | 17 (1.6) | 43.53 (13.16) | 33.79 (45.99) | 61.8 (1.78) | 6.06 (2.70) | 6.94 (3.01) | 7.06 (2.82) | 6.18 (2.86) | 7.06 (2.25) | 7.94 (2.28) | 29.7/58.5/11.8 |
| NR Disc. | 62.5 (18.5) |
5.58 (3.73) |
6.33 (2.81) |
6.17 (3.09) |
5.17 (2.83) |
6.00 (2.29) |
6.00 (3.41) |
||||
| PR | 192 (17.5) | 44.55 (12.86) | 18.71 (25.00) | 58.9 (18.6) | 5.82 (2.96) | 6.51 (2.56) | 5.90 (2.97) | 5.45 (2.68) | 5.88 (2.72) | 5.49 (3.07) | 28.1/66.1/5.8 |
| PR Disc. | 51.9 (18.2) |
5.32 (2.89) |
5.76 (2.41) |
5.38 (2.78) |
4.99 (2.73) |
5.41 (2.49) |
5.29 (2.94) |
||||
| FR | 555 (50.5) | 41.34 (13.27) | 16.76 (35.00) | 42.9 (23.0) | 4.78 (3.11) | 5.38 (2.91) | 4.59 (3.19) | 4.36 (3.00) | 4.27 (3.10) | 4.36 (3.13) | 53.7/42.5/3.8 |
| FR Disc. | 41.3 (23.5) |
4.21 (3.09) |
4.73 (2.91) |
4.18 (3.05) |
4.10 (2.99) |
4.05 (3.03) |
4.32 (3.13) |
||||
| Cum. | 1096 (100) | 42.36 (13.28) | 17.51 (31.34) | 51.5 (23.6) | 5.42 (3.12) | 6.06 (2.88) | 5.37 (3.22) | 5.07 (3.00) | 5.13 (3.13) | 5.17 (3.21) | 100/100/100 |
1 = Age, 2 = Weeks from Injury to Onboard Interval, 3 = VAS, 4 = Anxiety, 5 = Stress, 6 = Hopelessness (Depression Item 1), 7 = Low Interest (Depression Item 2), 8 = Pain Catastrophising, 9 = Kinesiophobia. 10 = Optimism about recovery (Yes% / Unsure% / No%). “Disc.” = score at discharge, USC = Unsuitable for clinic, SW = Surgical Withdrawals, DNC = Did Not Commence, DNCP = Did Not Complete, AW = Administrative Withdrawal, NR = No Recovery, PR = Partial Recovery, FR = Full Recovery. aDate of birth was only available for 1015 participants.
Table 2.
Means and standard deviations of WAD, NI, BI SI and Cumulatively.
| Injury | N | % | 1a | 2 | 3 | 4 | 5 | 6 | 7 | 8 | 9 | 10 |
| WAD | 260 | 23.72% | 40.06 (13.51) | 7.05 (4.38) | 53.8 (24.1) | 6.53 (2.66) | 5.99 (3.08) | 5.83 (3.15) | 5.17 (2.95) | 5.18 (3.29) | 5.15 (3.33) | 164.78 (16.62) |
| NI | 55 | 5.02% | 25.36 (11.40) | 25.36 (59.03) | 53.5 (21.4) | 6.85 (2.60) | 6.85 (2.60) | 5.91 (3.11) | 5.71 (3.13) | 6.11 (3.22) | 5.69 (3.21) | 242.20 (38.80) |
| BI | 364 | 33.21% | 41.30 (12.67) | 21.20 (36.67) | 51.9 (23.1) | 6.18 (2.82) | 5.47 (3.07) | 5.56 (3.20) | 5.14 (3.00) | 5.22 (3.09) | 5.21 (3.15) | 166.33 (18.82) |
| SI | 391 | 35.75% | 45.01 (13.49) | 20.69 (27.61) | 49.0 (23.7) | 5.47 (3.03) | 6.53 (2.66) | 4.78 (3.19) | 4.82 (3.00) | 4.88 (3.02) | 5.08 (3.17) | 218.54 (16.11) |
| Cum. | 1096 | 100 | 42.41 (13.26) | 17.53 (31.37) | 51.4 (23.6) | 6.05 (2.88) | 6.05 (2.88) | 5.37 (3.22) | 5.06 (3.00) | 5.13 (3.13) | 5.17 (3.21) | 188.77 (18.57) |
1 = Age, 2 = Weeks from Injury to Onboard Interval, 3 = VAS (mm), 4 = Stress, 5 =Anxiety, 6 = Hopelessness (Depression Item 1), 7 = Low Interest (Depression Item 2), 8 = Pain Catastrophising, 9 = Kinesiophobia, 10 = Minutes on SWORD, WAD = Whiplash Associated Disorder, NI = Neck Injury, BI = Back Injury, SI = Shoulder Injury. aDate of birth was only available for 1015 participants.
Table 3.
Outcomes by Injury Type.
| Status | USC (%) | DNC (%) | DNCP (%) | NR (%) | PR (%) | FR (%) |
| WAD | 10 (2.75) | 52 (14.28) |
21 (5.76) |
5 (1.38) | 46 (12.67) | 150 (41.21) |
| NI | 5 (18.18) |
4 (7.27) |
6 (10.90) |
3 (5.46) |
12 (21.81) |
25 (45.45) |
| BI | 18 (4.97) | 51 (14.01) |
36 (9.90) |
5 (1.37) |
81 (22.25) |
171 (46.98) |
| SI | 44 (11.28) |
46 (11.76) |
34 (8.70) |
4 (1.02) |
53 (13.55) |
209 (53.45) |
| Cum. | 77 | 153 | 97 | 17 | 192 | 555 |
Table 4.
Percentage without / percentage with / overall percentage classified by machine learning models built on MCW in response to 4-questions ratings on 80% training and 20% “test” data for anxiety, stress, depression, pain catastrophisation (Pain C.) and Kinesiophobia classification (Kines C.).
Table 4.
Percentage without / percentage with / overall percentage classified by machine learning models built on MCW in response to 4-questions ratings on 80% training and 20% “test” data for anxiety, stress, depression, pain catastrophisation (Pain C.) and Kinesiophobia classification (Kines C.).
|
Classifier (Min. Parent/Child) |
Anxiety | Stress | Depress. | Pain C. | Kines C. |
| CHAID (10/2) Test CHAID (5/2) Test |
38.6/85.3/69.4 28.6/80.0/60.4 50.6/79.7/69.6 38.9/70.9/59.7 |
69.3/61.2/65.2 60.2/58.4/59.3 72.4/53.9/62.2 74.8/53.3/65.2 |
79.4/46.7/66.3 77.1/32.1/61.9 88.1/32.8/66.6 86.3/26.8/63.4 |
94.9/18.5/65.7 95.5/17.2/63.4 85.5/39.8/67.7 83.8/32.1/64.1 |
6.4/96.2/62.8 7.5/96.9/62.7 45.3/76.1/64.4 37.0/70.3/58.5 |
| Ex-CHAID (10/2) Test Ex-CHAID (5/2) Test |
0.0/100/64.8 0.0/100/65.5 26.8/91.7/68.3 23.0/88.8/68.7 |
55.5/71.9/63.7 51.0/61.9/56.9 72.9/50.8/61.7 73.1/61.8/67.3 |
79.8/43.1/65.1 85.2/38.6/69.8 94.3/21.1/66.1 88.5/25.3/63.5 |
87.9/37.3/69.1 84.2/30.2/59.5 87.3/32.6/66.4 89.6/28.3/64.6 |
0.9/99.8/63.3 0.0/98.5/60.0 37.3/80.4/64.4 27.9/77.9/56.5 |
| CRT (10/2) Test CRT (5/2) Test |
61.4/77.8/71.9 66.7/79.5/75.6 50.2/85.9/74.0 33.7/84.7/63.4 |
67.7/63.7/70.0 77.5/59.2/68.5 79.3/63.7/71.4 64.5/61/4/62.9 |
87.3/54.3/74.8 77.4/45.3/63.7 85.1/55.1/73.3 83.5/73.3/70.3 |
84.1/59.9/74.7 75.4/41.9/62.3 83.4/57.8/73.6 78.1/41.5/63.2 |
50.6/79.5/68.5 37.2/67.3/57.0 42.4/82.6/67.2 19.7/79.5/59.6 |
| QUEST (10/2) Test QUEST (5/2) Test |
11.6/97.2/68.0 9.0/97.7/64.4 19.9/93.5/69.1 14.6/87.1/56.8 |
64.2/67.1/65.8 59.7/60.2/59.9 65.2/64.6/64.9 62.8/64.1/63.5 |
87.6/26.7/64.0 86.8/14.0/58.6 86.4/39.9/68.1 82.7/37.5/66.2 |
89.5/23.6/63.6 92.8/28.2/69.4 89.3/22.6/63.4 89.7/16.7/61.8 |
7.4/97.1/64.1 6.0/98.4/61.4 0.0/100/62.6 0/100/62.7 |
| NBC Test |
45.9/94.0/78.0 33.7/85.8/67.4 |
73.3/82.1/77.7 65.8/63.6/60.3 |
75.6/60.1/73.4 68.1/60.4/65.1 |
87.2/46.7/72.0 72.8/33.9/58.2 |
46.2/86.0/69.4 27.3/77.8/59.5 |
Disclaimer/Publisher’s Note: The statements, opinions and data contained in all publications are solely those of the individual author(s) and contributor(s) and not of MDPI and/or the editor(s). MDPI and/or the editor(s) disclaim responsibility for any injury to people or property resulting from any ideas, methods, instructions or products referred to in the content. |
© 2025 by the authors. Licensee MDPI, Basel, Switzerland. This article is an open access article distributed under the terms and conditions of the Creative Commons Attribution (CC BY) license (http://creativecommons.org/licenses/by/4.0/).
Copyright: This open access article is published under a Creative Commons CC BY 4.0 license, which permit the free download, distribution, and reuse, provided that the author and preprint are cited in any reuse.


