
Submitted:
05 November 2025
Posted:
06 November 2025
You are already at the latest version
Preprints on COVID-19 and SARS-CoV-2
Abstract
Introduction: Immune dysfunction plays a significant role in metabolic syndrome, contributing to both IR and chronic low-grade inflammation. This immune dysfunc-tion is characterized by overproduction of inflammatory cytokines among which of primary importance are tumor necrosis factor-alpha (TNF-α), interleukin-6 (IL-6) and MCP-1, whereas others such as IFN-γ, IL-17А, and the anti-inflammatory IL-10 appear to be of secondary importance. Cytokines also play a significant role in post-COVID disorders contributing to prolonged immune dysregulation and persistent subclinical inflammation. However, their role in the newly emerging metabolic disorders follow-ing infection remains poorly defined. Methods and materials: In the current study 78 patients (26 men and 52 women) were included, divided into two groups - group 1 (individuals with newly diagnosed car-bohydrate disorders after proven COVID-19 or post-COVID group; n=35) and group 2 (COVID-19 negative persons with Metabolic Syndrome; n=33). They were further di-vided into several subgroups according to type of metabolic disorder present. Standard biochemical, hormonal and immunological parameters were measured using ELISA and ECLIA methods, as wells as some indices for assessment of insulin resistance were calculated using the corresponding formula. Results: Patients from both groups demonstrate similar (P>0.05) metabolic parameters including BMI, lipid profile, uric acid, whereas those from the Post-COVID group demonstrated poor glycaemic parameters (Fasting plasma glucose and HbA1c) (P< 0.05). Patients from both Post-COVID and COVID-negative group demonstrated high levels of IR, the latter having higher mean values of both indices. Higher TNF-α and IL-10 values were registered in the Post-COVID group (P>0.05) whereas higher levels of INF-γ (P< 0.001) and IL-17A we registered in the COVID-negative group (P>0.05). A lot of correlations were found between the immunological parameters evaluated and the metabolic ones. Conclusion: The observed changes in both metabolic and immune parameters studied among the two groups show many similarities, but some significant differences have also been identified. What can be asserted is that cytokines definitely have an im-portant role in Post-COVID newly-emerging metabolic disorders contributing to both adipose tissue dysfunction, IR, dysglycaemia and dyslipidemia observed.
Keywords:
immunometabolic profile
; COVID-19
; new-onset metabolic disorders
; IR
; cytokines
1. Introduction
Metabolic syndrome (MetS) is defined as a combination of interrelated physiological, biochemical, clinical, and metabolic factors that directly increase the risk of atherosclerotic cardiovascular disease (ASCVD), type 2 Diabetes mellitus (T2DM), and all-cause mortality. [1,2] This constellation of metabolic abnormalities includes central obesity, atherogenic dyslipidemia, arterial hypertension, dysglycaemia (various deviations in carbohydrate glucose tolerance), pro-inflammatory and prothrombotic state. [3]
Insulin resistance (IR) and chronic low-grade inflammation are considered major, interconnected characteristics and core components of the pathogenesis of MetS with both immune and adipose tissue dysfunction playing essential role in their emergence and maintenance. [4]
Immune dysfunction, driven by a complex interplay between adipocytes and immune cells, plays a significant role in metabolic syndrome, contributing to both IR and chronic low-grade inflammation. [5] This immune dysfunction is characterized by overproduction of inflammatory cytokines released from activated immune cells, especially macrophages, further impairing insulin signaling and promoting inflammation, creating a feedback loop that worsens metabolic dysfunction. [6] Major cytokines implicated in low-grade inflammatory state in MetS are tumor necrosis factor-alpha (TNF-α) and interleukin-6 (IL-6) and MCP-1, [7] whereas others such as IFN-γ, IL-17А, and the anti-inflammatory IL-10 appear to be of secondary importance. [8,9,10]
Interestingly, IR and adipocyte dysfunction are also observed in the course and after SARS-CoV-2 infection, and they also show a link to the immune dysregulation induced by the virus. [11] Adipose tissue dysfunction in the course of COVID-19 is characterized with an increase in leptin levels and accompanying leptin resistance as well as dramatic decrease in adiponectin levels. [11,12]
Cytokine storm, a hyper-inflammatory state with an overproduction of inflammatory cytokines, is a key feature of COVID-19 and is associated with disease severity and negative outcomes, including death. [13] Among the numerous pro-inflammatory cytokines that are elevated during a cytokine storm, IL-1, IL-6, TNF-α and IFN-γ are considered of paramount importance. [14] Cytokines also play a significant role in post-COVID disorders by modulating the immune response, contributing to prolonged immune dysregulation and persistent subclinical inflammation (known as "smoldering cytokine activation"). However, their role in the newly emerging metabolic disorders following infection remains poorly defined. [15]
To what extent are immune system and metabolic disorders similar in newly emerging metabolic disorders, including DM and prediabetes, compared to those observed in classic metabolic syndrome, without prior SARS-CoV-2 exposure is still not revealed and is yet to come.
2. Materials and Methods
2.1. Study Design
A prospective observational study was conducted on 78 patients (26 men and 52 women) who attended the Clinic of Endocrinology and Metabolic Diseases at our hospital for active treatment. In order to investigate if there are common pathophysiological mechanisms implicated in the genesis of carbohydrate disorders and insulin resistance arising after COVID-19 and those observed in the classical Metabolic Syndrome, individuals were selected according to precisely defined criteria and divided into two group and similar diagnostic, metabolic, biochemical and hormonal aspects were studied in each of them.
2.2. Studied Population
The study population includes 2 groups of patients in the age range between 21 and 71 years:
1) Group 1 (Post-COVID group): 35 individuals with newly diagnosed carbohydrate disorders after proven COVID-19 (post-COVID group). All individuals were non-vaccinated and have a history for positive PCR test for COVID-19 at least 6 months before they were newly diagnosed with carbohydrate disorders. They were diagnosed with type 1 Diabetes mellitus (T1DM), T2DM and prediabetic conditions – impaired glucose tolerance (IGT) and impaired glucose tolerance (IGT), as well as normoglycaemic patients with IR and/or hyperinsulinemia. Diagnosis DM was made according to the WHO criteria (2019). [16] Prediabetic conditions (IFG, IGT) were diagnosed according to the WHO criteria (2015). [17] IR and hyperinsulinemia were diagnosed based on serum insulin levels during an oral glucose tolerance test (OGTT).
2) Group 2 (COVID-negative group): 33 individuals with MetS who did not suffer from COVID-19 and without previous vaccination (COVID-19 negative). The diagnosis MetS was made according to the IDF criteria (2009). [3] They were also divided in the aforementioned subgroups (with the exception of T1DM subgroup) – T2DM, IFG, IGT and IR and/or hyperinsulinemia.
2.3. Methods
All individuals included underwent survey, anthropometric measurements and basic clinical exam. Laboratory test were performed after informed consent was signed by the patients.
Standard biochemical parameters were evaluated including fasting plasma glucose, glycated hemoglobin (HbA1c), lipid profile parameters (Total cholesterol, Triglycerides, HDL-cholesterol, LDL-cholesterol) and Uric acid.
Hormonal parameters related to the regulation metabolic homeostasis as fasting insulin, leptin and adiponectin were also evaluated.
Immunological markers including interleukin (IL)-17A along with tumor-necrosis factor –alpha (TNF-α) and interferon-gamma (INF-γ) levels were monitored as potent pro-inflammatory cytokines implicated in both COVID-19 and MetS-related immune disturbances pathogenesis, as well as IL-10 levels - an anti-inflammatory cytokine.
The hormonal samples were studied by electrochemiluminescent immunoassay (ECLIA), following protocol, on an automatic analyzer. All immunological samples, as well as the samples for some of the hormonal studies, were investigated by enzyme-linked immunosorbent assay (ELISA) using commercial kits.
Insulin resistance was determined using IR indices, calculated according to corresponding the formula:
1) Homeostasis model assessment of insulin resistance (HOMA-IR)
This index is calculated HOMA-IR = Fasting plasma glucose (mmol/l) x Fasting insulin (µIU/ml)/22. [18]
2) Metabolic Score for Insulin Resistance (METS-IR)
METS-IR is calculated using the formula: METS-IR = (ln ((2 × fasting glucose (mg/dL) + triglycerides (mg/dL)) × BMI (kg/m2))/(ln (HDL-C (mg/dL)). The glucose, triglyceride, and HDL-C values are first converted to the appropriate units of measurement using the following formulas: glucose (mg/dL) = glucose (mmol/l) × 18.018; triglycerides (mg/dl) = triglycerides (mmol/l) × 88.57; HDL-C (mg/dl) = HDL-C (mmol/l) ×38.67
2.4. Statistical Analysis
Statistical Package for Social Sciences version 25 (SPSS – 25) was used for data statistical analysis. The quantitative variables were assigned a mean value, standard deviation (SD), standard error of the mean, and a 95% confidence interval for the mean. Kolmogorov-Smirnov and Shapiro-Wilk tests were used to check the normality of the distribution of the quantitative variables. Mann-Whitney U-test was used to determine statistically significant differences between two groups. Differences at an empirical significance level of P<0.05 were considered statistically significant. The non-parametric Spearman rank-order correlation test was used to determine the monotonic association (rs) between two variables. Only statistically significant correlations (P<0.05) were considered.
2.5. Ethical Aspects
The study is performed after received ethical approval from the Ethical commission of Medical University Pleven – Protocol №72/23.06.23. The study adhered to the ethical principles of the Declaration of Helsinki. Each person included in the study declared their voluntary willingness to participate in the study and gave their consent for the publication of their de-identified clinical data by signing and dating the consent form. The researcher also signed the informed consent, declaring his obligation to comply with the ethical principles set out in the Declaration of Helsinki. No psychological pressure was allowed on the volunteers to sign the informed consent.
3. Results
3.1. General Characteristic
The main demographic features of the population studied are presented on the table below (Table 1). As seen the mean age of the patients was 46.78 ± 4.74 years old with group 2 (COVID-19 negative subjects with MetS) being older (48.21 ± 4.51 years) and group 1 (patients with new onset carbohydrate disorder following COVID-19) being younger (45.35 ± 4.98 years) with significant difference between the groups (P<0.01).
Female predominance was most pronounced in the COVID-negative group (group 2) where female comprising 90.90% of all, while in the Post-COVID group (group 1), women accounted for 62.85% of the group.
Almost half of the individuals (42.65%) had a positive family history of DM – 40% in group 1 and 45.45% in group 2 respectively.
Table 2 comprise distribution of the patients according to the type of metabolic disorder present. Group 1 included a total of 35 individuals with newly emerging carbohydrate disorders after previous SARS-CoV-2 infection (Post-COVID group). In the studied group, a total of 19 individuals (54.28%) had newly diagnosed DM – 8 of them were diagnosed with T1DM, including LADA (22.85%), while the remaining 11 individuals (31.43%) were diagnosed with T2DM. Prediabetes as IGT was found in 3 individuals (8.57%), and as IFG in 4 patients (11.43%). The remaining 9 individuals, were normoglycaemic (25.72%) with data on basal and/or stimulated hyperinsulinemia and IR. (Table 2)
Group 2 comprises 33 individuals with negative PCR-test and no history of COVID-19 vaccination /exposure (COVID-negative group) and accompanying MetS. MetS was diagnosed according to IDF criteria. Of these, 11 individuals (33.33%) had diagnosis T2DM. The remaining individuals had prediabetes including 3 with IFG (9.09%), 4 with IGT (12.12%) and the remaining normoglycaemic 15 (45.45%) had data for basal and/or hyperinsulinemia and IR (Table 2).
3.2. Body Mass Index (BMI)
Following BMI values in the studied population subjects from the Post-COVID group demonstrated lower BMI values (31.91 ± 2.57 kg/m2) compared to the COVID-negative group (35.67 ± 7.89 kg/m2). However statistical significant difference was not found (P>0.05).
All patients from the Post-COVID group (group 1), except those with T1DM, had higher BMI values >30 kg/m2 (ranging from 23 – 49 kg/m2). BMI was studied among the different subgroups (according to the disorder present) and as expected, the subgroup of individuals with T1DM reported mean BMI values within the normal body weight range (23.63 kg/m2). The highest mean BMI values were reported in the subgroup of individuals with T2DM (36.64 kg/m2) and those with IR and/or hyperinsulinemia (36.89 kg/m2). Patients with IFG and IGT demonstrated quite similar values of mean BMI – respectively 32.75 kg/m2 and 33.33 kg/m2.
Evaluating the BMI in the different subgroups in the COVID-negative group (group 3), it was striking that all individuals had increased BMI values >30 kg/m2 (ranging from 23 – 48 kg/m2). The subgroup of individuals with IFG had the highest BMI – 41 kg/m2, followed by those with T2DM (BMI – 38.45 kg/m2), which was also higher than the average BMI for the entire group – 33.67 kg/m2. Normoglycaemic individuals with IR demonstrated the lowest BMI – 32.69 kg/m2, compared to those with T2DM and IFG, while those with IGT demonstrated similar levels – 33.5 kg/m2. In any case, no statistically significant differences were found between the individual subgroups (P>0.05).
3.3. Lipid Profile Parameters
Patients from both groups demonstrate similar values of total cholesterol (p>0.05). The average total cholesterol levels in group 1 are 4.87 ± 0.56 mmol/l (range 3.2-10.4) while in group 2 they are 4.88 ± 1.14 mmol/l (range 2.30-10.40). Following trends in individual subgroups individuals from the T1DM subgroup (from group 1) and those with IFG (from group 2) had the highest values of total cholesterol – 5.21 ± 2.28 mmol/l and 5.39 ± 0.23 mmol/l respectively. When comparing the corresponding subgroups no statistical difference was found (P>0.05).
Mean triglycerides (TG) levels of subjects from group 1 were 1.88 ± 0.84 mmol/l (range 0.9 - 3.67) which were quite similar to those observed in group 2 – 1.90 ± 0.82 mmol/l (range 0.85 - 4.16). No statistical significant difference was found between the separate groups or between the individual subgroups (P>0.05). Highest levels were registered among IGT subgroup (from group 1) and T2DM subgroup (from group 2) – 2.15 mmol/l and 2.33 ± 0.89 mmol/l respectively.
Individuals from the Post-COVID group demonstrated higher levels of HDL-Cholesterol - 0.95 ± 0.38 mmol/l (range 0.1 – 2.06) compared to the COVID-negative group where lowest levels were recorded – 0.87 ± 0.23 mmol/l (range 0.51 – 1.55). In any case, both groups showed sub-optimal levels (P>0.05). When comparing the respective subgroups statistical significant difference was found between the T2DM subgroups (P=0.019) with diabetics from the Post-COVID group having higher values. IFG subgroups also differed (P=0.028) with patients from the Post-COVID group again having higher values. As seen only IFG subjects from both subgroups demonstrated mean HDL-levels in the reference range.
Following serum LDL-Cholesterol levels subject from the COVID-negative group had higher mean values compared to the Post-COVID one – 3.16 ± 0.96 mmol/l (range 1.02 – 5.12) and 3.09 ± 1.37 mmol/l (range 1.51 – 8.14) respectively. No statistically significant difference was found neither between the two groups neither between the corresponding subgroups (P>0.05). As seen all subgroups demonstrated increased mean levels of LDL-C with the exception of IGT subgroup (group 2) where borderline values were recorded - 2.58 ± 0.9 mmol/l (Table 3).
3.4. Uric Acid
Uric acid levels were also monitored among the population studied with higher values being recorded in the COVID-negative group – 415.04 ± 101.37 µmol/ml (range 298 - 718) and lower in the Post-COVID one – 398.23 ± 101.58 µmol/ml (range 193 - 625) (P>0.05). Among individuals from group 1 those from IGT subgroup had higher values who statistically differ from the corresponding subgroup from group 2 (P=0.033) (Table 3).
3.5. Glycaemic Parameters
Fasting plasma glucose and HbA1c levels were evaluated among the population studied with individuals from group 1 having higher mean values of fasting plasma glucose – 7.64 ± 1.31 mmol/l (ranging from 4.1 to 17.1mmol/l). Individuals from group 2 demonstrated lower mean values – 5.69 ± 0.62 mmol/l (ranging from 4.04 to 11.2 mmol/l) and they statistically differ from those found in group 1 (P=0.039).
As expected individuals from group 1 had higher HbA1c levels – 8.0 ± 1.16% (ranging from 4.9 to 13.56%) than those from group 2 – 7.04 ± 0.89% (ranging from 5.42 to 9.56%) and no statistically significant difference was found (P=0.162).
3.6. Hormonal Parameters
Major adipokines levels - leptin and adiponectin have also been studied. Individuals from group 2 demonstrated higher mean levels of leptin – 52.02 ± 34.59 ng/ml (ranging from 10.45 to 111.92) compared to those from group 1 – 32.14 ± 25.69 ng/ml (ranging from 1.28 to 97.98) (P>0.05).
When comparing leptin levels in the corresponding subgroups statistical significant difference was only found between the T2DM subgroups (P=0.032) with diabetics from the COVID-negative group having higher values - 69.44 ± 35.77 ng/ml compared to those from the Post-COVID group - 38.16 ± 19.7 ng/ml (Table 4).
Monitoring of adiponectin levels revealed that individuals from both group 1 and 2 demonstrated similar values – 25.03 ± 1.84 µg/ml (ranging from 18.55 to 27.22 µg/ml) and 25.87 ± 0.6 µg/ml (ranging from 24.51 to 26.98 µg/ml) respectively (P>0.05).
Patients from the different subgroups demonstrated alike mean adiponectin levels (P>0.05) (Table 4).
3.7. Insulin Resistance Indices
Insulin resistance was determined using both HOMA-IR and METS-IR. Patients from both Post-COVID and COVID-negative group demonstrated significant IR using both indices with patients from group 2 having higher mean values.
Mean HOMA-IR values in patients from the COVID-negative group were 8.4 ± 17.67 (range 0.7-89.52) and 7.41 ± 11.37 (0.63-62.21) in the Post-COVID group without significant difference present (P>0.05). Patients from the COVID-negative group also had higher METS-IR mean values – 61.19 ± 17.21 (31.57-101.53) and those from the Post-COVID group had lower - 55.26 ± 18.3 (32.45-124.97). Anyway statistically significant difference was not found (P<0.05).
Levels of HOMA-IR were followed among different subgroups in both group 1 and group 2 (Table 5). Patients with IFG from group 1 (Post-COVID group) demonstrate higher mean values, followed by those with T2DM and IGT. Interestingly even subjects with T1DM demonstrated significant IR. Among individuals from group 2 (COVID-negative group) highest mean HOMA-IR values were recorded in T2DM subgroup and lowest in subjects with IR or/and hyperinsulinemia. When comparing the corresponding subgroups from each group no statistically significant difference was found (P>0.05).
Levels of METS-IR were also followed among different subgroups in both group 1 and group 2 (Table 5). In group 1 (Post-COVID group) higher mean values were recorded in T2DM subgroup, followed by those with IGT and IR or/and hyperinsulinemia. Patients with T1DM demonstrated higher mean values of the index. In group 2 (COVID-negative group) T2DM subgroup demonstrated highest levels. Anyway no statistically significant difference was found between the corresponding subgroups (P>0.05).
3.8. Immunological Parameters
3.8.1. Pro-Inflammatory Cytokines
Serum levels of TNF-α were evaluated with higher values being registered in the Post-COVID group (group 1) – 129.09 ± 40.17 pg/ml (ranging from 10.11 – 544.39) compared to the COVID-negative group (group 2) – 86.36 ± 25.82 pg/ml (ranging from 7.02 – 260.82) without significant difference being found (P>0.05).
Levels of TNF-α were monitored among individuals from each subgroup and no statistical significant difference was found (P>0.05) when comparing the corresponding subgroup from both group 1 and group 2 (Figure 1). Highest mean levels were recorder in IFG subgroup in both group 1 and group 2, with those from group 1 having higher levels – 202.65 ± 71.25 pg/ml (range 130.07 – 300.8) and 113.34 ± 37.55 pg/ml (range 70.33 – 139.58) respectively. In the Post-COVID group lowest levels were recorded among IGT subgroup – 102.98 ± 79.5 pg/ml (range 35.15 – 190.47) whereas in the COVID-negative group lowest individuals with IR have lowest levels – 71.78 ± 60.39 pg/ml (range 7.02 – 195.94). Patients with T2DM from the same group have also lower levels compared to the same subgroup from group 1 – 91.3 ± 95.98 pg/ml (range 7.38 – 260.82).
Among the individuals from T2DM subgroup (from group 1), a strong positive correlation was found between TNF-α levels and those of leptin (rs=0.663; P=0.026). In the corresponding T2DM subgroup among individuals from group 2 TNF-α levels negatively correlate with those of adiponectin (rs=0.713; P=0.013). In patients with IR or/and basal hyperinsulinemia from group 2 a strong correlation was found between levels of TNF-α and leptin (rs=0.702; P=0.003) as well as those of METS-IR (rs=0.636; P=0.011).
When following serum levels of INF-γ patients from the COVID-negative group (group 2) – had significantly higher values - 14.90 ± 2.09 pg/ml (ranging from 7.79 – 30.13) than those in the Post-COVID group (group 1) – 5.90 ± 1.51 pg/ml (ranging from 1.28 – 18.42) (P<0.001).
Levels of INF-γ were monitored among individuals from each subgroup and statistical significant difference was found between T2DM subgroup (P<0.001), IFG subgroup (p<0.001) and those with IR or/and hyperinsulinemia (p=0.002) (Figure 2). In group 2 highest mean levels were recorder in IGT subgroup – 19.63 ± 10.0 pg/ml (range 8.27 – 27.08) followed by IR or/hyperinsulinemia subgroup – 14.91 ± 6.5 pg/ml (range 7.79 – 30.13) and T2DM subgroup – 14.78 ± 3.39 pg/ml (range 9.71 – 19.54). In group 1 patients with T2DM demonstrated higher levels of INF-γ – 7.46 ± 4.99 pg/ml (range 2.4 – 18.42) followed by IGT subgroup – 6.72 ± 5.17 pg/ml (range 3.0 – 12.63) and subjects with IR – 6.08 ± 3.8 pg/ml (range 1.28 – 10.86). Lowest levels were registered among IFG subgroup – 2.79 ± 1.01 pg/ml (range 1.28 – 3.30).
A strong positive correlation was found between INF-γ and serum TG levels (rs=0.766; P=0.016) among patients with IR or/and basal hyperinsulinemia from group 1.
Among individuals with T2DM (from group 2) INF-γ levels negatively correlate with those of adiponectin (rs= -0.692; P=0.018).
Another two strong positive correlations exist between INF-γ and leptin (rs=0.634; P=0.011) and METS-IR (rs=0.857; P<0.001) in patients with IR or/and basal hyperinsulinemia from group 2.
Serum levels of IL-17A were evaluated with higher values being registered in the COVID-negative group (group 2)– 40.45 ± 12.62 pg/ml (ranging from 25.17 – 202.59) compared to the Post-COVID group (group 1) – 30.26 ± 5.23 pg/ml (ranging from 19.84 – 87.21) without significant difference being found (P>0.05).
Levels of IL-17A were monitored among individuals from each subgroup and no statistical significant difference was found (P>0.05) when comparing the corresponding subgroup from both group 1 and group 2 (Figure 3). In group 1 highest mean levels were recorder in IGT subgroup – 45.89 ± 35.83 pg/ml (range 23.36 – 87.21) whereas in group 2 it was T2DM subgroup – 51.32 ± 53.22 pg/ml (range 27.11 – 202.59). In the Post-COVID group lowest levels were recorded among T2DM subgroup – 21.19 ± 3.41 pg/ml (range 23.36 – 35.78) whereas in the COVID-negative group lowest individuals with IGT had lowest levels – 27.43 ± 1.47 pg/ml (range 26.14 – 29.04).
IL-17A levels positively correlate with those of HbA1c (rs=0.914; P<0.001) and serum triglycerides (rs=0.766; P=0.016) in IR subgroup from the Post-COVID group (group 1).
Another positive correlation was found among IGT subgroup in the COVID-negative group (group 2) where IL-17A levels positively correlate with those of HOMA-IR (rs=0.992; P=0.008).
3.8.2. Anti-Inflammatory Cytokines
IL-10 levels were also monitored evaluated with higher values being registered in Post-COVID group (group 1) – 3.45 ± 1.48 pg/ml (ranging from 1.24 – 22.45) than in the COVID-negative group (group 2)– 2.99 ± 0.45 pg/ml (ranging from 1.67 – 7.48) with no significant difference being found (P>0.05).
When comparing IL-10 levels among individuals from each subgroup (Figure 4) statistical significant difference was found only between IFG subgroups (P<0.001) with IFG subgroup from group 2 having higher mean values – 3.18 ± 0.14 pg/ml (range 3.02 – 3.30). Higher levels of IL-10 were recorded in IGT subgroup from group 1 – 7.67 ± 9.15 pg/ml (range 2.0 – 18.23) and T2DM subgroup from group 2 – 3.20 ± 1.47 pg/ml (range 2.0 – 6.3). In contrast lowest levels were recorded in IFG subgroup from group 1 – 1.98 ± 0.23 pg/ml (range 1.73 – 2.23) and in IGT subgroup from group 2 – 2.45 ± 0.52 pg/ml (range 2.0 – 3.02).
4. Discussion
4.1. General Caracteristic
We evaluated 68 patients with different metabolic disorder (T1DM, T2DM, IFG, IGT and IR) admitted in our clinic. They were divided in two groups - 35 patients (51.47%) have been newly diagnosed with metabolic disorders 6 months after previous COVID-19 and 33 patients (48.53%) have metabolic disorders and no history of COVID-19 vaccination or disease.
The mean age of the patients is 46.78 ± 4.74 years with significant difference found between the groups (P<0.01). COVID-19 negative subjects with Metabolic Syndrome are older (48.21 ± 4.51 years) than those with new onset carbohydrate disorder following COVID-19 (45.35 ± 4.98 years).
The individuals in group 2 were selected in order to approximate as closely as possible the age range of those in group 1. Another reason is the expected increased incidence of carbohydrate disorders, including type 2 diabetes, with advancing age. According to the latest data, the sharpest increase in morbidity is observed in the 45-64 age group and in people over 65 years. [19]
Female predominance is pronounced in both groups with women comprising ¾ of all patients.
Almost half of the individuals (42.65%) have a positive family history of DM and it was more pronounced in group 2 (45.45%) than in group 1 (40%).
Approximately half of all patients were diabetics (n=30; 44.72%). More than half of all patients from the Post-COVID group (group 1) have diabetes (n=19; 54.28%), whereas it was found in only 1/3 (n=11; 33.33%) of the patients from the COVID-negative group (group 2).
All of the patients from Post-COVID group have been newly-diagnosed and in only 2 from the COVID-negative group. The reason is that individuals in group 1 were pre-selected according to very strict criteria—being newly diagnosed with carbohydrate disorders established within 6 months after previous SARS-CoV-2 infection.
According to recent data, SARS-CoV-2 infection can lead to the development of T2DM within six months of diagnosis, highlighting the potential long-term consequences of the virus, with male gender and severity of infection significantly associated with a higher risk of diabetes. [20] In our cohort from Post-COVID individuals half of the diabetics were female and the other half – male.
A comparison was made between both of the groups according to the type of metabolic disorder present. The ratio between the two groups is approximately equal, with almost the same number of individuals with the specific type of metabolic disorder in the respective subgroups.
4.2. Body Mass Index (BMI)
Mean BMI index in both of the groups are in the overweight range, with higher values reported in the COVID-negative group (35.67 ± 7.89 kg/m2). However, no pronounced difference was found (P>0.05) with the other group, where high BMI values were also recorded (31.91 ± 2.57 kg/m2).
More than half of all patients are obese (BMI >30 kg/m2) (n=44; 64.7%), with those from group 2 comprising the majority of the group (n=25; 75.7%) and half of group 1 (n=19; 54.3%). A quarter of the individuals are overweight (n=13; 19.12%) with the majority of patients belonging to group 1 (n=9; 25.7%) and the minority – to group 2 (n=4; 12.1%). Only 16.18% of all patients have normal weigh (n=11) and most of them being from group 1 (n=7; 20%) whereas the rest - from group 2 (n=4; 12.12%)
A probable reason for the higher proportion of individuals with normal weight in group 1 is likely the fact that it includes individuals with T1DM having a normal BMI (mean 23.63 kg/m2). No significant differences were found between the corresponding subgroups (P>0.05).
In the Post-COVID group (group 1) highest mean BMI values were reported in the subgroup of individuals with T2DM (36.64 kg/m2) and those with IR and/or hyperinsulinemia (36.89 kg/m2). In contrast in group 2 lowest levels were registered in normoglycaemic individuals with IR (32.69 kg/m2).
A probable reason for this could be the fact that in the genesis of IR observed the Post-COVID group virus impact must also be taken into account, while in the COVID-negative group (Classical MetS), obesity and its consequences are the main contributing factors.
In the COVID-negative group (group 2) IFG subgroup has the highest BMI – 41 kg/m2 and by those with T2DM (BMI – 38.45 kg/m2). In contrast patients with IFG from group 1 demonstrate lower BMI (32.75 kg/m2).
4.3. Lipid Profile Parameters and Uric Acid Levels
Lipid profile major parameters (total cholesterol, TG, HDL-C and LDL-C) were evaluated and similar levels were found with no significant difference between the groups (P>0.05).
For a more detailed analysis of trends and discrepancies between individual subgroups, only a few isolated ones were found, but in summary, no significant differences were observed in terms of the aforementioned lipid profile parameters.
The vast majority of patients demonstrate hypertriglyceridemia (TG >1.7 mmol/l). All subgroups have mean levels >1.7 mmol/l with the exception of IR subgroup in group 2, whereas borderline levels were registered (1.69 ± 0.8 mmol/l). In the Post-COVID group highest levels were registered in IGT subgroup, whereas it was T2DM subgroup from the COVID-negative group. A probable reason can be the fact that individuals in group 2 have a different, but most likely longer duration of metabolic diseases compared to individuals in group 1, where it is no longer than 6 months. Furthermore, the observed hypertriglyceridemia in T2DM subgroup can also be considered a reflection of poor glycemic control of the disease, in addition to its duration.
HDL-C levels were also evaluated, and most participants had decreased levels (<1.0mmol) with those in the Post-COVID group having higher mean levels. Individuals from the separate subgroups also show HDL-C levels < 1.0mmol/l, with the exception of the IFG subgroups (in both of the groups) and those with T2DM (from group 1).
Patients from the COVID-negative group have higher mean values of LDL-C compared to the Post-COVID one (P>0.05) with both groups demonstrating above the optimal mean levels (>2.6mmol/l). Interestingly highest levels at all (3.54 ± 2.03 mmol/l) were found in T1DM subgroup (group 1). Similar mean values were registered among IFG (3.47 ± 0.39 mmol/l) and IR (3.48 ± 0.89 mmol/l) subgroups in group 2. Interestingly diabetics (T1DM and T2DM subgroups) in group 1 demonstrate higher levels of LDL-C (3.27 ± 1.66 mmol/l) than diabetics (T2DM subgroup) in group 2 (2.89 ± 1.09 mmol/l). This distinct difference, although not statistically significant, may be due to the additional viral impact on lipid metabolism.
Our finding confirm those reported by Xu et al. who concluded that there is an increased risks and 1-year burdens of incident dyslipidemia and incident lipid-lowering medications use in the post-acute phase of COVID-19 infection. [21]
Although not part of the diagnostic criteria, increased levels of uric acid are associated with increased prevalence of MetS [22] and also with all its components, including high TG, low HDL-C, high blood pressure, obesity, and high plasma glucose. [23]
Increased levels of uric acid (>420 µmol/ml for man and 340 µmol/ml for women) were also registered in most of the patients. In the post-COVID group increased vales were found in 1/3 of the males and almost all 83.33% of the females. In the Post-COVID group similar trends were observed in both male and female – 60% and 62.5% respectively. However no difference was found between the groups (P>0.05). Comparing the individual subgroups such is only observed between subgroups with IFG (P=0.033) with higher values registered in the Post-COVID patients.
In summary, however, no significant differences were found in terms of the main lipid parameters and uric acid in the separate subgroups, which shows that lipid and uric acid metabolism disorders are similar whether induced by SARS-CoV-2 viral exposure or within the framework of classic MetS.
4.4. Glycaemic Parameters
Giving the fact that group 1 (the Post-COVID group) included a higher percentage of diabetics (T1DM and T2DM) (n=19; 54.28%) compared to the COVID-negative group, in which diabetics account for 33.33% of the entire group (n=11), it is not surprising that higher mean fasting plasma glucose and HbA1c values were registered in that group.
Another fact that should be taken into account and probably explaining the discrepancies observed is the duration of the disturbances. It should be noted that for the period of 6 months, (the time during which the violations occurred in the post-COVID group), it is possible that the glycemic control targets were not achieved. In addition, the majority of individuals in the mentioned group were newly diagnosed at the time of hospitalization and had not received prior treatment.
4.5. Hormonal Parameters
An imbalance between pro-inflammatory adipokines like leptin, which is overproduced, and anti-inflammatory adipokines like adiponectin, which are decreased is being observed in MetS. This imbalance contributes to the onset and progression of the IR, dyslipidemia, and chronic low-grade inflammation, another key component of the MetS. [24,25,26]
Adipose tissue dysfunction has also been reported in the course of COVID-19 with an increase in leptin levels and accompanying leptin resistance as well as dramatic decrease in adiponectin levels. [11]
When leptin levels were followed higher mean values were observed in COVID-negative group compared to those in the Post-COVID group (P>0.05). A probable reason could be the higher relative proportion of obese individuals in the first group (75.5% than 54.3% in the Post-COVID group).
Significant difference was only found between the T2DM subgroups (P=0.032) with diabetics from the COVID-negative group having higher values - 69.44 ± 35.77 ng/ml than those from the Post-COVID group - 38.16 ± 19.7 ng/ml. Same trends were observed in BMI values in the aforementioned subgroups – 38.45 kg/m2 vs 35.89 kg/m2 respectively. Comparing the rest subgroups, no significant differences were found, although in all of them, those in the COVID-negative group demonstrated higher average leptin levels.
In summary, changes in adipokines levels, as an indicator of adipocyte dysfunction, are similar in newly developed disorders after COVID-19 and classic metabolic disorders comprising the spectrum of MetS.
4.6. Insulin Resistance Indices
Patients from both Post-COVID and COVID-negative group demonstrated high levels of IR, as their average HOMA-IR and METS-IR values exceed the established cutoff points of 2.9 and 31.84, respectively. Patients from group 2 have higher mean values of both indices.
Among different subgroups in both group 1 and group 2, individuals from T2DM subgroups show highest levels of IR. and IGT. Interestingly even subjects with T1DM demonstrate significant IR based on both indices (HOMA-IR – 4.99 and METS-IR – 52.94) even with a BMI within the normal range (23.63 kg/m2). We suppose that a possible reason for that is the poor glycemic control registered in this subgroup (HbA1c levels – 11.11 ± 1.85%) as well as a reflection of IR that developed and persists after COVID-19.
4.7. Immunological Parameters - Pro- and Anti-Inflammatory Cytokines
In order to characterize cytokine profile of the both groups serum levels of some common pro-inflammatory (TNF-α, INF-γ and IL-17A) and anti-inflammatory (IL-10) cytokines were evaluated.
Higher TNF-α values were registered in the Post-COVID group compared to the COVID-negative one (P>0.05) suggesting major role in the newly emerging metabolic disorders following COVID-19.
No statistical significant difference was found (P>0.05) when comparing the corresponding subgroup from both group 1 and group 2. Highest mean levels were recorder in IFG subgroup in both groups.
A positive correlation was found between TNF-α levels and those of leptin (rs=0.663; P=0.026) among diabetics (T2DM subgroup) from the Post-COVID group. Another negative one was observed in the corresponding T2DM subgroup among individuals from the COVID-negative group with adiponectin (rs =0.713; P=0.013).
In patients with IR or/and basal hyperinsulinemia from group 2 a strong correlation was found between levels of TNF-α and leptin (rs=0.702; P=0.003) as well as those of METS-IR (rs=0.636; P=0.011).
The correlations observed suggest that TNF-α are involved in the pathogenesis of metabolic disorders in both groups, mainly by influencing adipokine production, and also by affecting IR.
In contrast higher levels of INF-γ, the other pro-inflammatory cytokine, we registered in the COVID-negative group (14.90 ± 2.09 pg/ml) and they significantly differ from the Post-COVID group (5.90 ± 1.51 pg/ml) (P<0.001).
Statistical significant difference was found between T2DM subgroup (P<0.001), IFG subgroup (P<0.001) and those with IR or/and hyperinsulinemia (P=0.002) with higher values being recorded in COVID-negative patients. These findings suggest that INF-γ is having a significant role in the classic metabolic disorders rather than those emerging after COVID-19.
Among patients with IR from the Post-COVID group a strong positive correlation was found between INF-γ and serum TG levels (rs =0.766; P=0.016) suggesting its role in lipid disorders emerging in the course or after disease.
A negative correlation was found among individuals with T2DM (from group 2) between INF-γ and adiponectin (rs =-0.692; P=0.018) as well as two strong positive correlations with leptin (rs =0.634; P=0.011) and METS-IR (rs=0.857; P<0.001) in patients with IR or/and basal hyperinsulinemia (group 2) pointing another potential mechanism involved in adipose tissue dysfunction and insulin resistance observed.
Based on the correlation found in each group it can be assumed that both TNF-α and INF-γ are linked to metabolic dysfunction observed, especially in patients with T2DM and IR, pointing another potential mechanism involved in adipose tissue dysfunction and IR. In the Post-COVID group it is mainly through affecting adipokines production, causing an increase in those of leptin whereas in the COVID-negative group they act synergistically and cause a decrease in adiponectin production and increasing the IR.
IL-17A levels show similar trends – higher levels have been registered in the COVID-negative group (40.45 ± 12.62 pg/ml) compared to the Post-COVID one (30.26 ± 5.23 pg/ml) (P>0.05). Significant differences were not found between the corresponding subgroups. However positive correlation was found between 17A and serum triglycerides (r=0.766; P=0.016) and HbA1c levels (rs=0.914; P<0.01) in subjects with IR from the Post-COVID group. This is a reason to assume that this potent pro-inflammatory cytokine is also participating in IR pathogenesis mainly through interfering with lipid and glucose metabolism.
IL-10 levels were also monitored and based on the proposed reference ranges for healthy individuals - 4.8-9.8 pg/ml, it can be concluded that its levels are actually reduced in both groups studied.
Anyway higher values were registered in Post-COVID group (3.45 ± 1.48 pg/ml) than in the COVID-negative group (2.99 ± 0.45 pg/ml) with no significant difference being found (P>0.05).
Highest levels at all were found among IGT subgroup from group 1 (7.67 pg/ml). This finding are probably due to the low number of patients included in the subgroup. In all the rest subgroups (T2DM, IFG and IR) those from the COVID-negative group demonstrate higher values than those from the Post-COVID one. Anyway statistical significant difference was found only between IFG subgroups (P<0.001).
Low circulating IL-10 levels are reported in patients MetS, suggesting its protective role against metabolic dysfunction. More over along with lower production, impaired IL-10 function is considered in these patients, which contributes to the chronic low-grade inflammation associated with the syndrome. [27] Based on this our findings can be assumed as virus-induced immunological disturbances with major impact on IL-10 levels towards reduction than those observed in classic MetS.
In summary cytokines definitely have their role in the pathogenesis of newly-emerging metabolic disorders following COVID-19. Based on the observed differences in serum levels, it can be assumed that TNF-a, a cytokine established as a key factor in MetS immunopathogenesis, also plays a significant role in post-COVID disorders causing adipose tissue dysfunction and IR. Conversely, INF-γ and IL-17A, cytokines considered to be of secondary importance in the pathogenesis of classic metabolic disorders, have a smaller role in post-COVID disorders. Low IL-10 levels contribute to the immune disturbances observed, probably acting synergistically with the other cytokines. Authors should discuss the results and how they can be interpreted from the perspective of previous studies and of the working hypotheses. The findings and their implications should be discussed in the broadest context possible. Future research directions may also be highlighted.
5. Conclusions
The observed changes in both metabolic and immune parameters studied among the two groups show many similarities, but some significant differences have also been identified. Despite the lack of significant differences in terms of basic metabolic parameters, some were found in terms of immunological parameters. It turns out that TNF-α, considered one of the main cytokines in MetS, is also a key contributor in the pathogenesis of Post-COVID metabolic disorders, demonstrating a link with adipokines levels, but also with the degree of IR. On the other hand, IFN-γ considered pivotal in different stages of COVID-19, is directly linked to the persistent IR and adipocyte dysfunction observed afterwards. IL-17A is also established as a significant factor contributing to dysglycaemia and dyslipidemia, occurring after illness. Low IL-10 levels contribute to the immune disturbances observed, acting synergistically with the other cytokines. What can be asserted is that cytokines definitely have an important role in post-COVID newly-emerging metabolic disorders along with their well-known one in Metabolic Syndrome.
Author Contributions
Conceptualization, V.Ts., K.T. methodology, V.Ts., M.T., K.T., M.A. and I.G.; software, V.Ts., M.T. and K.T.; validation, M.A. and I.G.; formal analysis, V.Ts., M.V., M.A. and I.G.; investigation, V.Ts., M.T. and K.T.; writing—original draft preparation, V.Ts.; writing—review and editing, V.Ts. and K.T.; supervision, K.T.
Funding
Please add: The study was conducted with a grant of the Medical University – Pleven – Project №D6/2023 – „Changes in pancreatic beta cell function in COVID-19“.
Institutional Review Board Statement
The study was conducted in accordance with the Declaration of Helsinki, and approved by the Ethics Committee of Medical University Pleven (Protocol №72/23.06.23) for studies involving humans.
Informed Consent Statement
All participants declared their voluntary willingness to participate in the study and gave their consent for the publication of their de-identified clinical data by signing and dating the consent form.
Data Availability Statement
The authors declare that data supporting the findings of this study are available within the article.
Acknowledgments
We wish to thank Ass. Prof. Mircho Vukov for the statistical analysis. The authors acknowledge Medical University - Pleven, Bulgaria for financial support. The authors have reviewed and edited the output and take full responsibility for the content of this publication.”.
Conflicts of Interest
The authors declare that they have no conflict of interest. The funders had no role in the design of the study; in the collection, analyses, or interpretation of data; in the writing of the manuscript; or in the decision to publish the results.
Abbreviations
The following abbreviations are used in this manuscript:
IL-17 A - interleukin -17A
TNF-α - tumor-necrosis factor –alpha
INF-γ - interferon-gamma
IL-10 – interleukin-10
DM – Diabetes mellitus
T1DM – Type 1 Diabetes mellitus
T2DM – Type 2 Diabetes mellitus
IFG – Impaired fasting glycaemia
IGT – Impaired glucose tolerance
MetS – Metabolic Syndrome
BMI – Body mass index
HOMA-IR - Homeostasis model assessment of insulin resistance
METS-IR - Metabolic Score for Insulin Resistance
TG – Triglycerides
HDL-C – High-density lipoprotein cholesterol
LDL-C - Low-density lipoprotein cholesterol
IR – Insulin resistance:
References
- Alberti, K.G.M.M.; Zimmet, P.; Shaw, J.; IDF Epidemiology Task Force Consensus Group. The metabolic syndrome—A new worldwide definition. Lancet 2005, 366, 1059–1062. [Google Scholar] [CrossRef]
- Olijhoek, J.K.; van der Graaf, Y.; Banga, J.-D.; Algra, A.; Rabelink, T.J.; Visseren, F.L.J.; SMART Study Group. The Metabolic Syndrome is associated with advanced vascular damage in patients with coronary heart disease, stroke, peripheral arterial disease or abdominal aortic aneurysm. Eur. Heart J. 2004, 25, 342–348. [Google Scholar] [CrossRef]
- Alberti KG, Eckel RH, Grundy SM, Zimmet PZ, Cleeman JI, Donato KA, Fruchart JC, James WP, Loria CM, Smith SC., International Diabetes Federation Task Force on Epidemiology and Prevention. Hational HeXart, Lung, and Blood Institute. American Heart Association. World Heart Federation. International Atherosclerosis Society. International Association for the Study of Obesity. Harmonizing the metabolic syndrome: a joint interim statement of the International Diabetes Federation Task Force on Epidemiology and Prevention; National Heart, Lung, and Blood Institute; American Heart Association; World Heart Federation; International Atherosclerosis Society; and International Association for the Study of Obesity. Circulation, 2009; 120, 1640–1645.
- Patial, R.; Batta, I.; Thakur, M.; Sobti, R.C.; Agrawal, D.K. Etiology, Pathophysiology, and Treatment Strategies in the Prevention and Management of Metabolic Syndrome. Arch. Intern. Med. Res. 2024, 7, 273–283. [Google Scholar] [CrossRef] [PubMed]
- Paragh, G.; Seres, I.; Harangi, M.; Fülöp, P. Dynamic interplay between metabolic syndrome and immunity. Adv Exp Med Biol. 2014, 824, 171–190. [Google Scholar] [CrossRef]
- Berbudi, A.; Khairani, S.; Tjahjadi, A.I. Interplay Between Insulin Resistance and Immune Dysregulation in Type 2 Diabetes Mellitus: Implications for Therapeutic Interventions. ImmunoTargets Ther. 2025, 14, 359–382. [Google Scholar] [CrossRef] [PubMed]
- Tylutka, A.; Walas, Ł.; Zembron-Lacny, A. Level of IL-6, TNF, and IL-1β and age-related diseases: a systematic review and meta-analysis. Front. Immunol. 2024, 15, 1330386. [Google Scholar] [CrossRef]
- Huang, L.-Y.; Chiu, C.-J.; Hsing, C.-H.; Hsu, Y.-H. Interferon Family Cytokines in Obesity and Insulin Sensitivity. Cells 2022, 11, 4041. [Google Scholar] [CrossRef]
- Freitas, R.d.S.; Silva, C.M.d.S.; Fratelli, C.F.; de Lima, L.R.; Stival, M.M.; Funghetto, S.S.; da Silva, I.C.R.; de Andrade, R.V. IL-10 and IL-1β Serum Levels, Genetic Variants, and Metabolic Syndrome: Insights into Older Adults’ Clinical Characteristics. Nutrients 2024, 16, 1241. [Google Scholar] [CrossRef]
- Meehan, E.V.; Wang, K. Interleukin-17 Family Cytokines in Metabolic Disorders and Cancer. Genes 2022, 13, 1643. [Google Scholar] [CrossRef] [PubMed]
- Reiterer M, Rajan M, Gómez-Banoy N, et al. Hyperglycemia in Acute COVID-19 is Characterized by Adipose Tissue Dysfunction and Insulin Resistance. Preprint. medRxiv. 2021;2021.03.21.21254072. Published 2021 Mar 26. [CrossRef]
- Baltodano-Calle, M.J.; Polo-Vasquez, J.S.; Romani-Pozo, A.; Gutarra-Saldaña, D.; Guija-Poma, E. Leptin as a potential prognostic marker of the severity of COVID-19 infection in obese patients. Nutr. Metab. Cardiovasc. Dis. 2022, 32, 743–744. [Google Scholar] [CrossRef]
- Zanza, C.; Romenskaya, T.; Manetti, A.C.; Franceschi, F.; La Russa, R.; Bertozzi, G.; Maiese, A.; Savioli, G.; Volonnino, G.; Longhitano, Y. Cytokine Storm in COVID-19: Immunopathogenesis and Therapy. Medicina 2022, 58, 144. [Google Scholar] [CrossRef] [PubMed]
- Karki, R.; Kanneganti, T.-D. The ‘cytokine storm’: molecular mechanisms and therapeutic prospects. Trends Immunol. 2021, 42, 681–705. [Google Scholar] [CrossRef]
- Korobova, Z.R.; Arsentieva, N.A.; Lyubimova, N.E.; Totolian, A.A. Redefining Normal: Cytokine Dysregulation in Long COVID and the Post-Pandemic Healthy Donors. Int. J. Mol. Sci. 2025, 26, 8432. [Google Scholar] [CrossRef]
- World Health Organization. (2019). Classification of diabetes mellitus. World Health Organization. https://iris.who.int/handle/10665/325182.
- Bansal, N. Prediabetes diagnosis and treatment: A review. World J. Diabetes 2015, 6, 296–303. [Google Scholar] [CrossRef]
- Matthews, D.R.; Hosker, J.P.; Rudenski, A.S.; Naylor, B.A.; Treacher, D.F.; Turner, R.C. Homeostasis model assessment: Insulin resistance and β-cell function from fasting plasma glucose and insulin concentrations in man. Diabetologia 1985, 28, 412–419. [Google Scholar] [CrossRef]
- The National Diabetes Statistics Report. 2024.
- Sami, C.A.; Rahaman, M.F.U.; Khan, M.R.; Alam Bhuiyan, M.M.; Matin, A.; Rashed, H.M.; Khan, A.H.; Arafat, S.M.; Hasan, N. Glycemic Control Status After Six Months in Post-COVID-19 Patients. Cureus 2025, 17, e81225. [Google Scholar] [CrossRef]
- Xu, E.; Xie, Y.; Al-Aly, Z. Risks and burdens of incident dyslipidaemia in long COVID: a cohort study. Lancet Diabetes Endocrinol. 2023, 11, 120–128. [Google Scholar] [CrossRef]
- Salehidoost, R.; Aminorroaya, A.; Zare, M.; Amini, M. Is uric acid an indicator of metabolic syndrome in the first-degree relatives of patients with type 2 diabetes? . 2012, 17, 1005–1010. [Google Scholar]
- Copur, S.; Demiray, A.; Kanbay, M. Uric acid in metabolic syndrome: Does uric acid have a definitive role? Eur. J. Intern. Med. 2022, 103, 4–12. [Google Scholar] [CrossRef] [PubMed]
- Maury, E.; Brichard, S. Adipokine dysregulation, adipose tissue inflammation and metabolic syndrome. Mol. Cell. Endocrinol. 2010, 314, 1–16. [Google Scholar] [CrossRef] [PubMed]
- Kumari, R.; Kumar, S.; Kant, R. An update on metabolic syndrome: Metabolic risk markers and adipokines in the development of metabolic syndrome. Diabetes Metab. Syndr. Clin. Res. Rev. 2019, 13, 2409–2417. [Google Scholar] [CrossRef] [PubMed]
- Kim, J.-E.; Kim, J.-S.; Jo, M.-J.; Cho, E.; Ahn, S.-Y.; Kwon, Y.-J.; Ko, G.-J. The Roles and Associated Mechanisms of Adipokines in Development of Metabolic Syndrome. Molecules 2022, 27, 334. [Google Scholar] [CrossRef] [PubMed]
- Esposito, K.; Pontillo, A.; Giugliano, F.; Giugliano, G.; Marfella, R.; Nicoletti, G.; Giugliano, D. Association of Low Interleukin-10 Levels with the Metabolic Syndrome in Obese Women. J. Clin. Endocrinol. Metab. 2003, 88, 1055–1058. [Google Scholar] [CrossRef] [PubMed]
Figure 1.
Mean levels of TNF-α, INF-γ, IL-17A and IL-10 [pg/ml] among individuals from each subgroup in both Post-COVID (group 1) and COVID-negative group (group 2). T1DM- Type 1 Diabetes Mellitus; T2DM- Type 2 Diabetes Mellitus; IFG- Impaired fasting glycaemia; IGT-Impaired glucose tolerance; IR – insulin resistance or/and hyperinsulinemia .
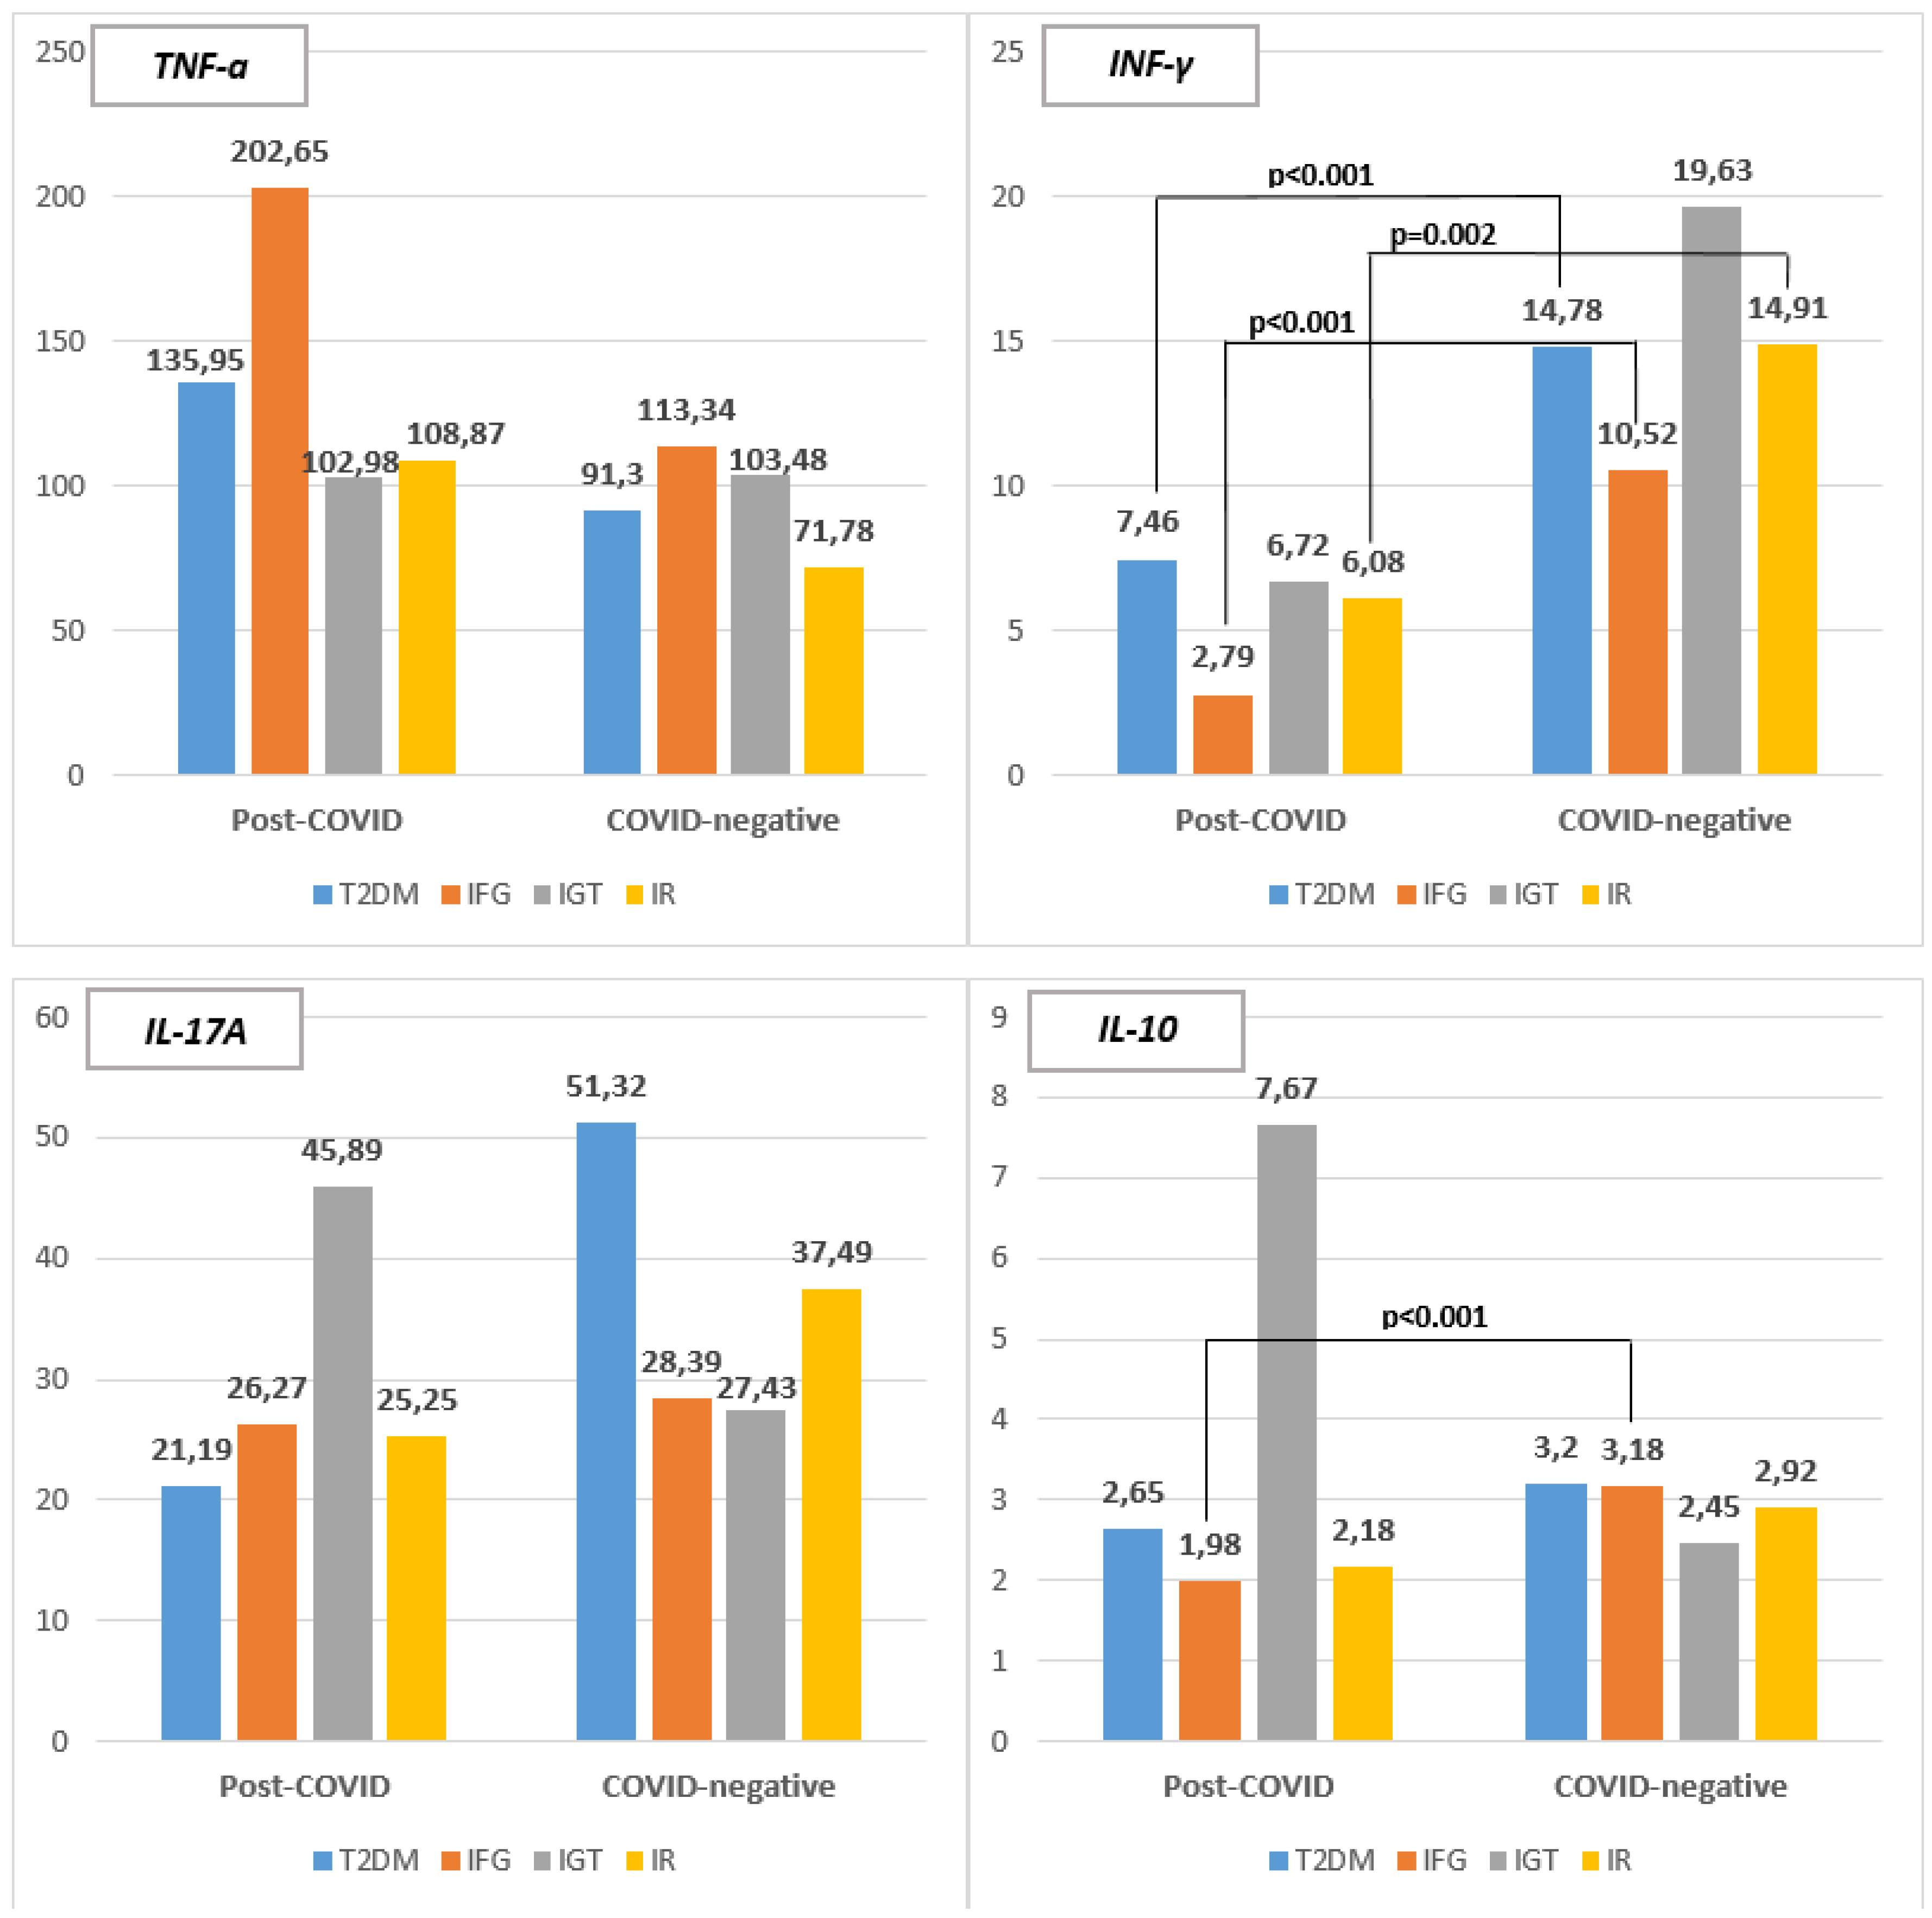

Table 1.
Basic clinical characteristics of the studied population.
| Variable |
Group 1 (n=35) |
Group 2 (n=33) |
All (n=68) |
|
|---|---|---|---|---|
|
Age (mean ± SD) |
45.35 ± 4.98 (22 – 71) |
48.21 ± 4.51 (21 – 68) |
46.78 ± 4.74 (21 – 71) |
|
| Gender | Male | n= 13 (37.15%) |
n= 3 (9.1%) | n= 16 (23.53%) |
| Female | n= 22 (62.85%) |
n= 30 (90.90%) |
n=52 (76.47%) |
|
| Family history of DM | Yes | n= 14 (40%) |
n= 15 (45.45%) |
n=29 (42.65%) |
| No | n= 21 (60%) |
n= 18 (54.55%) |
n=39 (57.35%) |
|
| Diabetes Mellitus |
Pre-exiting |
n= 0 (0%) |
n= 9 (27.27%) |
n= 9 (13.23%) |
| New diagnosed | n= 19 (54.28%) |
n= 2 (6.06%) |
n= 21 (30.88%) |
|
|
No |
n=16 (45.72%) |
n= 22 (66.66%) |
n= 38 (55.88%) |
|
Table 2.
Distribution of the patients from both group 1 (post-COVID group) and group 2 (COVID-negative group) according to the type of carbohydrate disorder.
Table 2.
Distribution of the patients from both group 1 (post-COVID group) and group 2 (COVID-negative group) according to the type of carbohydrate disorder.
| Type of disorder | Post-COVID group (n=35) |
COVID-negative group (n=33) |
|---|---|---|
|
T1DM |
n=8(22.85%) | n=0(0%) |
|
T2DM |
n=11(31.43%) | n=11(33.33%) |
|
IFG |
n=4(11.43%) | n=3(9.09%) |
|
IGT |
n=3(8.57%) | n=4(12.12%) |
|
IR/ Hyperinsulinemia |
n=9(25.72%) | n=15(45.45%) |
T1DM- Type 1 Diabetes Mellitus; T2DM- Type 2 Diabetes Mellitus; IFG- Impaired fasting glycaemia; IGT-Impaired glucose tolerance; IR – insulin resistance or/and hyperinsulinemia.
Table 3.
Lipid profile parameters and Uric acid levels of the studied population – mean values ± SD; (range).
Table 3.
Lipid profile parameters and Uric acid levels of the studied population – mean values ± SD; (range).
| Subgroup | Total Cholesterol [mmol/l] | ||
|---|---|---|---|
| Post-COVID group | COVID-negative group | Significance (P<0.05) | |
| T1DM | 5.21 ± 2.28 (3.2 – 10.4) |
||
| T2DM | 4.83 ± 1.32 (3.5 – 7.6) |
4.71 ± 1.33 (2.3 – 7.0) |
NS |
| IFG | 5.19 ± 0.53 (4.8 – 5.8) |
5.39 ± 0.23 (5.12 – 5.55) |
NS |
| IGT | 4.9 | 4.23 ± 1.03 (3.1 – 5.1) |
NS |
| IR | 4.51 ± 1.12 (3.7 – 7.2) |
5.16 ± 1.05 (3.7 – 7.2) |
NS |
| Subgroup | Triglycerides [mmol/l] | ||
| Post-COVID group | COVID-negative group | Significance (P<0.05) | |
| T1DM | 1.97 ± 1.2 (3.2 – 10.4) |
||
| T2DM | 1.74 ± 0.52 (1.45 – 2.91) |
2.33 ± 0.89 (1.0 – 4.16) |
NS |
| IFG | 1.92 ± 1.25 (1.19 – 3.36) |
1.74 ± 0.25 (1.46 – 1.96) |
NS |
| IGT | 2.15 | 1.78 ± 0.78 (1.32 – 2.58) |
NS |
| IR | 1.82 ± 0.74 (0.95 – 3.22) |
1.69 ± 0.8 (0.85 – 4.12) |
NS |
| Subgroup | HDL-Cholesterol [mmol/l] | ||
| Post-COVID group | COVID-negative group | Significance (P<0.05) | |
| T1DM | 0.77 ± 0.34 (0.1 – 1.05) |
||
| T2DM | 1.03 ± 0.28 (0.69 – 1.55) |
0.76 ± 0.19 (0.51 – 1.09) |
P=0.019 |
| IFG | 1.82 ± 0.34 (1.58 – 2.06) |
1.11 ± 0.02 (1.09 – 1.12) |
P=0.028 |
| IGT | 0.94 | 0.84 ± 0.15 (0.74 – 1.02) |
NS |
| IR | 0.86 ± 0.27 (0.58 – 1.45) |
0.92 ± 0.24 (0.55 – 1.55) |
NS |
| Subgroup | LDL-Cholesterol [mmol/l] | ||
| Post-COVID group | COVID-negative group | Significance (P<0.05) | |
| T1DM | 3.54 ± 2.03 (1.74 – 8.14) |
||
| T2DM | 3.01 ± 1.29 (1.78 – 5.71) |
2.89 ± 1.09 (1.02 – 4.80) |
NS |
| IFG | 3.1 ± 0.79 (2.2 – 3.67) |
3.47 ± 0.39 (3.19 – 3.75) |
NS |
| IGT | 2.98 | 2.58 ± 0.9 (1.68 – 3.48) |
NS |
| IR | 2.81 ± 1.1 (1.5 – 5.13) |
3.48 ± 0.89 (2.19 – 5.12) |
NS |
| Subgroup | Uric Acid [µmol/ml] | ||
| Post-COVID group | COVID-negative group | Significance (p<0.05) | |
| T1DM | 389.83 ± 153.51 (193 – 625) |
||
| T2DM | 416.86 ± 88.36 (312 – 557) |
446.22 ± 117.32 (350 – 718) |
NS |
| IFG | 368.67 ± 77.59 (289 – 444) |
401.5 ± 27.58 (382 – 421) |
NS |
| IGT | 485 | 376.33 ± 31.26 (343 – 405) |
P=0.033 |
| IR | 393.12 ± 97.56 (245 – 509) |
406.33 ± 112.31 (298 – 657) |
NS |
NS – no statistical significance present; T1DM- Type 1 Diabetes Mellitus; T2DM- Type 2 Diabetes Mellitus; IFG- Impaired fasting glycaemia; IGT-Impaired glucose tolerance; IR – insulin resistance or/and hyperinsulinemia .
Table 4.
Adipokines levels of the studied population – mean values ± SD; (range).
| Subgroup | Leptin [ng/ml] | ||
|---|---|---|---|
| Post-COVID group | COVID-negative group | Significance (P<0.05) | |
| T1DM | 24.22 ± 33.83 (1.28 - 97.98) |
||
| T2DM | 38.16 ± 19.7 (12.94 – 72.0) |
69.44 ± 35.77 (16.05 – 111.92) |
P=0.032 |
| IFG | 29.13 ± 31.17 (10.4 – 75.39) |
71.68 ± 44.37 (40.31 – 103.05) |
NS |
| IGT | 21.85 ± 16.9 (9.9 – 33.8) |
65.61 ± 12.01 (57.12 – 74.1) |
NS |
| IR | 35.44 ± 26.06 (1.8 – 80.33) |
33.01 ± 29.43 (10.45 – 101.66) |
NS |
| Subgroup | Adiponectin [µg/ml] | ||
| Post-COVID group | COVID-negative group | Significance (P<0.05) | |
| T1DM | 24.62 ± 1.99 (20.5 - 26.07) |
||
| T2DM | 25.32 ± 1.6 (21.18 – 26.6) |
25.35 ± 0.57 (24.51 – 26.11) |
NS |
| IFG | 25.86 ± 1.1 (24.84 – 27.22) |
26.16 ± 0.36 (25.78 – 26.49) |
NS |
| IGT | 25.87 ± 0.44 (25.56 – 26.18) |
26.80 | NS |
| IR | 24.47 ± 2.38 (18.55 – 26.31) |
26.0 ± 0.49 (25.36 – 26.98) |
NS |
NS – no statistical significance present; T1DM- Type 1 Diabetes Mellitus; T2DM- Type 2 Diabetes Mellitus; IFG- Impaired fasting glycaemia; IGT-Impaired glucose tolerance; IR – insulin resistance or/and hyperinsulinemia .
Table 5.
Estimated insulin resistance indices among the different subgroups from both Group 1 and 2 according to the type of carbohydrate disorders.
Table 5.
Estimated insulin resistance indices among the different subgroups from both Group 1 and 2 according to the type of carbohydrate disorders.
| Subgroup | HOMA-IR | ||
|---|---|---|---|
| Post-COVID group | COVID-negative group | Significance (P<0.05) | |
| T1DM | 4.99 ± 3.6 (2.9 - 10.12) |
||
| T2DM | 6.41 ± 6.23 (2.18 - 22.45) |
25.23 ± 36.74 (1.43 – 89.52 ) |
NS |
| IFG | 8.3 ± 7.16 (4.46 – 19.03) |
3.47 ± 2.25 (1.05 – 5.5 ) |
NS |
| IGT | 5.24 | 8.85 ± 9.29 (1.7 – 19.36 ) |
NS |
| IR | 3.38 ± 0.82 (1.6 - 4.19) |
3.37 ± 2.33 (0.7 – 8.38) |
NS |
| Subgroup | METS-IR | ||
| Post-COVID group | COVID-negative group | Significance (P<0.05) | |
| T1DM | 52.94 ± 29.35 (38.14 – 124.97) |
||
| T2DM | 59.69 ± 11.22 (43.68 – 75.52) |
70.85 ± 18.8 (42.92 – 101.53 ) |
NS |
| IFG | 42.5 ± 1.56 (41.4 – 43.6) |
49.9 ± 17.51 (36.4 – 69.69) |
NS |
| IGT | 55.62 | 58.68 ± 6.26 (52.15 – 64.63 ) |
NS |
| IR | 55.19 ± 13.59 (32.45 – 70.58) |
55.58 ± 14.59 (31.57 – 76.55 ) |
NS |
NS – no statistical significance present; T1DM- Type 1 Diabetes Mellitus; T2DM- Type 2 Diabetes Mellitus; IFG- Impaired fasting glycaemia; IGT-Impaired glucose tolerance; IR – insulin resistance or/and hyperinsulinemia .
Disclaimer/Publisher’s Note: The statements, opinions and data contained in all publications are solely those of the individual author(s) and contributor(s) and not of MDPI and/or the editor(s). MDPI and/or the editor(s) disclaim responsibility for any injury to people or property resulting from any ideas, methods, instructions or products referred to in the content. |
© 2025 by the authors. Licensee MDPI, Basel, Switzerland. This article is an open access article distributed under the terms and conditions of the Creative Commons Attribution (CC BY) license (http://creativecommons.org/licenses/by/4.0/).
Copyright: This open access article is published under a Creative Commons CC BY 4.0 license, which permit the free download, distribution, and reuse, provided that the author and preprint are cited in any reuse.


