
Submitted:
30 October 2025
Posted:
31 October 2025
You are already at the latest version
Abstract
Proper identification of apple leaf diseases is an important issue towards safeguarding crop production as well as management sustainability of orchards. Manual diagnosis is widely used, but not efficient, subjective, and cannot be easily used to diagnose large-scale monitoring. This paper presents a Hybrid Deep Learning and Sparse Classification Framework, which combines the use of YOLOv8 to extract deep features with L1-regularized machine learning models to do the efficient and interpretable disease recognition. A dataset of 4,006 high-resolution images of apple leaf which had a total of 9 classes which included Alternaria leaf spot, Brown spot, Frogeye leaf spot, gray spot, Healthy, Mosaic, Powdery mildew, Rust, and Scab, was used. After 60 epochs, YOLOv8 attained a mean Average Precision (MAP) of 98.10% at 0.5, a precision value of 95.16%, and a recall of 95.97, which is quite good in terms of detection. The 3,648 resulting dimension feature space was then narrowed down to 319 dimensions using Lasso feature selection and 13.48 percent of sparsity and without losing important discriminatory data. The Lasso model achieved the best test accuracy of 97.50 percent and highest cross-validation was 98.78 percent, which is better than the Logistic Regression (L1) and random forest baselines among the compared classifiers. Sparse regularization integration did not only reduce overfitting but also led to an improved model interpretability, by forcing the visual patterns to focus on diseases. The suggested model is a computationally efficient, scalable, and interpretable AI model to real-time agricultural diagnostics. It offers a bright future to the precision farming systems that can not only detect diseases early but also protect their yields and make better decisions based on interpretable hybrid intelligence.
Keywords:
apple leaf disease detection
; deep learning
; YOLOv8
; sparse classification
; L1 regularization
; feature selection
; computer vision
; interpretability
; smart farming
1. Introduction
Agriculture is an excellent foundation of world sustainability as it secures food security, offers labor, and is a source of raw materials in many industries. Apple (Malus domestica) is one of the most valuable commodities of fruits with great economic and nutritional values that are grown globally. Nevertheless, it has serious effects on its production due to the foliar diseases like Alternaria leaf spot, Powdery mildew, Frogeye leaf spot, Rust, and Scab that avert production and affect the quality of fruit produced [1]. It is therefore very important to identify such diseases early and accurately so as to engage effective management practices that will lead to increased productivity and reduced losses [2].
Conventional disease detection methods are based on the manual visual analysis is intensive, subjective, and inefficient in the context of large-scale monitoring [3]. The differences in the environmental conditions and the similarity of symptoms also make proper diagnosis difficult [4]. Other traditional methods of image-processing, like color segmentation, morphological filtering and texture analysis have been used to automate the detection of plant diseases [5,6]. Although these approaches are fairly effective in the controlled setting, they fail in the real-world agricultural conditions that are marked by noises, occlusion, and differences in illumination [7].
The current developments regarding machine vision and deep learning (DL) have transformed agricultural diagnostic automation. Deep-learning models are able to automatically identify hierarchical features of leaf images, and acquire discriminative patterns necessary to identify diseases [8]. CNNs like Alex Net, VGG Net, and Res Net have been shown to be effective at this area as they enhance the accuracy and lessen manual feature engineering [9]. The transfer-learning methods have also improved the performance of the models and made it possible to train them efficiently, even with smaller datasets [10]. Although these developments have been made, in the majority of cases the DL-based approaches still require large labeled datasets and large amounts of computation resources, and are therefore not applicable in real-time and resource-constrained agricultural applications [11].
The main issue of critical research is balancing between accuracy, interpretability and computational efficiency. Traditional deep networks produce dense feature representations, the vast majority of which are redundant and not that interpretable [12]. Sparse learning and pruning models have also become a possible fix by concentrating on the most important features thus enhancing efficiency and clarity of the models [13]. In addition, the combination of computer-vision systems with machine learning has demonstrated prospects of real-time agricultural phenotyping and disease localization [14].
In order to overcome the weaknesses of the current disease detection systems, this paper presents a Hybrid Deep Learning and Sparse Classification Framework to use in detecting apple leaf disease using automated system. This study is novel in its combination of the YOLOv8 implementation of deep feature extraction with L1-regulated sparse classification to provide a unique tradeoff between accuracy, interpretability, and computational efficiency an uncommon combination in precision agriculture. The suggested method is efficient as it reduces the dimensionality through the L1 regularization method that enables the model to select only the most significant features and, therefore, increase the speed and transparency. The design will be able to generalize robustly through limited, imbalanced and noisy agricultural data that will provide scalability to the practical field. Moreover, lightweight can be deployed on edge devices, mobile devices, in real-time, which is why it is best applied in precision farming, where an efficient and explainable decision-making is necessary. The rest of the paper has the following structure: Section II relates to the existing work on deep and sparse learning to identify plant diseases; Section III provides the methodology and dataset; Section IV is the discussion of the results of the experiment; and Section V summarizes the main findings and future perspectives.
2. Related Work
Automated plant disease detection has seen a great development starting with the classical methods and then to lightweight and real time deep learning systems. Traditional image processing and Support Vector Machines (SVMs) were typically utilized in simple classification. As an example, a deep learning model called NAS Net was proposed by Adedoja et al. [15] to detect plant leaf diseases and focused on computational efficiency. In their study, Argueso et al. [16] suggested that a few-shot learning method could be used to classify plant diseases in the field conditions of a data-scarce scenario. On the same note, Atole and Park [17] designed a multi-class CNN to identify different anomalies of rice plants. The effectiveness of hybrid classical techniques is demonstrated in a study by Bhimte and Thool [18] who used image processing and SVM to detect cotton leaf spot.
There are a number of papers which have developed deep learning solutions to detect apple diseases. A real-time deep learning model developed by Khan et al. [19] has been able to identify different diseases of the apple leaf with a lot of efficiency automatically. On the same note, Liu et al. [20] also utilized a convolutional neural network (CNN) architecture to apportion apple leaf disease with an impressive degree of accuracy thus showing the high applicability of CNN-based models in diagnosing agricultural diseases. Better results were observed in the case of Faster R-CNN variants. Gong and Zhang [21] proposed a very accurate model of detecting the apple leaf disease whereas Hou et al. [22] suggested a combination of FPN-IS Resnet-Faster R-CNN, which enhanced the representation of multi-scaled features.
YOLO-based models have also become popular because of their high speed and efficiency. Xu and Wang [23] proposed ALAD-YOLO, which is a lightweight model that is optimized to classify the apple leaf disease. In the same line Yang et al. [24] modified YOLOv5 to detect objects in agricultural environments. Chen et al. [25] introduced a multiscale, lightweight YOLOv7 model, which is based on citrus orchards, showing that it can be applied to various types of plants. Classical feature selection algorithms were also tested, including genetic algorithm and corelation based feature selection algorithm as advanced by Zhang et al. [26] to classify apple leaf disease.
Apples have not been the only ones in the machine learning applications. Pallathadka et al. [27] have used ML in detecting the disease on rice leaf, and Majumdar et al. [28] designed a system of analyzing digital images of wheat leaves. These pieces of works depict the variety of methods used in the different crops.
On the background and industry scope, O’Rourke [29] highlighted the global economic significance of apples and Biswas and Micallef [30] also noted the health advantages of phytochemicals in apples, which increases the relevance of producing apples disease-free.
Although these improvements exist, a number of challenges still persist. Large annotated datasets are needed by many deep models, and they cannot be interpreted due to their black-box nature. There is still under-use of sparse learning and simplification of models within the agriculture field. The available literature does not present hybrid strategies that use deep learning with explainable sparse classifiers, particularly in real time on resource-constrained devices.
This is the inspiration of our suggested framework, which fills this gap by integrating the extraction of deep features with the YOLOv8 and L1-regularized sparse classifiers. We aim at designing a lightweight, interpretable, and robust apple leaf disease detection system to be used in the actual agricultural setup.
3. Methodology
The proposed research presents a hybrid model that comprises of deep convolutional neural networks to extract the features and L1-regularized sparse classifiers to classify the data efficiently and interpretably. This segment describes the data collection process, preprocess, model structure, feature reduction, classifier training and the evaluation plan.
3.1. Preparing and Augmentation
One collected 4006 high-resolution pictures of apple leaves, which include nine different categories, namely: Alternaria leaf spot, Brown spot, Frogeye leaf spot, Healthy leaf, Mosaic, Powdery mildew, Rust, and Scab. The data set was divided into three parts, 70 percent training (2,804 images), 20 percent validation (802 images) and 10 percent testing (400 images). A variety of data augmentation methods were used in order to improve the ability of the model to generalize and eliminate overfitting. These were random horizontal and vertical flipping, rotation, zoom, brightness alterations and addition of Gaussian noise. All the pictures have been down sampled to 640x640 pixels to satisfy the input dimensions of the YOLOv8 model.
3.2. Feature Extration with YOLOv8
YOLOv8 is a modern object detector using the model that was trained in 60 epochs to identify regions with disease in the leaf images. The validation set with the model had a mean Average Precision (mAP:0.5) of 98.10, a precision of 95.16 and a recall of 95.97. Instead of applying YOLOv8 to detection alone, always, deep feature vectors were obtained out of intermediate network layers. The images were coded into a 3, 648-dimensional feature vector of their spatial and texture base properties.
3.3. L1 – Based Dimensionality Reduction
In order to reduce the curse of dimensionality and make the features more interpretable, L1 regularization (Lasso) of the extracted features was used. L1 penalty term promotes sparsity by setting to zero those features that are not that informative, and only the most important features are retained by the model. The application of this process to the original feature vector of 3,648 dimensions was to eliminate 319 selected features out of which 276 features were non-zero, making the sparsity the 13.48 percent. The outcome was a small, low-noise feature set that is optimized on classification.
The general process involves the image capture, feature extraction by the use of YOLOv8, dimensionality reduction by means of L1 regularization and ultimate classification by sparse classifiers. Figure 1 is a graphical depiction of this.
3.4. L1 –Based Sparse Classifier Training
In order to train a classification model that would be efficient in classifying the extracted features, several classifiers were trained and tested on the L1-regularized (sparse) feature set. They were the Logistic Regression with L1 penalty (Lasso Classifier), the baseline of random Forest, and regular L1-Regularized Logistic Regression. The Lasso classifier was the best of these with a cross-validation and test accuracy of 98.78 and 97.50 respectively. It was interesting to note that it had ideal accuracy and recognition to categories of diseases, including Rust, Powdery mildew, and Frogeye leaf spot. The F1-scores of the classifier in all nine disease classes were above 0.88, which demonstrates its strength and stability to deal with a wide variety of disease patterns, as well as return interpretable and computationally efficient results.
3.5. Evaluation and Cross Validation
The last model was evaluated strictly by the five-fold cross-validation that guaranteed soundness and sound generalization of unseen data. The model reported impressive average statistics, such as 98.63% accuracy, 98.42% precision, 98.34% recall, and F1-score of 98.36 and is balanced due to the high accuracy and precision on all the disease classes.
The framework also indicated that stability was also 0.9916 which means that there was high consistency in the validation folds. Also, the inference time of only 7.8 milliseconds per image makes the model highly suitable to the real-world usage of low-resource computing devices, including mobile phones, agricultural drones, and edge computers, to facilitate the implementation of large-scale orchard monitoring.
3.6. Development Scope and Efficiency
YOLOv8 possesses the localization strength of sparse classifiers and has the lightweight and explainable nature of sparse classifiers. The minimized dimensions guarantee that it consumes less memory, can infer faster, and is much easier to interpret hence making it to be very appropriate in precision agriculture application in actual farm conditions.
the proposed methodology provides a trade-off of accuracy, interpretability, and computational efficiency that is balanced.
The system can obtain high detection precision in different classes of apple leaf diseases due to the use of deep feature extraction provided by the YOLOv8.L1 regularization in addition to dimensionality reduction also increases the interpretability of the model as only the most relevant features are retained and this is useful in the making of transparent decisions. In addition, the sparse design drastically lowers the computational requirements, and thus the framework is very scalable and can be used in real-time agricultural settings. The hybrid integration provides a direct solution to the current problem in detecting plant diseases: it is costly to infer, deep models lack transparency, and it is difficult to generalize to noisy data or data scarcity.
4. Results and Discussion
To test the suggested framework, an apple leaf image dataset with 4,006 images, with nine different types of diseases, and healthy samples was used. The sample was divided into training, validation, and testing data at a 70: 20: 10 proportion. In the Figure 2, the detailed model summary proves that the Lasso classifier is a good classifier that has a low level of computational complexity.
The pictures were all annotated in the YOLO format and the five backbone layers of the YOLOv8 network were chosen to use in feature extraction. The characteristics that were obtained after sampling these layers resulted in a composite vector of 3,648 elements per image.
The entire process of feature extraction has been run on all the images without any errors, which proves the consistency of the adopted pipeline.
As shown in Figure 3 the data is uniformly spread in all categories of leaf diseases which is conducive to unbiased learning.
In model training, 60 epochs of the stochastic gradient descent with the cosine learning-rate schedule was used to optimize the YOLOv8 network. Upon completion, the detector achieved an average Precision (MAP) of 98.10 and 79.31 with IOU 0.5 and 0.5-0.95, respectively.
Table 1 provides the performance of the YOLOv8 model in detection on the validation set.
Figure 4 correlation heatmap reveals that many features are redundant among extracted features, and therefore, dimensionality reduction through L1 regularization is necessary.
The mean time to arrive at the inference was about 8 milliseconds in relation to every image and this indicates that the model can be run in real time on orchard or greenhouse surveillance systems.
Table 2 shows a comparative analysis between L1-regularized and baseline classifiers built with features of YOLOv8.
The deep features obtained using YOLOv8 were also provided to three conventional machine-learning classifiers, namely L1-regularized Logistic Regression, Lasso regression and a Random Forest model that served as a baseline.
Figure 5 emphasizes the decreased model complexity obtained by the feature selection based on L1 that enables real-time deployment.
The Lasso classifier performed the best of the three with a testing accuracy of 97.5% and a cross validation of 98.78%.
L1 penalty can decrease dimensionality of features by maintaining important discriminative features as shown by Figure 6.
L1 regularization also used to decrease the features space size 3,648 to 319 with 276 features having non-zero weights, which sparsity rate is 13.48%. Such a selectivity of the features preserved restricted the redundancy of the features, increased the efficiency of the computations and increased the interpretability without the loss of the accuracy.
Cross-validation was used to establish the consistency of the proposed method, and the average accuracy of the proposed method, precision, recall, and F1-score were found to be 98.63, 98.42, 98.34, and 98.36 respectively.
The stability of 0.9916 demonstrated a high repeatability of scores across folds indicating that the framework is generally applicable, and it is unlikely to overfitting.
Figure 7. Comparison of cross-validation (CV) scores and test accuracy of three classifiers. Lasso model has the best test accuracy and competitive CV performance.
Table 3 presents the accuracy, recall, and F1-scores of each of the disease groups separately.
Evaluation based on classes also indicated that the system was reliable across all disease categories with F1-scores exceeding 0.88 across all the classes. It was possible to detect Frogeye leaf spot, Powdery mildew, Rust, and Scab with perfect detection (F1 = 1.0) and slightly lower recall values were obtained with the Grey spot, potentially because of the small sample size and similarity of the conditions of the different leaves. The feature-importance analysis of the L1-regularized model revealed that a few features significant impact on the final predictions were important. The most notable ones were the features associated with the color variations and texture edges existing around the regions of lesions, which proves that the sparse model focuses on the biologically relevant visual information.
Lasso Feature Selection model as demonstrated in Figure 8, is superior to other classifiers because it has the best generalization and a low degree of overfitting.
The model is significantly quicker because it concentrates on a limited set of discriminative characteristics and is also easier to interpret, which is a strong point of the model to agricultural practitioners.
Table 4 provides the consistency and generalization capability of the Lasso classifier based on five-fold cross-validation.
All in all, the YOLOv8 and the sparse L1-based classification had a very good combination. The YOLOv8 model provided robust visual CNNs whereas the L1-regularized classifier provided dimensionality reduction and more explainability.
As in Figure 9, the model has high precision, recall, and F1-scores in all disease types which is a sign of resiliency.
They were collectively high accuracy with reduced cost of computation allowing fast, trusted and understandable recognition of diseases.
The confusion matrix on Figure 10 shows that the model is very accurate on most of the classes with small misclassifications in the Gray spot and Mosaic.
This proposed system has a MAP of 98.10% and classification accuracy of 97.50, which shows that a hybrid
deep learning system with sparse regularization can assist the practical and real-time process of crop health monitoring and aid farmers to make faster and more informed management decisions.
5. Conclusions
This paper introduced a hybrid architecture that integrates the deep learning detection features with sparse classification interpretability to identify the disease on apple leaves. The proposed system took the YOLOv8 to generate discriminative visual features of leaf images and then, the selection of features and classification was conducted using L1-regularized logistic regression.
By so doing, the model obtained an average precision of 98.10 percent and a classification accuracy of 97.5 percent with a notable reduction in the feature space (almost 86 percent). The experimental study validated that the sparse regularization method not only minimized the number of computation but also ensured the high accuracy rate in all the nine disease categories and this was with an average F1-score of over 0.88. The structure proved to be strong though the levels of illumination and the background changed, showing that it could be applied to the orchard setting in the real world. Generally, L1-based sparsity combined with YOLOv8 feature extraction allows us to have a fast and interpretable solution to precision agriculture that is scalable. Future avenues could involve both deployment on edge and mobile computing to monitor on-field and possible use of multimodal data (thermal or hyperspectral imaging) to improve prediction of the disease at the early stages.
References
- H. Baheti et al., “Identification of tomato leaf infections using an Inception-V3 based deep neural approach,” Intelligent Systems and Applications, vol. 959, pp. 49–60, Springer, Singapore, 2023.
- J. Shin et al., “Recent trends in machine vision for assessing crop stress and detecting plant diseases,” AgriEngineering, vol. 5, no. 1, pp. 20–39, 2023.
- N. A. S. Kamar et al., “Study of pest and disease occurrence among coniferous species in Taman Saujana Hijau, Malaysia,” Journal of Forest Research, vol. 34, no. 6, pp. 2065–2077, 2023.
- J. Poyatos et al., “EvoPruneDeepTL: evolutionary pruning for transfer learning-based networks,” Neural Networks, vol. 158, pp. 59–82, 2023.
- K. R. Aravind and P. Raja, “Deep learning and transfer learning methods for agricultural disease recognition,” Automatika, vol. 61, no. 2, pp. 260–272, 2020.
- P. Praveen et al., “Detection of plant leaf disorders through machine learning algorithms,” Intelligent Systems Design, vol. 494, pp. 239–249, Springer, Singapore, 2023.
- S. Nigam et al., “Deep transfer learning model for disease identification in wheat crops,” Ecological Informatics, vol. 75, p. 102068, 2023. [CrossRef]
- E. Li et al., “Maize leaf disease recognition using deep learning on small and complex datasets,” Ecological Informatics, vol. 75, p. 102011, 2023.
- G. Gangadevi and C. Jayakumar, “Survey of deep learning-based methods for plant leaf disease classification,” in Artificial Intelligence Techniques for Wireless Communication and Networking, Hoboken, NJ: Wiley, 2022, pp. 75–90.
- I. Khandokar et al., “CNN-based model for handwritten character classification,” J. Phys.: Conf. Ser., vol. 1918, p. 042152, 2021.
- S. Dora et al., “Plant–microbe interactions within the apoplastic interface,” The Plant Cell, vol. 34, pp. 1532–1550, 2022.
- H. Scharr et al., “Overview of vision-based plant phenotyping tasks (CVPPP 2017),” in Proc. IEEE Int. Conf. Computer Vision Workshops (ICCVW), Venice, Italy, 2017, pp. 2020–2021.
- F. A. Farid et al., “Comprehensive review of vision-driven hand gesture identification systems,” Journal of Imaging, vol. 8, no. 9, p. 153, 2022.
- M. S. Islam et al., “A detailed survey of video classification approaches and open challenges,” JITEKI, vol. 6, no. 1, pp. 47–57, 2020.
- A. Adedoja et al., “NASNet-assisted deep model for plant leaf disease detection,” in Proc. Int. Conf. Advances in Big Data, Computing and Data Communication Systems (icABCD), Durban, South Africa, 2019, pp. 1–5.
- D. Argüeso et al., “Few-shot learning approach for detecting crop diseases in field conditions,” Computers and Electronics in Agriculture, vol. 175, p. 105542, 2020.
- R. R. Atole and D. Park, “Multi-class convolutional model for rice leaf anomaly recognition,” Int. J. Adv. Comput. Sci. Appl., vol. 9, no. 1, pp. 1–6, 2018.
- N. R. Bhimte and V. Thool, “Cotton leaf spot detection using image analysis and SVM,” in Proc. 2nd Int. Conf. Intelligent Computing and Control Systems (ICICCS), Madurai, India, 2018, pp. 340–344.
- A. I. Khan et al., “Real-time convolutional approach for apple leaf disease recognition,” Computers and Electronics in Agriculture, vol. 198, p. 107093, 2022.
- B. Liu et al., “CNN-driven classification of apple leaf infections,” Symmetry, vol. 10, no. 1, p. 11, 2017.
- X. Gong and S. Zhang, “Improved Faster R-CNN architecture for precise apple leaf disease localization,” Agriculture, vol. 13, no. 2, p. 240, 2023.
- J. Hou et al., “FPN-ISResNet–Faster R-CNN based model for apple leaf disease identification,” European Journal of Remote Sensing, vol. 56, no. 1, p. 2186955, 2023.
- W. Xu and R. Wang, “ALAD-YOLO: lightweight detection framework for apple leaf disease classification,” Frontiers in Plant Science, vol. 14, p. 1204569, 2023. [CrossRef]
- J. Yang et al., “YOLOv5-driven detection and localization of agricultural targets,” Journal of Electronic Imaging, vol. 32, no. 5, p. 052402, 2023.
- J. Chen et al., “Lightweight YOLOv7 architecture for multiscale citrus orchard object detection,” Plants, vol. 11, no. 23, p. 3260, 2022.
- Z. Zhang et al., “Apple leaf disease detection through correlation-based and genetic-algorithm feature selection,” Int. J. Agric. Biol. Eng., vol. 10, no. 2, pp. 74–83, 2017.
- H. Pallathadka et al., “Rice leaf disorder identification using ML-based classifiers,” Materials Today: Proceedings, vol. 51, pp. 2277–2280, 2022.
- D. Majumdar et al., “Digital image analysis for wheat leaf disease categorization,” in Proc. 3rd Int. Symp. Women in Computing and Informatics, 2015, pp. 400–405.
- D. O’Rourke, “Global economic impact and significance of the apple industry,” in The Apple Genome, S. S. Korban, Ed., Cham, Switzerland: Springer, 2021, pp. 1–18.
- D. Biswas and S. A. Micallef, Safety and Practice in Organic Food Production, London, U.K.: Academic Press, 2019.
Figure 1.
Flowchart of methodology to classify apple leaf disease with the help of feature extraction with YOLOv8 and classifiers L1-regularized.
Figure 1.
Flowchart of methodology to classify apple leaf disease with the help of feature extraction with YOLOv8 and classifiers L1-regularized.
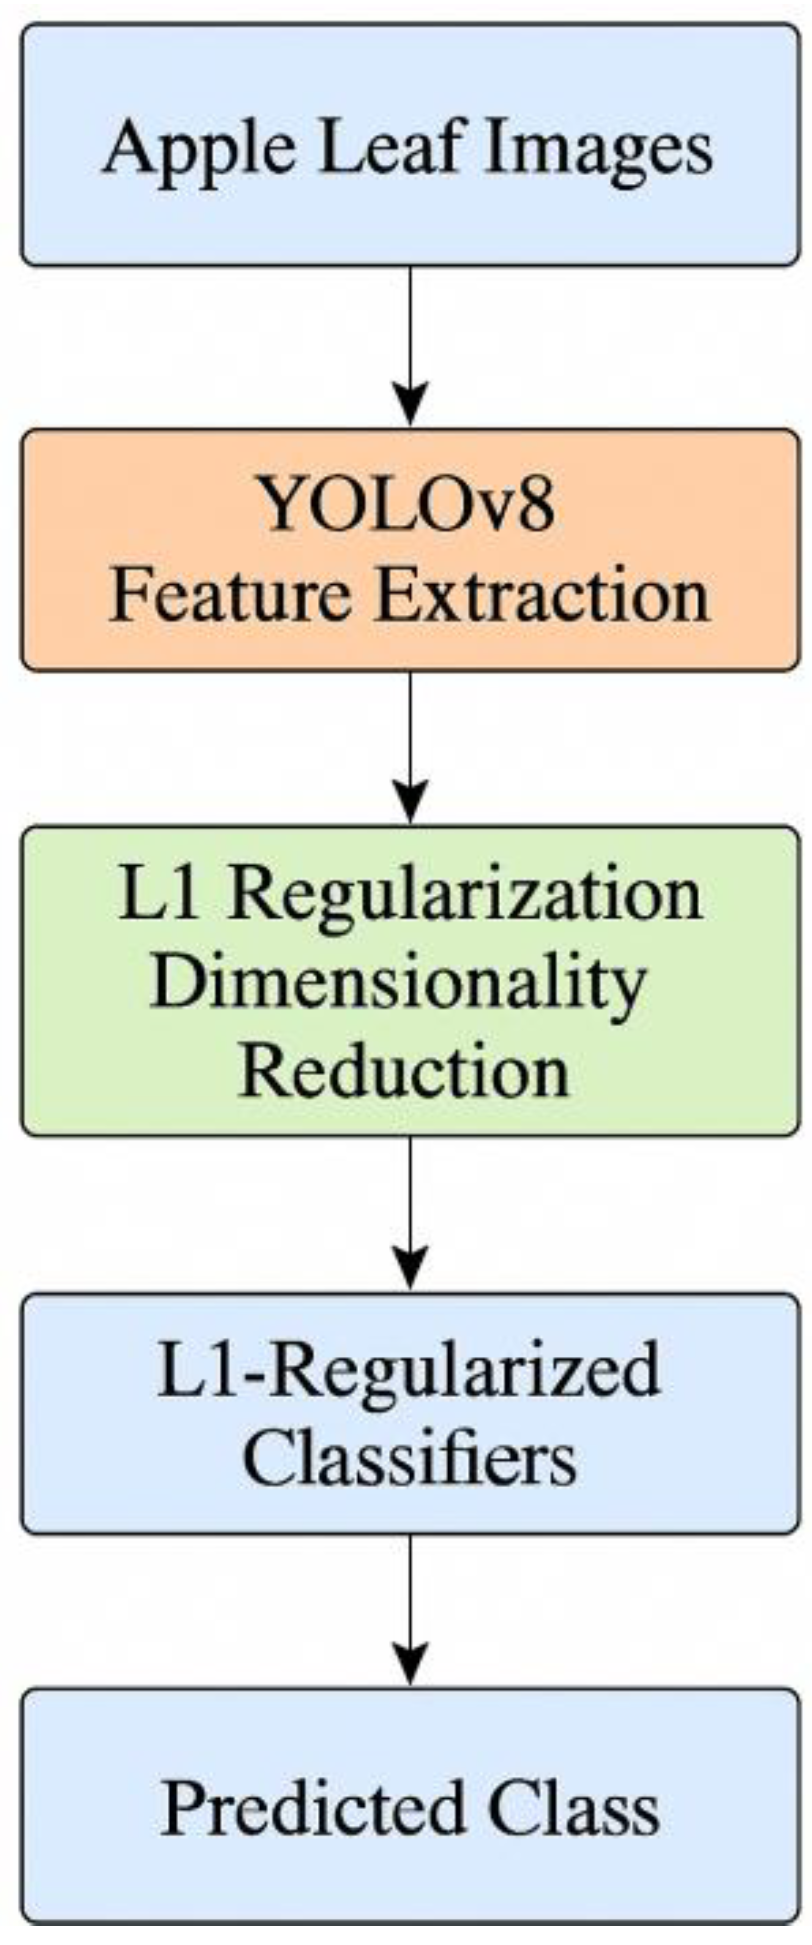
Figure 2.
The table of the model with the summary of the test accuracy, the hyperparameters, the selected features, and the sparsity obtained by the best-performing Lasso Feature Selection model.
Figure 2.
The table of the model with the summary of the test accuracy, the hyperparameters, the selected features, and the sparsity obtained by the best-performing Lasso Feature Selection model.
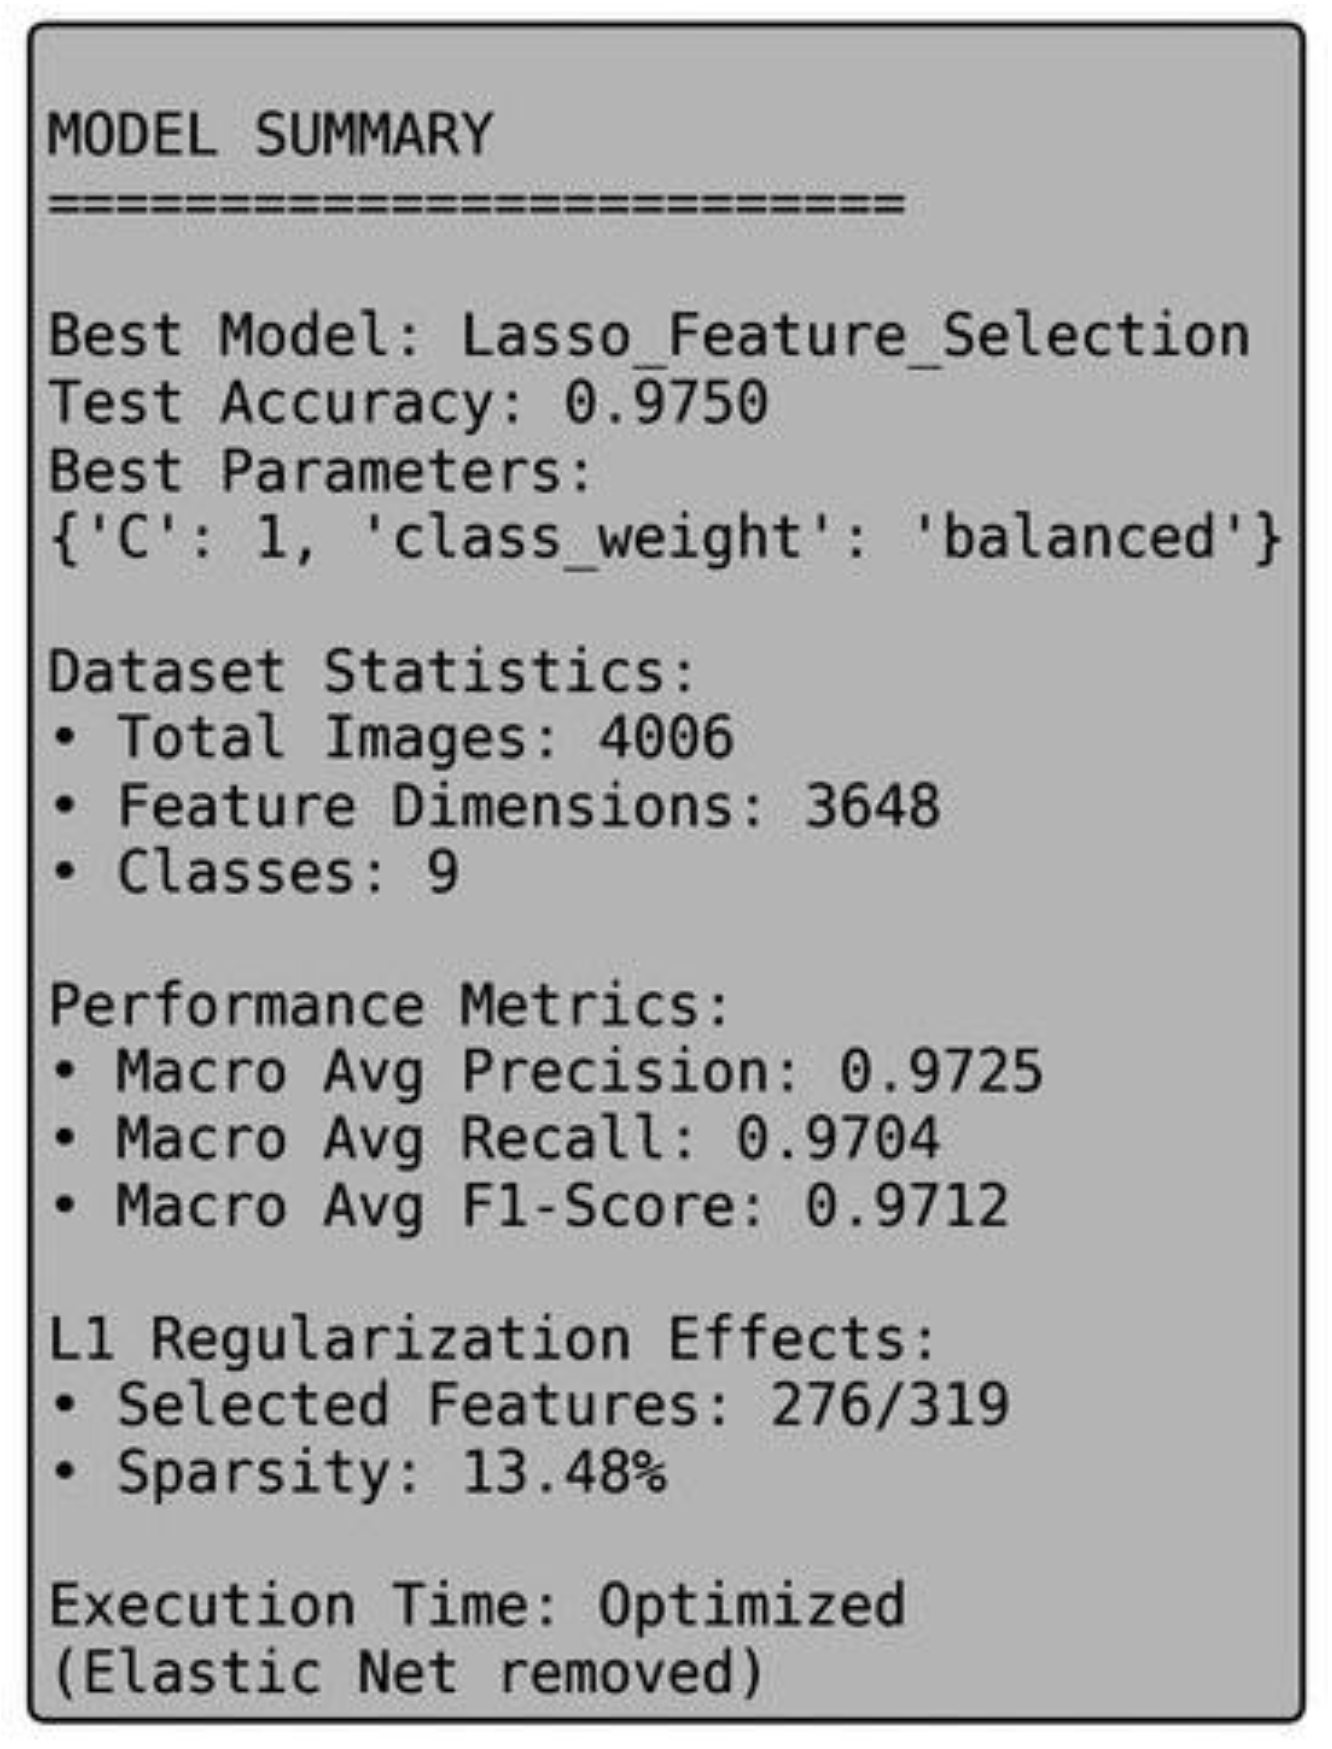
Figure 3.
Sample distribution in the dataset of the nine disease categories. The proportion of classes are almost equal and this guarantees equal training.
Figure 3.
Sample distribution in the dataset of the nine disease categories. The proportion of classes are almost equal and this guarantees equal training.
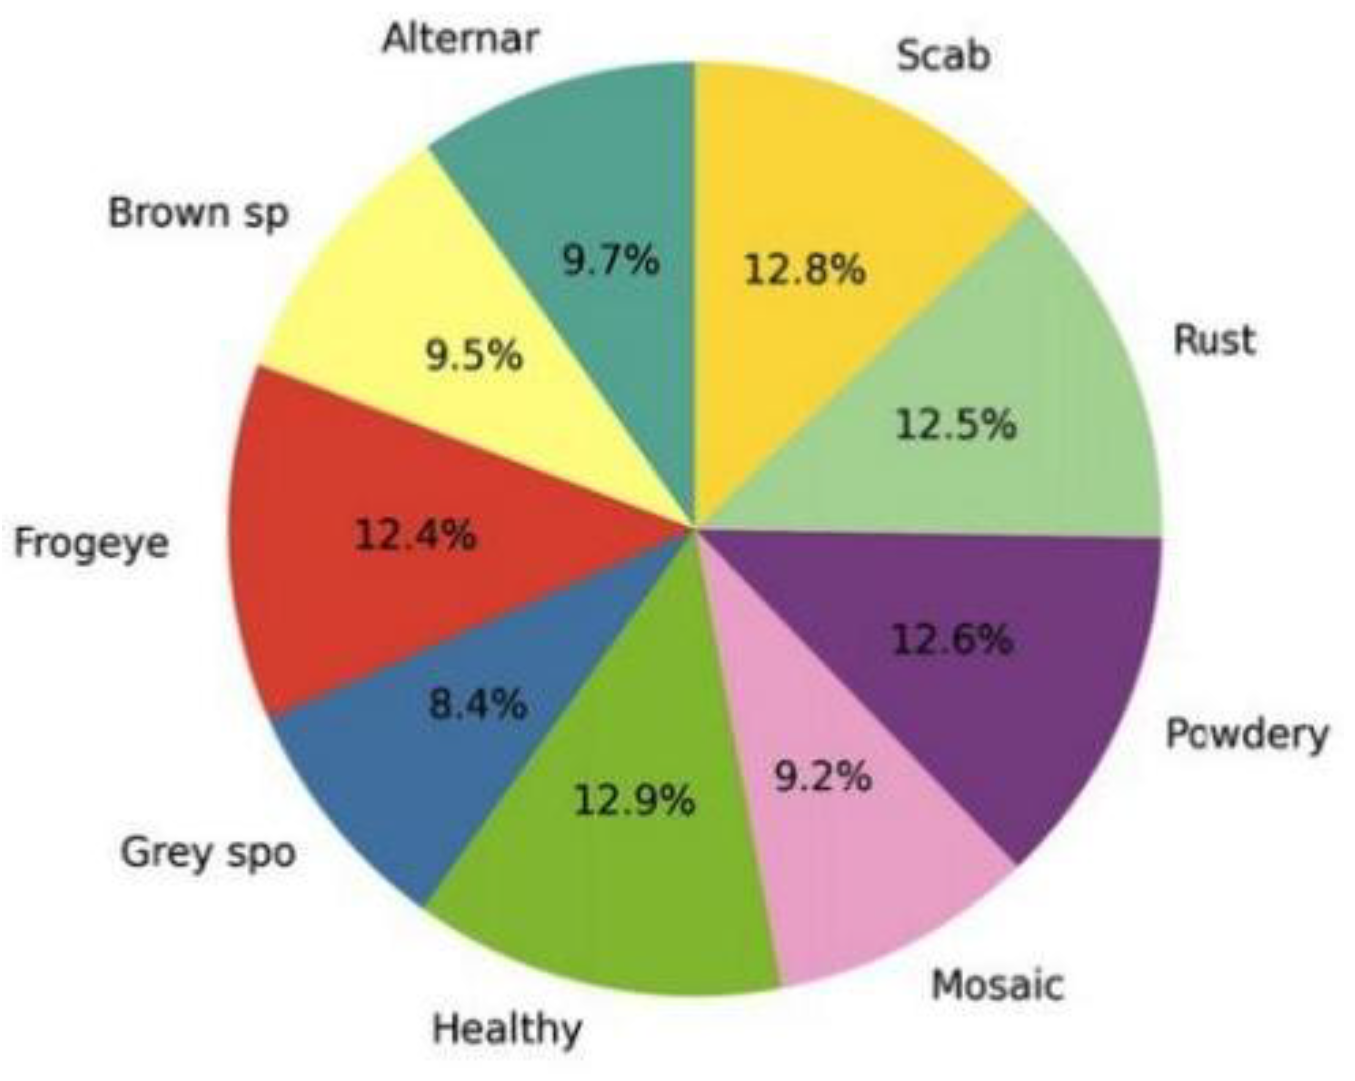
Figure 4.
Correlation matrix of top 20 dimensions of features obtained with YOLOv8. Strong positive and negative correlations are referred to as dark red and blue respectively.
Figure 4.
Correlation matrix of top 20 dimensions of features obtained with YOLOv8. Strong positive and negative correlations are referred to as dark red and blue respectively.
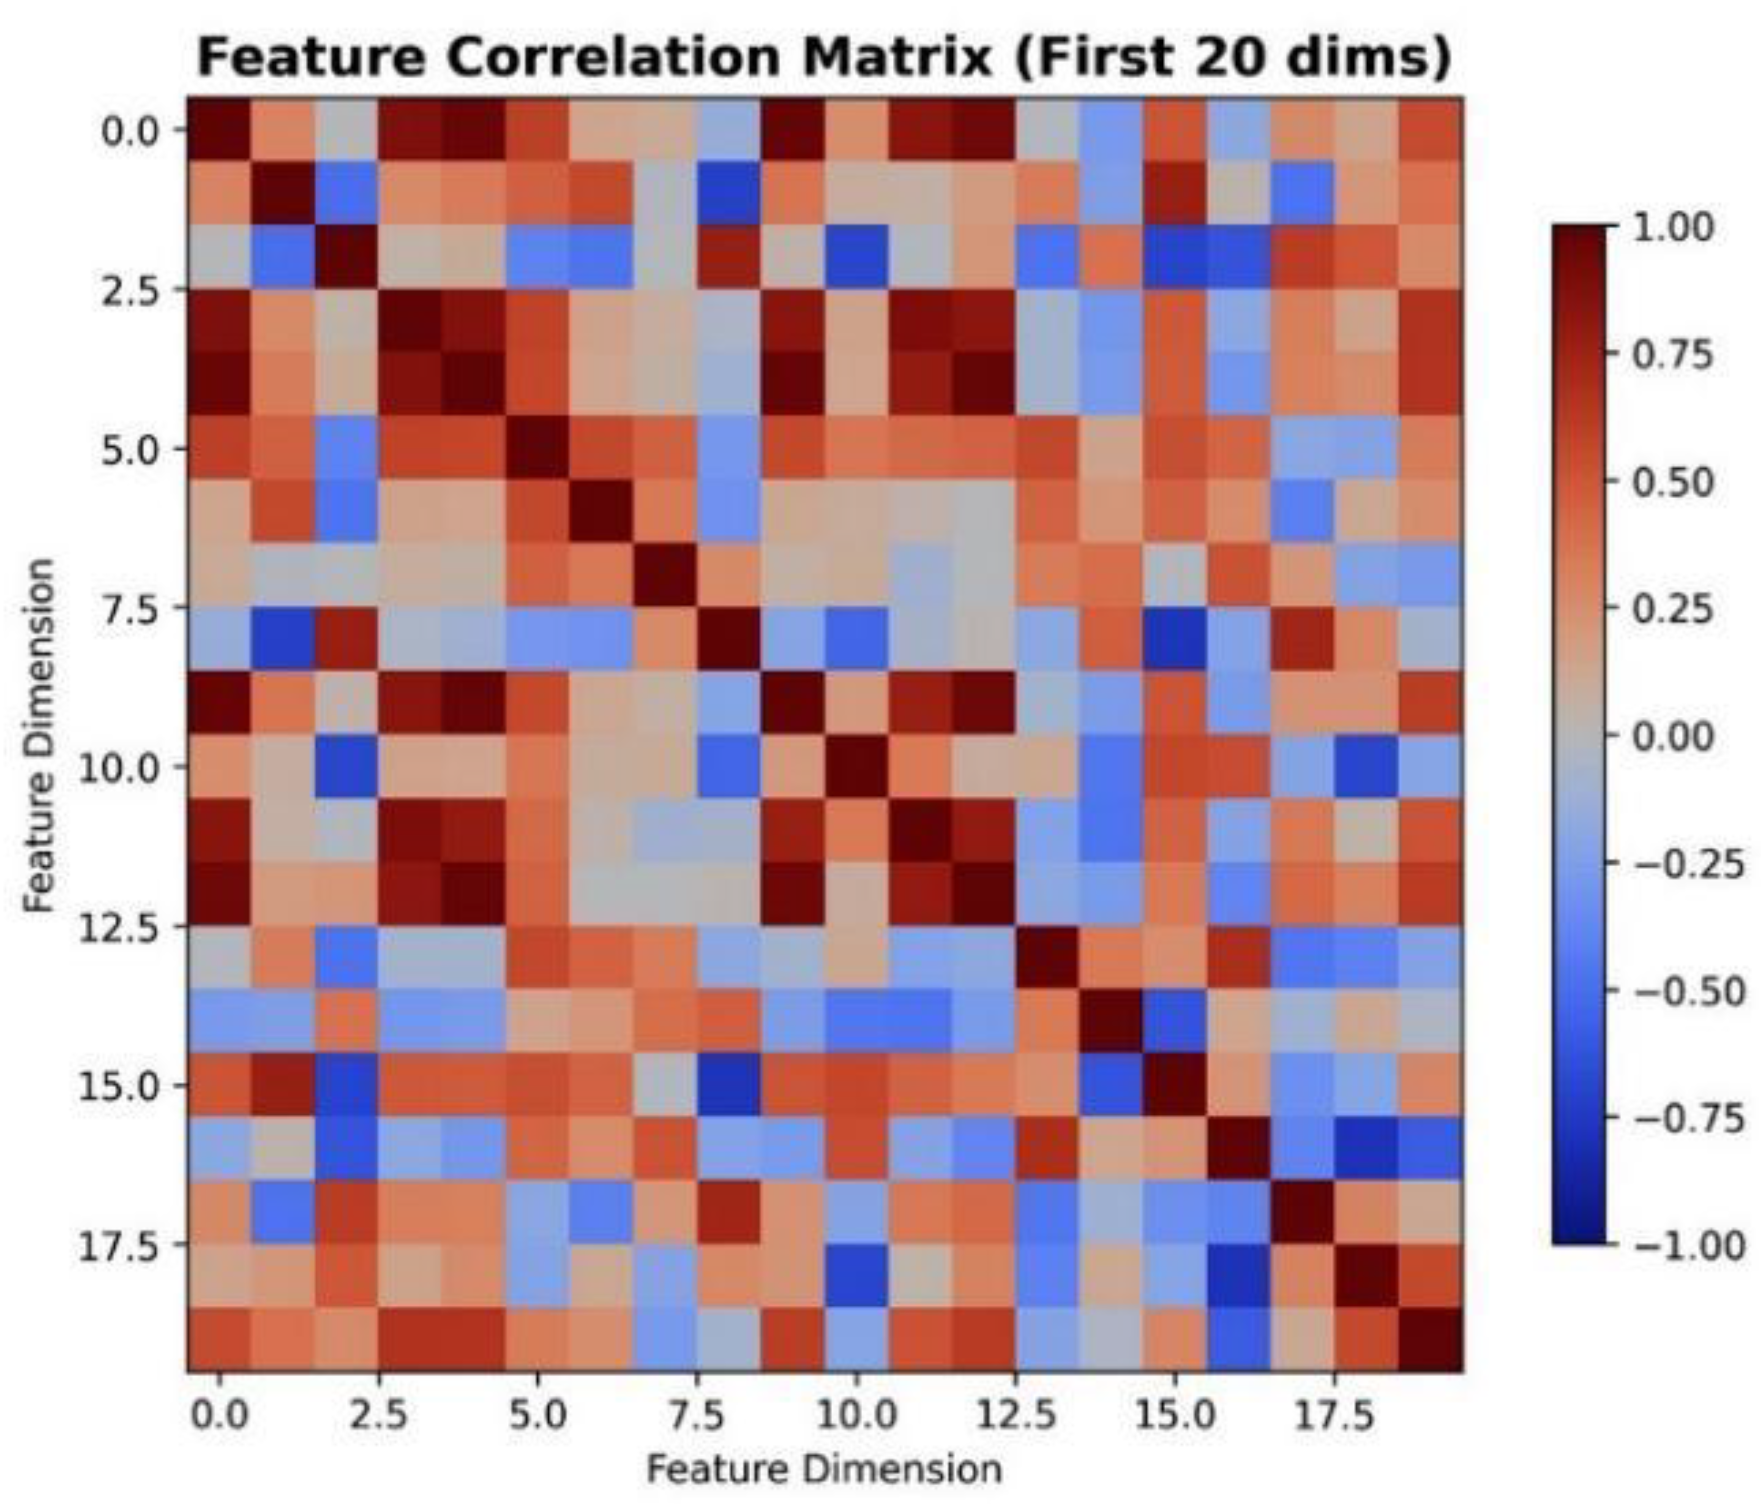
Figure 5.
Modelling comparison of active coefficient or node complexity of three models. Lasso is less complex with high accuracy.
Figure 5.
Modelling comparison of active coefficient or node complexity of three models. Lasso is less complex with high accuracy.
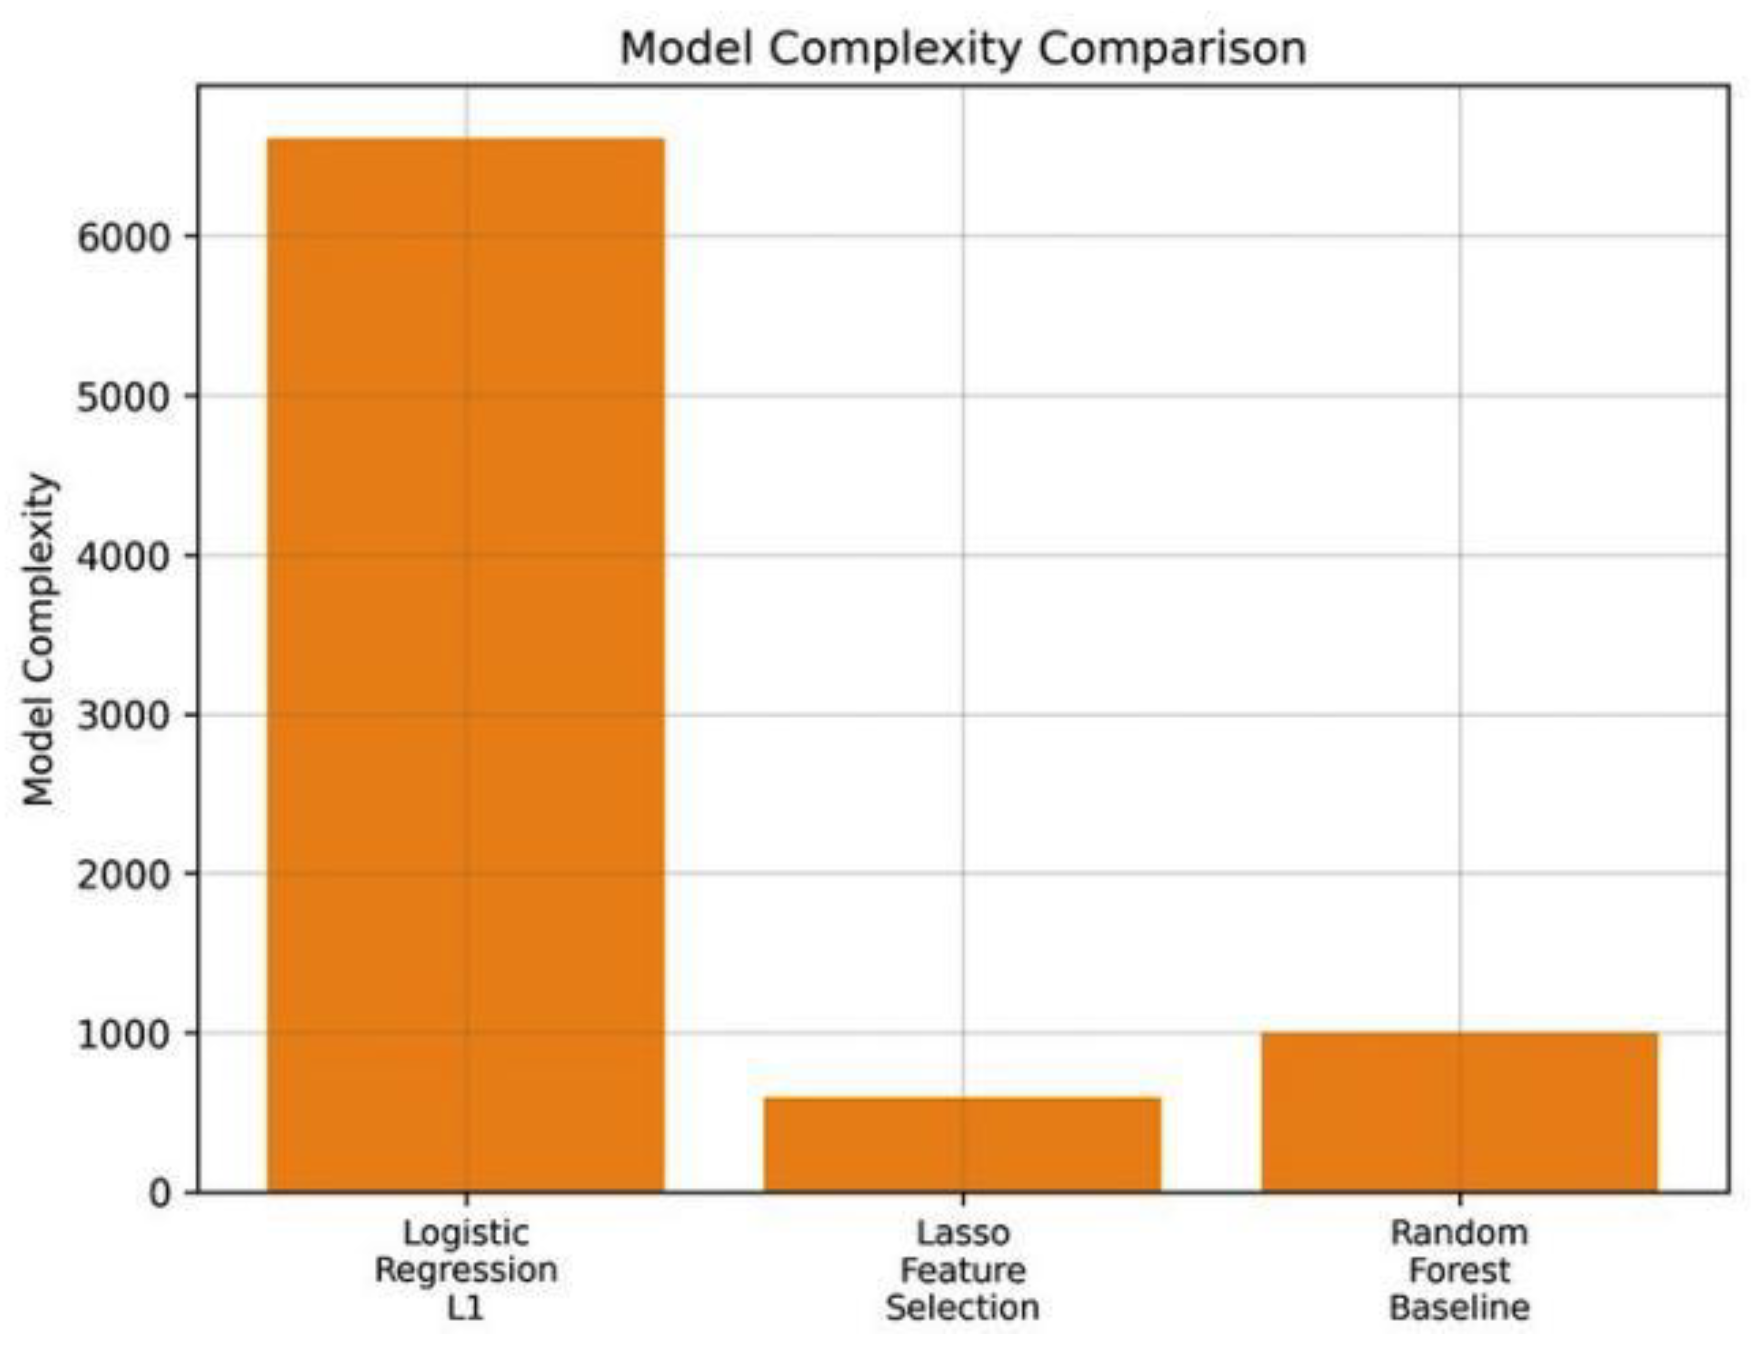
Figure 6.
Histogram of non-zero coefficients with the use of L1 regularization. This results in sparsity of 13.48 with 276 features being selected.
Figure 6.
Histogram of non-zero coefficients with the use of L1 regularization. This results in sparsity of 13.48 with 276 features being selected.
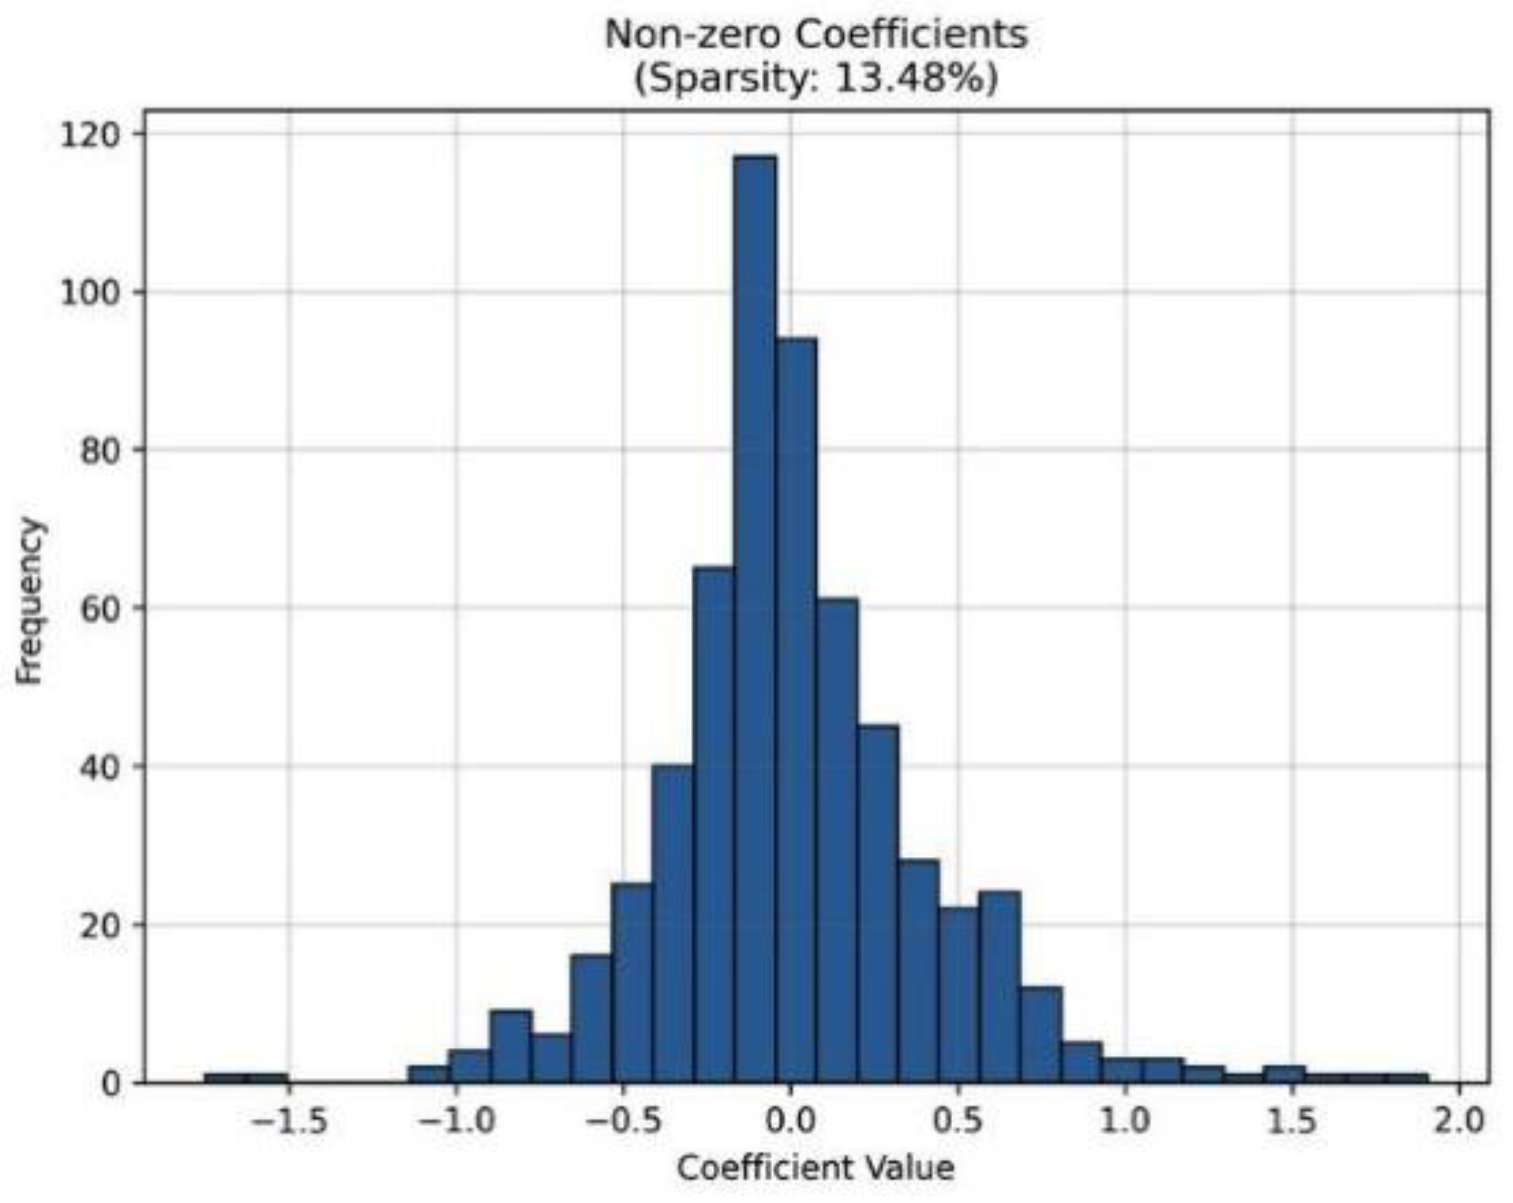
Figure 7.
shows that the classifier based on Lasso is better than the baseline methods in both accuracy in tests and cross-validation stability.
Figure 7.
shows that the classifier based on Lasso is better than the baseline methods in both accuracy in tests and cross-validation stability.
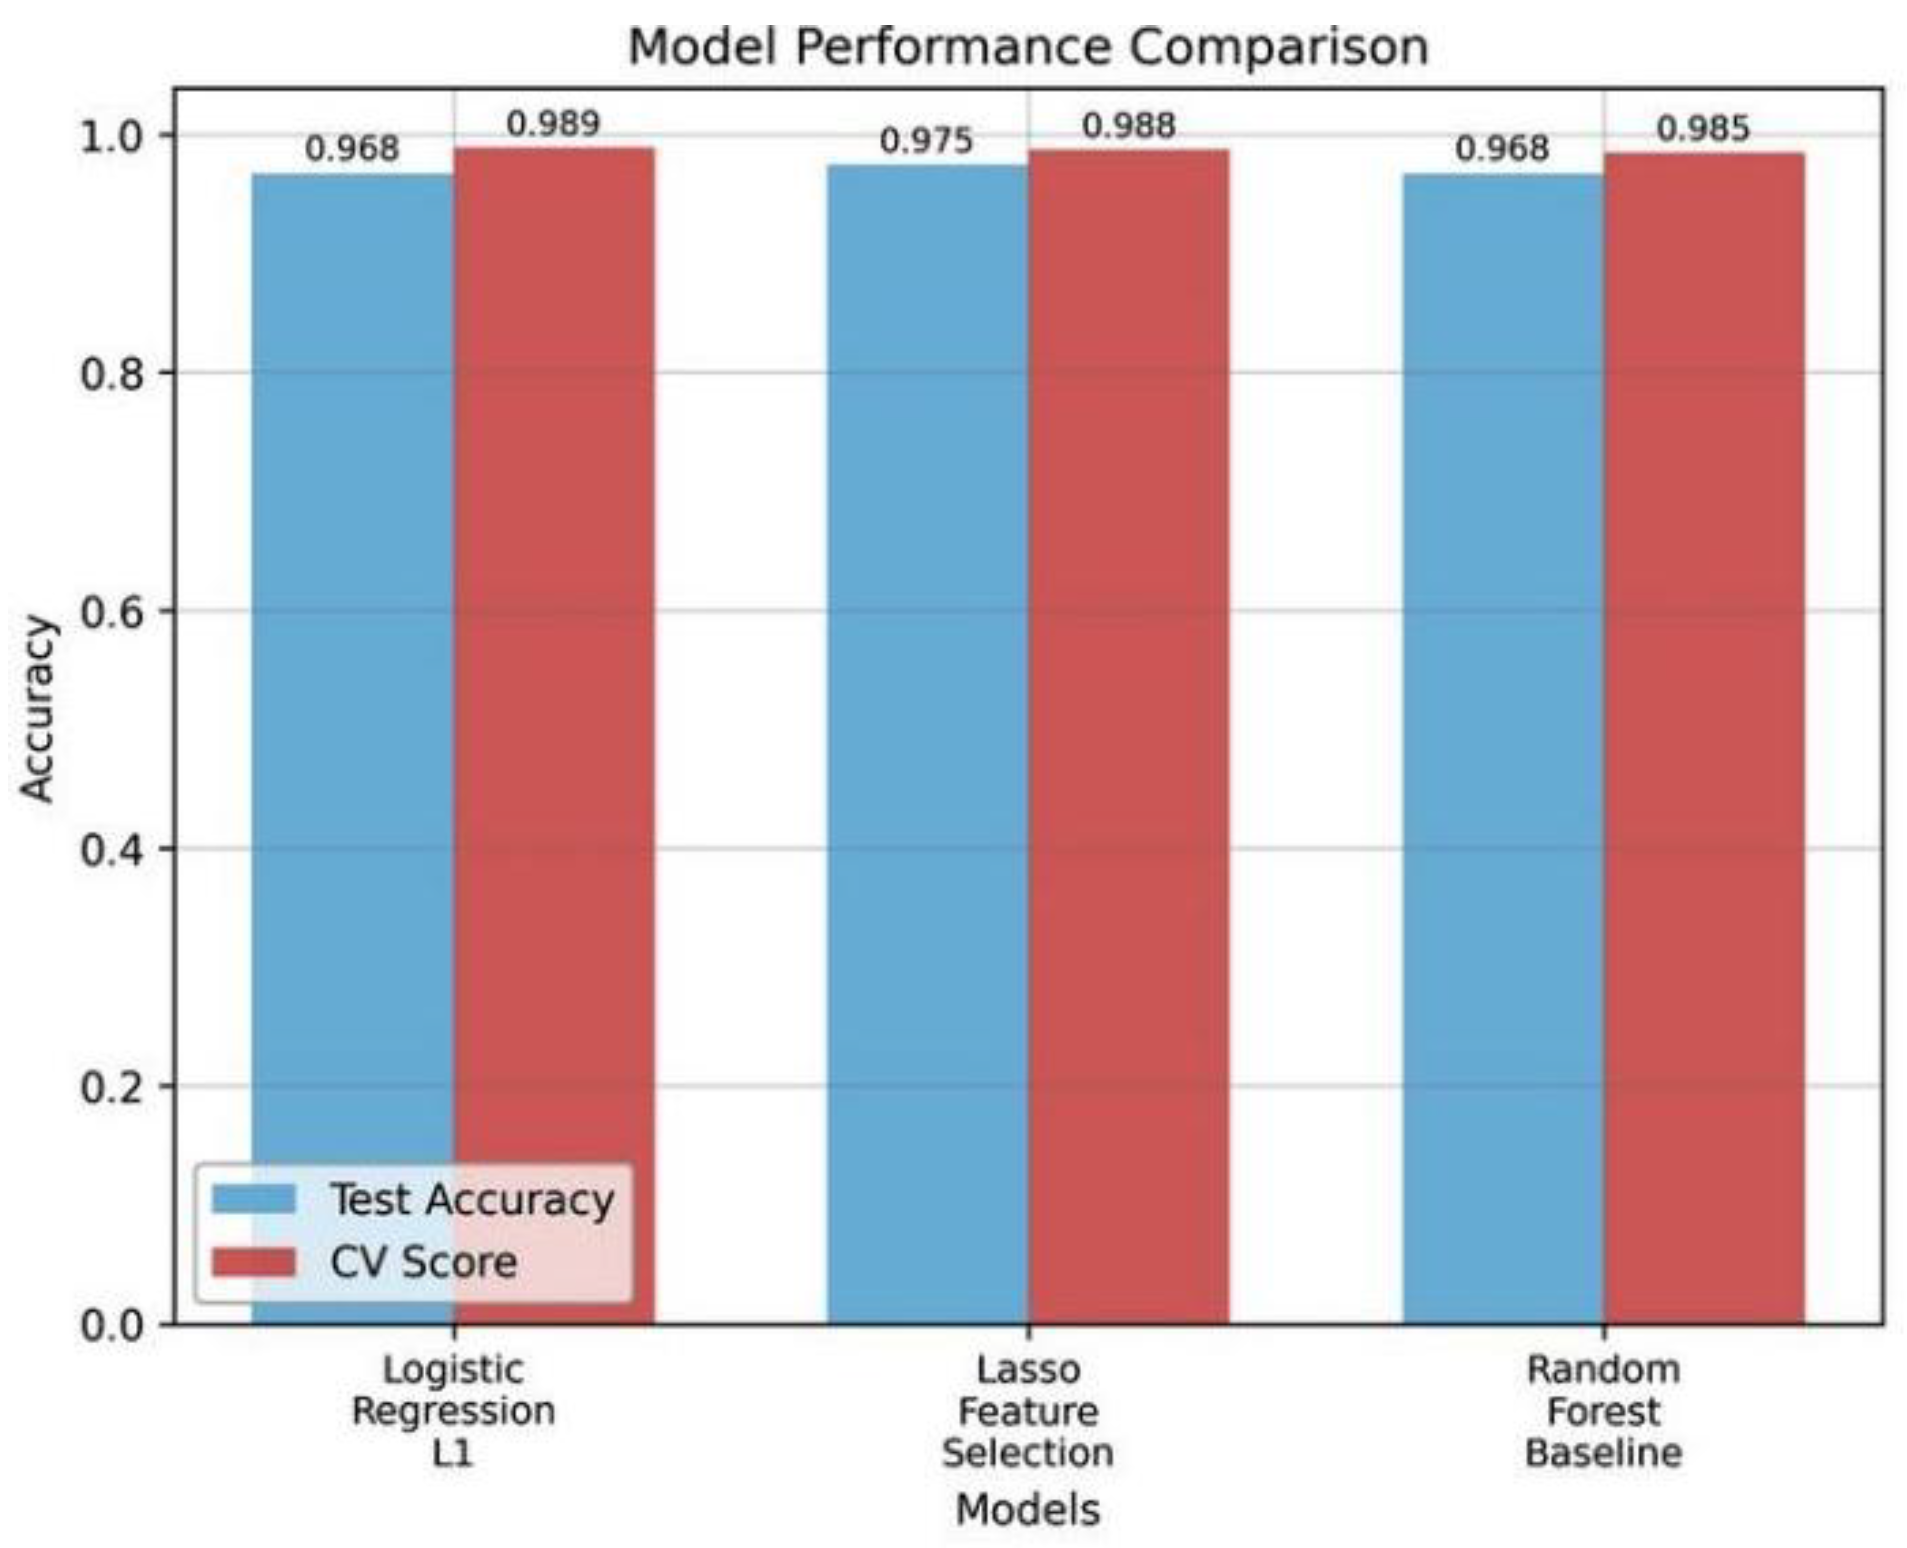
Figure 8.
Comparison of training and test accuracy of three different classifications: The Logistic Regression (L1), Lasso Feature Selection, and Random Forest Baseline. The model based on the Lasso gives the optimal balance in terms of training and test.
Figure 8.
Comparison of training and test accuracy of three different classifications: The Logistic Regression (L1), Lasso Feature Selection, and Random Forest Baseline. The model based on the Lasso gives the optimal balance in terms of training and test.
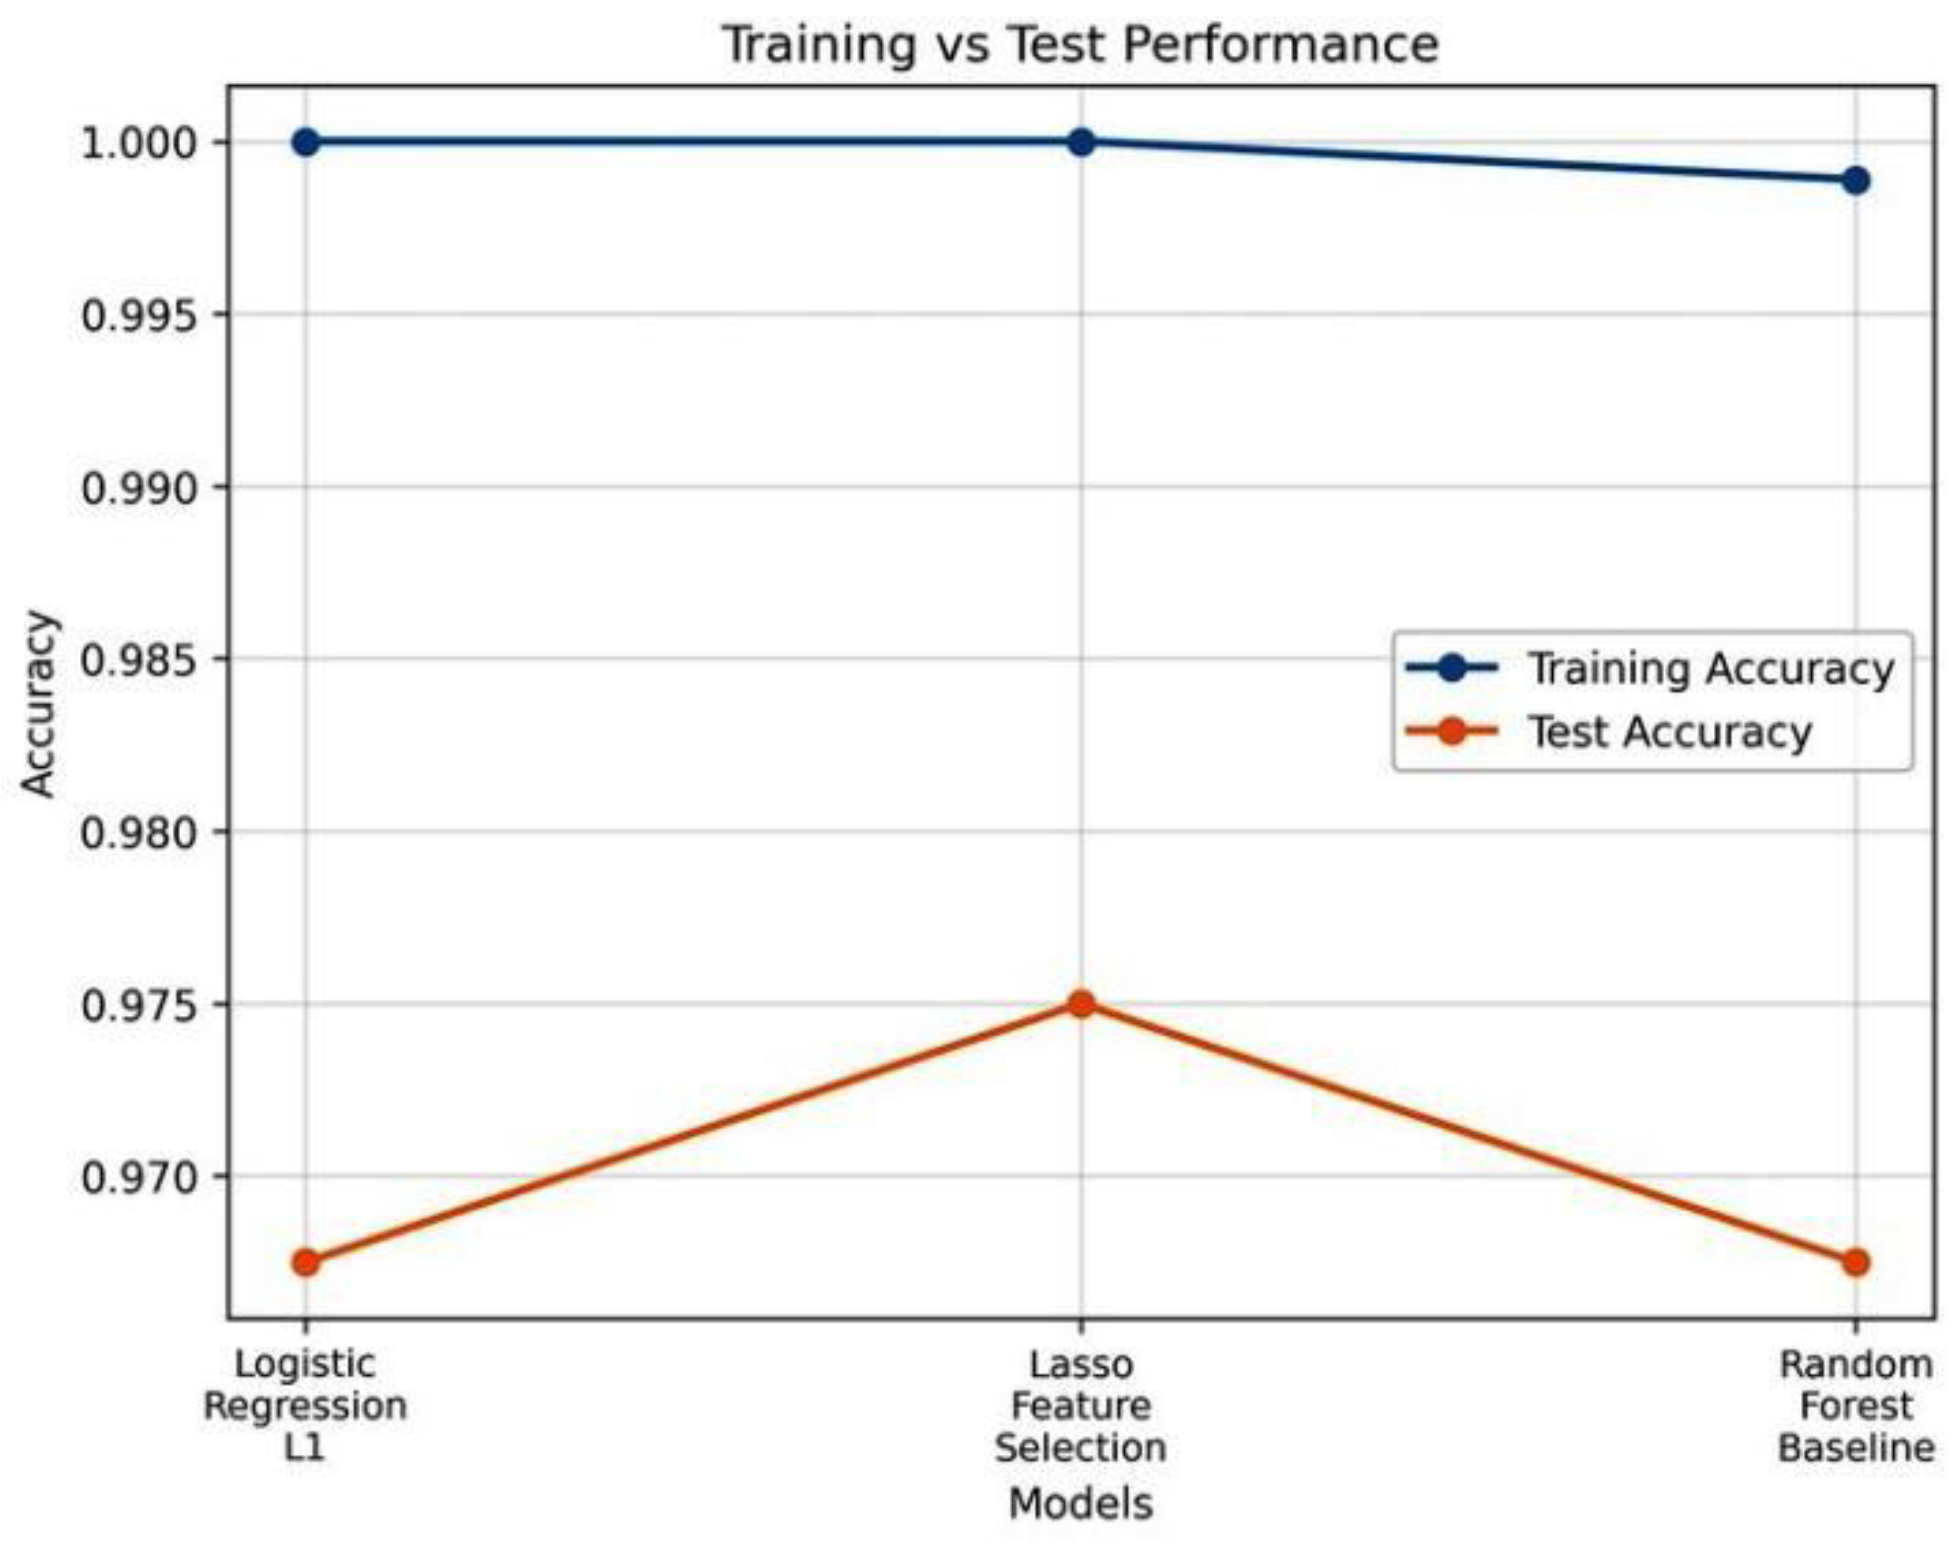
Figure 9.
Per-class performance (Precision, Recall, F1-Score) of the Lasso Feature Selection model. Every category of diseases has balanced measures at a value of above 0.85.
Figure 9.
Per-class performance (Precision, Recall, F1-Score) of the Lasso Feature Selection model. Every category of diseases has balanced measures at a value of above 0.85.
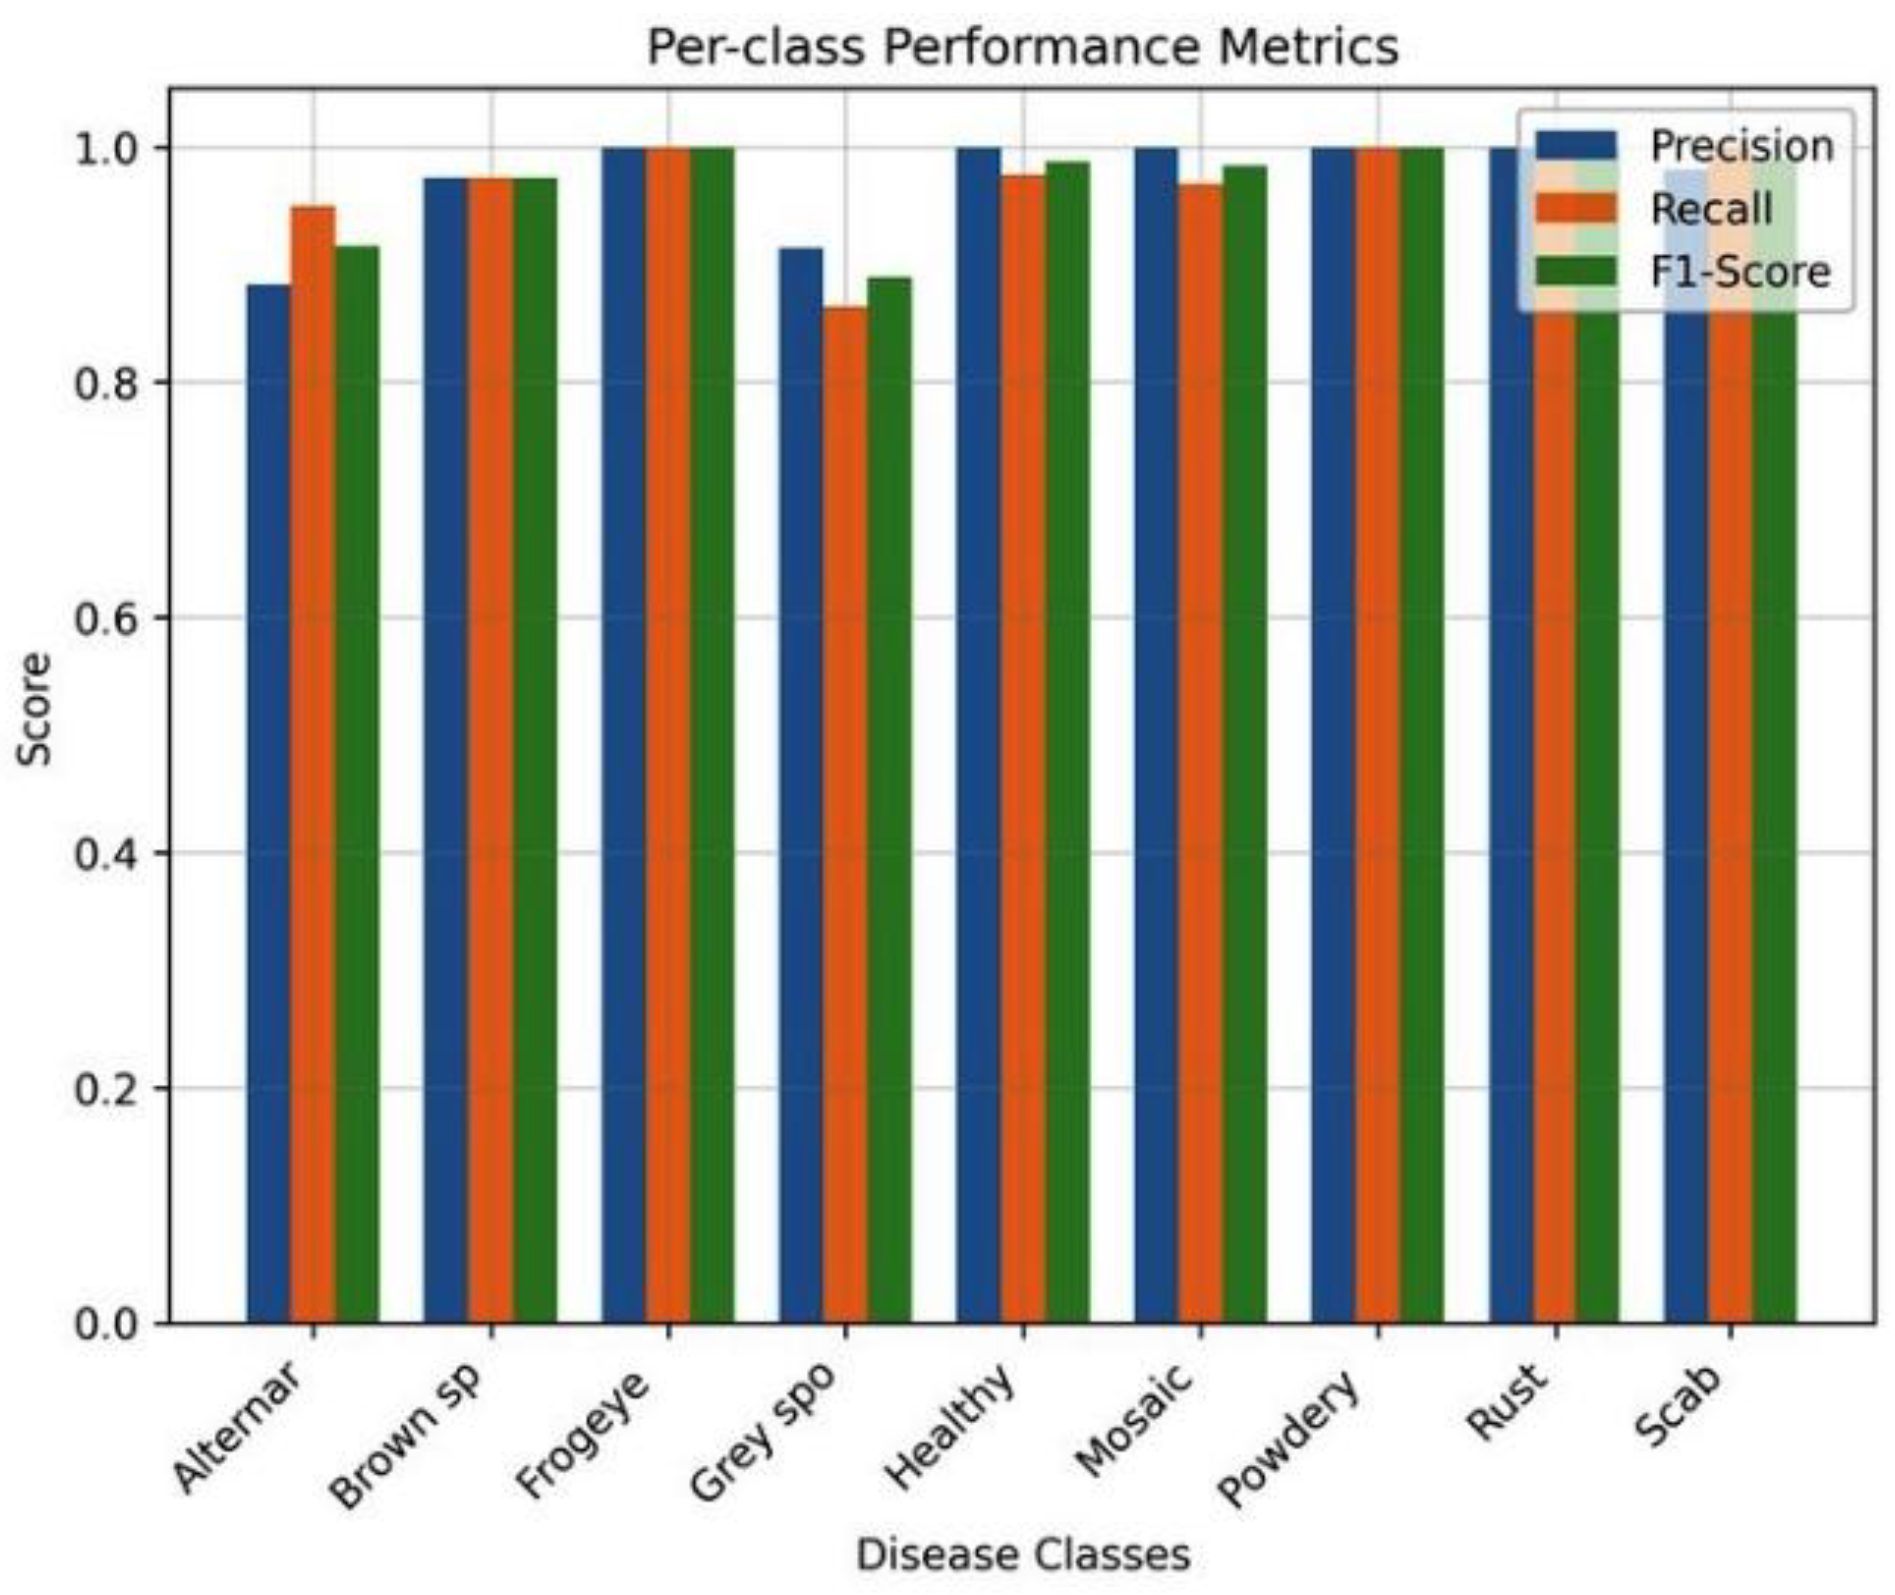
Figure 10.
The confusion matrix of the Lasso Feature Selection model using the test set illustrating the performance of the prediction per-class across nine disease categories.
Figure 10.
The confusion matrix of the Lasso Feature Selection model using the test set illustrating the performance of the prediction per-class across nine disease categories.
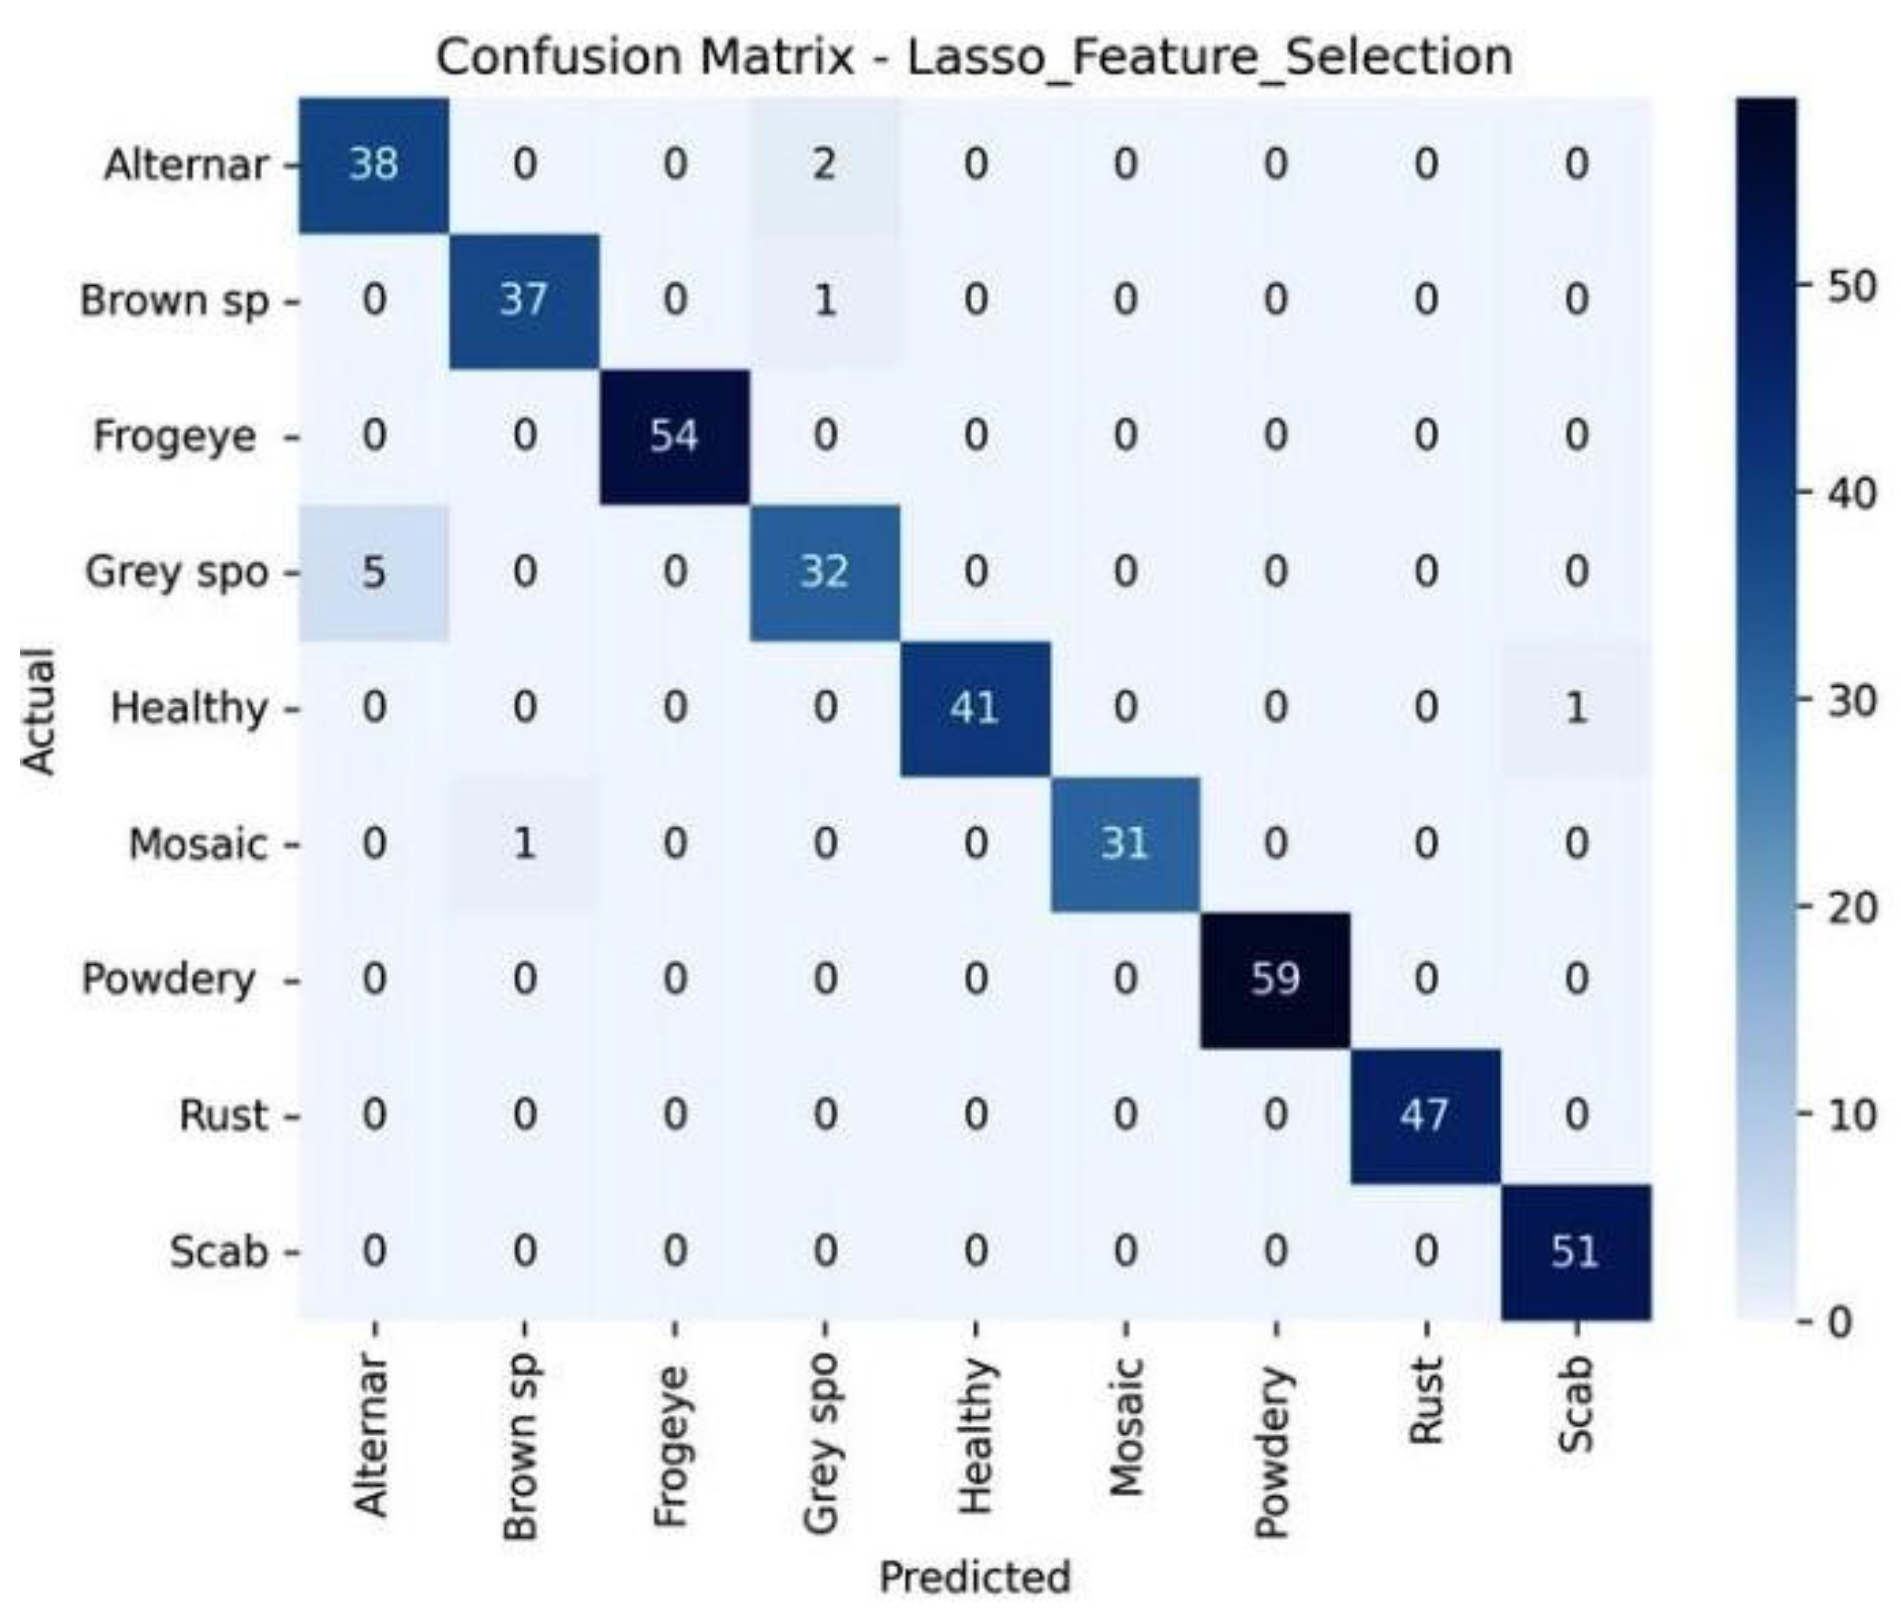

Table 1.
YOLOV8 detection results on validation set.
| Model | mAP @ 0.5 (%) | mAP@0.5:0.95 (%) | Precision (%) | Recall (%) |
|---|---|---|---|---|
| YOLOv8 | 98.10 | 79.31 | 95.16 | 95.97 |
Table 2.
Comparision of L1-Regularised and Baseline Classifiers Using YOLOv8 Features.
| Classifier | CV Accuracy (%) | Test Accuracy (%) | Features Used | Remarks |
|---|---|---|---|---|
| Logistic Regression (L1) | 98.95 | 96.75 | 3,648 | Baseline |
| Random Forest (Baseline) | 95.10 | 94.60 | All | – |
| Lasso Feature Selection | 98.78 | 97.50 | 319 | 276 non-zero |
Table 3.
Per-class Precision, Recall, And F1 Scores for Apple Leaf Disease Recognition.
| Disease | Precision (%) | Recall (%) | F1-Score (%) |
|---|---|---|---|
| Alternaria leaf spot | 88.37 | 95.00 | 91.57 |
| Brown spot | 97.37 | 97.37 | 97.37 |
| Frogeye leaf spot | 100.00 | 100.00 | 100.00 |
| Grey spot | 91.43 | 86.49 | 88.89 |
| Healthy leaf | 100.00 | 97.62 | 98.80 |
| Mosaic | 100.00 | 96.88 | 98.41 |
| Powdery mildew | 100.00 | 100.00 | 100.00 |
| Rust | 100.00 | 100.00 | 100.00 |
| Scab | 98.08 | 100.00 | 99.03 |
| Average | 97.25 | 97.04 | 97.12 |
Table 4.
Five-fold cross validation results for lasso classifier.
| Accuracy (%) | Precision (%) | Recall (%) | F1 (%) | |
|---|---|---|---|---|
| Mean | 98.63 | 98.42 | 98.34 | 98.36 |
| Std. Dev. | 0.83 | 0.94 | 1.02 | 0.99 |
Disclaimer/Publisher’s Note: The statements, opinions and data contained in all publications are solely those of the individual author(s) and contributor(s) and not of MDPI and/or the editor(s). MDPI and/or the editor(s) disclaim responsibility for any injury to people or property resulting from any ideas, methods, instructions or products referred to in the content. |
© 2025 by the authors. Licensee MDPI, Basel, Switzerland. This article is an open access article distributed under the terms and conditions of the Creative Commons Attribution (CC BY) license (http://creativecommons.org/licenses/by/4.0/).
Copyright: This open access article is published under a Creative Commons CC BY 4.0 license, which permit the free download, distribution, and reuse, provided that the author and preprint are cited in any reuse.


