Submitted:
27 October 2025
Posted:
28 October 2025
You are already at the latest version
Abstract
This paper presents the Fuzzy-Semantic Evaluation Framework (FSEF), a structured methodology for assessing emotional reasoning in lightweight transformer models under constrained computational conditions. The framework integrates accuracy, calibration, and latency as a unified triad to evaluate interpretive fidelity, probabilistic reliability, and real-time feasibility. Two lightweight transformers, MiniLM and DistilBERT, were implemented with a One-vs-Rest logistic classifier and compared against zero-shot prototype-matching baselines. All experiments were conducted in a virtualized single-core CPU environment with 2 GB RAM, replicating the constraints of typical IoT devices. Using the GoEmotions dataset containing 27 emotion categories and approximately 8,000 test samples, each model was evaluated under a fixed decision threshold of θ = 0.5. The supervised One-vs-Rest (OvR) models achieved substantially higher precision and balanced recall than the zero-shot configurations. DistilBERT-OvR reached the best overall results (Decision-F1 = 0.516, micro-F1 = 0.371), while MiniLM-OvR provided faster inference (≈27 ms) with moderate accuracy. Zero-shot variants maintained near-complete coverage (DecisionAcc ≈ 0.96) but exhibited low precision (≈0.05). All models operated within the 100 ms real-time boundary, confirming the feasibility of reliable emotional inference on resource-limited hardware. These findings demonstrate that probabilistically calibrated lightweight transformers can support interpretable, efficient, and deployable emotional AI systems for healthcare and telehealth environments.
Keywords:
emotional AI
; lightweight transformer
; probabilistic calibration
; FSEF framework
; IoT-based emotion recognition
; real-time latency
; IoT and edge deployment
; telehealth
; elderly-care AI
1. Introduction
As healthcare systems move toward home-based and aging populations, intelligent IoT devices have become essential for continuous monitoring. However, most devices focus on physical signals such as pulse or motion and overlook the emotional language patterns that often precede health decline in older adults. Elderly individuals tend to express discomfort indirectly through vague phrases, creating semantic ambiguity that conventional sentiment models cannot interpret effectively.
This study develops the Fuzzy-Semantic Evaluation Framework (FSEF) to address this limitation by enabling emotion recognition under constrained computational conditions. The framework integrates accuracy, calibration, and latency (A–C–L) as three evaluation dimensions, ensuring that emotional reasoning remains both interpretable and efficient. Two lightweight transformer models, MiniLM and DistilBERT, are implemented with a One-vs-Rest logistic classifier and evaluated on the GoEmotions dataset using a fixed threshold of θ = 0.5.
To enhance real-world deployability, the trained One-vs-Rest (OvR) models are published on the Hugging Face Hub, allowing IoT gateways with limited resources (single-core, 2 GB memory) to directly download and execute verified models without external computation. This workflow enables local, privacy-preserving emotion monitoring for older users, supporting timely health alerts in telehealth and home-care systems.
The FSEF demonstrates that lightweight models can achieve reliable fuzzy-semantic discrimination even in resource-limited environments. Its contribution lies in providing an operational paradigm that connects emotional language understanding with ethical and technical feasibility, extending emotional AI toward aging-friendly and energy-efficient emotional health monitoring applications.
2. Related Work
Early work in affective computing treated emotion recognition as a discrete classification problem based on lexical or acoustic cues.
- Picard’s foundational study established the concept of machine emotion perception [1], while subsequent research on sentiment analysis [2,3] highlighted progress but failed to handle fuzzy semantics—where emotional meaning varies with linguistic ambiguity and context, as theorized by Zadeh’s fuzzy set principles [4].
- Recent advances introduced fuzzy models that better capture ambiguous emotional expressions [5], an ability critical for healthcare and elderly communication where subtle cues often precede physical decline.
Transformer-based models such as BERT and RoBERTa improved contextual understanding but often produce overconfident predictions without proper calibration.
- However, these methods increase computational cost and are unsuitable for real-time or low-power systems, especially in medical AI [8].
To enhance efficiency, lightweight transformers such as DistilBERT [9] and MiniLM [10] leverage knowledge distillation for compact inference, supporting edge and IoT deployment [11]. Yang et al. [12] further showed feasibility in mobile healthcare settings.However, cloud-dependent inference introduces latency and potential privacy risks, motivating the development of lightweight models capable of secure, on-device emotional reasoning in healthcare IoT systems.Yet, most prior work emphasized accuracy or throughput while neglecting calibration stability and latency trade-offs. Recent calls for interpretable and responsible AI [13,14] underscore the need for frameworks that balance reliability with feasibility.
- Building upon these directions, the proposed Fuzzy-Semantic Evaluation Framework (FSEF) not only integrates accuracy, calibration, and latency into a unified structure but also emphasizes reproducibility and privacy-preserving deployment for real-world IoT environments [15]
3. Methods
3.1. Theoretical Framework
The proposed study builds on the Fuzzy-Semantic Evaluation Framework (FSEF), designed to quantify emotional reasoning in transformer-based systems under constrained computing conditions. The framework evaluates models through a three-fold analytic structure—Accuracy, Calibration, and Latency (A–C–L)—which collectively express how linguistic interpretation, probabilistic reliability, and computational efficiency interact within a unified reasoning process.
- Accuracy (A) captures external validity—the degree to which predicted emotion labels coincide with human annotation.
- Calibration (C) measures how consistently the model’s confidence values correspond to empirical correctness. For probability-based models, this is assessed through metrics such as ECE and Brier Score. For zero-shot similarity-based models, these metrics are applied to sigmoid-normalized similarity scores as confidence reliability proxies, allowing a consistent comparison of relative reliability across inference paradigms.
- Latency (L) quantifies computational realism, or the average inference time required per utterance on the designated single-core, 2 GB IoT device
Together, these three dimensions articulate a measurable equilibrium between cognitive fidelity and device feasibility—a balance crucial for deploying ethical, interpretable emotion models at the network edge.
3.1.1. Mathematical Formulation of the Framework
For each utterance i, FSEF defines a structured set of decision-level metrics that formalize the A–C–L dimensions:
measures whether the model predicts at least one correct label for each sample; it thus reflects the coverage of partial correctness (at-least-one accuracy) rather than full label-set agreement:
represent the average precision among all samples where the model makes a prediction, showing how many of the predicted labels are actually correct.
defines the average recall for samples with predictions, indicating how much of the true label set the model successfully identifies when it decides to predict.
is the harmonic mean of per-sample precision and recall, providing a balanced view of accuracy across samples that received predictions at the chosen threshold.
The Jaccard index integrates false-positive and false-negative dynamics into a single measure of set-level coherence.
Instead of adopting model-specific optima, the threshold θ was empirically examined over [0.1, 0.9] on the validation set. The scans indicated that θ ≈ 0.5 lies near the plateau of maximum F1 stability for the supervised One-vs-Rest (OvR) models, providing a consistent operating point where precision and recall remain balanced.
For zero-shot configurations, this value does not guarantee the same precision–recall balance but serves as a unified and reproducible comparison baseline across inference paradigms.
Accordingly, θ = 0.5 was fixed for all models to maintain an interpretable decision boundary and ensure fair cross-paradigm comparison rather than model-specific tuning.
3.1.2. Rationale and Semantic Context
The rationale for integrating fuzzy semantics into the FSEF framework arises from the observation that emotional expressions in natural language rarely correspond to single, discrete categories. Everyday communication often contains mixed or partially overlapping affective cues—such as “I’m fine,” “maybe,” or “it’s probably nothing”—that require probabilistic interpretation rather than fixed categorical assignment. Representing emotions as overlapping probabilistic distributions enables the model to handle this ambiguity and better approximate the linguistic variability observed in real-world affective data.
The use of a fixed decision threshold (θ = 0.5) introduces consistency and interpretability into the evaluation process. This threshold functions as a predefined confidence boundary, ensuring that the model produces an output only when its probability estimates exceed a defined level of evidence. The fixed threshold transforms uncertainty into a quantifiable operational condition, allowing a direct assessment of the model’s decision reliability under uniform constraints across different architectures.
Each decision-level metric quantitatively represents a specific aspect of model performance. DecisionAcc(θ) measures whether the model predicts at least one correct emotional label for each instance, focusing on recognition coverage. DecisionPrec(θ) evaluates prediction accuracy among outputs by quantifying the proportion of correctly identified emotions, while DecisionRec(θ) examines the completeness of predictions relative to the true emotional labels. Their harmonic mean, DecisionF1(θ), summarizes the balance between coverage and precision. Calibration metrics, including ECE, Brier Score, assess the reliability of the probability estimates, verifying that predicted confidence values correspond to empirical correctness. Collectively, these measures evaluate both the external validity and internal consistency of the model’s probabilistic behavior.
Conceptually, the A–C–L triad (Accuracy–Calibration–Latency) characterizes the interaction among interpretive precision, probabilistic reliability, and computational efficiency. Accuracy reflects the degree to which the model’s predictions align with reference annotations. Calibration measures the consistency between prediction confidence and empirical outcomes. Latency quantifies the feasibility of inference under constrained computational resources. Together, these dimensions provide a structured view of model behavior, linking linguistic interpretation with quantitative validation. By combining probabilistic inference and fuzzy semantics, the FSEF framework formalizes emotional reasoning as a calibrated computational process that ensures both interpretive accuracy and operational stability.
3.2. Framework Architecture
The framework is structured to balance semantic capacity, calibration reliability, and computational feasibility. The following subsection outlines the backbone selection and lightweight design principles that enable this balance in practice.
3.2.1. Model Selection and Lightweight Design
The framework employs two lightweight Transformer encoders—MiniLM and DistilBERT—as the backbone models. These architectures were chosen after evaluating a range of pretrained language models with respect to parameter size, computational cost, and representation quality. MiniLM (approximately 33 million parameters) and DistilBERT (approximately 66 million parameters) both retain the linguistic richness of BERT-base while providing substantially faster inference speed. MiniLM achieves this efficiency through self-attention distillation, aligning attention maps between student and teacher models, whereas DistilBERT uses layer-wise knowledge distillation to transfer intermediate representations. This combination allows FSEF to examine the trade-off between model compactness and semantic expressiveness under identical experimental conditions.
To maintain efficiency during task adaptation, a frozen-encoder strategy is employed. In this approach, all transformer parameters remain fixed throughout the training phase, while only a small number of task-specific parameters—belonging to the output classifier—are optimized. Freezing the encoder ensures that the large pretrained feature extractor functions as a stable sentence embedding generator, reducing the number of trainable parameters from tens of millions to only those within the lightweight classification head. This reduces GPU memory and training time and helps mitigate overfitting risks, which is particularly advantageous when training data are limited or noisy, as is common in emotion-labeled corpora. As a result, the model maintains the rich contextual representations acquired during large-scale pretraining, while introducing minimal computational overhead.
A One-vs-Rest (OvR) logistic regression head is attached to each encoder to enable multi-label classification. The OvR head is composed of 27 independent binary classifiers, each responsible for predicting the presence or absence of one emotion category from the GoEmotions dataset (except “neutral” category). This design reflects the nature of emotional language, where multiple emotions can co-occur within a single sentence. Each logistic unit receives the same sentence embedding as input and outputs a probability score, representing the independent likelihood that a specific emotion is active. Unlike softmax-based classifiers that enforce mutual exclusivity among labels, the OvR architecture allows all 27 probabilities to be computed simultaneously and independently.
The independence of classifiers also makes the architecture modular: each binary model can be updated or recalibrated without affecting others, facilitating efficient retraining when new emotion categories or domains are introduced. During inference, the model aggregates the outputs of all 27 classifiers into a probability vector, and a fixed threshold (θ = 0.5) is applied to determine which emotions are predicted as active. Because only the OvR parameters are trainable while the transformer remains frozen, the overall parameter footprint remains small, resulting in a compact model that performs inference within milliseconds on low-power hardware.
Following the fine-tuning stage, each MiniLM and DistilBERT OvR model is configured for publication on the Hugging Face Hub, together with its logistic weights (ovr_logreg.pkl), label encoders (mlb.pkl), and configuration metadata (meta.json). The Hub serves as a model registry that supports transparent version control and reproducibility within the FSEF framework.
In the deployment phase, the IoT device retrieves the appropriate model directly through the huggingface_hub API. The model files are automatically downloaded and initialized locally, eliminating the need for manual transfer and ensuring that each deployed instance executes a verified model consistent with the evaluation configuration.
This combination of frozen transformer encoders and lightweight OvR classifiers defines the core architectural principle of the FSEF framework: a clear separation between semantic encoding and task-specific decision making. The approach preserves general semantic knowledge while providing efficient, interpretable emotion classification suitable for deployment in IoT and embedded systems.
Figure 1.
FSEF Framework Architecture (Encoder + OvR Head Structure).
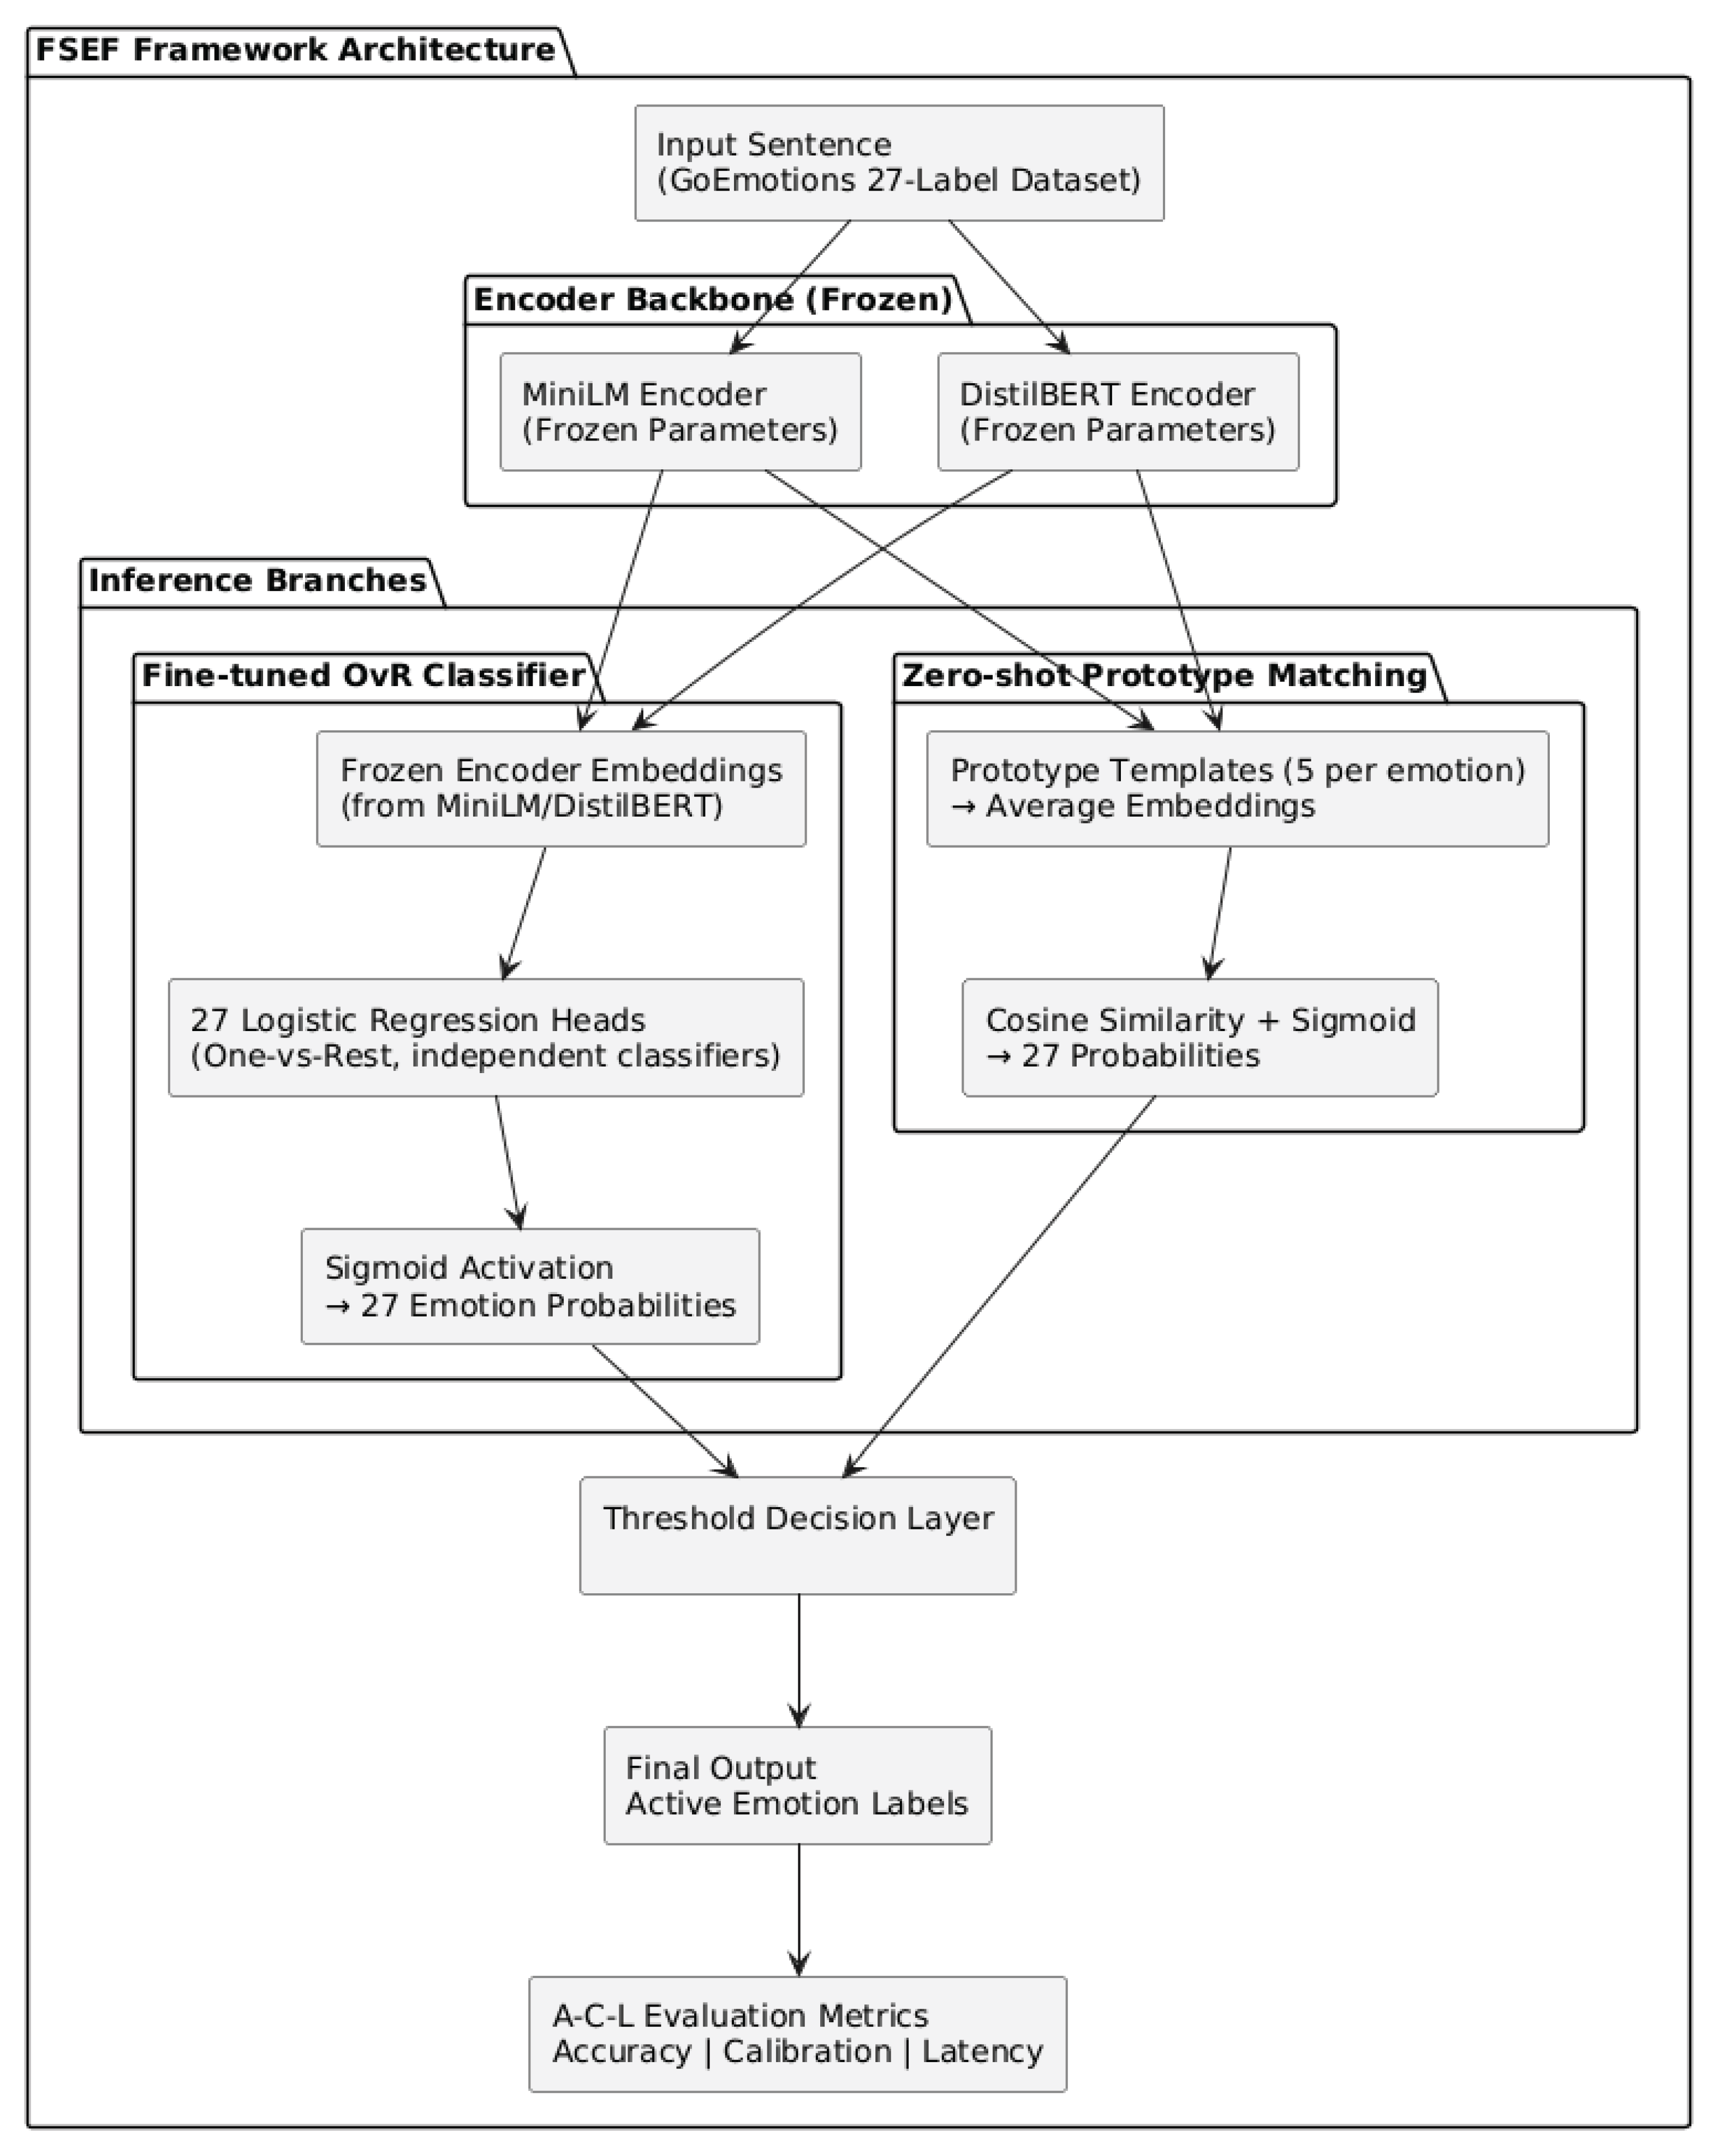
3.2.2. Inference Mechanisms: Zero-shot and Fine-tuned Models
In parallel with the trained OvR classifiers, a zero-shot inference model is implemented for comparison. This model performs emotion recognition without any supervised training. Instead, it leverages the pretrained encoder’s semantic embedding space to perform prototype-based similarity matching.
For each of the 27 emotion categories, five representative template sentences are defined (e.g., for joy: “This text expresses joy,” “I feel joyful”). Each set of templates is encoded by the same transformer, and the average embedding vector of those sentences forms the class prototype. During inference, a test sentence is encoded into a vector, and cosine similarity is computed between the input embedding and each class prototype. These similarity scores are normalized via a sigmoid function to yield comparable confidence reliability values across 27 emotions. If the probability of an emotion exceeds the fixed threshold θ = 0.5, that emotion is predicted as active; otherwise, it is omitted. The zero-shot design allows direct inference based on the encoder’s semantic knowledge but may exhibit weaker reliability compared with supervised training.
The fine-tuned OvR logistic regression model adapts the frozen encoders to task-specific emotional semantics. Using the GoEmotions training subset (27 classes, multi-label annotations), each sentence is embedded using the frozen encoder, and these embeddings are used to train 27 separate logistic regressors. Each regressor computes the conditional probability for emotion k given the input x.
Both the zero-shot and OvR models share the same output dimensionality: a 27-element confidence-score vector, where each element corresponds to an emotion category. This structural consistency allows both inference paradigms to apply the same decision threshold (θ = 0.5) for fair comparison, although the numerical meaning of the scores differs between cosine-similarity–based confidence values and logistic-regression probabilities. The OvR models incorporate supervision from labeled data, which enhances both predictive accuracy and calibration reliability compared with the unsupervised zero-shot approach.
3.3. Experimental Environment
All experiments in this study are designed under a deployment-as-validation paradigm, in which each evaluation is carried out within the same computational constraints as those expected during actual field deployment. The IoT environment was emulated through a virtualized single-core setup replicating the same resource constraints, representing a typical resource-limited edge device. This configuration serves as a controlled approximation of legacy IoT environments, enabling systematic assessment of model feasibility and stability under restricted hardware resources. All inference operations were executed within a virtualized single-core environment that emulates a 2 GB IoT device, without any offloading to external servers. This setup reproduces the computational constraints of real edge hardware while maintaining a controlled and reproducible environment for latency and throughput measurements. The local-execution design also ensures that no user data leave the device, maintaining data-privacy compliance by default.
3.4. Training Setup
Prior to deployment, model training is performed in a cloud environment to leverage scalable computational resources. The fine-tuning of One-vs-Rest (OvR) classifiers is conducted within a Jupyter-based workspace (e.g., Google Colab or equivalent GPU/CPU instances) using standard open-source Python libraries, including Transformers, Sentence-Transformers, and scikit-learn.During this phase, the GoEmotions dataset is used with its official train, validation, and test splits to guarantee consistency and reproducibility. Each sentence is first encoded into a dense vector representation by the frozen MiniLM or DistilBERT encoder, and these embeddings are then used to train 27 independent logistic-regression classifiers (one for each emotion category and remove “neutral” category).
Because only a small number of parameters—those of the logistic regressors—are optimized, the training procedure remains computationally light and can be executed efficiently even on CPU-based systems. The validation process includes scanning a range of candidate thresholds (θ ∈ [0.1, 0.9]) to identify potential operating points for composite metrics such as Decision-F1 and accuracy-coverage balance. For consistency, however, the final evaluation of all models is standardized at θ = 0.5, providing a uniform decision boundary across architectures and training conditions.
Figure 2.
cloud and IOT models flow.
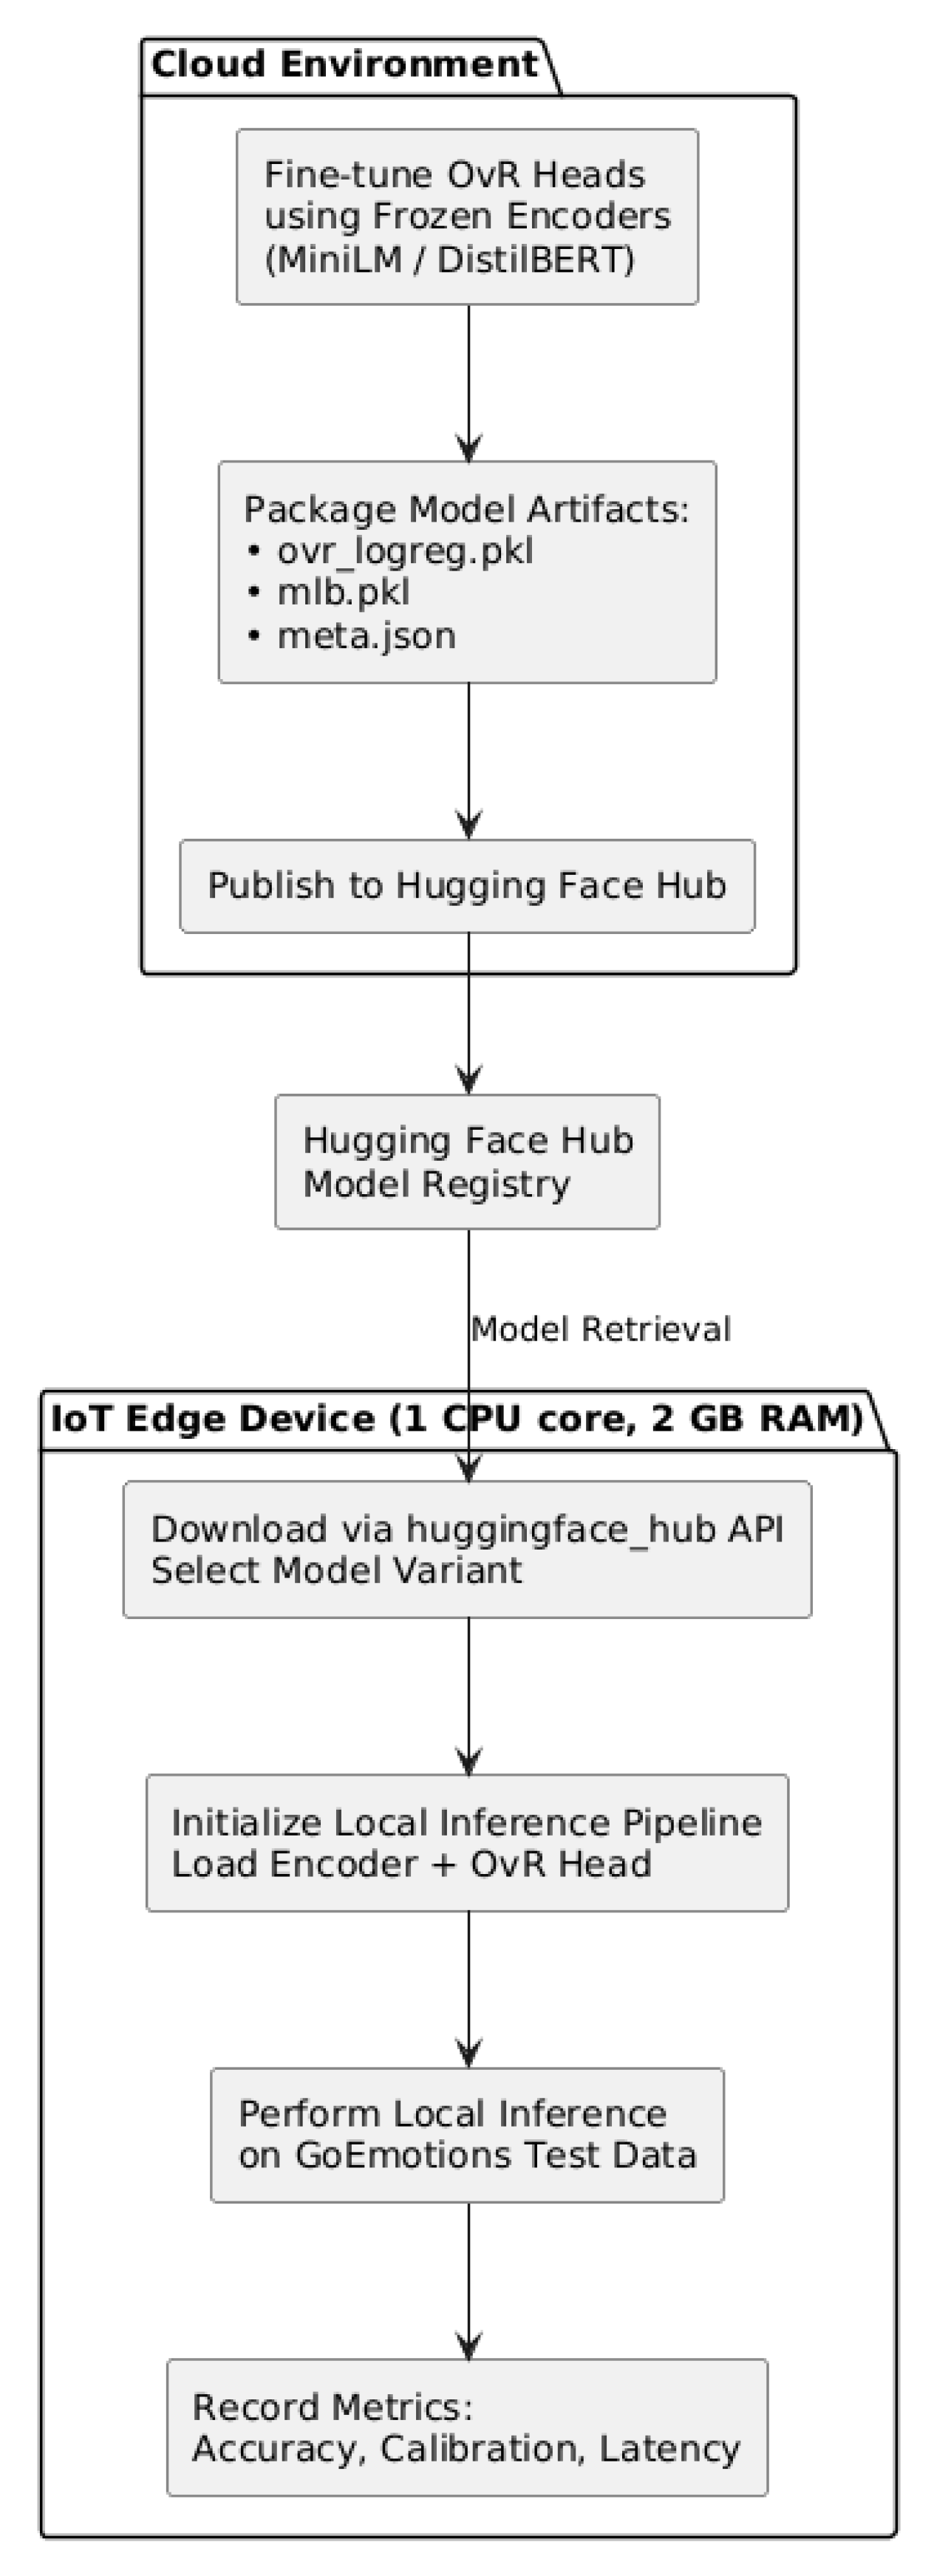
3.5. Deployment and Inference Configuration
After model preparation, both the fine-tuned OvR classifiers and the zero-shot prototype-matching pipeline are packaged for execution on the target IoT device. The trained MiniLM and DistilBERT models are hosted on the Hugging Face Hub, allowing reproducible version control and seamless transfer to embedded platforms.
For evaluation, approximately 8,000 samples from the official GoEmotions test split were used as the clean baseline, with no additional filtering or augmentation. This setup ensures reproducibility and consistency across all model configurations. Each sentence is encoded by the on-device encoder, processed through the classification head, and filtered by the fixed threshold θ = 0.5 to produce multi-label predictions.
This setup establishes the foundation for evaluating system performance under realistic hardware and computational constraints, enabling a direct transition from controlled training conditions to fully embedded testing within the FSEF framework.
3.6. Evaluation Metrics and Statistical Rationale
The evaluation adopts the A–C–L framework to ensure a balanced assessment of model performance across accuracy, calibration, and latency dimensions. It follows the theoretical metric definitions established in the framework design, emphasizing their statistical interpretation and integration within a unified evaluation structure.
Accuracy-oriented metrics evaluate how precisely and completely the model identifies emotion labels for each input sample. They include both sample-level measures (Decision-based) and set/global-level measures (Jaccard, Micro-F1, Top-1), providing complementary perspectives on model accuracy.

Table 1.
Accuracy-oriented metrics and their functional interpretation.
| Metric | Level of Evaluation | Purpose / Interpretation |
| DecisionAcc(θ) | Sample-level | Measures coverage of partially correct predictions (whether at least one correct label is captured). |
| DecisionPrec(θ) | Sample-level | Evaluates selectivity—the proportion of predicted labels that are correct (low false positives). |
| DecisionRec(θ) | Sample-level | Evaluates completeness—the proportion of true labels correctly recovered (low false negatives). |
| DecisionF1(θ) | Sample-level | Balances precision and recall through a harmonic mean, representing overall correctness. |
| Jaccard Index | Set-level | Measures intersection over union between predicted and true label sets, summarizing overlap accuracy. |
| Micro-F1 | Global-level | Aggregates predictions across all classes, emphasizing performance on frequent labels. |
| Top-1 Accuracy | Global-level | Assesses correctness of the model’s single highest-confidence prediction. |
Accuracy-oriented metrics are grouped according to their level of evaluation.
The sample-level metrics examine model performance on individual instances. They measure how accurately the model assigns emotion labels to each input sample. Metrics such as DecisionAcc(θ), DecisionPrec(θ), DecisionRec(θ), and DecisionF1(θ) operate at this level. Their values reflect how well the model performs on a per-sample basis, independent of dataset-wide effects.
The set-level metric considers the label sets as a whole, assessing the degree of overlap between predicted and true label groups. The Jaccard Index is used at this level to quantify how similar the two sets are in terms of intersection and union, providing a more comprehensive representation of correctness across multiple labels within the same sample.
The global-level metrics, including Micro-F1 and Top-1 Accuracy, extend the evaluation to the entire dataset. They aggregate the outcomes of all predictions to measure the model’s overall correctness across categories and samples. Global-level indicators are essential for comparing model performance under class imbalance, where some emotion categories appear more frequently than others.
Together, these evaluation levels provide a structured view of model accuracy, linking individual and overall prediction behaviors. Decision-based metrics evaluate model performance on samples with predicted outputs at the selected threshold θ, while global metrics such as micro-F1 summarize accuracy across all labels and samples.
- The two metric types serve complementary analytical roles: decision-based metrics describe conditional precision and recall at the sample level, and global metrics capture aggregate performance across the dataset. This integrated design enables a balanced and interpretable assessment of accuracy within a unified evaluation framework.
Reliability-oriented evaluation focuses on how consistently the model’s confidence values reflect empirical correctness. Metrics such as Expected Calibration Error (ECE) and Brier Score are used to quantify this alignment. For zero-shot or prototype-based variants, these measures are applied to sigmoid-normalized similarity scores as reliability indicators, not strict calibration statistics, providing a common basis for comparing confidence alignment between supervised and unsupervised paradigms.
Lower ECE and Brier values thus represent stronger confidence reliability, indicating that predicted scores are more consistent with empirical outcomes.
For zero-shot models, the cosine-similarity outputs are transformed by a sigmoid function to yield approximate confidence scores within the [0, 1] range. Although these scores are not calibrated through supervised training, they provide a consistent reliability scale for evaluating relative confidence alignment using ECE and Brier metrics, which serve here as reliability proxies rather than strict calibration measures.
Latency-based evaluation examines computational efficiency and real-time feasibility.
The average inference time per sample is measured on a single-core IoT device to characterize the typical runtime behavior of each model under constrained hardware. These statistics characterize the model’s runtime behavior under constrained hardware resources. Lower latency indicates that the system can maintain responsiveness without compromising predictive accuracy or confidence reliability, which is essential for practical deployment in embedded or edge-computing environments.
Table 2.
Overview of evaluation dimensions under the A–C–L framework.
| Dimension | Focus of Evaluation | Representative Metrics | Interpretive Meaning |
| Accuracy (A) | External correctness and completeness of predictions | DecisionAcc(θ), DecisionPrec(θ), DecisionRec(θ), DecisionF1(θ), Jaccard Index, Micro-F1, Top-1 Accuracy | Measures how well the model identifies emotional labels at sample and dataset levels. |
| Calibration (C) | Reliability of model confidence estimates | ECE, Brier Score | Indicates how closely the model’s confidence values correspond to empirical correctness across probability- and similarity-based outputs. |
| Latency (L) | Computational efficiency and real-time feasibility | Average latency | Quantifies inference speed and resource efficiency on the IoT device. |
The integration of accuracy, calibration, and latency provides a complete foundation for quantitative evaluation within the FSEF framework. Accuracy represents the external correctness of predictions, calibration reflects the internal reliability of probability estimates, and latency defines the computational feasibility of the models under hardware constraints. Considering these dimensions together ensures a balanced and objective assessment, allowing improvements in predictive accuracy to be evaluated alongside reliability and efficiency. This integrated view establishes a consistent basis for subsequent analyses comparing the MiniLM and DistilBERT architectures under resource-limited deployment conditions.
In addition to the core A–C–L indicators, two auxiliary metrics were used for robustness analysis.
- The Area Under the Risk–Coverage Curve (AURC) quantifies the global trade-off between prediction confidence and risk. It is computed by sorting samples according to confidence scores and integrating the empirical risk as coverage increases from 0 to 1. Lower AURC values indicate better overall reliability across confidence thresholds.
The ΔRobust (Delta Robustness) metric measures the absolute change of a given indicator (e.g., micro-F1, ECE, AURC) between clean and perturbed input conditions:
Smaller ΔRobust values denote higher stability under input noise.
4. Results
Four model configurations—MiniLM-ZeroShot, DistilBERT-ZeroShot, MiniLM-OvR, and DistilBERT-OvR—were evaluated across accuracy, calibration, and latency dimensions. All experiments used a fixed multi-label decision threshold of θ = 0.5 to ensure comparability.
The choice of θ = 0.5 was based on both validation and theoretical considerations. Validation scans across θ ∈ [0.1, 0.9] showed that lower thresholds increased coverage but caused excessive label activation, while higher thresholds reduced recall and overall balance. The value of 0.5 provided a practical midpoint that maintained balanced precision and recall near the region of best F1 performance. Conceptually, this threshold defines a consistent confidence boundary for all models and prevents model-specific tuning that could distort reliability comparisons between architectures.
All subsequent results covering accuracy, calibration, and latency are reported under θ = 0.5. This setting represents a stable and interpretable condition for multi-label emotion prediction.
4.1. Accuracy Evaluation
Accuracy evaluation examines the external performance of each model using decision-level and set-level metrics such as DecisionF1(θ), micro-F1, Jaccard index, and Top-1 accuracy. As summarized in Table 3, the OvR models achieve higher precision, more balanced recall, and overall stronger F1 scores than the zero-shot counterparts. DistilBERT-OvR attains the highest results (Decision-F1 = 0.516, micro-F1 = 0.371), while MiniLM-OvR ranks second (Decision-F1 = 0.494, micro-F1 = 0.271), showing a difference of about 0.10 in micro-F1. In contrast, both zero-shot models yield recall near 0.96 but precision below 0.05, resulting in F1 scores below 0.10. These results demonstrate that supervised logistic-regression training improves discriminative control and reduces label over-activation observed in unsupervised prototypes.
As shown in Table 3, DecisionAcc(θ) represents the proportion of samples for which the model predicts at least one correct emotion label, while micro-F1 aggregates correctness across all labels. The OvR models maintain balanced DecisionAcc (≈ 0.5) and micro-F1 (≈ 0.3–0.4), indicating that their selective predictions translate into higher overall consistency. In contrast, the zero-shot variants reach near-complete DecisionAcc but extremely low micro-F1, reflecting over-activation rather than genuine accuracy.
This pattern is confirmed by their precision–recall statistics: precision remains around 4.7–5.0%, while recall reaches ≈ 95% at θ = 0.5. The prototype-based zero-shot method therefore identifies nearly all true emotions but also predicts many incorrect ones. In contrast, the OvR logistic models achieve a balanced outcome, with both precision and recall close to 50%. For example, DistilBERT-OvR records about 0.53 for both metrics.
At the sample level, these Decision-Prec and Decision-Rec values (≈ 0.53 / 0.53) describe per-instance balance, while the global micro-F1 of 0.371 summarizes aggregated performance across all labels and samples. The two measures differ in evaluation scope but together demonstrate consistent precision–recall equilibrium. The corresponding Decision-F1 values reach ≈ 0.50–0.52, compared with ≈ 0.09 for the zero-shot variants. Similarly, Top-1 accuracy rises from 22.5% for DistilBERT-ZeroShot to 41.3% for DistilBERT-OvR, maintaining the same performance ranking: DistilBERT-OvR best, MiniLM-OvR second, and both zero-shot models far weaker.
4.2. Reliability and Calibration Analysis
The decision threshold θ = 0.5 was empirically validated through a scan over θ ∈ [0.1, 0.9], which showed that this value lies near the region of stable precision–recall balance for the supervised OvR models. Conceptually, this threshold provides a consistent and interpretable boundary across inference paradigms, serving as a uniform operating condition rather than a probabilistic equivalence. For zero-shot configurations, θ = 0.5 is applied to sigmoid-normalized similarity scores purely for comparability, without implying the same probabilistic meaning as in the supervised outputs. Under this setting, the zero-shot models exhibit near-complete activation coverage (≈ 0.98–0.99) and very high recall (≈ 95%) but low precision (≈ 5%), reflecting their looser selectivity. Although this configuration may not represent strict statistical parity between paradigms, it provides a reproducible and interpretable baseline for cross-model evaluation. Additional validation confirmed that the relative ranking of models remains consistent when each system is assessed at its own F1-optimal threshold. The OvR logistic models demonstrate stable calibration under this configuration, with probability estimates aligning closely with true outcomes (ECE ≈ 0.058, Brier ≈ 0.028).
For the zero-shot models, cosine-similarity outputs were normalized through a sigmoid transformation to obtain comparable confidence scores within the [0,1] range. On this normalized scale, their reliability error (ECE ≈ 0.22, Brier ≈ 0.05) is higher than that of the supervised probabilities, indicating weaker consistency between predicted confidence and actual correctness. These results are reported as reliability measures derived from similarity-based confidence values, ensuring comparability between inference paradigms.
In contrast, the zero-shot models produce probability-like scores derived from cosine similarity, normalized through a sigmoid function for comparability. At θ = 0.5, they generate predictions for most samples, achieving high recall (≈ 96%) but relatively low precision (≈ 5%). These results reflect the intrinsic difference between unsupervised semantic matching and supervised probabilistic learning. Although normalization can adjust the numeric scale of confidence values, the underlying mechanism remains based on similarity rather than learned probability distributions
The OvR models behave more conservatively, generating predictions only when sufficient confidence is reached. Their supervised adaptation yields balanced precision and recall around 0.5, reflecting closer agreement between predicted confidence and empirical accuracy. Overall, they produce fewer but more trustworthy outputs, confirming that supervised training substantially improves calibration reliability.
As shown in Figure 3, color intensity represents the magnitude of calibration error across decision thresholds and coverage levels. Darker areas correspond to smaller calibration error, indicating better reliability and stronger confidence alignment, whereas lighter regions reflect higher deviation. The uniformly low and flat surface demonstrates consistent reliability across θ and coverage, aligning with the quantitative results reported in the text (ECE ≈ 0.058, Brier ≈ 0.028).
4.3. Robustness Evaluation
To further assess calibration behavior, robustness experiments were conducted to verify whether the improved reliability of the OvR models persists under noisy input conditions. These analyses focus on the stability of prediction confidence and classification performance when the input text is perturbed by noise.
ECE (Expected Calibration Error) measures the average deviation between predicted probabilities and actual correctness; smaller values indicate better calibration. The Brier Score represents the mean squared difference between predicted probabilities and true labels, decreasing as calibration improves. The Area Under the Risk–Coverage Curve (AURC) captures the global trade-off between confidence and risk, where lower values correspond to more reliable confidence estimates. The micro-F1 metric provides a global measure of classification accuracy by combining precision and recall across all emotion labels. Finally, ΔRobust quantifies the absolute change of each metric between clean and noisy conditions, allowing direct assessment of stability.
A robustness protocol was applied by introducing controlled perturbations into the test data, including random spelling modifications, punctuation insertion, and synonym substitutions. The results show that both OvR models maintain stable calibration and accuracy, with only marginal variations in ECE (Δ≈0.002) and AURC (Δ≈0.003–0.007) under noise. These findings confirm that supervised logistic calibration remains reliable even when the input text contains minor disturbances, demonstrating strong robustness and generalization capability in realistic deployment scenarios.
For comparison, the zero-shot models show a noticeably larger decline under noisy conditions. When the same perturbation protocol was applied, their global micro-F1 dropped by approximately 0.03 (on average from ≈ 0.09 to ≈ 0.06), and both ECE and AURC increased by ≈ 0.01 to 0.015. These changes are roughly four to five times greater than those observed in the OvR models, indicating that the prototype-based inference is considerably more sensitive to input distortions. In contrast, the OvR configurations maintained stable calibration and accuracy, with all |Δ| values remaining below 0.007. This pattern supports the conclusion that supervised logistic calibration provides stronger robustness against minor textual noise than unsupervised semantic matching.
ΔRobust quantifies the sensitivity of a model to small input disturbances. A smaller ΔRobust value indicates higher stability, meaning the model’s performance and confidence reliability remain consistent under noise. ΔRobust is reported for metrics such as micro-F1, ECE, and AURC to show how these indicators change after applying controlled perturbations.
The ΔRobust results show that both OvR models maintain stable confidence reliability under moderate input noise. The changes in ECE remain within 0.002, indicating that supervised calibration is resistant to small perturbations. In contrast, the zero-shot models experience larger degradation, with micro-F1 decreasing by approximately 0.03 and higher variability in reliability metrics such as ECE and AURC. Overall, the findings demonstrate that the OvR logistic head is the key factor contributing to improved reliability. Both OvR models sustain stable predictive behavior even when the input data include mild noise, confirming that the supervised logistic calibration framework enhances reliability under clean evaluation conditions and preserves robustness under noisy or uncertain inputs.
Figure 4 illustrates a subset of these robustness results for the OvR configuration. The Δ(Noisy − Clean) terrain visualization shows that all metric variations remain within ±0.007, confirming minimal sensitivity to textual noise. The shallow color gradients indicate that calibration-related metrics (ECE, Brier, AURC) change only slightly under perturbation, while DecisionF1@θ decreases marginally, consistent with the numerical findings in Table 4. SelECE, SelBrier, and SelCov indicate calibration, error, and coverage metrics computed on the θ-selected subset of predictions, reflecting the reliability and selectivity of confident outputs.
4.4. Latency and Deploy Ability
This section evaluates latency and deployability under realistic hardware constraints, focusing on CPU-only inference on resource-limited devices. All latency and throughput measurements were obtained in a virtualized single-core CPU environment with 2 GB RAM, replicating the conditions of typical edge devices.
Before reporting the results, it is necessary to clarify the latency definition used in this study. Inference latency refers to the time measured from the start of sentence encoding to the final label output, excluding tokenization and I/O operations. This definition focuses on the computational segment of the inference pipeline and thus represents pipeline latency rather than full end-to-end latency. The term “end-to-end” is used here in a computational sense—covering all on-device neural and classification steps—while excluding peripheral preprocessing or file-handling overhead.
All four configurations operate within the range typically regarded as real-time (≤ 100 ms per inference). MiniLM-based models achieve the fastest processing speed, averaging 26.7–29.5 ms per sample, while DistilBERT-based models require 74–75 ms. This difference reflects the larger network depth of DistilBERT but remains well below the real-time boundary. Consequently, all models satisfy the latency requirements for interactive or embedded use.
The Zero-shot and OvR configurations differ mainly in how label scores are computed. The Zero-shot model derives similarity between input embeddings and fixed class prototypes, whereas OvR applies supervised logistic weights learned from labeled data. Both configurations are fully vectorized, and the small latency difference observed (e.g., 26.7 ms vs 29.5 ms for MiniLM, 74.0 ms vs 75.0 ms for DistilBERT) likely falls within normal measurement variation rather than reflecting structural efficiency. Each latency value represents the mean of 500 inference runs on the same single-core setup, excluding tokenization and I/O time. The marginal advantage observed for OvR can be attributed to minor implementation factors such as optimized batch operations rather than intrinsic architectural speed.
From a deployability perspective, both designs can be integrated into practical systems with minimal adaptation. The Zero-shot configuration requires no additional training and is lightweight but tends to over-activate emotion labels without further calibration. The OvR models include a one-time offline training stage using about 43,000 samples, which completes within minutes on a CPU. During inference, their additional logistic operations remain fully vectorized and impose no meaningful runtime overhead.
Across all models, DistilBERT-OvR achieves the best overall balance of accuracy, calibration, and latency. With moderate latency (≈ 74 ms per inference), it remains fully real-time while providing the highest precision and reliability among all tested configurations. DistilBERT-OvR therefore represents the most suitable trade-off for practical deployment, meeting both the efficiency requirements of IoT systems and the accuracy standards required for emotion-recognition tasks.
All models use a fixed decision threshold of θ = 0.5 to ensure consistent operation across inference paradigms.
At this threshold, OvR models exhibit higher selectivity, producing outputs only when confidence exceeds a balanced evidence level, whereas zero-shot models activate a larger number of labels and require additional calibration for reliable use.
Although the zero-shot method remains simpler to deploy, its precision and calibration stability are considerably lower.
The OvR configuration—particularly the DistilBERT-OvR variant—achieves the most balanced performance, improving accuracy and reliability without increasing latency and meeting real-time requirements for multi-label emotion recognition on IoT and embedded systems.
5. Discussion
5.1. Verification of the A–C–L Framework
The experimental findings validate the theoretical structure proposed in Chapter 2, confirming that emotional reasoning in lightweight transformer models can be quantitatively explained through the Accuracy–Calibration–Latency (A–C–L) triad. The Fuzzy-Semantic Evaluation Framework (FSEF) defines these three dimensions as the joint foundation of interpretive reliability in constrained environments. The experiments demonstrate that model performance cannot be measured by accuracy alone; rather, calibration reliability and computational feasibility must be analyzed together to assess the integrity of probabilistic reasoning.
The accuracy dimension, formalized in Section 2.1.1, captures external validity by measuring consistency between predicted and human-labeled emotions. The OvR configurations achieved a DecisionF1 of 0.516 and micro-F1 of 0.371 (DistilBERT-OvR), outperforming the zero-shot baselines by a wide margin. This quantitative improvement supports the framework’s premise that supervised adaptation enhances discriminative control and mitigates label over-activation.
The calibration dimension, operationalized through Expected Calibration Error (ECE) and Brier Score, verifies how internal confidence corresponds to empirical correctness. Consistent with Section 2.4 of the methodology, supervised logistic regression achieved ECE ≈ 0.058 and Brier ≈ 0.028, whereas zero-shot prototypes produced ECE ≈ 0.22. This fourfold difference empirically confirms that supervised probabilistic modeling yields better confidence alignment and interpretable reliability.
Finally, the latency dimension validates the framework’s assumption of hardware realism. As reported in Table 5, MiniLM and DistilBERT performed inference within 26–75 ms on a single-core, 2 GB IoT environment, satisfying the real-time boundary defined in Section 2.3. These results confirm that emotional reasoning can be implemented within constrained resources without compromising reliability. Together, the three dimensions of A–C–L form an integrated validation chain: accuracy provides external fidelity, calibration ensures internal consistency, and latency defines operational feasibility.
5.2. Calibration Reliability and Responsible Inference
The experiments also verify that probabilistic calibration functions as a mechanism for responsible inference, an idea central to the framework proposed in Chapter 2. The fixed decision threshold (θ = 0.5) introduced in Section 2.1.2 was intended to balance precision and recall across models. The results confirm this balance empirically: OvR models exhibited both DecisionPrecision ≈ 0.53 and DecisionRecall ≈ 0.53, demonstrating stable selectivity. Zero-shot models, in contrast, maintained recall near 95% but precision below 5%, showing that unsupervised similarity matching lacks effective confidence regulation.
These observations validate the design principle that interpretive credibility arises not from higher recall but from calibrated restraint. By adopting a uniform θ = 0.5 across all architectures, the study operationalizes uncertainty management as a quantitative boundary rather than a subjective threshold. This standardization converts probabilistic ambiguity into measurable reliability, demonstrating that controlled selectivity can enhance both performance and transparency.
The robustness tests further strengthen this interpretation. Under controlled textual noise, OvR models showed ΔECE ≤ 0.002 and ΔAURC ≤ 0.007, confirming the framework’s expectation that supervised calibration remains stable under perturbation. These minimal deviations indicate that the model’s confidence estimates remain valid even when linguistic input is degraded, a requirement for healthcare and telehealth use where data variability is common. Hence, calibration reliability within FSEF provides not only a statistical measure but also a practical safeguard for consistent emotional monitoring.
5.3. Architectural Moderation and Resource-Constrained Feasibility
The architectural comparison between MiniLM and DistilBERT provides further evidence for the theoretical assumption that representational depth influences both semantic expressiveness and computational efficiency. DistilBERT, with its deeper structure, achieved the highest accuracy and calibration consistency, while MiniLM demonstrated faster inference and sufficient reliability for real-time deployment. These findings validate that architectural moderation—balancing contextual capacity against latency—optimizes the A–C–L equilibrium under IoT constraints.
All experiments were executed in a virtualized single-core CPU environment with 2 GB RAM, replicating realistic edge-device conditions. Within this configuration, both models achieved inference times well below the 100 ms real-time limit. Importantly, the fine-tuned OvR models were uploaded to the Hugging Face Hub, including logistic weights and configuration metadata. This design enables IoT gateways to directly download and initialize verified models via API without external servers. Such workflow exemplifies privacy-preserving local inference, meeting healthcare requirements for data security and reproducibility. The ability to achieve full on-device inference confirms that FSEF extends beyond theoretical evaluation to practical system design suitable for embedded deployment.
5.4. Aging-Friendly Application and Societal Contribution
The applicability of FSEF extends to aging-related healthcare, one of the core motivations outlined in the introduction. In elderly populations, emotional irregularities and linguistic hesitation often precede physical deterioration. Systems that can detect subtle emotional shifts through fuzzy-semantic reasoning therefore contribute to early-stage health alerts and continuous mental-state assessment. The experiments demonstrate that even under constrained hardware, supervised OvR models preserve sufficient calibration stability to detect ambiguous expressions with reliability comparable to larger architectures.
This capability supports the creation of lightweight, trustworthy monitoring systems for older adults living independently. The IoT-based implementation ensures that emotional data remain processed locally, preventing unnecessary data transmission and preserving user privacy. By enabling reliable emotion inference within a single-core 2 GB gateway, FSEF contributes a feasible model for aging-friendly telehealth, where interpretability and privacy take precedence over throughput.
5.5. Methodological and Theoretical Implications
From a methodological standpoint, the study validates that FSEF’s A–C–L triad provides a measurable structure for balancing semantic fidelity, confidence reliability, and operational efficiency. The results confirm the internal consistency of the framework: metrics such as DecisionF1, ECE, and latency jointly capture how reasoning accuracy interacts with computational constraints. This alignment between theoretical formulation and empirical outcome demonstrates that probabilistic reasoning can be formalized as a stable evaluation process rather than a heuristic interpretation.
The framework also has theoretical implications for explainable and trustworthy AI. By grounding interpretability in quantitative calibration rather than post-hoc explanation, FSEF integrates ethical reliability directly into probabilistic mechanisms. The results show that reliability metrics and latency trade-offs can serve as transparent indicators of model behavior, enabling auditors to evaluate emotional AI systems objectively. This principle supports broader human-centered AI research and provides a pathway for developing deployable models that balance empathy, accountability, and computational realism.
6. Future Work and Limitations
Although the Fuzzy-Semantic Evaluation Framework (FSEF) has achieved its initial goal of validating a structured and deployable foundation for emotional reasoning, several limitations define future directions of this research.
First, the current study evaluated models on the English GoEmotions dataset, which ensures linguistic consistency but limits cultural and semantic diversity. Future work will extend the corpus to multilingual and cross-cultural samples, particularly languages with non-Latin scripts and distinct emotional idioms. Such expansion will examine whether probabilistic calibration under the fixed threshold θ = 0.5 remains stable across linguistic systems and emotional taxonomies. Broader datasets will also allow statistical testing of semantic ambiguity and enable analysis of emotional overlap beyond the categorical boundaries used in this study.
Second, while the current implementation employed two lightweight transformer encoders (MiniLM and DistilBERT), future experiments will incorporate classical baselines such as logistic regression, SVM, and lexicon-based classifiers. This comparison will quantify the interpretive gain introduced by supervised calibration and threshold control. In addition, the framework can be extended to multimodal reasoning, integrating speech and visual cues through shared embeddings to evaluate whether calibration reliability persists when heterogeneous modalities provide conflicting signals.
Third, the present work simulated an IoT environment using a virtualized single-core CPU with 2 GB memory. Although this setup replicates constrained conditions, future deployment on physical IoT hardware is necessary to evaluate long-term sustainability, including power consumption, temperature stability, and memory fragmentation. Monitoring tools could be integrated to record adaptive power–confidence trade-offs, aligning energy management with probabilistic reasoning.
Finally, the aging-care application discussed in this research remains conceptual. Future field studies will evaluate the system in real elderly-care environments to determine its ability to detect subtle emotional cues and support timely intervention. This extension will validate whether the framework’s calibration reliability translates into measurable trust and usability among older users.
Through these efforts, FSEF can evolve from an experimental framework into a scalable and culturally inclusive paradigm for responsible emotional AI—linking probabilistic reasoning, efficient deployment, and human-centered design within real-world healthcare and IoT contexts.
7. Conclusions
This study developed and validated the Fuzzy-Semantic Evaluation Framework (FSEF) as a structured and deployable foundation for emotional reasoning in resource-limited environments. The framework addressed the limitations of conventional affective computing by integrating accuracy, calibration, and latency into a unified structure that quantifies both interpretive reliability and operational feasibility. The experimental findings confirmed that emotional understanding in lightweight transformer models depends not only on prediction accuracy but also on the internal consistency of confidence estimation and the practical constraints of computation. By establishing the Accuracy–Calibration–Latency (A–C–L) triad, the framework provides a reproducible approach for assessing probabilistic reasoning in emotion recognition systems.
The supervised One-vs-Rest (OvR) models trained on the GoEmotions dataset demonstrated balanced precision and recall at the fixed decision threshold θ = 0.5, achieving stable calibration with low error and consistent real-time performance. These results verified that calibrated probabilistic supervision produces more reliable and interpretable predictions than unsupervised semantic matching. The experiments also validated the feasibility of real-time inference on constrained IoT devices, where both DistilBERT and MiniLM achieved latency well below the 100-millisecond boundary while maintaining stable calibration. The publication of fine-tuned OvR models on the Hugging Face Hub further extended the framework into a reproducible and privacy-preserving workflow, allowing IoT systems to directly access verified models and perform local inference without cloud dependence.
Beyond technical validation, the study contributes to the development of aging-friendly and trustworthy emotional AI. Many older users express discomfort indirectly through ambiguous or hedged language, which requires fuzzy-semantic interpretation rather than categorical sentiment classification. By enabling calibrated reasoning within limited hardware, FSEF demonstrates how emotional monitoring can be integrated into everyday healthcare devices without compromising privacy or interpretability. This alignment between probabilistic reasoning and ethical deployment supports the long-term vision of human-centered, responsible emotion recognition.
In conclusion, the framework unites fuzzy semantics, probabilistic calibration, and efficient deployment into a single evaluative model that advances both theoretical and practical aspects of emotional AI. It establishes a measurable foundation for interpretable emotional reasoning, confirms the feasibility of local inference on constrained devices, and provides a pathway toward sustainable, aging-friendly, and privacy-conscious applications in future telehealth and home-care systems.
References
- Picard, R.W. Affective Computing; MIT Press: Cambridge, MA, 1997. [Google Scholar]
- Cambria, E.; Poria, S.; Bajpai, R.; Schuller, B. Affective computing and sentiment analysis. IEEE Intelligent Systems 2020, 35, 102–107. [Google Scholar]
- Poria, S.; Cambria, E.; Gelbukh, A. Aspect extraction for opinion mining with a deep convolutional neural network. Knowledge-Based Systems 2016, 108, 42–49. [Google Scholar] [CrossRef]
- Zadeh, L.A. The concept of a linguistic variable and its application to approximate reasoning—I. Information sciences 1975, 8, 199–249. [Google Scholar] [CrossRef]
- Xiong, Y.; et al. Fuzzy speech emotion recognition considering semantic ambiguity. Journal of Intelligent & Fuzzy Systems 2024. [Google Scholar]
- Guo, C.; Pleiss, G.; Sun, Y.; Weinberger, K.Q. On calibration of modern neural networks. In Proceedings of the Proc. Int. Conf. Machine Learning (ICML); 2017; pp. 1321–1330. [Google Scholar]
- Lakshminarayanan, B.; Pritzel, A.; Blundell, C. Simple and scalable predictive uncertainty estimation using deep ensembles. In Proceedings of the Proc. Advances in Neural Information Processing Systems (NeurIPS); 2017; pp. 6402–6413. [Google Scholar]
- Mehrtash, Alireza, et al. Confidence calibration and predictive uncertainty estimation for deep medical image segmentation. IEEE transactions on medical imaging 2020, 39, 3868–3878. [Google Scholar] [CrossRef] [PubMed]
- Sanh, V.; Debut, L.; Chaumond, J.; Wolf, T. DistilBERT, a distilled version of BERT: smaller, faster, cheaper and lighter. arXiv 2019, arXiv:1910.01108. [Google Scholar]
- Wang, W.; Bao, F.; Dong, L.; Wei, H.; Xu, K. MiniLM: Deep self-attention distillation for task-agnostic compression of pre-trained transformers. In Proceedings of the Proc. Advances in Neural Information Processing Systems (NeurIPS); 2020. [Google Scholar]
- Zhou, Z.; Chen, X.; Li, E.; Zeng, L.; Luo, K.; Zhang, J. Edge intelligence: Paving the last mile of artificial intelligence with edge computing. Proceedings of the IEEE 2019, 107, 1738–1762. [Google Scholar] [CrossRef]
- Yang, Kangning, et al. Mobile emotion recognition via multiple physiological signals using convolution-augmented transformer. In Proceedings of the 2022 International Conference on Multimedia Retrieval; 2022.
- Doshi-Velez, F.; Kim, B. Towards a rigorous science of interpretable machine learning. arXiv arXiv:1702.08608, 2017. [CrossRef]
- Arrieta, A.B.; Díaz-Rodríguez, N.; Del Ser, J.; et al. Explainable Artificial Intelligence (XAI): Concepts, taxonomies, opportunities and challenges toward responsible AI. Information Fusion 2020, 58, 82–115. [Google Scholar] [CrossRef]
- Deng, S.; et al. Edge intelligence: The confluence of edge computing and artificial intelligence. IEEE Internet of Things Journal 2020, 7, 7457–7469. [Google Scholar] [CrossRef]
Figure 3.
Selective calibration and decision performance terrains for OvR models (θ × Coverage). Color variation represents calibration error, with darker regions corresponding to lower ECE values and better reliability.
Figure 3.
Selective calibration and decision performance terrains for OvR models (θ × Coverage). Color variation represents calibration error, with darker regions corresponding to lower ECE values and better reliability.
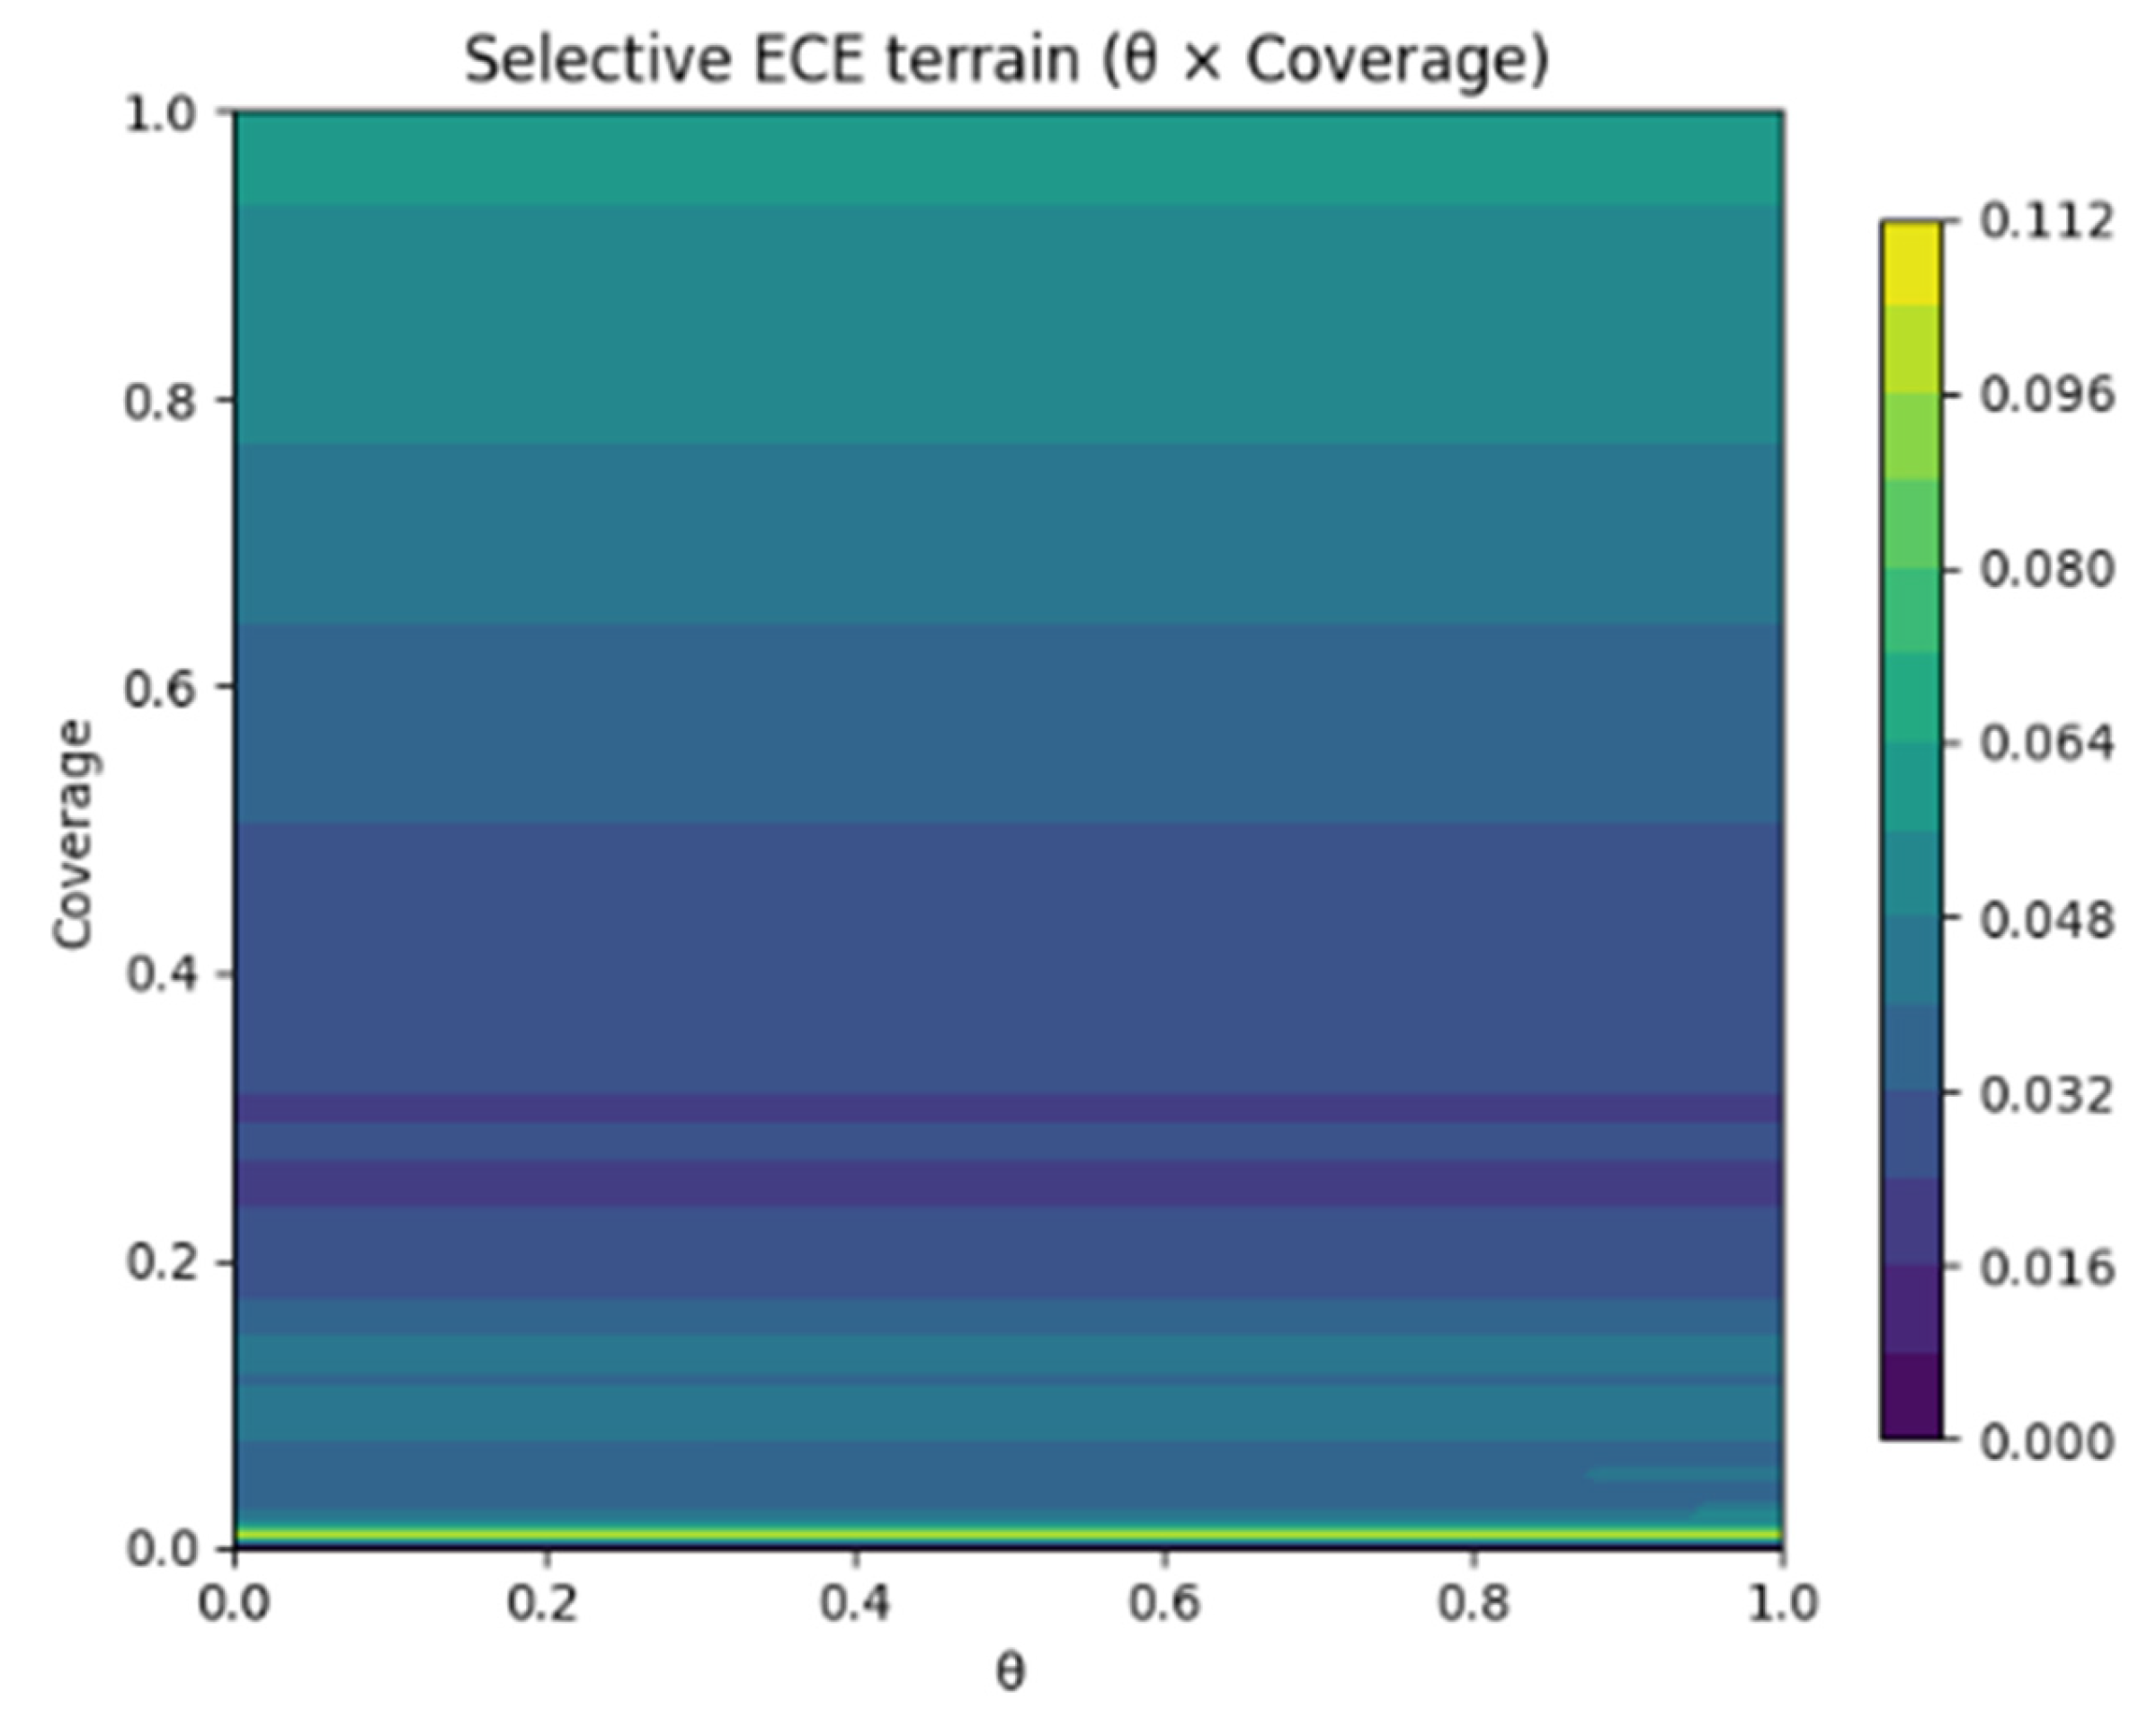
Figure 4.
Robust terrain across metrics.
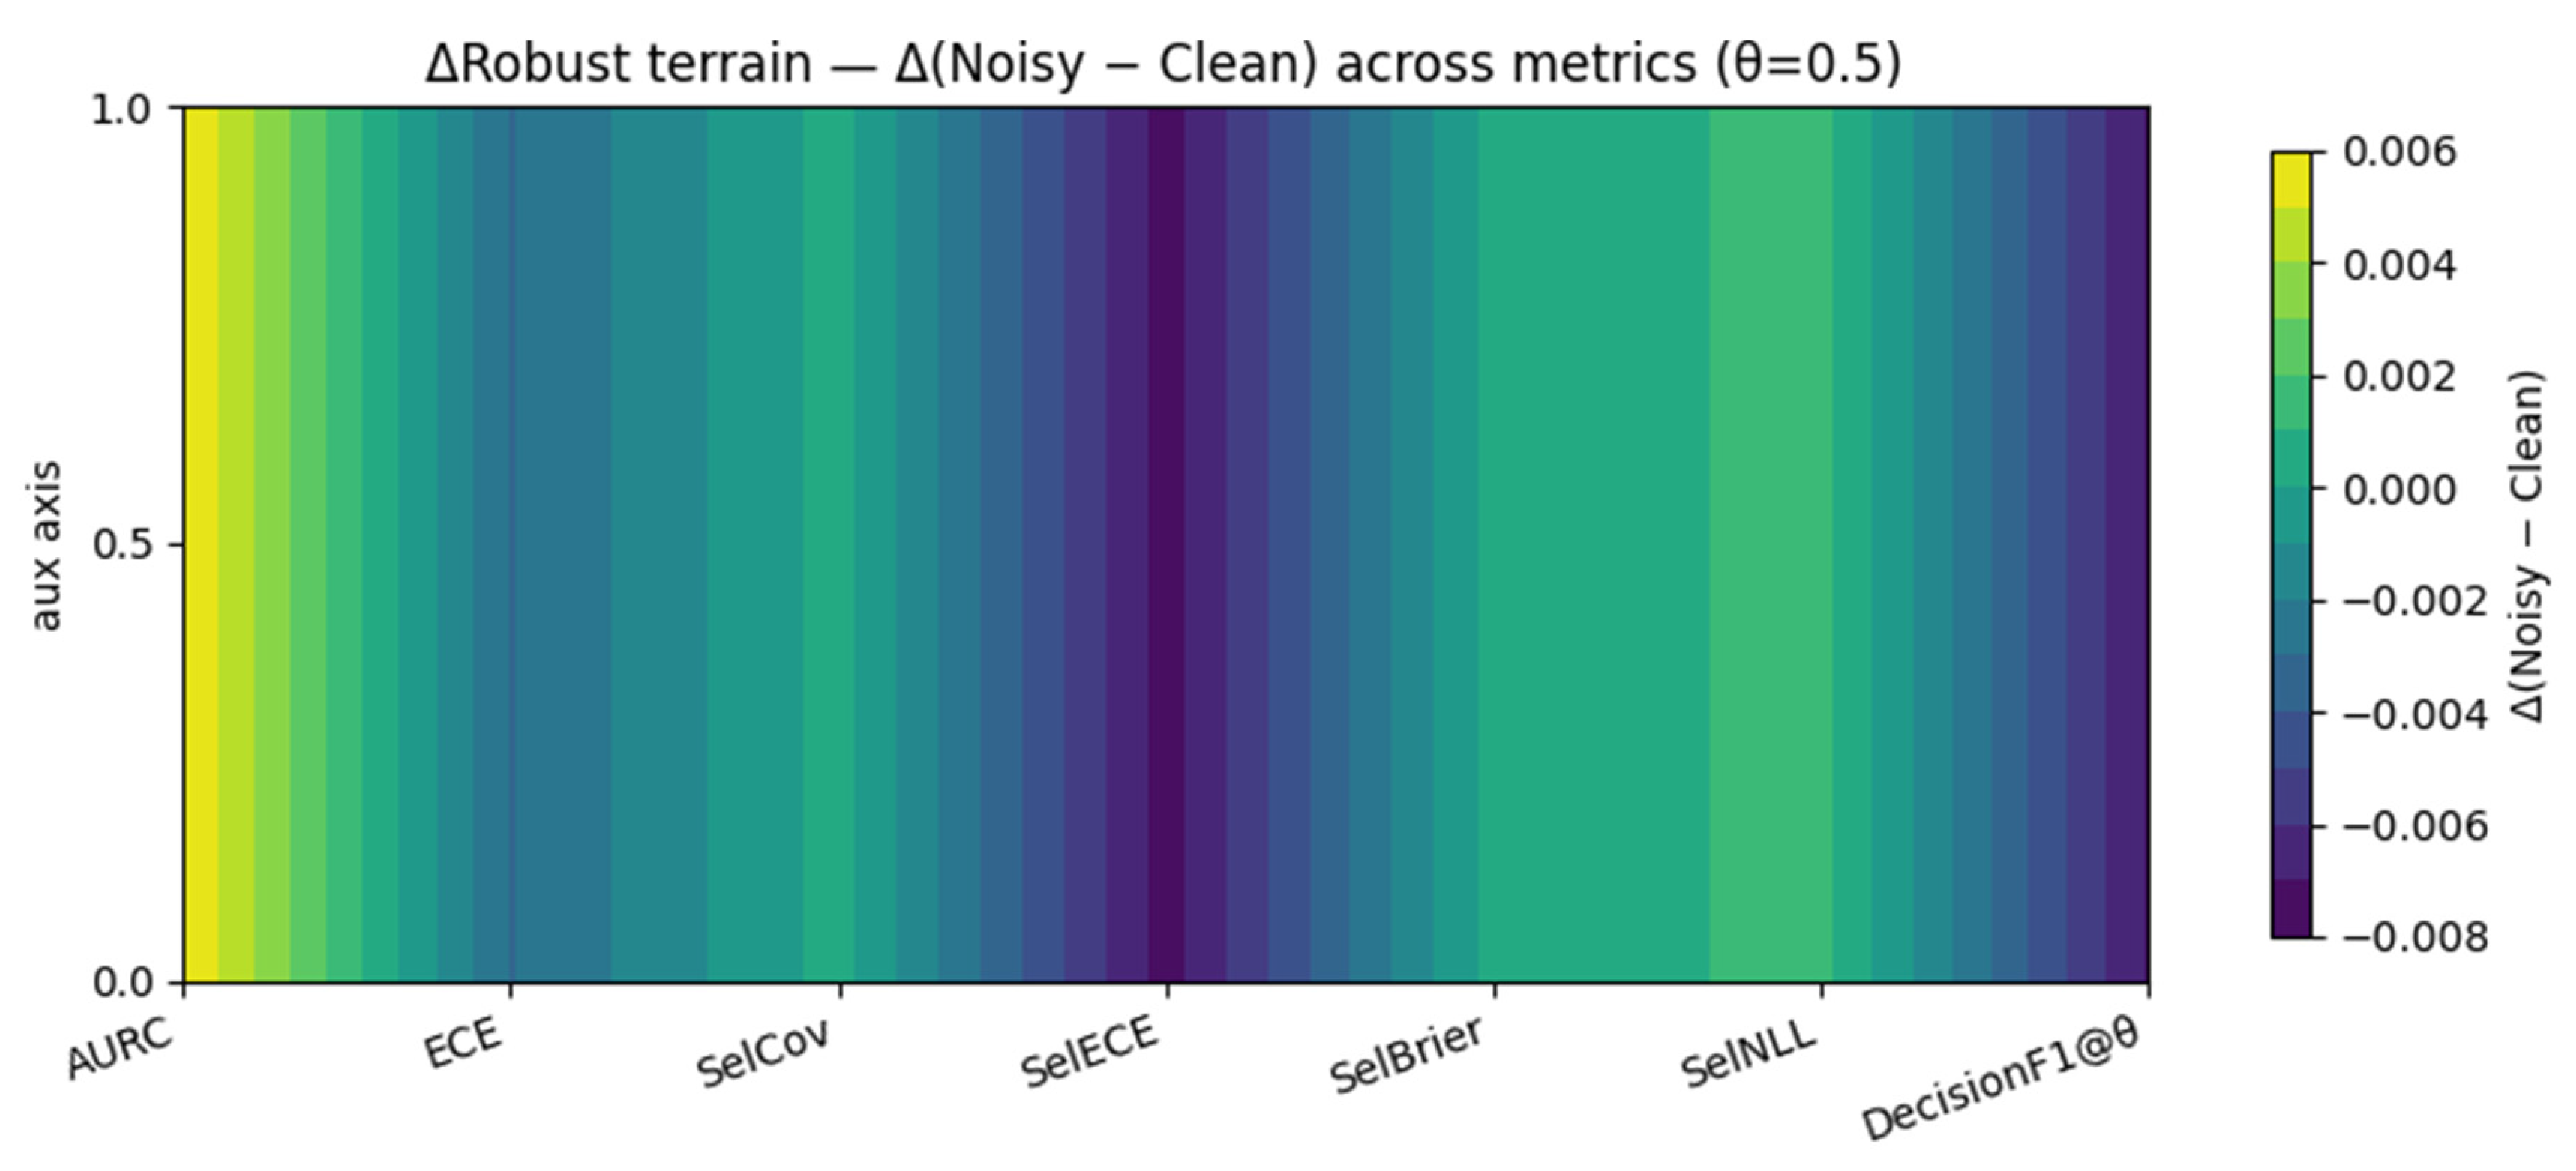
Table 3.
Accuracy metrics of four model configurations (θ = 0.5). OvR models achieve higher Top-1 accuracy, F1 scores, and Jaccard index than zero-shot models. All results are obtained on the test set.
Table 3.
Accuracy metrics of four model configurations (θ = 0.5). OvR models achieve higher Top-1 accuracy, F1 scores, and Jaccard index than zero-shot models. All results are obtained on the test set.
| Model | Top-1 | micro-F1 | DecisionF1 | Jaccard | DecisionAcc | DecisionPrec | DecisionRec |
| MiniLM-ZeroShot | 0.223 | 0.086 | 0.088 | 0.046 | 0.97 | 0.047 | 0.971 |
| DistilBERT-ZeroShot | 0.225 | 0.091 | 0.093 | 0.049 | 0.96 | 0.050 | 0.955 |
| MiniLM-OvR | 0.334 | 0.271 | 0.494 | 0.178 | 0.55 | 0.516 | 0.499 |
| DistilBERT-OvR | 0.413 | 0.371 | 0.516 | 0.276 | 0.57 | 0.532 | 0.528 |
Table 4.
Robustness Experiments across models.
| Condition | Metric | Clean | Noisy | Absolute Change (Δ) | Observation |
| MiniLM-OvR | micro-F1 | 0.271 | 0.265 | decreases by 0.006 | Slight reduction, indicating stable performance. |
| ECE | 0.058 | 0.060 | increases by 0.002 | Calibration remains stable under noisy input. | |
| AURC | 0.309 | 0.316 | increases by 0.007 | Minor increase in risk–coverage area. | |
| DistilBERT-OvR | micro-F1 | 0.371 | 0.364 | decreases by 0.007 | Consistent with MiniLM-OvR, showing slightly better robustness overall. |
| ECE | 0.059 | 0.061 | increases by 0.002 | Very small change, showing stable calibration. | |
| AURC | 0.315 | 0.318 | increases by 0.003 | Negligible change in risk–coverage balance. |
Table 5.
Latency Experiment Results (θ = 0.5, Single-Core CPU, 2 GB RAM).
| Model ID | Encoder | Classification Method | Average Latency (ms) | micro-F1 | Jaccard | Observation |
| MiniLM-ZeroShot | MiniLM-L6-v2 | Prototype Matching (Cosine) | 29.5 ms | 0.087 | 0.046 | Lightweight zero-shot baseline; easy to deploy but low precision and high activation rate. |
| DistilBERT-ZeroShot | DistilBERT-base-nli-stsb | Prototype Matching (Cosine) | 75.0ms | 0.091 | 0.049 | Slower but slightly higher semantic coverage; calibration weak. |
| MiniLM-OvR | MiniLM-L6-v2 | One-vs-Rest Logistic Regression | 26.7 ms | 0.271 | 0.178 | Lowest latency and balanced accuracy–calibration performance. |
| DistilBERT-OvR | DistilBERT-base-nli-stsb | One-vs-Rest Logistic Regression | 74.0 ms | 0.371 | 0.276 | Highest accuracy, moderate latency; |
Disclaimer/Publisher’s Note: The statements, opinions and data contained in all publications are solely those of the individual author(s) and contributor(s) and not of MDPI and/or the editor(s). MDPI and/or the editor(s) disclaim responsibility for any injury to people or property resulting from any ideas, methods, instructions or products referred to in the content. |
© 2025 by the authors. Licensee MDPI, Basel, Switzerland. This article is an open access article distributed under the terms and conditions of the Creative Commons Attribution (CC BY) license (http://creativecommons.org/licenses/by/4.0/).
Copyright: This open access article is published under a Creative Commons CC BY 4.0 license, which permit the free download, distribution, and reuse, provided that the author and preprint are cited in any reuse.


