
Submitted:
23 October 2025
Posted:
23 October 2025
You are already at the latest version
Abstract
The civil aviation sector has played a crucial role in contributing to Mongolian regional development and promoting tourism. The number of inbound passengers served by national air transport to Mongolia has increased significantly due to the construction of the new airport and the introduction of a visa-free regime for specific countries. Forecasting passenger demand is crucial for estimating air passenger potential, expanding airports, and establishing new terminals. The purpose of this study was to examine the predictors of demand for foreign air passengers to Mongolia and to identify the potential for demand. The demand for air passengers arriving from the top 24 foreign countries between 2015 and 2024 was analyzed using the augmented gravity panel data analysis. The results from the regression analysis of the augmented gravity model showed that the coefficients of variables, including Mongolia's real GDP per capita, the number of foreign passengers arriving for travel, work, and visit purposes, the number of foreign passengers arriving within 30 days and from visa-free countries were statistically significant and positive effects on the demand with expected signs. In contrast, the number of foreign passengers arriving for study purposes and the Covid effect was insignificant.
Keywords:
gravity model
; foreign passenger demand
; tourism
; air transport
1. Introduction
The Mongolian civil aviation sector makes a significant contribution to Mongolian regional development, including local trade, services, and tourism. Recently, the number of inbound passengers served by civil air transport has increased significantly due to the improvement of the global economy, particularly in trade, services, and tourism. In particular, the commissioning of a new international airport in 2021 has been a significant step forward in the development of the civil airlines sector. In 2021, the Mongolian Government approved the long-term and medium-term development policy aimed at developing tourism by expanding the local civil airline's infrastructure and capacity to meet the requirements of 4C and 4D categories and building a new passenger and cargo hub in Northeast Asia.
1.1. Current Status
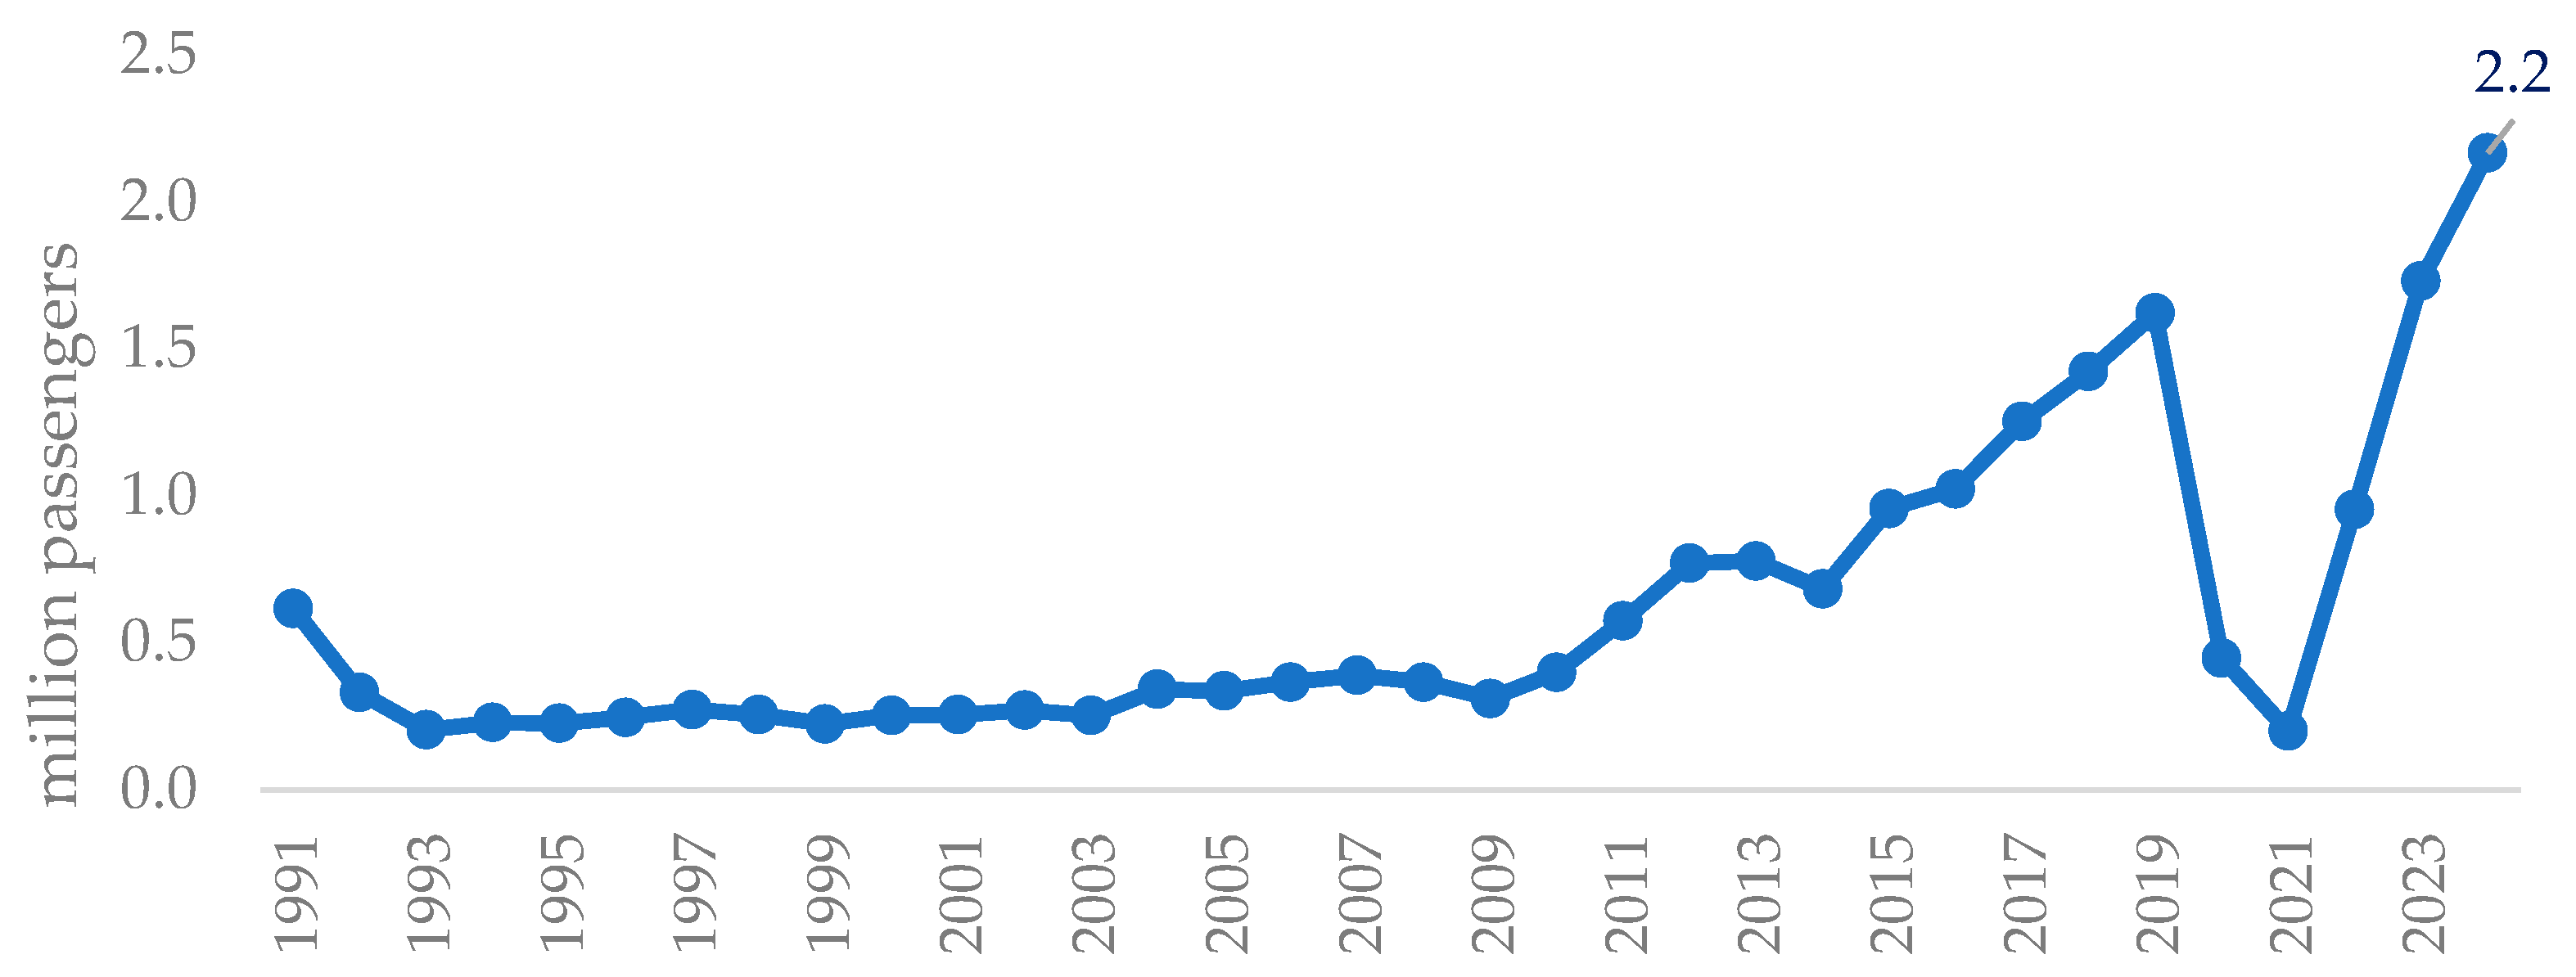
In 2024, air transport served a record high of 2.2 million passengers, representing a 9.5% compound annual growth rate since 2015. The air aviation sector operated international flights to 155 destinations, based on agreements with around 50 countries, as well as domestic flights to 9 local destinations. Of all passengers served by civil air transport, 80.5% were on international flights, while 19.5% were on domestic flights. As shown in Table A1, national air carrier companies accounted for 61.5% of all international passengers.
Figure 1.
Number of air passengers arriving in Mongolia by airplane, in millions.
1.2. Foreign Air Passengers Arriving in Mongolia and Tourists
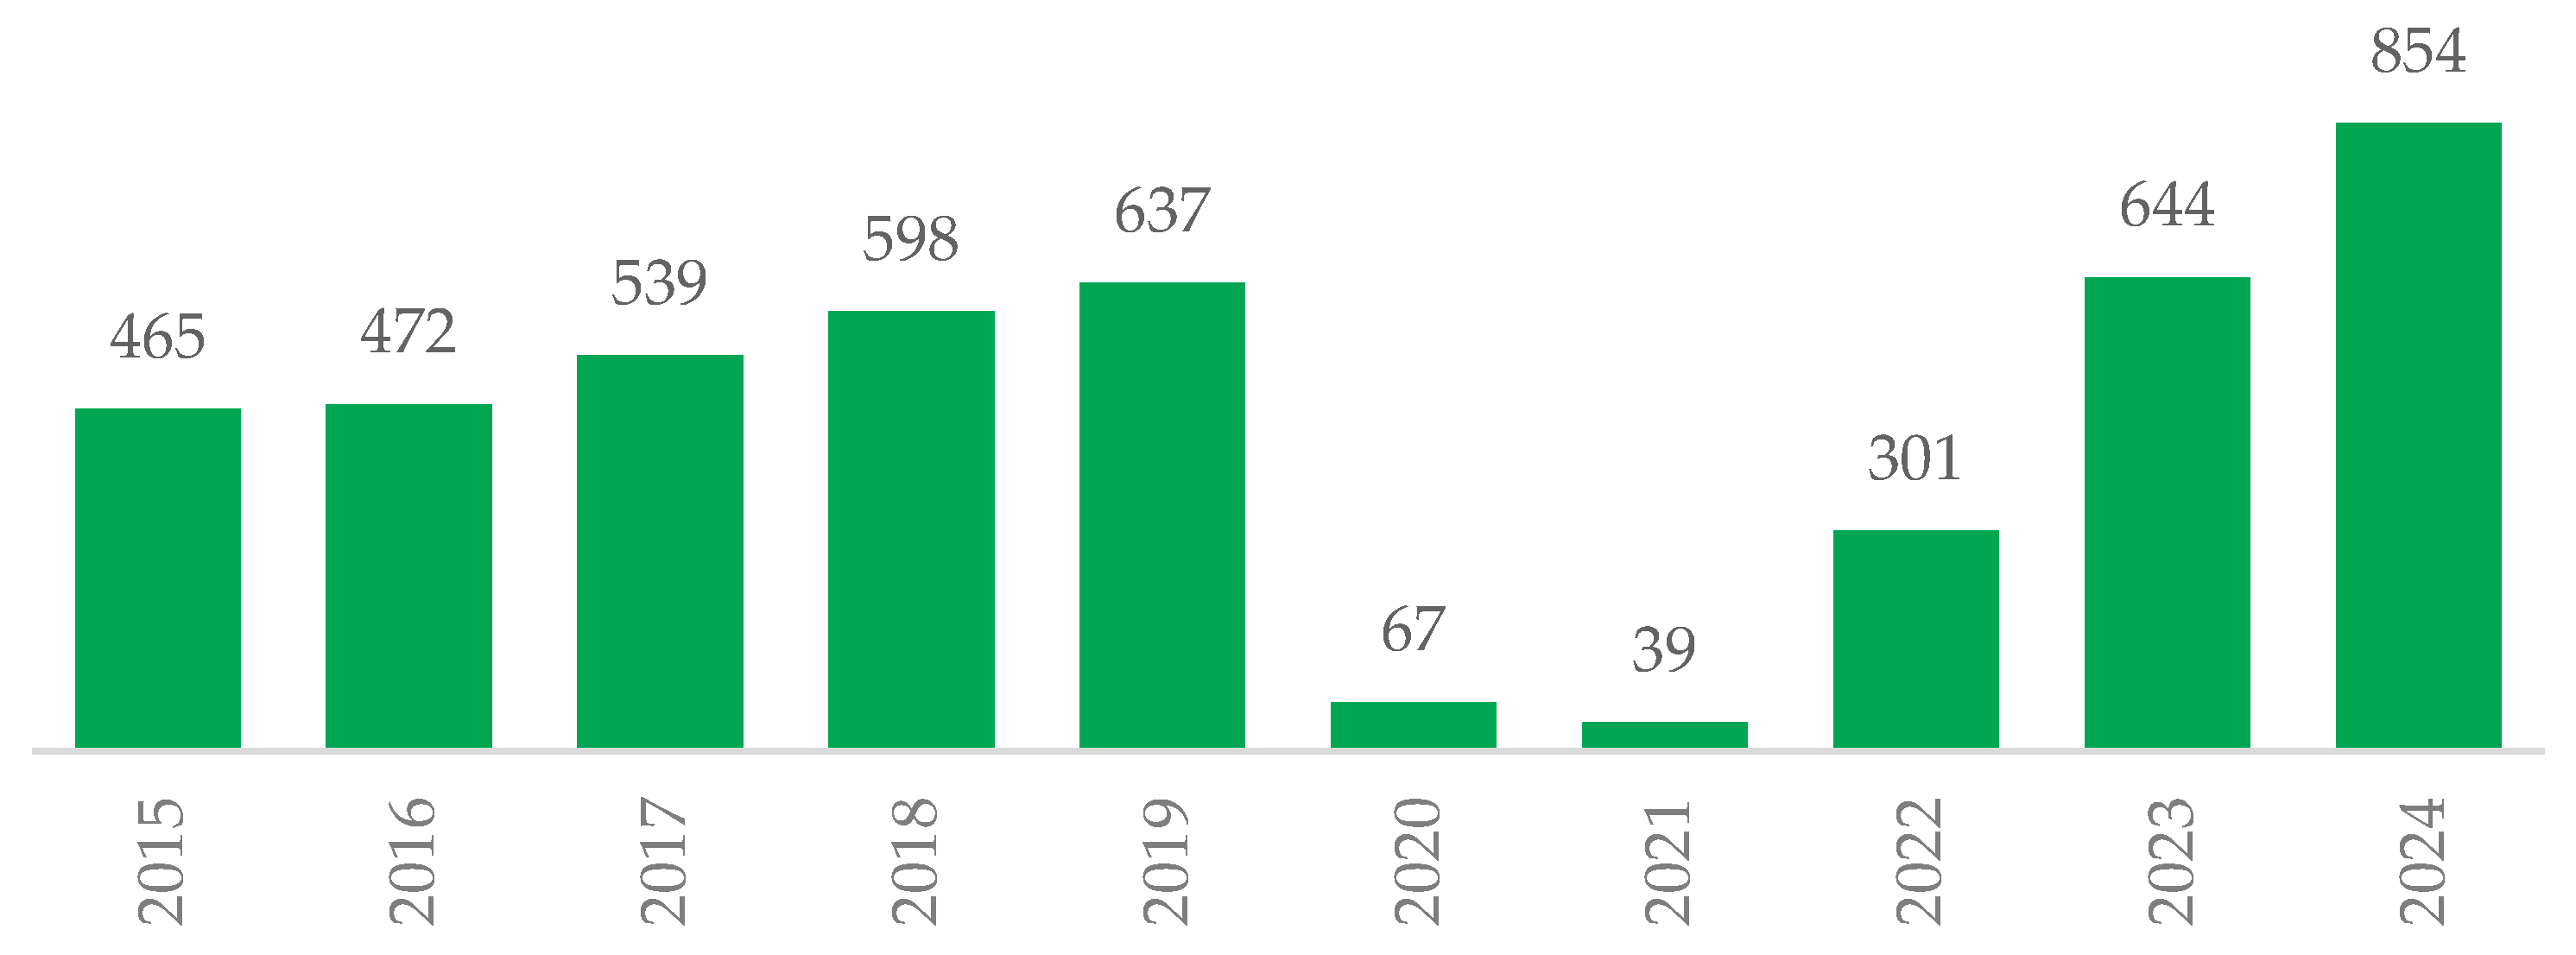
The number of foreign air passengers visiting Mongolia has increased since the COVID-19 pandemic, as shown in Figure A2. As presented in Table A2, foreign air passengers from 8 countries, including China, Russia, South Korea, and Japan, among others, accounted for 88.7% of the total foreign air passengers served by air transport. In recent years, the number of foreign passengers from China, Russia, South Korea, Japan, Kazakhstan, Turkey, Kyrgyzstan, and South Asian countries has been increasing.
As presented in Table 1, the total number of foreign air passengers served by national air transport in 2024 reached 853,800. Foreign air passengers mainly came to Mongolia for travel purposes, accounting for 45.6 percent of the total. Adult female passengers account for 39.5 percent of the total foreign air passengers. The share of female passengers in total foreign air passengers increased from 27.1 percent in 2015 to 39.5 percent in 2024. Foreign air passengers for short-term visits, including travel, business trips, and transit within 30 days, comprise 89.5 percent of the total foreign air passengers visiting Mongolia. Additionally, the number of foreign air passengers arriving from visa-free countries is on the rise. The number of air passengers arriving from the Republic of Korea and Japan has increased, reaching 219,700 in 2024.
In 2024, the number of foreign tourists visiting Mongolia reached 727,400, as shown in Table 4. The share of tourists served by airplanes accounted for 53.5 percent of total air passengers. The number of foreign tourists traveling by airplane is more likely to increase. The number of tourists traveling by airplane increased by 2.8 times from 137,100 in 2015 to 389,500 in 2024, as presented in Table A3.
Due to the increasing number of inbound passengers served by air transport as well as state development policy on the civil aviation sector, there is a need to study the state capacity of air transport, international passenger flows, and demand. This study aimed to examine the predictors of the demand for foreign passengers to travel to Mongolia via air transport and to determine its potential.
2. Literature Review
In the case of Mongolia, few studies have used the gravity model to analyze the demand for foreign air passengers visiting Mongolia. For international studies, numerous studies have employed the gravity model to estimate the demand for air passengers. We conducted a literature review analysis, drawing on more than 10 foreign articles in this study. The scope, variables, and key findings of some articles are presented in Table A4.
Heng Zhou et al. (2018) conducted an impact assessment of airport catchment areas on air passenger demand using the gravity model, concluding that the size of airport areas significantly affected air passenger demand. Andres Tillmann et al. (2023) estimated air passenger demand using a gravity model with a machine-learning method based on panel datasets that included the number of passengers, population, the distance between airport catchments, GDP, consumer price index, and poverty rate [8].
Yahua Zhang (2016) used a gravity model to analyze the factors influencing air passenger flows in China. The study employed panel data analysis, including variables such as the number of passengers, the distance between airports, the volume of rail passengers, the air population, and various policy-related factors, such as air transport policy. The findings indicate that the operation of local high-speed trains has a significant and positive correlation with passenger flows [13].
Daw (2013) studied the determinants of domestic air passenger demand in the Republic of South Africa by applying a gravity model. The study results indicate that household consumption, fuel prices, and air ticket prices influence air passenger demand. Gollnick (2018) conducted an interesting study titled A Global Gravity Model for Air Passenger Demand between City Pairs. This study employed a gravity model to predict air passenger demand between cities for 4,435 cities worldwide, based on socioeconomic factors [5].
Gravity models have been used by most researchers to estimate the demand for air transport passengers. In most of these studies, 'per capita income' and 'distance between countries or airports' are estimated as the main variables in the gravity model that influence demand for air passengers. The country's situation and airport needs were the basis for selecting policy variables in these studies. In some studies, a machine learning model based on a gravity model is used to develop suitable models for predicting the demand for air passengers. The majority of studies emphasize that are predicting the demand of air passengers makes a significant contribution to the civil aviation sector’s development, namely policy (Kun Wang, 2020), sectoral development (Fabian Baier, 2021), business (Tobias Grosche, 2007) and managerial level (Tomasz Ryczkowski, 2016) [6,9,11]. Kung Wang (2020) concluded that GDP, distance, and oil prices significantly determine the passenger traffic on air routes between Central Asian countries [9].
In summarizing the findings of previous studies, this study utilizing the gravity model is more likely to be necessary for the development of booking strategies in line with management, inter-cities tariff regulation, insurance, and air traffic exemptions, as well as fuel prices for air cargo and passenger transport, new route directions, aircraft operations, supply frequencies, ticket prices, joint flight models, and leased aircraft models.
3. Methodology
The civil aviation sector has been advancing, and the number of air passengers and tourists visiting Mongolia by airplane has grown gradually because the Mongolian government aims to receive 1.0 million foreign tourists to Mongolia in 2025 and 2.0 million in the coming years, according to the development of the tourism sector but the new airport capacity is about 3.0 million passengers per year.
3.1. Purpose of the Study:
The purpose of this study is to analyze the predictors of demand for foreign air passengers visiting Mongolia by air transport and to determine the potential demand for such air travel.
3.2. Theoretical Basis of the Study:
The Gravity model, which is widely used in international trade theory, was developed based on Newton's law of gravitation in physics. According to Newton's theory of gravitation, the gravitational force between two objects is directly proportional to each of their masses and inversely proportional to the square of the distance between them.
- ▪ Mass_i,j implies GDP, real GDP per capita, and population of countries i and j in the previous studies
- ▪ Distance_ij expresses Distance between countries i and j
The gravity model analyzes the relationship between the distance and the economic indicators (GDP, GDP per capita, population) between the countries i and j.
The gravity model has been developed for more than half a century. In 2003, Anderson and Van Wincoop (2003) developed the gravity model, which was based on the equilibrium of demand and supply in microeconomics and established a theoretical basis [1]. Linneman (1966), Bergstand (1985), Eaton and Kortum et al. (1997), Deardorff (1998), Anderson and Van Wincoop et al. (2003) developed the theoretical basis of gravity based on Ricardo's theory and the Heckscher-Ohlin theoretical concepts. Due to the gravity model having a solid theoretical basis, it is widely utilized in practical studies across various sectors, including trade, services, migration, and transport. The gravity model has some advantages. It can forecast the demand for air passengers to be influenced by geographical, economic, and social factors and has a solid theoretical basis, defined by the equilibrium of demand and supply. In addition, this model can examine the predictors affecting air passenger demand and identify potential demand. Therefore, the augmented gravity model with OLS estimation was employed in this study, utilizing panel data analysis.
3.3. Model Specification:
In this study, the primary variables of the augmented gravity model include the number of foreign passengers, real GDP per capita, and the distance between the countries i and j. The additional policy variables in the augmented gravity model include the number of adult passengers, the number of adult female passengers, travel purposes (travel, study, work, and business), travel time, purchasing power parity, as well as dummy variables such as whether the country has visa-free conditions, COVID-19 effects, and whether countries border. We employed the following log-log gravity model in this analysis.
Gravity model with log-log form:
(1)
where,
- ▪ TAij - the number of foreign air passengers visiting from country j to country I;
- ▪ Yi ба Yj - Real GDP per capita of countries i and j;
- ▪ Distij - the distance between countries i and j;
- ▪ PVij - Additional policy variables that could influence air passenger demand.
The gravity model with log-log form allows for the reduction of heteroscedasticity, the estimation of the sensitivity of the variables, and the insertion of additional policy variables in this model. In previous studies, augmented gravity models have allowed researchers to incorporate various “policy variables” into this model. The augmented gravity model includes both primary and additional policy variables for the following regression:
(2)
where,
- ▪ TAij - the number of foreign passengers traveling from country j to country i;
- ▪ Yi ба Yj - Real GDP per capita of countries i and j;
- ▪ Distij -the distance between countries i and j;
- ▪ Adult_fe – Number of foreign adult female air passengers;
- ▪ TT_30 – Number of foreign air passengers traveling to Mongolia within 30 days;
- ▪ PPPij – Purchasing power parity between countries i and j;
- ▪ FP_tour – Number of foreign air passengers arriving for travel purposes;
- ▪ FP_buss – Number of foreign air passengers arriving by business;
- ▪ FP_work – Number of foreign air passengers arriving for work purposes;
- ▪ FP_study – Number of foreign air passengers arriving for study purposes;
- ▪ Visa – The dummy variable is whether a country has visa-free condition to travel to Mongolia;
- ▪ Covid – The dummy variable is whether a country has a COVID effect in a particular year;
- ▪ Border – The dummy variable is whether a country borders with Mongolia.
Number of foreign passengers: Passenger demand is determined by the number of air passengers, air passenger flows (Yahua Zhang, 2016), number of cargo flows, and number of passenger trips (Suprayitno, 2019) [10,13]. The demand expresses the number of foreign air passenger served by air transport to Mongolia in this study.
GDP per capita: Previous studies have used GDP per capita as a measure of economic performance or economic growth. For example, some researchers such as Andreas (Andreas M. Tillmanna, 2023) and Yones (Yones, 2023) used GDP per capita [2,14]. Therefore, we used the GDP per capita of Mongolia and the rest of the countries accordingly.
Distance between countries: This variable is one of the primary variables in the gravity model. Most researchers measure it as the geographical distance between cities or between countries in the gravity model. In addition, trade costs, as a proxy for distance, are used. Novy (2012) has estimated and published trade costs between more than 180 countries for the period 1995-2022. We have yet to incorporate trade costs into this model.
Purchasing power parity ratio (PPP): In previous studies, inflation, the consumer price index (Andreas M. Tillmann, I. J., 2023), and foreign exchange (Heng Zhou, 2018) have been used to estimate the impact on air passenger demand [2,8]. The exchange rate between the Mongolian and the host country's currency is not only an important indicator, but also affects purchasing power. In this study, purchasing power parity is used.
Additional variables: This study incorporated additional policy variables into the augmented gravity model, including the number of adult passengers, the number of adult female passengers, travel purposes (travel, study, work, and business), and travel time.
Dummy variables: We applied some dummy variables included visa, border and Covid.
3.4. Data:
In this study, we selected 24 leading countries that regularly transport passengers visiting Mongolia via airplane. In 2024, the total number of air passengers arriving in Mongolia from these 24 countries reached 801,900, accounting for 93.9 percent of all foreign air passengers. Table 2 shows the definition and source of the data used in the study.
4. Results and Discussion
We present the descriptive statistics of the augmented gravity model variables in Table 3. As estimates of descriptive statistics, means and standard deviations are estimated. Number of observations is 240.
Using the gravity model commonly employed, we performed a regression analysis with two models, utilizing panel data from 24 countries for the period from 2015 to 2024.
For Model 1, we analyzed the primary variables of the augmented gravity model, specifically real GDP per capita and distance variables, which affect the demand for foreign air passengers, as shown in Table 4. For Model 2, we performed regression evaluation after including additional policy variables in the model in addition to the main variables.
The results from augmented gravity model 1:
According to the theoretical hypothesis of the Gravity Model, the results from the regression analysis of the augmented gravity model indicate that Mongolia’s GDP per capita is positively related to the demand for foreign air passengers visiting Mongolia. In contrast, the distance between countries is negatively related to foreign air passenger demand. The gravity model regression analysis results are consistent with the concept of the Gravity Model. However, the relationship between the GDP per capita of the foreign country and the demand for foreign air passengers is insignificant. We aim to provide the following explanations regarding the regression evaluation in the model.
- ▪ When Mongolia’s real GDP per capita increases by 1.0 percent, the number of for-eign air passengers to Mongolia is expected to increase by 3.5 percent. The increase in income of Mongolian citizens will provide opportunities for developing tourism, improving the quality and accessibility of domestic trade and services, and offer-ing opportunities to provide interests and services that attract foreign tourists.
- ▪ When the distance between countries and Mongolia increases by 1 percent, the demand for foreign air passengers traveling to Mongolia by airplane decreases by 2.1 percent. One possible explanation is related to East Asian passengers. Foreign air passengers arriving from East Asian countries accounted for 84.3 percent of the total foreign air passengers. The annual increase in the number of foreign air passengers from these countries can be attributed to their proximity to Mongolia, as well as the availability of direct flights.
The results from augmented gravity model 2:
The results show that variables such as the real GDP per capita of Mongolia and other countries, distance between countries, a dummy variable indicating bordering with Mongolia and purchasing power parity are insignificant for foreign air passenger demand. For one possible explanation of the “Border” dummy variable, passengers from countries neighboring Mongolia often arrive by train and car rather than by air transport. Hence, this variable is more likely to be insignificant. For example, 388,900 tourists arrived from neighboring countries, including China and Russia, in 2024. According to statistics, 33.9 percent of these tourists traveled by air, while the remaining 66.1 percent traveled mainly by road and rail. The PPP variable result indicates that foreign air passengers and tourists have access to affordable products in Mongolia, which is likely not to affect the purchasing power parity variable.
The results indicated that several variables, including the number of foreign air passengers arriving for travel, business, and work purposes, as well as adult female passengers, are statistically significant and positively correlated with the demand for foreign air passengers visiting Mongolia. Additionally, the number of foreign air passengers arriving for visa-free travel and those traveling within 30 days also showed a positive relationship with demand. Conversely, the demand for foreign air passengers is statistically significant and negatively correlated with the number of passengers arriving for study purposes, as well as the COVID-19 dummy variable. We provide the following explanations regarding the regression evaluation for Model 2.
- ▪ When the real GDP per capita of Mongolia increases by 1.0 percent, demand for foreign air passengers is expected to increase by 0.89 percent.
- ▪ If the number of foreign air passengers arriving for travel, business, and work purposes increases by 1.0 percent, demand for foreign air passengers will increase by 0.18 percent, 0.16 percent, and 0.09 percent, respectively.
- ▪ The study results showed that foreign passengers are interested in traveling to Mongolia for a short period, with a relatively brief travel time. When the number of foreign air passengers traveling within 30 days increases by 1 percent, the foreign air passenger demand will increase by 0.12 percent. The study results also show that foreign air passenger demand will increase by 0.03 percent if the number of adult female passengers grows by 1 percent. The number of adult female passengers has been increasing in recent years.
- ▪ When the number of foreign passengers from visa-free countries increases by 1.0 percent, the demand for foreign passengers traveling by air will increase by 0.14 percent, indicating that visa-free travel for tourism purposes is a significant indicator for air transport traffic. When the number of passengers traveling for study purposes increases by 1.0 percent, the foreign passenger demand will decrease by 0.09 percent.
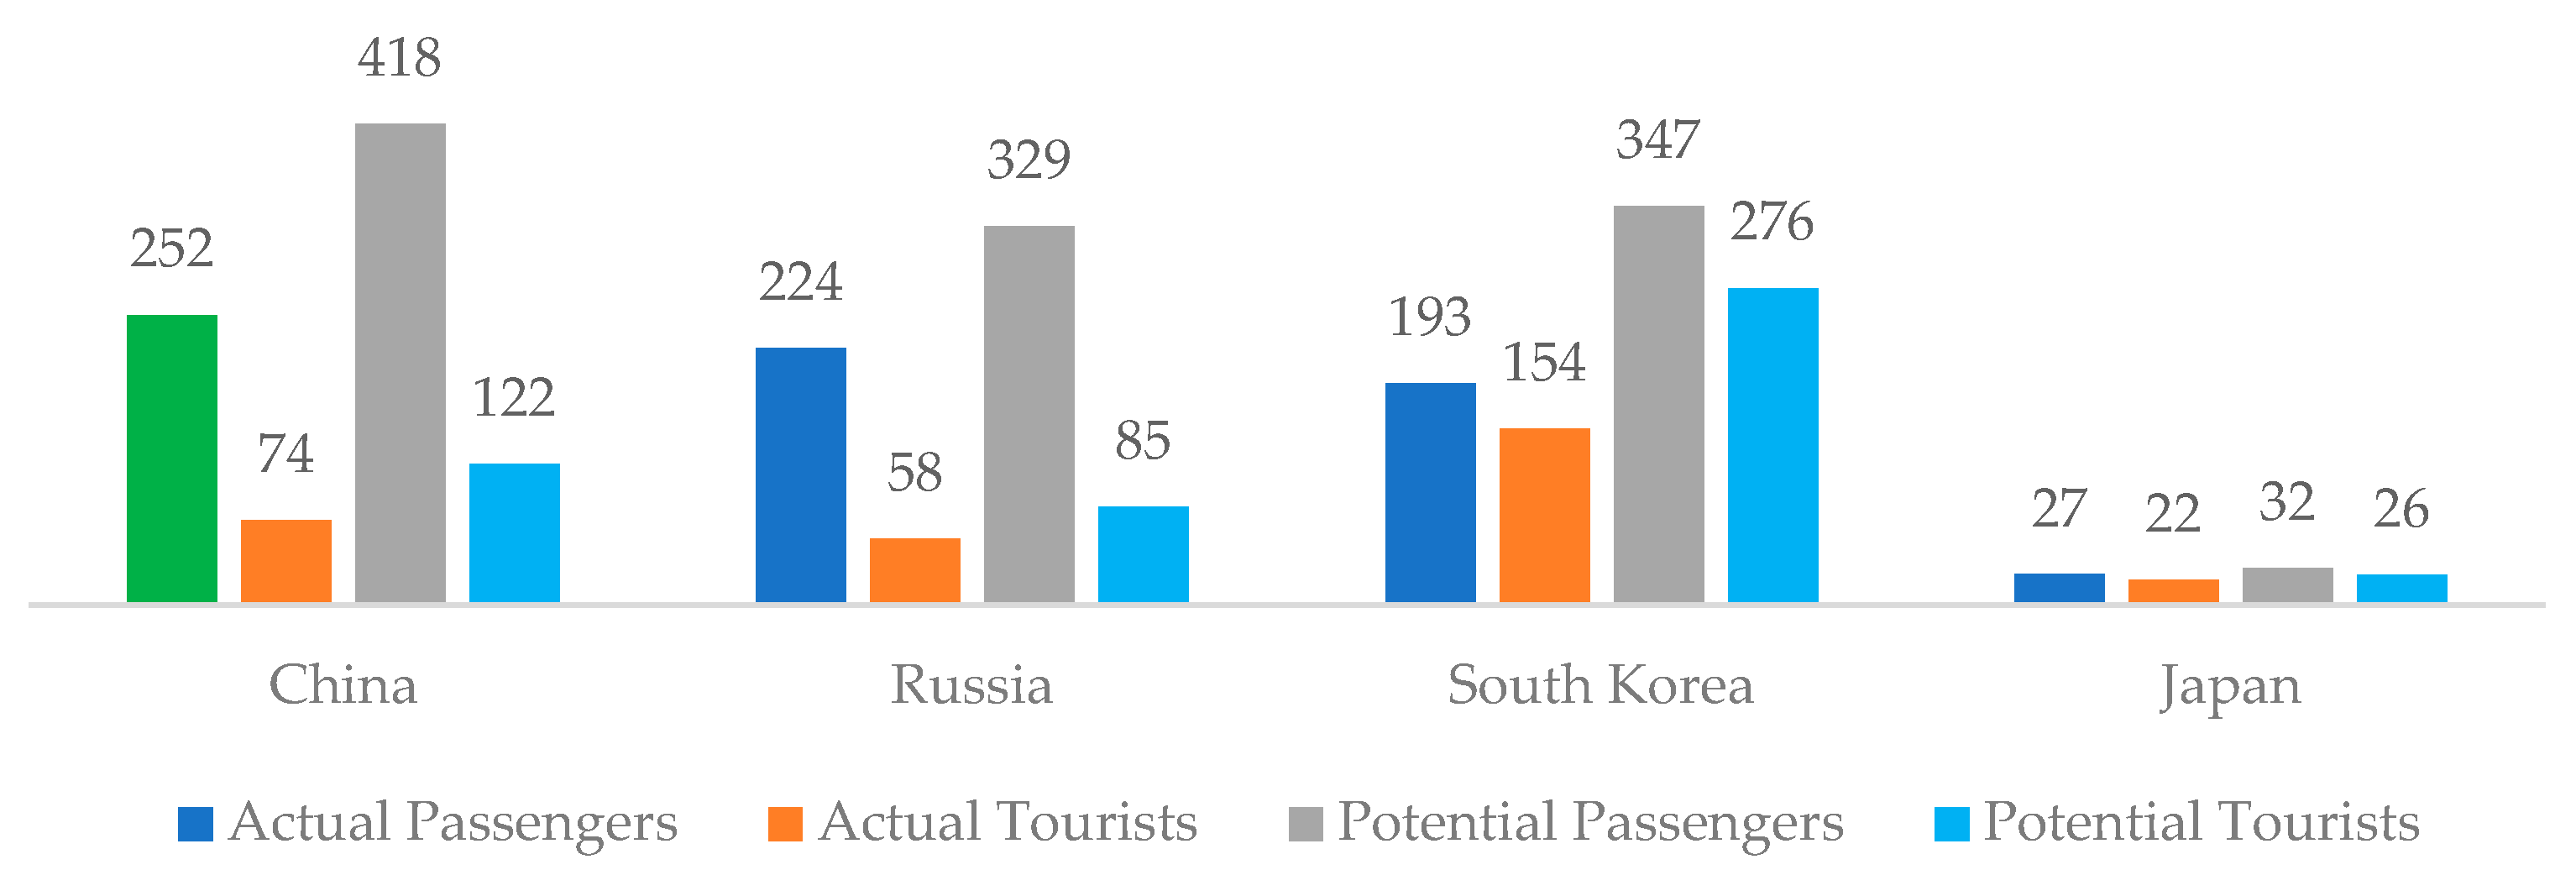
According to the augmented gravity model, the potential demand for foreign air passengers traveling by airplane visiting Mongolia is 520.0 thousand passengers higher than the actual performance. We selected four countries, namely China, Russia, South Korea, and Japan, and compared the actual and potential demand of foreign air passengers visiting Mongolia by air transport, as shown in Figure 3. The total number of travelers from these four countries served by air transport in 2024 was 696.0 thousand, of which 44.1 percent came for tourism purposes. The potential demand for foreign passengers from these countries is 1,126.0 thousand. Compared to the 2024 performance, 430.0 thousand passengers from these four countries were able to travel by airplane. The preliminary results indicate that 202,000 more foreign passengers were able to be served by air transportation.
Figure 2.
Number of foreign passengers traveled from 4 countries /thousand people/.
5. Conclusions and Suggests
We conducted this study to analyze the predictors of demand for foreign air passengers visiting Mongolia by air transport and to determine potential demand using panel data analysis, focusing on the top 24 foreign countries for the period from 2015 to 2024.
According to the results from the augmented gravity model regression analysis, variables such as Mongolia’s real GDP per capita, the number of foreign passengers traveling, working, and visiting, and the number of foreign passengers traveling within 30 days and from visa-free countries have a statistically significant and positively related with the demand for foreign air passengers visiting Mongolia for air transport. Conversely, predictors such as the number of foreign air passengers traveling for study purposes and the COVID-19 dummy variable have a negative relationship with the demand for foreign air passengers.
The study results indicated a need to assess the demand for domestic flights, operate flights from the older airport, enhance conditions, supply, and accessibility for foreign tourists, and increase the number of airport terminals. Additionally, there is a need to explore the possibility of operating domestic passenger flights from Buyant-Ukhaa Airport. To support the government’s goal of increasing the number of foreign tourists visiting Mongolia to 2.0 million and establishing the country as a transit hub for East Asia, it is essential to construct a new terminal.
6. Limitation and Future Works
In the future, it will be possible to continue developing this study by refining the augmented gravity model, collecting additional data on policy variables essential for the study, and examining inbound and outbound foreign and domestic passengers and cargo. The advancement of this model is likely to help in the planning and budgeting of policies for the civil aviation sector.
Additionally, we will incorporate policy variables such as ticket prices, the number and frequency of international direct flights, cargo turnover, transit transport, and other relevant policy variables into the augmented gravity model. Moreover, including monthly and seasonal data will help evaluate the effects of these additional variables on demand for foreign and domestic air passengers. This research can also explore the model's expansion of airport capacity and regional considerations.
Website
Abbreviations
The following abbreviations are used in this manuscript:
| RGDPPC_i | Mongolia's real GDP per capita |
| RGDPPC_j | Real GDP per capita of the traveling country |
| Dist_ij | Geographical distance between Mongolia and the destination country |
| PPP_ij | Purchasing power parity |
| Adult_fe | Number of adult female passengers |
| TT_30 | Number of passengers with a travel period within 30 days |
| FP_tour | Number of passengers arriving for travel purposes |
| FP_buss | Number of passengers arriving on business trip |
| FP_work | Number of passengers arriving for work purposes |
| FP_study | Number of passengers arriving for study purposes |
| Covid | 0 if no Covid, 1 if Covid |
| Visa | 0 value if visa required, 1 value if no visa |
| Border | 1 if there is bordering, 0 if no bordering |
| GABR | General Authority for border protection of Mongolia |
| WB | World Bank |
| WHO | World Health Organization |
| CD, MFOM | Ministry of Foreign Affairs of Mongolia, Consular Department |
Appendix A

Table A1.
Total number of foreign and domestic passengers carried by major airlines, 2024.
| Air carrier | International | Domestic | Total | Share |
| MIAT | 823.4 | 281.2 | 1,104.6 | 73.9 |
| HUNNU AIR | 134.0 | 56.8 | 190.8 | 12.8 |
| AERO MONGOLIA | 101.7 | 82.3 | 184.0 | 12.3 |
| EZNIS AIRWAYS | 16.2 | 0.0 | 16.2 | 1.1 |
| TOTAL | 1,075.2 | 420.4 | 1,495.6 | 100.0 |
Source: Civil aviation authority of Mongolia.
Table A2.
Total number of foreign and domestic passengers carried by major airlines, 2024.
| Country | 2015 | 2019 | 204 | Share |
| China | 215.7 | 208.4 | 252.4 | 29.6 |
| Russia | 70.1 | 146.8 | 223.8 | 26.2 |
| South Korea | 49.4 | 103.4 | 193.1 | 22.6 |
| Japan | 19.8 | 25.2 | 26.6 | 3.1 |
| USA | 15.2 | 19.9 | 17.6 | 2.1 |
| Kazakhstan | 14.8 | 16.5 | 24.6 | 2.9 |
| Germany | 9.2 | 12.7 | 12.5 | 1.5 |
| France | 8.2 | 10.7 | 6.9 | 0.8 |
| TOTAL | 402.3 | 543.6 | 757.5 | 88.7 |
| Share | 86.5 | 85.3 | 88.7 | - |
Source: National Statistics Office, General Authority for border protection of Mongolia.
Table A3.
Comparing air passengers with tourists abroad.
| indicator | 2015 | 2019 | 2024 |
| Number of foreign tourists visiting Mongolia | 386.2 | 577.3 | 727.4 |
| Number of foreign air passengers via airplane | 137.1 | 260. | 389.5 |
| Share of foreign air tourists via airplane in total tourists | 35.5 | 45.0 | 53.5 |
Source: National Statistics Office and Central Border Protection Authority, Mongolia.
Table A4.
Comparing the literature reviews that were selected.
| Researcher | Scope | Explaining variables | Key findings |
| (Heng Zhou, 2018) | The impact assessment of catchment areas of airports on air passenger demand |
|
The area size of an airport affects air passenger demand. |
| (Andreas M. Tillmanna, 2023) | Air passenger demand estimation |
|
Based on the gravity model, it was analyzed using machine learning models and other equipment |
| (Yahua Zhang, 2016) | Analysis of factors affecting China's air passenger flow |
|
The movement of local high-speed trains is having a positive impact on passenger traffic. |
| (Daw, 2013) | Analysis of factors affecting domestic air passenger demand in the Republic of South Africa |
|
The results show that air passenger demand is affected by household consumption, fuel prices, and airfares. |
| (Gollnick, 2018) | Using a gravity model to analyze intercity air passenger demand |
|
Developed a gravity model to predict intercity air passenger demand for 4,435 cities around the world based on socio-economic factors. |
Source: National Statistics Office and Central Border Protection Authority, Mongolia.
Figure A1.
The number of foreign air passengers to Mongolia /thous.people/.
References
- Anderson James, E. , Eric van Wincoop "Gravity with Gravitas: A Solution to the Border Puzzle. ". American Economic Review. 2003, 93, 170–193. [Google Scholar] [CrossRef]
- Andreas, M. Tillmanna Imke Joormann, Sabrina C. L. Ammanna Reproducible Air Passenger Demand Estimation. Journal of Air Transport Management. 2023, 29. [Google Scholar]
- Andreas, M. Tillmanna Imke Joormannb, Sabrina C. L. Ammanna Reproducible Air Passenger Demand Estimation. Journal of Air Transport Management. 2023. research gate, 29.
- Cohen Shamai A Gravity Model for Aviation Forecasting [Report]. Vrije University Amsterdam : Spatial, Transport and Environmental, 2016.
- Daw Olebogeng David The Determinants of Domestic Air Passenger Demand in the Republic of South Africa. Mediterranean Journal of Social Sciences. 2013, 4, 13.
- Fabian Baier Peter Berster, Marc Gelhausen Global cargo gravitation model: airports matter. International Economics and Economic Policy. 2021, 219–238.
- Gollnick Ivan Terekhov&Volker A global gravity model for air passenger demand between city pairs and future [Conference] // AIAA AVIATION Forum. Atlanta, Georgia : [s.n.], 2018.
- Heng Zhou Jianhong (Cecilia) Xia, Qingzhou Luo, Jie Sun Investigating the impact of catchment areas of airports on estimating air travel demand: A case study of regional Western Australia. Journal of Air Transport Management. 2018, 23.
- Kun Wang Xiaowen Fy Modeling the potential for aviation liberalization in Central Asia – Market analysis and implications for the Belt and Road Initiative. Transportation Research. 2020, 10.
- Suprayitno Developing a direct gravity trip distribution model for air . Earth and Environmental Science. 2019. IOP Publishing : Vol. 8, 8. Suprayitno Developing a direct gravity trip distribution model for air. Earth and Environmental Science. 2019. IOP Publishing : Vol. 8, 8.
- Tobias Grosche Franz Rothlauf, Armin Heinzl Gravity models for airline passenger volume estimation. Journal of Air Transport Management. 2007, 10.
- Tomasz Ryczkowski Agata Fronczak, Piotr Fronczak How transfer flights shape structure of the airline network [Journal]. 2016, 7.
- Yahua Zhang Anming Zhang Determinants of Air Passenger Flows in China. Journal of Transport Economics and Policy, Volume 50, Part 3. 2016, 50, 18.
- Yones Rasha FOUAD Macroeconomic Determinants of Air passenger Demand in Egypt. Scientific Journal for Financial and Commercial Studies and Research. 2023, 4, 43.
Table 1.
Number of foreign air passengers visiting Mongolia.
| Air carrier | 2015 | 2019 | 2024 | Share in 2024 |
| Passengers for tourism purpose | 137.1 | 260.1 | 389.5 | 45.6 |
| Passengers for study purpose | 2.4 | 6.5 | 11.2 | 1.3 |
| Adults passengers | 446.1 | 606.0 | 798.2 | 93.5 |
| Adult female passengers | 125.9 | 228.6 | 337.2 | 39.5 |
| Passengers within 30 days | 377.2 | 569.4 | 764.1 | 89.5 |
| Passengers for visa-free travel | 388.4 | 489.0 | 796.6 | 93.3 |
| Passengers arrived from bordering coutnry (China and Russia) | 285.8 | 355.2 | 476.2 | 55.8 |
| Passengers arrived from South Korea and Japan | 69.2 | 128.5 | 219.7 | 25.8 |
| TOTAL | 465.3 | 637.0 | 853.8 | 100.0 |
Source: Civil aviation authority of Mongolia.
Table 2.
Dataset.
| Variables | Specification | Measurement | Source |
| TAij | Number of foreign passengers served by air transport to Mongolia | Number of people | GABP |
| RGDPPC_i | Mongolia's real GDP per capita | Thousand USD | World bank |
| RGDPPC_j | Real GDP per capita of the traveling country | Thousand USD | World bank |
| Dist_ij | Geographical distance between Mongolia and the destination country | km | CEPII |
| PPP_ij | Purchasing power parity | Index | World bank |
| Adult_fe | Number of adult female passengers | Number of people | GABP |
| TT_30 | Number of passengers with a travel period within 30 days | Number of people | GABP |
| FP_tour | Number of passengers arriving for travel purposes | Number of people | GABP |
| FP_buss | Number of passengers arriving on business trip | Number of people | GABP |
| FP_work | Number of passengers arriving for work purposes | Number of people | GABP |
| FP_study | Number of passengers arriving for study purposes | Number of people | GABP |
| Covid | 0 if no Covid, 1 if Covid | Dummy | WHO |
| Visa | 0 value if visa required, 1 value if no visa | Dummy | CD, MFOM |
| Border | 1 if there is bordering, 0 if no bordering | Dummy | - |
Source: Civil aviation authority of Mongolia.
Table 3.
Descriptive analysis.
| Variables | Foreign air passengers demand | ||||
| Observation | Mean | Standard deviation |
Min | Max | |
| TAij | 240 | 18094.8 | 46030.3 | 8 | 252412 |
| RGDPPC_i | 240 | 4168.4 | 275.8 | 3817.9 | 4757 |
| RGDPPC_j | 240 | 37099.2 | 20488.5 | 1585 | 91000 |
| Dist_ij | 240 | 5452.9 | 2219.5 | 1223 | 10027 |
| PPP_ij | 240 | 48.7 | 169.1 | 0.6 | 872.6 |
| Female | 240 | 6414.9 | 17245.4 | 2 | 120097 |
| TT_30 | 240 | 13743.9 | 36284.7 | 7 | 211357 |
| FP_tour | 240 | 7003.0 | 17929.6 | 1 | 153633 |
| FP_buss | 240 | 1882.7 | 5895.0 | 1 | 62882 |
| FP_work | 240 | 1547.4 | 8137.6 | 1 | 68774 |
| FP_study | 240 | 176.9 | 884.5 | 1 | 9406 |
Table 4.
Table 4. Results of regression analysis.
| Variables | Foreign air passengers demand | |
| Model 1 | Model 2 | |
| RGDPPC_i | 3.487** | 0.894** |
| RGDPPC_j | 0.198 | -0.058 |
| Dist_ij | -2.109** | -0.154 |
| PPP_ij | - | -0.006 |
| Adult_fe | - | 0.033** |
| TT_30 | - | 0.119** |
| FP_tour | - | 0.175** |
| FP_buss | - | 0.164** |
| FP_work | - | 0.096** |
| FP_study | - | -0.091** |
| Covid | - | -0.139** |
| Visa | - | 0.142** |
| Border | - | -0.086 |
| Constant | -5.264 | -2.831 |
| R2 | 0.277 | 0.982 |
Note: Researcher’s calculation Significance: denotes **p<0.01; *p<0.05.
Disclaimer/Publisher’s Note: The statements, opinions and data contained in all publications are solely those of the individual author(s) and contributor(s) and not of MDPI and/or the editor(s). MDPI and/or the editor(s) disclaim responsibility for any injury to people or property resulting from any ideas, methods, instructions or products referred to in the content. |
© 2025 by the authors. Licensee MDPI, Basel, Switzerland. This article is an open access article distributed under the terms and conditions of the Creative Commons Attribution (CC BY) license (https://creativecommons.org/licenses/by/4.0/).
Copyright: This open access article is published under a Creative Commons CC BY 4.0 license, which permit the free download, distribution, and reuse, provided that the author and preprint are cited in any reuse.


