
Submitted:
20 October 2025
Posted:
22 October 2025
You are already at the latest version
Abstract
The retina is a highly specialized structure consisting of neurons, glial cells, and pigment epithelial cells. Glaucoma, the leading cause of irreversible blindness, is characterized by increased intraocular pressure (IOP), retinal ganglion cell (RGC) loss, and retinal nerve fibre layer thinning. This study aimed to validate an experimental glaucoma model and examine retinal structural changes during disease development. Female DBA/2 mice, genetically predisposed to glaucoma, were used as the experimental group, while pre-glaucomatous DBA/2 and non-glaucomatous C57Bl/6 mice served as controls. IOP was measured biweekly. Retinal sections were analysed histologically for retinal thickness, individual layer thickness, and the number of cells within the ganglion cell layer. Glaucomatous DBA/2 mice exhibited significantly higher IOP and significant retinal thinning. Structural changes were observed as reduced outer plexiform layer and inner nuclear layer thickness and increased inner plexiform layer thickness. Ganglion cell layer cell counts decreased in glaucomatous mice in both central and peripheral regions. In conclusion, DBA/2 mice develop hallmark glaucoma features while retinal thinning is layer-specific. Understanding the sequence of retinal damage, including RGC axonal dysfunction and cell death, is critical for designing advanced preclinical research strategies and, in the future, developing targeted therapies.
Keywords:
glaucoma
; neurodegeneration
; retina
; retinal layers
1. Introduction
The retina is a highly specialized eye structure that comprises neurons (photoreceptors, horizontal cells, bipolar cells, amacrine cells, and retinal ganglion cells [RGC]), glial cells (Müller cells, astrocytes, and microglia), and pigment epithelial cells. Neurons transmit visual impulses, while glial cells support neuronal function by providing nourishment, maintaining structural integrity, secreting neuroprotective proteins, and mediating immune processes [1,2,3]. The pigment epithelial cells form the retina’s outermost layer, regulating nutrient exchange and protecting against oxidative damage [4].
The mammalian retina contains ten layers: (i) retinal pigment epithelium (RPE), (ii) photoreceptor layer, (iii) outer limiting membrane (OLM), (iv) outer nuclear layer (ONL), (v) outer plexiform layer (OPL), (vi) inner nuclear layer (INL), (vii) inner plexiform layer (IPL), (viii) ganglion cell layer (GCL), (ix) retinal nerve fiber layer (RNFL), and (x) inner limiting membrane (ILM) [1]. The three thickest layers contain neuronal bodies (ONL, INL, GCL), and their synaptic processes form the OPL, IPL between them [5]. Photoreceptors, with cell bodies located in the ONL, synapse with bipolar and horizontal cells in the OPL, while bipolar and amacrine cells, with bodies located in the INL, synapse with RGCs in the IPL. The cell bodies of RGCs lay in the GCL, and their axons form the RNFL, projecting to the brain via the optic nerve [6,7,8].
Glaucoma is a chronic disease affecting 76 million people worldwide, with projections estimating an increase to 111.8 million by 2040 [9]. It is one of the leading causes of irreversible blindness globally [10]. Glaucoma is defined as a chronic optic neuropathy, with elevated intraocular pressure (IOP) being a major risk factor [11,12,13]. It encompasses a heterogeneous group of conditions characterized by RGC loss, RNFL thinning, and optic disc cupping [14,15], classifying it as a neurodegenerative disorder. RGC loss occurs via apoptosis, triggered by genetic, neurotrophic, autoimmune, and excitotoxic factors [16]. In the classic understanding of glaucoma development, increased IOP causes damage to the retina leading to RGC loss. The mechanisms involved in this interplay are still being researched, though it is believed that high IOP induces mechanical and oxidative stress, as well as hypoxia of the inner retina. This is modulated by structural and material properties of the eye, which vary across regions. The stress triggers the remodelling and transmission of stimuli to RGCs [17].
Even though the research on glaucoma pathomechanisms is extensive and ongoing, most of it centers around IOP and RGCs. However, RGCs are cells that interact with other parts of the retina, which may be affected by glaucoma as well, and may play a role in its pathomechanisms. This study aimed to validate a popular experimental model of glaucoma and then assess the structural changes in the retina that occur during glaucoma development.
2. Materials and Methods
2.1. Animals
This study was approved by the II Local Ethical Committee in Warsaw (resolution WAW2/122/2020). Female DBA/2 mice, genetically predisposed to pigmentary glaucoma, served as the experimental model, while C57Bl/6 mice, which do not develop glaucoma, were used as controls. The animals were divided into four groups: (i) C57Bl/6_11w (control) – 11-week-old non-glaucomatous C57Bl/6 mice (n=10), (ii) C57Bl/6_44w (control) – 44-week-old non-glaucomatous C57Bl/6 mice (n=12), (iii) DBA/2_11w (control) – 11-week-old pre-glaucomatous DBA/2 mice (n=10) (iv) DBA/2_44w_GLAU (experimental) – 44-week-old glaucomatous DBA/2 mice (n=10).
Mice were housed in ventilated rooms (12-hour light-dark cycles, 20 – 24 °C, 55% ± 10% humidity) in cages with enrichment. Food and water were provided ad libitum, and animals underwent a 2-week acclimatization period prior to in vivo examinations.
2.2. In Vivo Studies
Mice from the C57Bl/6_11t and DBA/2_11t groups were examined in vivo once at 11 weeks of age before sacrifice, and mice from the C57Bl/6_10m and DBA/2_10m_GLAU groups were examined every two weeks from 11 weeks to 44 weeks of age. Animals were anesthetized with isoflurane delivered by a low-flow anesthesia system (SomnoSuite; flow [ml/min] = 0.65 x body weight [g]). IOP was then measured using a TonoVet Plus handheld veterinary tonometer (iCare). The measurement was performed in each eye, three times and averaged.
2.3. Sacrifice and Tissue Harvesting
Remaining under anesthesia, the mice were sacrificed by cervical dislocation. Tissues (blood and eyeballs) were harvested for further analysis. Blood was collected directly from the left ventricle of the heart and, after clotting, centrifuged to obtain serum.
2.4. Histopathological Analysis
Retinal sections were prepared and stained with hematoxylin and eosin per the protocol described previously by our team [18]. The retina was analyzed on three consecutive cross-pupil sections and the retinal thickness (RT), as the distance between the OLM and ILM at the widest point [μm], and the thickness of chosen individual retinal layers, ONL, OPL, INL, and IPL, at their widest point [μm] were measured. To avoid bias due to skew sectioning, the thickness values of individual layers were presented as the ratio to the measured RT value: (i) ONL/RT, (ii) OPL/RT, (iii) INL/RT, and (iv) IPL/RT. Next, the number of cells within the GCL was counted in the central part of the retina over a length of 500 μm (cells of central GCL) and in the peripheral part, over a length of 250 μm on one side and 250 μm on the opposite side of the section (the measurement was started at a distance of 500 μm from the edge of the ciliary body). The number of cells was summed to express the number of cells per 500 μm of the peripheral retina (cells of peripheral GCL).
2.5. Statistical Analysis
Data were analysed using GraphPad Prism 9 and Microsoft Excel. Normality was assessed using the Shapiro-Wilk test. Statistical comparisons employed ANOVA, or Kruskal-Wallis tests, depending on the distribution of data. The level of significance was set at p ≤ 0.05.
3. Results
A descriptive analysis of the results is presented in Table A1 in the Appendix section.
3.1. Tonometry
The results of IOP measurements performed at two-week intervals are presented in Figure 1. Mice of the experimental group presented significantly higher IOP values compared to C57Bl/6 mice at the same age, 17 mmHg (interquartile range [IQR] 16 – 18.75 mmHg) vs. 15 mmHg (IQR 13 – 17 mmHg), p = 0.005. IOP in experimental mice was also significantly higher than in younger mice of the same strain at 11 weeks of age, 17 mmHg (IQR 16 – 18.75 mmHg) vs. 13 mmHg (IQR 12 – 14 mmHg), p < 0.001. Additionally, a difference was observed between 11-week-old DBA/2 and 11-week-old C57Bl/6 mice, with young DBA/2 mice having lower IOP than young C57Bl/6 mice, 13 mmHg (IQR 12 – 14 mmHg) vs. 15 mmHg (IQR 14 – 17 mmHg), p < 0.001 (Figure 2A).
3.2. Retinal Thickness
Exemplary cross-sections of the mouse retina with measurements of RT and retinal layers’ thickness are presented in Figure 3. Mice with glaucoma had significantly thinner retinas than young pre-glaucomatous mice of the same strain (RT: 106 µm [IQR 90.1 – 124 µm] vs. 194.5 µm [IQR 180.25 – 242.25 µm], p < 0.001). In addition, the retina of 44-week-old glaucomatous DBA/2 mice was significantly thinner than the retina of 44-week-old non-glaucomatous mice of the control strain (RT: 106 µm [IQR 90.1 – 124 µm] vs. 194 µm [IQR 127.25 – 223.75 µm], p < 0.001) (Figure 2B).
3.3. The Thickness of the Individual Layers of the Retina
With age, the thickness of the inner layers of the retina of both mice strains changed. A decrease in the thickness of the INL and an increase in the thickness of the IPL were observed in relation to RT (Figure 2E,F). A change that was only present in the experimental group (DBA/2_10m_GLAU) was a decrease in OPL/RT, this ratio in mice with glaucoma was lower than in 11-week-old pre-glaucomatous (DBA/2_11t), 0.061 (IQR 0.051 – 0.069) vs. 0.072 (IQR 0.062 – 0.078), p = 0.018. However, no statistically significant difference was observed when comparing 44-week-old DBA/2 mice with 44-week-old C57Bl/6 mice (Figure 2D).
3.4. Cells of GCL
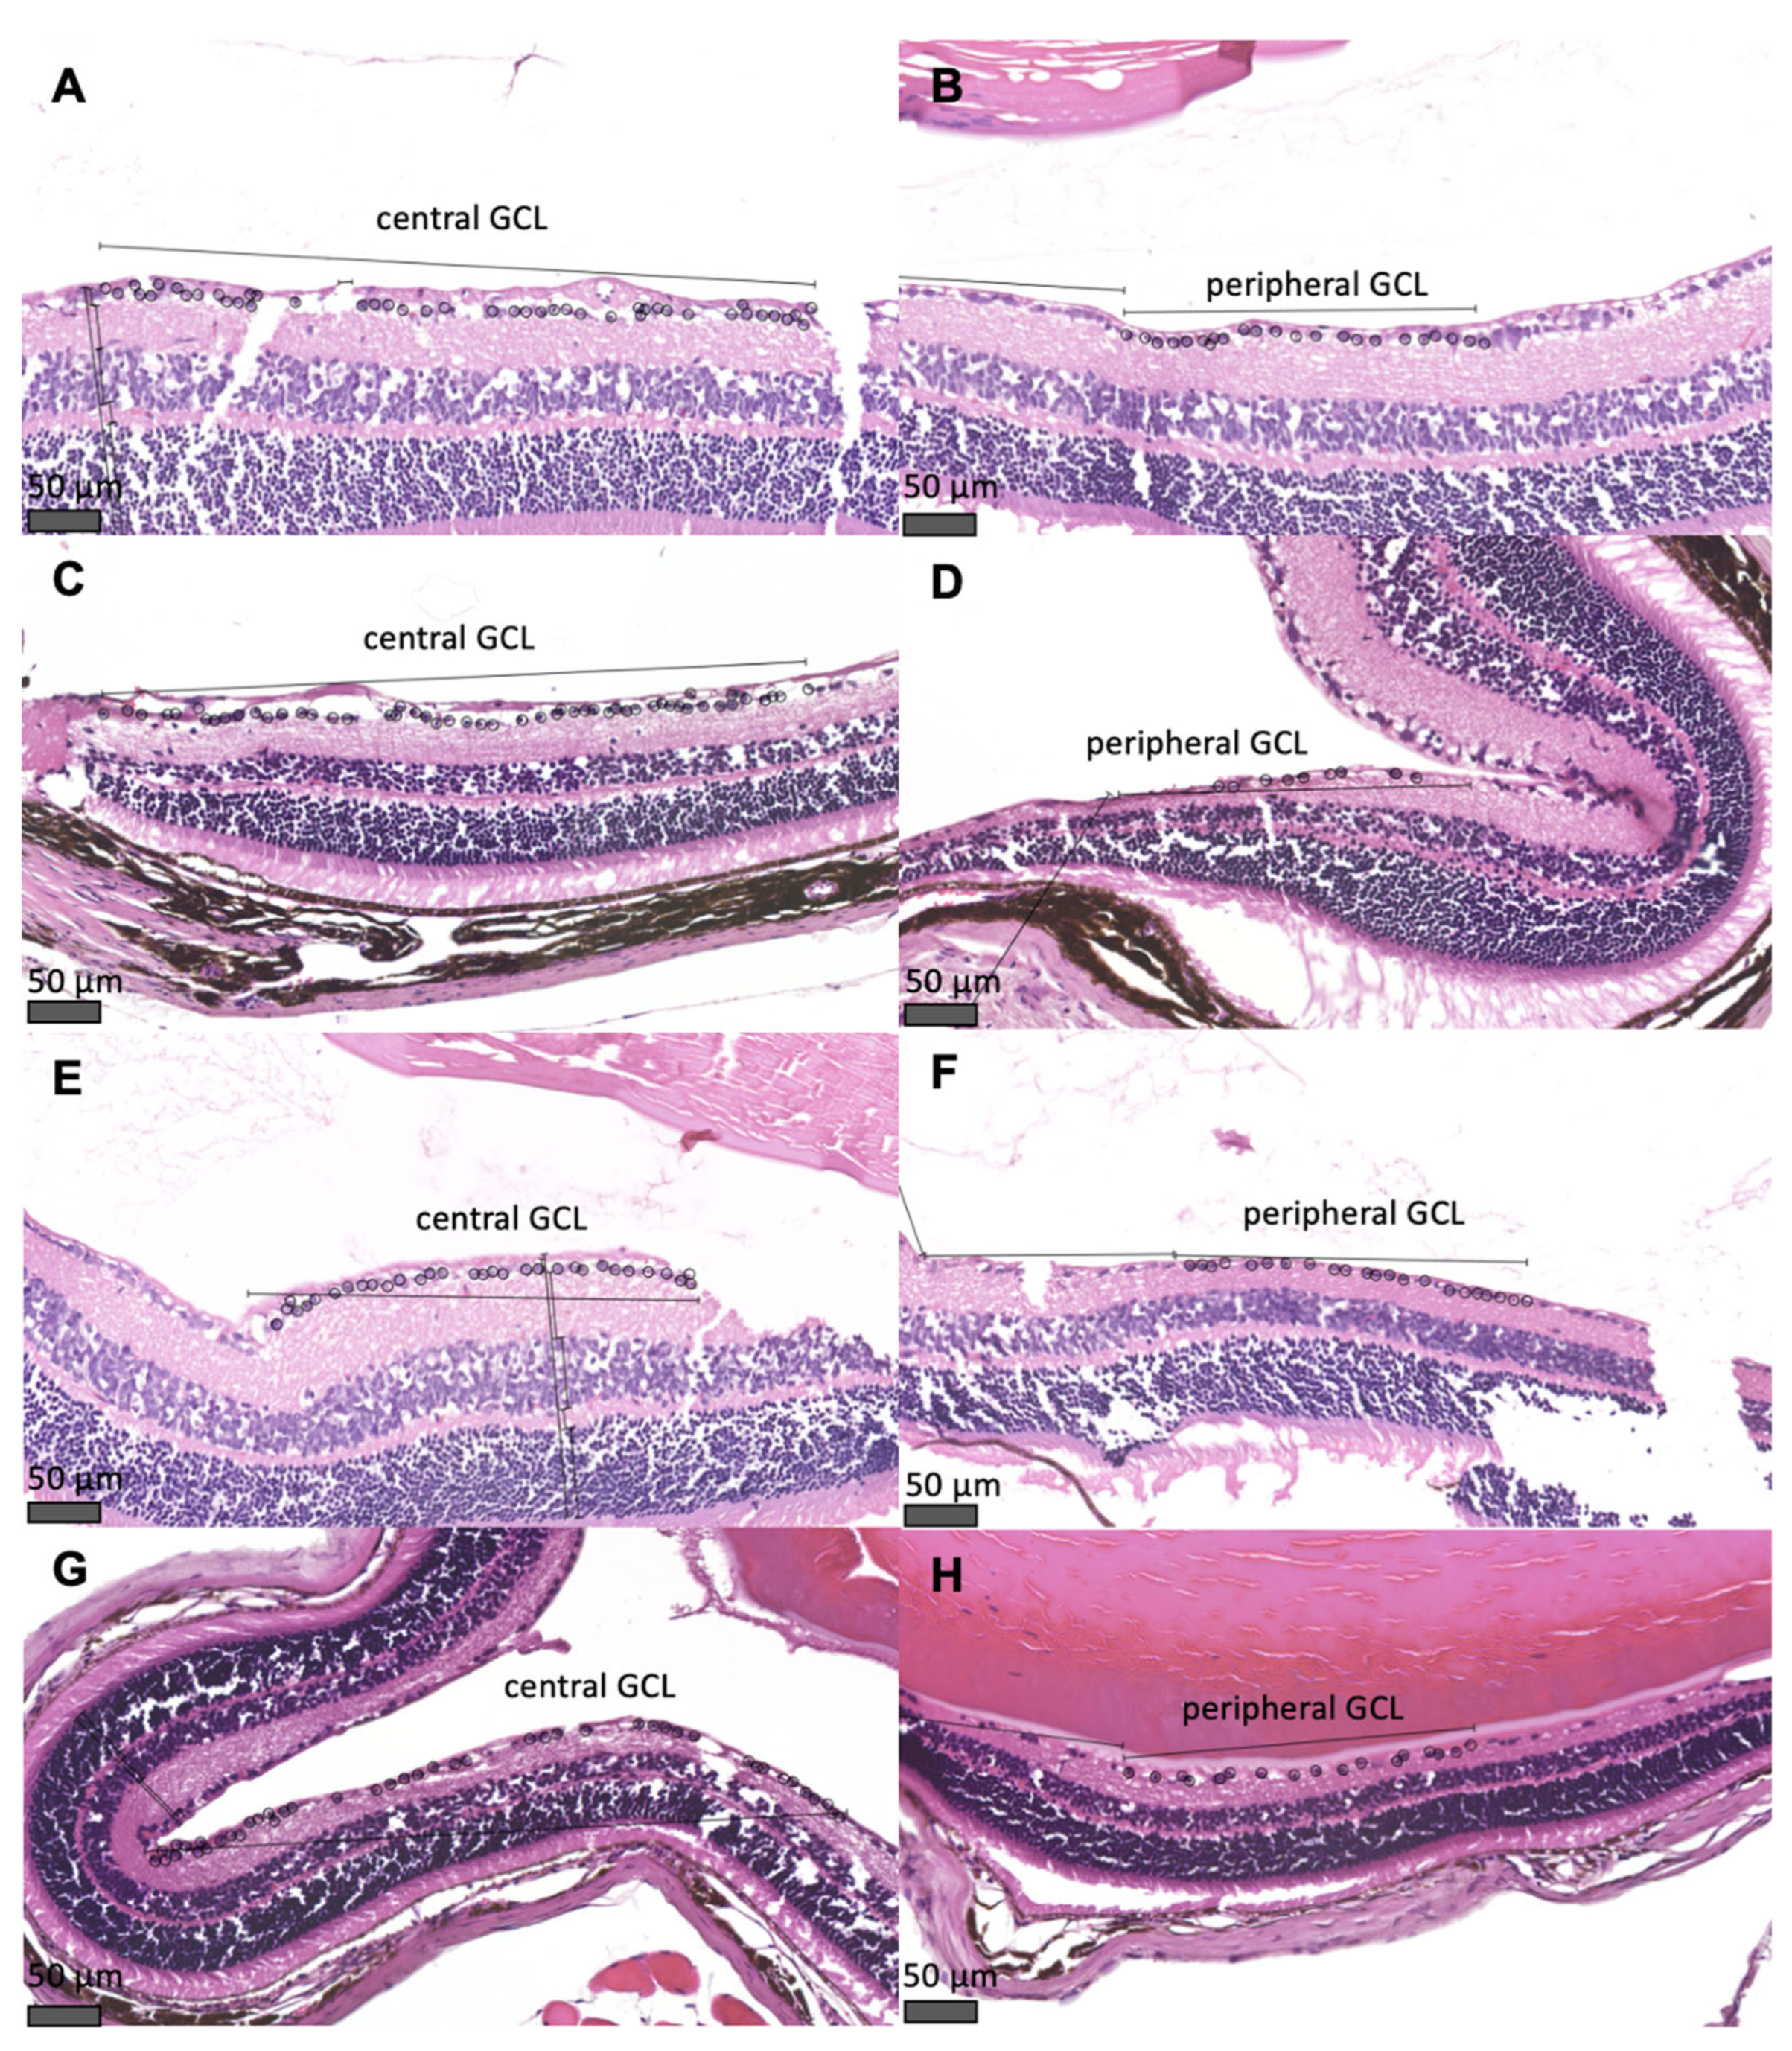
Sections through the mouse retina showing the cells of central and peripheral GCL are shown in Figure 4. In mice with glaucoma (DBA/2_10m_GLAU), a reduced number of cells of both central and peripheral GCL, was observed compared to the group of 44-week-old non-glaucomatous C75Bl/6 mice (cells of central GCL: 36.5 [IQR 30.25 – 40.75] vs. 56.5 [IQR 38 – 74.75], p < 0.001; cells of peripheral GCL: 29 [IQR 20.75 – 32.5] vs. 38 [IQR 34.25 – 42.5], p < 0.001) and compared to the group of 11-week-old pre-glaucomatous DBA/2 mice (cells of central GCL: 36.5 [IQR 30.25 – 40.75] vs. 55.5 [IQR 50.25 – 62], p < 0.001; cells of peripheral GCL: 29 [IQR 20.75 – 32.5] vs. 46.5 [IQR 41.25 – 51], p < 0.001). No differences in the number of cells of GCL were observed between the remaining groups of animals (Figure 2G,H).
4. Discussion
4.1. The Diagnosis of Glaucoma Was Made Based on a Higher IOP and Changes Indicative of Retinal Degeneration
In glaucomatous mice (44-week-old DBA/2), a significant increase in IOP was observed compared to healthy mice (11-week-old pre-glaucomatous mice of the same strain and 44-week-old mice from a strain not prone to glaucoma) (Figure 2A). The average time of glaucoma development in DBA/2 mice is considered to be 7 - 9 months [19,20,21,22], which was also confirmed by our results. Based on regular IOP measurements, a significant increase in IOP was observed from the 30th week (7th month) of life (Figure 1). In addition to the increase in IOP, the mice also suffered a decrease in the number of cells of the GCL, in both the central and peripheral parts of the retina (Figure 2G,H, Figure 4). This indicates damage to the optic nerve (formed by axons of RGCs stemming from the GCL) which, according to the definition proposed by the American Academy of Ophthalmology in 2016, allows for the diagnosis of glaucoma as an optic neuropathy [11]. The diagnosis of glaucoma in DBA/2 mice based on increased IOP and reduced number of cell bodies or axons was also made by Grillo et al. and Inman et al. [23,24].
4.2. Glaucoma Causes Changes in the Structure of the Retina
In glaucomatous mice, a significant decrease in RT and a decrease in the OPL thickness were observed when compared to pre-glaucomatous 11-week-old DBA/2 mice (Figures 2B,D and 3). In the experimental group, there was a change in the thickness of the innermost retinal layers: a decrease in the INL thickness and an increase in the IPL thickness (Figures 2E,F and 3). The change in the thickness of the INL and IPL layers could be related to the aging process of the eye, as it was observed in all 44-week-old mice (both glaucomatous DBA/2 mice and non-glaucomatous C57Bl/6 controls).
A significant decrease in RT indicates the involvement of neurodegenerative processes in the pathogenesis of glaucoma. However, retinal atrophy does not occur symmetrically in all layers. The cells whose apoptosis is believed to cause visual impairment in patients with glaucoma are RGCs, whose bodies form the majority of the GCL layer [25]. However, these cells are the longest cells of the visual pathway, and their fragments build several layers of the retina. RGCs’ dendrites are located in the IPL, where they connect by synapses with bipolar and amacrine cells, whose bodies are located in the INL. RGCs’ axons form the RNFL. Therefore, the assessment of the layers adjacent to the GCL is crucial during research concerning the neurodegenerative processes of the retina in the course of glaucoma [26].
There are few preclinical studies which analyzed the neighbouring retinal cells in DBA/2 mice; however, the results are ambiguous. Meah et al. evaluated the function of amacrine and bipolar cells (whose bodies are located in the INL, and axons form synapses with RGCs in the IPL) in glaucoma in 13 – 16-month-old DBA/2 mice. They used Second Harmonic Generation microscopy to assess single axons of retinal cells. In the course of glaucoma, they did not observe a loss of axons of amacrine or bipolar cells within the IPL [27]. Nickells et al. in their review also drew attention to the influence of glaucoma on the functioning of neighboring retinal cells. They showed that amacrine cells undergo functional changes consisting of a change in the level of expression of neurotransmitters, but there is no reduction in their number in the retina. In photoreceptor cells, especially red and green cones, observed can be the swelling of the cell bodies (located in the ONL), swelling of synaptic terminals (located in the OPL), and a decrease in iodopsin gene expression [28].
More data on changes in individual retinal layers in the course of glaucoma come from studies of the human retina conducted using the optical coherence tomography (OCT) method. Although this test differs significantly in sensitivity and specificity from the histopathological examination, OCT enables imaging of the retina in vivo. OCT studies performed in patients with glaucoma have shown that in the course of the disease, the thickness of the IPL layer is reduced, while the outer layers (ONL, OPL) are not damaged in the disease process. The assessment of the change in the thickness of the INL layer remains controversial, as some researchers report a decrease in its thickness in the course of glaucoma, while others deny this [26,29,30].
5. Conclusions
DBA/2 mice develop hallmark features of glaucoma. Retinal thinning is layer-specific, which highlights the complexity of the neurodegenerative processes associated with the development of the disease. Understanding the sequence of RGC damage, including axonal dysfunction and cell death, is critical for developing targeted neuroprotective therapies aimed at preserving vision in glaucoma patients. This study provides foundational insights into the structural changes associated with glaucoma, with implications for advancing preclinical research and, in the future, therapeutic strategies.
Author Contributions
Conceptualization, E.S., K.K. and A.C-J.; methodology, E.S., K.K., J.D., D.W. and Ł.K.; investigation, E.S., K.K., J.D. and D.W.; resources, K.K., Ł.K. and A.C-J.; data curation, E.S.; writing—original draft preparation, E.S.; writing—review and editing, K.K., J.D., D.W., Ł.K. and A.C-J.; supervision, Ł.K. and A.C-J.; project administration, E.S., K.K., J.D. and A.C-J.; funding acquisition, E.S. All authors have read and agreed to the published version of the manuscript.
Funding
The work was created as part of the project “TIME 2 MUW – didactic excellence as an opportunity for the development of the Medical University of Warsaw” co-financed by the European Social Fund under the Knowledge Education Development Operational Programme for 2014-2020, funding agreement number: POWR.03.05.00-00-Z040/18-00 and as part of a project implemented in the years 2020 to 2022, financed by a subsidy for science, obtained by the Medical University of Warsaw.
Institutional Review Board Statement
The animal study protocol was approved by the II Local Ethical Committee in Warsaw (resolution number WAW2/122/2020, date of approval 28 October 2020).
Data Availability Statement
The data presented in this study is available in the appendix section.
Conflicts of Interest
The authors declare no conflicts of interest.
Abbreviations
The following abbreviations are used in this manuscript:
| GCL | Ganglion cell layer |
| ILM | Inner limiting membrane |
| INL | Inner nuclear layer |
| IPL | Inner plexiform layer |
| IQR | Interquartile range |
| IOP | Intraocular pressure |
| OCT | Optical coherence tomography |
| OLM | Outer limiting membrane |
| ONL | Outer nuclear layer |
| OPL | Outer plexiform layer |
| RGC | Retinal ganglion cells |
| RNFL | Retinal nerve fiber layer |
| RPE | Retinal pigment epithelium |
| RT | Retinal thickness |
Appendix A
Appendix A.1
In the Appendix A.1, we present the data from the statistical analysis.

Table A1.
Descriptive analysis of the assessed parameters.
| Group | IOP [mm Hg] median (IQR) | RT [μm] median (IQR) | ONL/RT median (IQR) | OPL/RT median (IQR) | INL/RT median (IQR) | IPL/RT median (IQR) | Cells of central GCL median (IQR) | Cells of peripheral GCL median (IQR) |
| C57Bl/6_11w | 15 (14 – 17) | 196 (181.75 – 222.5) | 0.35 (0.34 – 0.37) | 0.066 (0.062 – 0.072) | 0.22 (0.21 – 0.23) | 0.23 (0.20 – 0.28) | 54 (47 – 59.75) | 43.5 (39.25 – 46.75) |
| C57Bl/6_44w | 15 (13–17) | 194 (127.25 – 223.75) | 0.34 (0.30 – 0.36) | 0.062 (0.054 – 0.072) | 0.20 (0.18 – 0.21) | 0.27 (0.24 – 0.32) | 56.5 (38 – 74.75) | 38 (34.25 – 42.5) |
| DBA/2_11w | 13 (12 – 14) | 194.5 (180.25 – 242.25) | 0.37 (0.35 – 0.41) | 0.072 (0.062 – 0.078) | 0.23 (0.22 – 0.24) | 0.22 (0.20 – 0.26) | 55.5 (50.25 – 62) | 46.5 (41.25 – 51) |
| DBA/2_44w_GLAU | 17 (16 – 18.75) | 106 (90.1 – 124) | 0.36 (0.33 – 0.39) | 0.061 (0.051 – 0.069) | 0.20 (0.19 – 0.22) | 0.29 (0.24 – 0.32) | 36.5 (30.25 – 40.75) | 29 (20.75 – 32.5) |
| P values of the comparisons between groups | ||||||||
| C57Bl/6_11w vs. C57Bl/6_44w | 0,790 | >0,999 | >0,999 | 0,548 | 0,005 | 0,018 | >0,999 | 0,380 |
| C57Bl/6_11w vs. DBA/2_11w | <0,001 | >0,999 | 0,159 | >0,999 | 0,575 | 0,970 | >0,999 | 0,439 |
| DBA/2_11w vs. DBA/2_44w_GLAU | <0,001 | <0,001 | >0,999 | 0,018 | <0,001 | 0,002 | <0,001 | <0,001 |
| C57Bl/6_44w vs. DBA/2_44w_GLAU | 0,005 | <0,001 | 0,245 | >0,999 | 0,924 | >0,999 | <0,001 | <0,001 |
Abbreviations: IOP –intraocular pressure; RT – retinal thickness; ONL/RT – ratio of outer nuclear layer thickness to retinal thickness; OPL/RT – ratio of outer plexiform layer thickness to retinal thickness; INL/RT – ratio of inner nuclear layer thickness to retinal thickness; IPL/RT – ratio of inner plexiform layer to retinal thickness; GCL – ganglion cell layer; IQR – interquartile range.
References
- Gupta, M.P.; Herzlich, A.A.; Sauer, T.; Chan, C.C. Retinal Anatomy and Pathology. Dev Ophthalmol 2016, 55, 7–17. [Google Scholar] [CrossRef]
- Masland, R.H. Neuronal diversity in the retina. 2001, 11, 431–436. [Google Scholar] [CrossRef]
- Vecino, E.; Rodriguez, F.D.; Ruzafa, N.; Pereiro, X.; Sharma, S.C. Glia-neuron interactions in the mammalian retina. Prog Retin Eye Res 2016, 51, 1–40. [Google Scholar] [CrossRef]
- Boulton, M.; Dayhaw-Barker, P. The role of the retinal pigment epithelium: topographical variation and ageing changes. Eye (Lond) 2001, 15 Pt 3, 384–389. [Google Scholar] [CrossRef]
- Baden, T.; Euler, T.; Berens, P. Understanding the retinal basis of vision across species. Nat Rev Neurosci 2020, 21, 5–20. [Google Scholar] [CrossRef]
- Nguyen-Ba-Charvet, K.T.; Chédotal, A. Development of retinal layers. C R Biol 2014, 337, 153–159. [Google Scholar] [CrossRef]
- Adams, T.; Chernoff, E.; Wilson, J.; Dharmarajan, S. Reactive Muller Glia as Potential Retinal Progenitors. 2013, 10.5772/55150. [Google Scholar] [CrossRef]
- Salman, A.; McClements, M.E.; MacLaren, R.E. Insights on the Regeneration Potential of Müller Glia in the Mammalian Retina. Cells 2021, 10, 1957. [Google Scholar] [CrossRef]
- Allison, K.; Patel, D.; Alabi, O. Epidemiology of Glaucoma: The Past, Present, and Predictions for the Future. Cureus 2020, 12, e11686. [Google Scholar] [CrossRef]
- Stein, J.D.; Khawaja, A.P.; Weizer, J.S. Glaucoma in Adults-Screening, Diagnosis, and Management: A Review. Jama 2021, 325, 164–174. [Google Scholar] [CrossRef]
- Prum, B.E., Jr.; Rosenberg, L.F.; Gedde, S.J.; Mansberger, S.L.; Stein, J.D.; Moroi, S.E.; Herndon, L.W., Jr.; Lim, M.C.; Williams, R.D. Primary Open-Angle Glaucoma Preferred Practice Pattern(®) Guidelines. Ophthalmology 2016, 123, P41–p111. [Google Scholar] [CrossRef]
- Sekhar, G.C. Glaucoma definition: Implications for equitable care. Indian J Ophthalmol 2021, 69, 1025–1026. [Google Scholar] [CrossRef]
- Nickells, R.W.; Howell, G.R.; Soto, I.; John, S.W. Under pressure: cellular and molecular responses during glaucoma, a common neurodegeneration with axonopathy. Annu Rev Neurosci 2012, 35, 153–179. [Google Scholar] [CrossRef]
- Jonas, J.B.; Aung, T.; Bourne, R.R.; Bron, A.M.; Ritch, R.; Panda-Jonas, S. Glaucoma. Lancet 2017, 390, 2183–2193. [Google Scholar] [CrossRef]
- Weinreb, R.N.; Aung, T.; Medeiros, F.A. The pathophysiology and treatment of glaucoma: a review. Jama 2014, 311, 1901–1911. [Google Scholar] [CrossRef]
- Lupinacci, A.P.C.; Barnebey, H.; Netland, P.A. Neuroprotection of Retinal Ganglion Cells. In The Glaucoma Book: A Practical, Evidence-Based Approach to Patient Care, Schacknow, P.N., Samples, J.R., Eds. Springer New York: New York, NY, 2010; pp. 647-650. [CrossRef]
- Pitha, I.; Du, L.; Nguyen, T.D.; Quigley, H. IOP and glaucoma damage: The essential role of optic nerve head and retinal mechanosensors. Prog Retin Eye Res 2024, 99, 101232. [Google Scholar] [CrossRef]
- Sikorska, E.; Wołosz, D.; Kasarełło, K.; Koperski, Ł.; Górnicka, B.; Cudnoch-Jędrzejewska, A. Preparation and Analysis of Histological Slides of Rat and Mouse Eyeballs to Evaluate the Retina. JoVE 2024, e66663. [Google Scholar] [CrossRef]
- McKinnon, S.J.; Schlamp, C.L.; Nickells, R.W. Mouse models of retinal ganglion cell death and glaucoma. Exp Eye Res 2009, 88, 816–824. [Google Scholar] [CrossRef]
- Libby, R.T.; Anderson, M.G.; Pang, I.-H.; Robinson, Z.H.; Savinova, O.V.; Cosma, I.M.; Snow, A.M.Y.; Wilson, L.A.; Smith, R.S.; Clark, A.F.; et al. Inherited glaucoma in DBA/2J mice: Pertinent disease features for studying the neurodegeneration. Visual Neuroscience 2005, 22, 637–648. [Google Scholar] [CrossRef]
- Turner, A.J.; Vander Wall, R.; Gupta, V.; Klistorner, A.; Graham, S.L. DBA/2J mouse model for experimental glaucoma: pitfalls and problems. Clin Exp Ophthalmol 2017, 45, 911–922. [Google Scholar] [CrossRef]
- Johnson, T.V.; Tomarev, S.I. Rodent models of glaucoma. Brain Res Bull 2010, 81, 349–358. [Google Scholar] [CrossRef]
- Inman, D.M.; Sappington, R.M.; Horner, P.J.; Calkins, D.J. Quantitative correlation of optic nerve pathology with ocular pressure and corneal thickness in the DBA/2 mouse model of glaucoma. Invest Ophthalmol Vis Sci 2006, 47, 986–996. [Google Scholar] [CrossRef]
- Grillo, S.L.; Montgomery, C.L.; Johnson, H.M.; Koulen, P. Quantification of Changes in Visual Function During Disease Development in a Mouse Model of Pigmentary Glaucoma. J Glaucoma 2018, 27, 828–841. [Google Scholar] [CrossRef]
- Almasieh, M.; Wilson, A.M.; Morquette, B.; Cueva Vargas, J.L.; Di Polo, A. The molecular basis of retinal ganglion cell death in glaucoma. Prog Retin Eye Res 2012, 31, 152–181. [Google Scholar] [CrossRef]
- Cifuentes-Canorea, P.; Ruiz-Medrano, J.; Gutierrez-Bonet, R.; Peña-Garcia, P.; Saenz-Frances, F.; Garcia-Feijoo, J.; Martinez-de-la-Casa, J.M. Analysis of inner and outer retinal layers using spectral domain optical coherence tomography automated segmentation software in ocular hypertensive and glaucoma patients. PLoS One 2018, 13, e0196112. [Google Scholar] [CrossRef]
- Meah, A.; Boodram, V.; Bucinca-Cupallari, F.; Lim, H. Axonal architecture of the mouse inner retina revealed by second harmonic generation. PNAS Nexus 2022, 1, pgac160. [Google Scholar] [CrossRef]
- Nickells, R.W. Ganglion cell death in glaucoma: from mice to men. Vet Ophthalmol 2007, 10 Suppl 1, 88–94. [Google Scholar] [CrossRef]
- Tong, J.; Phu, J.; Alonso-Caneiro, D.; Khuu, S.K.; Kalloniatis, M. High sampling resolution optical coherence tomography reveals potential concurrent reductions in ganglion cell-inner plexiform and inner nuclear layer thickness but not in outer retinal thickness in glaucoma. Ophthalmic Physiol Opt 2023, 43, 46–63. [Google Scholar] [CrossRef]
- Kim, E.K.; Park, H.L.; Park, C.K. Relationship between Retinal Inner Nuclear Layer Thickness and Severity of Visual Field Loss in Glaucoma. Sci Rep 2017, 7, 5543. [Google Scholar] [CrossRef]
Figure 1.
Mean values of intraocular pressure (IOP) in DBA/2 and C57Bl/6 mice during the experiment.
Figure 1.
Mean values of intraocular pressure (IOP) in DBA/2 and C57Bl/6 mice during the experiment.
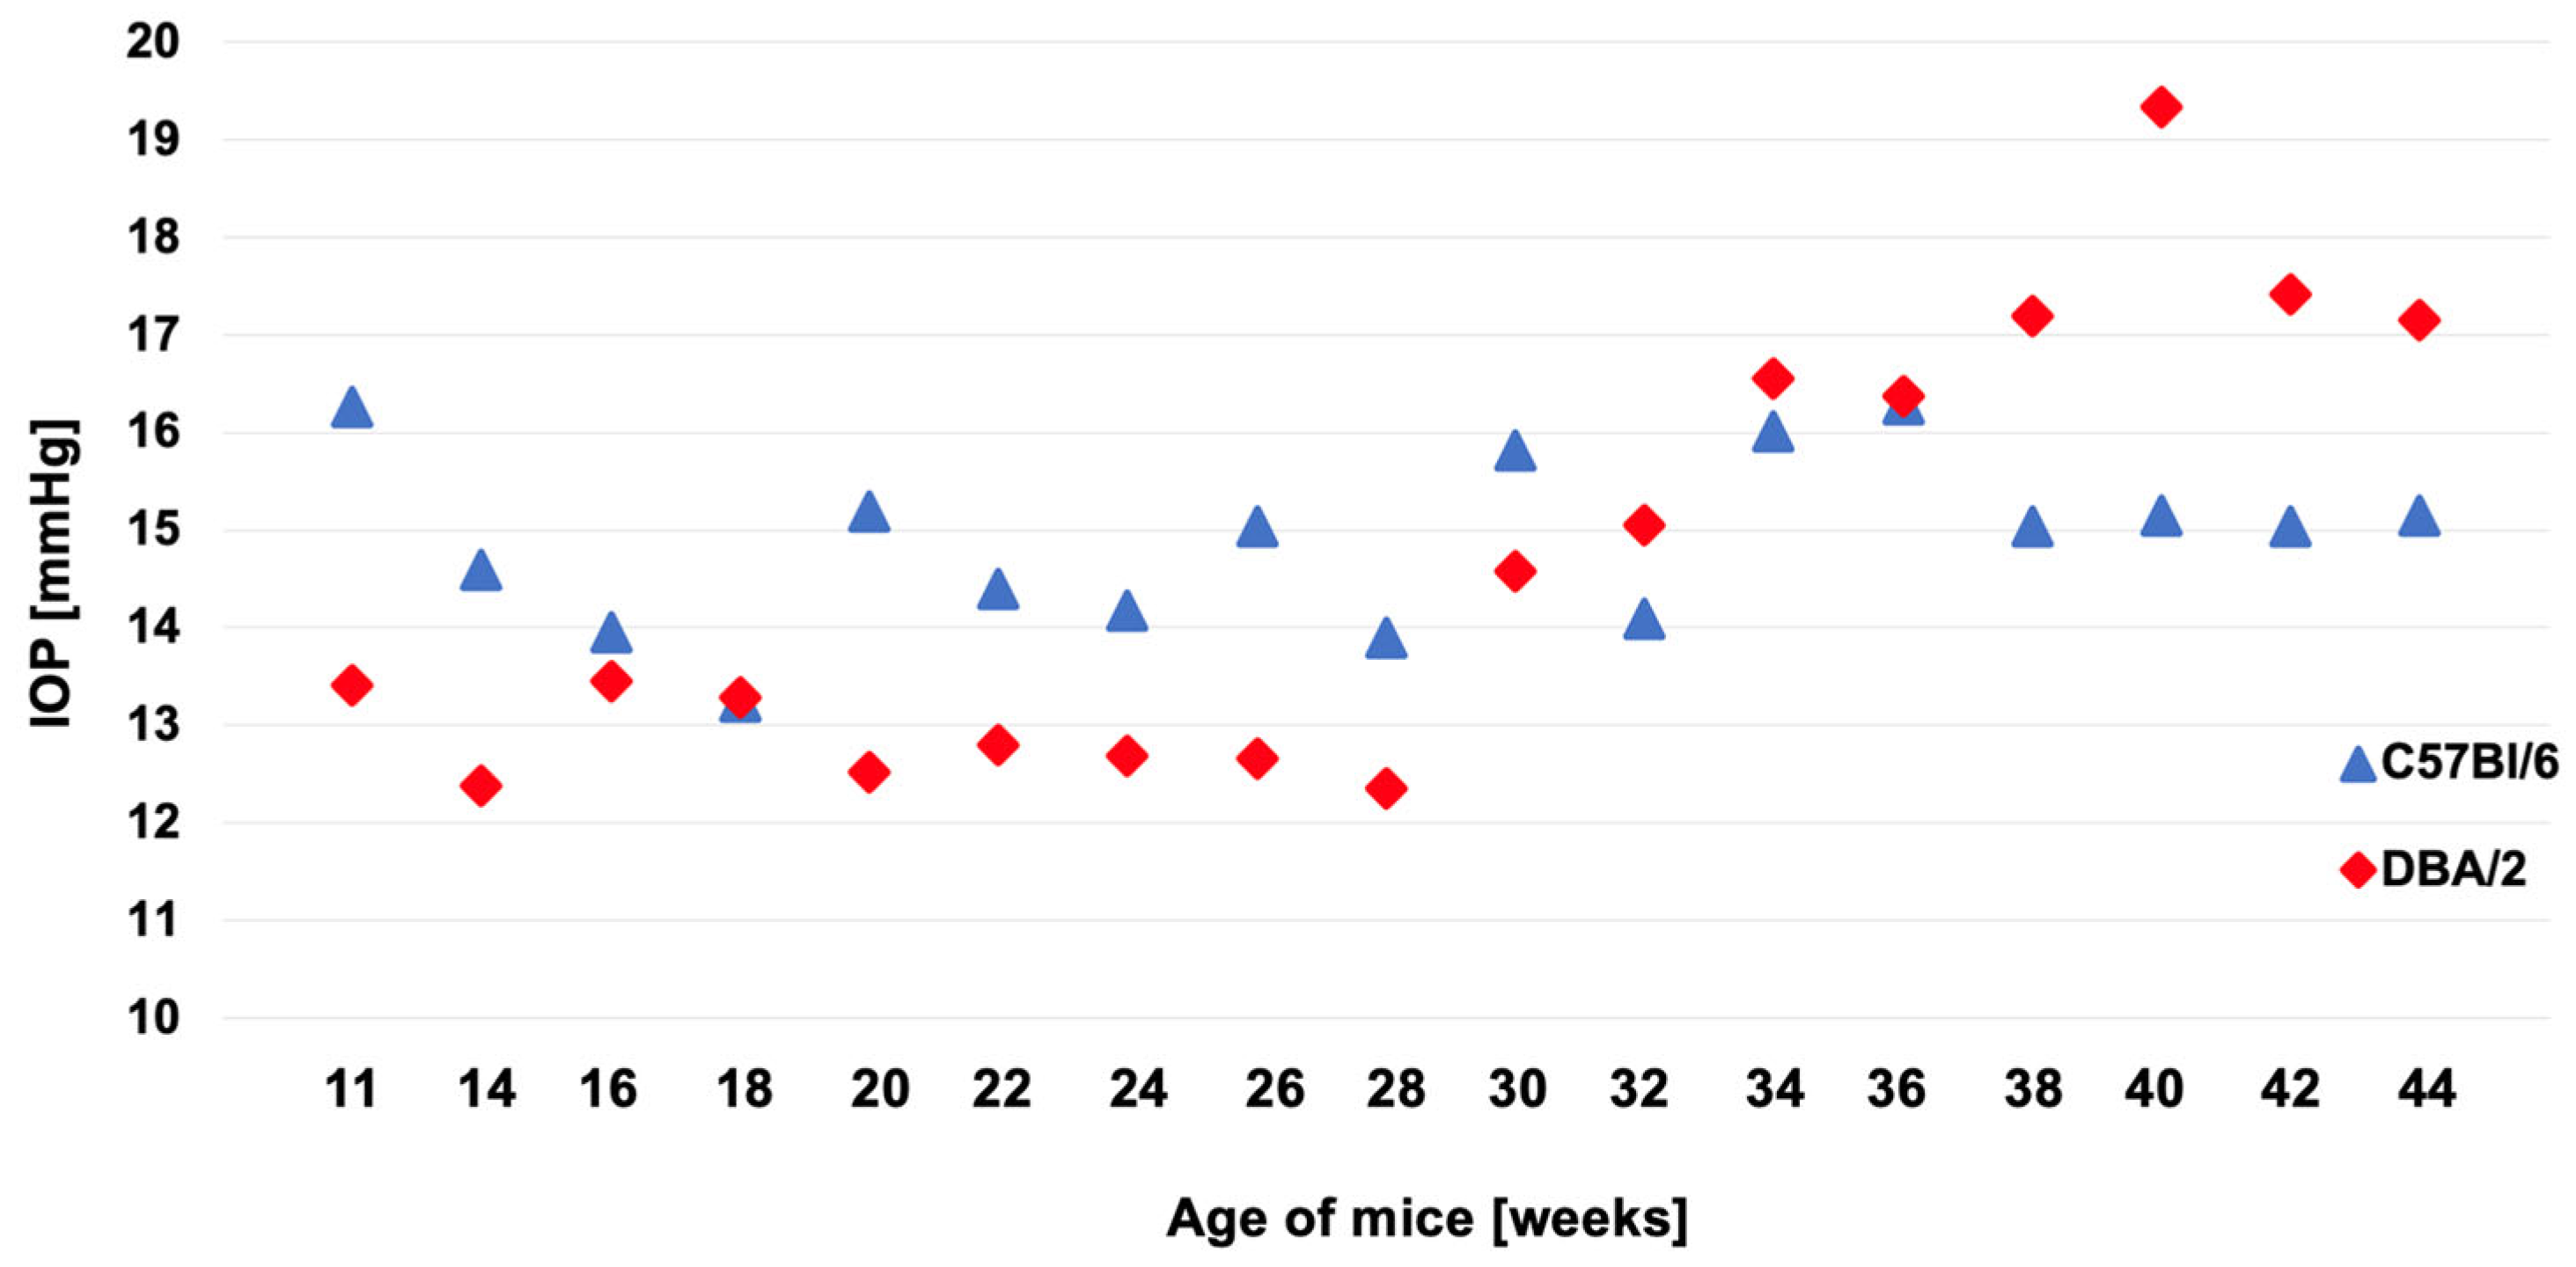
Figure 2.
Values of (A) intraocular pressure (IOP), (B) retinal thickness (RT), (C) thickness of the outer nuclear layer in relation to retinal thickness (ONL/RT), (D) thickness of the outer plexiform layer in relation to retinal thickness (OPL/RT), (E) thickness of the inner nuclear layer in relation to retinal thickness (INL/RT), (F) thickness of the inner plexiform layer in relation to retinal thickness (IPL/RT), (G) number of cells of the central ganglion cell layer (GCL), (H) number of cells of the peripheral ganglion cell layer (GCL) in C57Bl/6 and DBA/2 mice on the day of sacrifice. The box plot shows the median (horizontal line), and the first and third quartiles. Whiskers depict minimum and maximum values. * p < 0.05; ** p < 0.01; *** p < 0.001.
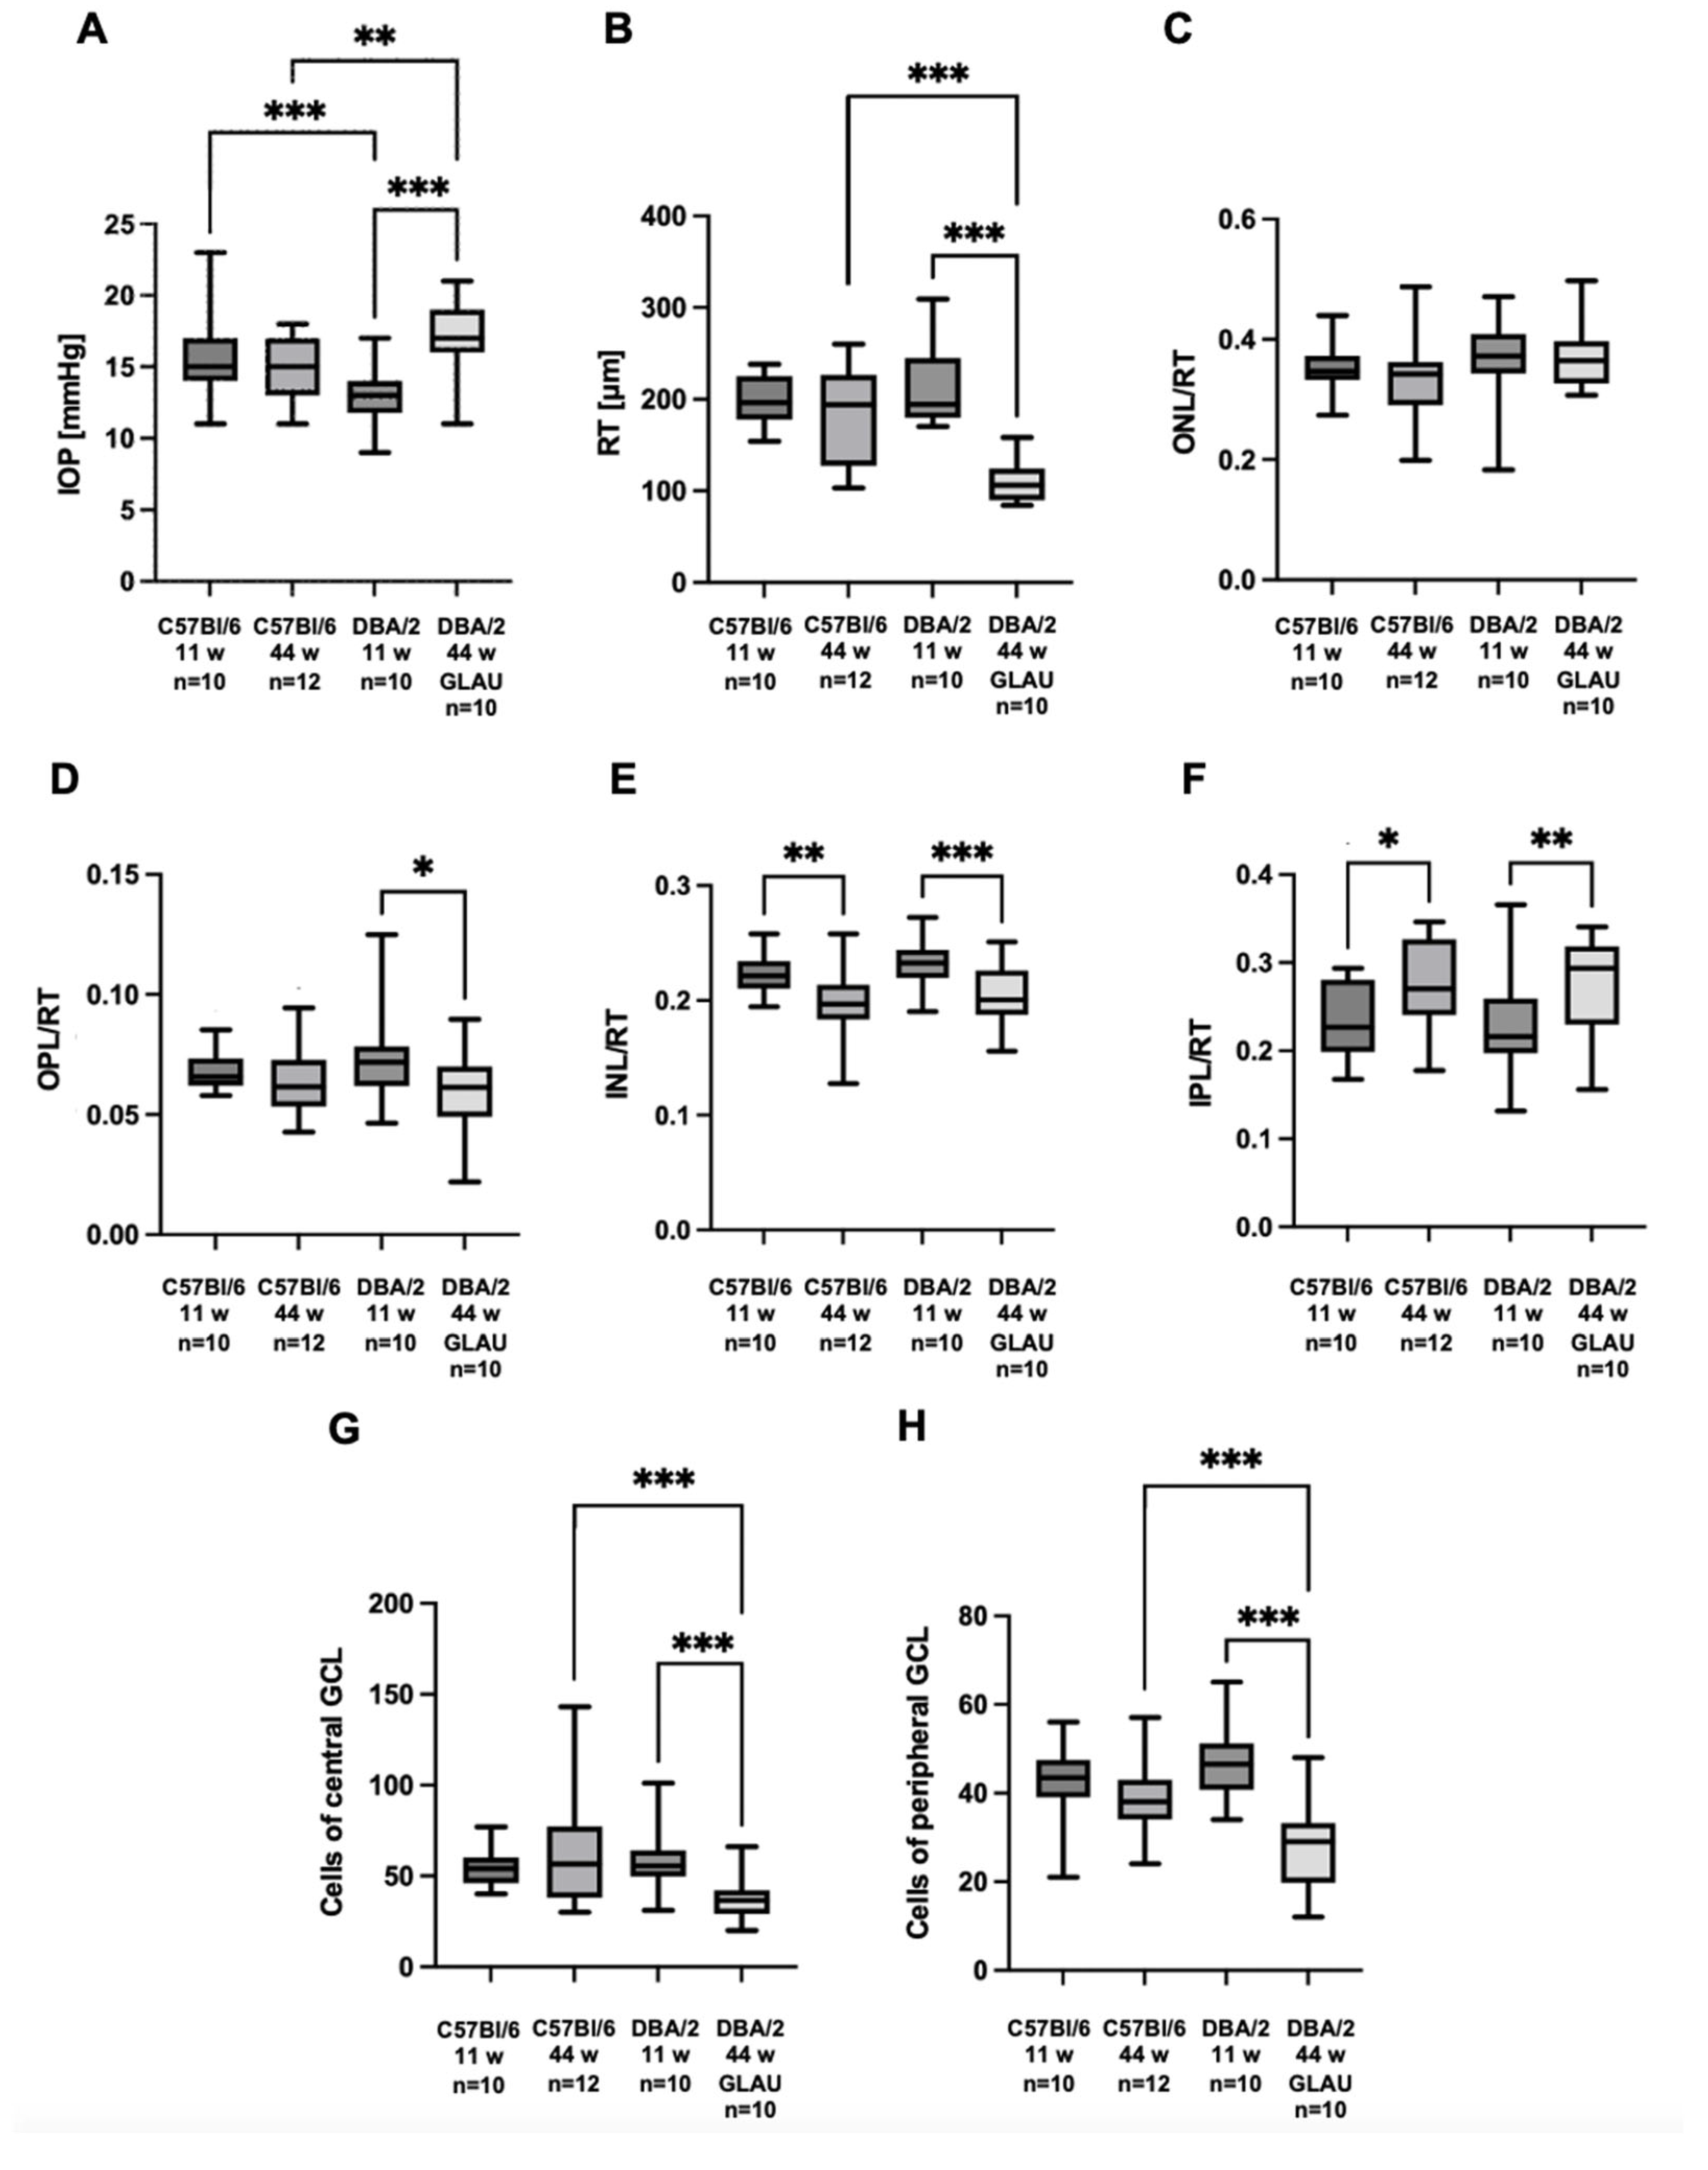
Figure 3.
Exemplary cross-section of the retina of (A) an 11-week-old C57Bl/6 mouse, (B) a 44-week-old C57Bl/6 mouse, (C) an 11-week-old DBA/2 mouse, (D) a 44-week-old DBA/2 mouse with glaucoma. Hematoxylin and eosin staining. RT – retinal thickness; ONL – outer nuclear layer; OPL – outer plexiform layer; INL – inner nuclear layer; IPL – inner plexiform layer. Magnification 200x.
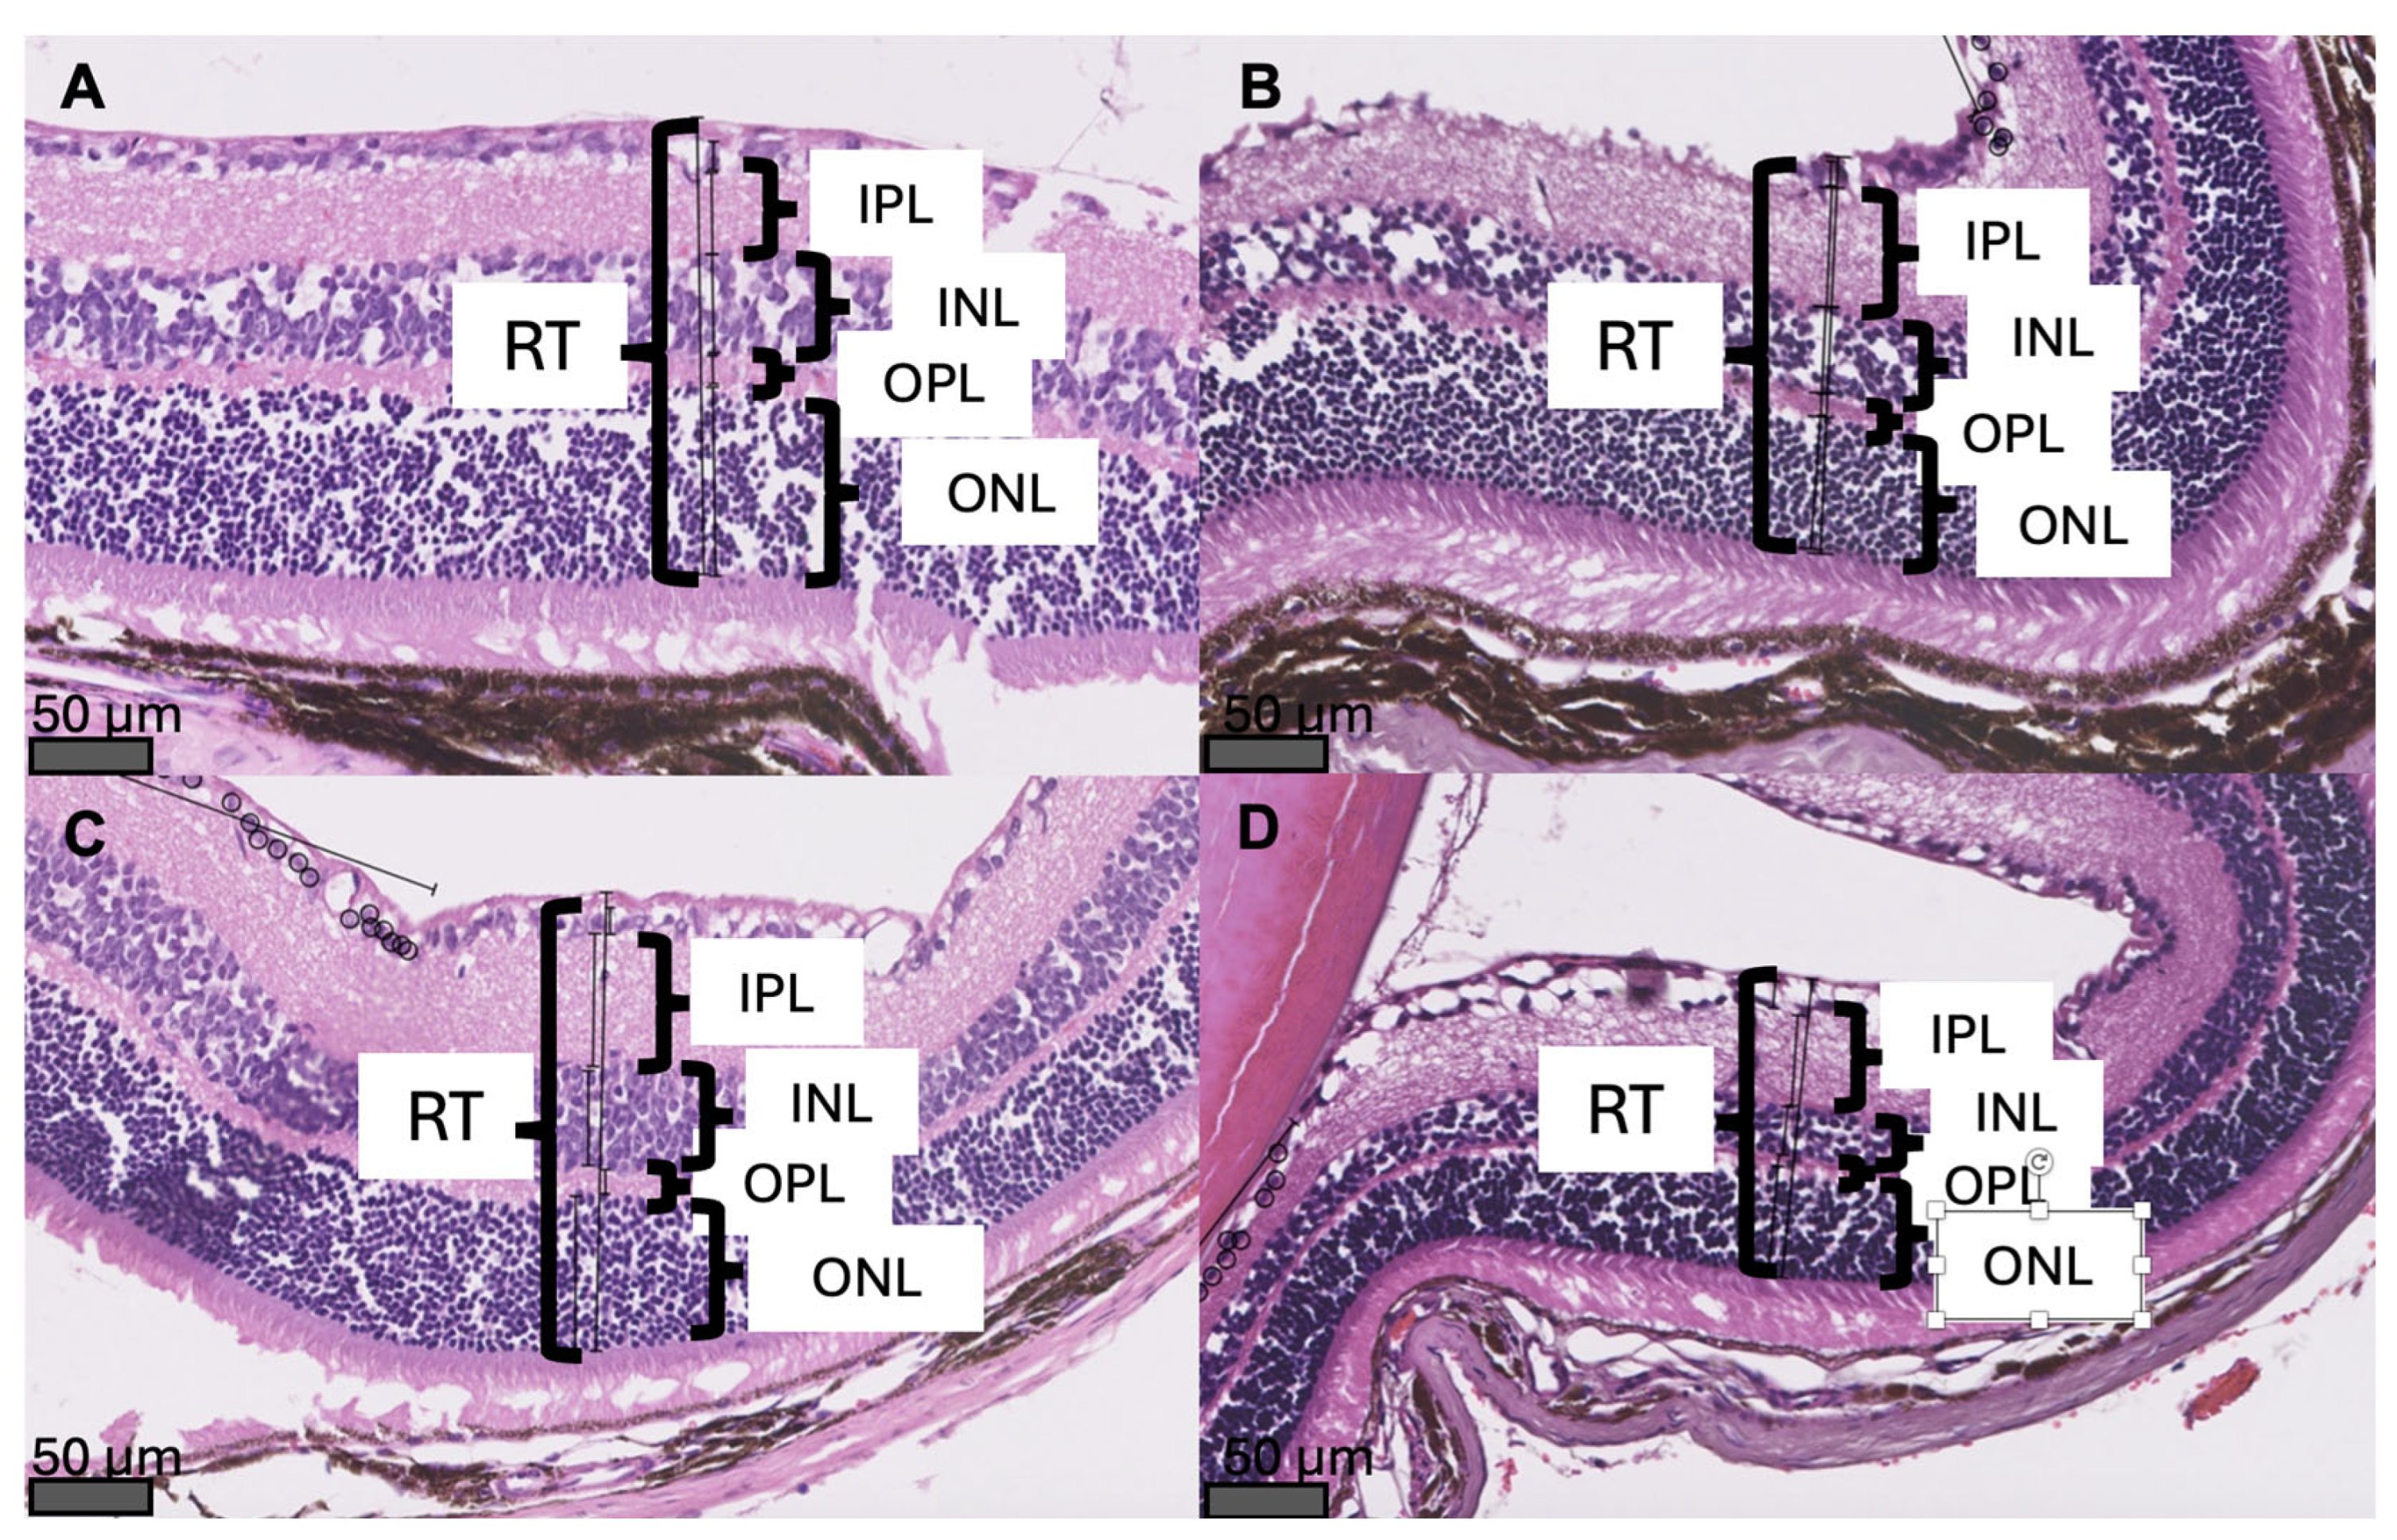
Figure 4.
Exemplary cross-sections of the retina showing (A) cells of central GCL of an 11-week-old C57Bl/6 mouse, (B) cells of peripheral GCL of an 11-week-old C57Bl/6 mouse, (C) cells of central GCL of a 44-week-old C57Bl/6 mouse, (D) cells of peripheral GCL of a 44-week-old C57Bl/6 mouse, (E) cells of central GCL of an 11-week-old DBA/2 mouse, (F) cells of peripheral GCL of an 11-week-old DBA/2 mouse, (G) cells of central GCL of a 44-week-old DBA/2 mouse with glaucoma; (H) cells of peripheral GCL of a 44-week-old DBA/2 mouse with glaucoma. Hematoxylin and eosin staining. Cell bodies are marked with circles. Magnification 200x.
Disclaimer/Publisher’s Note: The statements, opinions and data contained in all publications are solely those of the individual author(s) and contributor(s) and not of MDPI and/or the editor(s). MDPI and/or the editor(s) disclaim responsibility for any injury to people or property resulting from any ideas, methods, instructions or products referred to in the content. |
© 2025 by the authors. Licensee MDPI, Basel, Switzerland. This article is an open access article distributed under the terms and conditions of the Creative Commons Attribution (CC BY) license (http://creativecommons.org/licenses/by/4.0/).
Copyright: This open access article is published under a Creative Commons CC BY 4.0 license, which permit the free download, distribution, and reuse, provided that the author and preprint are cited in any reuse.


