Submitted:
18 October 2025
Posted:
21 October 2025
You are already at the latest version
Abstract
Synthesis of published and new data from Govorov and Kocebu guyots provides geochemical and chronostratigraphic constraints on hydrogenetic cobalt-rich Fe-Mn crusts from the Western Pacific Magellan Seamount Trail (MST). The history of the crusts began about 65–60 Myr ago, when the relict layer R was deposited in the Campanian–Maastrichtian and Late Paleocene along the shores of guyots. The growth of the old-generation crusts continued in the Late Paleocene–Early Eocene (Layer I-1) and in the Middle–Late Eocene (Layer I-2) in a shallow-water shelf environment. The younger layers of crusts formed in the Late Oligocene–Early Miocene (Layer I-2b), Miocene (Layer II), and Pliocene–Pleistocene (Layer III) at depths about the present sealevel. The precipitation of Fe and Mn oxyhydroxides from seawater was interrupted by several episodes of dissolution, the longest one between the old and young layers of Fe-Mn crusts (from 38 to 26.5 Ma). Fe and Mn oxyhydroxides in the crusts were affected by two global events of phosphogenesis in the Pacific: Late Eocene–Early Oligocene, from 43 to 39 Ma (Layers R, I-1, I-2) and Late Oligocene–Early Miocene, from 27 to 21 Ma (Layer I-2b). The trace element patterns in different layers of the Fe-Mn crusts are grouped using factor analysis of principal components (varimax raw) into four factors: (1) + (all REEs except Ce and La); (2) +(Ce, La, Ba, Mo, Sr, Pb); (3) +(Zr, Hf, Nb, Rb, As)/-Pb; (4) +(U, Th, Co, As, Sb, W)/-Y. The factor score diagrams highlight fields which are especially contrasting for Layers I-1, I-2 and II+III according to factors 2 and 4. Consistent REE and Y variations in Layers I-2b→II →III of the crust from Pallada Guyot correlate with gradual ocean deepening between the Late Oligocene–Early Miocene and Present when the MST guyots were submerging. Large variations in trace element contents across coeval layers may be due to hydrodynamics of currents on the guyot surfaces. Furthermore, the geochemistry of the crusts bears effects from repeated episodes of Cenozoic volcanism in the MST region of the Pacific Plate. Higher contents of Nb, Zr, As, Sb, and W in the younger layers II and III may result from large-scale volcanism, including Miocene eruptions of petit-spot volcanoes.
Keywords:
Cobalt-rich Fe-Mn crusts
; geochemistry
; chronostratigraphy
; biostratigraphy
; calcareous nannofossils
; Govorov
; Kocebu and Pallada guyots
; Magellan Seamount Trail
1. Introduction
Cobalt-rich ferromanganese crusts on guyots and seamounts are attractive exploration targets having significant mineral potential, including critical metals and other valuable elements (Co, Ni, Cu, Mn, Zr, Mo, W, REEs and Y, etc.) [1,2,3,4,5,6,7,8]. The Magellan Seamount Trail in the Pacific Ocean, one of best documented exploration regions, comprises seventeen flat-topped guyots and several relatively small seamounts with peak-like summits. The names of the MST guyots were approved by the IHO-IOC GEBCO Gazetteer of Undersea Feature Names (available online at http://www.ngdc.noaa.gov/gazetteer/) and are recommended for use in all relevant publications. Many of the guyots were named after Russian scientists who contributed a lot into the research of oceans as a whole and Fe-Mn crusts or nodules in particular (I.N. Govorov, N.S. Skornyakova, V.M. Gordin, V.I. Il’ichev, K.N. Fedorov, I.S. Gramberg, L.K. Zatonsky, M.E. Melnikov, and E.L. Shkolnik), and sea explorers I.I. Butakov and O.E. Kocebu. The names of four guyots refer to Russian ships: frigate Pallada, most noted for studies of the Far East, as well as modern research vessels Pegas, Vulkanolog, and Gelendzhik used in numerous cruises over the MST region.
Main results, including geological and geophysical maps of the region, lithology, mineralogy, and chemistry of volcanic rocks and Fe-Mn crusts are available at http://guyot.ocean.ru, in technical reports of JSC Yuzhmorgeologiya, and in a number of publications [9,10,11,12,13,14,15,16,17,18,19,20,21]. Cobalt-rich Fe-Mn crusts (Fe-Mn crusts or crusts hereafter) in many MST guyots have been largely documented in terms of occurrence, stratigraphy, zoning, mineralogy, and chemistry in the course of cruises by teams from Russia, China, South Korea, Japan, and other countries. Exploration for crusts in Govorov, Kocebu, Alba, and Vulkanolog guyots (scale 1:50 000) has been carried out by JSC Yuzhmorgeologiya surveys since 2015 on contract with the International Seabed Authority, https://isa.org.jm/exploration-contracts/cobalt-rich-ferromanganese-crusts/.
The ~1200 km long Magellan Seamount Trail (MST) comprises Govorov, Skornyakova, Gordin, Vulkanolog, Kocebu, Alba, Il’ichev, Shkolnik, Pegas, Pallada, and Melnikov guyots in the northwestern flank and Fedorov, Ita Mai Tai, Gelendzhik, Gramberg, Zatonsky, Butakov, and Arirang guyots in the southeast (Figure 1). The bases of the volcanic edifices lie at sea depths from 5100–5300 m in the northwest to 5500–5900 m in the southeast of MST. Many guyots are extended with small satellite edifices and numerous offshoots. Their flat summit plateaus reach depths from 1400–1600 m to 2000–2600 m below the sealevel. The guyots are composed of Cretaceous alkali-basaltic and volcaniclastic rocks [9,10,11]. Events of Cenozoic volcanic activity in the Pacific Plate produced multiple volcanic cones and domes rising above the summit plateaus of Govorov, Albа, Kocebu and other guyots [12,13,18,19]. For example, Cenozoic eruption products found on Alba Guyot include basanites and tuffs of Miocene petit-spot volcanoes [14,20,21]. The guyot summit plateaus occurred at shallow sea depths till the latest Eocene and submerged to about the present bathymetric level in Oligocene–Miocene–Pliocene time [9,10,11,12]. Co-rich Fe-Mn crusts precipitated on hard rock substrates along the periphery of the summit plateaus and slopes till the 3000–3500 m sea depths but are absent from sediment-covered low-angle slopes deeper than 3500 m. The thickness of the crusts varies from 14–15 cm in the northwestern MST guyots to 20–25 cm in the southeastern guyots. The thickest crusts (up to 40 cm) were reported from Ita Mai Tai Guyot [22].
1.1. Morphology and Mineralogy of Fe-Mn Crusts
The structure, texture, and mineralogy features of the MST hydrogenetic Co-rich Fe-Mn crusts were detailed in multiple Russian publications [9,10,11,12,22,23,24,25,26,27,28,29,30,31,32].
Few crust samples (23%) contain fragments of the mosaic laminated relict layer (R) containing numerous microinclusions and round inclusions of carbonate fluorapatite (CFA) near the top. The layer is crosscut by 5–8 mm veinlets with phosphate or argillic fill (Figure 2).
The complete sections of most crusts begin with a dense black laminated layer (I-1) of 90 to 220 quasi-parallel laminas per 1 cm. The ore material is bluish black on the cleavage plane, with diamond luster, conchoidal fracture, and occasionally with flaky jointing. The space between laminas, as well as numerous 0.01–0.3 mm (rarely up to 1–2 mm) thick crosscutting veinlets, are filled with whitish or yellowish CFA aggregate bearing phosphatized nannofossils and foraminifers.
The basal layer is overlain by Layer I-2, which is similar to Layer I-1 in the degree of ore alteration but is poorer in CFA. The layer looks mottled due to a combination of black columns, Fe-Mn globules, and CFA inclusions. Locally, some 1–3 cm fragments show blind jointing. The boundary with Layer I-1 below is commonly smooth but is sometimes sharp. Layers I-1 and I-2 are discordant in some sections.
Layer II has a radiated-columnar structure, with roughly parallel columns of Fe and Mn oxyhydroxides perpendicular to the layer boundaries, branching in the upper part, and argillic material in the interstitial space. Porous zones bear a gravel mixture of small rock and mineral grain clasts, foraminifers, and calcareous nannoplankton. The layer encloses carbonate-clayey and carbonate-phosphate lenses in the bottom part. Layers II-1 and II-2 are sometimes clearly distinguishable. The boundary with the underlying Layer I-2 is sharp, often with an angular unconformity.
The uppermost Layer III has a heterogeneous general appearance, a massive structure, and a variable thickness. Its brownish-black color is due to fine ochreous particles disseminated among the black ore material. The boundary between Layers III and II may be either very sharp or smooth. Fe and Mn oxyhydroxides in Layers II and III bear no evident signatures of postdepositional alteration.
Thus, the complete section of Fe-Mn crusts from the MST guyots comprises five units: R (rarely found) → I-1 → I-2 → II → III. However, most of the sections are reduced to fewer layers (I-1 → II → III; I-2 → II → III; II → III), and often to single Layer III few cm thick (more than 50% of all related crust fields on the guyot surfaces).
The mineralogy of the crusts is rather uniform [9,10,11,22,30,31,32,33] and consists of two dominant ore-forming components and various phases occurring in minor amounts. The main phases are poorly crystalline Fe-vernadite (δ-MnO2) and X-ray amorphous Mn-bearing iron oxyhydroxide with a feroxyhyte (δ-FeOOH) structure in all layers. Other phases include buserite, asbolane-buserite, todorokite (10Å phase), birnessite (7Å phase), pyrolusite, romanechite, iron hydroxides (goethite, akaganeite, lepidocrocite, hematite), lithiophorite, Ca-psilomelane (rancieite), and other rarer phases.
The mineralogy of the oldest relict layer R differs markedly from that of the younger layers in the presence of asbolane (or asbolane-buserite with abundant asbolane wads), disseminated goethite, as well as lesser percentages of Fe-vernadite, feroxyhyte, ferrihydrite, and ubiquitous todorokite.
Non-metallic phases are unevenly distributed across the crusts: mainly CFA enclosing <1 µm sized cerianite, parisite, monazite, bastnaesite, barite, and other phases in Layers I-1, I-2, while Layer II contains inclusions or aggregates of montmorillonite-illite, chlorite, zeolites (phillipsite or rarely heulandite and analcime), detrital plagioclase, K-Na feldspar, clinopyroxene (diopside-hedenbergite), and amphibole (hastingsite, tremolite). Different layers bear inclusions of biogenic calcite, veinlets or inclusions of abiogenic calcite and rarely aragonite, siderite, and dolomite, as well as abundant quartz in Layer III.
1.2. Formation History of Fe-Mn Crusts
The history and ages of layers in the complete section of MST Fe-Mn crusts (Figure 2) were reconstructed from index species of calcareous nannoplankton, as well as identified foraminifers, radiolarians, and macrofossils (molluscs and corals) with reference to the stratigraphy of guyots and main paleogeographic events in the ocean from the Late Cretaceous to the Cenozoic [9,10,11,12,23,24,25,26,27,28,29].
The oldest relict Layer R was deposited in the Campanian–Maastrichtian (sublayer Ra) and Paleocene (sublayer Rb), in shallow water near the shore, probably within the photic zone. The precipitation continued in the Late Paleocene-Early Eocene, in a relatively shallow shelf environment, at sea depths <500–600 m (Layer I-1), and in the Middle–Late Eocene (Layer I-2). Layer II was deposited in the Late Oligocene–Miocene at sea depths of 1200–3000 m, close to the present sealevel, while Layer III formed in Pliocene–Pleistocene time.
Thin layers and pores in the ore component of old layers R, I-1, and I-2 are filled with phosphatized biogenic carbonate partly replaced by CFA. The crusts became enriched with phosphorus and crystallized CFA after the deposition of old layers during the Late Eocene–Early Oligocene (43–39, with a peak at 37 Ma) and Late Oligocene–Early Miocene (27–21 Ma) global events of phosphogenesis in the Pacific [34]. The phosphogenic reactions mobilized and redistributed minor and trace elements between Fe-Mn oxyhydroxides and phosphate matter and induced crystallization of СFA, REE carriers, asbolane-buserite, and other phases [11,35,36,37,38]).
The stages of precipitation and growth in the history of the Fe-Mn crusts were interrupted by local paleoceanographic events: (1) partial dissolution of previously deposited layers under global and regional changes in the compositions, redox conditions, and physical parameters of seawater; (2) hydrodynamic changes in currents on the guyot surfaces; (3) sediment deposition; (4) volcaniclastic deposition during episodes of volcanic activity. The longest gap (up to 12-14 Мyr) separated the old (R, I-1, I-2) and young (II, III) generations of the crust layers (Figure 2).
Many MST guyots and seamounts in the Pacific tropical latitudes share the features of morphology, mineralogy, and formation history of hydrogenetic Fe-Mn crusts [26,27,28,29], which is evidence of extensive Late Cretaceous–Cenozoic precipitation of Fe and Mn oxyhydroxides from seawater over a large territory of the equatorial Pacific for at least 60–65 Мyr. As an example, Figure 3 shows identified index species of calcareous nannofossils in two crusts from Butakov and Lomilik (Marshall Islands) guyots, after [29]. Unlike the section of Figure 2, these sections include Late Oligocene–Early Miocene Layer I-2b.
1.3. Geochemistry of Minor and Trace Element of Hydrogenetic Fe-Mn Crusts: Main Features
The most often invoked model explains the formation of Fe-Mn crusts by precipitation of Fe and Mn oxyhydroxides incorporating Co, Ni, Cu, Mo, W, REE, Y, and other elements directly from seawater [1,2,3,4,5,6,7,8,9,10,11,33]. The distribution of Mn and Fe in seawater is controlled by its major-ion chemistry, pH, and contents of dissolved oxygen, organic matter, and carbon dioxide. Phytoplankton and skeletal organic material accumulate Co, Mn, Ni, and other metals till depths of 500 m [4,43]. The consumption of oxygen by organic matter produces an oxygen minimum zone (OMZ) at bathymetric levels of 500–800 m, below which the concentration of dissolved oxygen gradually increases. Decomposition of organic matter in the OMZ sub-reducing environment elevates dissolved Mn, whereas the greater depths beneath the OMZ provide favorable conditions for precipitation of Fe and Mn oxyhydroxides onto exposed rock surfaces of seamounts [43,44,45]. Mn phases interacting with bottom waters sorb positively charged dissolved metals and complexes, whereas negatively and/or zero charged ions are sorbed onto Fe phases [6,46]. Comparison of trace element patterns of different phases in hydrogenetic Co-rich Fe–Mn crusts from the central Pacific and Atlantic regions shows that Co, Ni, Zn, Ba, Li, and Tl are mainly sequestered by the Mn component, while the Fe component accumulates Cu, Pb, Hg, Be, Sc, Ti, Zr, Hf, Nb, Ta, Bi, In, Sn, Te, Th, Cr, As, Se, Mo, and W; the residual aluminosilicate component in phosphatized layers containing abundant CFA is enriched in Y, Bi, Pb, and Se [46].
Much of the previous work on the Co-rich Fe-Mn crusts focused on their bulk chemistry, especially the patterns of main valuable metals (Mn, Fe, Co, Ni, Cu) and associated trace elements. The geochemistry of crusts as a whole is controlled by the relative contributions of the constituent layers that contain, in varying proportions, Fe and Mn oxyhydroxides (Fe-vernadite, feroxyhyte, etc.), CFA, aluminosilicates, and a residual biogenic carbonate phase. The Fe-Mn ore matrix and accessory phases partition elements selectively [33,46]: Fe and Mn oxyhydroxides sequester REEs, Y, Cu, Zn, and V; Fe-vernadite accumulates Co, Zn, Ni, Mg, Ba, and Tl; feroxyhyte hosts As, Bi, Cu, Cr, Mo, Nb, Pb, Te, Ti, Th, W, and Zr; aluminosilicates bear Si, Al, K, Ti, Cr, Mg, Fe, Na, Sc, and Rb; CFA is a carrier of P, Ca, CO₂, Sr, and Y; and biogenic carbonate contains Ba, Sr, Ce, Cu, V, Ca, and Mg. The most comprehensive datasets on the chemical compositions of Fe-Mn crusts and nodules from different oceanic regions were presented in [3,4,5,44]. They include mean concentrations of major and trace elements and metals in hydrogenetic Co-rich Fe-Mn crusts from three Pacific regions (North Pacific Prime Zone, including the Magellan Seamounts, Non-Prime North Pacific, and South Pacific) determined from sets of 70 to 362 analyses [5,44].
The concentrations of trace elements in the bulk samples of MST Fe-Mn crusts estimated previously by the team of JSC Yuzhmorgeologiya [22] are: <1 ppm for Ta, Cs, Ag, Pt; 1–10 ppm for ∑REE, Rb, Be, Sc, Se, Cd, Sn, Hf; 10–100 ppm for LREE, Nb, Sb, W, U, Th, Cr, Ga, Te, Bi; 100–1000 ppm for Ce, La, Nd, Y, Zn, Mo, Zr, As, Tl; and >1000 ppm for Ce, Pb, Sr, and Ba. Other data represent the average bulk composition of Fe-Mn crusts [47]: the mean contents of Mn, Fe, Co, Ni, Cu, REE, and Y in crusts from Govorov, Il’ichev, Kocebu, Pegas, Alba, Pallada, Fedorov, Gramberg, Ita Mai Tai, Gelendzhik, and Butakov guyots, as well as the mean contents of Fe, Mn, Co, Ni, Cu, P₂O₅, Mo, TiO₂, Zn, Cu, REE, and Y in layers I-1, I-2, II, and III of the crusts.
The Fe-Mn crusts from Pallada, Gramberg, Ita Mai Tai, Gelendzhik, and Butakov guyots were reported to share some geochemical features [22]. The relict layer R is highly heterogeneous due to abundant carbonate-phosphate material and often shows abnormally high Cu, Ni, Ba, Sr, Cr, Sc, Li, Zn, Hf, and Th concentrations. Layer I has the highest enrichment in Ce, Pb, Sr, Ba, Mo, Te, and Bi, as well as La, Zn, and Th on some guyots. Layer I-2 has the lowest overall trace element contents but is characterized by high Y, Cr, Sc, and Zr. The trace element distribution in Layer II is poorly consistent, with elevated Rb, Cs, Li, Zr, Sb, Nb, and Zn but low Sr and Bi. Layer III is enriched in As, Tl, and W while being depleted in Ba and Zn.
The geochemistry and mineralogy of separate layers of the crusts sampled on Ita Mai Tai, Gelendzhik [48,49], Govorov, Vulkanolog, Kocebu [50,51,52], Gordin, Pegas [53], Pallada [54,55], and Shkolnik [56] guyots have been studied in more or less detail.
In this review we synthesize dispersed data on the geochemistry and chronostratigraphy of MST Co-rich Fe-Mn crusts. The compositions of several crust samples from Govorov and Kocebu guyots are detailed and compared with a crust sample from Pallada Guyot [55], as well as, analytical results from earlier publications and technical reports of JSC Yuzhmorgeologiya on contents of minor and trace elements in the MST crusts. The review addresses geochemical features, element correlations, Co-chronometry, growth rates, ages, and the history of crust layers precipitated on the MST guyots.
2. Geological Background of Govorov and Kocebu Guyots
Govorov Guyot is the largest in the MST, with its 190×180 km base lying along the 4700 m isobath, a trapezium-shaped main body with 70–90 km sides, and a 79×53 km flat top [12,18,19,50,51] (Figure 4a).
The main edifice is extended with two satellites oriented in the southwestern and southeastern directions and large offshoots in the south and northeast. The slopes of the main edifice dip at 4–8° to 25°; the northern and northeast slopes are shallower (10–15°) than the western and eastern slopes until the 4500 m depth. The northeastern edge and flat top are delineated by a chain of volcanic cones up to 100 m high with 0.6–2.5 km base diameters [13]. The main guyot edifice and its satellites are composed mostly of volcanic rocks. The rocks exposed on slopes are fine to boulder-size lava and tuff clasts, hyaloclastics, pillow lavas, or lava flows with columnar jointing. Eroded volcanic and sedimentary rocks affected by seawater alteration are cemented with calcareous coccolith-foraminiferal material and form so-called edaphogenic breccias. The volcanic rocks reach thicknesses of ~1700–1800 m on the southwestern slope and up to 2900 m on the northeastern slope. The summit platform and low-angle slopes of the guyot are locally covered by Aptian to Pliocene carbonate sediments [9,12,19]. The surfaces swept from unconsolidated sediments, mainly along the top edge to sea depths of 2200–2400 m, are paved with Co-rich Fe-Mn crusts, from 0.7 to 14.5 cm thick, with occasional occurrences of Fe-Mn nodules.
Kocebu Guyot consists of two (western and eastern) flat-topped edifices of 115×95 km and ~10000 km2 total size (Figure 4b). The two summit platforms are separated by a saddle at 3500–3700 m below the sealevel, while the pedestals of the main edifices reach water depths of 5100–5500 m [9,12,52]. The eastern edifice sits upon a 42×41 km (~ 1000 km2) triangular base and has a 20×16.5 km (~180 km2) summit platform 1200–1400 m under the water. The western edifice is larger (55×52 km or ~1400 km2) and has several offshoots. Both edifices have convex-concave transversal profiles and steep slopes (20–25°) till water depths of 2300–3000 m. Volcanic eruptions produced more than 200 small cones and domes (0.5–1.5 km across and 50–100 m high) upon the slopes and offshoots of the guyot while carbonate deposition left remnants of a lagoonal coral reef with lenses of stratified sediments on the tops.
The Co-rich Fe-Mn crusts of Govorov and Kocebu guyots precipitated upon Late Cretaceous and Early Paleogene bioclastic limestones, edaphogenic breccias, volcanic, and volcaniclastic rocks. All crusts bear Fe-vernadite and Mn-feroxyhyte as main minerals in all layers. Layers I-1 and I-2, and less often layer II, contain asbolane-buserite and CFA. The distribution, textures, structures, and mineralogy of the Govorov and Kocebu Fe-Mn crusts (including those from dredging sites 08D106, 08D115, 14MTP01 and 14D77, Figure 4), were described in detail previously [50,51,52].
3. Materials and Methods
3.1. Sampling
Cobalt-rich Fe-Mn crusts were retrieved by dredging and coring of shallow boreholes in the course of cruises by JSC Yuzhmorgeologiya. The most representative samples of crusts were separated from the volcanic, volcaniclastic, and sedimentary substrate, in bulky pieces of >10 kg. Samples of layers were cut out from the thickest crusts with a diamond saw. Note, however, that thus obtained samples may bear fragments of transition zones between layers rather than being representative of a single layer. The samples were kept in muffle furnaces at 105°C at least 24 hours and then crushed, quartered, and ground.
The Fe-Mn crusts used for this study were dredged from Govorov and Kocebu guyots during the cruises of R/V Gelendzhik (JSC Yuzhmorgeologiya) in 2016–2017 (Figure 4, coordinates of dredging sites and 30 crust layer sample numbers are provided in Table 1 for 9 crust sections). Samples of Govorov crusts were selected in the eastern part of the main edifice (08D106, 08D108), as well as on the summit plateau and slopes of its satellite southeast of the main edifice (08D115, 08D114), and 08D118-3. The Kocebu crusts were collected on the slopes of the western edifice (14D53, 14MTP01, 14MTP02) and near the edge of the eastern edifice (14D77-2).
3.2. XRF and ICP-MS Chemistry of Fe-Mn Crusts
The samples of hydrogenetic Co-rich Fe-Mn crusts from Govorov and Kocebu guyots were analyzed for bulk chemistry at the Center for Isotope-Geochemical Studies of the Vinogradov Institute of Geochemistry, Siberian Branch of the Russian Academy of Sciences (IGC SB RAS, Irkutsk) by several methods: XRF on a Bruker AXS S4 Pioneer wavelength dispersive X-ray fluorescence spectrometer using glass fusion discs (for SiO2, TiO2, MgO, Fe2O3 tot, MnO tot, CaO, K2O, Na2O, P2O5, LOI, Ba, Sr, Zr, V, Co, Ni, Cu, and Zn). Minor and trace elements (Co, Ni, V, Cu, Sb, W, Mo, Zn, Be, Rb, Ba, Th, U, Nb, Ta, Pb, Ga, As, REE and Y) were determined by mass spectrometry with inductively coupled plasma (ICP-MS) after acid digestion of samples, on an Agilent NexION 300D quadrupole mass spectrometer. The quality of XRF and ICP-MS analyses was checked against local standards CDO-4, CDO-5, CDO-6 [57] and USGS international standard AGV-2.
The data were processed statistically using the Statistica 10 software (StatSoft). The correlation coefficients were used to calculate matrices for the chemical data to measure the strength of linear relationship between pairs of variables. Statistical significance is quoted at the 95% confidence level. Element relationships were constrained by factor analysis of principal components (varimax raw) to identify groups of major and trace elements. REE and Y plots were normalized to the respective contents in the Post-Archean Australian Shale (PAAS) [58]. The Ce anomaly was calculated as Ce* = 2Ce/(La + Pr) for PAAS-normalized values.
4. Results
The XRF data revealed major and minor element patterns of Co-rich Fe-Mn crusts from nine sampled sections in Govorov and Kocebu guyots (Figure 5, Table A1 and Table A2 in Appendix A), which were compared with data on a crust from Pallada Guyot [55].
Samples from all layers show relatively high LOI of 12-15 wt.% (presumably due to atmospheric moisture adsorbed on the ground ore material) and quite large ranges of major oxides: 12-29 wt% Fe2O3 tot, 22-35 wt% MnO tot, 3.4-20 wt% CaO, 1-9.4 wt% P2O5, at modest amounts of TiO2 (1-2 wt%), MgO (1.3-2 wt%), Na2O (1.6-2.5 wt%), and K2O (0.3-1.2 wt%). The highest concentrations of Ca and P were measured in phosphatized layers (I-1 and I-2). The excess of Fe over Mn increases from layer I-1 to layer III, while the Mn/Fe ratio decreases from 3-2.5 to 1.5-0.8. Layers II and III in all crusts show SiO2 and Al2O3 enrichment due to the presence of silicate phases (quartz, feldspars, etc.). The crust from Pallada Guyot contains 1.5-3.2 wt% SiO2 and displays minor variations of the Mn/Fe ratio (1.7-1.9) in the average compositions of layers I-2, I-2b, II and III (Figure 5).
4.1. Contributions of Layers to the Bulk Composition
Evaluating the mineral potential of Co-rich Fe-Mn crusts and their viability as commercial resources of metals requires data on chemistry of the crusts as a whole and their individual layers. Sampling during the cruises of JSC Yuzhmorgeologiya commonly includes several procedures: measuring the average thicknesses of crusts and their layers, estimating physical parameters (density, moisture content, porosity, etc.), and analyzing major, minor and trace elements in bulk crust or less often layer samples. The contribution (weigth fractions, wt%) of layers to the bulk crust composition is hard to estimate from their linear sizes. Such calculations are made with regard to the density of layers varying from ~2.1 g/cm3 in Layer I-1 to ~1.9 g/cm3 in Layer III [9] and can yield only approximate estimates because the crusts have complex cross-sectional structure even within single large samples (Figure 6). The problem was solved using mass-balance calculations of major oxide contents (Table 2), for each layer relative to the bulk composition of crusts from Govorov (08D106, 08D115) and Kocebu (14D77-2, 14D53) guyots and statistical data.
The calculations were performed with the minimum values of the statistical parameter ∑ΔX2 (sum of square residuals of the initial and calculated oxide contents using the least squares method) for different sets of major oxides (SiO2, TiO2, Al2O3, Fe2O3, MgO, MnO, CaO, Na2O, K2O, and P2O5, Table A1 and Table A2 in Appendix A). The mass-balance estimates showed that Layer III contributed 47 and 53 wt% into the bulk crust composition of samples 08D106 and 08D115, respectively, at ∑ΔX2 = 0.19 and 0.27 (Table 2). These contributions are 2.3 and 1.3 times higher than the estimates based on the average thickness of layer III: 20% for 08D106 and 42% for 08D115. The large discrepancy may result from variability of layer thicknesses, as in samples 08D106 and 14D77-2 (Figure 6). Note also that the layer compositions can be estimated from small crust fragments selected in laboratory, which allows relating metals to specific layers more precisely.
4.2. Minor and Trace Element Chemistry
4.2.1. High-Tech Metals (Co, Ni and Cu), Ba, Sr, Pb, Zn, V, Mo, Zr, Nb, W, Sb, and As
The concentrations of Co and Ni vary from 4000 to 7200 ppm and from 3000 to 8700 ppm, respectively, across the crusts from Kocebu, Govorov and Pallada guyots (Figure 7; Table A3 and Table A4 in Appendix A). There is no evident correlation between the two elements: the amount of Co is the highest (8694 ppm) in Layer III from sample 08D118-3 but is the lowest (as well as Ni) in the same layer of other crust samples where it mostly occurs in Layers II or I-2. The crust from Pallada Guyot contains the lowest amount of Co and Ni in Layers I-2b and II, while Layers I-2 and III show the greatest enrichment in both elements. The Cu contents range from 700 to 2500 ppm being the highest in Layer II and lower in Layer III of the Govorov and Kocebu samples, and decrease progressively in the series I-2 → I-2b → II → III in the crust from Pallada Guyot. In all sections, Layer I-1 typically shows the highest enrichment in Ba and Sr and sometimes in Zn and Mo. Layer III bears As in most of the samples while Layer II (II-1 and II-2) is enriched in Zr, Nb, and Sb, and occasionally W.
4.2.2. REE and Y
The abundances of REE and Y in the Co-rich Fe-Mn crusts from Kocebu and Govorov guyots vary in large ranges and show consistent variations in separate layers (Figure 8 and Figure 9; Table A3 and Table A4 in Appendix A). The sum REE and Y decreases from 3546–2360 ррm in Layers I-1 and I-2 to 2188–1312 ppm in II, while Ce accounts for <60% of this sum. Cerium is especially high in Layer I-1 (1354 ppm to 2177 ppm in samples 14D77-2 and 14MTP01, respectively) where it contributes 50–61% to REE+Y, but its concentration and contribution in Layer III are much lower: 535–612 ppm and 48-38%, respectively. The abundances of Y, La, and Gd likewise decrease from I-1 to III but less markedly than for Ce (Figure 8).
Other REEs (Pr, Nd, Sm, Eu, Tb, Dy, Ho, Er, Tm, Yb, and Lu) have irregular patterns, either decreasing (08D115, 08D106, 08D118-3, 14D77-2, 14D53) or increasing (08D114, 14MTP02) within small intervals. The crust from Pallada Guyot shows a decreasing trend of Ce and REE+Y from early to younger layers, while other REEs and Y become progressively higher in the series I-2b → II → III (Figure 8).
The PAAS-normalized REE+Y patterns of crusts from Govorov and Kocebu guyots are marked by a positive Ce anomaly, with its magnitude (Ce*) decreasing gradually toward younger layers (Figure 9; Table A3 and Table A4 in Appendix A). The Y anomaly is positive in Layers I-1 and I-2 but negative in II and III.
5. Discussion
5.1. Average Chemistry of Bulk Crusts and Individual Layers
The bulk chemistry of Co-rich Fe-Mn crusts from the MST guyots was characterized using 309 to 803 XRF, mass spectrometry, and ICP-MS analyzes obtained before 2009 [47], as well as statistical data (mean, median, minimum and maximum values and variance) for 276 ICP-MS analyses for minor and trace elements complied from technical reports of JSC Yuzhmorgeologiya before 2017 and our nonpublished data on Govorov and Kocebu guyots (Table A5 in Appendix A). The mean contents of elements estimated by different methods and in different time intervals are generally consistent, with discrepancy of < 20–25%. The concentrations of main valuable elements vary in large ranges (percentages in brackets are variance): 2700–9000 ррm Co (19%), 1200–6700 ppm Ni (19%), 520–2113 ppm Cu (21%), 140–600 ppm Mo (19%), 320–801 ppm Zn (19%), 352–1700 ppm Pb (21%), 92–260 ppm As (17%), and 1006–3228 ppm REE+Y (21%). Most of elements show quasi-normal distribution patterns at variance from 9 to 40%. The concentrations of Cr, Li, Be, Cs, Ta, Zr, and Hf have the highest variance and lognormal distribution. The discrepancy between the mean and median values is the most prominent for Cr (16.5 and 11 ppm, 277%), Zr (231 and 120 ppm, 106%) and Hf (3 and 1.8 ppm, 94%) (Table A5 in Appendix A).
The chemistry of crusts as a whole depends on the contributions (weight fractions) of the constituent layers (Table 2) which may have different geochemical characteristics. This inference agrees with poor correlations among elements revealed by the factor analysis of principal components (varimax raw) for 276 ICP-MS analyses. Only REE and several pairs of trace elements have high correlation coefficients with r > 0.7 at 95% confidence level: Zr–Hf (r = 0.92), Zr–Ta (r = 0.78), Rb–Cs (r = 0.78), Zn–Sr (r = 0.77), Sb–Sn (r = 0.73), Nb–Sb (r = 0.72), and W–Tl (r = 0.72) (Supplementary Table S1). The correlation between these elements is obviously independent of the relative contributions of layer compositions to the whole-crust chemistry.
The data used to characterize the minor- and trace element compositions of the Fe-Mn crusts in this study included 118 ICP-MS analyses for Layers III, II, I-2, and I-1 in the crusts from Govorov and Kocebu guyots (Table A3 and Table A4 in Appendix A) complemented with analyses from earlier publications [47,48,50,51,52] and technical reports of JSC Yuzhmorgeologiya. The data were processed statistically to estimate mean concentrations and variance for major elements and mean, median, maximum, minimum, and variance values for minor and trace elements (Table A6 and Table A7, Appendix A). High variance (>50 %) at nearly lognormal distribution was observed for Cr, Li, Cs, Rb, Ta, Pb, Zr, Hf and Ga in Layer III (31 analyses); Cr, Li, Be, Cs, Rb, Ta, Zr, Hf and Ga in Layer II (33 analyses); Cr, Sb, Cs, Rb, Th, Nb, Ta, Zr and Hf in Layer I-2 (25 analyses); Cr, Sc, Li, Be, Rb, Cs, Ta, Zr and Hf in Layer I-1 (29 analyses). The mean ratio Mn/Fe decreases slightly from 1.85-1.68 in the old unit (Layers I-1, I-2) to 1.35-1.34 in the younger units (II, III). Layers I-1 and I-2 contain the highest concentrations of P but are depleted in Ti. The values of mean, median, maximum and minimum contents, REE+Y, L/HREE, and positive Ce anomaly (Ce*) vary markedly from layer to layer.
The variations of mean REE, Y, minor and trace elements in separate layers of the analyzed Fe-Mn crusts were plotted in a diagram of element contents normalized to the average composition of crusts from the Non-Prime North Pacific Zone, N-PNPZ [5,44]. Layers I-1 and I-2 are enriched in Ba, Sr, Pb, Mo, Bi, Te and depleted in Co, Cr, Sb, W, Li, Cs, Zr, Hf, Ga, As and Cd (Figure 10a,b), while Layer II stores the highest concentrations of Ni, Cu, Sn, Sb, W, Tl, Li, Cs, Rb, Nb, Zr, and Hf. Layer III contains more As, Ni, Ga and less Cu, Zn, and Te compared to other layers. The contents of Y are the highest in Layers I-1 and I-2, while Ce is the highest in Layer I-1 and the lowest in Layer III. Layer I-2 is depleted in Pr, Nd, Sm and Eu, while Layer II shows the lowest total of Ho, Er, Tm, Yb and Lu REEs.
The PAAS-normalized REE and Y patterns of separate layers are typical of hydrogenetic crusts, with a positive Ce anomaly (Ce*) decreasing from I-1 to III (Figure 10c).
The (Ni+Co+Cu)–Mn–Fe and (Zr+Y+Ce)–(Fe+Mn)/4–(Co+Ni)×15 and Ce*–(Y/Ho)sn diagrams used for classification of Fe-Mn crusts confirm the hydrogenetic origin of the analyzed layers (Figure 11a,b). The phosphatized layers (I-1, I-2) are enriched in Y and plot isolated fields in the Сe*–(Y/Ho)sn and Сe*–Nd diagrams (Figure 11c,d).
The complex geochemical characteristics of crust layers were grouped using the factor analysis of principal components (varimax raw) applied to a statistical sample of 118 analyses for 34 elements (Co, Ni, Cu, Sb, W, Mo, Zn, Be, Rb, Ba, Sr, Th, U, Nb, Pb, Zr, Hf, Ga, As, REE and Y), as well as the values of Сe*, the sums of LREE, HREE, REE+Y and the L/HREE ratio. The concentrations of Cr, V, Sc, Sn, Tl, Li, Bi, Cd and Te were not included because they remain non determined in many analyses. The strongest factor (1) which accounts for 34.7 % of total variance encompasses all REEs except Ce and La (Figure 12). Other second to fourth strongest factors with loadings >0.5-0.6 outline three more groups of elements: +(Ce, La, Ba, Mo, Sr, Pb), 16.6% of variance (factor 2); +(Zr, Hf, Nb, Rb, As)/-Pb, 13.9% of variance (factor 3), and +(U, Th, Co, As, Sb, W)/-Y, 7.5% of variance (factor 4).
According to factor 1 scores, the layers are compositionally similar, with close ranges of all REEs (Pr, Nd, Sm, Eu, Tb, Dy, Ho, Er, Tm, Yb, and Lu) except Ce and La. Factor 2 scores define the field of Layer I-1 with well pronounced correlations of Ce, Ce*, La, LREE, L/HREE, Ba, Mo, Sr, and Pb. Factor 3 corresponds to slightly elevated concentrations of Zr, Hf, Nb, Rb, As and high correlation between these elements in some compositions of Layers II and III. The lowest factor 4 scores are assigned to Layer I-2, with strong negative correlation between Y and the group U, Th, Co, As, Sb, W. Thus, the factor scores highlight composition fields, which are especially distinctive for Layers I-1, I-2 and II+III according to factors 2 and 4 (Figure 12).
5.2. Correlations Among Elements
Pairwise correlations of some elements and oxides demonstrate main features of difference between the old (I-1, I-2) and young (II, III) layers of the sampled Fe-Mn crusts (Figure 13, Figure 14 and Figure 15). Correlation is the strongest in the pairs CaO and P2O5 (r = 0.99), Zr and Hf (r = 0.96), Rb and Cs (r = 0.97), and is quite high for Rb–Li (r = 0.84) and Li–Cs (r = 0.85), both in bulk crust compositions and in data for separate layers; most of REEs correlate at r = 0.6–0.8. Among other trace elements, only Ba, Nb, and Bi show high correlations (r ≥ 0.7) with Ce, La, LREE, REE+Y, Zr, Hf, and As: Ba–La (r = 0.84), Ba–LREE (r = 0.85), Ba-Ce (r = 0.73), Nb-Sb (r = 0.81), Nb–Hf (r = 0.73), Nb–Zr (r = 0.70); Nb–As (r = 0.67); Bi–Ce (r = 0.85), Bi–LREE (r = 0.80), and Bi–(REE+Y) (r = 0.80) (Supplementary Table S2).
The strongest correlation relationships for the compositions of crusts as a whole and their separate layers are detailed below.
5.2.1. CaO and P2O5
Variations of CaO and P2O5 were studied in Fe-Mn crusts from four guyots: Govorov and Kocebu, this study (Table A1 and Table A2 in Appendix A), Ita Mai Tai [63] and Pallada [55]. The concentrations of CaO and P2O5 lack any significant correlation in Layers III and II which contain <4 wt% CaO and <1 wt% P2O5 (inset in Figure 15) but show almost perfect linear relationship in Layers I-2 and I-1, apparently due to the presence of carbonate fluorapatite (CFA). The highest possible CaO vs. P2O5 correlation (r ~ 1) is observed in all bulk crust, layer, and EPMA data for phosphatized samples (Figure 15).
The composition of CFA in phosphatized crusts from the Pacific Ocean is relatively uniform [64], with 30.15 wt% P2O5 and 53.17 wt% CaO on average (P2O5/CaO = 0.57). The average CFA composition was used to obtain empirical equations for estimating the wt% contents of CaO and CFA in crust samples where CaO > 4 wt% and P2O5 > 1 wt%: CaO = 2.3133 + 1.66867×P2O5 and CFA = 3.4305×(P2O5 – 1). The contents of CFA reach 50 wt% in the most phosphatized Layer I-2 in the crust from Kocebu Guyot (Figure 15).
5.2.2. High Field Strength Elements (Nb, Ta, Zr, Hf), Metalloids (Sb, As), W, and Alkali Metals (Rb, Cs, Li)
Correlation is the strongest (r = 0.92–0.96) between Zr and Hf in all bulk and layer compositions, but the distributions of the two elements differ in crust layers. Their concentrations vary in very large ranges both in crusts as a whole and in separate layers: from 15–22 ppm to 1100–1200 ppm Zr and 0.4–0.5 ppm to 17 ppm Hf (Figure 13b). The Zr and Hf enrichment is high in Layer II from most of the Govorov and Kocebu crust samples (Figure 7); some zones of high Zr (1100–1400 ppm) and Hf (20–35 ppm) also exist in Layer II of the crust from Pallada Guyot. The Zr/Hf ratio ranges from 32 to 259 over the whole crusts and from 31 to 184 within layers.
Niobium and tantalum correlate rather poorly in both bulk crust and layer compositions, at the concentration ranges of 7.6 ppm to 91 ppm (Nb) and 0.1 to 1.7 ppm (Ta). The Nb enrichment is higher in the young layers relative to the old units of the Fe-Mn crusts (Figure 13d–f), while the Ta variations are moderate. Correspondingly, the Nb/Ta ratio increases from 43–60 in Layers I-1 and I-2 to 60–240 in II and III (Figure 13c). The crust from Pallada Guyot shares similarity with the Govorov and Kocebu samples in the contents of Nb and Ta and in the patterns of Nb and Nb/Ta in the respective layers.
The concentrations of Sb, As, and W are commonly higher in younger layers (II, III) and correlate with Nb contents in the crusts from Govorov and Kocebu guyots (Figure 13d–f), but this trend is uncommon for the Pallada sample, where Sb enrichment is restricted to a few zones in Layer II.
Among alkali metals, only Rb concentrations reach high levels of 18–34 ppm and correlate at as high as r > 0.9 with Cs, in all bulk crust and layer compositions (Figure 13a). The crust from Pallada Guyot contains up to 230 ppm Rb, 28 ppm Cs, and 60 ppm Li in a single point from Layer III, which may be due to a K-feldspar grain that fell within the local spot of the LA-ICP-MS analysis.
The iron and carbonate components of the hydrogenetic Fe-Mn crusts mainly sequester Rb and Cs [46], while Li, Zr, Hf, Nb, Ta, Sb and As are mostly incorporated into the iron component. These elements migrated into the crusts from seawater containing the Zr(OH)4o > Zr(OH)4-, Hf(OH)4o > Hf(OH)4-, Nb(OH)6- > Nb(OH)5o, Ta(OH)6- > Ta(OH)5o, and HAsO42- complexes.
5.2.3. REE, Y, Ba, Sr, and Bi
All PAAS-normalized REE patterns of hydrogenetic Fe-Mn crusts differ in a positive Ce anomaly and slight HREE enrichment over LREE (Figure 9 and Figure 10c). The REE and Y patterns for MST crusts, including those from Govorov and Kocebu guyots, display decreasing Ce, Y, REE+Y, and Ce* trends from phosphatized old Layers I-1 and I-2 to younger Layers II and III, while the behavior of other REEs is less consistent (Figure 8). However, the REE and Y trends in the Pallada crust are more regular, especially upwards from Layers I-2b to III: Ce and Ce* decrease while other REEs and Y increase gradually (Figure 16).
Experiments show that hydrogenetic Fe-Mn crusts from different oceanic regions, among which the Central Pacific, can sorb REEs from seawater into both iron and manganese components [65]. Cerium becomes oxidized and sorbed preferably on suspended matter (where it produces a positive anomaly) leaving the seawater depleted (negative Ce anomaly), and is thus inherited by hydrogenetic Fe-Mn crusts. In the global oceanic water depth profiles of REEs, Ce decreases gradually down from the maximum at 100–250 m below the sealevel while the concentrations of other REEs increase [57]. In this respect, the consistent variations of REE and Y (Figure 16) in the successively deposited Layers I-2b, II and III of the Pallada crust can be expected to correlate with seawater depth given that the guyot has been submerging ever deeper since the Late Oligocene.
The compositions of layers display strong correlations among Ce, La, LREE, Bi, and Ba (Figure 14) as a result of phosphatization in the CFA-enriched older layers. The apatite structure can incorporate multiple impurities by isomorphic substitutions of CO32-, F- (as in CFA), SO32-, Cl- for PO43- and Sc3+, Y3+, Bi3+ for Ca2+ [46]. According to LA-ICP-MS data, CFA veinlets with microinclusions of monazite, barite, and other phases in Fe-Mn crusts collected from Western and Central Pacific seamounts contain up to 3 wt% SO3, 0.8 wt% REE (with dominant La), and minor contents of Y, Sr and Ba [64]. Cerium in CFA is much lower than other REEs, and its respective PAAS-normalized patterns typically have a negative Ce anomaly, as in the seawater [63].
There is no correlation among the highest concentrations of P, Ca, Ce, Bi, Ba, and Y in the most phosphatized Layer I-2 of the crust from Pallada Guyot, possibly because a mixture of CFA and mineral inclusions of monazite, cerianite, parisite, barite, and other carriers of P, REE, Ba, and Y fell into the 50 µm spot of the LA-ICP-MS analysis. Some of these phases, of <1 µm grain sizes, were identified earlier by microdiffraction XRD on the surfaces of crystalline CFA aggregates in phosphatized layers of Fe-Mn crusts [32]. Thus, high correlation between Ce, Ba and Bi at r > 0.8 (Figure 14b,d,f) may be due to the presence of these elements in Fe and Mn oxyhydroxides or to inclusions of REE carriers or phases of other trace elements (e.g., Bi) in CFA.
5.3. Co-Chronometry, Growth Rates, and Deposition History of Fe-Mn Crusts
The growth rates of Co-rich Fe-Mn crusts have multiple controls: gradual subsidence of seamounts during motions of oceanic plates, the productivity of surface waters, the pole-to-equator temperature gradient, as well as latitudinal and longitudinal mixing in the oceanic water column [43,45]. The growth rates of Fe-Mn crusts and nodules are estimated from isotopes of Th (up to 1 Myr) and Be (up to 10 Myr) [66,67]. Os-isotope stratigraphy is also used to determine the age of Fe–Mn crusts, taking into account hiatuses in their deposition, by comparing Os isotope data with the 187Os/188Os curve of seawater [67,68,69]. For the MST, 187Os/188Os isotope ratio was used to obtain a high-resolution isotopic record of a hydrogenetic Fe–Mn crust sampled on the southeastern slope of Il'ichev Guyot [70] and on Ita Mai Tai Guyot [71]. U–Pb CFA dating using LA-ICP-MS also clarifies the age and different stages of phosphatization of Fe-Mn crust layers [67,71].
Isotopic data (230Thex and 230Thex/232Th methods and 10Be/9Be chronology) were used to obtain an empirical relationship between the crust growth rate and Co contents as a basis for Co-chronometry: GR (mm per Myr) = 1.28/(Co − 0.24) [72]. This approach assumes that the Co flux to the Fe and Mn oxyhydroxides remains consistent over both time and space, but this assumption is only applicable to hydrogenetic crusts [73]. The influence of diagenetic processes on the growth rate of Fe-Mn nodules is included into an alternative Co-chronometer using Co, Fe, and Mn content [74]. Growth-rate calculations based on this Co-chronometer often yield unrealistic ages for Fe-Mn crusts, as in the case of the crust from Pallada Guyot [54], which exceed the 60 to 65 Ma biostratigraphic ages of the oldest relict layer R (Figure 2 and Figure 3).
A shortcoming in the existing Co-chronometry approaches is that they neglect hiatuses between layers in Fe-Mn crusts, which were identified reliably from the biostratigraphy of calcareous nannoplankton, foraminifera, radiolarians, and macrofaunas (Figure 2 and Figure 3). The available biostratigraphic constraints were used for chronostratigraphic correlations among several sections of Fe-Mn crusts from the near-equatorial Pacific [26,27,28,29,45], illustrated by a fragment in Figure 17 displaying main breaks in ore deposition for the guyots of Butakov, Alba, Fedorov, Gramberg, and Lomelik. The phosphatized Layer I-2b, well pronounced at the base of Layer II, formed during the Late Oligocene–Early Miocene time span (26.5 to 18 Ma) between the older and younger crust layers after a prolonged gap from 38 to 26.5 Ma in the Early to Middle Oligocene.
The principal gaps in ore deposition from the chronostratigraphic model of Figure 16 (~2 Myr in the early Pliocene between Layers II and III, ~3 Myr in the Miocene between Layers II and I-2b, and ~12 Myr in the Late Oligocene to Early Miocene between Layers I-2b and I-2) were incorporated into a new age profile for the 94 mm thick crust collected on Pallada Guyot [55]. The updated age model is presented in Figure 18a, together with growth rates from Co-chronometry [69] based on 184 EPMA analyses and the patterns of P2O5 and Co (Figure 18b–d). The recalculated age of the Pallada Fe-Mn crust is ~17 Myr older than that estimated by Co-chronometry (24.5 Ma, after [55] against 41.5 Ma, Figure 18a).
Layer I-2 (12 mm thick), the most phosphatized old unit in this crust, grew at about 10 mm per Myr in the Late Eocene from 41.5 to 40 Ma (Figure 18a). Its formation falls within the main Late Eocene–Early Oligocene episode of phosphogenesis in Pacific sediments, from 43 to 39 Ma [34]. The following subunit, 15 mm I-2b, formed rapidly for about 1 Myr in the Late Oligocene from 28 to 27 Ma at 10 to 70 mm per Myr, after a ~12 Myr gap. Moderate P enrichment in this layer (Figure 17c) may reflect the second phosphatization event in the Late Oligocene–Early Miocene, from 27 to 21 Ma [34]. The deposition of Layer II (32 mm) followed a ~3 Myr break and occurred in the Late Oligocene–Early Miocene, from 24 to 16 Ma, at a variable rate of 2 to 30 mm per Myr. The uppermost unit, 32 mm Layer III, was deposited after a ~2 Myr gap at a slow rate of 2 to 3 mm per Myr, from ~14 Ma to the Present and gained high Co concentrations up to 8000–10000 ppm (Figure 18d).
Therefore, the Co chronometer [72] is applicable to dating layers in Co-rich Fe-Mn crusts with due regard for hiatuses revealed by chronostratigraphic correlations (Figure 17). Reliable timing on the growth history of hydrogenetic crusts requires checks against biostratigraphic data, especially identifying index species of calcareous nannoplankton. Note, however, that three to five determinations of mean Co contents for different layers of crusts from Govorov and Kocebu guyots obtained in this study (Table A4 and Table A5 in Appendix A) are unsuitable for estimating the growth rates and ages of the crusts.
6. Conclusions
The precipitation history of old and young layers in Co-rich Fe-Mn crusts was inferred to correlate with global Late Cretaceous–Cenozoic climate events [6,12,26,27,28,29,43,45]. The main growth periods of Fe-Mn crusts were associated with Pacific polytaxic conditions, including warm water, increased bioproductivity, expanded OMZ, significant biogenic carbonate production, and high carbonate dissolution rates, which may have increased the Fe and Mn components in the oceanic water column. The hiatuses in the crust profiles coincide with oligotaxic ocean characterized by cool water, low bioproductivity, low planktonic calcium carbonate dissolution rates, and low Fe-Mn oxyhydroxide fluxes to the water column. In addition, regional and local factors, including geological events, hydrodynamic processes, and the morphology of guyot surfaces, created favorable conditions for accretion of Fe and Mn oxyhydroxides.
Biostratigraphic constraints place the deposition onset of Fe-Mn crusts at ~65–60 Ma. The oldest relict layer R was deposited in the Campanian–Maastrichtian and Late Paleocene near the shore, probably in the photic zone. The growth of Fe-Mn crusts continued in the Late Paleocene–Early Eocene (Layer I-1) and Middle–Late Eocene (Layer I-2) shallow-water shelf no deeper than 500–600 m below the sealevel. The oldest unit of the crusts originated in the highly bioproductive equatorial zone. Layers II (Miocene) and III (Pliocene-Pleistocene) precipitated at larger sea depths of 1200–3000 m. The detailed stratigraphy of phosphatized sublayer I-2b, which was dated as the Late Oligocene–Early Miocene (26.5–18 Ma) and attributed to the base of Layer II, is to be further constrained. The deposition of Fe and Mn phases was interrupted several times, with the longest gap from 38 to 26.5 Ma between the old (R, I-1, and I-2) and young (I-2b, II, and III) layers of the crusts (Figure 2 and Figure 17). The ore material of the crusts was considerably altered during the Late Eocene–Early Oligocene (43 to 39 Ma) and Late Oligocene–Early Miocene (27 to 21 Ma) global events of phosphogenesis in the Pacific sediments which left record in layers R, I-1, I-2 and sublayer I-2b, respectively. Further chronostratigrphic correlation of the Pacific Fe-Mn crusts requires support from data on index species of calcareous nannofossils at layer boundaries (Figure 3 and Figure 17), geochemical profiles determined by localized analyses (EPMA, SEM-EDS, and LA-ICP-MS), as well as growth rates and ages of layers constrained by Co-chronometry and isotopic studies.
A major part of this study focuses on characterizing the chemistry of the Co-rich Fe-Mn crusts and their separate layers. The composition of crusts as a whole depends on the relative contributions (weight fractions) of the geochemically different constituent layers, which can be estimated using mass-balance calculations (Table 2). The amassed geochemical data for the crust layers were systematized by means of factor analysis of principal components (varimax raw) that revealed four factor groups of trace elements: (1) + (all REEs except Ce and La); (2) +(Ce, La, Ba, Mo, Sr, Pb); (3) +(Zr, Hf, Nb, Rb, As)/-Pb; (4) +(U, Th, Co, As, Sb, W)/-Y. The factor score diagrams highlight fields of elements which are especially distinctive for Layers I-1, I-2, and II+III according to factors 2 and 4 (Figure 12).
The chemistry of the Fe-Mn crusts confirms the hydrogenetic origin of Layers II and III, in which Fe and Mn oxyhydroxides precipitated directly from seawater. The older layers (R, I-1, I-2 and I-2b) most likely originated by the same mechanism but their chemistry and mineralogy were affected by later phosphatization. The contents of CFA in the phosphatized layers were estimated using the empirically found relationship between CaO and P2O5 (Figure 15).
The lower unit of the crusts (Layers I-1 and I-2) is enriched in Co, Y, and Ce, and its data points plot isolated fields in the Сe*–Nd and Сe*–(Y/Ho)sn diagrams (Figure 9c,d). All PAAS-normalized REE+Y patterns of hydrogenetic Fe-Mn crusts show a positive Ce anomaly and slight LREE depletion relative to HREE (Figure 9 and Figure 10c). The consistent changes in REE and Y concentrations (decreasing Ce contents and Ce* anomaly at increasing other REEs and Y, Figure 16) toward layers I-2b → II → III in the crust from Pallada Guyot correlate with the trend of progressive ocean deepening from the Late Oligocene–Early Miocene to Present and the respective submergence of the Pacific Plate with the guyots to greater water depths. This inference has important paleogeographic implications and can be confirmed in the course of further studies on other samples of Co-rich Fe-Mn crusts.
The patterns of minor and trace elements in different layers of the crusts vary markedly between and within Govorov, Kocebu, and Pallada guyots (Figure 7, Figure 8, Figure 13 and Figure 14). The heterogeneous distribution of elements in individual layers may be due to hydrodynamics of submarine currents controlled by the surface topography of guyots and the position of the Magellan Seamounts relative to the global paleoclimatic zones in the Pacific Ocean. On the other hand, the geochemistry of the Fe-Mn crusts was strongly affected by repeated episodes of Cenozoic volcanic activity in the MST area of the Pacific Plate. Specifically, voluminous eruptions of Miocene petit-spot volcanoes on the guyots [20,21], may be responsible for elevated concentrations of Nb, Zr, As, Sb and W in Layers II and III (Figure 13 and Figure 14).
Author Contributions
Conceptualization, investigation and field sampling, I.S.P.; writing, review, and editing, all authors; Visualization, E.A.S and I.A.P. All authors have read and agreed to the published version of the manuscript.
Funding
The study was funded by grant 25–17–00128 from the Russian Science Foundation (RSF).
Data Availability Statement
All data of this study are presented in the text, Appendix A and Supplementary Tables.
Acknowledgments
We would like to thank crew members of R/V Gelendzhik (JSC Yuzhmorgeologiya) for sampling work and support during the cruises of 2016–2017. We are grateful to our colleagues: Chubarov V.M., Zarubina O.V., and Tauson L.S. (Vinogradov Institute of Geochemistry, Irkutsk) for XRF and ICP-MS measurements.
Conflicts of Interest
The authors declare no conflict of interest.
Appendix A

Table A1.
XRF analyses (wt% concentrations) of Co-rich Fe-Mn crust layers from Govorov Guyot.
| 08D106 | 08D108 | 08D114 | 08D115 | 08D118 | |||||||||||||
| III | II-2 | II-1 | I-2 | I-1 | III | II-2 | II-1 | III | II | I-1 | III | II | I-1 | III | II | I-1 | |
| SiO2 | 18.67 | 9.88 | 7.84 | 5.14 | 1.87 | 18.81 | 14.05 | 7.39 | 10.33 | 9.35 | 2.78 | 14.03 | 10.88 | 2.94 | 9.19 | 7.57 | 5.55 |
| TiO2 | 1.69 | 2.18 | 2.22 | 1.72 | 1.26 | 1.49 | 1.80 | 2.19 | 2.10 | 2.29 | 1.77 | 2.07 | 2.25 | 1.54 | 2.39 | 2.33 | 1.80 |
| Al2O3 | 4.39 | 2.31 | 2.19 | 1.86 | 0.81 | 4.55 | 3.42 | 2.01 | 1.88 | 2.69 | 0.83 | 3.24 | 3.02 | 0.94 | 2.37 | 2.11 | 1.56 |
| Fe2O3 | 28.51 | 25.95 | 22.49 | 15.34 | 13.22 | 27.97 | 27.24 | 23.40 | 29.33 | 21.37 | 18.68 | 27.25 | 24.10 | 15.36 | 23.95 | 22.58 | 19.97 |
| MgO | 1.76 | 1.84 | 2.08 | 2.10 | 1.65 | 1.71 | 1.77 | 1.98 | 1.72 | 2.22 | 1.40 | 1.79 | 1.93 | 1.55 | 1.90 | 2.02 | 1.23 |
| MnO | 22.34 | 30.50 | 33.32 | 35.01 | 31.42 | 22.25 | 26.57 | 33.44 | 29.40 | 35.47 | 31.07 | 25.98 | 30.54 | 30.86 | 32.36 | 34.20 | 24.19 |
| CaO | 3.49 | 3.94 | 4.70 | 10.01 | 18.78 | 3.79 | 3.53 | 4.34 | 3.80 | 4.68 | 14.42 | 3.87 | 3.98 | 16.24 | 3.98 | 4.12 | 16.96 |
| Na2O | 2.55 | 2.14 | 1.87 | 2.11 | 1.73 | 2.18 | 1.73 | 2.12 | 2.01 | 1.96 | 1.47 | 1.83 | 1.88 | 1.56 | 2.17 | 1.76 | 1.36 |
| K2O | 1.23 | 0.69 | 0.45 | 0.67 | 0.27 | 1.01 | 0.99 | 0.56 | 0.54 | 0.58 | 0.32 | 1.04 | 0.75 | 0.31 | 0.61 | 0.48 | 0.37 |
| P2O5 | 1.06 | 0.96 | 1.22 | 4.23 | 9.42 | 1.05 | 0.98 | 1.03 | 1.03 | 1.07 | 6.70 | 0.97 | 0.98 | 7.92 | 0.82 | 0.79 | 8.70 |
| LOI | 12.38 | 14.77 | 15.30 | 14.51 | 14.62 | 11.70 | 13.67 | 15.02 | 13.81 | 15.18 | 14.15 | 13.73 | 13.85 | 15.12 | 14.95 | 15.57 | 13.59 |
| H2O- | 9.70 | 11.26 | 10.70 | 9.70 | 7.76 | 9.50 | 9.84 | 10.86 | 11.89 | 11.33 | 10.01 | 10.18 | 11.65 | 8.08 | 11.54 | 11.66 | 8.08 |
| Ba | 0.130 | 0.150 | 0.170 | 0.220 | 0.240 | 0.110 | 0.130 | 0.170 | 0.150 | 0.190 | 0.260 | 0.130 | 0.160 | 0.230 | 0.170 | 0.210 | 0.280 |
| Sr | 0.120 | 0.150 | 0.150 | 0.140 | 0.180 | 0.130 | 0.130 | 0.150 | 0.160 | 0.150 | 0.190 | 0.130 | 0.140 | 0.170 | 0.140 | 0.140 | 0.180 |
| Zr | 0.064 | 0.065 | 0.067 | 0.051 | 0.036 | 0.054 | 0.064 | 0.066 | 0.063 | 0.074 | 0.048 | 0.065 | 0.066 | 0.056 | 0.053 | 0.066 | 0.063 |
| V | 0.056 | 0.058 | 0.056 | 0.046 | 0.060 | 0.052 | 0.060 | 0.059 | 0.065 | 0.058 | 0.071 | 0.048 | 0.057 | 0.056 | 0.062 | 0.064 | 0.059 |
| Co | 0.400 | 0.590 | 0.670 | 0.590 | 0.440 | 0.350 | 0.490 | 0.590 | 0.580 | 0.690 | 0.350 | 0.610 | 0.660 | 0.500 | 0.840 | 0.650 | 0.240 |
| Ni | 0.300 | 0.470 | 0.600 | 0.840 | 0.600 | 0.280 | 0.390 | 0.590 | 0.380 | 0.710 | 0.380 | 0.360 | 0.540 | 0.570 | 0.530 | 0.640 | 0.290 |
| Cu | 0.085 | 0.119 | 0.156 | 0.188 | 0.106 | 0.059 | 0.107 | 0.178 | 0.066 | 0.236 | 0.123 | 0.088 | 0.159 | 0.162 | 0.205 | 0.208 | 0.133 |
| Zn | 0.047 | 0.055 | 0.068 | 0.088 | 0.086 | 0.048 | 0.055 | 0.067 | 0.060 | 0.079 | 0.068 | 0.050 | 0.064 | 0.077 | 0.071 | 0.085 | 0.075 |
| Total | 99.27 | 96.82 | 95.62 | 94.86 | 96.80 | 97.59 | 97.18 | 95.35 | 97.47 | 99.05 | 95.08 | 97.28 | 96.01 | 96.16 | 96.76 | 95.59 | 96.60 |
| Fe | 20 | 18 | 16 | 11 | 9 | 20 | 19 | 16 | 21 | 15 | 13 | 19 | 17 | 11 | 17 | 16 | 14 |
| Mn | 17 | 24 | 26 | 27 | 24 | 17 | 21 | 26 | 23 | 27 | 24 | 20 | 24 | 24 | 25 | 26 | 19 |
| Mn/Fe | 0.87 | 1.30 | 1.64 | 2.53 | 2.63 | 0.88 | 1.08 | 1.58 | 1.11 | 1.84 | 1.84 | 1.06 | 1.40 | 2.22 | 1.50 | 1.68 | 1.34 |
Table A2.
XRF analyses (wt% concentrations) of Co-rich Fe-Mn crust layers from Kocebu Guyot.
| 14D77-2 | 14D53 | 14MTP02 | 14MTP01 | |||||||||
| III | II-2 | II-1 | I-2 | I-1 | III | II | I-2 | III | II | I-1 | I-1 | |
| SiO2 | 17.67 | 7.70 | 10.44 | 2.14 | 1.82 | 20.49 | 11.36 | 4.75 | 14.96 | 11.26 | 4.89 | 2.76 |
| TiO2 | 1.36 | 1.86 | 2.06 | 1.28 | 1.02 | 1.56 | 2.05 | 1.72 | 1.94 | 2.19 | 1.75 | 1.49 |
| Al2O3 | 3.93 | 1.70 | 2.97 | 0.91 | 0.90 | 5.15 | 3.39 | 1.75 | 2.96 | 3.44 | 1.65 | 1.12 |
| Fe2O3 | 27.36 | 25.36 | 24.64 | 11.71 | 11.86 | 27.94 | 24.31 | 16.92 | 29.53 | 22.10 | 20.60 | 17.77 |
| MgO | 1.74 | 1.91 | 2.05 | 1.68 | 1.76 | 1.78 | 1.98 | 1.82 | 1.62 | 1.97 | 1.37 | 1.28 |
| MnO | 23.53 | 33.75 | 30.51 | 29.32 | 32.72 | 21.29 | 27.87 | 29.54 | 25.23 | 30.71 | 25.79 | 28.58 |
| CaO | 3.42 | 4.12 | 4.24 | 20.26 | 17.90 | 3.73 | 5.43 | 14.20 | 3.51 | 4.14 | 14.04 | 17.70 |
| Na2O | 2.33 | 1.70 | 1.88 | 2.02 | 1.68 | 1.97 | 1.82 | 1.72 | 1.87 | 1.82 | 1.49 | 1.61 |
| K2O | 0.89 | 0.48 | 0.79 | 0.39 | 0.40 | 1.12 | 0.93 | 0.46 | 0.90 | 0.88 | 0.42 | 0.28 |
| P2O5 | 1.07 | 1.02 | 1.20 | 10.02 | 8.84 | 1.04 | 1.94 | 6.86 | 0.98 | 0.97 | 6.86 | 8.81 |
| LOI | 13.15 | 15.31 | 14.18 | 14.21 | 14.09 | 11.81 | 14.46 | 14.33 | 13.02 | 15.10 | 16.89 | 13.81 |
| H2O- | 9.95 | 12.32 | 11.62 | 8.15 | 8.58 | 10.23 | 9.83 | 8.39 | 9.68 | 9.42 | 7.37 | 9.69 |
| Ba | 0.110 | 0.150 | 0.170 | 0.190 | 0.260 | 0.110 | 0.150 | 0.170 | 0.140 | 0.210 | 0.310 | 0.300 |
| Sr | 0.130 | 0.160 | 0.150 | 0.170 | 0.170 | 0.120 | 0.140 | 0.150 | 0.140 | 0.140 | 0.170 | 0.200 |
| Zr | 0.054 | 0.056 | 0.062 | 0.043 | 0.037 | 0.061 | 0.063 | 0.062 | 0.063 | 0.075 | 0.069 | 0.037 |
| V | 0.058 | 0.071 | 0.058 | 0.046 | 0.064 | 0.052 | 0.052 | 0.050 | 0.060 | 0.053 | 0.058 | 0.071 |
| Co | 0.420 | 0.670 | 0.570 | 0.430 | 0.460 | 0.380 | 0.530 | 0.450 | 0.420 | 0.520 | 0.260 | 0.290 |
| Ni | 0.350 | 0.570 | 0.530 | 0.690 | 0.700 | 0.310 | 0.480 | 0.650 | 0.290 | 0.570 | 0.390 | 0.320 |
| Cu | 0.064 | 0.089 | 0.121 | 0.161 | 0.101 | 0.073 | 0.114 | 0.165 | 0.100 | 0.246 | 0.199 | 0.068 |
| Zn | 0.047 | 0.062 | 0.060 | 0.094 | 0.121 | 0.048 | 0.059 | 0.075 | 0.063 | 0.075 | 0.077 | 0.077 |
| Total | 97.68 | 96.74 | 96.68 | 95.76 | 94.90 | 99.03 | 97.13 | 95.84 | 97.80 | 96.47 | 97.28 | 96.57 |
| Fe | 19 | 18 | 17 | 8 | 8 | 20 | 17 | 12 | 21 | 15 | 14 | 12 |
| Mn | 18 | 26 | 24 | 23 | 25 | 17 | 22 | 23 | 20 | 24 | 20 | 22 |
| Mn/Fe | 0.95 | 1.47 | 1.37 | 2.77 | 3.05 | 0.84 | 1.27 | 1.93 | 0.95 | 1.54 | 1.39 | 1.78 |
Table A3.
ICP-MS analyses (ppm concentrations) of Co-rich Fe-Mn crust layers from Govorov Guyot.
| 08D106 | 08D108 | 08D114 | 08D115 | 08D118 | |||||||||||||
| III | II-2 | II-1 | I-2 | I-1 | III | II-2 | II-1 | III | II | 1-1 | III | II | 1-1 | III | II | I-1 | |
| Co | 4400 | 6506 | 7100 | 5994 | 4779 | 3988 | 5683 | 6514 | 6270 | 7014 | 4041 | 6359 | 7176 | 5337 | 8694 | 6765 | 2568 |
| Ni | 2962 | 4739 | 6010 | 7932 | 5586 | 2746 | 3813 | 5828 | 3563 | 6607 | 3864 | 3621 | 5332 | 5658 | 5400 | 6049 | 2908 |
| Cr | 43 | 14 | 4.3 | 12 | 35 | 27 | 22 | 13 | 12 | 13 | 32 | 5.8 | 32 | 22 | 1.9 | 30 | 25 |
| V | 555 | 636 | 634 | 481 | 658 | 597 | 606 | 626 | 661 | 613 | 799 | 558 | 599 | 626 | 681 | 643 | 688 |
| Cu | 873 | 1315 | 1777 | 1935 | 1110 | 743 | 2089 | 1993 | 766 | 2466 | 2533 | 960 | 1800 | 1690 | 2357 | 3275 | 1517 |
| Sb | 48 | 52 | 55 | 49 | 34 | 39 | 49 | 52 | 48 | 52 | 47 | 70 | 58 | 46 | 46 | 49 | 53 |
| W | 72 | 90 | 95 | 96 | 65 | 61 | 89 | 103 | 83 | 89 | 50 | 71 | 95 | 85 | 80 | 90 | 71 |
| Mo | 352 | 539 | 590 | 564 | 767 | 385 | 443 | 598 | 505 | 588 | 770 | 393 | 516 | 690 | 507 | 549 | 520 |
| Zn | 691 | 629 | 757 | 928 | 756 | 516 | 653 | 706 | 590 | 943 | 629 | 554 | 759 | 762 | 745 | 817 | 621 |
| Be | 6.0 | 4.3 | 6.2 | 4.7 | 5.5 | 3.6 | 22 | 6.8 | 5.6 | 6.5 | 27 | 3.1 | 6.6 | 4.8 | 4.6 | 23 | 15 |
| Rb | 18 | 14 | 9.4 | 26 | 1.3 | 16 | 31 | 31 | 8.9 | 33 | 1.8 | 12 | 33 | 12 | 6.7 | 8.9 | 12 |
| Ba | 1451 | 1797 | 2159 | 3119 | 3039 | 1400 | 2044 | 2186 | 1763 | 3126 | 3529 | 1580 | 2827 | 3097 | 1988 | 2619 | 3934 |
| Th | 14 | 14 | 14 | 6.8 | 8.6 | 17 | 10 | 16 | 17 | 9.0 | 9.6 | 15 | 17 | 10 | 20 | 14 | 9.6 |
| U | 11 | 14 | 13 | 9.1 | 11 | 11 | 13 | 15 | 14 | 11 | 14 | 12 | 13 | 11 | 13 | 11 | 11 |
| Nb | 64 | 75 | 79 | 62 | 42 | 46 | 69 | 74 | 59 | 75 | 45 | 84 | 79 | 54 | 67 | 78 | 52 |
| Ta | 0.33 | 0.31 | 0.44 | – | – | 0.05 | 0.33 | 0.47 | 0.49 | 0.83 | – | 0.66 | 0.05 | – | 0.75 | 0.75 | – |
| Pb | 146 | 367 | 1180 | 1483 | 1702 | 99 | 158 | 763 | 507 | 281 | 1343 | 327 | 547 | 1350 | 555 | 1440 | 1587 |
| Sr | 1309 | 1572 | 1649 | 1483 | 1818 | 1325 | 1310 | 1689 | 1558 | 1529 | 1996 | 1344 | 1520 | 1787 | 1519 | 1504 | 1810 |
| Zr | 627 | 752 | 728 | 544 | 391 | 570 | 664 | 858 | 588 | 794 | 494 | 609 | 738 | 601 | 529 | 675 | 637 |
| Hf | 9.7 | 13 | 12 | 9.2 | 3.8 | 7.3 | 11 | 15 | 8.5 | 15 | 6.3 | 11 | 13 | 8.2 | 8.3 | 12 | 9.1 |
| Ga | 88 | 39 | 17 | 1.0 | 0.03 | 10 | 21 | 5.6 | 11 | 14 | 1.3 | 43 | 0.03 | 8.3 | 29 | 37 | 8.0 |
| As | 258 | 259 | 246 | 165 | 161 | 263 | 282 | 241 | 268 | 228 | 202 | 309 | 257 | 195 | 203 | 186 | 180 |
| La | 233 | 267 | 263 | 289 | 336 | 226 | 209 | 278 | 311 | 254 | 399 | 245 | 277 | 413 | 265 | 265 | 481 |
| Ce | 612 | 967 | 1205 | 1676 | 1726 | 568 | 622 | 1194 | 924 | 1297 | 1997 | 866 | 1130 | 1729 | 1153 | 1613 | 1771 |
| Pr | 50 | 61 | 61 | 59 | 55 | 52 | 46 | 66 | 74 | 61 | 72 | 52 | 58 | 73 | 67 | 65 | 84 |
| Nd | 221 | 259 | 252 | 255 | 230 | 225 | 197 | 274 | 309 | 262 | 297 | 219 | 249 | 320 | 278 | 272 | 351 |
| Sm | 46 | 53 | 54 | 52 | 43 | 48 | 41 | 57 | 63 | 53 | 52 | 47 | 50 | 56 | 56 | 57 | 61 |
| Eu | 11 | 13 | 13 | 12 | 10 | 12 | 9.8 | 13 | 17 | 13 | 12 | 11 | 12 | 14 | 15 | 13 | 15 |
| Gd | 48 | 56 | 54 | 59 | 57 | 49 | 42 | 57 | 66 | 59 | 60 | 50 | 53 | 71 | 59 | 57 | 72 |
| Tb | 6.8 | 7.9 | 7.2 | 7.5 | 7.0 | 7.3 | 6.3 | 7.9 | 9.8 | 7.5 | 7.8 | 6.9 | 7.2 | 9.2 | 8.2 | 7.7 | 9.1 |
| Dy | 41 | 45 | 43 | 47 | 44 | 44 | 38 | 44 | 55 | 43 | 46 | 41 | 44 | 59 | 46 | 43 | 59 |
| Ho | 8.8 | 9.3 | 9.2 | 10 | 10 | 8.7 | 8.0 | 9.2 | 11 | 9.0 | 10 | 8.8 | 9.1 | 14 | 9.2 | 8.7 | 13 |
| Er | 25 | 27 | 26 | 31 | 31 | 24 | 22 | 27 | 31 | 26 | 30 | 25 | 27 | 42 | 25 | 25 | 38 |
| Tm | 3.7 | 4.0 | 3.6 | 4.4 | 4.5 | 3.6 | 3.4 | 3.8 | 4.5 | 3.8 | 4.3 | 3.7 | 4.0 | 5.7 | 3.9 | 3.5 | 5.5 |
| Yb | 25 | 25 | 24 | 29 | 29 | 23 | 22 | 25 | 28 | 24 | 29 | 23 | 27 | 37 | 25 | 23 | 37 |
| Lu | 4.0 | 3.8 | 3.7 | 4.5 | 4.6 | 3.7 | 3.3 | 3.9 | 4.2 | 3.8 | 4.2 | 3.8 | 4.2 | 6.0 | 3.5 | 3.5 | 5.8 |
| Y | 204 | 189 | 199 | 393 | 458 | 201 | 173 | 215 | 224 | 244 | 278 | 197 | 230 | 560 | 174 | 190 | 523 |
| LREE | 1174 | 1620 | 1848 | 2343 | 2400 | 1131 | 1124 | 1882 | 1698 | 1940 | 2829 | 1439 | 1776 | 2605 | 1834 | 2285 | 2763 |
| HREE | 366 | 367 | 371 | 585 | 646 | 364 | 318 | 392 | 433 | 421 | 469 | 360 | 406 | 803 | 354 | 361 | 763 |
| Ce* | 1.3 | 1.8 | 2.2 | 3.0 | 2.9 | 1.2 | 1.5 | 2.0 | 1.4 | 2.4 | 2.7 | 1.8 | 2.1 | 2.3 | 2.0 | 2.8 | 2.0 |
| L/HREE | 3.2 | 4.4 | 5.0 | 4.0 | 3.7 | 3.1 | 3.5 | 4.8 | 3.9 | 4.6 | 6.0 | 4.0 | 4.4 | 3.2 | 5.2 | 6.3 | 3.6 |
| REY | 1540 | 1987 | 2218 | 2928 | 3045 | 1496 | 1442 | 2274 | 2131 | 2361 | 3298 | 1799 | 2181 | 3408 | 2189 | 2646 | 3526 |
Table A4.
ICP-MS analyses (ppm concentrations) of Co-rich Fe-Mn crust layers from Kocebu Guyot.
| 14D77-2 | 14D53 | 14MTP02 | 14MTP01 | |||||||||
| III | II-2 | II-1 | I-2 | I-1 | III | II | I-2 | III | II | I-1 | I-1 | |
| Co | 4608 | 6910 | 6419 | 4512 | 4889 | 4127 | 6085 | 5086 | 5062 | 5266 | 3102 | 3203 |
| Ni | 3258 | 5413 | 5200 | 6599 | 6999 | 3072 | 4903 | 6746 | 3036 | 5234 | 4034 | 3222 |
| Cr | 17 | 4.5 | 33 | 13 | 52 | 38 | 46 | 27 | 60 | 15 | 23 | 39 |
| V | 605 | 703 | 664 | 512 | 740 | 528 | 607 | 544 | 667 | 537 | 691 | 745 |
| Cu | 674 | 1003 | 1372 | 1826 | 1110 | 755 | 1316 | 1788 | 1171 | 2479 | 2120 | 760 |
| Sb | 42 | 49 | 54 | 34 | 31 | 46 | 56 | 49 | 46 | 48 | 53 | 47 |
| W | 68 | 107 | 86 | 66 | 40 | 60 | 83 | 108 | 65 | 78 | 93 | 42 |
| Mo | 431 | 671 | 563 | 556 | 804 | 326 | 477 | 519 | 399 | 479 | 563 | 707 |
| Zn | 498 | 749 | 784 | 805 | 1005 | 488 | 773 | 826 | 657 | 851 | 701 | 623 |
| Be | 5.4 | 3.4 | 5.6 | 8.3 | 1.9 | 4.5 | 6.0 | 5.3 | 6.2 | 7.1 | 8.8 | 5.1 |
| Rb | 16 | 24 | 44 | 3.7 | 8.9 | 21 | 46 | 21 | 11 | 40 | 7.8 | 1.9 |
| Ba | 1356 | 2285 | 2867 | 2159 | 3240 | 1340 | 2665 | 2818 | 1823 | 3071 | 4396 | 3963 |
| Th | 13 | 13 | 15 | 3.3 | 8.0 | 13 | 14 | 5.4 | 16 | 9.9 | 9.2 | 7.0 |
| U | 11 | 15 | 14 | 10 | 12 | 10 | 13 | 13 | 13 | 10 | 10 | 13 |
| Nb | 55 | 65 | 79 | 37 | 35 | 68 | 83 | 64 | 59 | 71 | 52 | 39 |
| Ta | 0.14 | 0.05 | 0.42 | – | – | 1.1 | 0.52 | – | 0.45 | 0.89 | – | – |
| Pb | 72 | 848 | 149 | 1172 | 1900 | 120 | 130 | 765 | 428 | 228 | 1098 | 2029 |
| Sr | 1346 | 1720 | 1660 | 1603 | 1726 | 1202 | 1578 | 1595 | 1497 | 1346 | 1838 | 2071 |
| Zr | 537 | 643 | 758 | 437 | 388 | 561 | 749 | 674 | 630 | 834 | 691 | 391 |
| Hf | 8.0 | 9.6 | 13 | 5.9 | 4.1 | 9.5 | 13 | 12 | 9.6 | 16 | 9.3 | 4.4 |
| Ga | 11 | 17 | 5.4 | 0.03 | 2.4 | 56 | 17 | 2.6 | 11 | 11 | 15 | 5.7 |
| As | 271 | 305 | 297 | 136 | 160 | 257 | 271 | 207 | 292 | 222 | 191 | 209 |
| La | 213 | 276 | 283 | 338 | 252 | 187 | 239 | 254 | 310 | 228 | 421 | 418 |
| Ce | 535 | 842 | 978 | 1258 | 1355 | 583 | 981 | 1333 | 969 | 1212 | 1625 | 2177 |
| Pr | 43 | 61 | 62 | 58 | 43 | 37 | 50 | 53 | 73 | 55 | 75 | 56 |
| Nd | 195 | 259 | 263 | 263 | 185 | 160 | 215 | 227 | 311 | 230 | 314 | 229 |
| Sm | 37 | 53 | 56 | 49 | 33 | 33 | 42 | 44 | 64 | 48 | 59 | 38 |
| Eu | 9.8 | 13 | 13 | 12 | 8.1 | 8.3 | 11 | 11 | 16 | 11 | 14 | 9.1 |
| Gd | 41 | 52 | 57 | 59 | 43 | 36 | 49 | 52 | 66 | 48 | 66 | 53 |
| Tb | 6.0 | 7.7 | 7.8 | 7.7 | 5.6 | 5.3 | 6.4 | 6.6 | 9.4 | 6.5 | 8.0 | 6.5 |
| Dy | 37 | 47 | 46 | 49 | 35 | 32 | 37 | 39 | 55 | 38 | 51 | 42 |
| Ho | 7.7 | 9.4 | 9.6 | 12 | 8.6 | 7.1 | 8.5 | 8.8 | 11 | 7.7 | 11 | 9.9 |
| Er | 23 | 27 | 28 | 34 | 26 | 21 | 24 | 25 | 30 | 22 | 34 | 31 |
| Tm | 3.4 | 3.9 | 4.1 | 5.0 | 3.9 | 3.1 | 3.7 | 3.7 | 4.5 | 3.2 | 4.8 | 4.3 |
| Yb | 22 | 26 | 26 | 32 | 25 | 20 | 24 | 23 | 28 | 20 | 31 | 28 |
| Lu | 3.4 | 4.0 | 4.0 | 5.0 | 4.3 | 3.4 | 3.9 | 3.9 | 4.4 | 3.3 | 4.7 | 4.5 |
| Y | 189 | 186 | 235 | 536 | 333 | 176 | 247 | 321 | 230 | 195 | 434 | 439 |
| LREE | 1032 | 1504 | 1654 | 1977 | 1876 | 1008 | 1537 | 1922 | 1742 | 1783 | 2507 | 2927 |
| HREE | 332 | 362 | 417 | 740 | 485 | 304 | 403 | 483 | 439 | 344 | 644 | 619 |
| Ce* | 1.3 | 1.5 | 1.7 | 2.1 | 3.0 | 1.6 | 2.1 | 2.7 | 1.5 | 2.5 | 2.1 | 3.2 |
| L/HREE | 3.1 | 4.1 | 4.0 | 2.7 | 3.9 | 3.3 | 3.8 | 4.0 | 4.0 | 5.2 | 3.9 | 4.7 |
| REY | 1364 | 1866 | 2072 | 2717 | 2361 | 1312 | 1941 | 2405 | 2181 | 2127 | 3151 | 3546 |
Table A5.
Bulk chemistry of MST Co-rich Fe-Mn crusts.
| Mean | Var,% | n | Mean | Mediana | Min | Max | Var,% | n | |
| Mn | 21.13 | 13 | 803 | ||||||
| Fe | 16.28 | 13 | 794 | ||||||
| P2O5 | 2.75 | 71 | 631 | ||||||
| Mn/Fe | 1.31 | 17 | 793 | ||||||
| Co | 5800 | 23 | 803 | 5498 | 5400 | 2700 | 9000 | 19 | 276 |
| Ni | 4400 | 18 | 803 | 4307 | 4300 | 1200 | 6700 | 19 | 276 |
| Cr | 17 | 107 | 309 | 17 | 11 | 2.4 | 720 | 277 | 248 |
| V | 529 | 13 | 247 | 500 | 500 | 260 | 625 | 9.4 | 146 |
| Cu | 1200 | 26 | 803 | 1220 | 1200 | 520 | 2113 | 21 | 276 |
| Sc | 10.4 | 37 | 309 | 10 | 10 | 1.0 | 25 | 31 | 270 |
| Sn | 8.5 | 38 | 309 | 8.3 | 8.3 | 2.9 | 15 | 22 | 274 |
| Sb | 39 | 23 | 309 | 36 | 36 | 9.2 | 60 | 21 | 276 |
| W | 62 | 29 | 309 | 71 | 71 | 14 | 120 | 24 | 276 |
| Mo | 383 | 20 | 309 | 378 | 370 | 140 | 600 | 19 | 276 |
| Tl | 124 | 25 | 309 | 122 | 122 | 44 | 190 | 22 | 274 |
| Zn | 555 | 16 | 309 | 550 | 560 | 320 | 801 | 19 | 276 |
| Li | 4.7 | 56 | 305 | 5.2 | 4.5 | 1.5 | 16.7 | 48 | 274 |
| Be | 5.8 | 38 | 309 | 5.4 | 4.9 | 2.2 | 15 | 42 | 276 |
| Cs | 0.50 | 48 | 309 | 0.54 | 0.50 | 0.09 | 1.5 | 46 | 274 |
| Rb | 9.2 | 44 | 309 | 8.9 | 8.4 | 3 | 34 | 38 | 276 |
| Ba | 1528 | 21 | 309 | 1377 | 1400 | 740 | 4700 | 27 | 276 |
| Th | 13 | 29 | 309 | 14 | 13 | 4.9 | 27 | 33 | 276 |
| U | 11 | 23 | 309 | 12 | 12 | 5.9 | 21 | 19 | 276 |
| Nb | 40 | 53 | 309 | 41 | 42 | 7.3 | 94 | 37 | 276 |
| Ta | 0.60 | 69 | 309 | 0.47 | 0.38 | 0.09 | 1.9 | 61 | 275 |
| Pb | 1166 | 20 | 309 | 1121 | 1100 | 352 | 1700 | 21 | 276 |
| Sr | 1278 | 14 | 309 | 1252 | 1300 | 686 | 1714 | 13 | 276 |
| Zr | 321 | 93 | 309 | 231 | 120 | 14 | 1200 | 106 | 276 |
| Hf | 4.2 | 96 | 309 | 3.0 | 1.8 | 0.40 | 17 | 94 | 276 |
| Bi | 35 | 30 | 309 | 41 | 40 | 16 | 82 | 26 | 274 |
| Ga | 14 | 66 | 309 | 13 | 13 | 0.03 | 25 | 30 | 276 |
| As | 193 | 59 | 309 | 162 | 160 | 92 | 260 | 17 | 276 |
| Cd | 3.9 | 47 | 309 | 4.1 | 4.1 | 1.6 | 6.3 | 17 | 274 |
| Te | 57 | 35 | 309 | 51 | 49 | 14 | 98 | 26 | 274 |
| La | 272 | 19 | 309 | 242 | 240 | 124 | 410 | 22 | 276 |
| Ce | 972 | 25 | 309 | 849 | 820 | 390 | 1700 | 26 | 276 |
| Pr | 52 | 20 | 309 | 46 | 45 | 27 | 75 | 21 | 276 |
| Nd | 212 | 21 | 309 | 203 | 200 | 130 | 280 | 16 | 276 |
| Sm | 43 | 21 | 309 | 43 | 42 | 28 | 64 | 17 | 276 |
| Eu | 11 | 19 | 309 | 11 | 11 | 6.9 | 16 | 16 | 276 |
| Gd | 55 | 21 | 309 | 54 | 54 | 28 | 78 | 16 | 276 |
| Tb | 7.7 | 18 | 309 | 7.8 | 7.7 | 4.3 | 11 | 15 | 276 |
| Dy | 46 | 21 | 309 | 46 | 46 | 21 | 65 | 14 | 276 |
| Ho | 9.6 | 19 | 309 | 9.5 | 9.4 | 4.3 | 13 | 14 | 276 |
| Er | 28 | 20 | 309 | 27 | 27 | 12 | 40 | 14 | 276 |
| Tm | 4.0 | 18 | 309 | 4.0 | 3.9 | 1.8 | 5.6 | 14 | 276 |
| Yb | 26 | 20 | 309 | 25 | 25 | 12 | 36 | 14 | 276 |
| Lu | 4.1 | 20 | 309 | 4.1 | 4.0 | 1.8 | 6.2 | 14 | 276 |
| Y | 230 | 32 | 309 | 216 | 200 | 86 | 450 | 32 | 276 |
| LREE | 1562 | 309 | 1394 | 1365 | 743 | 2525 | 22 | 276 | |
| HREE | 180 | 309 | 178 | 176 | 85 | 254 | 14 | 276 | |
| Ce* | 1.9 | 309 | 1.8 | 1.8 | 1.0 | 2.7 | 15 | 276 | |
| L/HREE | 8.7 | 309 | 7.8 | 7.7 | 5.1 | 12 | 18 | 276 | |
| REY | 1972 | 309 | 1788 | 1760 | 1007 | 3229 | 21 | 276 |
Notes. Mn, Fe, and P2O5 are in wt%, trace elements are in ppm. Italicized colored values refer to statistical parameters for bulk crusts chemistry from Govorov, Kocebu, Il’ichev, Pegas, Alba, Pallada, Fedorov, Gramberg, Ita Mai Tai, Gelendzhik, and Butakova guyots, after [47]; other data are explained in text, statistical parameters for bulk crusts chemistry from Govorov, Kocebu, Vulkanolog, Skornyakova, Pegas, Il’ichev, Pallada, Gelendzhik, Butakov, and several guyots east of MST (Zatonsky, Nazimov, Zubov, Marova, and Rykachev), see guyots sites on https://www.ngdc.noaa.gov/gazetteer/. Var,% = variance; Min and Max = minimum and maximum element concentrations; n = number of analyses in the dataset.
Table A6.
Minor and trace element chemistry of MST Co-rich Fe-Mn crust layers III and II.
| III | II | |||||||||||
| Mean | Mediana | Min | Max | Var,% | n | Mean | Mediana | Min | Max | Var,% | n | |
| Fe | 17.69 | 10 | 139 | 17.10 | 14 | 131 | ||||||
| Mn | 23.67 | 13 | 140 | 22.35 | 13 | 140 | ||||||
| P2O5 | 1.21 | 65 | 128 | 1.60 | 74 | 123 | ||||||
| TiO2 | 1.77 | 18 | 64 | 1.82 | 17 | 60 | ||||||
| Mn/Fe | 1.34 | 19 | 139 | 1.35 | 25 | 130 | ||||||
| Co | 5654 | 5600 | 3200 | 9200 | 28 | 31 | 5535 | 5683 | 3200 | 7176 | 22 | 33 |
| 6500 | 24 | 140 | 5200 | 24 | 131 | |||||||
| Ni | 4023 | 4000 | 2559 | 5800 | 25 | 31 | 4838 | 4900 | 3270 | 6607 | 19 | 33 |
| 4700 | 22 | 140 | 5000 | 22 | 131 | |||||||
| Cr | 20 | 20 | 1.9 | 60 | 78 | 18 | 21 | 22 | 4.2 | 46 | 59 | 20 |
| V | 602 | 597 | 510 | 690 | 11 | 17 | 607 | 607 | 508 | 703 | 8 | 20 |
| Cu | 869 | 810 | 340 | 2357 | 46 | 31 | 1547 | 1500 | 700 | 3275 | 34 | 33 |
| 1030 | 45 | 140 | 1680 | 27 | 131 | |||||||
| Sc | 8.0 | 7.3 | 4.3 | 13 | 35 | 20 | 8.4 | 7.8 | 4.3 | 13 | 25 | 22 |
| Sn | 7.8 | 7.9 | 5.5 | 10 | 18 | 23 | 11 | 12 | 6.8 | 15 | 18 | 22 |
| Sb | 41 | 39 | 31 | 70 | 19 | 31 | 44 | 44 | 26 | 61 | 19 | 33 |
| W | 90 | 90 | 53 | 124 | 21 | 31 | 91 | 91 | 57 | 142 | 20 | 33 |
| Mo | 459 | 440 | 320 | 640 | 20 | 31 | 484 | 479 | 270 | 671 | 20 | 33 |
| 500 | 20 | 59 | 460 | 21 | 43 | |||||||
| Tl | 136 | 127 | 80 | 230 | 31 | 23 | 152 | 146 | 65 | 230 | 29 | 22 |
| Zn | 566 | 580 | 370 | 745 | 15 | 31 | 701 | 730 | 460 | 943 | 16 | 33 |
| 630 | 25 | 38 | 710 | 13 | 37 | |||||||
| Li | 2.9 | 2.0 | 0.97 | 8.8 | 69 | 23 | 5.1 | 4.7 | 1.6 | 10 | 53 | 22 |
| Be | 4.8 | 4.3 | 3.1 | 8.2 | 29 | 31 | 6.8 | 6.0 | 3.4 | 23 | 63 | 33 |
| Cs | 0.38 | 0.27 | 0.07 | 1.2 | 84 | 23 | 0.59 | 0.65 | 0.11 | 1.5 | 63 | 22 |
| Rb | 8.5 | 7.4 | 3.1 | 21 | 58 | 31 | 15 | 10 | 3.2 | 46 | 83 | 33 |
| Ba | 1351 | 1300 | 863 | 1988 | 20 | 31 | 1843 | 1797 | 994 | 3126 | 33 | 33 |
| Th | 14 | 14 | 6.6 | 22 | 32 | 31 | 10 | 10 | 2.6 | 17 | 45 | 33 |
| U | 13 | 14 | 10 | 19 | 14 | 31 | 12 | 13 | 9.4 | 16 | 14 | 33 |
| Nb | 55 | 53 | 32 | 88 | 26 | 31 | 59 | 61 | 17 | 91 | 31 | 33 |
| Ta | 0.50 | 0.41 | 0.05 | 1.2 | 62 | 31 | 0.49 | 0.40 | 0.05 | 1.7 | 70 | 33 |
| Pb | 1051 | 1127 | 72 | 1682 | 49 | 31 | 887 | 966 | 130 | 1530 | 44 | 33 |
| 1500 | 16 | 38 | 1220 | 16 | 37 | |||||||
| Sr | 1419 | 1458 | 1100 | 1731 | 12 | 31 | 1463 | 1500 | 1000 | 1769 | 12 | 33 |
| Zr | 329 | 230 | 45 | 877 | 78 | 31 | 430 | 380 | 35 | 1100 | 83 | 33 |
| Hf | 5.0 | 2.9 | 0.7 | 11 | 74 | 31 | 6.9 | 5.3 | 0.77 | 17 | 82 | 33 |
| Bi | 32 | 31 | 20 | 54 | 28 | 23 | 36 | 37 | 20 | 69 | 33 | 22 |
| Ga | 16 | 11 | 5.4 | 88 | 107 | 31 | 13 | 11 | 0.03 | 39 | 61 | 33 |
| As | 232 | 230 | 130 | 343 | 24 | 31 | 207 | 212 | 72 | 305 | 26 | 33 |
| Cd | 4.0 | 4.1 | 2.9 | 5.1 | 16 | 23 | 4.0 | 4.0 | 2.7 | 5.4 | 19 | 22 |
| Te | 43 | 43 | 26 | 68 | 26 | 23 | 55 | 53 | 30 | 95 | 26 | 22 |
| La | 231 | 226 | 146 | 320 | 20 | 31 | 221 | 220 | 130 | 300 | 23 | 33 |
| 290 | 17 | 22 | 257 | 17 | 24 | |||||||
| Ce | 696 | 690 | 400 | 1153 | 27 | 31 | 860 | 770 | 420 | 1613 | 33 | 33 |
| 881 | 29 | 22 | 903 | 22 | 24 | |||||||
| Pr | 50 | 50 | 34 | 74 | 22 | 31 | 49 | 50 | 29 | 66 | 22 | 33 |
| 60 | 22 | 22 | 50 | 16 | 24 | |||||||
| Nd | 218 | 219 | 148 | 311 | 20 | 31 | 212 | 215 | 120 | 274 | 21 | 33 |
| 237 | 21 | 22 | 202 | 16 | 24 | |||||||
| Sm | 45 | 46 | 30 | 64 | 21 | 31 | 44 | 46 | 24 | 57 | 23 | 33 |
| 52 | 23 | 22 | 43 | 16 | 24 | |||||||
| Eu | 12 | 11 | 7.0 | 17 | 21 | 31 | 11 | 11 | 6.4 | 15 | 20 | 33 |
| 12 | 22 | 22 | 10 | 14 | 24 | |||||||
| Gd | 56 | 54 | 35 | 80 | 20 | 31 | 51 | 51 | 31 | 79 | 19 | 33 |
| 65 | 21 | 22 | 57 | 16 | 24 | |||||||
| Tb | 8.0 | 7.7 | 5.3 | 12 | 20 | 31 | 7.2 | 7.3 | 4.6 | 10 | 19 | 33 |
| 9.0 | 21 | 22 | 8.0 | 17 | 24 | |||||||
| Dy | 48 | 46 | 32 | 67 | 18 | 31 | 42 | 43 | 27 | 59 | 17 | 33 |
| 55 | 25 | 22 | 46 | 20 | 24 | |||||||
| Ho | 9.6 | 9.2 | 6.7 | 14 | 16 | 31 | 8.5 | 8.6 | 5.6 | 11 | 15 | 33 |
| 12 | 29 | 22 | 10 | 23 | 24 | |||||||
| Er | 28 | 27 | 19 | 40 | 16 | 31 | 25 | 25 | 16 | 33 | 15 | 33 |
| 33 | 31 | 22 | 30 | 24 | 24 | |||||||
| Tm | 4.1 | 3.9 | 2.9 | 5.9 | 15 | 31 | 3.5 | 3.6 | 2.4 | 4.5 | 15 | 33 |
| 5.0 | 29 | 22 | 4.0 | 23 | 24 | |||||||
| Yb | 26 | 26 | 20 | 36 | 13 | 31 | 23 | 24 | 16 | 28 | 14 | 33 |
| 32 | 39 | 22 | 29 | 26 | 24 | |||||||
| Lu | 4.1 | 4.1 | 3.1 | 5.6 | 13 | 31 | 3.6 | 3.7 | 2.6 | 4.4 | 13 | 33 |
| 5.0 | 40 | 22 | 5.0 | 27 | 24 | |||||||
| Y | 167 | 170 | 94 | 230 | 18 | 31 | 167 | 170 | 92 | 247 | 26 | 33 |
| 189 | 20 | 22 | 231 | – | – | – | 35 | 24 | ||||
| LREE | 1252 | 1174 | 808 | 1834 | 22 | 31 | 1396 | 1297 | 743 | 2285 | 27 | 33 |
| 1532 | 22 | 1465 | 24 | |||||||||
| HREE | 183 | 177 | 123 | 257 | 17 | 31 | 164 | 167 | 105 | 229 | 16 | 33 |
| 216 | 22 | 189 | 24 | |||||||||
| Ce* | 1.5 | 1.4 | 1.1 | 2.0 | 19 | 31 | 1.9 | 1.8 | 1.4 | 2.8 | 21 | 33 |
| 1.5 | 22 | 1.8 | 24 | |||||||||
| L/HREE | 6.9 | 6.9 | 4.8 | 10 | 20 | 31 | 8.5 | 7.7 | 6.2 | 13 | 23 | 33 |
| 7.1 | 22 | 7.8 | 24 | |||||||||
| REY | 1602 | 1506 | 1111 | 2189 | 19 | 31 | 1727 | 1593 | 958 | 2646 | 24 | 33 |
| 1937 | 22 | 1775 | 24 |
Notes. Mn, Fe, TiO2, and P2O5 are in wt%, trace elements are in ppm. Italicized colored values refer to statistical parameters of chemistry for crust layers III and II from Govorov, Kocebu, Il’ichev, Pegas, Alba, Pallada, Fedorov, Gramberg, Ita Mai Tai, Gelendzhik, and Butakov guyots, after [47]; other data are explained in text, statistical parameters for chemistry for crust layers III and II from Govorov, Kocebu, Vulkanolog, Gelendzhik, and Butakov guyots. Var,% = variance; Min and Max = minimum and maximum element concentrations; n = number of analyses in the dataset.
Table A7.
Minor and trace element chemistry of MST Co-rich Fe-Mn crust layers I-2 and I-1.
| I-2 | I-1 | |||||||||||
| Mean | Mediana | Min | Max | Var,% | n | Mean | Mediana | Min | Max | Var,% | n | |
| Fe | 11.17 | 26 | 106 | 12.40 | 22 | 89 | ||||||
| Mn | 17.96 | 20 | 107 | 21.95 | 15 | 89 | ||||||
| P2O5 | 9.74 | 47 | 97 | 6.93 | 38 | 84 | ||||||
| TiO2 | 0.72 | 56 | 51 | 0.79 | 66 | 37 | ||||||
| Mn/Fe | 1.68 | 25 | 106 | 1.85 | 26 | 89 | ||||||
| Co | 3066 | 2949 | 1000 | 5994 | 41 | 25 | 3914 | 4000 | 2400 | 5337 | 21 | 29 |
| 3200 | 31 | 107 | 4100 | 23 | 89 | |||||||
| Ni | 4597 | 4092 | 2300 | 7932 | 38 | 25 | 4132 | 3864 | 1800 | 7600 | 35 | 29 |
| 4500 | 31 | 107 | 4200 | 29 | 89 | |||||||
| Cr | 13 | 13 | 3.0 | 27 | 63 | 22 | 18 | 22 | 1.5 | 52 | 80 | 26 |
| V | 445 | 456 | 293 | 549 | 19 | 12 | 673 | 688 | 440 | 880 | 15 | 15 |
| Cu | 1377 | 1300 | 890 | 2400 | 27 | 25 | 1106 | 981 | 400 | 2533 | 45 | 29 |
| 1430 | 27 | 107 | 1170 | 31 | 88 | |||||||
| Sc | 10 | 10 | 6.4 | 17 | 28 | 22 | 7.1 | 5.9 | 3.2 | 23 | 59 | 22 |
| Sn | 9.3 | 9.5 | 4.1 | 15 | 31 | 22 | 7.8 | 8.0 | 3.8 | 13 | 29 | 22 |
| Sb | 23 | 18 | 9.7 | 49 | 55 | 25 | 30 | 29 | 13 | 53 | 39 | 29 |
| W | 61 | 58 | 23 | 108 | 41 | 25 | 44 | 41 | 20 | 93 | 43 | 29 |
| Mo | 383 | 384 | 180 | 642 | 32 | 25 | 580 | 580 | 320 | 840 | 26 | 29 |
| 460 | 26 | 21 | 650 | 16 | 18 | |||||||
| Tl | 122 | 110 | 46 | 217 | 42 | 22 | 125 | 119 | 77 | 195 | 29 | 22 |
| Zn | 624 | 590 | 350 | 1034 | 32 | 25 | 724 | 701 | 370 | 1435 | 33 | 29 |
| 640 | 23 | 21 | 730 | 22 | 22 | |||||||
| Li | 3.5 | 3.1 | 2.0 | 6.7 | 37 | 22 | 2.1 | 1.6 | 0.84 | 6.8 | 76 | 22 |
| Be | 4.8 | 4.4 | 2.0 | 8.3 | 30 | 25 | 6.3 | 5.1 | 1.9 | 27 | 74 | 29 |
| Cs | 0.39 | 0.41 | 0.10 | 0.84 | 51 | 22 | 0.16 | 0.14 | 0.06 | 0.47 | 63 | 22 |
| Rb | 6.9 | 5.4 | 3.2 | 26 | 76 | 25 | 4.7 | 4.0 | 1.3 | 12 | 55 | 29 |
| Ba | 1535 | 1300 | 950 | 3119 | 37 | 25 | 2528 | 2318 | 1266 | 4396 | 35 | 29 |
| Th | 5.3 | 3.9 | 2.2 | 24 | 87 | 25 | 11 | 11 | 3.1 | 19 | 34 | 29 |
| U | 10 | 10 | 7.4 | 13 | 14 | 25 | 12 | 12 | 8.9 | 17 | 15 | 29 |
| Nb | 27 | 20 | 5.3 | 66 | 68 | 25 | 29 | 22 | 9.3 | 54 | 48 | 29 |
| Ta | 0.50 | 0.44 | 0.13 | 1.2 | 66 | 22 | 0.49 | 0.42 | 0.10 | 1.1 | 60 | 22 |
| Pb | 879 | 810 | 550 | 1483 | 30 | 25 | 1596 | 1638 | 788 | 2300 | 25 | 29 |
| 1050 | 36 | 21 | 1840 | 22 | 22 | |||||||
| Sr | 1525 | 1595 | 1100 | 1800 | 11 | 25 | 1764 | 1779 | 1300 | 2252 | 12 | 29 |
| Zr | 275 | 190 | 55 | 674 | 75 | 25 | 250 | 155 | 10 | 691 | 85 | 29 |
| Hf | 4.7 | 3.2 | 0.88 | 12 | 78 | 25 | 3.5 | 2.5 | 0.44 | 11 | 83 | 29 |
| Bi | 45 | 42 | 25 | 81 | 34 | 22 | 77 | 81 | 45 | 109 | 21 | 22 |
| Ga | 8.9 | 9.3 | 0.03 | 16 | 47 | 25 | 11 | 12 | 0.03 | 21 | 45 | 29 |
| As | 133 | 130 | 72 | 207 | 22 | 25 | 163 | 161 | 110 | 225 | 18 | 29 |
| Cd | 3.3 | 3.2 | 1.4 | 6.3 | 37 | 22 | 3.4 | 3.3 | 1.9 | 5.2 | 28 | 22 |
| Te | 49 | 49 | 26 | 81 | 30 | 22 | 59 | 57 | 37 | 88 | 23 | 22 |
| La | 224 | 200 | 146 | 433 | 30 | 25 | 290 | 272 | 130 | 481 | 31 | 29 |
| 294 | 23 | 27 | 345 | 17 | 17 | |||||||
| Ce | 854 | 758 | 440 | 1676 | 37 | 25 | 1455 | 1483 | 849 | 2177 | 23 | 29 |
| 953 | 24 | 27 | 1634 | 18 | 17 | |||||||
| Pr | 42 | 41 | 26 | 63 | 25 | 25 | 50 | 45 | 29 | 84 | 29 | 29 |
| 51 | 36 | 27 | 56 | 18 | 17 | |||||||
| Nd | 185 | 179 | 110 | 306 | 26 | 25 | 215 | 210 | 117 | 351 | 27 | 29 |
| 209 | 39 | 27 | 219 | 19 | 17 | |||||||
| Sm | 35 | 34 | 21 | 52 | 25 | 25 | 39 | 37 | 22 | 61 | 27 | 29 |
| 43 | 44 | 27 | 42 | 20 | 17 | |||||||
| Eu | 9.2 | 8.9 | 5.8 | 13 | 22 | 25 | 10 | 9.7 | 6.2 | 15 | 24 | 29 |
| 11 | 42 | 27 | 10 | 15 | 17 | |||||||
| Gd | 49 | 47 | 35 | 71 | 21 | 25 | 55 | 53 | 29 | 89 | 25 | 29 |
| 61 | 37 | 27 | 63 | 14 | 17 | |||||||
| Tb | 6.7 | 6.6 | 4.3 | 9.9 | 20 | 25 | 7.1 | 7.0 | 4.5 | 11 | 20 | 29 |
| 8.0 | 49 | 27 | 7.0 | 21 | 17 | |||||||
| Dy | 42 | 42 | 28 | 63 | 20 | 25 | 44 | 42 | 28 | 69 | 21 | 29 |
| 53 | 53 | 27 | 49 | 25 | 17 | |||||||
| Ho | 9.2 | 9.0 | 6.3 | 15 | 19 | 25 | 9.5 | 8.7 | 6.2 | 15 | 21 | 29 |
| 12 | 51 | 27 | 11 | 27 | 17 | |||||||
| Er | 28 | 28 | 19 | 44 | 19 | 25 | 29 | 27 | 18 | 47 | 21 | 29 |
| 38 | 50 | 27 | 34 | 30 | 17 | |||||||
| Tm | 3.9 | 3.9 | 2.8 | 6.2 | 18 | 25 | 4.1 | 3.9 | 2.7 | 6.5 | 20 | 29 |
| 5.0 | 48 | 27 | 5.0 | 26 | 17 | |||||||
| Yb | 26 | 25 | 18 | 41 | 18 | 25 | 27 | 26 | 18 | 41 | 19 | 29 |
| 36 | 53 | 27 | 33 | 30 | 17 | |||||||
| Lu | 4.2 | 4.1 | 3.0 | 6.7 | 18 | 25 | 4.3 | 4.2 | 3.0 | 7.0 | 20 | 29 |
| 6.0 | 51 | 27 | 5.0 | 34 | 17 | |||||||
| Y | 306 | 272 | 170 | 718 | 38 | 25 | 272 | 210 | 130 | 560 | 49 | 29 |
| 393 | 32 | 27 | 308 | 31 | 17 | |||||||
| LREE | 1350 | 1224 | 821 | 2343 | 32 | 25 | 2059 | 2020 | 1316 | 2927 | 22 | 29 |
| 1561 | 27 | 2306 | 17 | |||||||||
| HREE | 168 | 167 | 117 | 256 | 19 | 25 | 179 | 173 | 109 | 268 | 20 | 29 |
| 219 | 27 | 207 | 17 | |||||||||
| Ce* | 2.0 | 1.9 | 1.4 | 3.0 | 17 | 25 | 2.9 | 2.9 | 1.5 | 4.5 | 22 | 29 |
| 1.8 | 27 | 2.7 | 17 | |||||||||
| L/HREE | 7.9 | 7.4 | 5.7 | 12 | 21 | 25 | 12 | 12 | 5.6 | 16 | 20 | 29 |
| 7.1 | 27 | 11 | 17 | |||||||||
| REY | 1825 | 1620 | 1201 | 3183 | 30 | 25 | 2510 | 2403 | 1648 | 3546 | 22 | 29 |
| 2173 | 27 | 2821 | 17 |
Notes. Mn, Fe, TiO2, and P2O5 are in wt%, trace elements are in ppm. Italicized colored values refer to statistical parameters of chemistry for crust layers I-2 and I-1 from Govorov, Kocebu, Il’ichev, Pegas, Alba, Pallada, Fedorov, Gramberg, Ita Mai Tai, Gelendzhik, and Butakov guyots, after [47]; other data are explained in text, statistical parameters for chemistry of crust layers I-2 and I-1 from Govorov, Kocebu, Vulkanolog, Gelendzhik, and Butakov guyots. Var,% = variance; Min and Max = minimum and maximum element concentrations; n = number of analyses in the dataset.
References
- Lisitsyn, A.P. (Ed.) Ferromanganese Crusts and Nodules on Seamounts of the Pacific; Nedra: Moscow, Russia, 1990; 227p. (in Russian).
- Baturin, G.N. Oceanic Mineral Resources; Nauka: Moscow, Russia, 1993; 303p. (in Russian).
- Andreev, S.I. (Ed.) Cobalt-Bearing Ferromanganese Crusts and Nodules of the Pacific Ocean; VNIIOkeangeologiya: St-Petersburg, Russia, 1993; 190p. (In Russian).
- Andreev, S.I. (Ed.) Cobalt-Rich Ores of the World Ocean; VNIIOkeangeologiya: St. Petersburg, Russia, 2002; 168p. (in Russian).
- Hein, J.R.; Mizell, K.; Koschinsky, A.; Conrad, T.A. Deep-ocean mineral deposits as a source of critical metals for high- and green-technology applications: Comparison with land-based resources. Ore Geol. Rev. 2013, 51, 1–14. [CrossRef]
- Halbach, P.E.; Jahn, A.; Cherkashov, G. Marine Co-Rich Ferromanganese Crust Deposits: Description and Formation, Occurrences and Distribution, Estimated World-wide Resources. In: Sharma, R., (Ed.) Deep-Sea Mining: Resource Potential, Technical and Environmental Considerations; Springer International Publishing: Cham, Switzerland, 2017; 65–141. [CrossRef]
- Bogdanov, Y.A.; Sorokhtin, O.G.; Zonenshain, L.P.; Kuptsov, V.M.; Lisitsyna, N.A.; Podrazhansky, A.M. Ferromanganese Crusts and Nodules on Pacific Seamounts; Nauka: Moscow, Russia, 1990; 229p. (In Russian).
- Bogdanov, Yu.A.; Gurvich, E.G.; Bogdanova, O.Yu.; Dubinin, A.V.; Gorshkov, A.I.; Jansa, L.F. Ferromanganese crusts and nodules from guyots of the Northwestern Pacific. Geochem. Int. 1998, 36(5), 455–466.
- Melnikov, M.E. Deposits of Cobalt-Rich Manganese Crusts; FGUGP GNTS; Yuzhmorgeologiya: Gelendzhik, Russia, 2005; 230p. (In Russian).
- Melnikov, M.E. Cobalt-rich ferromanganese crusts; In World Ocean. V.III. Solid Minerals and Gas Hydrates in the Ocean; Nauchny Mir: Moscow, Russia, 2018; pp.285–322. (In Russian).
- Volokhin, Y.G.; Melnikov, M.E.; Shkolnik, E.L.; Vasiliev, B.I.; Govorin, I.N.; Khersberg, L.B.; Zadornov, M.V.; Baturin, G.N.; Mechetin, A.V.; Chudaev, O.V.; et al. Guyots of the Western Pacific and their Mineralization; Nauka: Moscow, Russia, 1995; 368p. (In Russian).
- Pletnev, S.P.; Melnikov, M.E.; S’edin, V.T.; Sedysheva, T.E.; Avdonin, V.V.; Anokhin, V.M.; Zakharov, Y.D.; Punina, T.A.; Smirnova, O.L. Geology of Guyots in the Magellan Seamounts (Pacific Ocean); Dalnauka: Vladivostok, Russia, 2020; 200p. (In Russian).
- Melnikov, M.Y.; Pletnev, S.P.; Anokhin, V.M.; Sedysheva, T.E.; Ivanov, V.V. Volcanic edifice on guyots of the Magellan Seamounts (Pacific Ocean). Russ. J. Pacific Geol. 2016, 10(6), 435–4452. [CrossRef]
- Melnikov, M.Y.; Podschuveit, V.B.; Pulyaeva, I.A.; Nevretdinov, E.B. Middle Miocene volcanic structures on the Dalmorgeologiya Guyot (Magellan Seamounts, Pacific Ocean). Russ. J. Pacific Geol. 2000, 19, 38–46. (In Russian).
- Koppers, A.A.P.; Staudigel, H.; Wijbrans, J.R.; Pringle, M.S. The Magellan seamount trail: Implications for Cretaceous hotspotvolcanism and absolute Pacific Plate motion. Earth Planet. Sci. Lett. (EPSL). 1998, 163, 53–68. [CrossRef]
- Koppers, A.A.P.; Staudigel, H.; Wijbrans, J.R. Dating crystalline groundmass separates of altered Cretaceous seamount basalts by the 40Ar/39Ar incremental heating technique. Chem. Geol. 2000, 166, 139–158. [CrossRef]
- Wei, H.; Zhang, G.-L.; Zhang, J.; Shi, X.-F.; Castillo, P.R.; Zhang, Y.; Zhang, W.-F.; Xu, Y.-G.; Li, H.-Y.; Zhang, H. Overlapping hotspot tracks and melts from diffuse plume materials in the upper mantle generated intraplate seamount groups in the WestPacific. Earth Planet. Sci. Lett. (EPSL). 2024, 643, 118901. [CrossRef]
- Peretyazhko, I.S.; Savina, E.A. Chemistry and crystallization conditions of minerals in metasomatized oceanic lithosphere and basaltic rocks of Govorov Guyot, Magellan Seamounts, Pacific Ocean. Minerals 2022, 12, 1305. [CrossRef]
- Peretyazhko, I.S.; Savina, E.A. Cretaceous intraplate volcanism of Govorov Guyot and formation models of the Magellan seamounts, Pacific Ocean. Intern. Geol. Rev. 2023, 65, 2479–2505. [CrossRef]
- Peretyazhko, I.S.; Savina, E.A.; Pulyaeva, I.A.; Yudin, D.S. Intraplate volcanism of the Alba Guyot. Geodynamic formation models of the Magellan Seamounts in the Pacific Ocean for 100 million years. Russ. Geol. Geophys. 2023, 64, 1–27. [CrossRef]
- Peretyazhko, I.S.; Savina, E.A.; Pulyaeva, I.A. Miocene petit-spot basanitic volcanoes on Cretaceous Alba Guyot (Magellan Seamount Trail, Pacific Ocean). Geosciences 2024, 14, 2522. [CrossRef]
- Avdonin, V.V.; Kruglyakov, V.V.; Lygina, T.I.; Melnikov, M.E.; Sergeeva, N.E. Oceanic Ferromanganese Ores: Genetic Interpretation of Structures and Textures; GEO: Moscow, Russia, 2014; p. 164. (in Russian).
- Melnikov, M.E.; Pulyaeva, I.A. Ferromanganese crusts deposits of Marcus-Wake and Magellan seamount, Western Pafic: structure, composition and age. Russ. J. Pac. Geol., 1995, 11, 525.
- Melnikov, M.E.; Pletnev, S.P. Age and formation conditions of the Co-rich manganese crust on guyots of the Magellan Seamounts. Lithol. Miner. Resour. 2013, 48(1), 1–13.
- Pletnev, S.P.; Smirnova, O.L.; Melnikov, M.E.; Punina, T.A.; Kopaevich, L.F. New paleontological data on Govorov, Vulkanolog, and Kocebu guyots (Magellan seamounts, Pacific). Russ. J. Pac. Geol. 2017; 11(2), 148–153. [CrossRef]
- Pulyaeva, I.A. Stratification of ferromanganese crusts on the Magellan seamounts. In: Proc. 30th International Geological Congress; Beijing, China, 1996, 13, 111–128.
- Pulyaeva, I.A.; Hein, J.R. Paleoceanographic conditions during the formation of Fe-Mn crusts from the Pacific Ocean: Biostratigraphic and compositional evidence. In: Abstracts and Proceedings, 39th Underwater Mining Institute; Gelendzhik, Russia, 2010, 1–12. (in Russian).
- Pulyaeva, I.A.; Hein, J.R. Chronostratigraphy of Fe-Mn crusts from the Pacific Ocean. In: Proc. Joint International Conference on Minerals of the Ocean-5 and Deep-Sea Minerals and Mining-3; St. Petersburg, Russia, 2010, 38–40. (in Russian).
- Pulyaeva, I.A.; Hein, J.R. Hydrogenetic Fe-Mn crusts from the Atlantic and Pacific oceans: Geological evolution and conditions of formation. In: Marine Minerals: Recent Innovations in Technology; UMI: Anaheim, CA, USA, 2011.
- Avdonin, V.V.; Sergeeva, N.E. Formation patterns of ferromanganese crusts and nodules. Bull. Moscow State Univ. Ser. 4: Geol. 2003, 5, 31–39. (in Russian).
- Bogdanova, O.Yu.; Novikov, G.V.; Bogdanov, Yu.A.; Gorshkov, A.I. Mineralogy and morphogenetic types of ferromanganese deposits in the World ocean. Geol. Ore Dep. 2008, 50(6), 462–469.
- Baturin, G.N.; Dubinchuk, V.T.; Azarnova, L.A.; Mel'nikov, M.E. Minerals of rare earth elements in the phosphate fraction of ferromanganese crusts on seamounts. Dokl. Earth Sci. 2006, 411 (9), 1362-1365. [CrossRef]
- Hein; J.R., Koschinsky, A.; Bau, M.; Manheim, F.T.; Kang, J.-K.; Roberts, L., Cobalt-rich ferromanganese crusts in the Pacific. Handbook of Marine Mineral Deposits 2000, 18, pp.239–273.
- Hein, J.R.; Yeh, H.-W.; Gunn, S.H.; Sliter, W.V.; Benninger, L.M.; Wang, C.-H. Two major Cenozoic episodes of phosphogenesis recorded in equatorial Pacific seamount deposits. Paleoceanography 1993, 8, 293–311. [CrossRef]
- Koschinsky, A.; Stascheit, A.; Bau, M.; Halbach, P. Effects of phosphatization on the geochemical and mineralogical composition of marine ferromanganese crusts. Geochim. Cosmochim. Acta 1997, 61, 4079–4094. [CrossRef]
- Baturin, G.N.; Yushina, I.G. Rare earth elements in phosphate-ferromanganese crusts on Pacific seamounts. Lithol. Miner. Resour. 2007, 42 (2), 101–117. [CrossRef]
- Cui, Y., Shi, X., Liu, J., Ren, X. Effects of phosphatization on the elemental association of cobalt-rich crusts. Bull. Geol. Sci. Tech. 2008, 27, 61–67. [CrossRef]
- Ren, J.; He, G.; Yao, H.; Deng, X.; Zhu, K.; Yang, S. The effects of phosphatization on the REY of Co-rich Fe-Mn crusts. Mar. Geol. Quat. Geol. 2017, 37(2), 33–43. [CrossRef]
- Martini, E.; Worsley, T. Standard Neogene calcareous nannoplankton zonation. Nature 1970, 225, 289–290.
- Martini, E. Standard Tertiary and Quaternary calcareous nannoplankton zonation. In: Farinacci, A. (Ed.) Proc. 2nd Planktonic Conference; Edizioni Tecnoscienza: Bologna, Italy, 1971, 2, 1225–1230.
- Bukry, D. Biostratigraphy of Cenozoic marine sediment by calcareous nannofossils. Micropaleontology 1978, 24(1), 44–60.
- Okada, H.; Bukry, D. Supplementary modification and introduction of code numbers to the low latitude coccolith biostratigraphic zonation. Mar. Micropaleontol. 1980, 5, 321–325. [CrossRef]
- Koschinsky, A.; Hein, J.R. Marine Ferromanganese Encrustations: Archives of Changing Oceans. Elements 2017, 13, 177–182. [CrossRef]
- Hein, J.R.; Koschinsky, A. Deep-ocean ferromanganese crusts and nodules. Treatise Geochem. 2014, 13, 273–291. [CrossRef]
- Glasby, G.P.; Ren, X.; Shi, X.; Pulyaeva, I.A. Co-rich Mn crusts from the Magellan seamounts cluster: The long journey through time. Geo-Mar Lett. 2007, 27, 315–323. [CrossRef]
- Koschinsky, A.; Hein, J. Acquisition of elements from seawater by ferromanganese crusts: Solid phase associations and seawater speciation. Mar. Geol. 2003, 19, 331–351. [CrossRef]
- Melnikov, M.E.; Pletnev S.P. Distribution of cerium in accumulations of manganese crusts of different ranks on the Magellan seamount (Pacific Ocean). Geology and minerals of the world ocean 2009, 1, 23–26. (In Russian).
- Asavin, A.M.; Kubrakova, I.V.; Melnikov, M.E.; Tyutyunnik, O.A.; Chesalova, E.I. Geochemical zoning in ferromanganese crusts of Ita-Mai-Tai guyot. Geochem. Int. 2010, 48 (5), 423–445. [CrossRef]
- Yang, K.; Ma, W.; Zhang, W.; Li, Z.; He, G.; Li, X.; Qiu, Z.; Wang, H.; Zhao, B.; Yang, Y.; Wei, Z.; Liu, Y. Geological and geochemical characteristics of shallow-buried ferromanganese crusts from Weijia Guyot and their resource potential. Marine Geol., 2023, 464(5):107119. [CrossRef]
- Novikov, G.V.; Melnikov, M.E.; Bogdanova, O.Y.; Drozdova, A.N.; Lobus, N.V. Mineralogy and geochemistry of Co-bearing manganese crusts from the Govorov and Volcanologist guyots of the Magellan Seamounts (Pacific Ocean). Oceanology 2017. 57 (5), 716–722. [CrossRef]
- Novikov, G.V.; Lobkovsky, L.I.; Lobusa, N.V.; Bogdanova, O.Y; Sedysheva, T.E. Ore content of Co-rich ferromanganese crust of the Govorov guyot of the Magellanic mountains of the Pacific Ocean. Dokl. Earth Sci. 2021, 499(2), 675–682. [CrossRef]
- Novikov, G.V.; Sedysheva, T.E.; Bogdanova, O.Yu.; Lobus, N.V. Cobalt-rich ferromanganese crusts of the Kotzebue guyot of the Magellan seamount of the Pacific Ocean: conditions of occurrence, mineralogy, and geochemistry. Oceanology 2022, 62 (6), 879–889. [CrossRef]
- Yang, K.; Park, H.; Son, S.K.; Baik, H.; Park, K.; Kim, J.; Yoon, J.; Park, C.H.; Kim, J. Electron microscopy study on the formation of ferromanganese crusts, western Pacific Magellan Seamounts. Mar. Geol. 2019, 410, 32–41. [CrossRef]
- Wang, L.; Zeng, Z. The geochemical features and genesis of ferromanganese deposits from Caiwei Guyot, Northwestern Pacific Ocean. J. Mar. Sci. Eng. 2022, 10, 1275. [CrossRef]
- Yang, Y.; Xiao, B.; Shi , X .; Zhang, S. Unusual cobalt behaviors and enrichment in cobalt-rich crust from the Magellan seamounts in the Western Pacific. Ore Geol. Rev. 2024, 173:106234. [CrossRef]
- Park, J.; Hwang, H.; An, Y.; Yang, K. High-resolution reconstruction of oxidation–reduction conditions: Raman spectroscopy and µ-XRF analysis of manganese nodule and crust on tabletop of Western Pacific Magellan Seamounts. Minerals 2024, 14, 1135. [CrossRef]
- Dubinin, A.V. Geochemistry of Rare-Earth Elements in the Ocean; Nauka: Moscow, Russia, 2006; 360p. (In Russian).
- McLennan, S.M. Rare earth elements in sedimentary rocks; influence of provenance and sedimentary processes. In: Lipin, B.R.; McKay, G.A. (Eds.), Geochemistry and Mineralogy of Rare Earth Elements. De Gruyter, Berlin. 1989; 169–200. [CrossRef]
- Bonatti, E.; Kraemer, T.; Rydell, H. Classification and genesis of submarine iron-manganese deposits. In: Horn, D.R. (Ed.) Ferromanganese Deposits on the Sea Floor; Arden House; Harriman: New York, 1972; 149p.
- Halbach, P.; Scherhag, C.; Hebisch, U.; Marchig, V. Geochemical and mineralogical control of different genetic types of deep-sea nodules from the Pacifc Ocean. Mineral. Deposita 1981, 16 (1), 59–84. [CrossRef]
- Josso, P.; Pelleter, E.; Pourret, O.; Fouquet, Y.; Etoubleau, J.; Cheron, S.; Bollinger, C. A new discrimination scheme for oceanic ferromanganese deposits using high field strength and rare earth elements. Ore Geol. Rev. 2017, 87, 3–15. . [CrossRef]
- Bau, M.; Schmidt, K.; Koschinsky, A.; Hein, J.; Kuhn, T.; Usui, A. Discriminating between different genetic types of marineferro-manganese crusts and nodules based on rare earth elements and yttrium. Chem. Geol. 2014, 381, 1–9. [CrossRef]
- Deng, X.; Liu, Y;, Luo, J.; Hu, G.; Wang, W.; Deng, X.; Wang, H.; Wei, Z.; Ren, J.; Zhou, J. Effects of phosphatization on the mineralogical and geochemical composition of marine ferromanganese crusts from the JiaXie Guyot in the Western Pacific: Constraints from high resolution analysis. Ore Geol. Rev. 2024, 172: 106209. [CrossRef]
- Jiang, X.D.; Sun, X.M.; Chou, Y.M.; Hein, J.R.; He, G.W.; Fu, Y.; Li, D.F.; Liao, J.L.; Ren, J.B. Geochemistry and origins of carbonate fluorapatite in seamount Fe-Mn crusts from the Pacific Ocean. Mar. Geol. 2020, 423, 106135. [CrossRef]
- Bau, M.; Koshcinsky, A. Oxidative scavenging of cerium on hydrous Fe oxide: Evidence from the distribution of rare earth elements and yttrium between Fe oxides and Mn oxides in hydrogenetic ferromanganese crusts. Geochem. J. 2009, 43 (1), 37–47. [CrossRef]
- Claude, C.; Suhr, G.; Hofmann, A.W.; Koschinsky, A. U-Th chronology and paleoceanographic record in a Fe-Mn crust from the NE Atlantic over the last 700 ka. Geochim. Cosmochim. Acta 2005, 69(20). 4845–4854. [CrossRef]
- Josso, P.; Parkinson, I.; Horstwood, M.; Lusty, P.; Chenery, S.; Murton, B. Improving confidence in ferromanganese crust age models: A composite geochemical approach. Chem. Geol. 2019, 513, 108–119. [CrossRef]
- Klemm, V.; Levasseur, S.; Frank, M.; Hein, J.R.; Halliday, A.N. Osmium isotope stratigraphy of a marine ferromanganese crust. Earth Planet. Sci. Lett. 2005, 238, 42–48. [CrossRef]
- Goto, К.Т.; Anbar, A.D.; Gordon, G.W.; Romaniello, S.J.; Shimoda, G.; Takaya, Y.; Tokumaru, A.; Nozaki, T.; Suzuki, K.; Machida, M.; Hanyu, T.; Usui, A. Uranium isotope systematics of ferromanganese crusts in the Pacific Ocean: Implications for the marine 238U/235U isotope system. Geochim. Cosmochim. Acta 2014, 146(20). 43-58. [CrossRef]
- Zeng, X.; Zhang, J.; Yao, H.; Ren, J.; Li, J. A high-resolution Os-Nd-Pb isotopic record of a hydrogenous Fe–Mn crust from the Northwestern Pacific and its response to plate motion. Mar. Geol. 2023, 459, 107028. [CrossRef]
- Peng, J.; Li, D.; Poulton, S.W.; O’Sullivan G.J.; Chew, D.; Yu Fu, Y.; Sun, X. Episodic intensification of marine phosphorus burial over the last 80 million years. Nat. Com. 2024, 15:7446. [CrossRef]
- Puteanus, D.; Halbach, P. Correlation of Co concentration and growth rate — a method for age determination of ferromanganese crusts. Chem. Geol. 1988, 69, 73–85. [CrossRef]
- Halbach, P.; Segl, M.; Puteanus, D.; Mangini, A. Co-fluxes and growth rates in ferromanganese deposits from central Pacific seamount areas. Nature 1983, 304, 716-719. [CrossRef]
- Manheim, F.T.; Lane-Bostwick, C.M. Cobalt in ferromanganese crusts as a monitor of hydrothermal discharge on the Pacific sea floor. Nature 1988, 335, 59–62. [CrossRef]
Figure 1.
Magellan Seamounts in the Pacific (a) and guyots in the northwestern MST flank (b) from https://maps.ngdc.noaa.gov/viewers/bathymetry/.
Figure 1.
Magellan Seamounts in the Pacific (a) and guyots in the northwestern MST flank (b) from https://maps.ngdc.noaa.gov/viewers/bathymetry/.
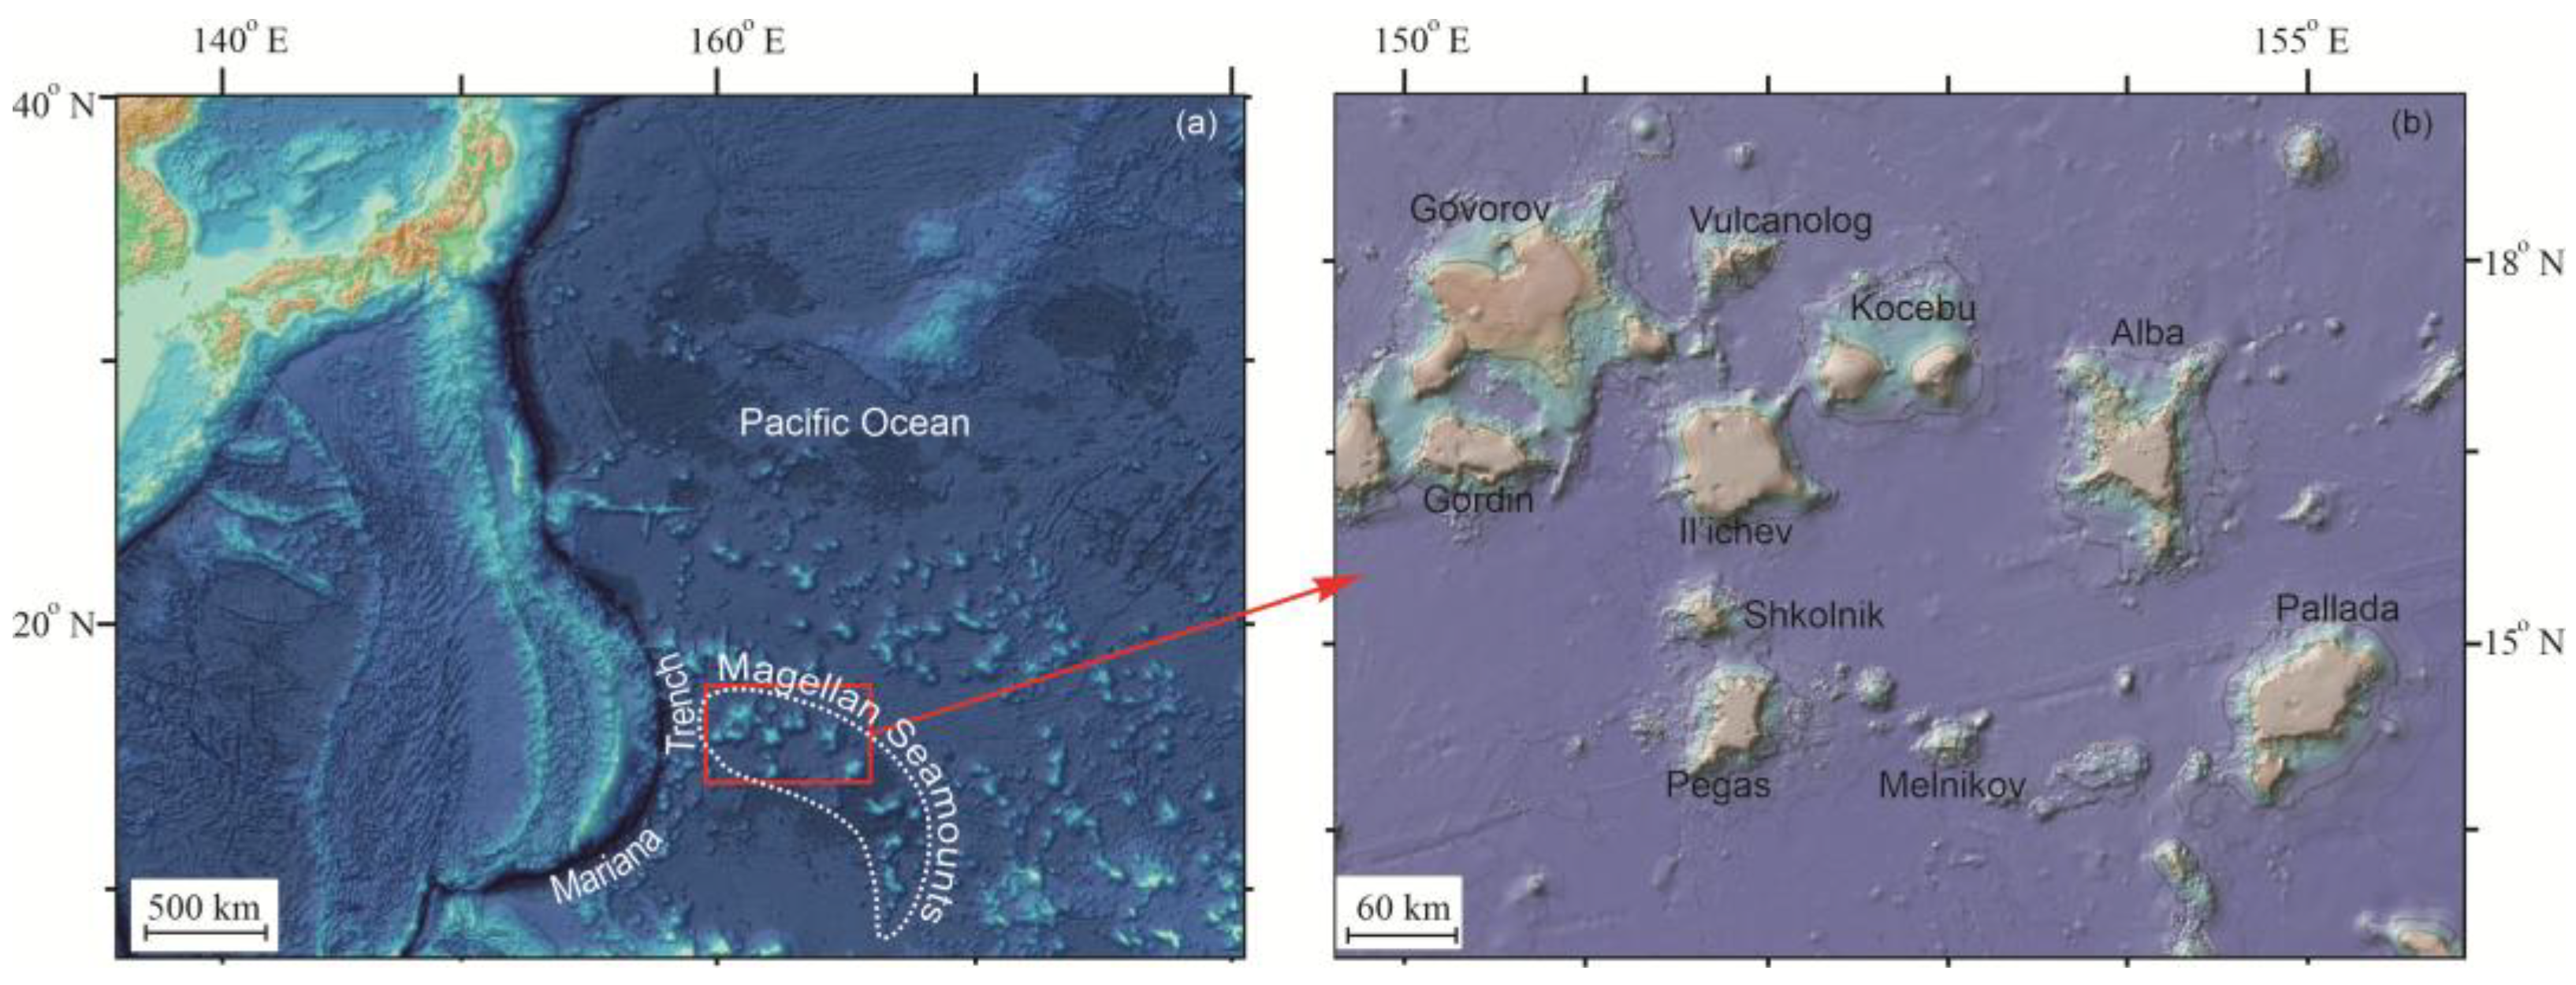
Figure 2.
Generalized section of MST Co-rich Fe-Mn crusts, after [9,23,24] and an example of a full section of crust from the Butakov Guyot (sample 37D87-1).
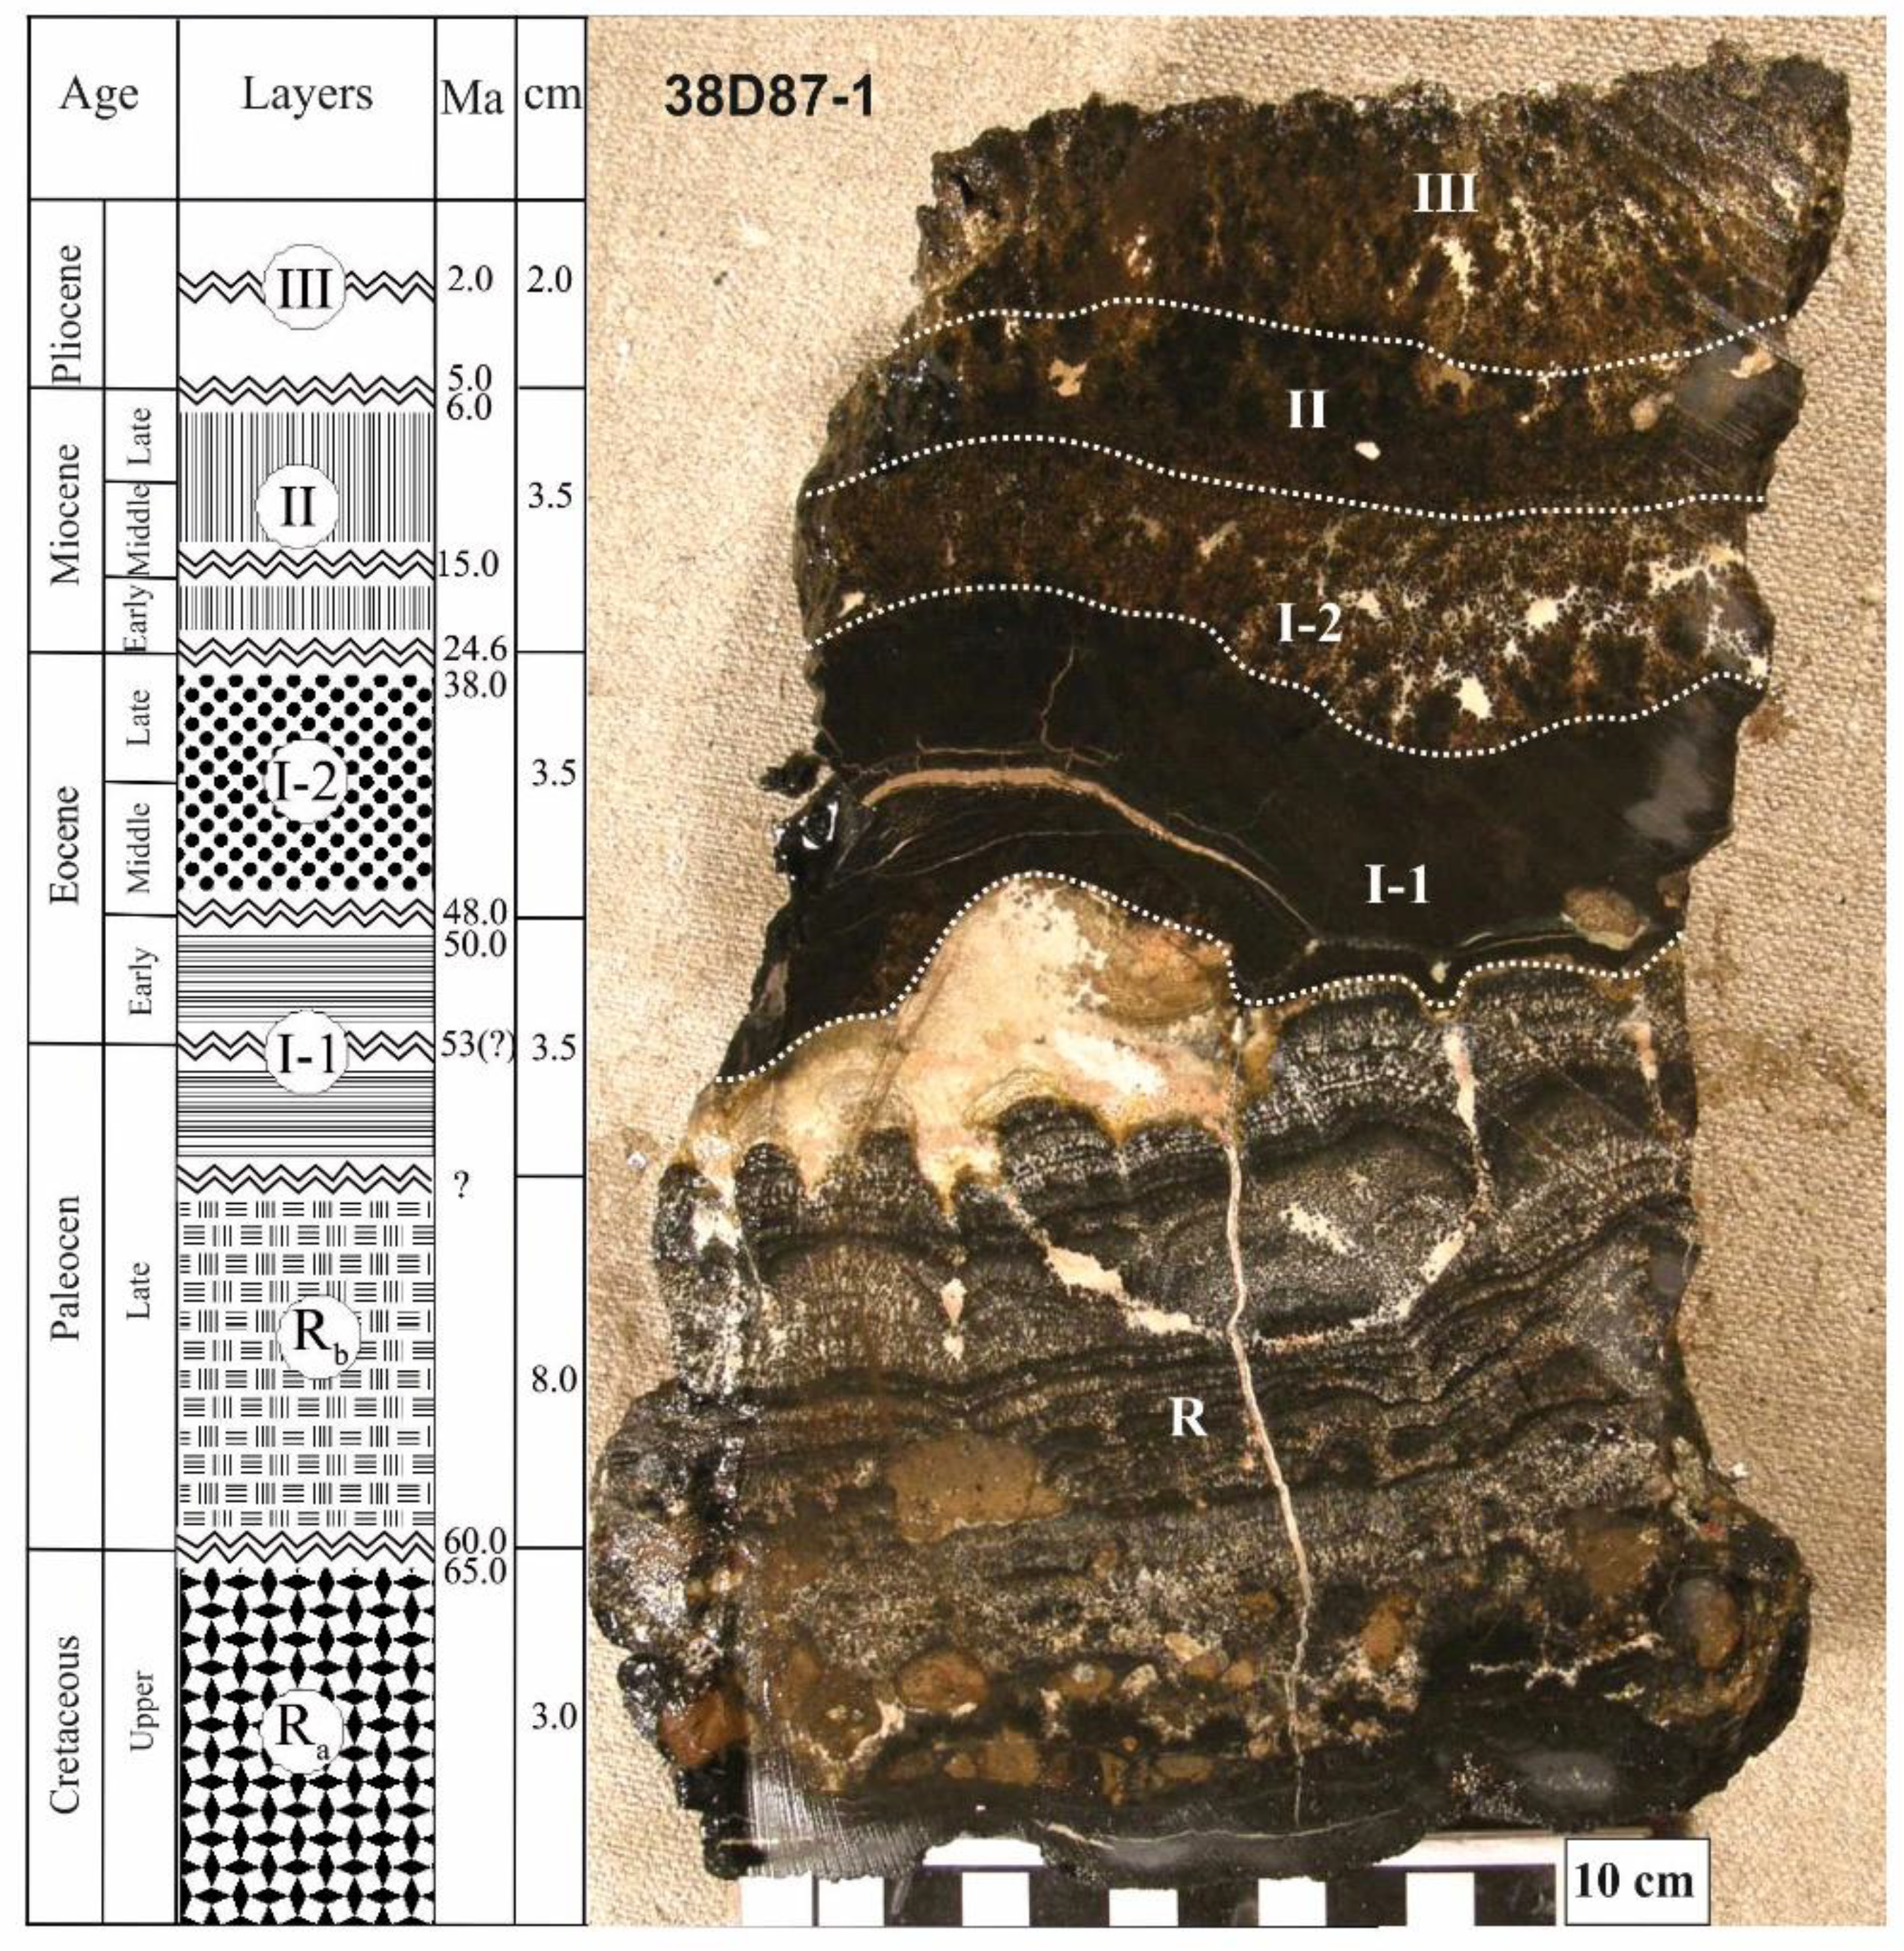
Figure 3.
Cross sections of Fe-Mn crusts from Butakov and Lomilik guyots, with identified index species of calcareous nannoplankton [39,40,41,42] modified after a conference presentation [29].
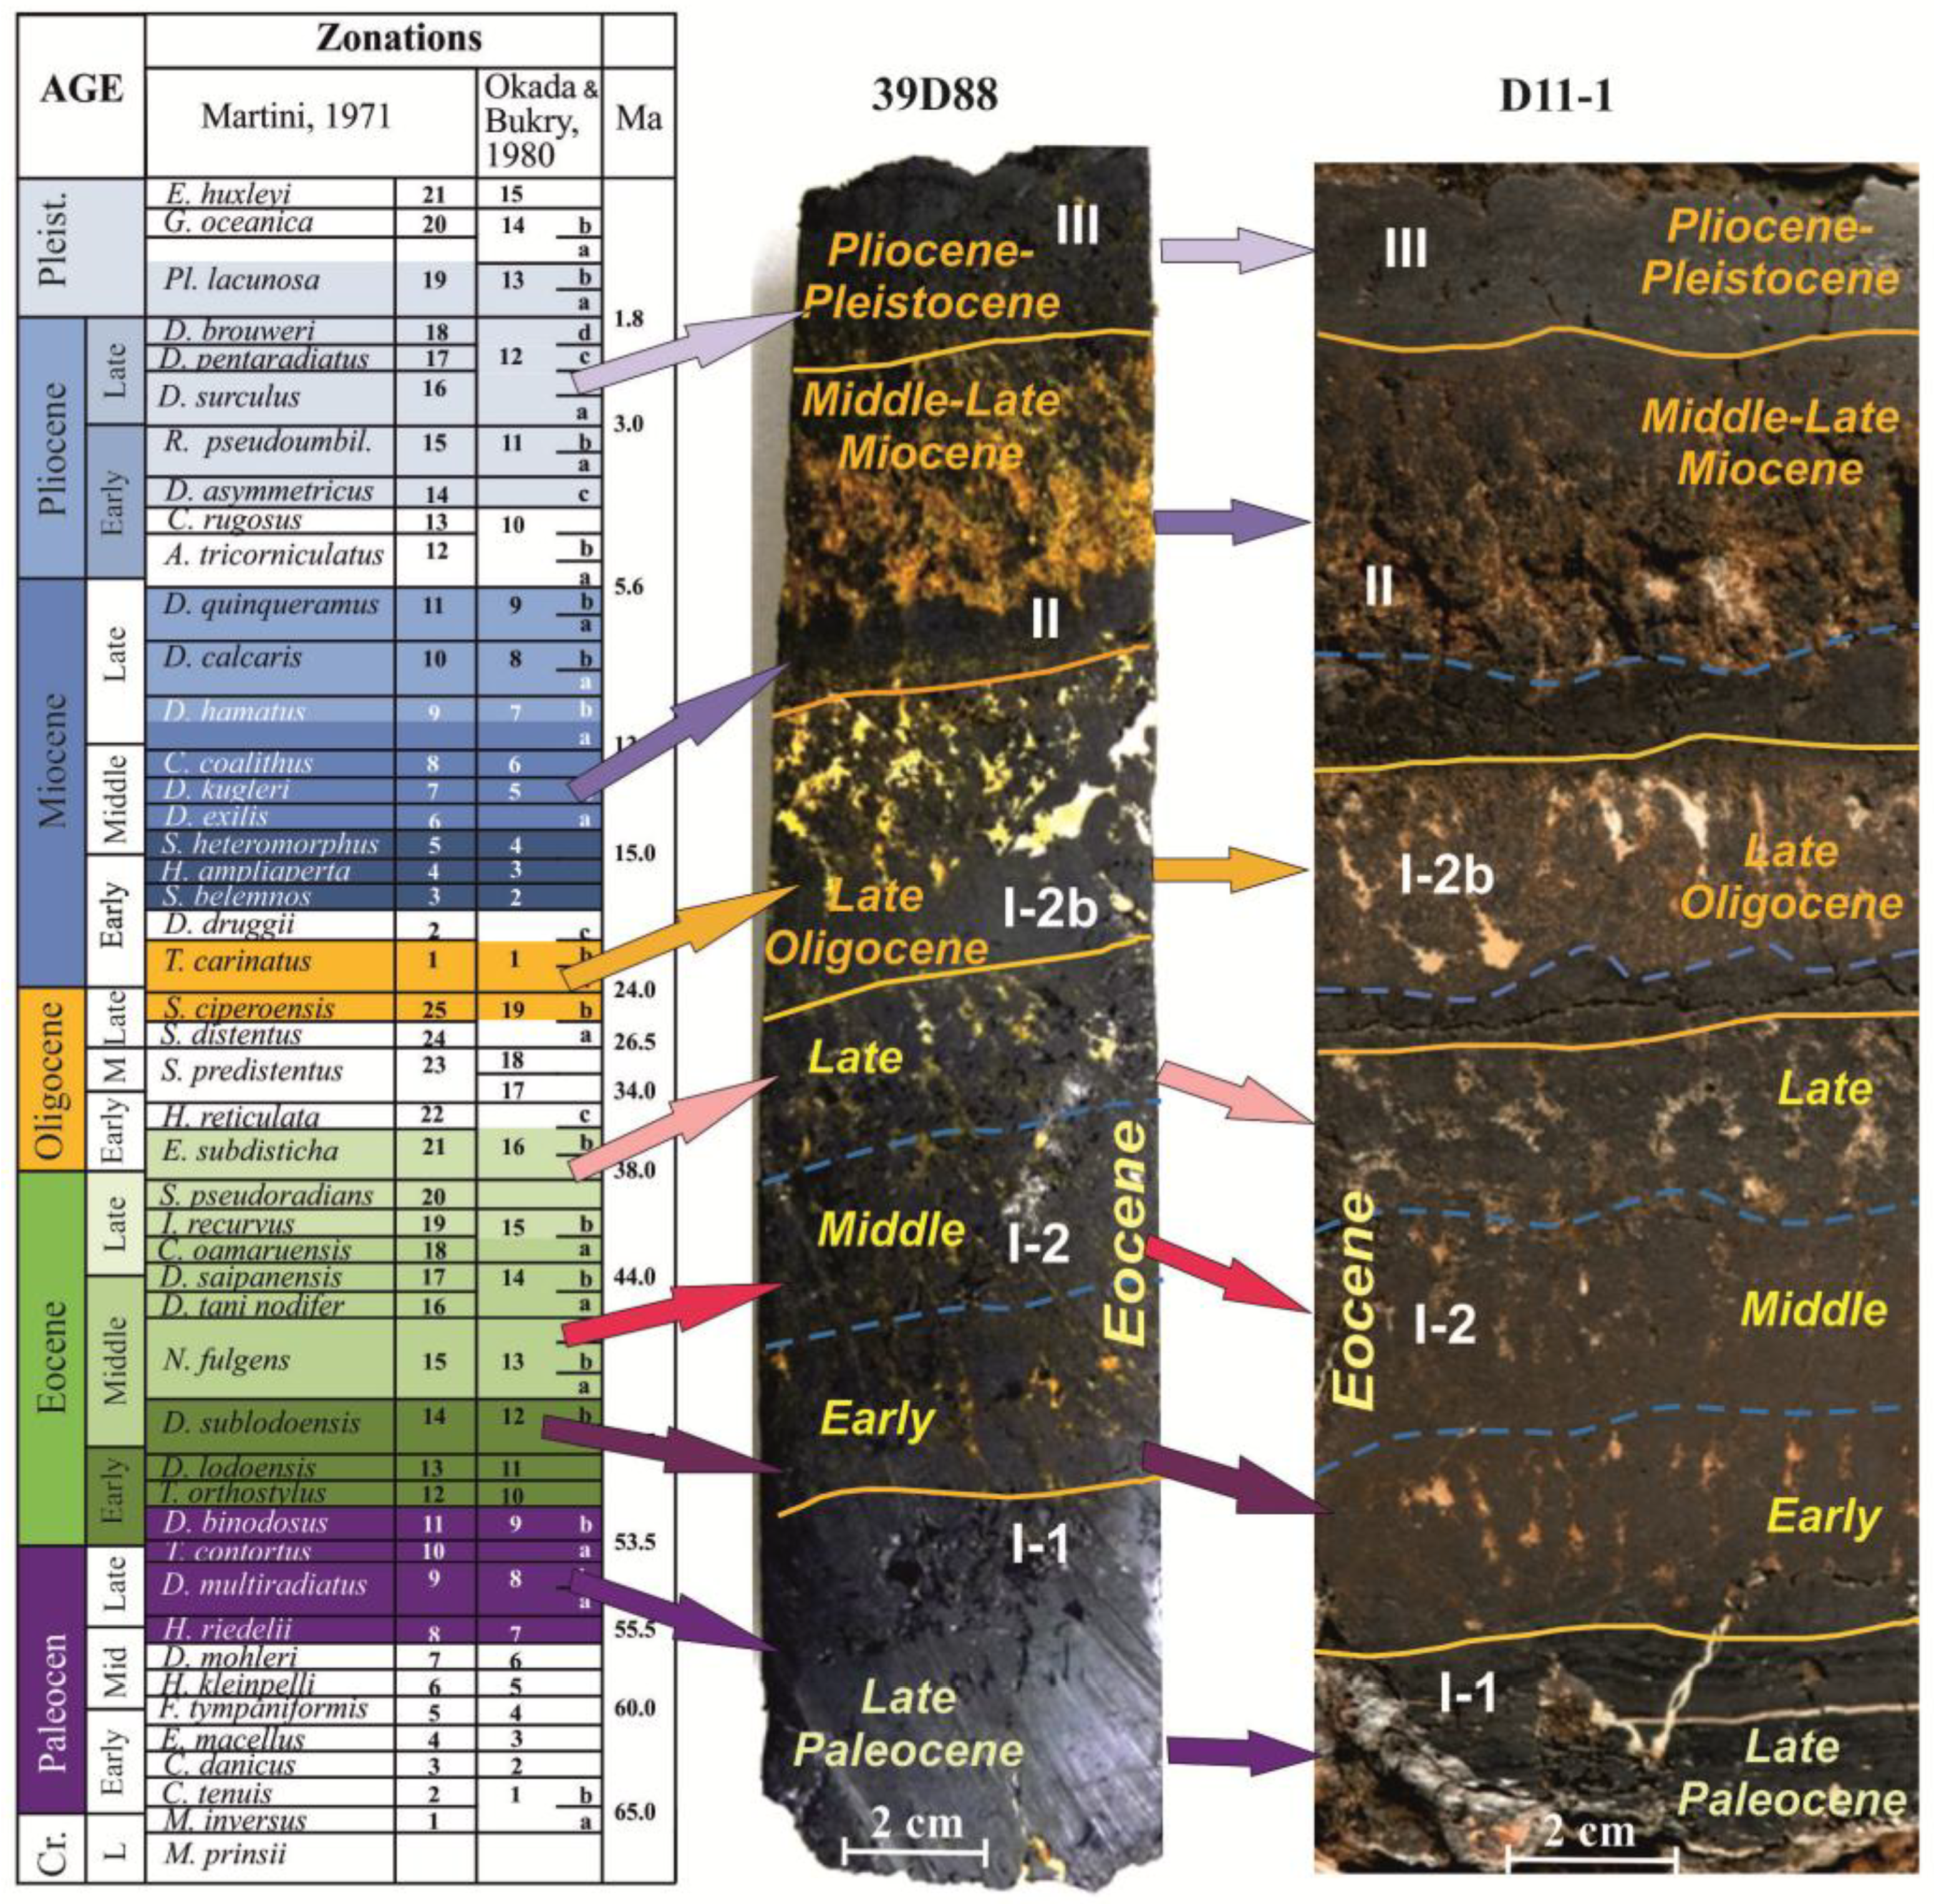
Figure 4.
Bathymetry maps of Govorov (a) and Kocebu (b) guyots. Bold lines in panels (c) and (d) are isobaths at 500 m intervals. Triangles mark location of dredging sites.
Figure 4.
Bathymetry maps of Govorov (a) and Kocebu (b) guyots. Bold lines in panels (c) and (d) are isobaths at 500 m intervals. Triangles mark location of dredging sites.
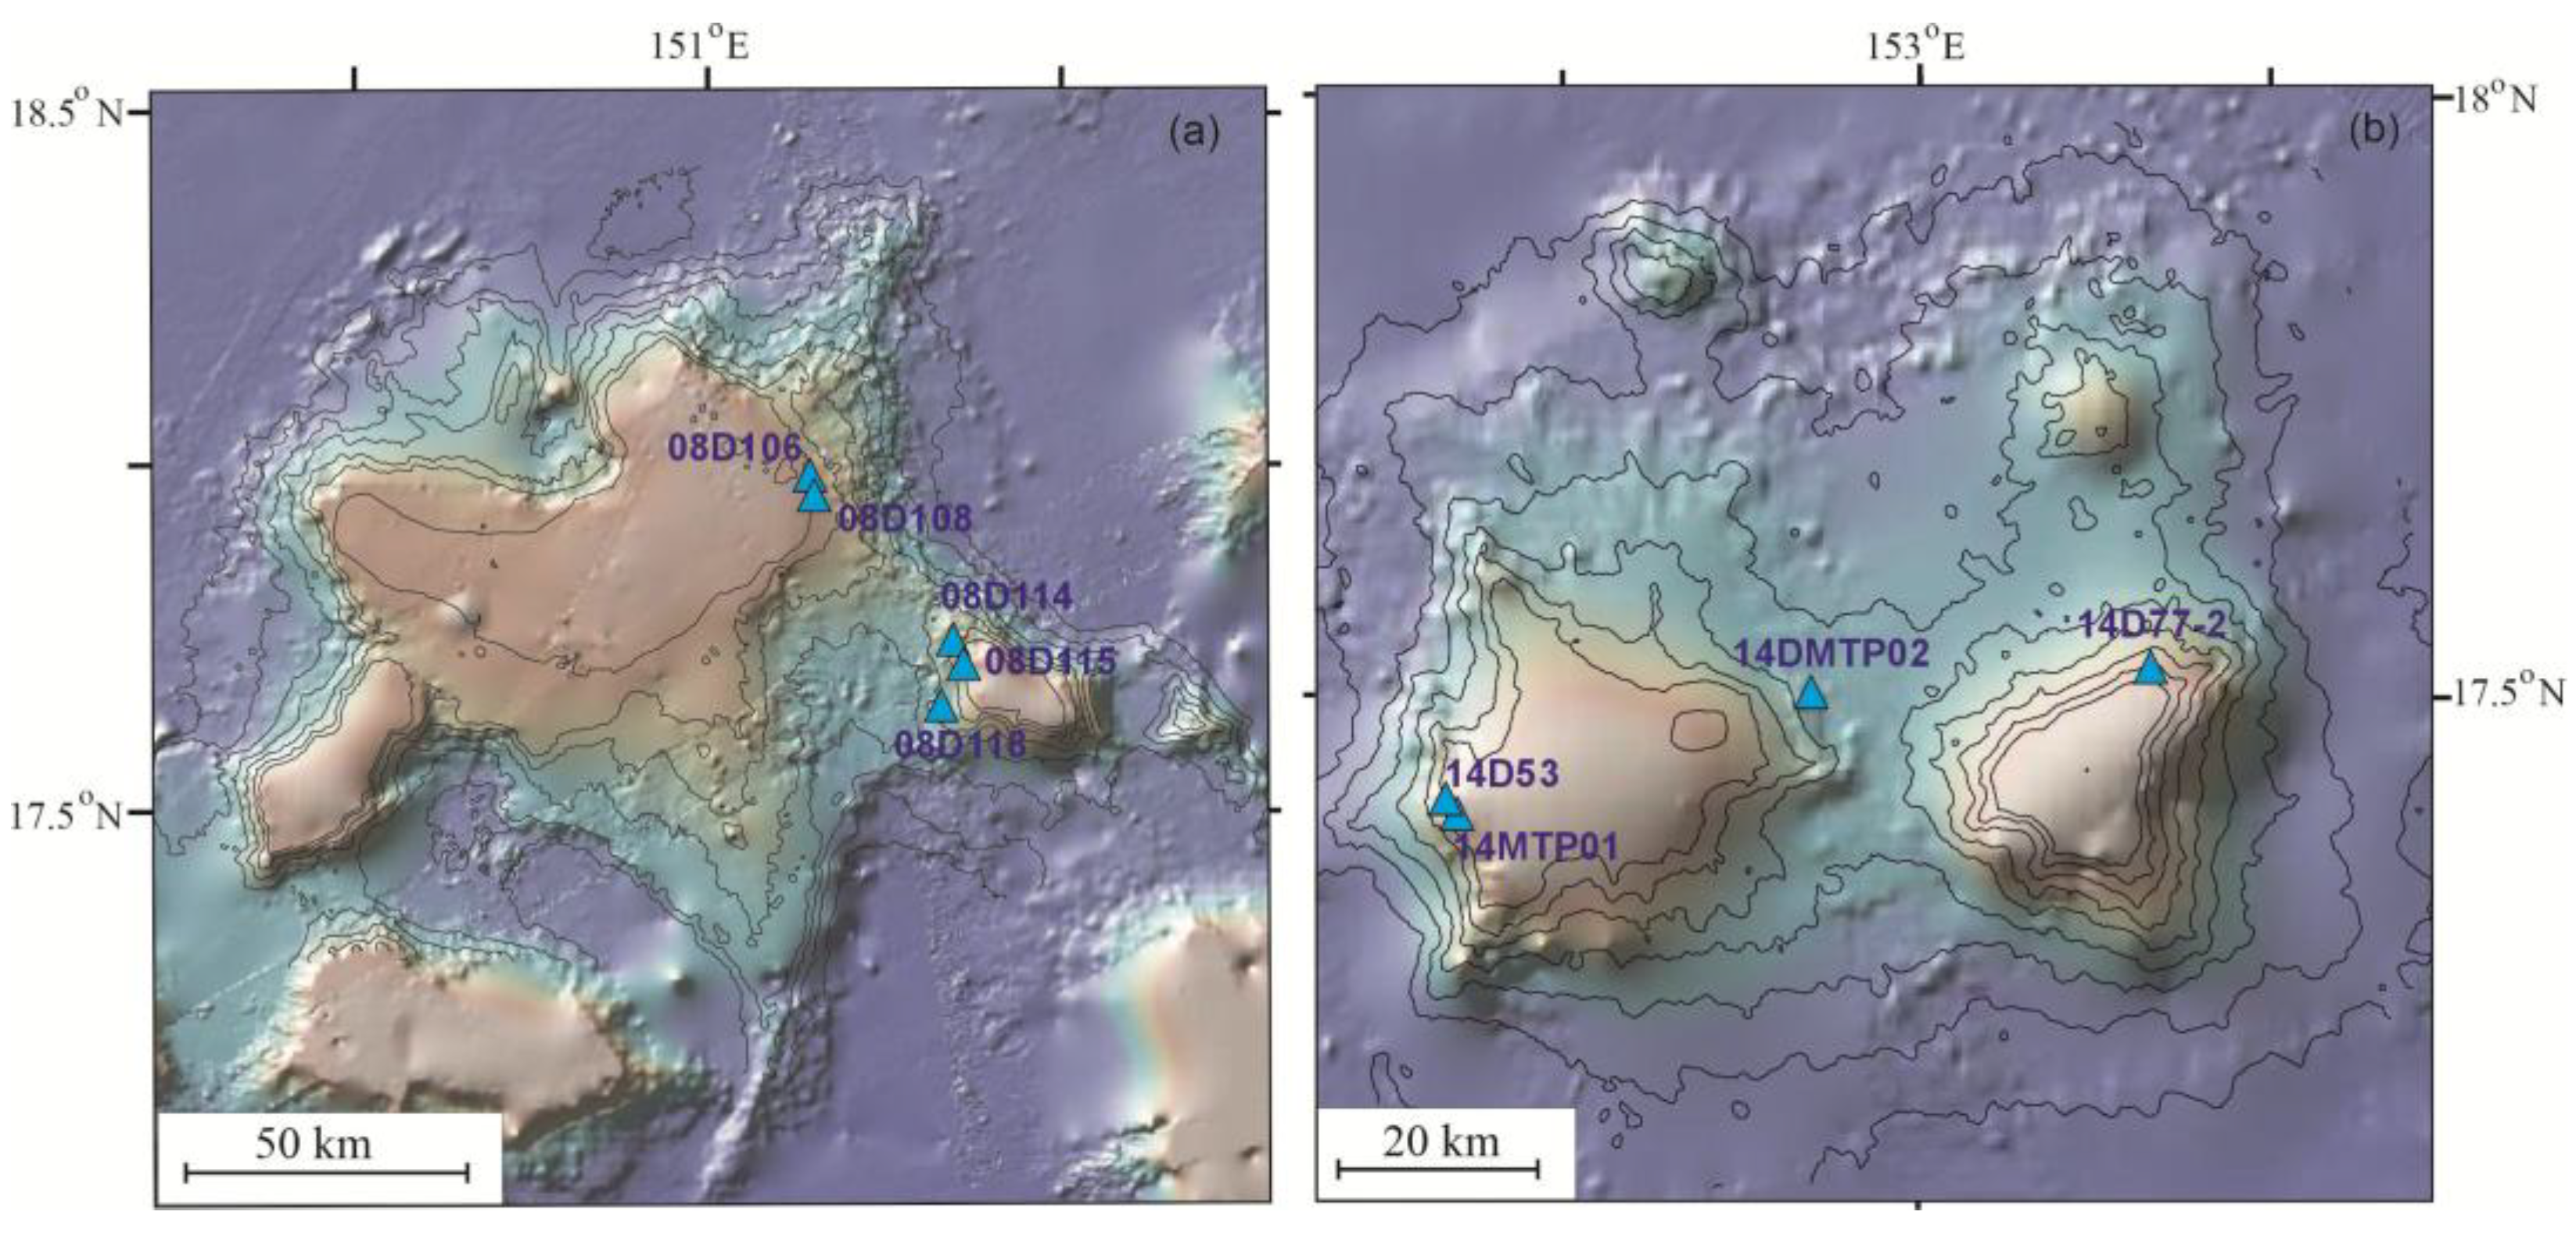
Figure 5.
Summary of XRF data for layers of crusts from Kocebu and Govorov guyots (Table A1 and Table A2 in Appendix A), as well as layers of the crust (from EPMA and XRF data) from Pallada Guyot, after [55]).
Figure 5.
Summary of XRF data for layers of crusts from Kocebu and Govorov guyots (Table A1 and Table A2 in Appendix A), as well as layers of the crust (from EPMA and XRF data) from Pallada Guyot, after [55]).
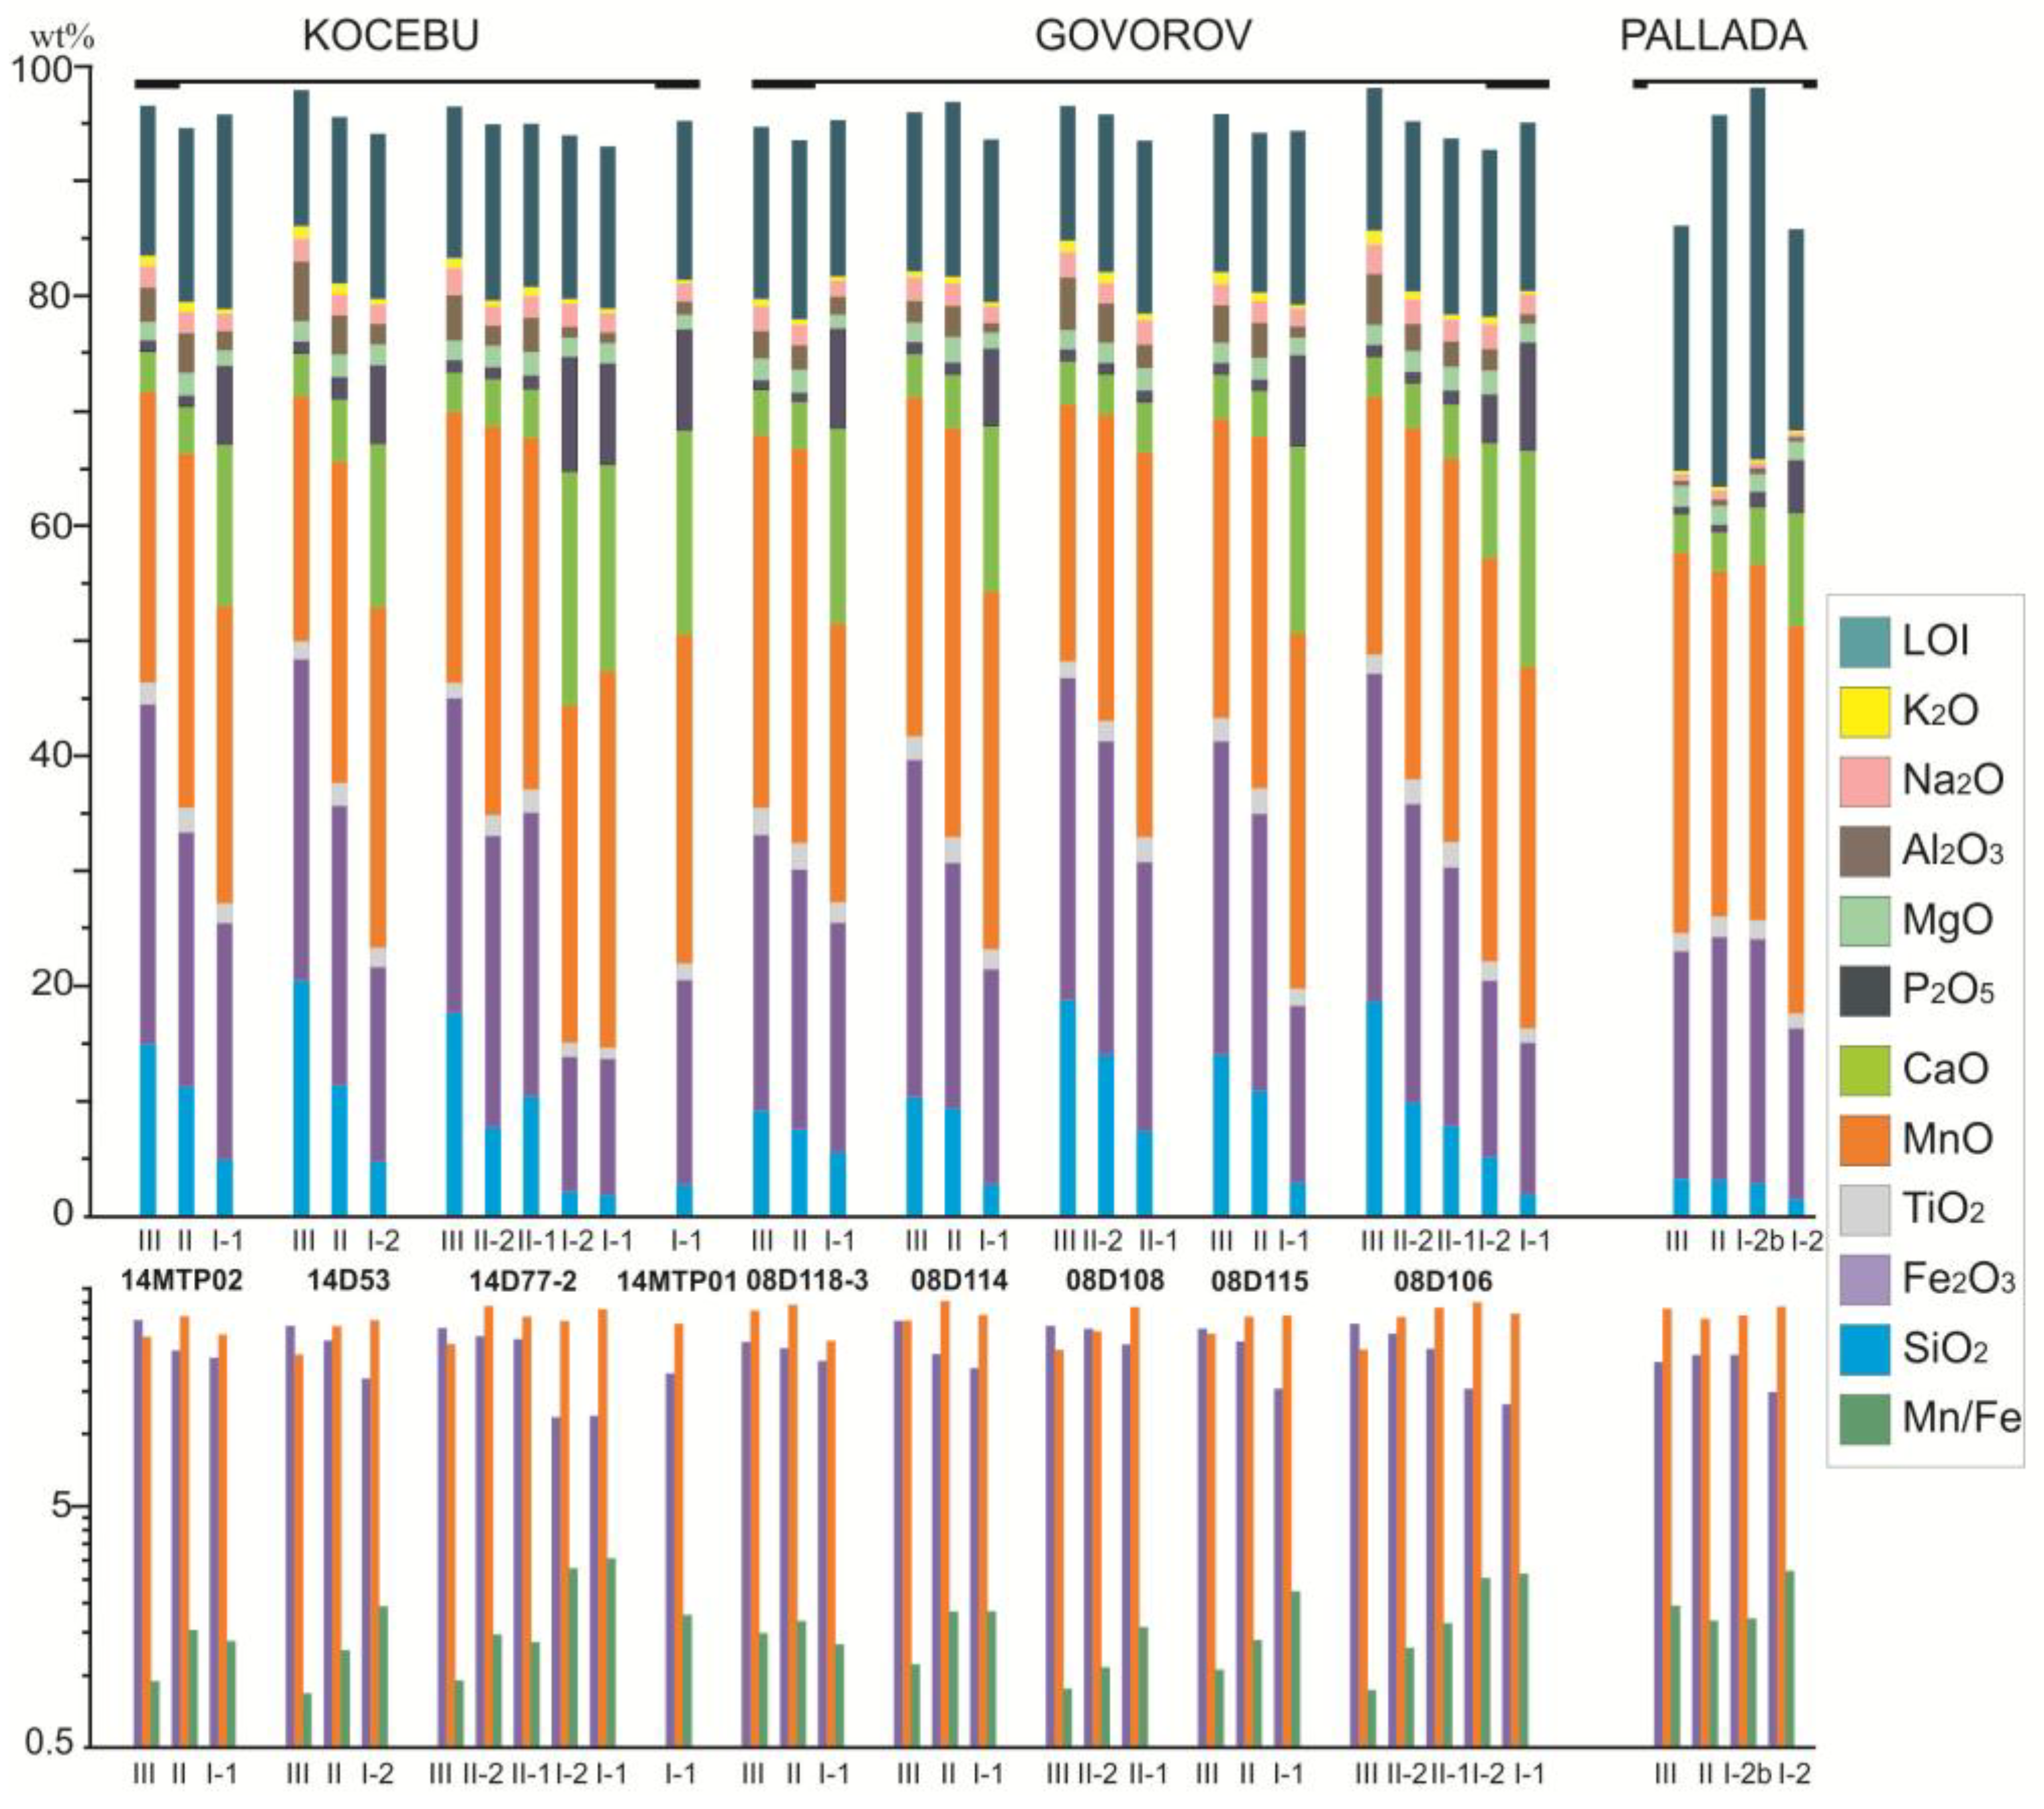
Figure 6.
Sections of Co-rich Fe-Mn crusts sampled from Govorov (08D106, 08D118-3) and Kocebu (14D77-2, 14MTP02) guyots.
Figure 6.
Sections of Co-rich Fe-Mn crusts sampled from Govorov (08D106, 08D118-3) and Kocebu (14D77-2, 14MTP02) guyots.
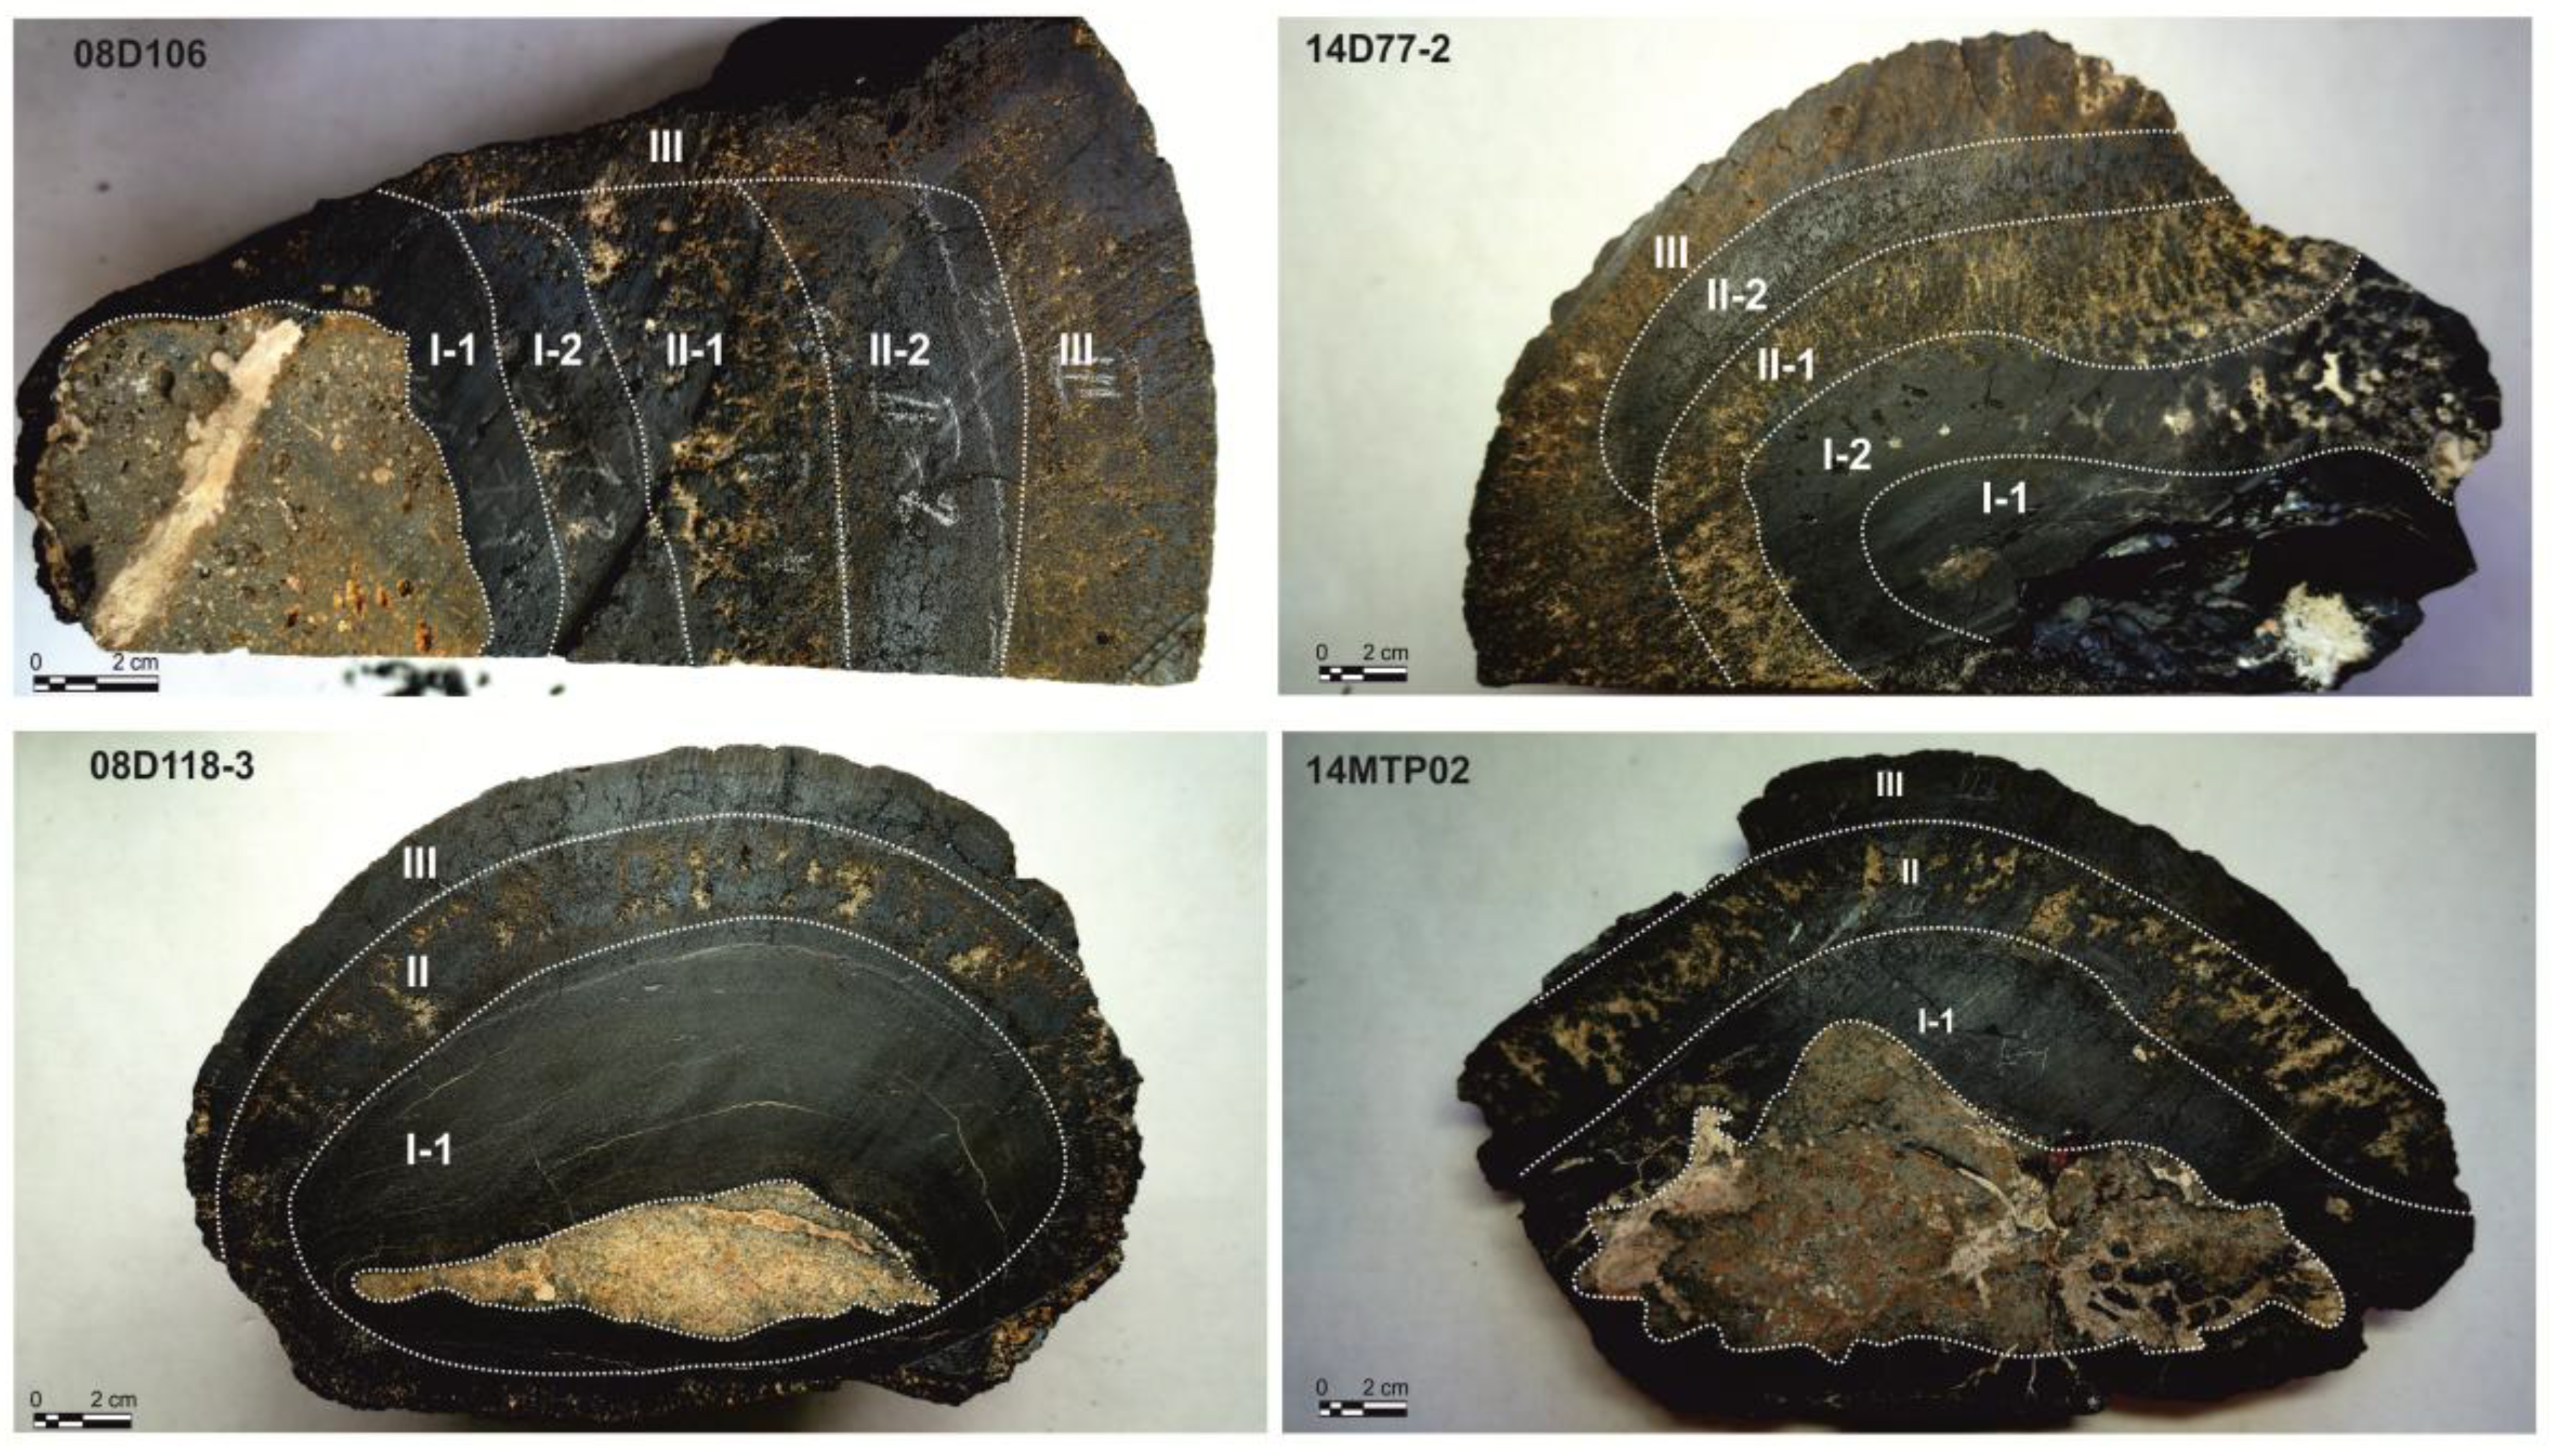
Figure 7.
Patterns of trace elements (ppm) in different layers of crusts from Govorov and Kocebu guyots, this study (Table A3 and Table A4 in Appendix A), and in crust from Pallada Guyot, after [52].
Figure 7.
Patterns of trace elements (ppm) in different layers of crusts from Govorov and Kocebu guyots, this study (Table A3 and Table A4 in Appendix A), and in crust from Pallada Guyot, after [52].
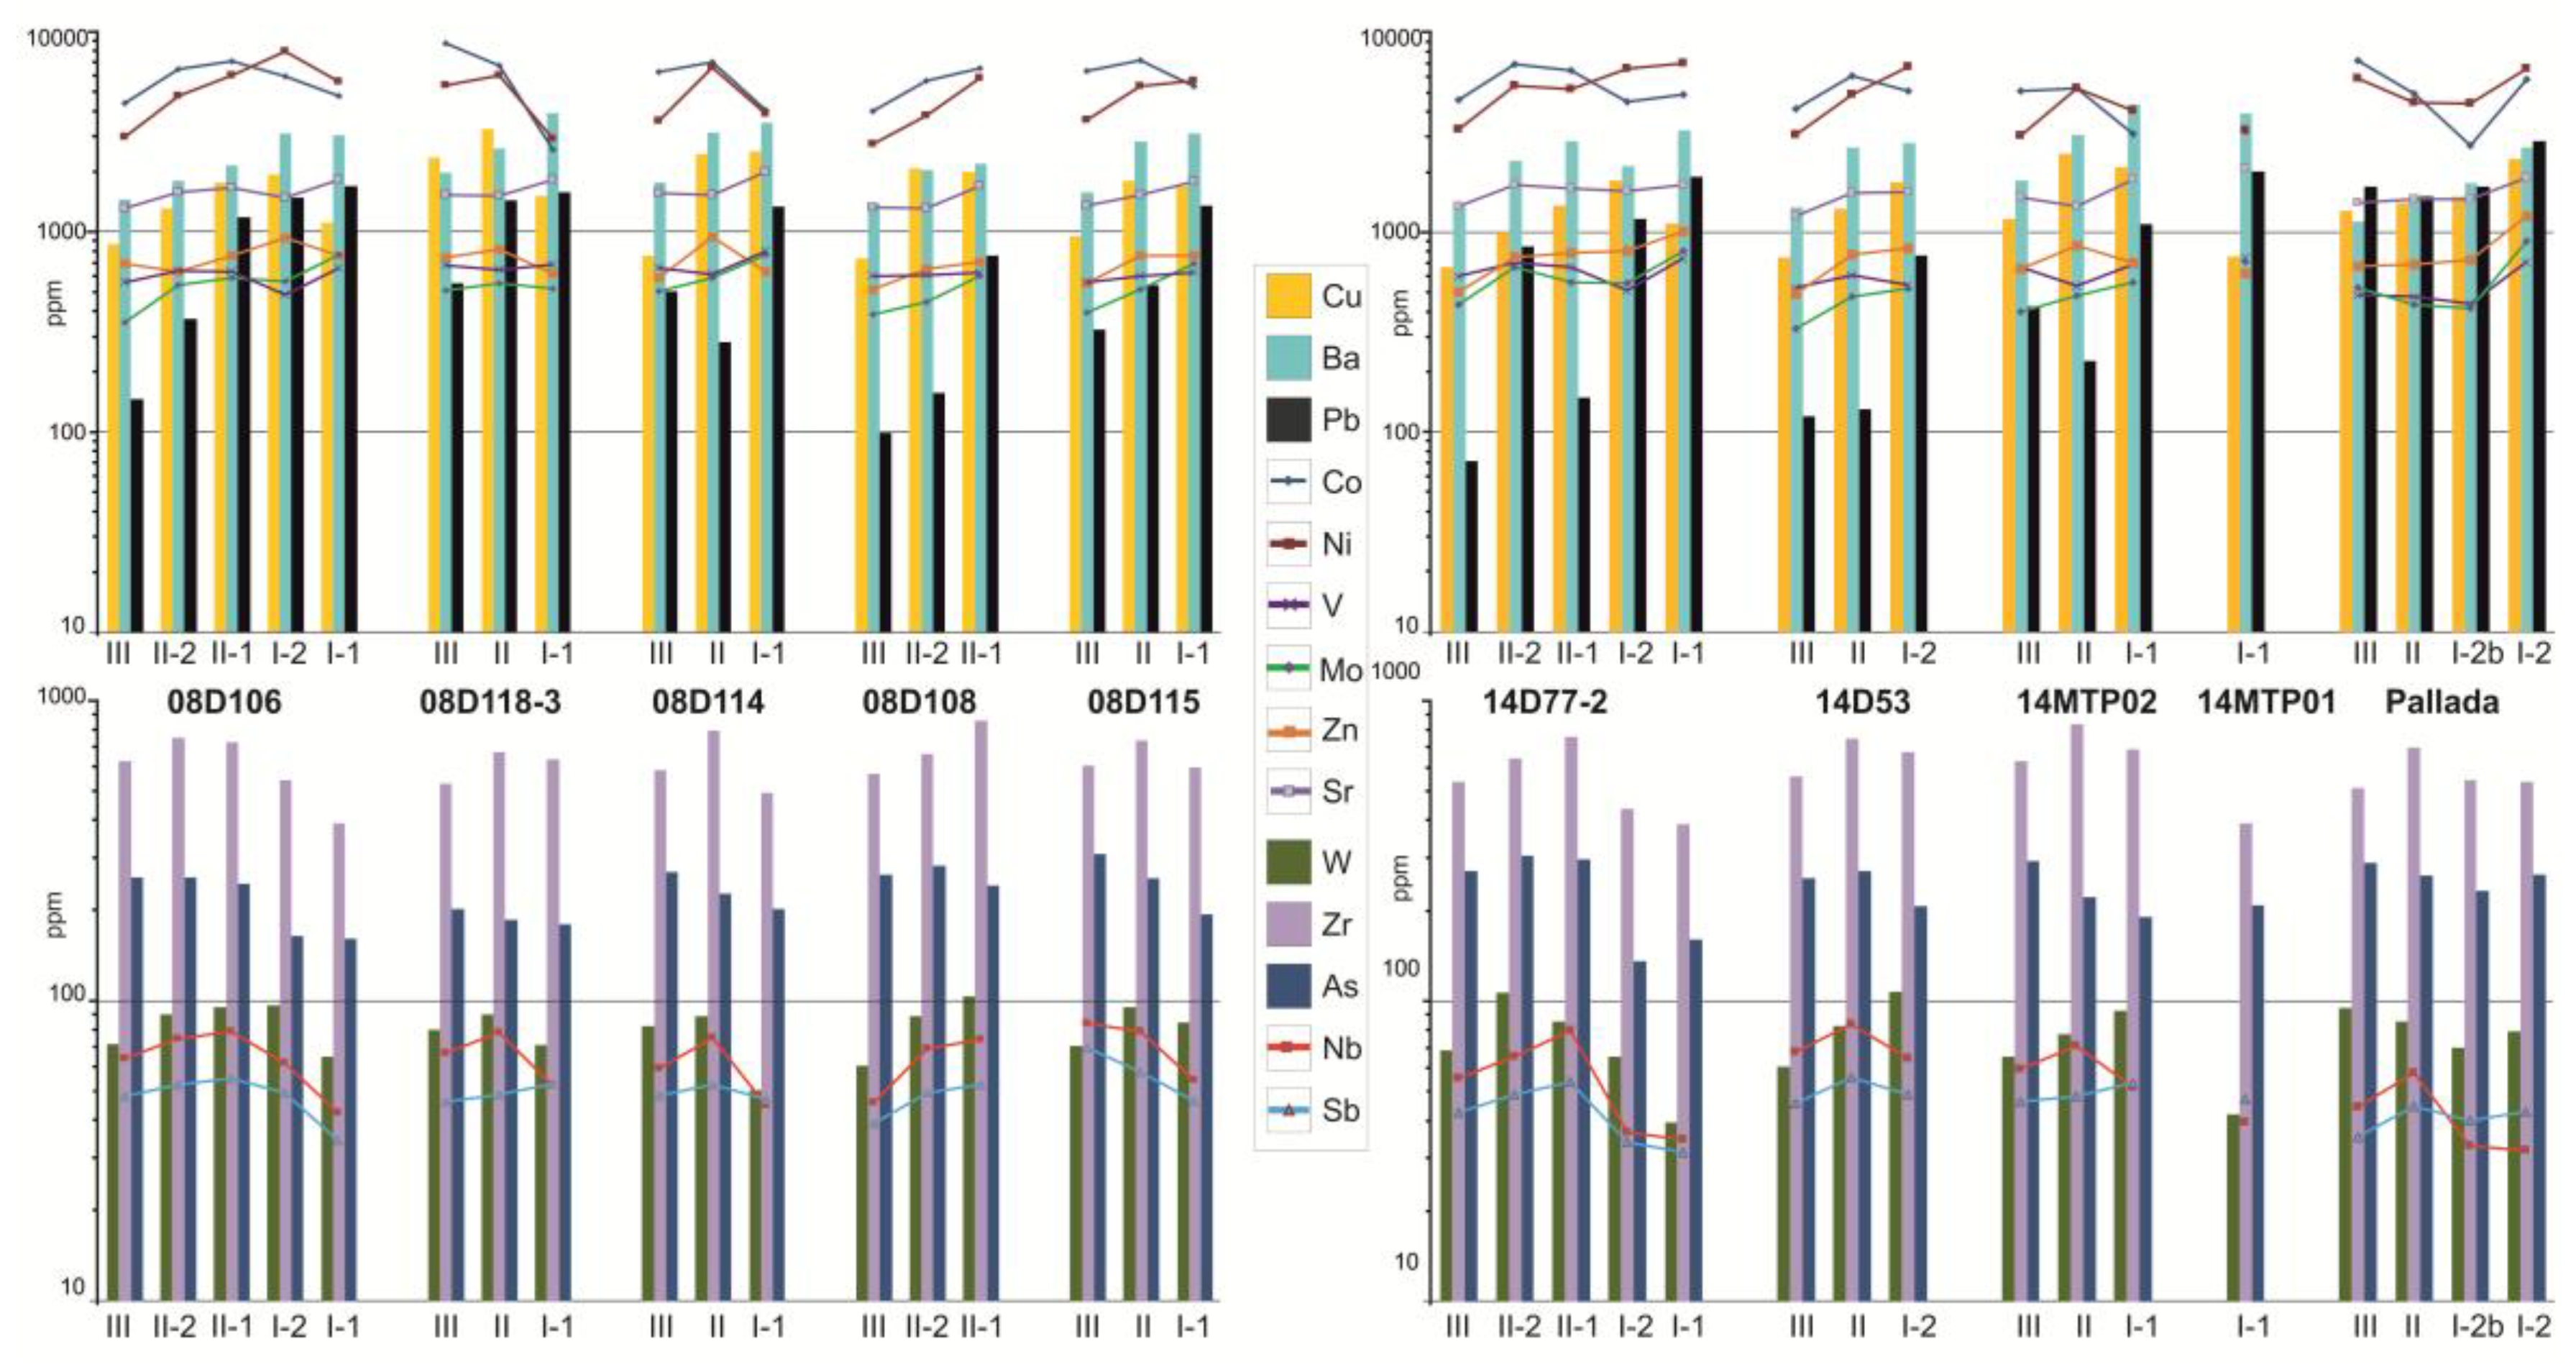
Figure 8.
REE and Y patterns (ppm) in different layers of Co-rich Fe-Mn crusts from Govorov and Kocebu guyots, this study (Table A3 in Appendix A), and Pallada Guyot, after [55].
Figure 8.
REE and Y patterns (ppm) in different layers of Co-rich Fe-Mn crusts from Govorov and Kocebu guyots, this study (Table A3 in Appendix A), and Pallada Guyot, after [55].
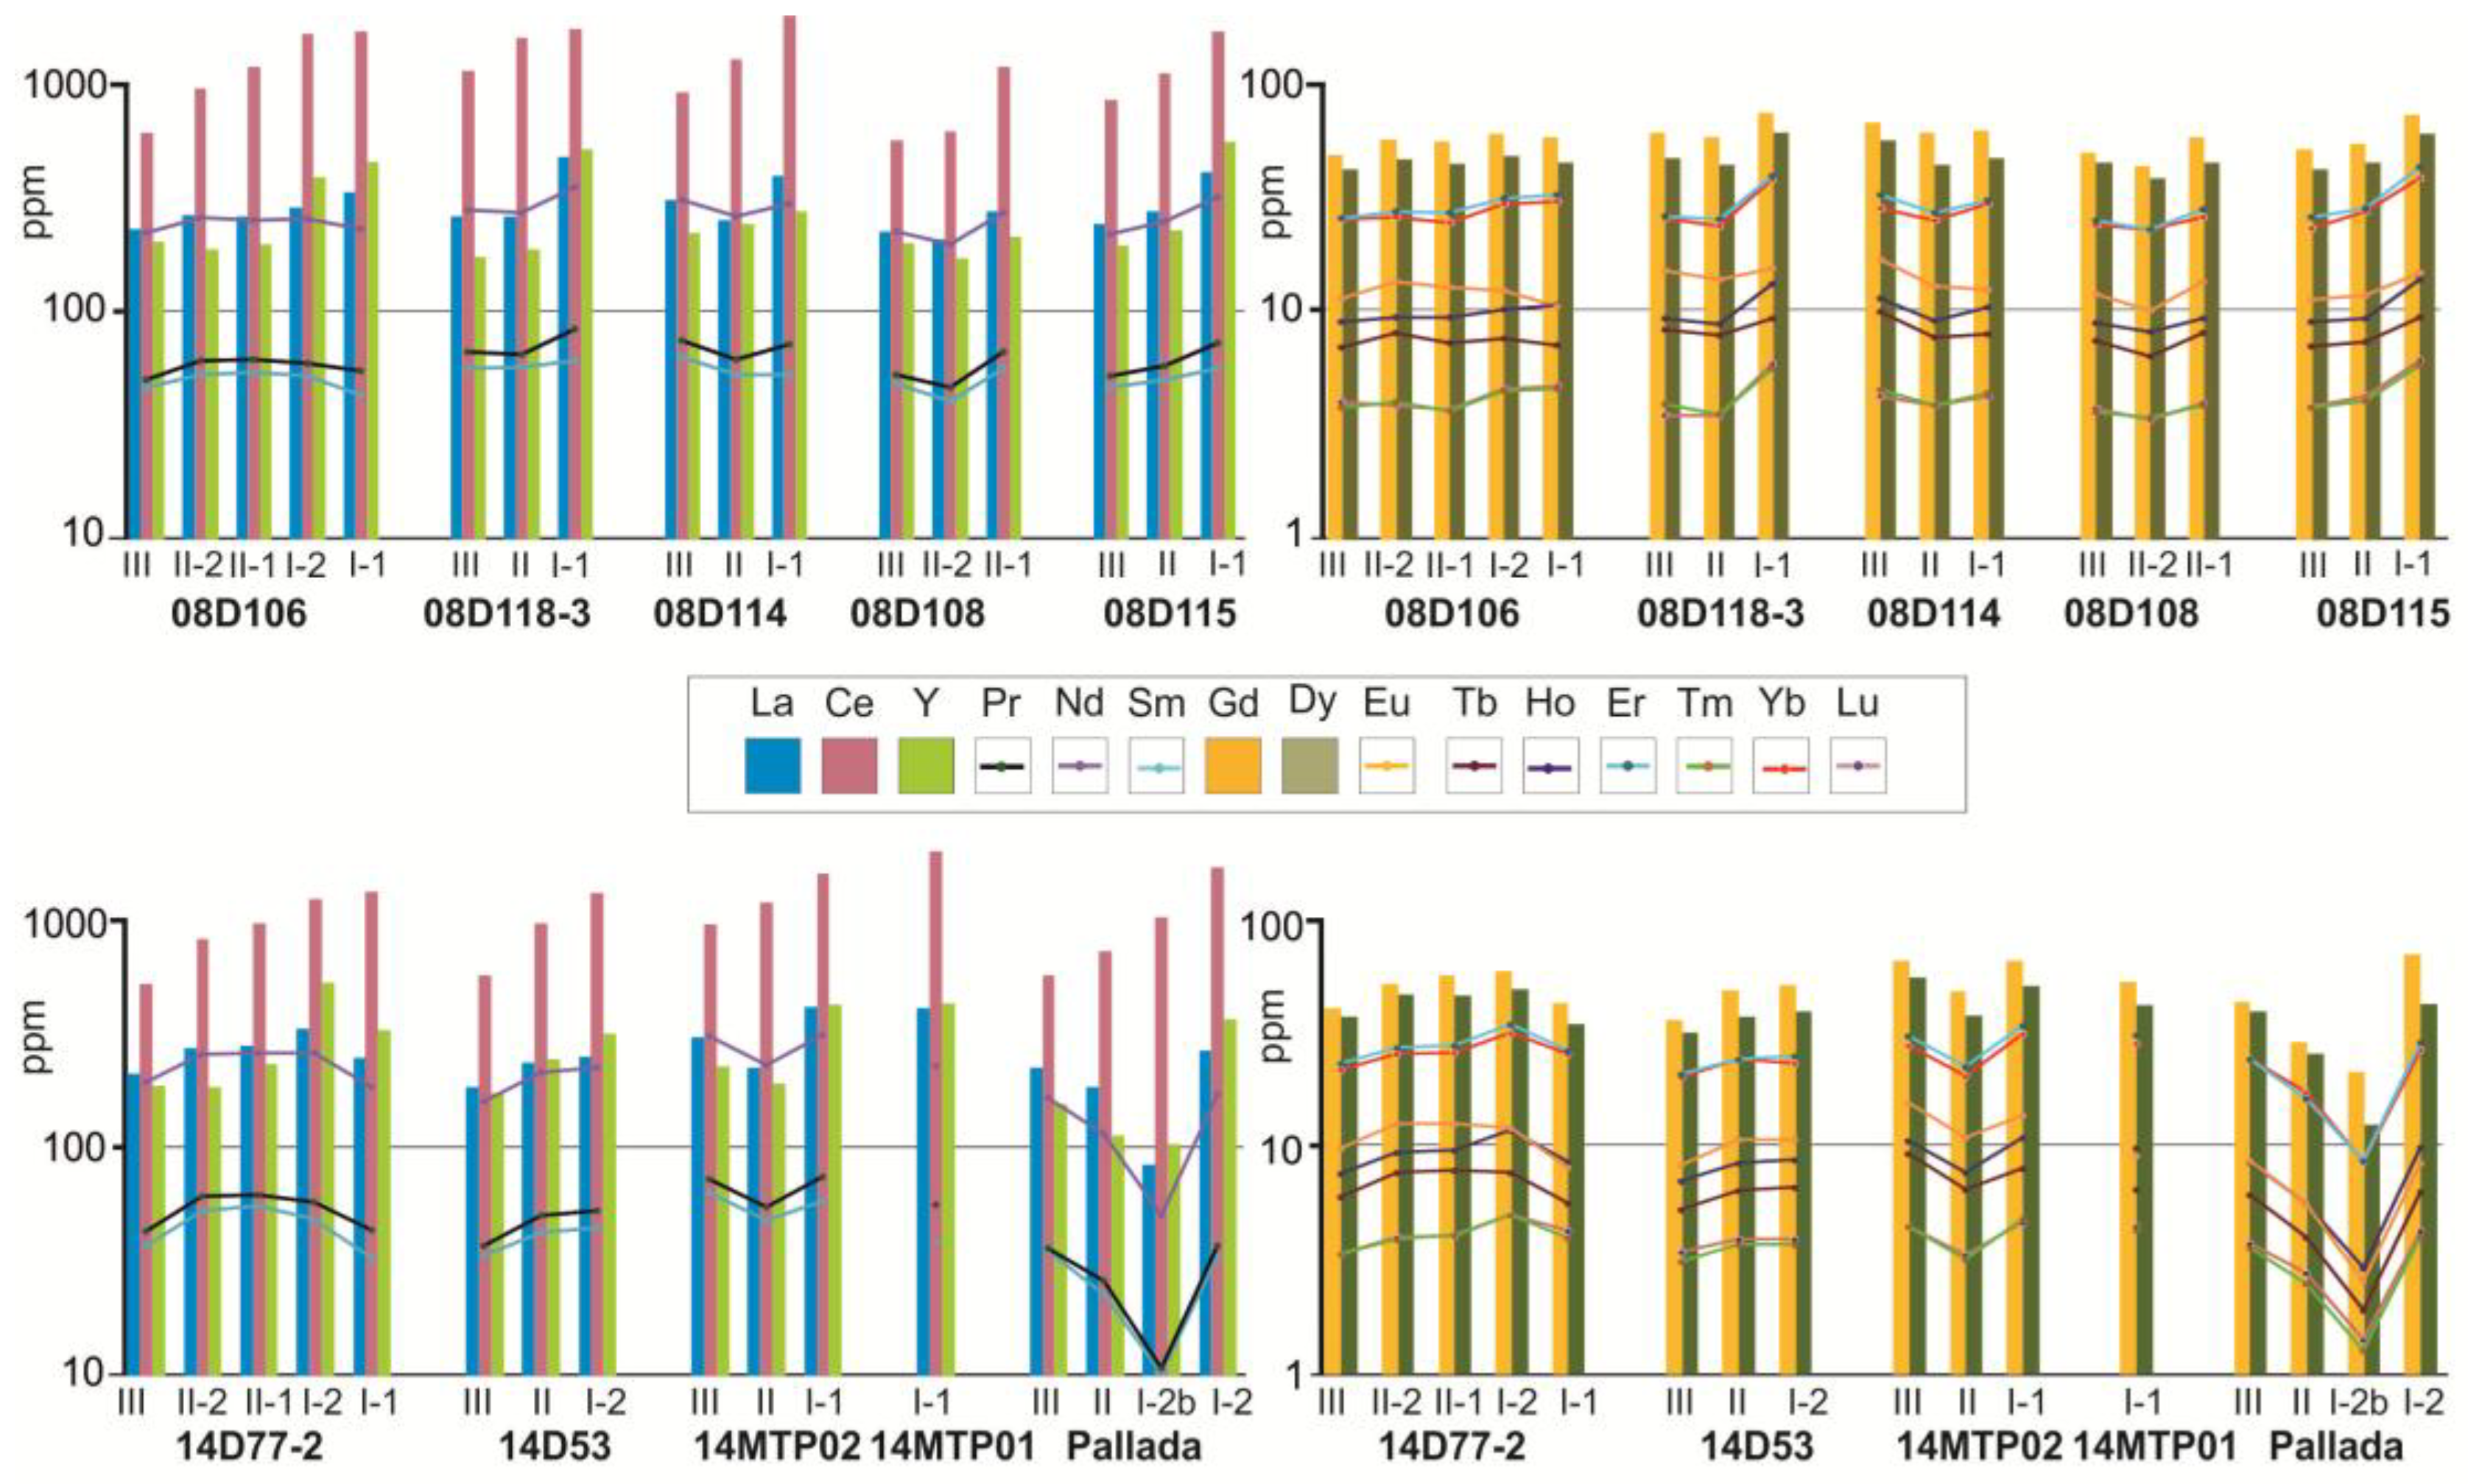
Figure 9.
PAAS-normalized REE and Y patterns in different layers of Co-rich Fe-Mn crusts from Govorov and Kocebu guyots.
Figure 9.
PAAS-normalized REE and Y patterns in different layers of Co-rich Fe-Mn crusts from Govorov and Kocebu guyots.
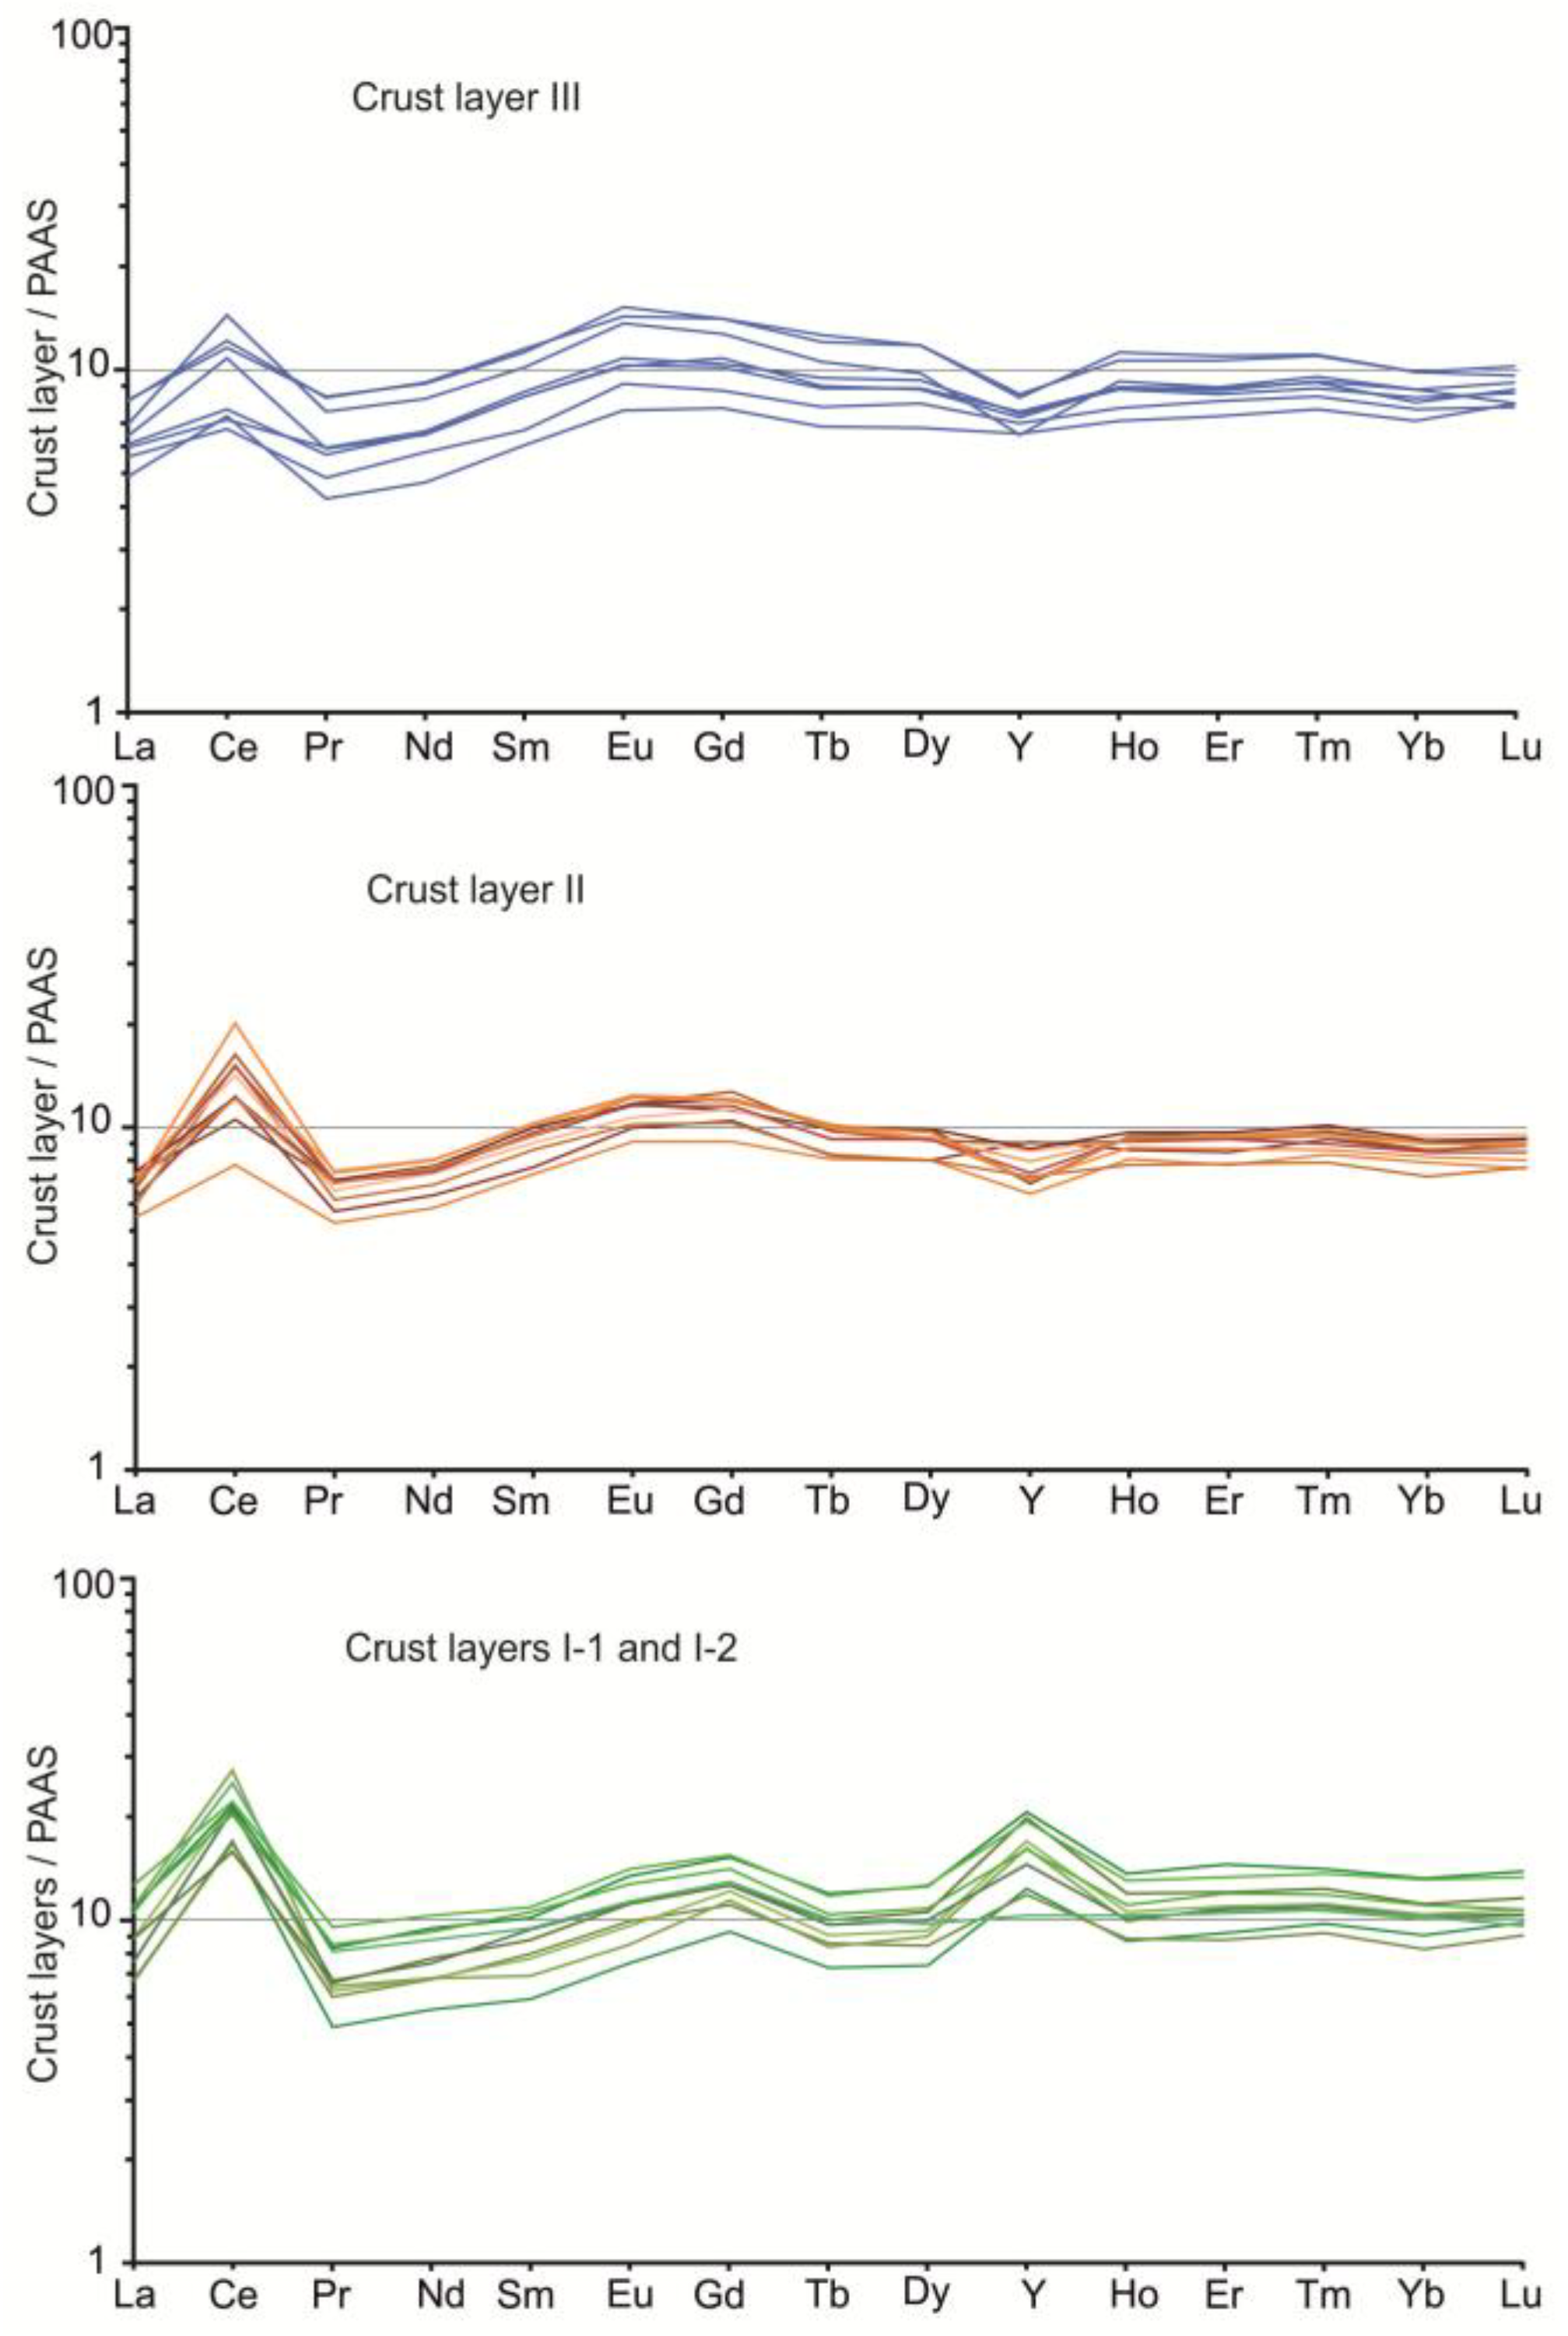
Figure 10.
Mean contents of minor, trace elements, REE, Y, and Ce* normalized to N-PNPZ (Non-Prime North Pacific Zone, after [5,44] (a), (b), and PAAS, after [58] (c).
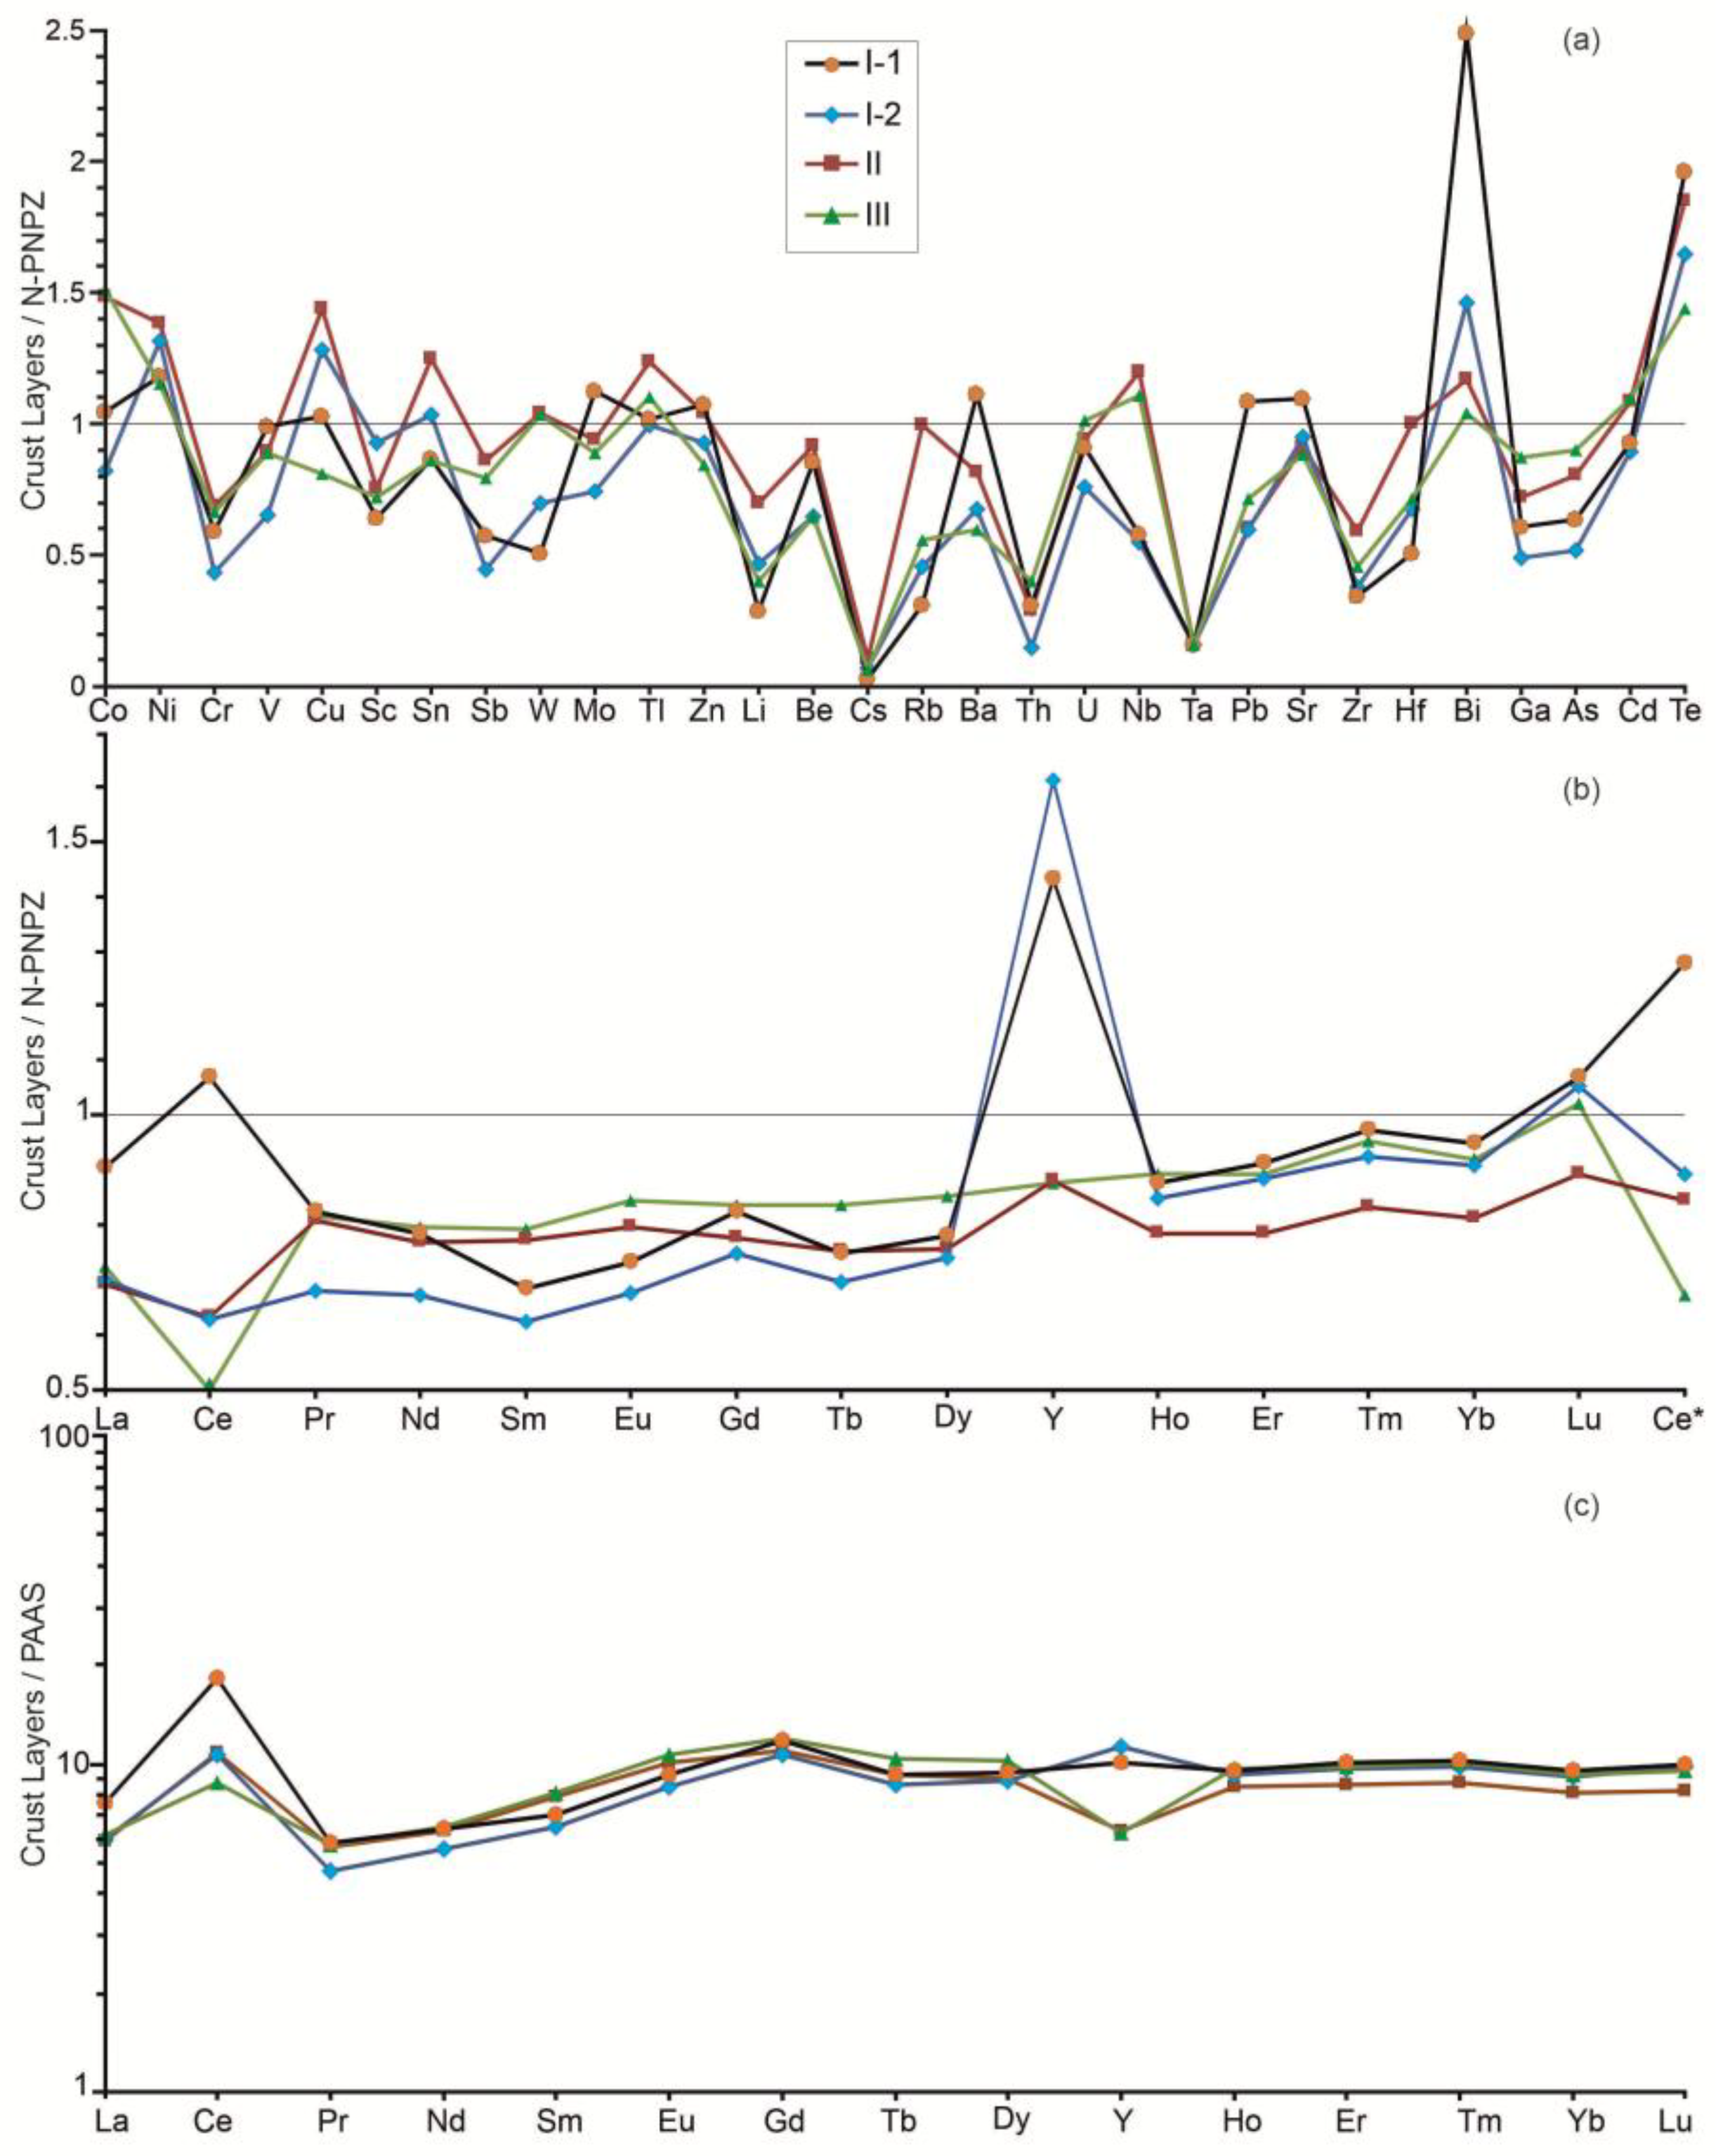
Figure 11.
Ternary discrimination diagrams for Fe-Mn crusts and nodules: (Ni+Co+Cu)–Mn–Fe, after [59,60] (a); (Zr+Y+Ce)–(Fe+Mn)/4–(Co+Ni)×15, after [61] (b); and classification diagrams based on REE and Y, modified after [62] (c) and (d).
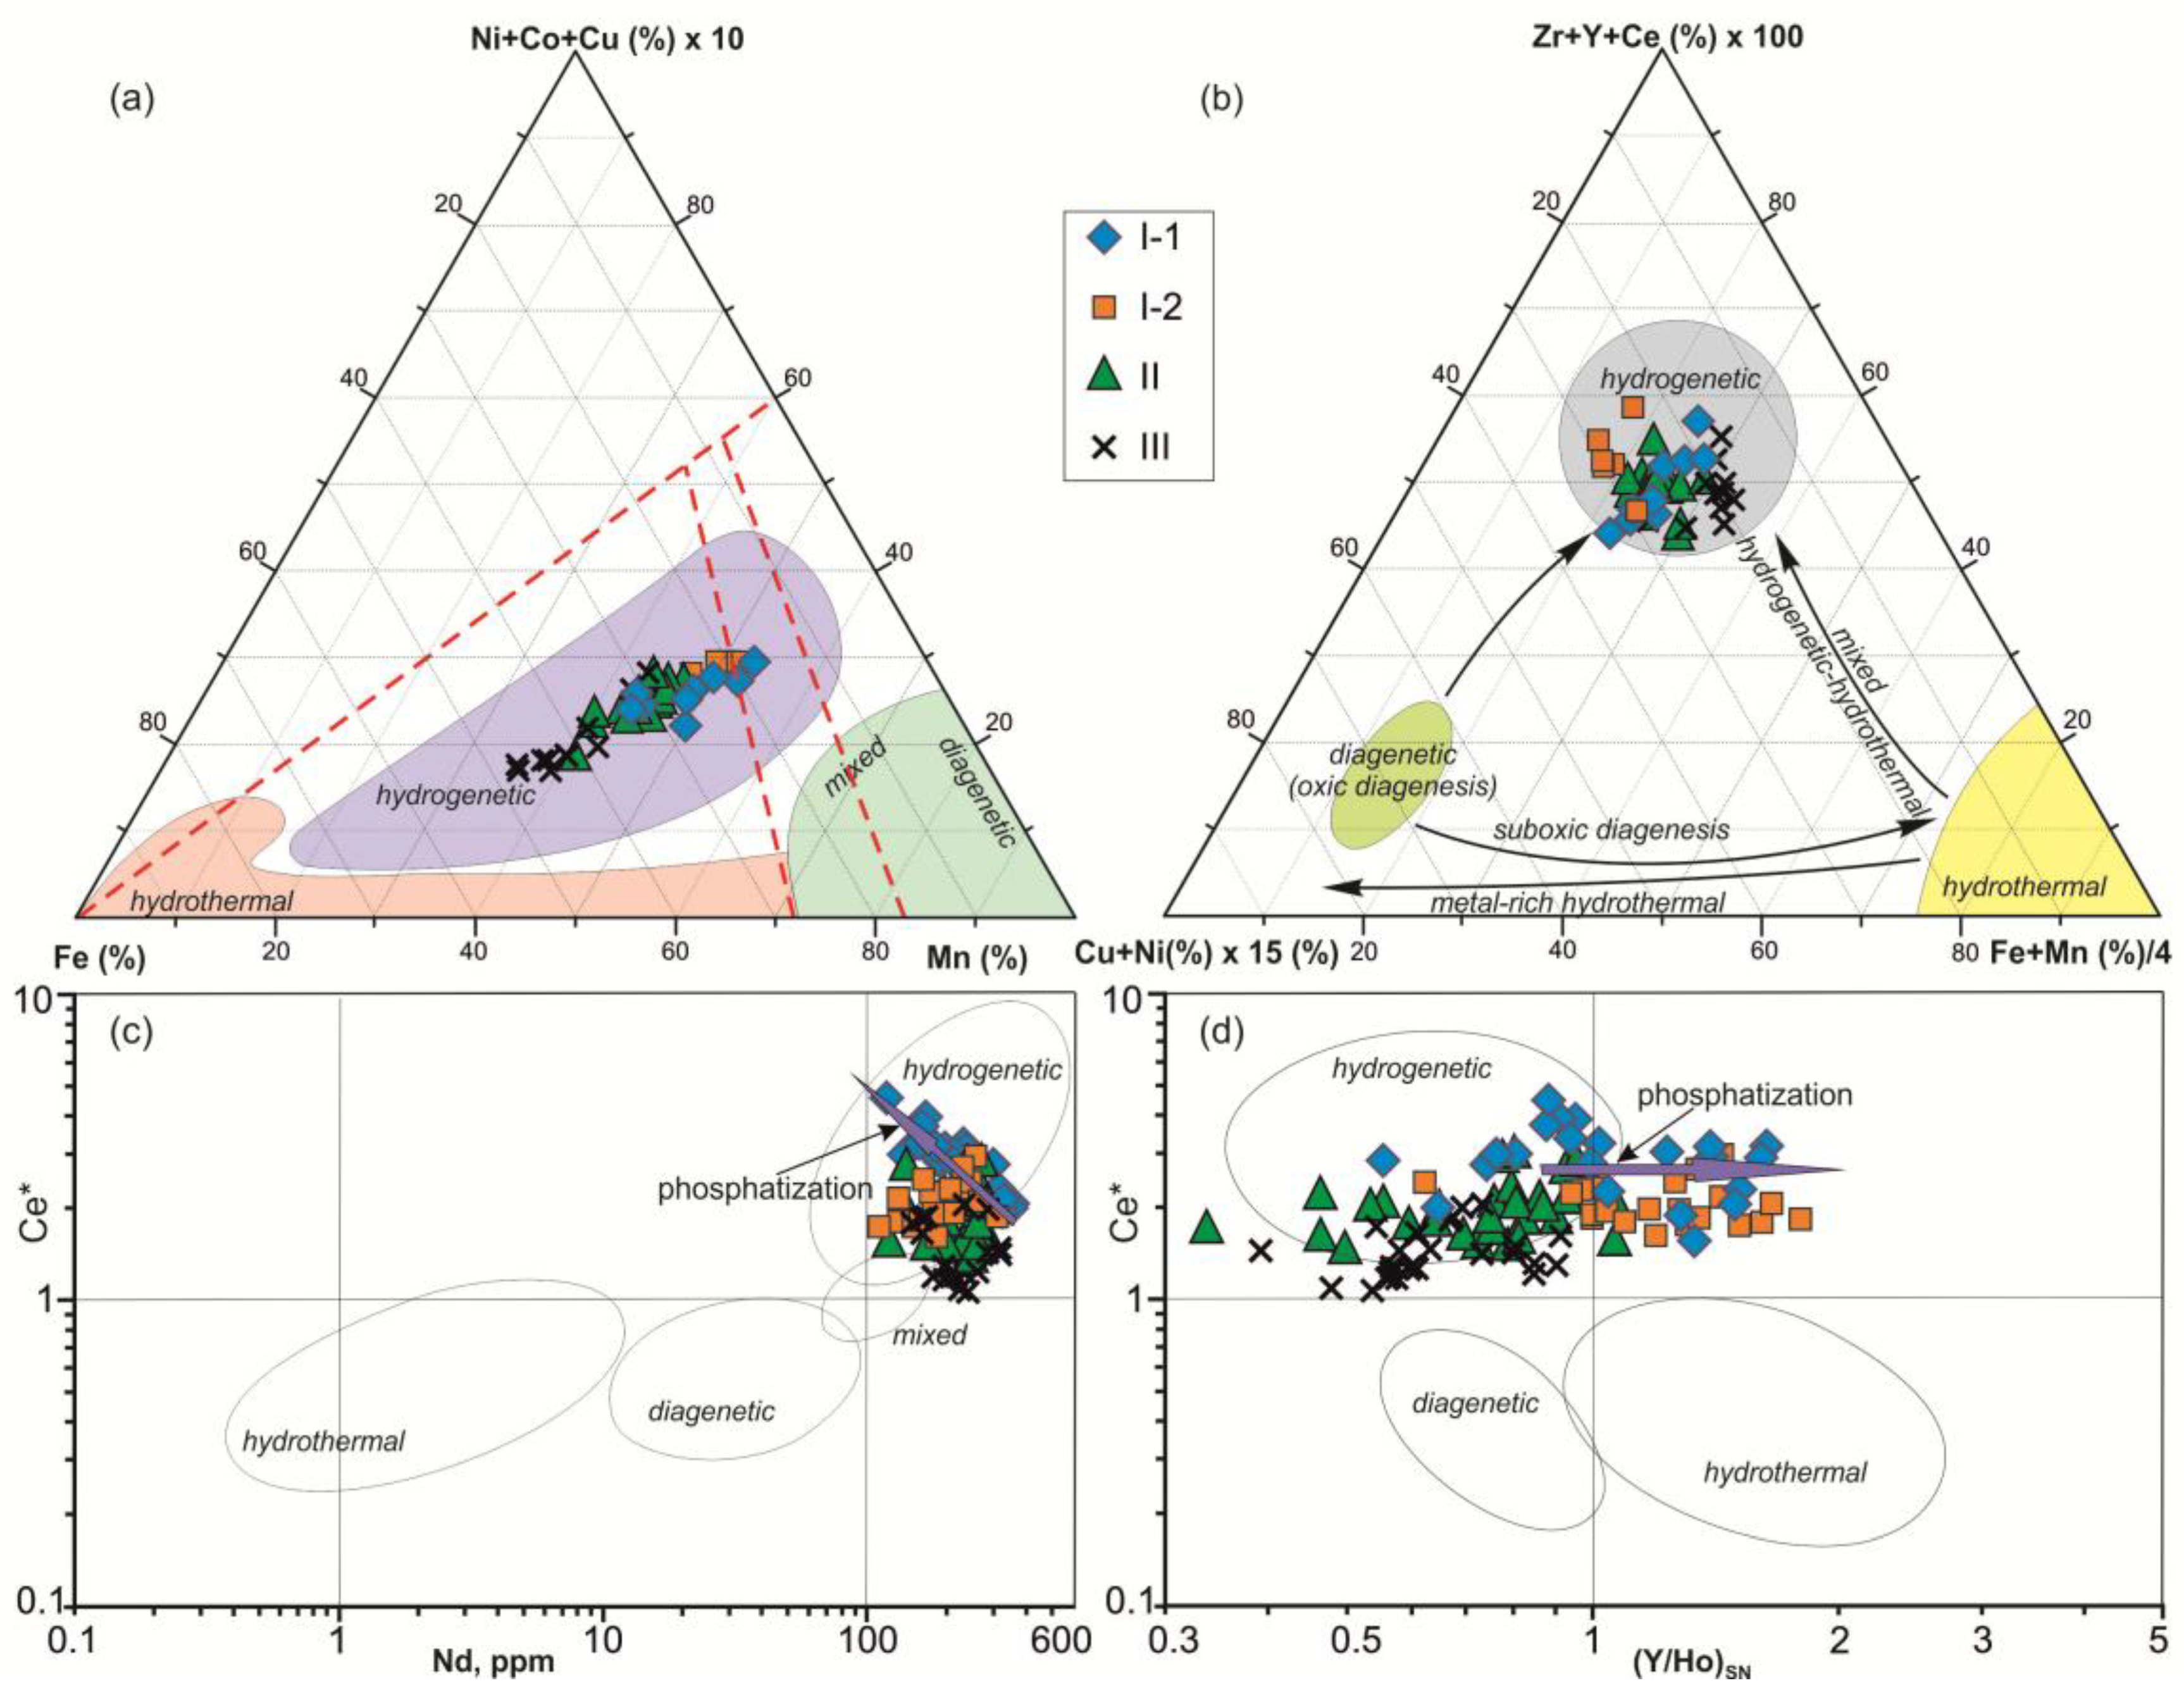
Figure 12.
Grouping of elements by factor analysis of principal components (varimax raw) for layers in MST Fe-Mn crusts (see text for explanation). The plots show relationships based on factor loadings for elements and factor scores for layer compositions. .
Figure 12.
Grouping of elements by factor analysis of principal components (varimax raw) for layers in MST Fe-Mn crusts (see text for explanation). The plots show relationships based on factor loadings for elements and factor scores for layer compositions. .
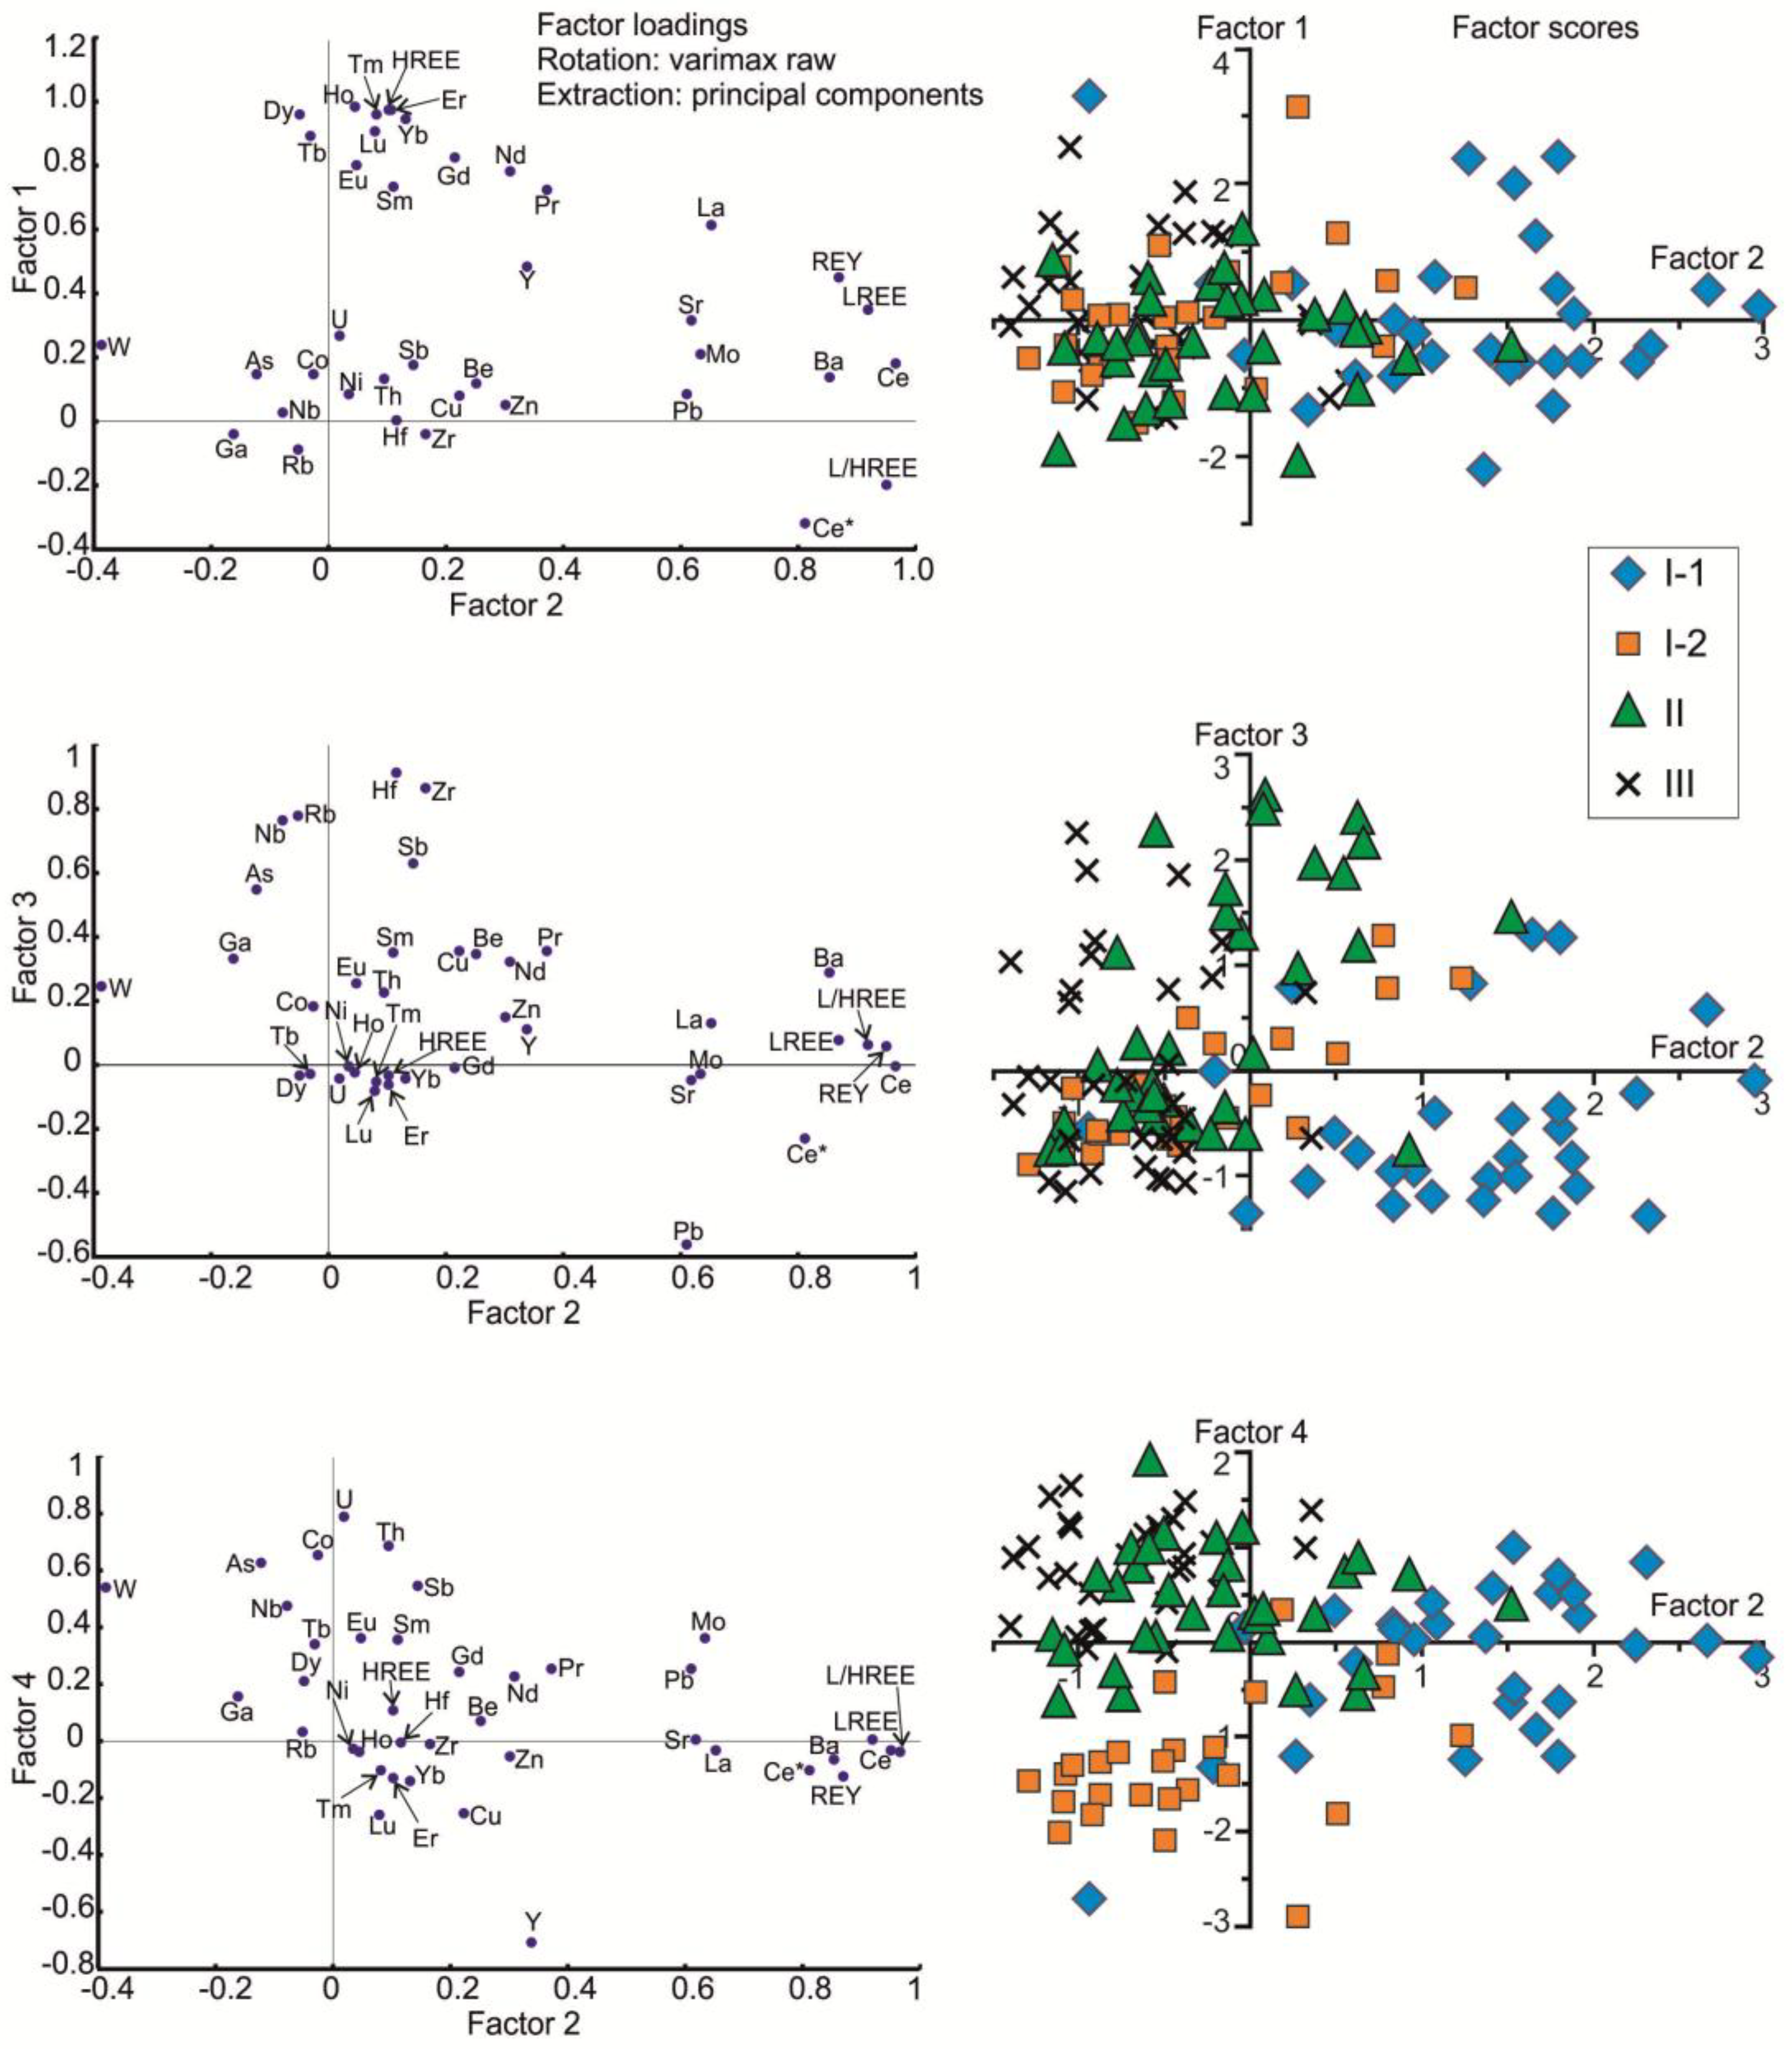
Figure 13.
Concentrations of Nb, Zr, Hf, W, Sb, As and Zr/Hf and Nb/Ta ratios in layers of MST Fe-Mn crusts. Grey fields in panels (a) and (b) are bulk crust compositions.
Figure 13.
Concentrations of Nb, Zr, Hf, W, Sb, As and Zr/Hf and Nb/Ta ratios in layers of MST Fe-Mn crusts. Grey fields in panels (a) and (b) are bulk crust compositions.
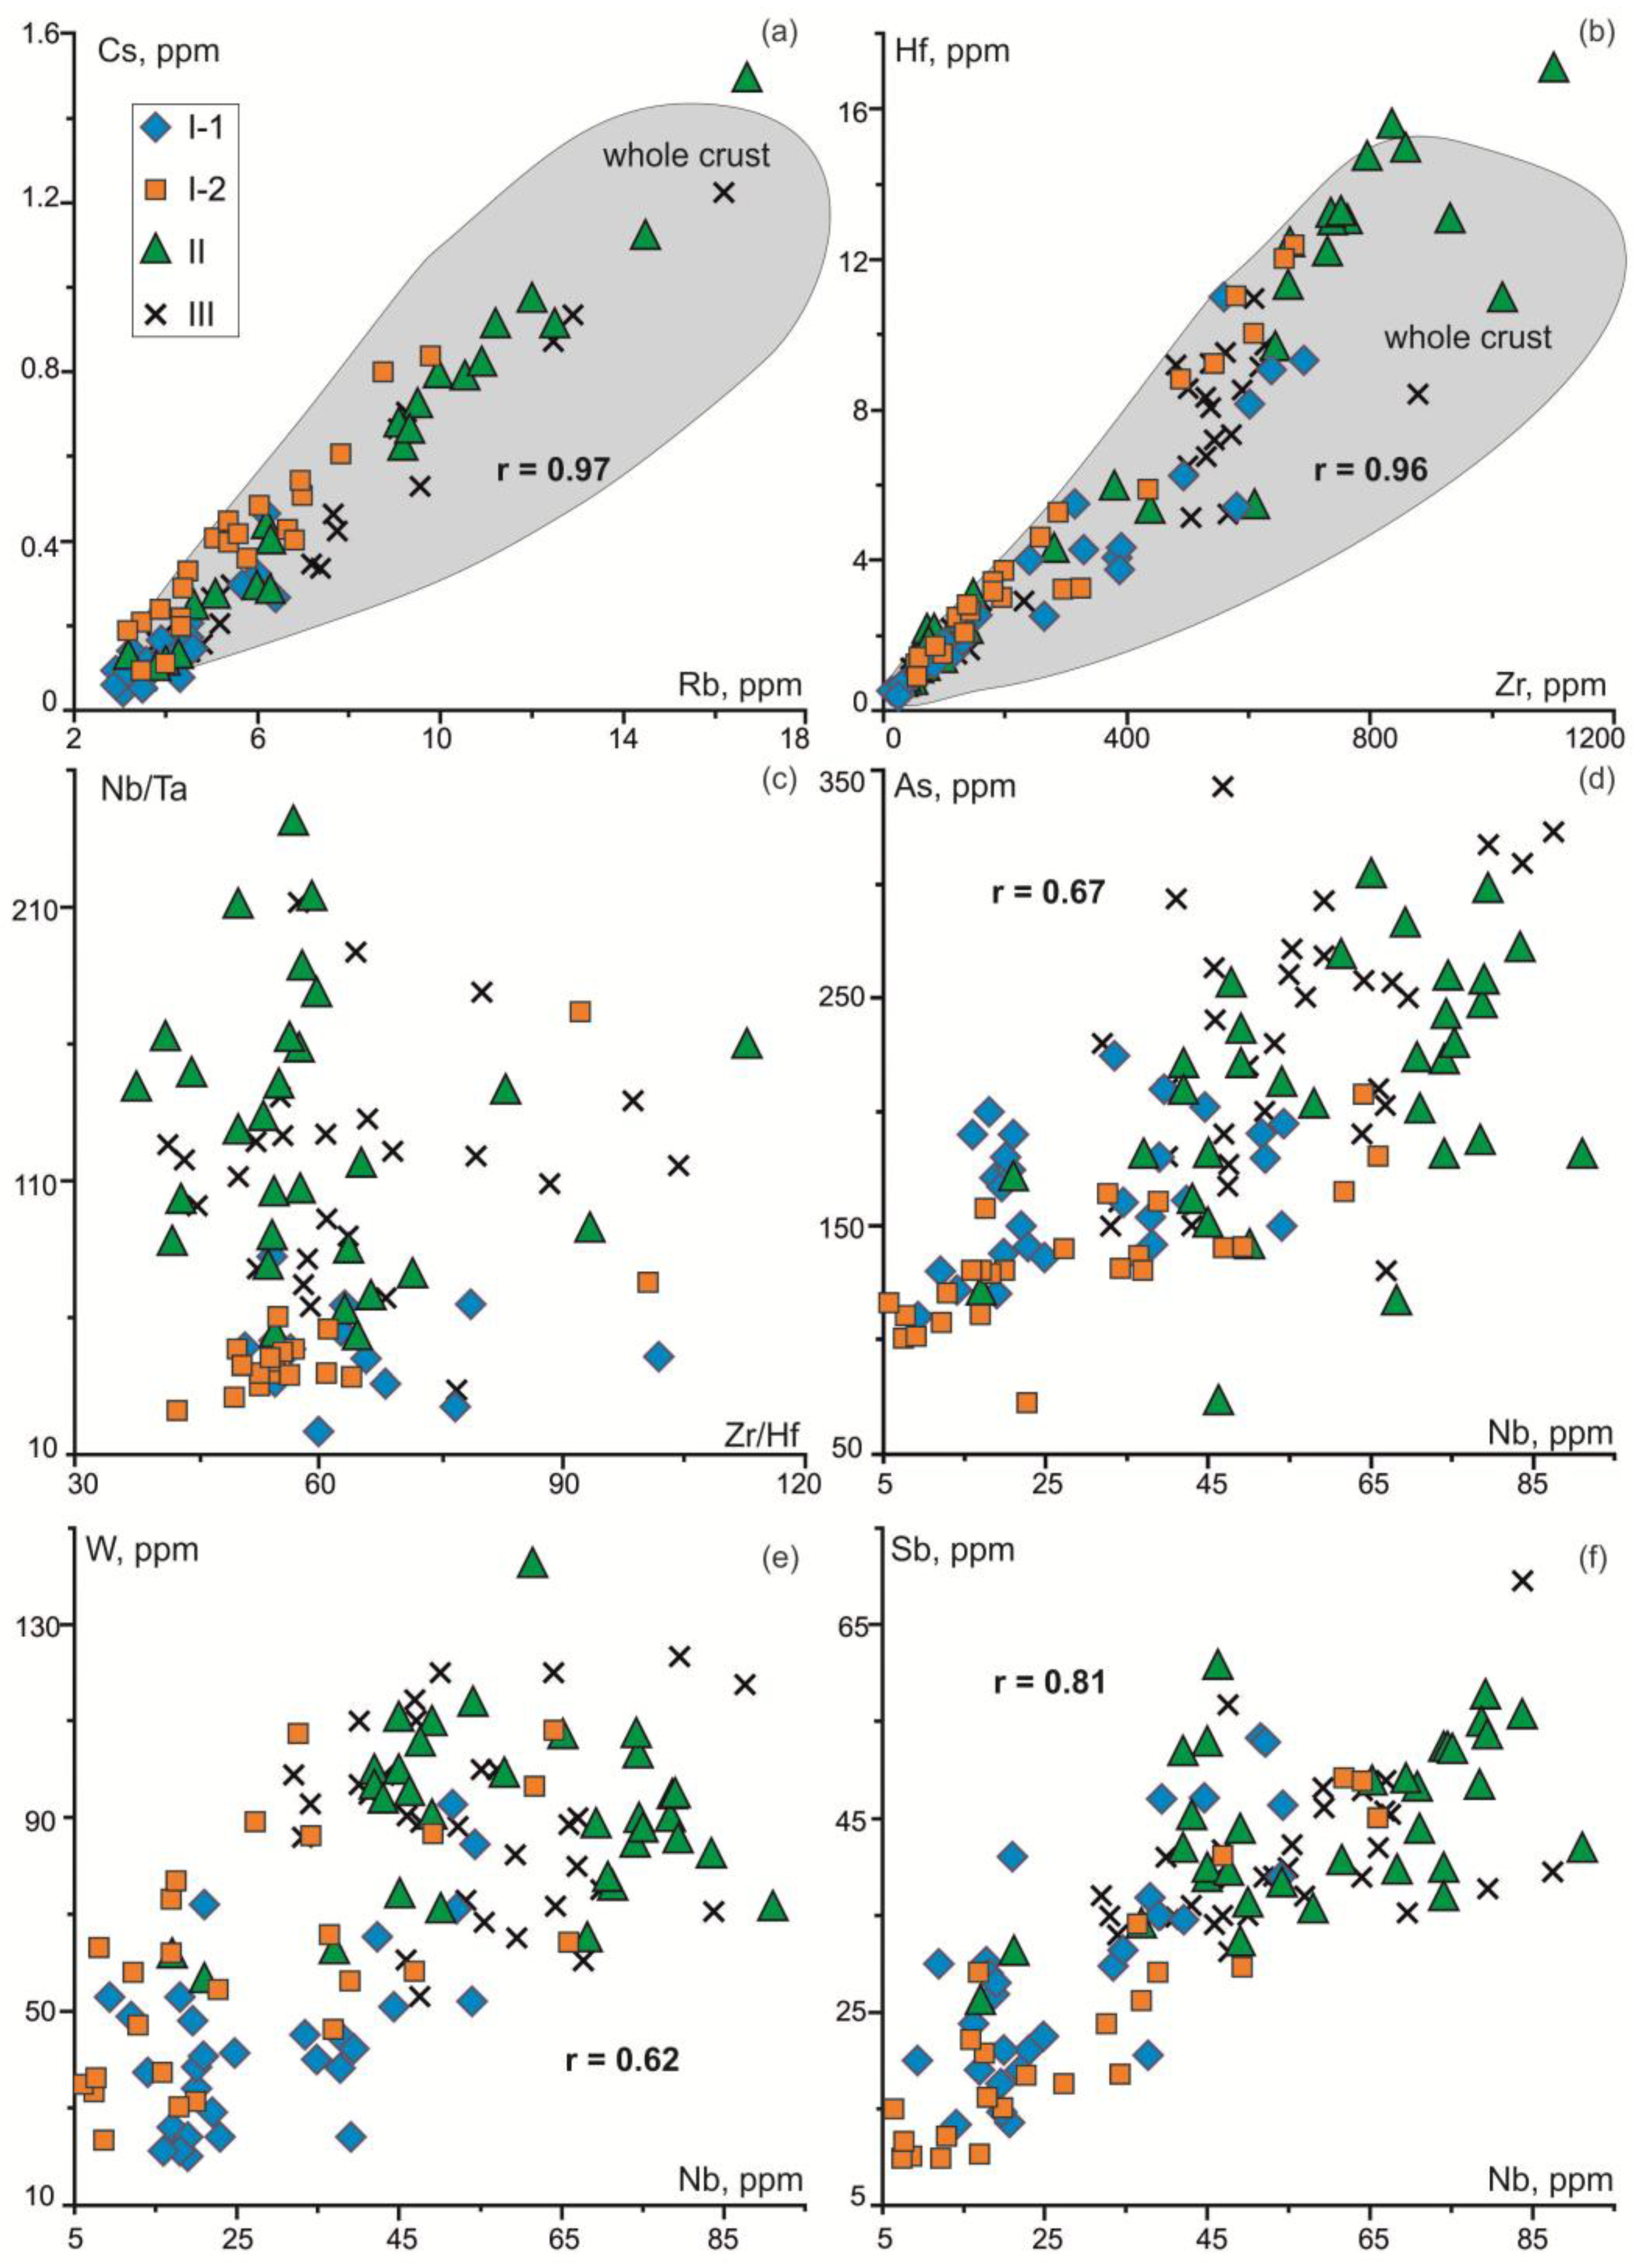
Figure 14.
Concentrations of Co, Ni, Ce, La, Bi, and As in layers of MST Fe-Mn crusts.
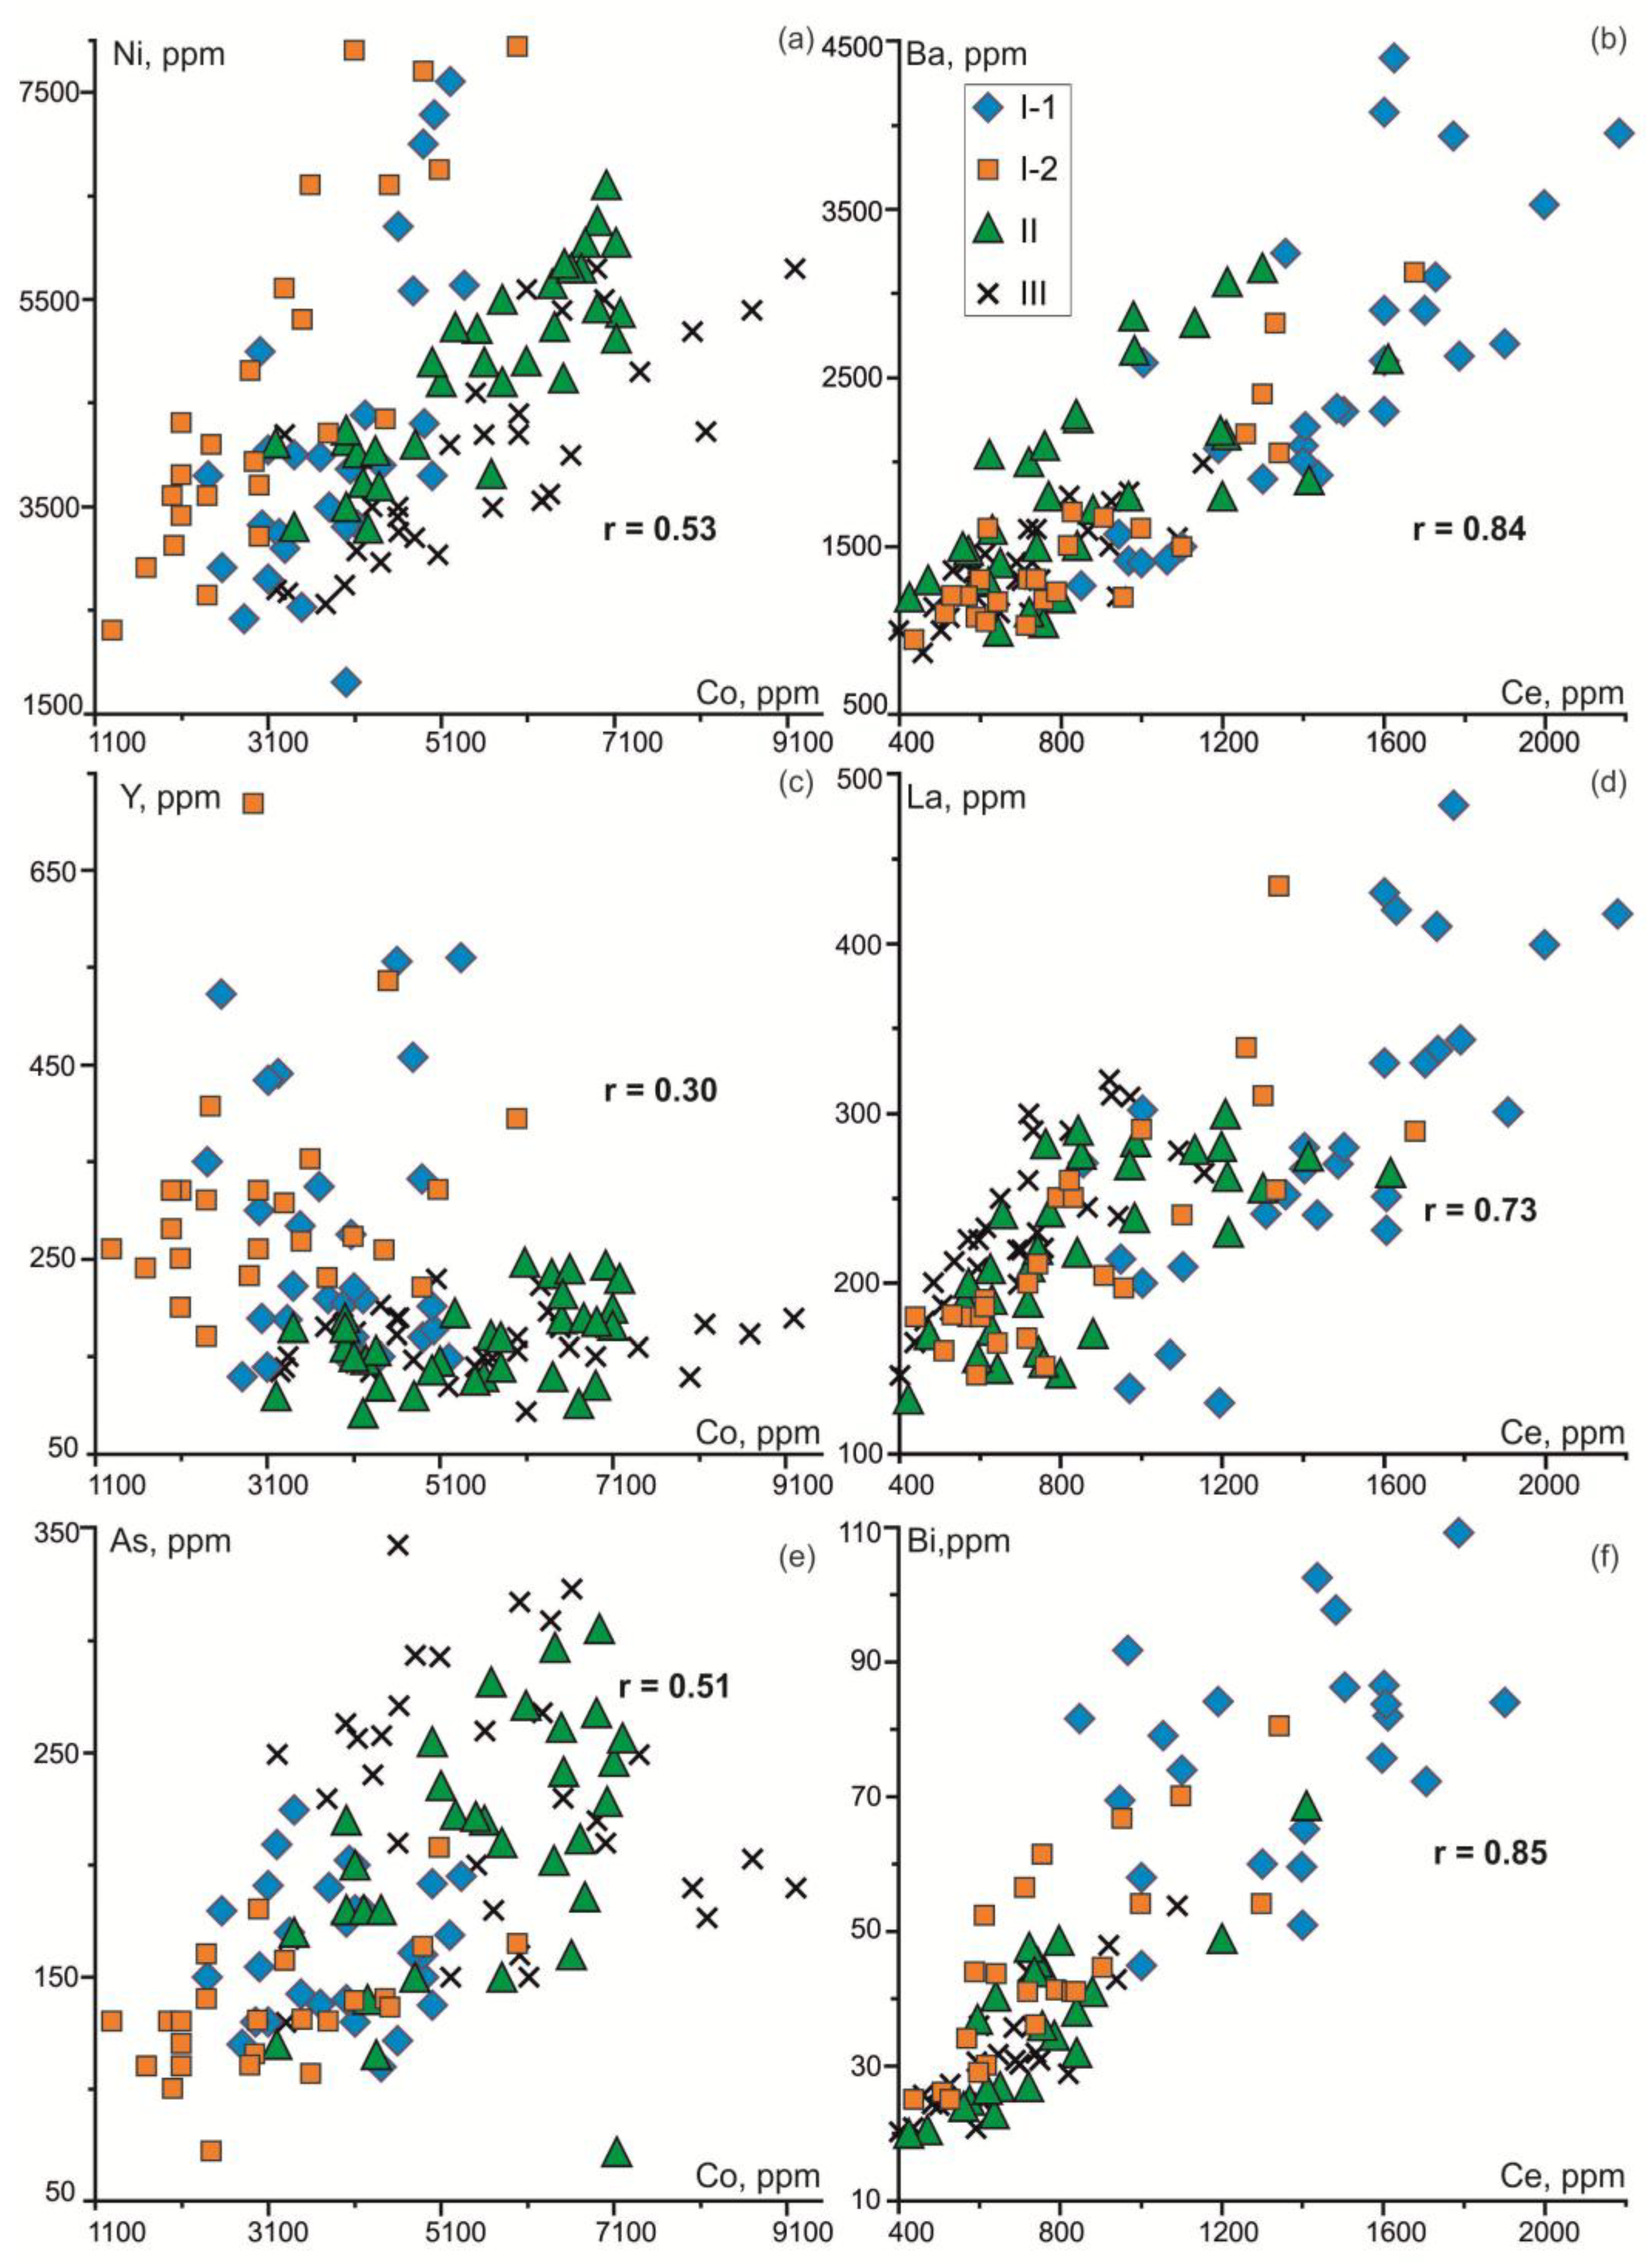
Figure 15.
Variations of P2O5 and CaO in MST Fe-Mn crusts. See text for explanation.
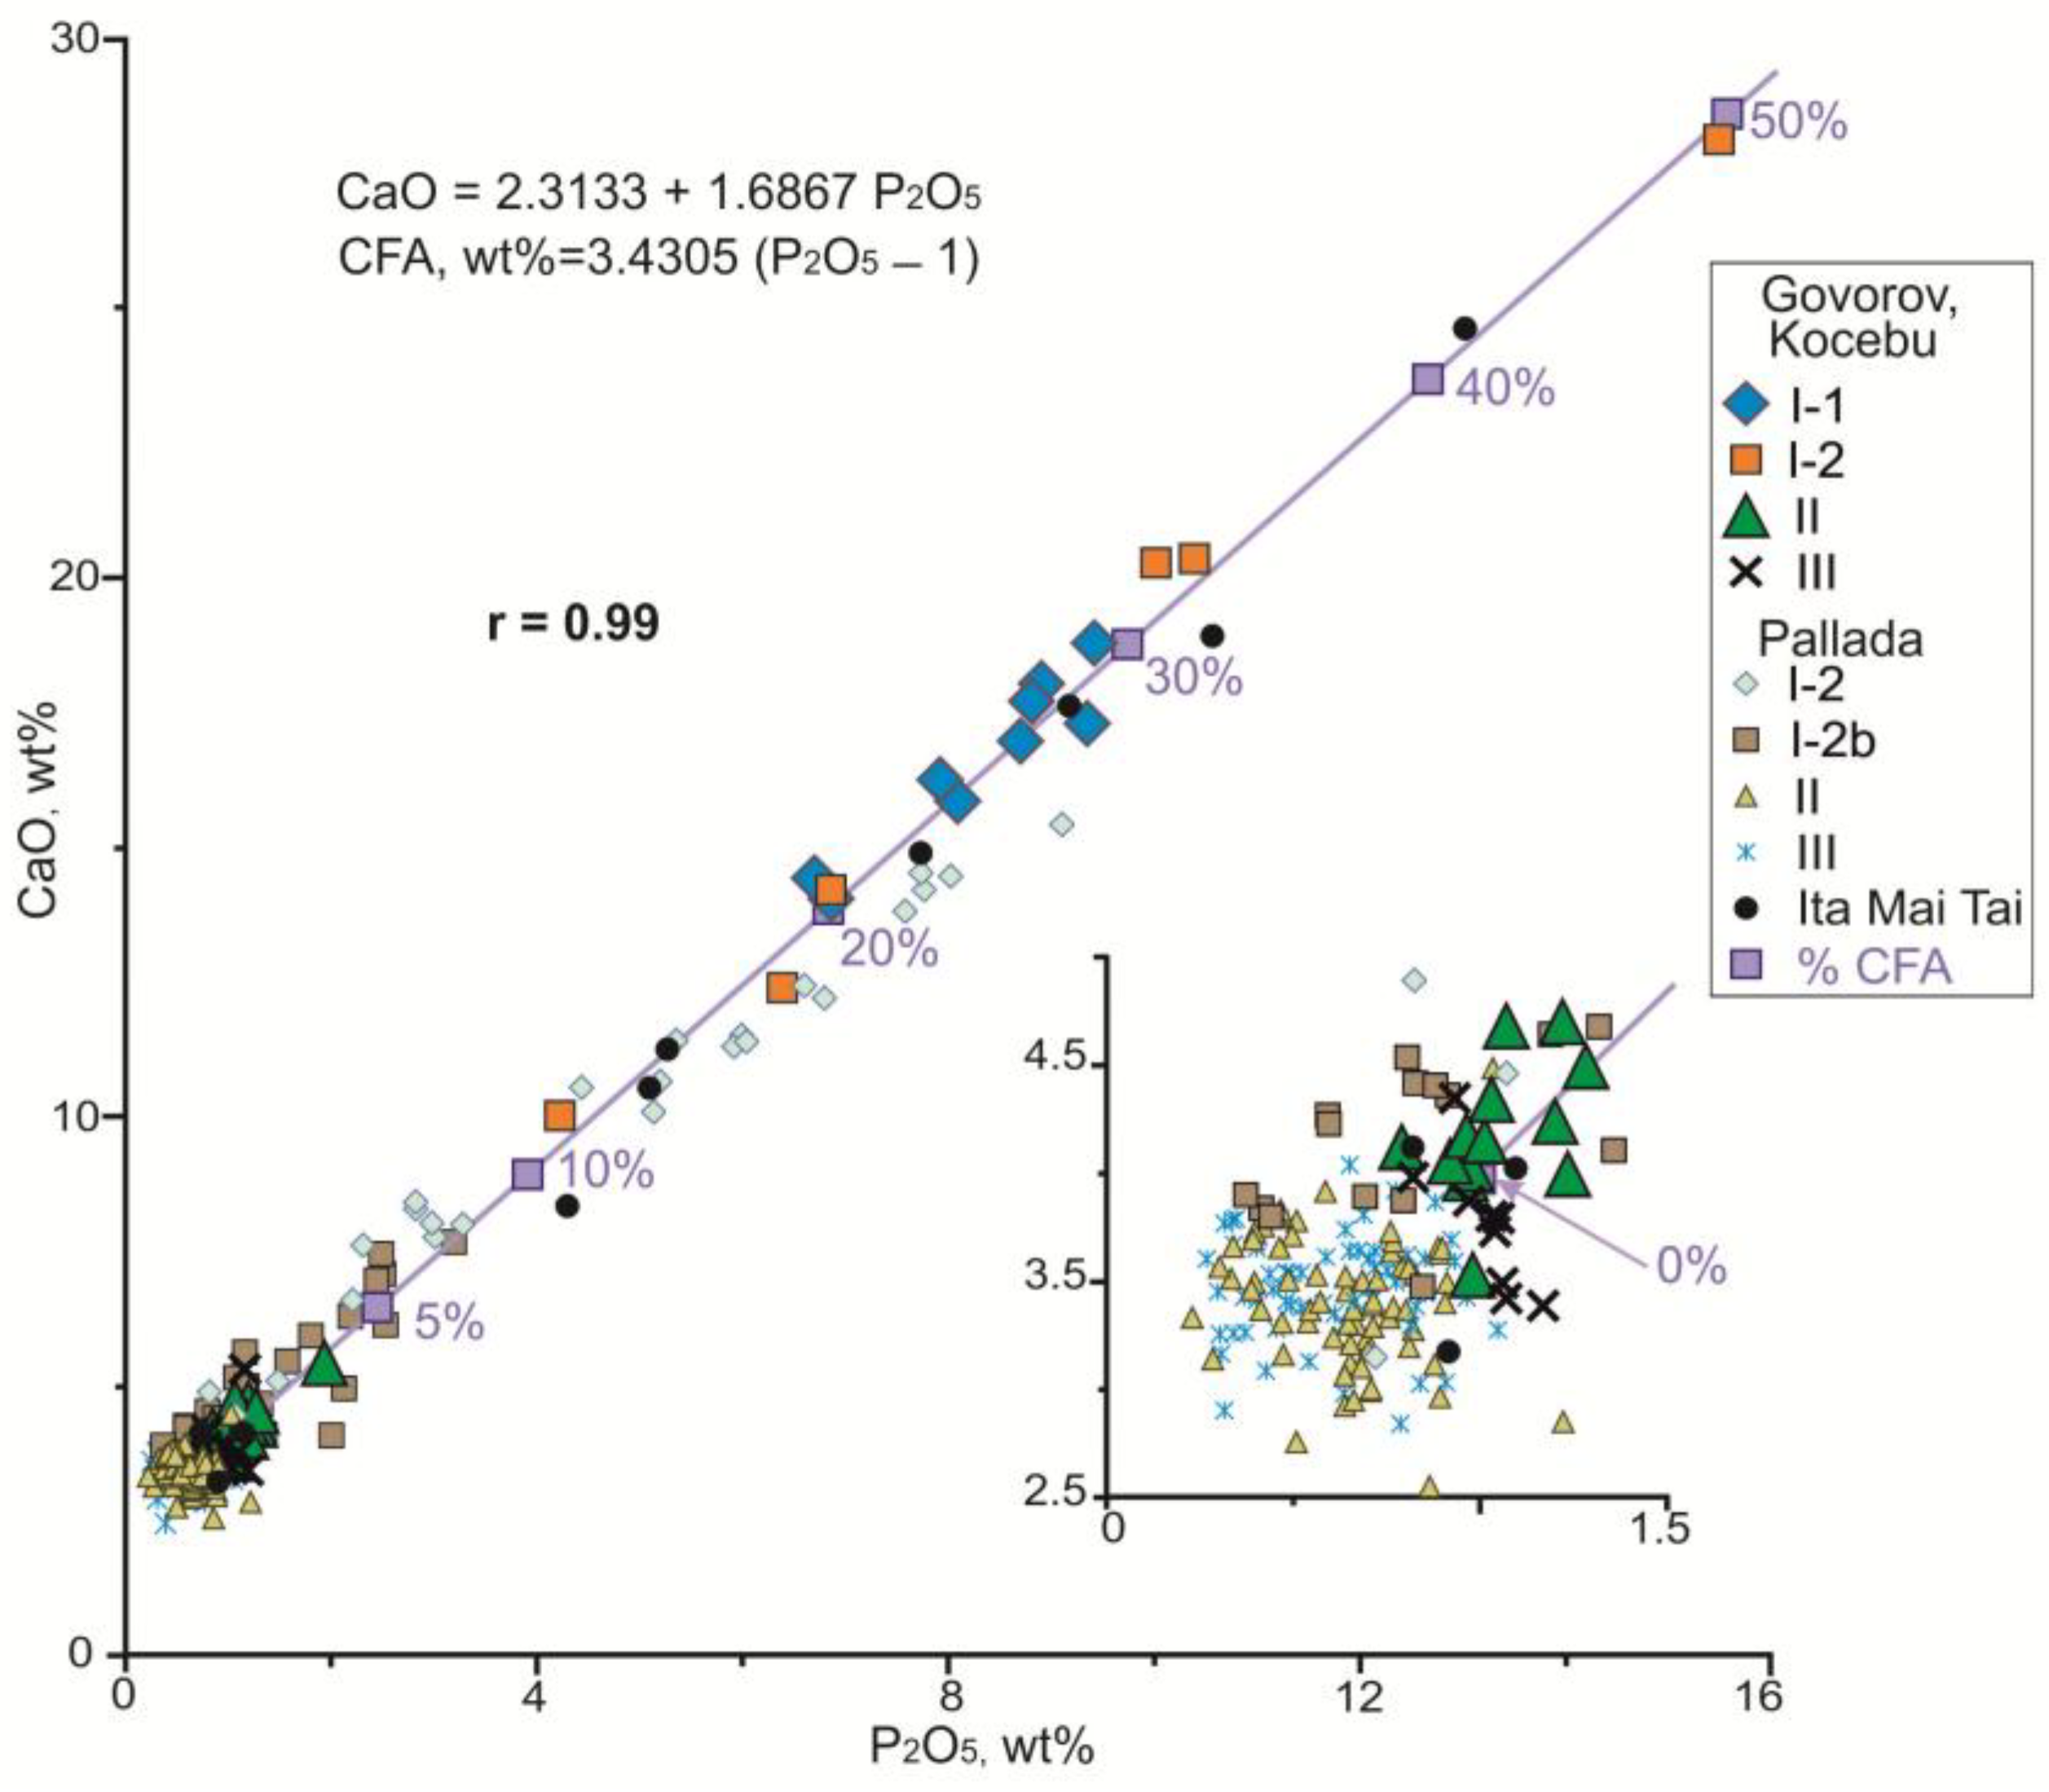
Figure 16.
Variations of Ce, La, Pr, Nd, Y and Ce* in the layers (mm) of the crust from Pallada Guyot, after [55].
Figure 16.
Variations of Ce, La, Pr, Nd, Y and Ce* in the layers (mm) of the crust from Pallada Guyot, after [55].
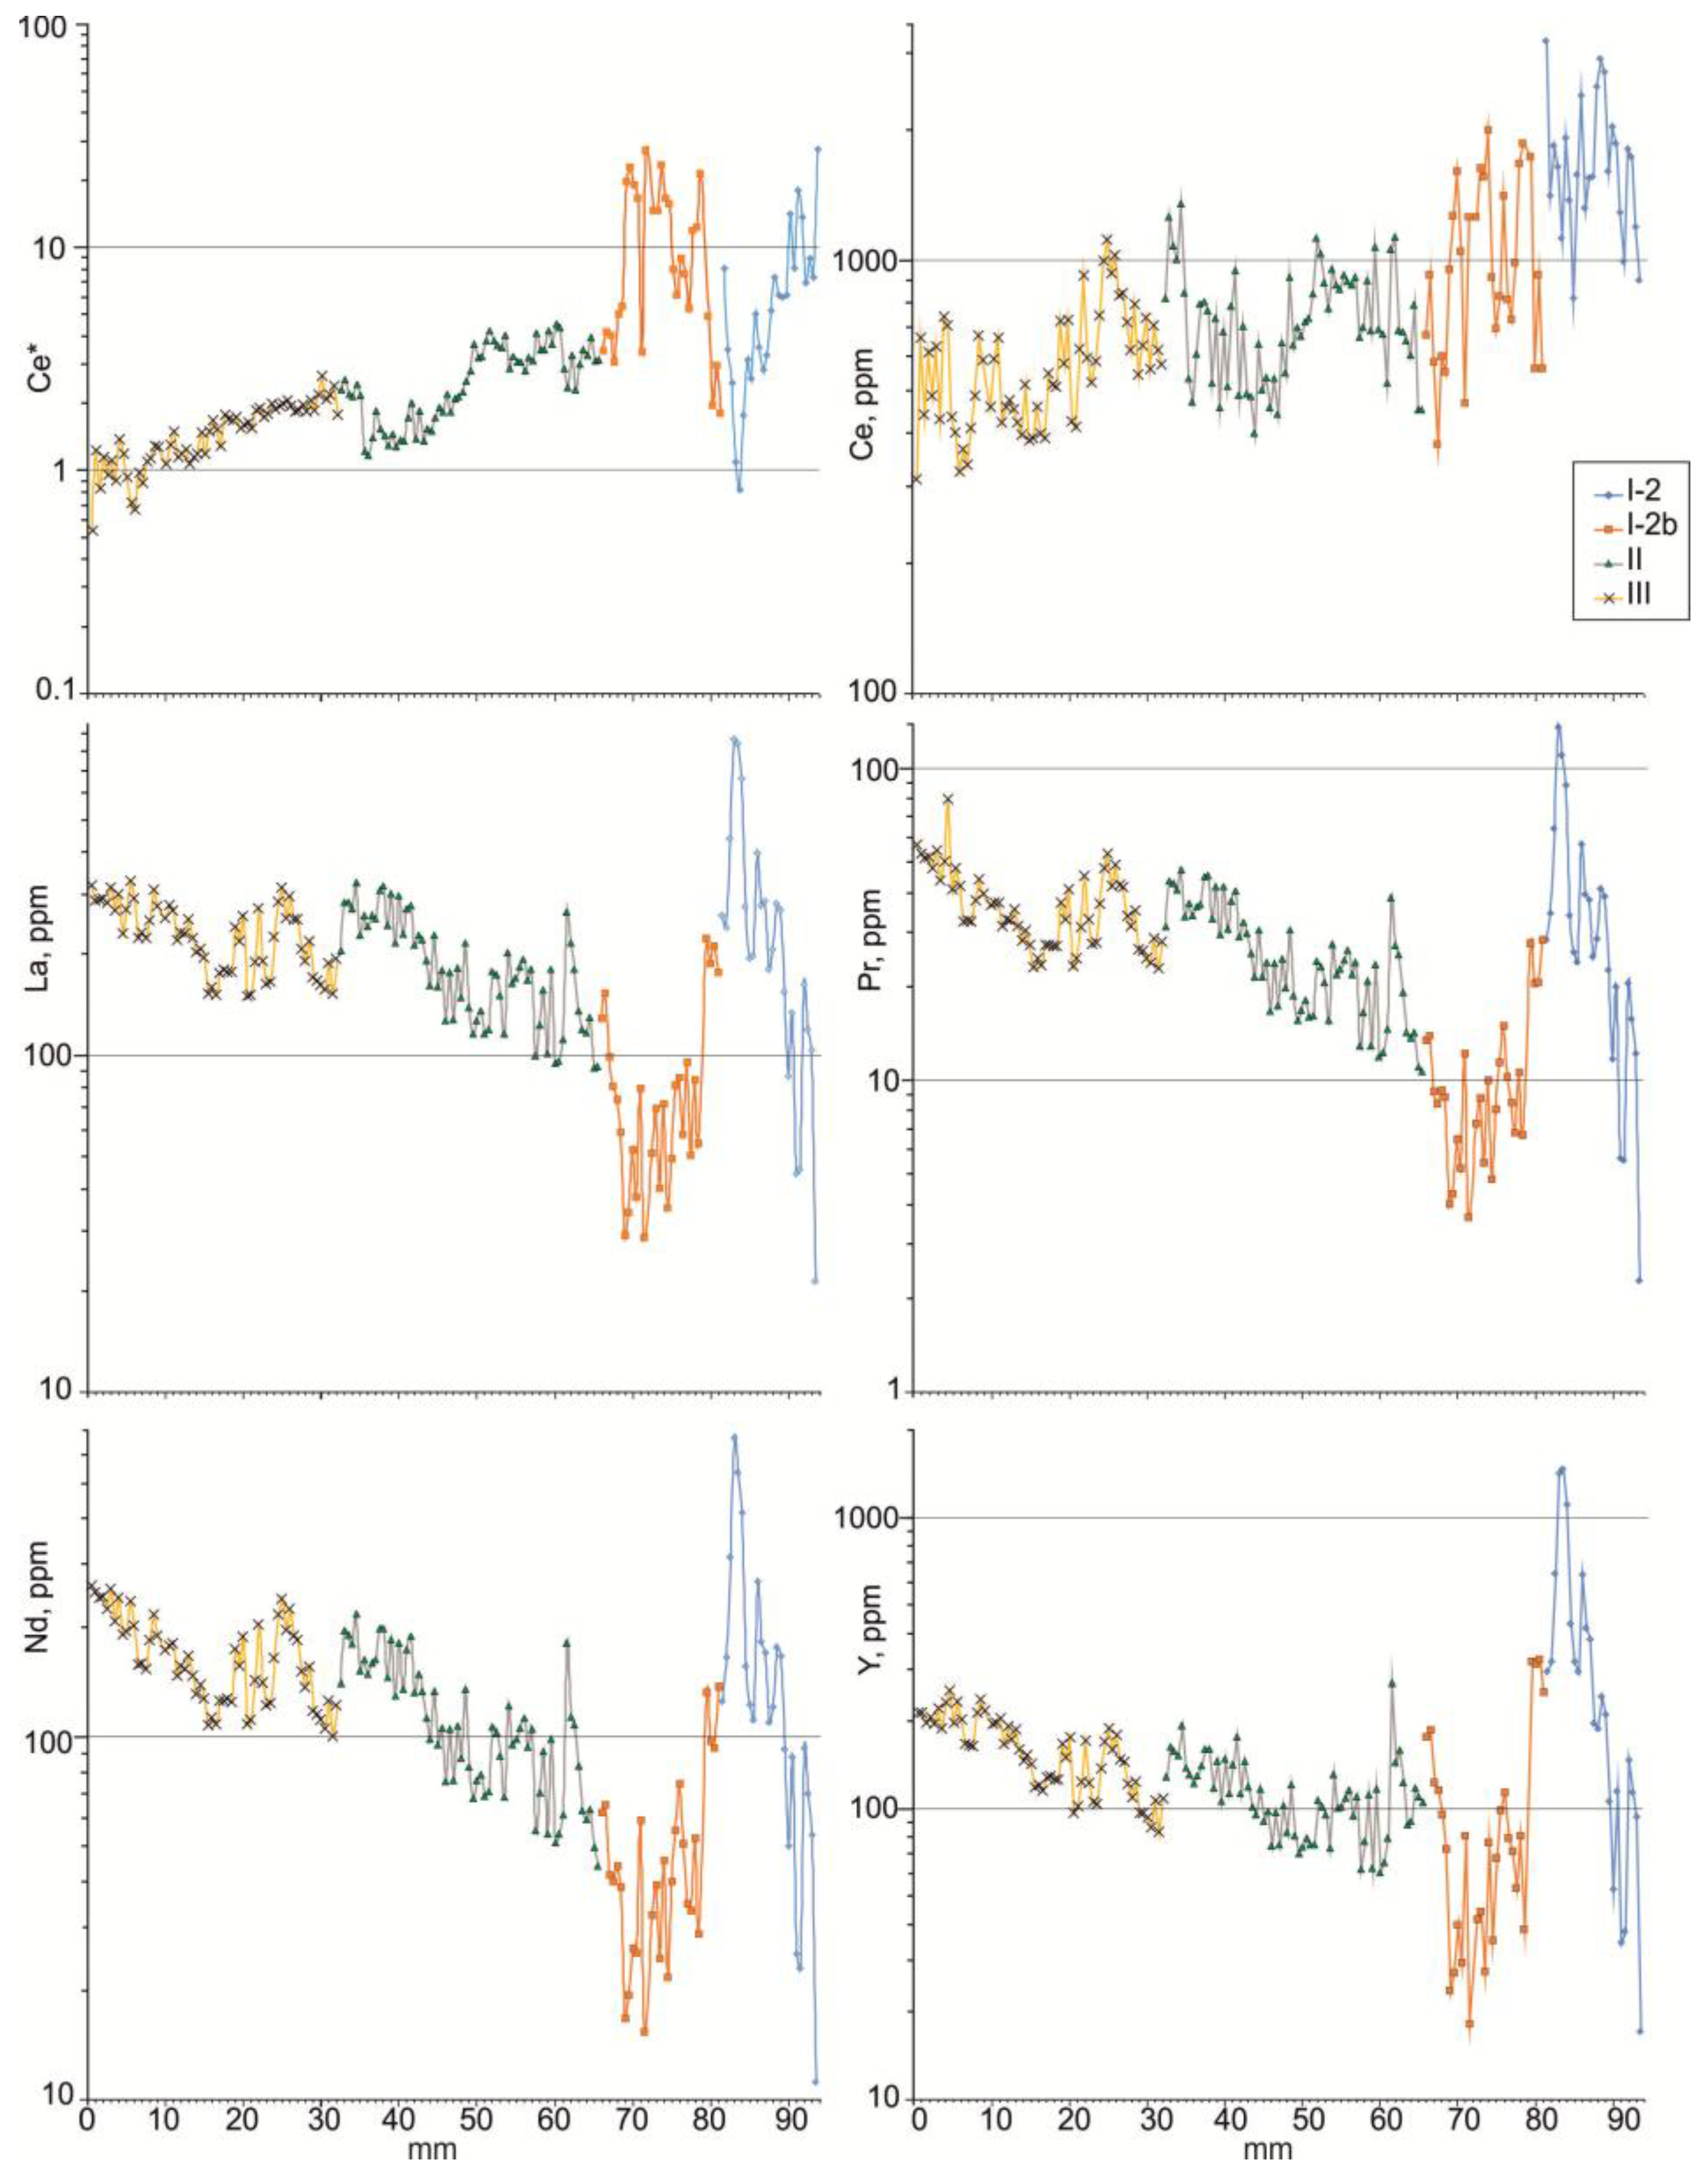
Figure 17.
Chronostratigraphy of Co-rich Fe-Mn crusts from Lomilik (Marshall Islands), Butakov, Alba, Fedorov, and Gramberg guyots, modified after [29].
Figure 17.
Chronostratigraphy of Co-rich Fe-Mn crusts from Lomilik (Marshall Islands), Butakov, Alba, Fedorov, and Gramberg guyots, modified after [29].
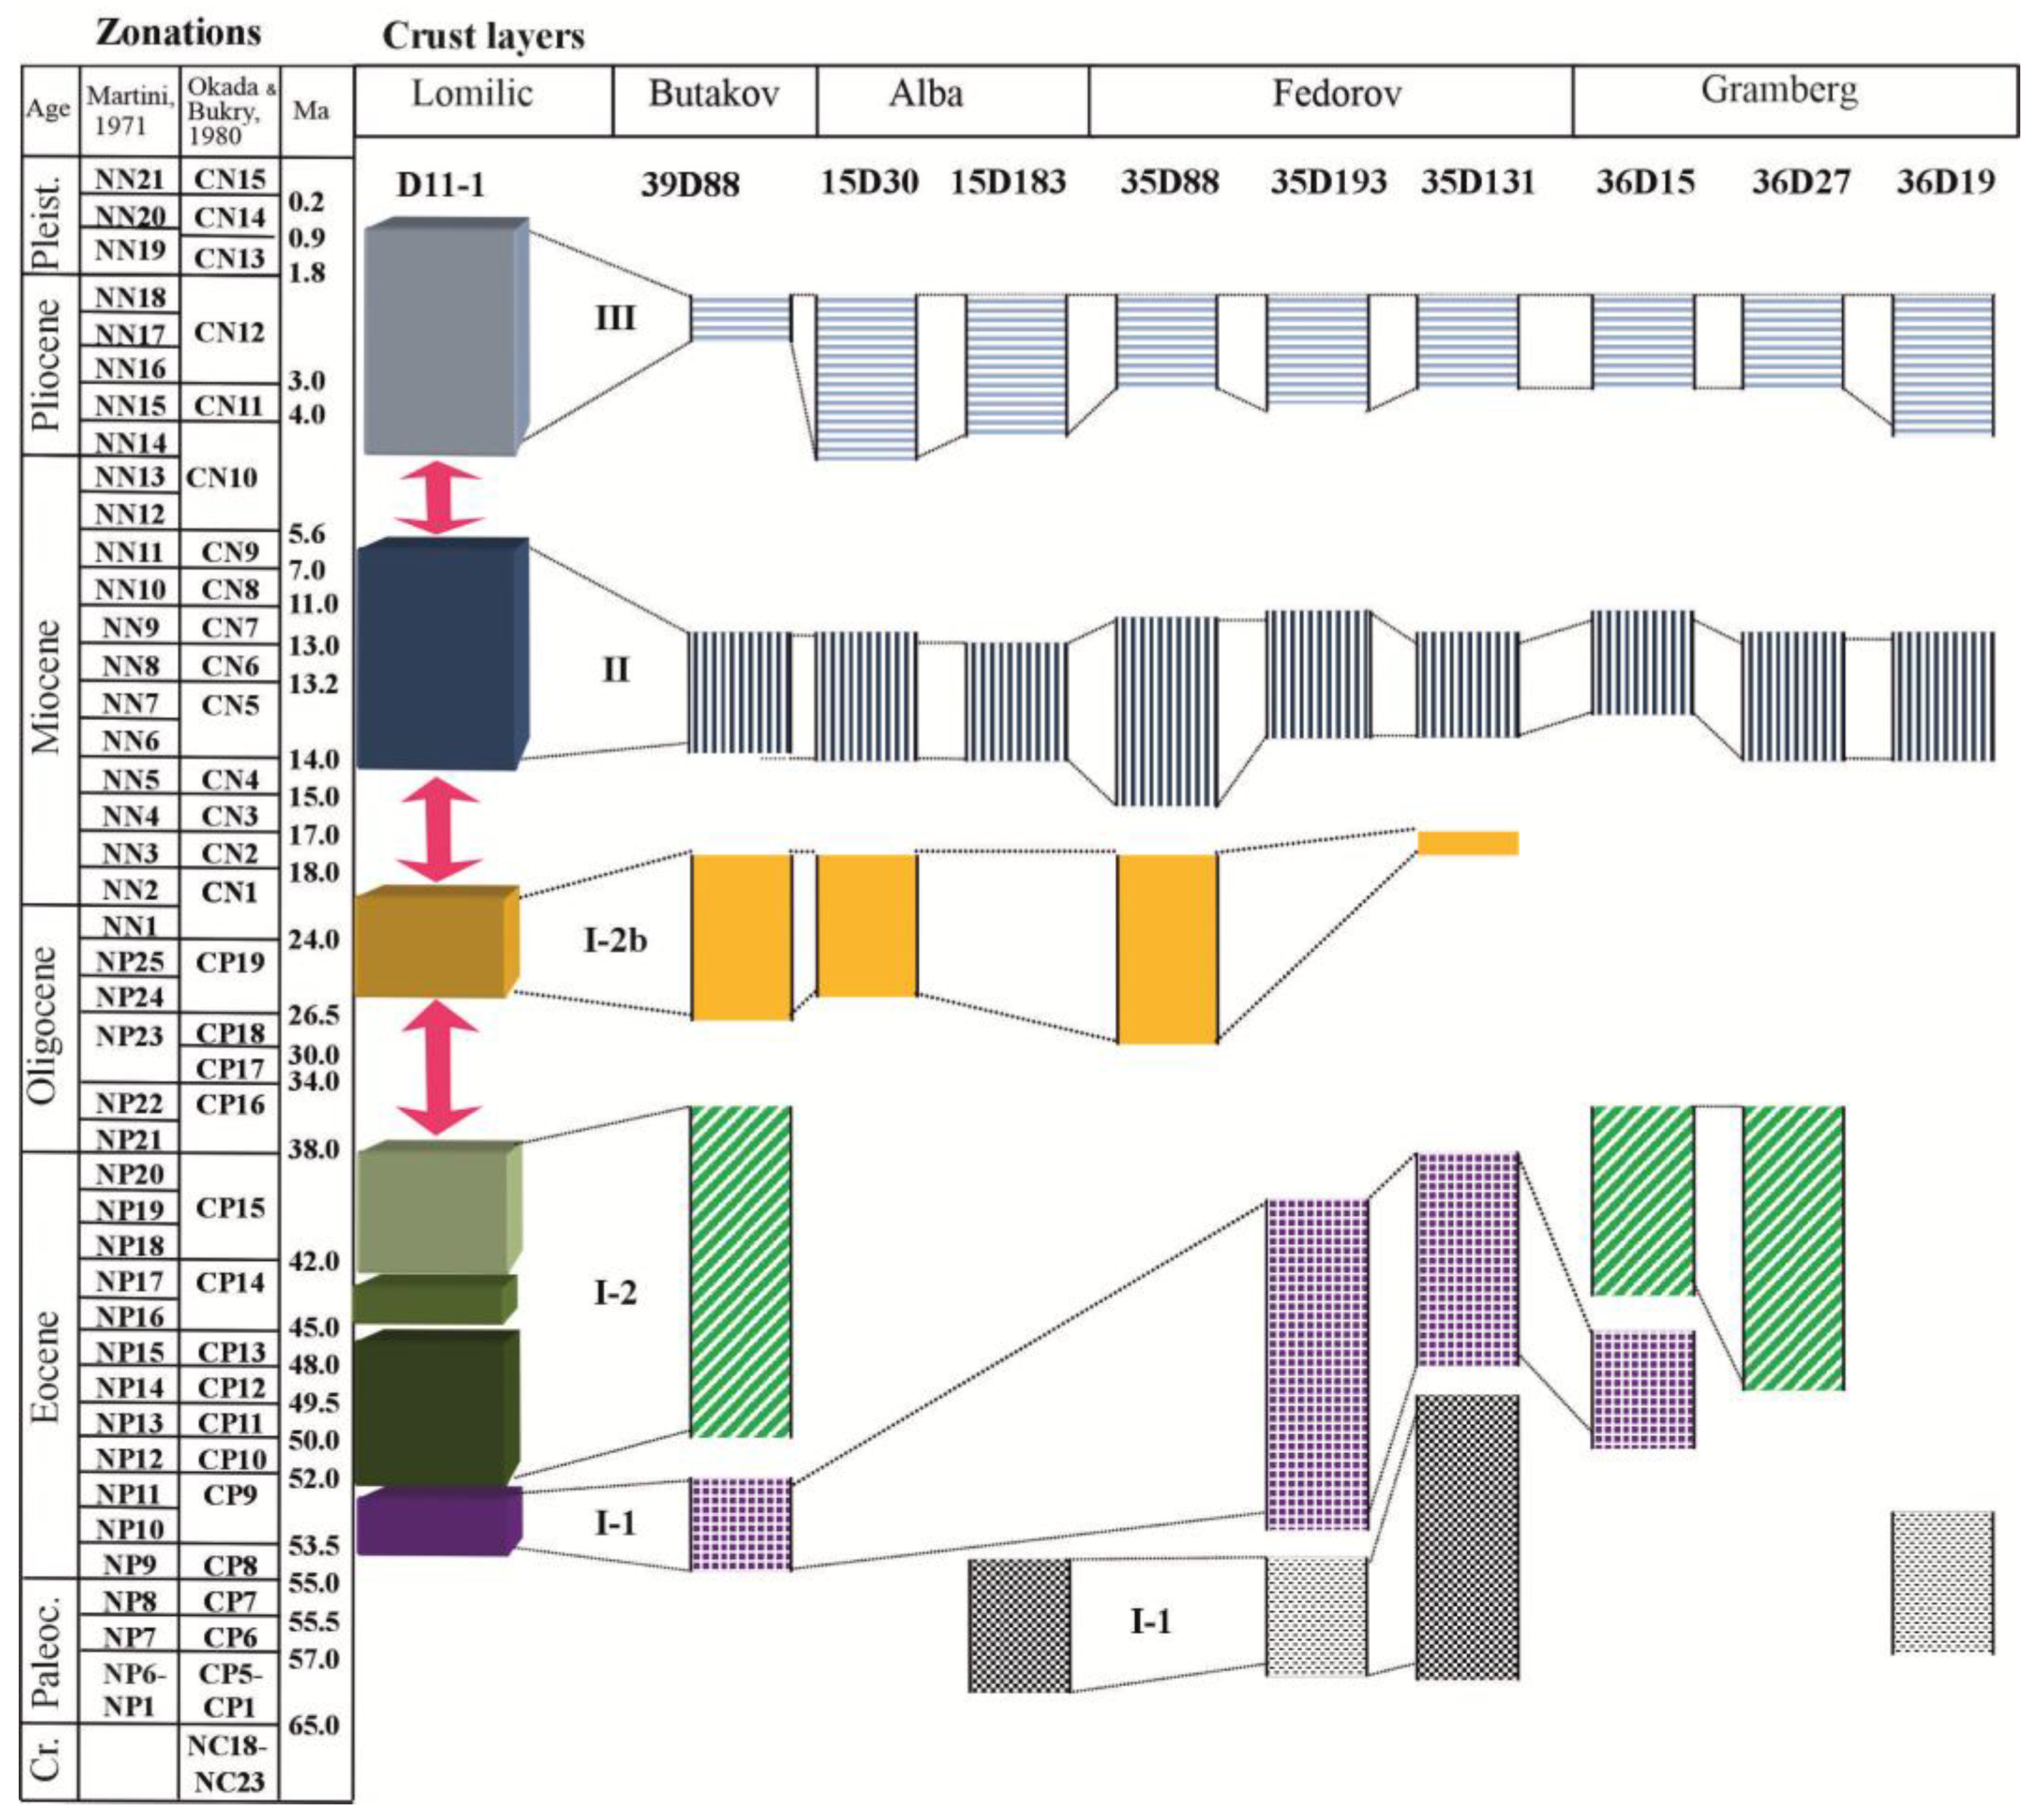
Figure 18.
Age profile of the Co-rich Fe-Mn crust from Pallada Guyot (a), layer growth rates from Co-chronometry (b), and patterns of P2O5 (c) and Co (d).
Figure 18.
Age profile of the Co-rich Fe-Mn crust from Pallada Guyot (a), layer growth rates from Co-chronometry (b), and patterns of P2O5 (c) and Co (d).
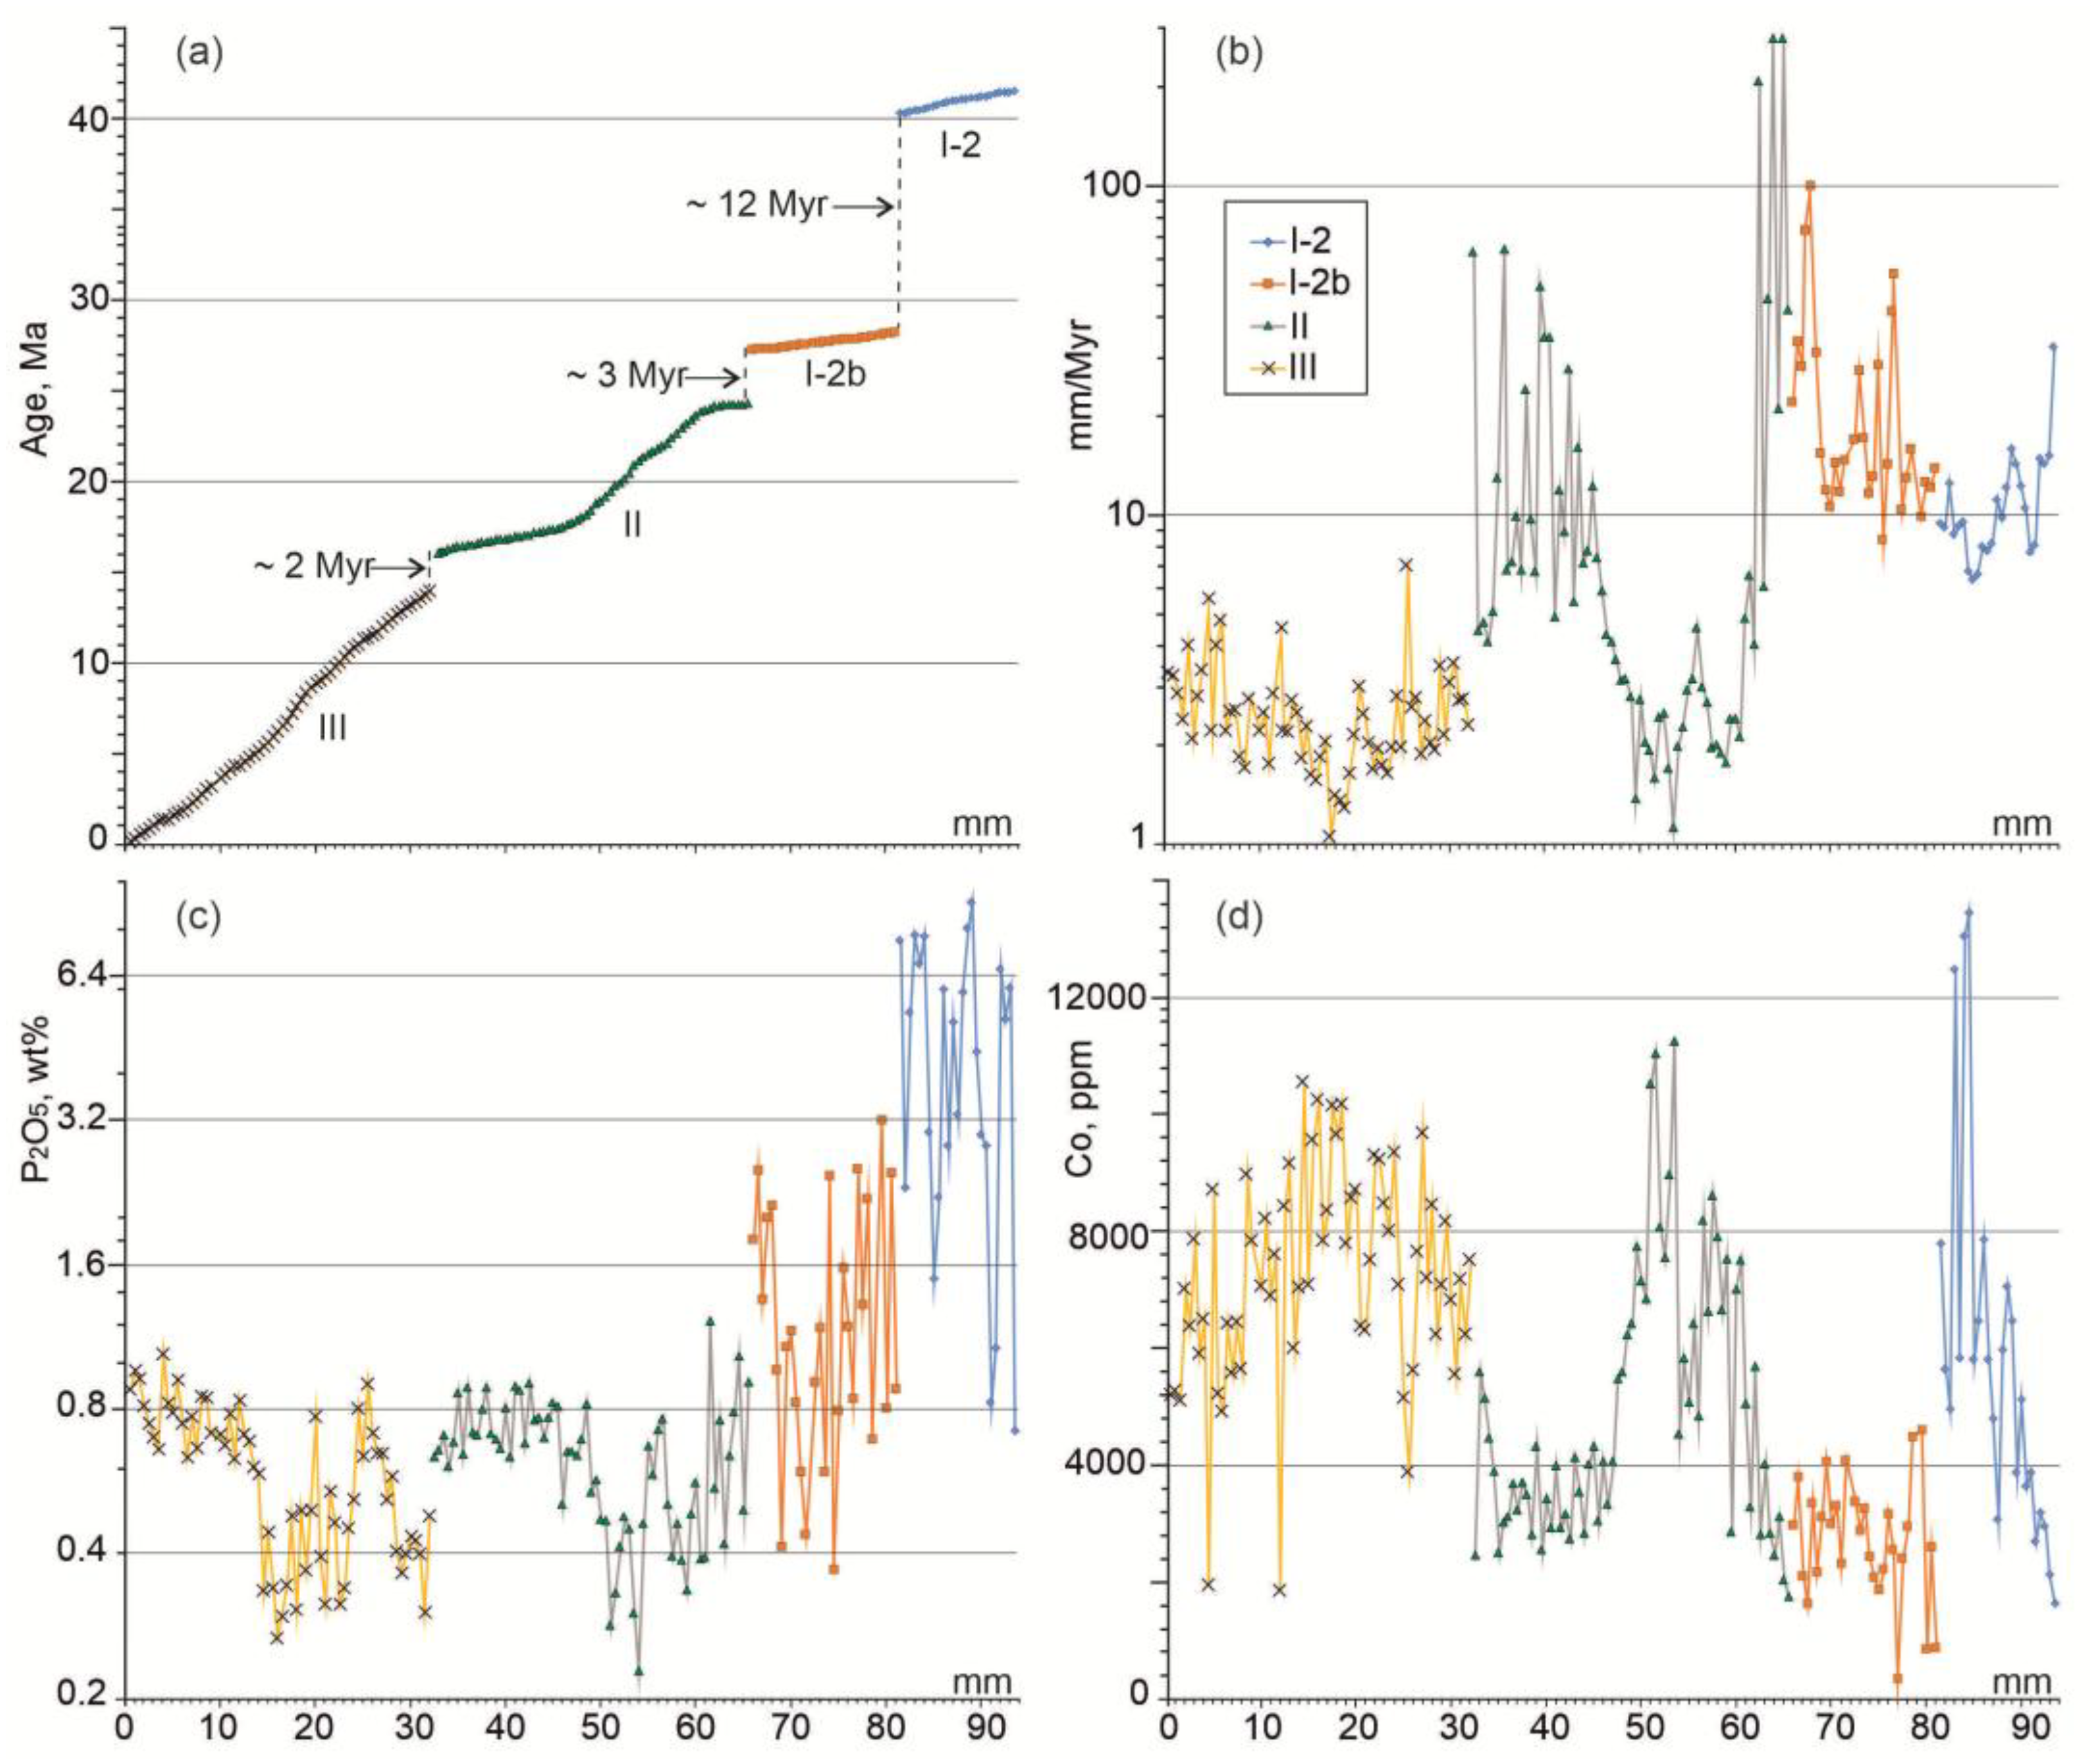
Table 1.
Location of dredging sites at Govorov and Kocebu guyots.
|
Sampling sites |
Deposit Type (Crust layer samples) |
Latitude (N) |
Longitude (E) |
Sea depth, m |
| Govorov | ||||
| 08D106 | Crust (I-1, I-2, II-1, II-2, III) | 17°55.416' | 151°14.111' | 1780 |
| 08D108 | Crust (II-1, II-2, III) | 17°53.903' | 151°14.488' | 2037 |
| 08D115 | Crust (I-1, II, III) | 17°37.201' | 151°29.888' | 1900 |
| 08D114 | Crust (I-1, II, III) | 17°39.611' | 151°28.809' | 2249 |
| 08D118-3 | Crust (I-1, II, III) | 17°33.101' | 151°27.571' | 2832 |
| Kocebu | ||||
| 14D53 | Crust (I-2, II, III) | 17°22.431' | 152°33.218' | 1794 |
| 14MTP01 | Crust (I-1) | 17°22.346' | 152°33.056' | 1958 |
| 14MTP02 | Crust (I-1, II, III) | 17°27.555' | 152°51.043' | 2695 |
| 14D77-2 | Crust (I-1, I-2, II-1, II-2, III) | 17°29.877' | 153°13.693' | 1538 |
Dredging was performed within a 600 m long interval; coordinates and sea depths are given for the starting point of dredging.
Table 2.
Contributions of layers (weight fraction) to the bulk Fe-Mn crusts composition.
| 08D106 | ∆Χ | Layer | wt% | 08D115 | ∆Χ | Layer | wt% | ||
| SiO2 | 13.10 | 0.082 | III | 47.02 | SiO2 | 9.95 | 0.176 | III | 53.13 |
| TiO2 | 1.99 | 0.098 | II-2 | 21.93 | TiO2 | 1.85 | -0.001 | II | 13.45 |
| Al2O3 | 3.08 | -0.122 | II-1 | 18.41 | Al2O3 | 2.13 | -0.272 | I-1 | 29.16 |
| Fe2O3 | 25.00 | -0.118 | I-2 | 12.25 | Fe2O3 | 22.20 | 0.003 | Total | 95.73 |
| MgO | 2.05 | 0.178 | I-1 | 0.04 | MgO | 1.87 | 0.208 | ||
| MnO | 27.42 | -0.205 | Total | 99.64 | MnO | 26.94 | 0.033 | ||
| CaO | 4.49 | -0.114 | CaO | 7.03 | -0.296 | ||||
| Na2O | 2.48 | 0.209 | Na2O | 2.36 | |||||
| K2O | 0.82 | -0.075 | K2O | 0.71 | -0.034 | ||||
| P2O5 | 1.52 | 0.065 | P2O5 | 3.14 | 0.184 | ||||
| LOI | 15.40 | LOI | 15.84 | ||||||
| Total | 97.35 | Total | 94.03 | ||||||
| ∑∆Χ2 | 0.185 | ∑∆Χ2 | 0.271 | ||||||
| 14D77-2 | ∆Χ | Layer | wt% | 14D53 | ∆Χ | Layer | wt% | ||
| SiO2 | 10.13 | 0.197 | III | 27.98 | SiO2 | 11.38 | 0.229 | III | 2.35 |
| TiO2 | 1.73 | 0.101 | II-2 | 28.99 | TiO2 | 1.82 | -0.146 | II | 94.10 |
| Al2O3 | 2.21 | -0.237 | II-1 | 22.32 | Al2O3 | 2.94 | -0.371 | I-2 | 0.00 |
| Fe2O3 | 22.80 | -0.192 | I-2 | 13.24 | Fe2O3 | 23.33 | -0.231 | Total | 96.45 |
| MgO | 2.06 | I-1 | 7.89 | MgO | 2.02 | 0.115 | |||
| MnO | 29.73 | 0.090 | Total | 100.42 | MnO | 27.00 | 0.272 | ||
| CaO | 6.96 | -0.233 | CaO | 4.74 | -0.457 | ||||
| Na2O | 2.46 | Na2O | 2.39 | ||||||
| K2O | 0.76 | 0.112 | K2O | 0.80 | |||||
| P2O5 | 3.05 | 0.163 | P2O5 | 1.43 | -0.420 | ||||
| LOI | 16.35 | LOI | 16.57 | ||||||
| Total | 98.23 | Total | 94.40 | ||||||
| ∑∆Χ2 | 0.243 | ∑∆Χ2 | 0.739 |
Note. ∆Χ is the difference between the initial and calculated oxide contents.
Disclaimer/Publisher’s Note: The statements, opinions and data contained in all publications are solely those of the individual author(s) and contributor(s) and not of MDPI and/or the editor(s). MDPI and/or the editor(s) disclaim responsibility for any injury to people or property resulting from any ideas, methods, instructions or products referred to in the content. |
© 2025 by the authors. Licensee MDPI, Basel, Switzerland. This article is an open access article distributed under the terms and conditions of the Creative Commons Attribution (CC BY) license (http://creativecommons.org/licenses/by/4.0/).
Copyright: This open access article is published under a Creative Commons CC BY 4.0 license, which permit the free download, distribution, and reuse, provided that the author and preprint are cited in any reuse.


