Submitted:
20 October 2025
Posted:
21 October 2025
You are already at the latest version
Abstract
Accurate pharmaceutical demand forecasting is essential to ensure timely drug availabil-ity, minimize waste, and enhance the sustainability of healthcare supply chains. However, existing statistical, machine learning, and deep learning approaches often struggle to capture the nonlinear and dynamic demand patterns arising from drug substitutions, comorbidity treatments, and seasonal disease fluctuations. To address this challenge, we propose KG-GCN-LSTM, a novel hybrid model that integrates a pharmaceutical knowledge graph (KG) with deep learning techniques. The knowledge graph encodes se-mantic relationships among drugs and symptoms, thereby enriching the contextual in-formation for a Graph Convolutional Network (GCN). The outputs of the GCN are subse-quently processed by a Long Short-Term Memory (LSTM) network to capture temporal dynamics in drug demand. Experiments on real-world pharmacy sales data demonstrate that KG-GCN-LSTM consistently outperforms established benchmarks—including ARI-MA, SVR, XGBoost, RNN, CNN-LSTM, and NBEATS, achieving a 3.62% reduction in Symmetric Mean Absolute Percentage Error (SMAPE) relative to NBEATS. These findings underscore the potential of knowledge graph–enhanced deep learning in fostering resili-ent and sustainable pharmaceutical supply chains, thereby improving resource allocation, mitigating shortages, and ultimately enhancing public health outcomes.
Keywords:
forecast
; gcn
; lstm
; knowledge graph
; pharmaceutical demand
1. Introduction
In recent years, efficient drug demand forecasting has become increasingly critical for pharmaceutical supply chain management, especially in light of growing healthcare demands, supply volatility, and the need for sustainable resource utilization. Accurate predictions of pharmaceutical consumption are essential not only to avoid stockouts, reduce inventory costs, and ensure timely access to medications, but also to minimize waste, improve supply chain resilience, and support the long-term sustainability of healthcare systems. However, drug demand forecasting remains a challenging task due to the inherent complexity of medical consumption patterns, which are influenced by a wide range of factors including seasonal trends, disease outbreaks, regulatory policies, and drug substitution relationships[1,2].
Traditional time series models such as Auto Regressive Integrated Moving Average (ARIMA) or exponential smoothing often fail to capture the nonlinear and heterogeneous patterns present in real-world drug consumption data. Moreover, these models typically treat each drug as an isolated sequence, ignoring important inter-drug relationships such as therapeutic equivalence, co-prescription, and substitution, which are crucial in understanding demand dynamics and achieving more sustainable pharmaceutical management. To address these limitations, recent studies have begun incorporating machine learning and deep learning approaches, particularly recurrent neural networks (GRU/LSTM) and convolutional neural networks (CNNs), which demonstrate improved performance in learning temporal dependencies. Specifically, LSTM[3] networks are capable of retaining long-term temporal information and handling variable-length input sequences, making them highly suitable for capturing complex demand trends over time. Meanwhile, CNNs excel at automatically extracting local patterns and hierarchical features from time-series data, improving the model’s ability to detect short-term fluctuations and periodic behaviors.
Although deep learning models like LSTM and CNN have shown clear advantages in capturing both long- and short-term temporal features, they are inherently limited in modeling the substitution and combination relationships among drugs—factors that also significantly influence demand. These relationships form a graph-structured network, where graph convolutional network (GCN[4]) are well-suited to model the inherent dependencies. Several studies have already leveraged GCNs to enhance prediction accuracy by integrating such relational knowledge into the forecasting process. Shi, et al. [5] proposes an integrated GCN-LSTM model for predicting stock price movement by assuming that large fluctuations are primarily caused by high-volume trades among interrelated stocks. By modeling capital flows through multi-relation graphs and combining GCN and LSTM, the approach significantly improves prediction accuracy. Yang, et al. [6] proposes a GCN-LSTM model to accurately predict urban rooftop PV potential by incorporating spatial shading between buildings, addressing the limitations of traditional geospatial and time-series methods. Wei, et al. [7] proposes a spatiotemporal power load forecasting method that combines improved scale-limited dynamic time warping (LDTW) clustering with a GCN-LSTM model to better capture temporal and spatial correlations in grid data.
Inspired by these studies, we propose a novel fusion forecasting framework, termed KG-GCN-LSTM, which integrates a knowledge graph with a GCN-LSTM[8] model to leverage both graph-based and sequential learning. Specifically, we construct a pharmaceutical knowledge graph that encodes the semantic relationships among drugs based on substitutability and combination usage. A graph convolutional network (GCN) is then employed to extract relational representations for each drug, which are dynamically combined with historical demand features and fed into a long short-term memory (LSTM) network to perform multi-step demand forecasting. This hybrid architecture allows the model to jointly learn spatial (inter-drug) and temporal (time-series) dependencies in a unified framework, thereby promoting more accurate, resilient, and sustainable drug supply chain management.
The main contributions of this work are summarized as follows:
- Knowledge Graph Enhancement: The pharmaceutical knowledge graph is designed to capture the interrelationships between drugs and symptoms, thereby supporting more accurate pharmaceutical demand forecasting. Ablation analysis indicates that approximately half of the model’s performance improvement can be attributed to the relational information derived from the knowledge graph, highlighting its crucial role in enhancing predictive accuracy.
- Model Innovation: We propose a hybrid model by combining GCN and LSTM. This design allows the model to simultaneously capture inter-drug relational dependencies and temporal demand patterns, leading to more accurate and robust predictions of pharmaceutical demand.
- Empirical Validation: Extensive experiments on a real-world pharmaceutical sales dataset demonstrate that the proposed model significantly outperforms classical statistical and deep learning models across multiple metrics.
The remainder of this paper is organized as follows: Section 2 reviews related work on demand forecasting. Section 3 presents the proposed KG-GCN-LSTM framework in detail. Section 4 describes the experimental setup and discusses the results. Finally, Section 5 concludes the paper and outlines directions for future research.
2. Literature Review
Demand forecasting has long been recognized as a crucial component of supply chain management. Traditional statistical models such as ARIMA, Exponential Smoothing, and Seasonal Trend Decomposition have been widely adopted due to their interpretability and simplicity. Gilbert [9] applied the ARIMA model to predict consumer demand, while [10] used the Seasonal ARIMA (SARIMA) model to forecast monthly peak electricity load. Jian, et al. [11] utilized an ARIMA model to accurately forecast the number of chronic kidney disease (CKD) patients and estimate the associated economic burden in China.
However, these approaches, including ARIMA and exponential smoothing, often fall short when dealing with the high variability and non-linear patterns commonly observed in demand data, particularly when demand is influenced by external, seasonal, and behavioral factors.
Driven by Industry 4.0 and advancements in artificial intelligence, machine learning (ML) techniques such as Random Forest, eXtreme Gradient Boosting (XGBoost), and Support Vector Regression (SVR) have gained widespread attention. Vairagade, et al. [12] employed a Random Forest model to predict demand for goods in the supply chain. Ji, et al. [13] applied the XGBoost model to forecast future sales demand for an e-commerce company. Yani and Aamer [14] empirically demonstrated that Random Forest and decision-tree-based models outperformed traditional baselines by 10–41% in pharmaceutical demand forecasting. Machine learning models offer several advantages, including the ability to capture complex non-linear relationships, incorporate a wide range of features, and adapt to large, high-dimensional datasets. However, they also present challenges such as interpretability issues, overfitting risks, and sensitivity to data preprocessing[15]. Yildiz and Sucuoglu [16] develops a low-cost, real-time IoT-based air quality forecasting system enhanced with machine learning, achieving high predictive accuracy and contributing to sustainable urban environmental management. Şen [17] demonstrates that ensemble learning methods, particularly Random Forest and XGBoost, provide reliable and accurate daily water level forecasts for dam reservoirs, supporting sustainable water resource management under climate variability.
In recent years, deep learning models have gained significant attention for time series forecasting, particularly in demand prediction. Recurrent Neural Networks (RNNs), especially Long Short-Term Memory (LSTM) networks, have shown superior performance over traditional models in capturing long-range temporal dependencies and handling irregular purchase patterns. DeepAR, an autoregressive recurrent model, further advances this field by modeling the conditional distribution of future values and has achieved notable success in large-scale retail forecasting.
Several studies have explored hybrid architectures to enhance forecasting accuracy. For instance, Punia, et al. [18] combined LSTM with Random Forest to capture both temporal and regression-based relationships in multi-channel retail data. Hou, et al. [19] proposed a TCN-LSTM model incorporating external variables for short-term urban passenger flow prediction. Jeon and Seong [20] improved DeepAR with distribution-based inputs and model ensembling, ranking third in the M5 competition. Zha, et al. [21] applied CNN-LSTM for gas field production forecasting. Liu, et al. [22] employs a hybrid TCN–Transformer–LSTM model to predict groundwater, effectively addressing three key challenges: high-frequency fluctuations, medium-range dependencies, and long-term memory effects. Ashtar, et al. [23] proposes a hybrid multi-stage forecasting framework for electricity demand in The Netherlands, demonstrating that sequence-to-sequence deep learning models with engineered temporal features outperform statistical and hybrid baselines, particularly for long-term predictions.
In the pharmaceutical sector, recent studies have shown that machine learning and deep learning techniques can significantly improve the accuracy of drug demand forecasting compared with traditional time-series models [24,25]. Rathipriya, et al. [26] found shallow neural networks more effective than deep models across diverse drug categories. Hapsari [27] utilized K-Means clustering with Bi-LSTM to forecast pharmaceutical demand, outperforming traditional machine learning approaches. Similarly, Mbonyinshuti, et al. [28] and Priyadharshini, et al. [29] demonstrated the advantages of LSTM-based and CNN-LSTM hybrid models in improving medicine demand forecasting and inventory optimization in healthcare systems.
Deep learning models such as CNNs and LSTMs have demonstrated significant advantages in demand forecasting, particularly in effectively capturing diverse temporal and spatial patterns within complex time series data. However, these models often overlook the interaction information embedded in graph structures—for instance, the compositional or substitutive relationships among pharmaceuticals, or the interdependencies between financial assets. To enhance the representational capacity of forecasting models, recent studies have begun integrating domain-specific knowledge through graph-based structures [7,30,31]. In healthcare, GCNs have been used for disease prediction, drug repurposing, and patient risk stratification[32], yet their application in demand forecasting remains limited.
In pharmaceutical contexts, knowledge graphs provide a natural way to represent relationships among drugs based on clinical use, substitution, pharmacological similarity, and co-prescription patterns. By embedding such graphs into the forecasting pipeline, GCNs can enrich temporal models with contextual information. However, most existing studies either treat drug forecasting as independent time series or focus solely on temporal dependencies, neglecting the rich semantic interrelations among drugs. To the best of our knowledge, very few works have attempted to combine graph neural networks with temporal models for drug demand forecasting. Our proposed KG-GCN-LSTM fusion model aims to fill this gap by jointly modeling inter-drug relationships and temporal demand patterns, thereby improving forecast accuracy and robustness.
3. Methods
In this section, we propose a hybrid prediction framework that effectively integrates structural semantic information from a drug knowledge graph with temporal demand patterns by combining a GCN and a LSTM network. A drug knowledge graph (KG) is a structured representation of pharmaceutical domain knowledge, where entities such as drugs, symptoms, and diseases are modeled as nodes, and their semantic or functional relationships (substitution or co-prescription) are represented as edges. This graph-based representation enables the encoding of domain-specific prior knowledge, which is often overlooked by purely data-driven time-series models. To incorporate this structured knowledge into demand forecasting, we employ GCN to learn low-dimensional embeddings of drugs from the knowledge graph. The GCN propagates and aggregates information across connected nodes, allowing each drug’s representation to reflect not only its intrinsic characteristics but also its relationships with other drugs. These graph-based embeddings are then integrated into the temporal forecasting module (LSTM), enabling the model to jointly capture structural knowledge dependencies and temporal demand dynamics. By combining the knowledge graph with GCN, our KG-GCN-LSTM model effectively leverages both domain knowledge and time-series patterns, resulting in improved prediction accuracy and robustness.
As illustrated in Figure 1, the proposed model architecture is composed of four key components:
- Graph Data Construction via Knowledge Graph:
A domain-specific drug knowledge graph is constructed by extracting structured semantic relationships among drugs, such as substitution and combination relations. This graph is represented as a heterogeneous network where nodes correspond to drugs and edges represent semantic relations. Historical demand data for each drug are aligned with corresponding graph nodes to form attribute-enhanced graph data for subsequent learning.
- 2.
- GCN-Based Relational Embedding:
To capture topological dependencies and semantic correlations between drugs, a multi-layer Graph Convolutional Network is employed. The GCN propagates information across the graph structure, generating relational embeddings that encode not only a drug’s own features but also contextual information aggregated from its neighboring nodes (e.g., substitute or complementary drugs). This enables the model to learn high-level inter-drug representations that reflect real-world co-usage or substitution patterns.
- 3.
- LSTM-Based Temporal Modeling:
The temporal dynamics of drug demand are modeled using an LSTM network, which is well-suited for learning sequential dependencies and long-term temporal patterns. The historical demand sequences of each drug, enriched with relational embeddings, are fed into the LSTM to learn time-aware representations that capture seasonality, trends, and irregular demand fluctuations.
- 4.
- Prediction:
The LSTM module’s outputs are fed via a fully linked layer to obtain the final demand prediction. This fusion layer combines structural knowledge from the drug graph with temporal features from the LSTM, allowing the model to produce more context-aware and accurate forecasts. The output represents a forecast of future demand.
This hybrid architecture allows for a more comprehensive modeling of pharmaceutical demand by unifying relational semantics and temporal dynamics, addressing the limitations of traditional univariate forecasting models that fail to account for complex inter-drug interactions.
3.1. Graph Data Construction
As illustrated in Figure 2, for a given target drug A, the model input is constructed by combining the historical demand data of all drugs with a drug knowledge graph. Specifically, the knowledge graph is queried to identify all drugs that are directly or indirectly related to drug A. For example, drugs B and C may share a direct relationship with drug A, while drug D may be connected through an intermediate node. The historical demand series for these related drugs are then extracted to form the raw input data for the demand forecasting model of drug A.
Based on the preprocessed data, we construct a drug graph , where each node corresponds to a specific drug, and each edge denotes a semantic relationship between drugs. These relationships include, but are not limited to substitution and combination.
3.2. Graph Convolutional Network for Relation Learning
We apply a multi-layer GCN to embed the structural information from the drug graph into dense representations. Given a drug graph with nodes, let denote the adjacency matrix, where if there is an edge between node and node , and 0 otherwise; is the feature matrix with -dimensional input features for each node. To ensure that each node retains its own information during convolution, we introduce self-loops:
where is the identity matrix. The corresponding degree matrix is:
The propagation rule for a single GCN layer is defined as:
where:
- is the hidden representation at the -th layer, with
- is the trainable weight matrix.
- is a nonlinear activation function ReLU.
- is the symmetrically normalized adjacency matrix, which ensures numerical stability and avoids scaling issues during aggregation.
Through this mechanism, each node updates its feature representation by aggregating information from its neighbors, weighted by graph structure.
As illustrated in Figure 3, a two-layer GCN is adopted to strike a balance between model expressiveness and computational complexity, and it can be formally expressed as:
The first layer maps input features into a hidden space, extracting local structural embeddings.
The second layer aggregates higher-order dependencies and generates the final embeddings , where each row corresponds to the representation of a drug node.
These embeddings are subsequently used as input for the LSTM module, which captures temporal dynamics in pharmaceutical demand.
3.3. LSTM for Temporal Demand Forecasting
The GCN output vector is the input of LSTM:
The core structure of the LSTM network comprises four key components: the forget gate, input gate, candidate state, and output gate, as illustrated in Figure 4.
The forget gate determines whether the memory from the previous time step should be retained. Its computation is defined by Equation (6), where denotes the forget gate output, and represents the sigmoid activation function, which maps values to the range (0, 1). is the weight matrix, and is the bias term for the forget gate. The input gate, defined in Equation (7), controls the extent to which the current input affects the memory cell. Here, and denote the weight matrix and bias for the input gate, respectively. The candidate cell state is computed as shown in Equation (8), where and represent the corresponding weights and biases, and denotes element-wise multiplication. The memory cell state is then updated by combining the outputs of the forget gate and input gate, as defined in Equation (9). Next, the output gate determines which parts of the current cell state are exposed as output. The computation of the output gate is shown in Equation (10), where and refer to the weights and biases of the output gate, respectively. The hidden state at the current time step is computed as shown in Equation (11).
4. Results
The experiments are conducted on a public dataset, the Retail Sales Dataset of a Pharmacy in Indonesia [33], which contains daily sales records for a variety of pharmaceutical products. The sales data for each drug are aggregated on a weekly basis. To ensure a robust evaluation, only drugs with at least 50 weeks of sales data in the training set were retained. The models are then evaluated by predicting demand over the final 8 weeks. The drug knowledge graph is derived from the DrugBank database [34]. Specifically, the Product Concept ID for each drug was first retrieved through the Medication Search API, after which the Therapeutic Alternatives API was used to identify potential substitutes associated with each Product Concept ID. These substitution relationships were then integrated to build a pharmaceutical knowledge graph that formally represents inter-drug connections.
4.1. Baselines for Comparison
To assess the effectiveness of the proposed KG-GCN-LSTM model, we compare KG- GCN-LSTM to the following baselines: (1) auto-ARIMA [35], (2) SVR [36], (3) XGBoost [37], (4) RNN [38], (5) CNN-LSTM [21], (6) NBEATS[39]. Table 1 provides an overview of each model’s characteristics along with their key parameter settings. All models, including baselines and the proposed KG-GCN-LSTM, are trained using the training set, with hyperparameters optimized on the validation set. The final evaluation is conducted on the test set to compare the predictive capabilities of each approach under identical conditions.
Forecasting performance is evaluated using commonly adopted metrics, including Mean Absolute Error (MAE), Root Mean Square Error (RMSE), and Symmetric Mean Absolute Percentage Error (SMAPE), allowing a comprehensive assessment of both absolute and relative prediction accuracy.
MAE measures the average magnitude of the absolute differences between the predicted and actual values, offering a straightforward interpretation of the model’s prediction bias. It is defined as:
where denotes the number of samples, represents the actual value of the ith sample, and is the predicted value.
RMSE evaluates the square root of the average squared prediction errors, emphasizing larger errors due to the squaring operation. It is more sensitive to outliers compared to MAE and is given by:
SMAPE quantifies prediction accuracy as a percentage, measuring the average absolute error relative to the actual values, Unlike the traditional Mean Absolute Percentage Error (MAPE), SMAPE addresses the issue of asymmetry by normalizing the absolute error with the average of the actual and predicted values. This makes it particularly useful when the scale of the data varies or when actual values are close to zero:
Together, these metrics offer complementary perspectives on the model’s predictive accuracy, robustness, and practical utility.
Table 2 presents the comparative forecasting performance of different baseline models and the proposed KG-GCN-LSTM model, evaluated using three standard metrics: MAE, RMSE, and SMAPE. The results indicate significant performance differences across classical statistical models, machine learning methods, and advanced deep learning architectures.
Among the state-of-the-art models, NBEATS surpasses CNN-LSTM in performance but still struggles with relatively high error rates (MAE = 78.2468, RMSE = 96.3988, SMAPE = 11.86%). On the other hand, the proposed KG-GCN-LSTM model outperforms all competitors across the three evaluation metrics, achieving the lowest error values (MAE = 53.9080, RMSE =65.4058, SMAPE = 8.24%). Remarkably, compared to NBEATS, our model reduces SMAPE by 3.62%, underscoring its superior ability to integrate pharmaceutical knowledge graph features with temporal forecasting.
These findings validate the significance of incorporating structured pharmaceutical knowledge through graph representations in improving forecasting accuracy. The results also demonstrate that combining domain-specific knowledge with deep sequential models enhances both prediction robustness and adaptability to the inherent complexities of pharmaceutical demand patterns.
Figure 6 presents a comparison between the predicted and actual values. The red line indicates the reference line where the predicted values equal the actual values. The closer the points are to this line, the more accurate the predictions. As shown in Figure 5, the points corresponding to the KG-GCN-LSTM model are closer to the red line and more densely clustered, indicating higher prediction accuracy. In contrast, the points corresponding to the CNN-LSTM model are more dispersed and lie farther from the reference line, reflecting lower accuracy.
To better understand the predictive capability of our model, Figure 7 presents a visual comparison of average forecasting results across all models. The time-series plots show that AutoARIMA and RNN capture the general demand trends but often lag behind rapid fluctuations. CNN-LSTM demonstrates unstable predictions with noticeable deviations during peak demand periods, while NBEATS yields smoother curves but still fails to accurately follow local variations in the data.
In contrast, the proposed KG-GCN-LSTM exhibits the closest alignment with the actual demand curve, particularly in capturing sudden demand surges and seasonal fluctuations. This observation is consistent with the quantitative metrics reported in Table 2, where KG-GCN-LSTM achieves the lowest MAE, RMSE, and SMAPE.
The combination of numerical evidence and visual analysis strongly supports that integrating drug knowledge graph representations with temporal modeling allows KG-GCN-LSTM to achieve more accurate and reliable pharmaceutical demand forecasting than both classical methods and state-of-the-art deep learning models.
4.2. Ablation Study
To comprehensively assess the contributions of various components and data sources in the proposed KG-GCN-LSTM model, we performed an ablation study by methodically eliminating or substituting essential modules. The objective of this investigation is to ascertain the individual and collective impacts of temporal modeling, graph-based relational learning, and knowledge graph enrichment on forecasting ability.
- (1)
- Analysis at the Component Level
First, we looked at how the GCN and LSTM modules worked. In particular, swapping out the LSTM module for a one-layer MLP with 64 hidden units creates the KG-GCN-MLP version. On the other hand, taking off the GCN module leaves with a solo LSTM model.
The results of Table 3 demonstrate the synergistic importance of both components. The most dismal performance of the standalone LSTM variation is observed (MAE = 72.6728, RMSE = 84.4461, SMAPE = 11.21%), indicating that LSTM is inadequate for capturing the evolution of pharmaceutical demand over time. The KG-GCN-MLP achieves superior results (MAE = 65.2841, RMSE = 80.7454, SMAPE = 10.32%), demonstrating that the relation can detect graph patterns but still lacks temporal modeling.
The full KG-GCN-LSTM, on the other hand, does far better than both ablated versions on all measures (MAE = 53.9080, RMSE = 65.4058, SMAPE = 8.24%).
Figure 8 shows that the LSTM model does a good job of capturing general demand trends, while the KG-GCN-MLP model shows how demand changes in the short term. The KG-GCN-LSTM model makes a more accurate and balanced prediction by combining both relational and temporal learning abilities.
These results show that the GCN and LSTM modules work together in different ways. The GCN effectively encodes relational knowledge from the pharmaceutical knowledge graph, capturing associations between drugs and symptoms. The LSTM captures long-term temporal dependencies and changes in drug use over time.
By combining them, the KG-GCN-LSTM model can make the most accurate and reliable predictions in all experimental conditions.
- (2)
- Analyzing the Contribution of the Knowledge Graph
To further confirm the effect of the knowledge graph, a new baseline model called GCN-LSTM was included. This model only uses the raw pharmaceutical demand time series as input. The graph only has one node that represents the target drug, and it doesn’t use any relational data from the knowledge graph like KG-GCN-LSTM does. This architecture lets us separate the effect of architectural design on performance from the effect of knowledge graph data.
As show in Table 3, the GCN-LSTM model has a SMAPE that is 1.36% lower than the LSTM model, and the KG-GCN-LSTM model has a SMAPE that is 2.97% lower than the LSTM model. These results show that adding graph-structured data from the knowledge graph accounts for about 1.61% of the performance gain, while the KG-GCN-LSTM model’s own architectural design accounts for the other 16% of the improvement.
In general, these results show that the better performance of KG-GCN-LSTM is due to the combined effects of data enrichment and structural innovation. The addition of the pharmaceutical knowledge graph helps the model grasp how medications and symptoms are related in terms of meaning, and the graph-based architecture makes it better at modeling complicated temporal-relational dynamics. These improvements all help make pharmaceutical demand forecasting more accurate, which is in line with the goal of developing strong healthcare supply chains.
5. Conclusions
This study addresses the critical challenge of improving the accuracy of pharmaceutical demand forecasting, a factor that directly affects inventory costs and the sustainability of medical supply chains. Traditional statistical and machine learning methods often fail to simultaneously capture the complex temporal dynamics of drug demand and the intrinsic interdependencies among pharmaceutical products. As a result, forecasting errors may lead to inefficient inventory management, resource waste, or even drug shortages.
To overcome these limitations, we propose the KG-GCN-LSTM forecasting framework, which integrates relational modeling and temporal learning to achieve more accurate demand predictions. The framework incorporates a pharmaceutical knowledge graph, where a GCN is employed to capture substitution relationships and co-prescription patterns among drugs. These relational features are then combined with the LSTM network to analyze temporal demand trends embedded in historical sales data.
Extensive experiments demonstrate that KG-GCN-LSTM significantly outperforms baseline models—including AutoARIMA, SVR, XGBoost, RNN, CNN-LSTM and NBEATS—across multiple evaluation metrics (MAE, RMSE, and SMAPE). Compared with the NBEATS model, the proposed framework reduces SMAPE by 3.62%, confirming its superior predictive accuracy. Furthermore, ablation experiments reveal the distinct contributions of both GCN and LSTM components. Notably, approximately half of the overall performance improvement stems from the relational data provided by the knowledge graph, highlighting the value of data augmentation in enhancing prediction precision.
This research demonstrates that integrating structured pharmaceutical knowledge into deep learning models not only improves predictive accuracy but also contributes to building a resilient and sustainable pharmaceutical supply chain.
In summary, the KG-GCN-LSTM framework not only surpasses traditional and deep learning baselines but also offers a new perspective on the application of knowledge graphs in pharmaceutical demand forecasting. These findings underscore the potential of combining domain knowledge with advanced neural architectures to address the complexity of medical supply chain prediction problems.
Despite the strong performance of KG-GCN-LSTM, several directions remain for future exploration.
- Multi-feature data integration: Incorporating demographic data, pharmacy location, and holiday information may capture additional factors influencing demand and further improve prediction accuracy.
- Model interpretability: While the proposed model enhances prediction precision through the integration of knowledge graphs and deep learning, it still lacks interpretability in explaining inter-drug relationships and the mechanisms underlying demand fluctuations.
Note: ARIMA: Auto Regressive Integrated Moving Average; SVR: Support Vector Regression; XGBoost: eXtreme Gradient Boosting; RNN: Recurrent Neural Network; CNN: Convolutional Neural Network; N-BEATS: Neural Basis Expansion Analysis for interpretable Time Series forecasting.
References
- Bilal, A. I.; Bititci, U. S.; Fenta, T. G. , Challenges and the Way Forward in Demand-Forecasting Practices within the Ethiopian Public Pharmaceutical Supply Chain. Pharmacy 2024, 12, 86. [Google Scholar] [CrossRef]
- Bilal, A. I.; Rostami-Tabar, B.; Hewage, H. H.; Bititci, U. S.; Fenta, T. G. , The missing puzzle piece: contextual insights for enhanced pharmaceutical supply chain forecasting. International Journal of Production Research 2025, 1–19. [Google Scholar] [CrossRef]
- Gers, F. A.; Schmidhuber, J.; Cummins, F. , Learning to forget: Continual prediction with LSTM. Neural computation 2000, 12, 2451–2471. [Google Scholar] [CrossRef]
- Zhao, L.; Song, Y.; Zhang, C.; Liu, Y.; Wang, P.; Lin, T.; Deng, M.; Li, H. , T-GCN: A temporal graph convolutional network for traffic prediction. IEEE transactions on intelligent transportation systems 2019, 21, 3848–3858. [Google Scholar] [CrossRef]
- Shi, Y.; Wang, Y.; Qu, Y.; Chen, Z. , Integrated GCN-LSTM stock prices movement prediction based on knowledge-incorporated graphs construction. International Journal of Machine Learning and Cybernetics 2024, 15, 161–176. [Google Scholar] [CrossRef]
- Yang, C.; Li, S.; Gou, Z. , Spatiotemporal prediction of urban building rooftop photovoltaic potential based on GCN-LSTM. Energy and Buildings 2025, 334, 115522. [Google Scholar] [CrossRef]
- Wei, M.; Wen, M.; Zhang, Y. , A novel spatial electric load forecasting method based on LDTW and GCN. IET Generation, Transmission & Distribution 2024, 18, 491–505. [Google Scholar]
- Wang, X.; Wang, X.; Yin, X.; Li, K.; Wang, L.; Wang, R.; Song, R. , Distributed LSTM-GCN-based spatial–temporal indoor temperature prediction in multizone buildings. IEEE Transactions on Industrial Informatics 2023, 20, 482–491. [Google Scholar] [CrossRef]
- Gilbert, K. , An ARIMA supply chain model. Management Science 2005, 51, 305–310. [Google Scholar] [CrossRef]
- Kareem, Y.; Majeed, A. R. In Monthly Peak-load Demand Forecasting for Sulaimany Governorate Using SARIMA, 2006 IEEE/PES Transmission & Distribution Conference and Exposition: Latin America, 2006; IEEE: 2006; pp 1-5.
- Jian, Y.; Zhu, D.; Zhou, D.; Li, N.; Du, H.; Dong, X.; Fu, X.; Tao, D.; Han, B. , ARIMA model for predicting chronic kidney disease and estimating its economic burden in China. BMC Public Health 2022, 22, 2456. [Google Scholar] [CrossRef] [PubMed]
- Vairagade, N.; Logofatu, D.; Leon, F.; Muharemi, F. In Demand forecasting using random forest and artificial neural network for supply chain management, Computational Collective Intelligence: 11th International Conference, ICCCI 2019, Hendaye, France, September 4–6, 2019, Proceedings, Part I 11, 2019; Springer: 2019; pp 328-339.
- Ji, S.; Wang, X.; Zhao, W.; Guo, D. , An application of a three-stage XGBoost-based model to sales forecasting of a cross-border e-commerce enterprise. Mathematical Problems in Engineering 2019, 2019. [Google Scholar] [CrossRef]
- Yani, L. P. E.; Aamer, A. , Demand forecasting accuracy in the pharmaceutical supply chain: a machine learning approach. International journal of pharmaceutical and healthcare marketing 2023, 17, 1–23. [Google Scholar] [CrossRef]
- Douaioui, K.; Oucheikh, R.; Benmoussa, O.; Mabrouki, C. , Machine Learning and Deep Learning Models for Demand Forecasting in Supply Chain Management: A Critical Review. Applied System Innovation (ASI), 2024; 7. [Google Scholar]
- Yildiz, O.; Sucuoglu, H. S. , Development of Real-Time IoT-Based Air Quality Forecasting System Using Machine Learning Approach. Sustainability 2025, 17, 8531. [Google Scholar] [CrossRef]
- Şen, S. G. , Machine Learning-Based Water Level Forecast in a Dam Reservoir: A Case Study of Karaçomak Dam in the Kızılırmak Basin, Türkiye. Sustainability 2025, 17, 1–23. [Google Scholar]
- Punia, S.; Nikolopoulos, K.; Singh, S. P.; Madaan, J. K.; Litsiou, K. , Deep learning with long short-term memory networks and random forests for demand forecasting in multi-channel retail. International journal of production research 2020, 58, 4964–4979. [Google Scholar] [CrossRef]
- Hou, Z.; Du, Z.; Yang, G.; Yang, Z. , Short-term passenger flow prediction of urban rail transit based on a combined deep learning model. Applied Sciences 2022, 12, 7597. [Google Scholar] [CrossRef]
- Jeon, Y.; Seong, S. , Robust recurrent network model for intermittent time-series forecasting. International Journal of Forecasting 2022, 38, 1415–1425. [Google Scholar] [CrossRef]
- Zha, W.; Liu, Y.; Wan, Y.; Luo, R.; Li, D.; Yang, S.; Xu, Y. , Forecasting monthly gas field production based on the CNN-LSTM model. Energy 2022, 260, 124889. [Google Scholar] [CrossRef]
- Liu, Y.; Du, M.; Ma, X.; Hu, S.; Tuo, Z. , Groundwater Level Prediction Using a Hybrid TCN–Transformer–LSTM Model and Multi-Source Data Fusion: A Case Study of the Kuitun River Basin, Xinjiang. Sustainability 2025, 17, 8544. [Google Scholar] [CrossRef]
- Ashtar, D.; Mohammadi Ziabari, S. S.; Alsahag, A. M. M. , Hybrid Forecasting for Sustainable Electricity Demand in The Netherlands Using SARIMAX, SARIMAX-LSTM, and Sequence-to-Sequence Deep Learning Models. Sustainability 2025, 17, 7192. [Google Scholar] [CrossRef]
- Fourkiotis, K. P.; Tsadiras, A. , Applying machine learning and statistical forecasting methods for enhancing pharmaceutical sales predictions. Forecasting 2024, 6, 170–186. [Google Scholar] [CrossRef]
- Zhu, X.; Ninh, A.; Zhao, H.; Liu, Z. , Demand forecasting with supply-chain information and machine learning: Evidence in the pharmaceutical industry. Production and Operations Management 2021, 30, 3231–3252. [Google Scholar] [CrossRef]
- Rathipriya, R.; Abdul Rahman, A. A.; Dhamodharavadhani, S.; Meero, A.; Yoganandan, G. , Demand forecasting model for time-series pharmaceutical data using shallow and deep neural network model. Neural Computing and Applications 2023, 35, 1945–1957. [Google Scholar] [CrossRef] [PubMed]
- Hapsari, I. , Cluster-specific Bi-LSTM models for improved pharmaceutical sales forecasting. Journal Industrial Servicess (JISS) 2024, 10, 259–270. [Google Scholar] [CrossRef]
- Mbonyinshuti, F.; Nkurunziza, J.; Niyobuhungiro, J.; Kayitare, E. , Health supply chain forecasting: a comparison of ARIMA and LSTM time series models for demand prediction of medicines. Acta Logistica 2024, 11, 269–280. [Google Scholar] [CrossRef]
- Priyadharshini, P.; Keerthana, S.; Devi, G. K. In Optimizing Pharmaceutical Supply Chains using a Hybrid CNN-LSTM Model for Accurate Medicine Demand Forecasting, 2025 3rd International Conference on Self Sustainable Artificial Intelligence Systems (ICSSAS), 2025; IEEE: 2025; pp 1525-1532.
- Amiri, B.; Haddadi, A.; Mojdehi, K. F. , A novel hybrid GCN-LSTM algorithm for energy stock price prediction: leveraging temporal dynamics and inter-stock relationships. IEEE Access 2025. [Google Scholar] [CrossRef]
- Zhang, Y.; Xu, S.; Zhang, L.; Jiang, W.; Alam, S.; Xue, D. , Short-term multi-step-ahead sector-based traffic flow prediction based on the attention-enhanced graph convolutional LSTM network (AGC-LSTM). Neural Computing and Applications 2024, 1–20. [Google Scholar] [CrossRef]
- Dara, O. N.; Ibrahim, A. A.; Mohammed, T. A. , Advancing medical imaging: detecting polypharmacy and adverse drug effects with Graph Convolutional Networks (GCN). BMC Medical Imaging 2024, 24, 174. [Google Scholar] [CrossRef] [PubMed]
- Gustriansyah, R. , Retail sales dataset of a pharmacy in Indonesia. In V1 ed.; Data, M., Ed. 2022.
- Knox, C.; Wilson, M.; Klinger, C. M.; Franklin, M.; Oler, E.; Wilson, A.; Pon, A.; Cox, J.; Chin, N. E.; Strawbridge, S. A. , DrugBank 6.0: the DrugBank knowledgebase for 2024. Nucleic acids research 2024, 52, (D1), D1265–D1275. [Google Scholar] [CrossRef]
- Hyndman, R. J.; Khandakar, Y. , Automatic time series forecasting: the forecast package for R. Journal of statistical software 2008, 27, 1–22. [Google Scholar] [CrossRef]
- Aghelpour, P.; Mohammadi, B.; Biazar, S. M. , Long-term monthly average temperature forecasting in some climate types of Iran, using the models SARIMA, SVR, and SVR-FA. Theoretical and Applied Climatology 2019, 138, 1471–1480. [Google Scholar] [CrossRef]
- Abbasi, R. A.; Javaid, N.; Ghuman, M. N. J.; Khan, Z. A.; Ur Rehman, S. ; Amanullah In Short term load forecasting using XGBoost, Workshops of the International Conference on Advanced Information Networking and Applications, 2019; Springer: 2019; pp 1120-1131.
- Tokgöz, A.; Ünal, G. In A RNN based time series approach for forecasting turkish electricity load, 2018 26th Signal processing and communications applications conference (SIU), 2018; IEEE: 2018; pp 1-4.
- Oreshkin, B. N.; Carpov, D.; Chapados, N.; Bengio, Y. , N-BEATS: Neural basis expansion analysis for interpretable time series forecasting. arXiv preprint arXiv:1905.10437, arXiv:1905.10437 2019.
Figure 1.
KG-GCN-LSTM model architecture diagram.
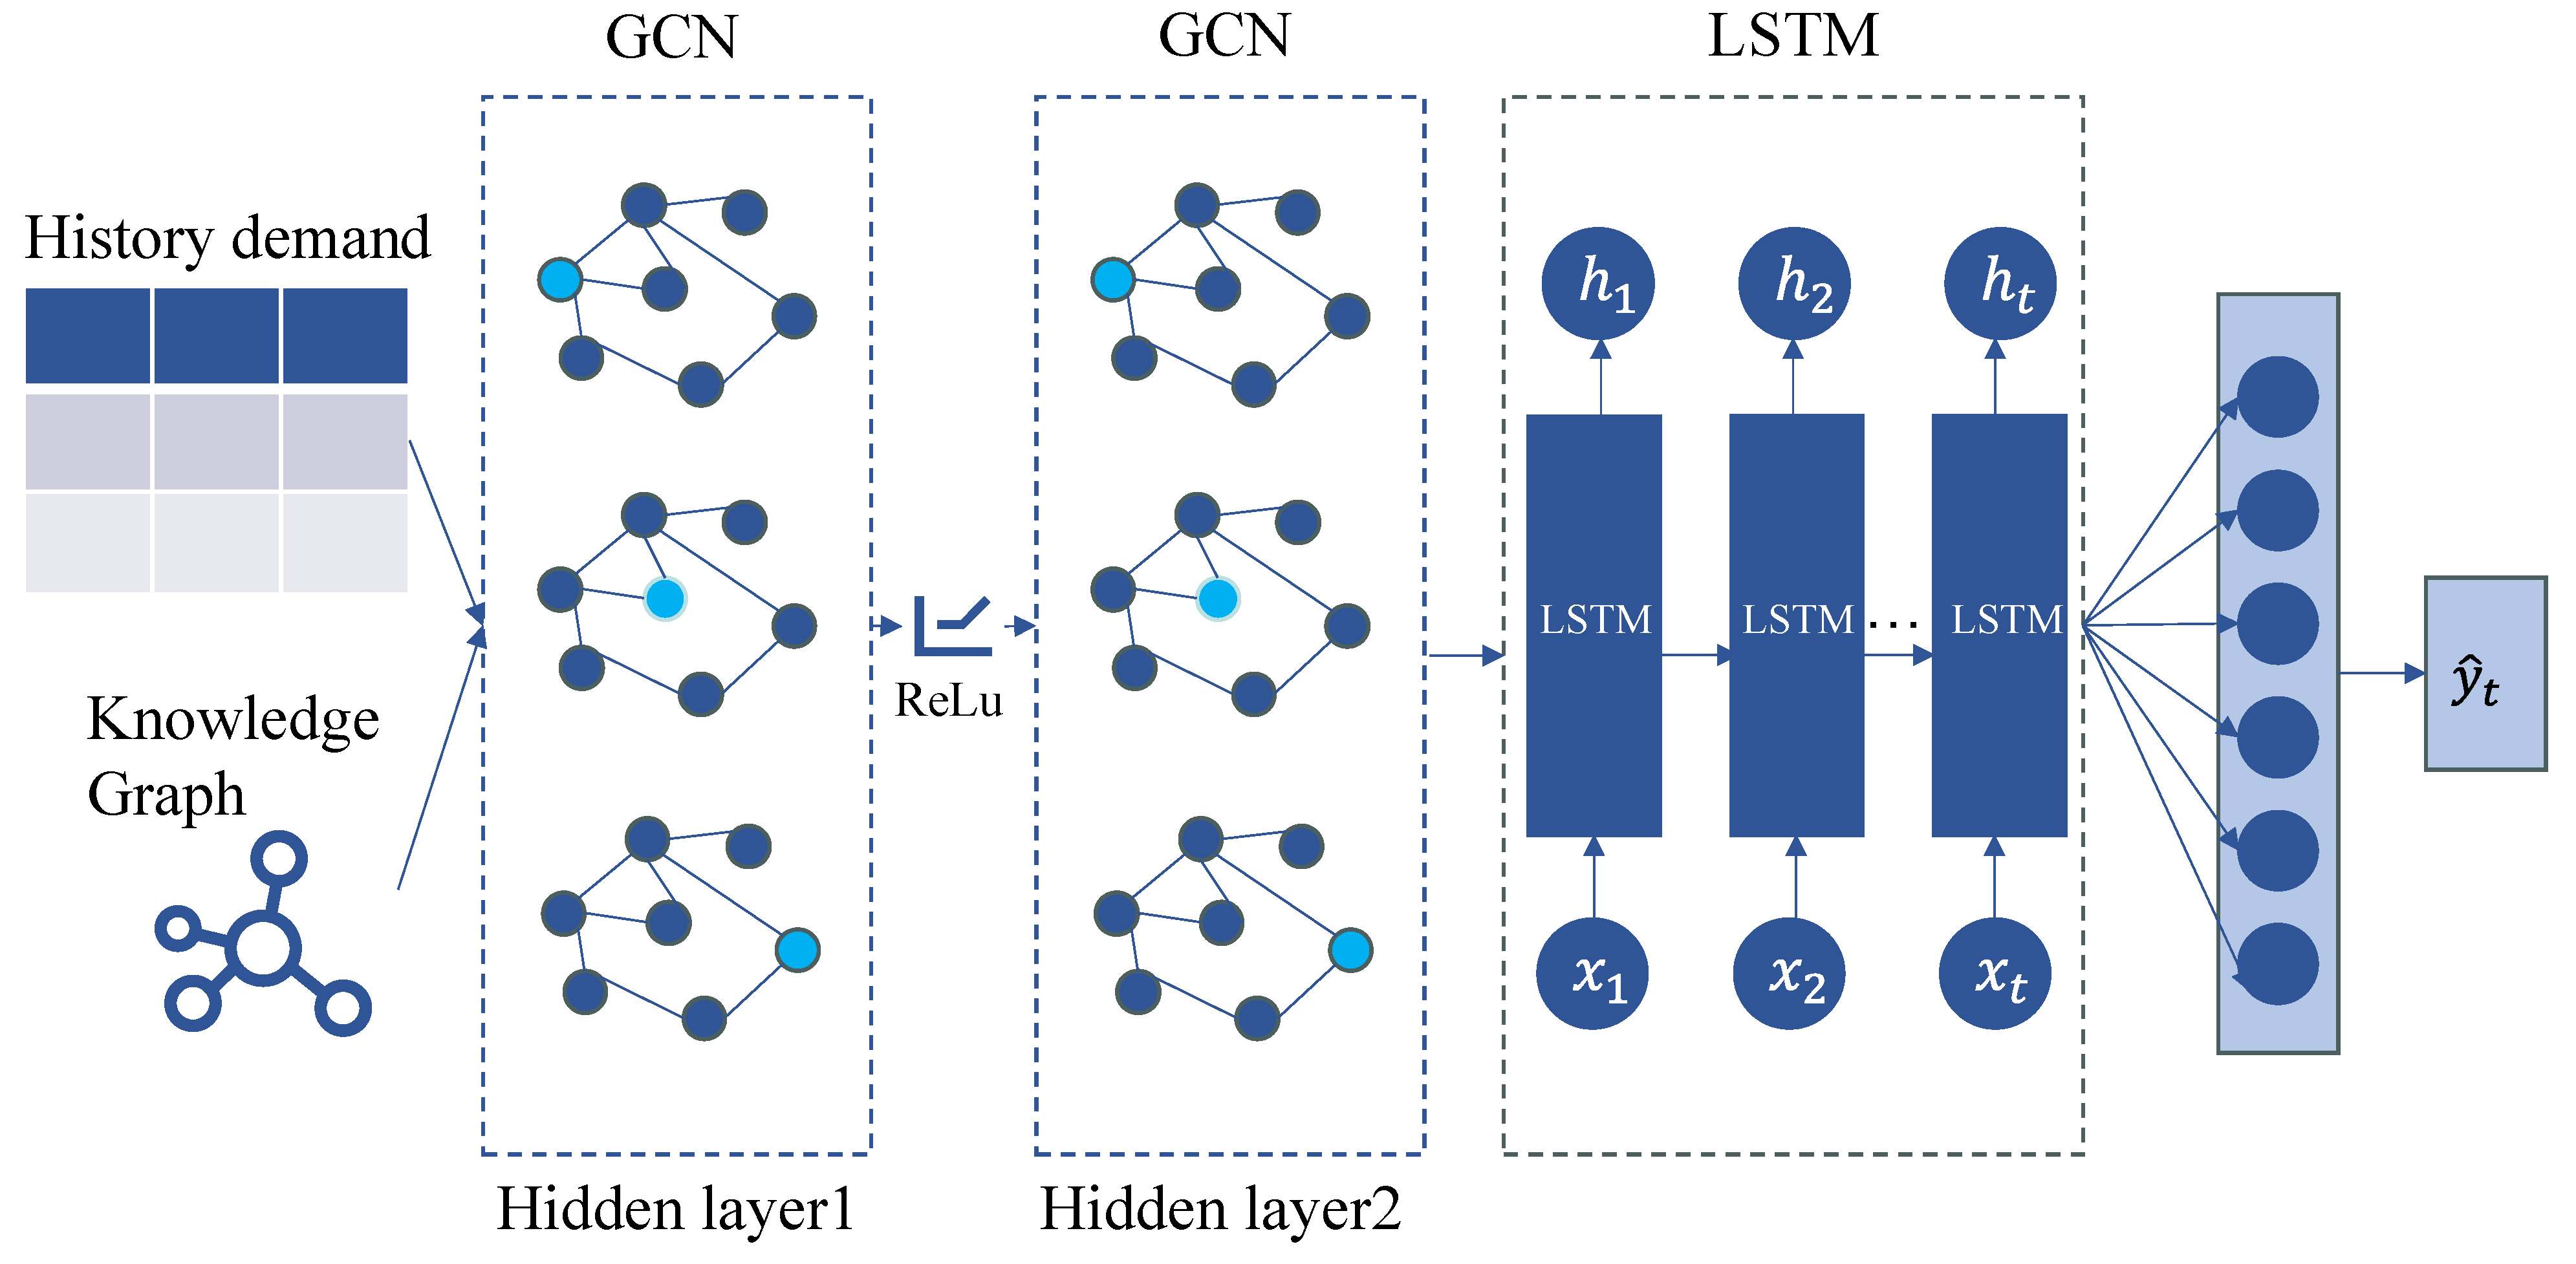
Figure 2.
Graph data construction.
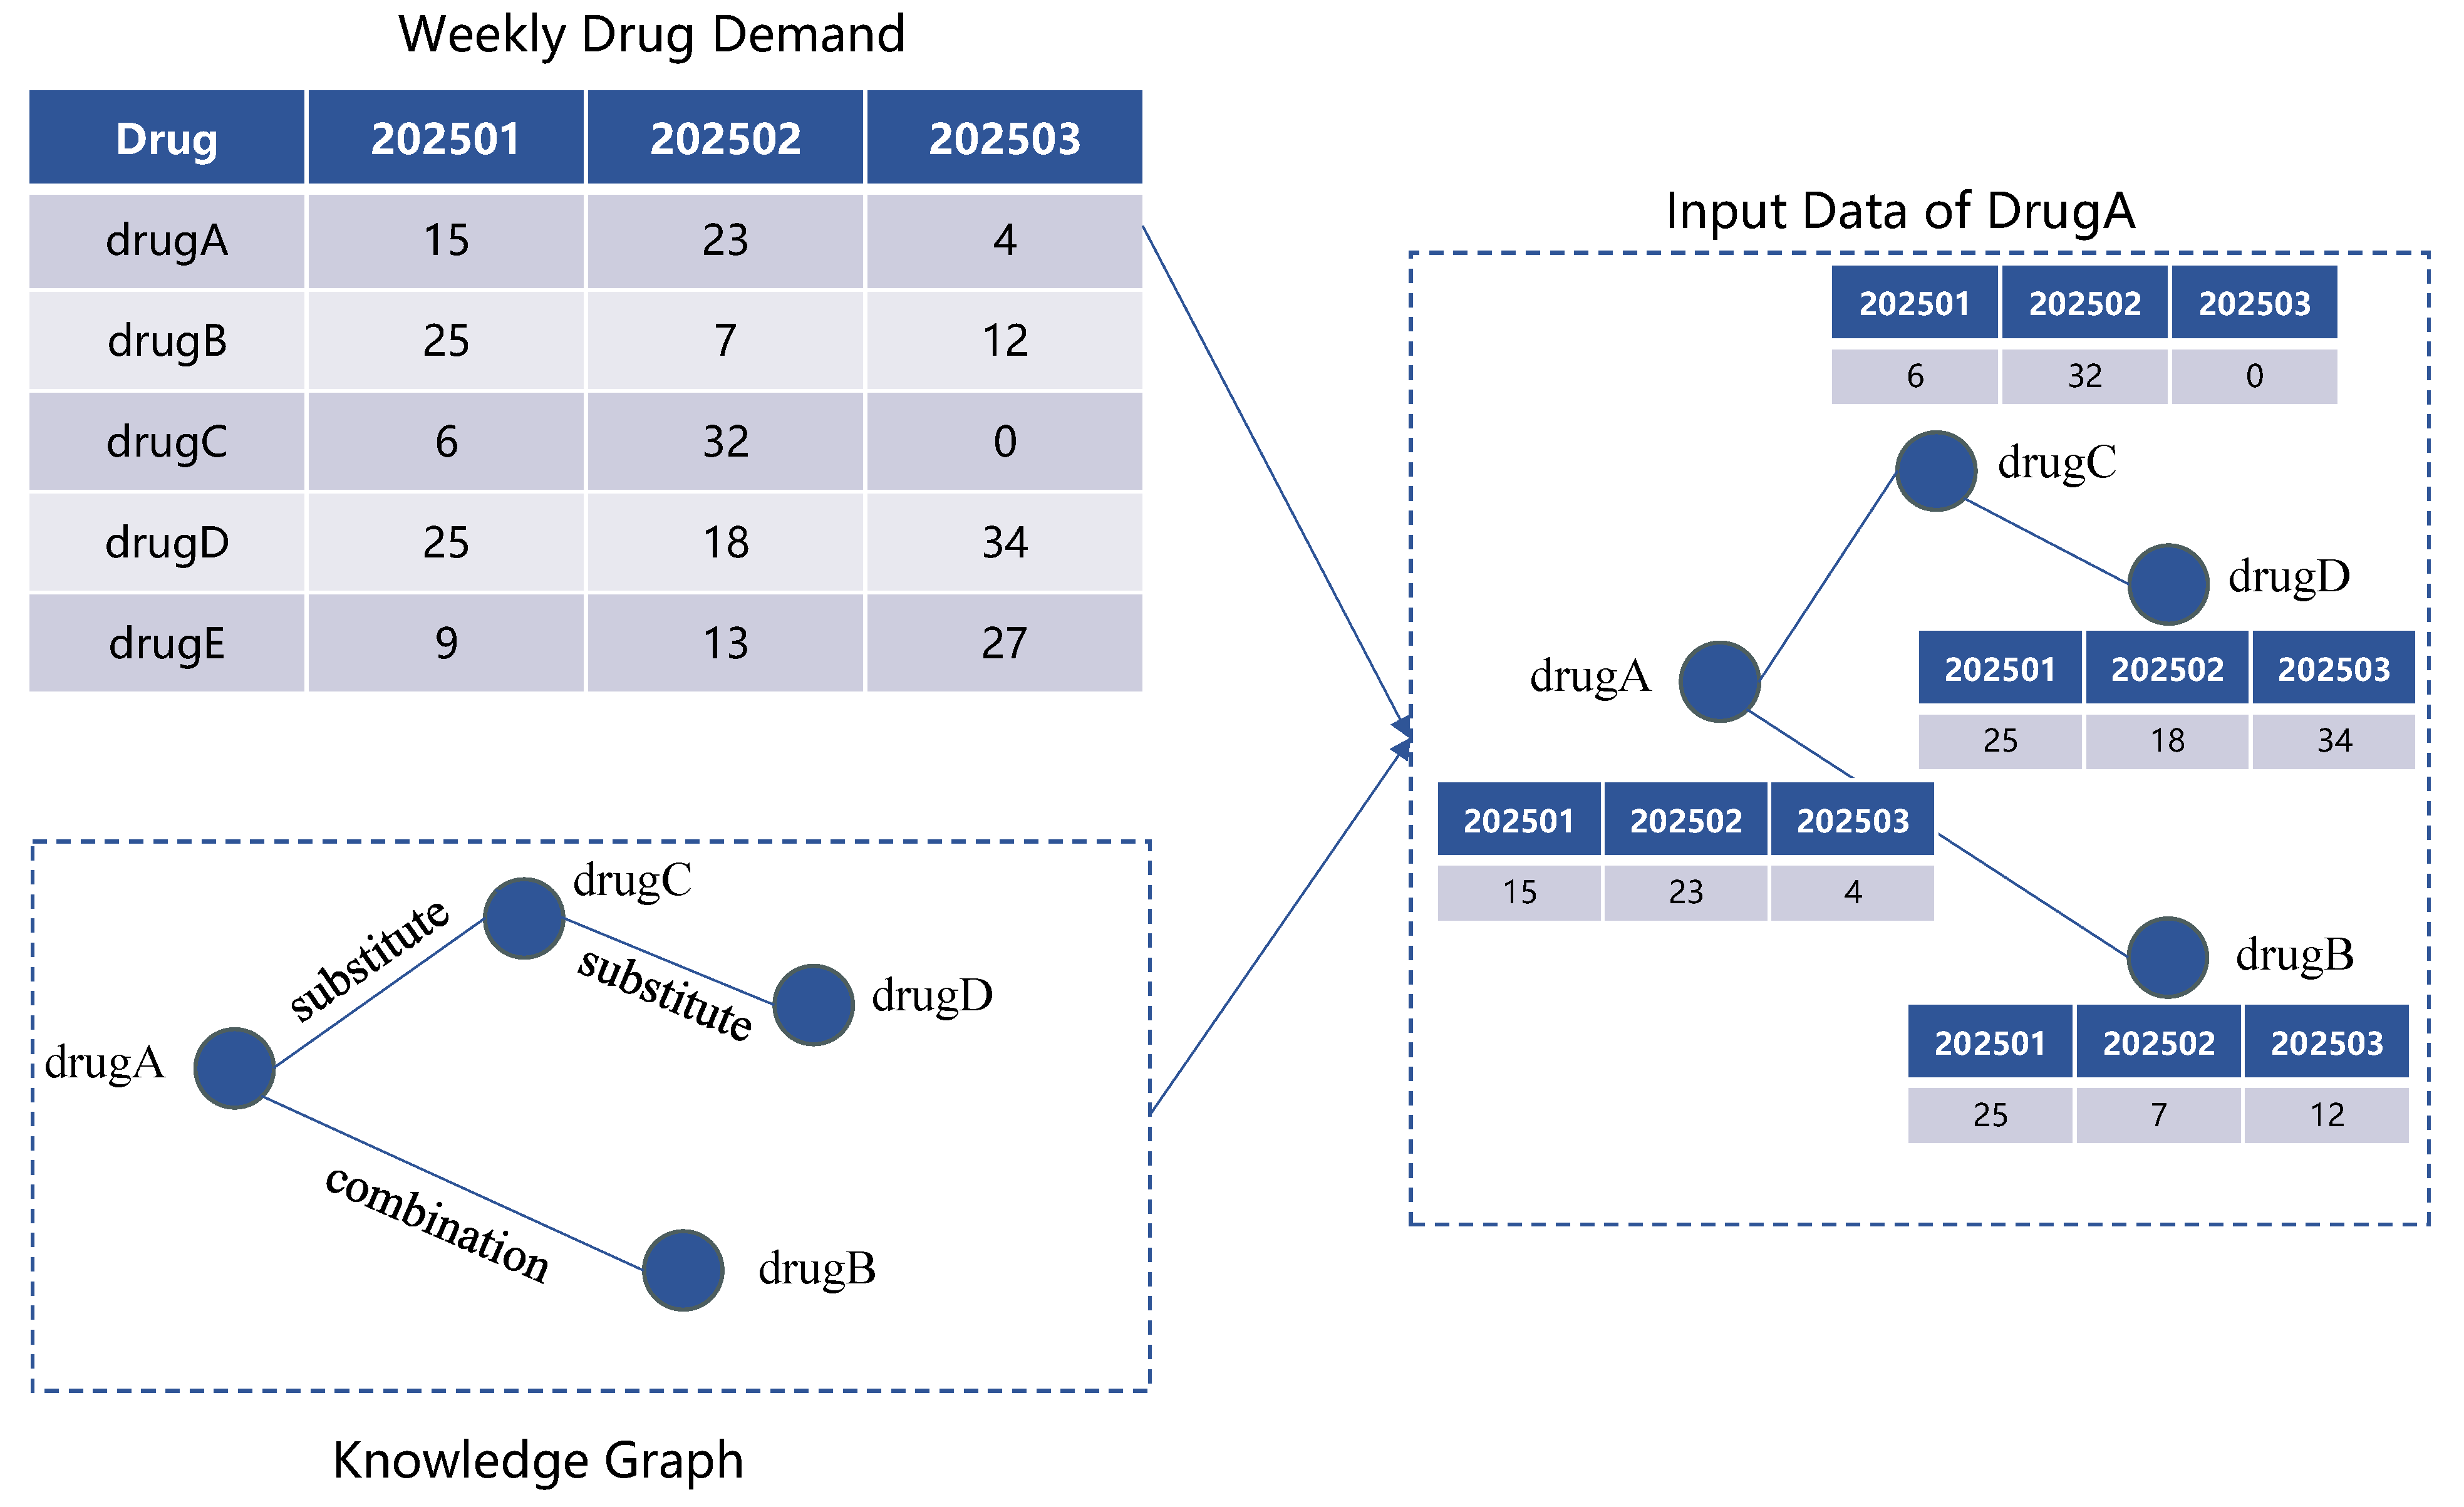
Figure 3.
A two-layer GCN architecture.
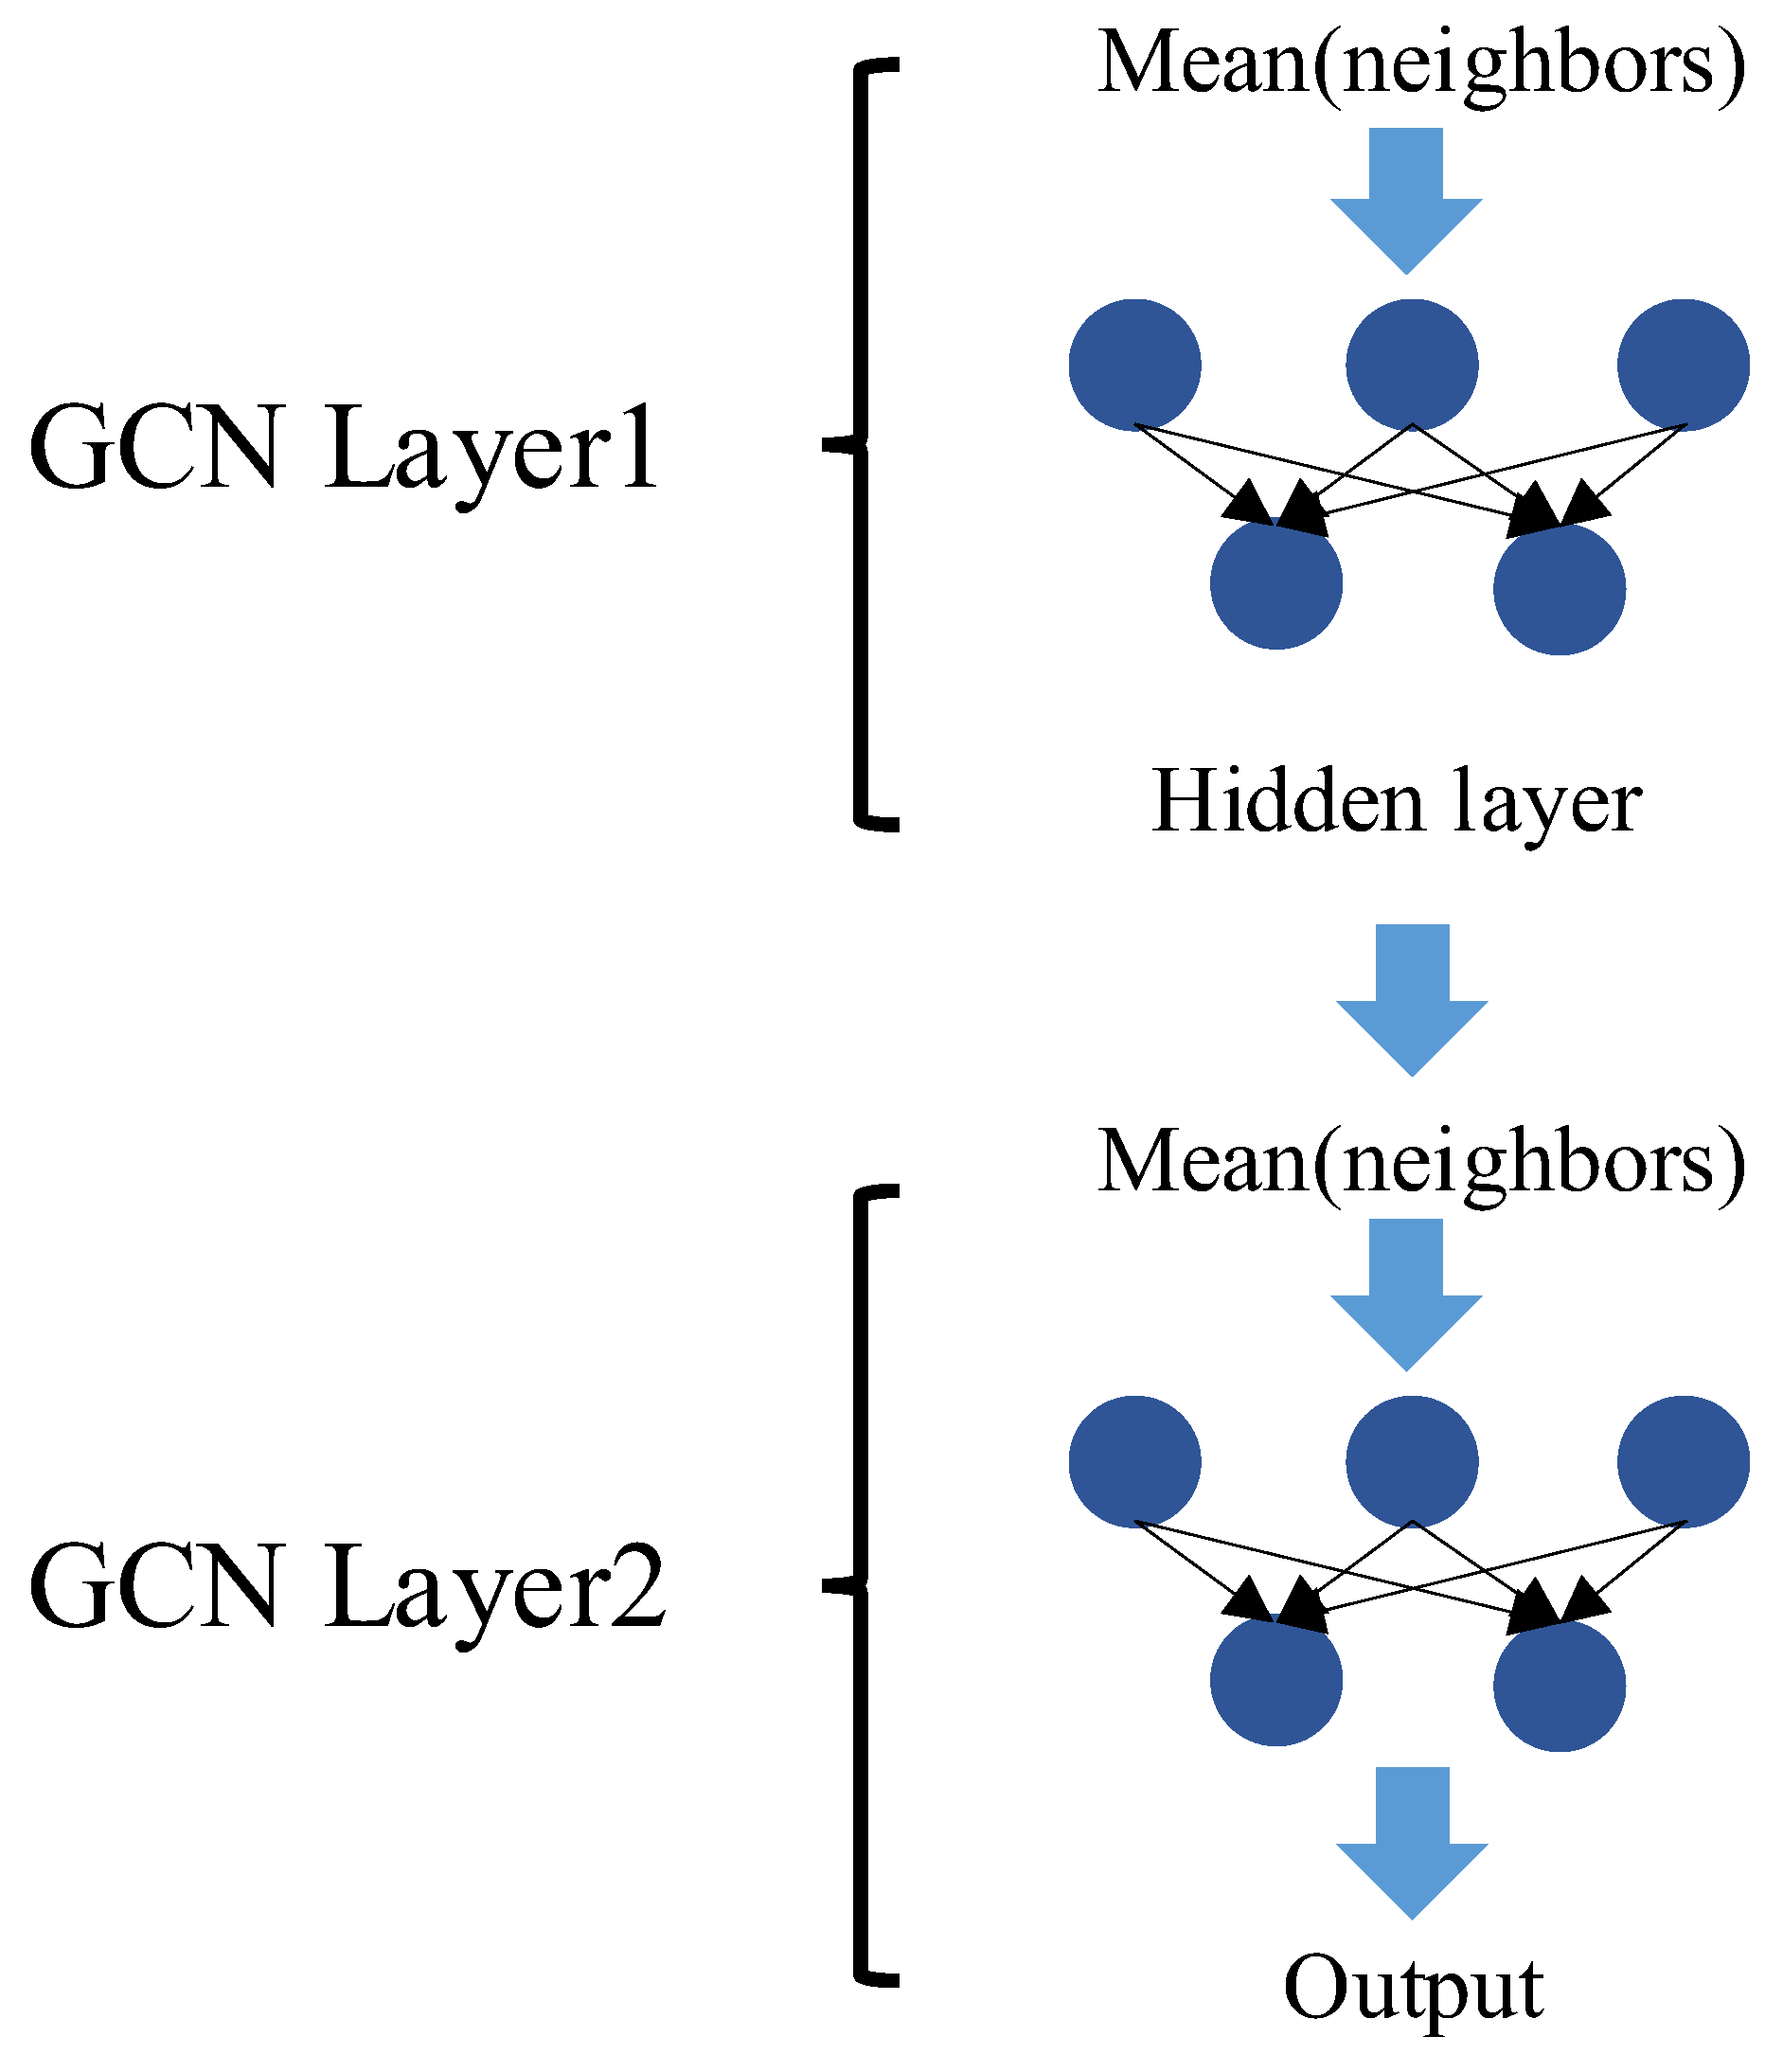
Figure 4.
LSTM framework.
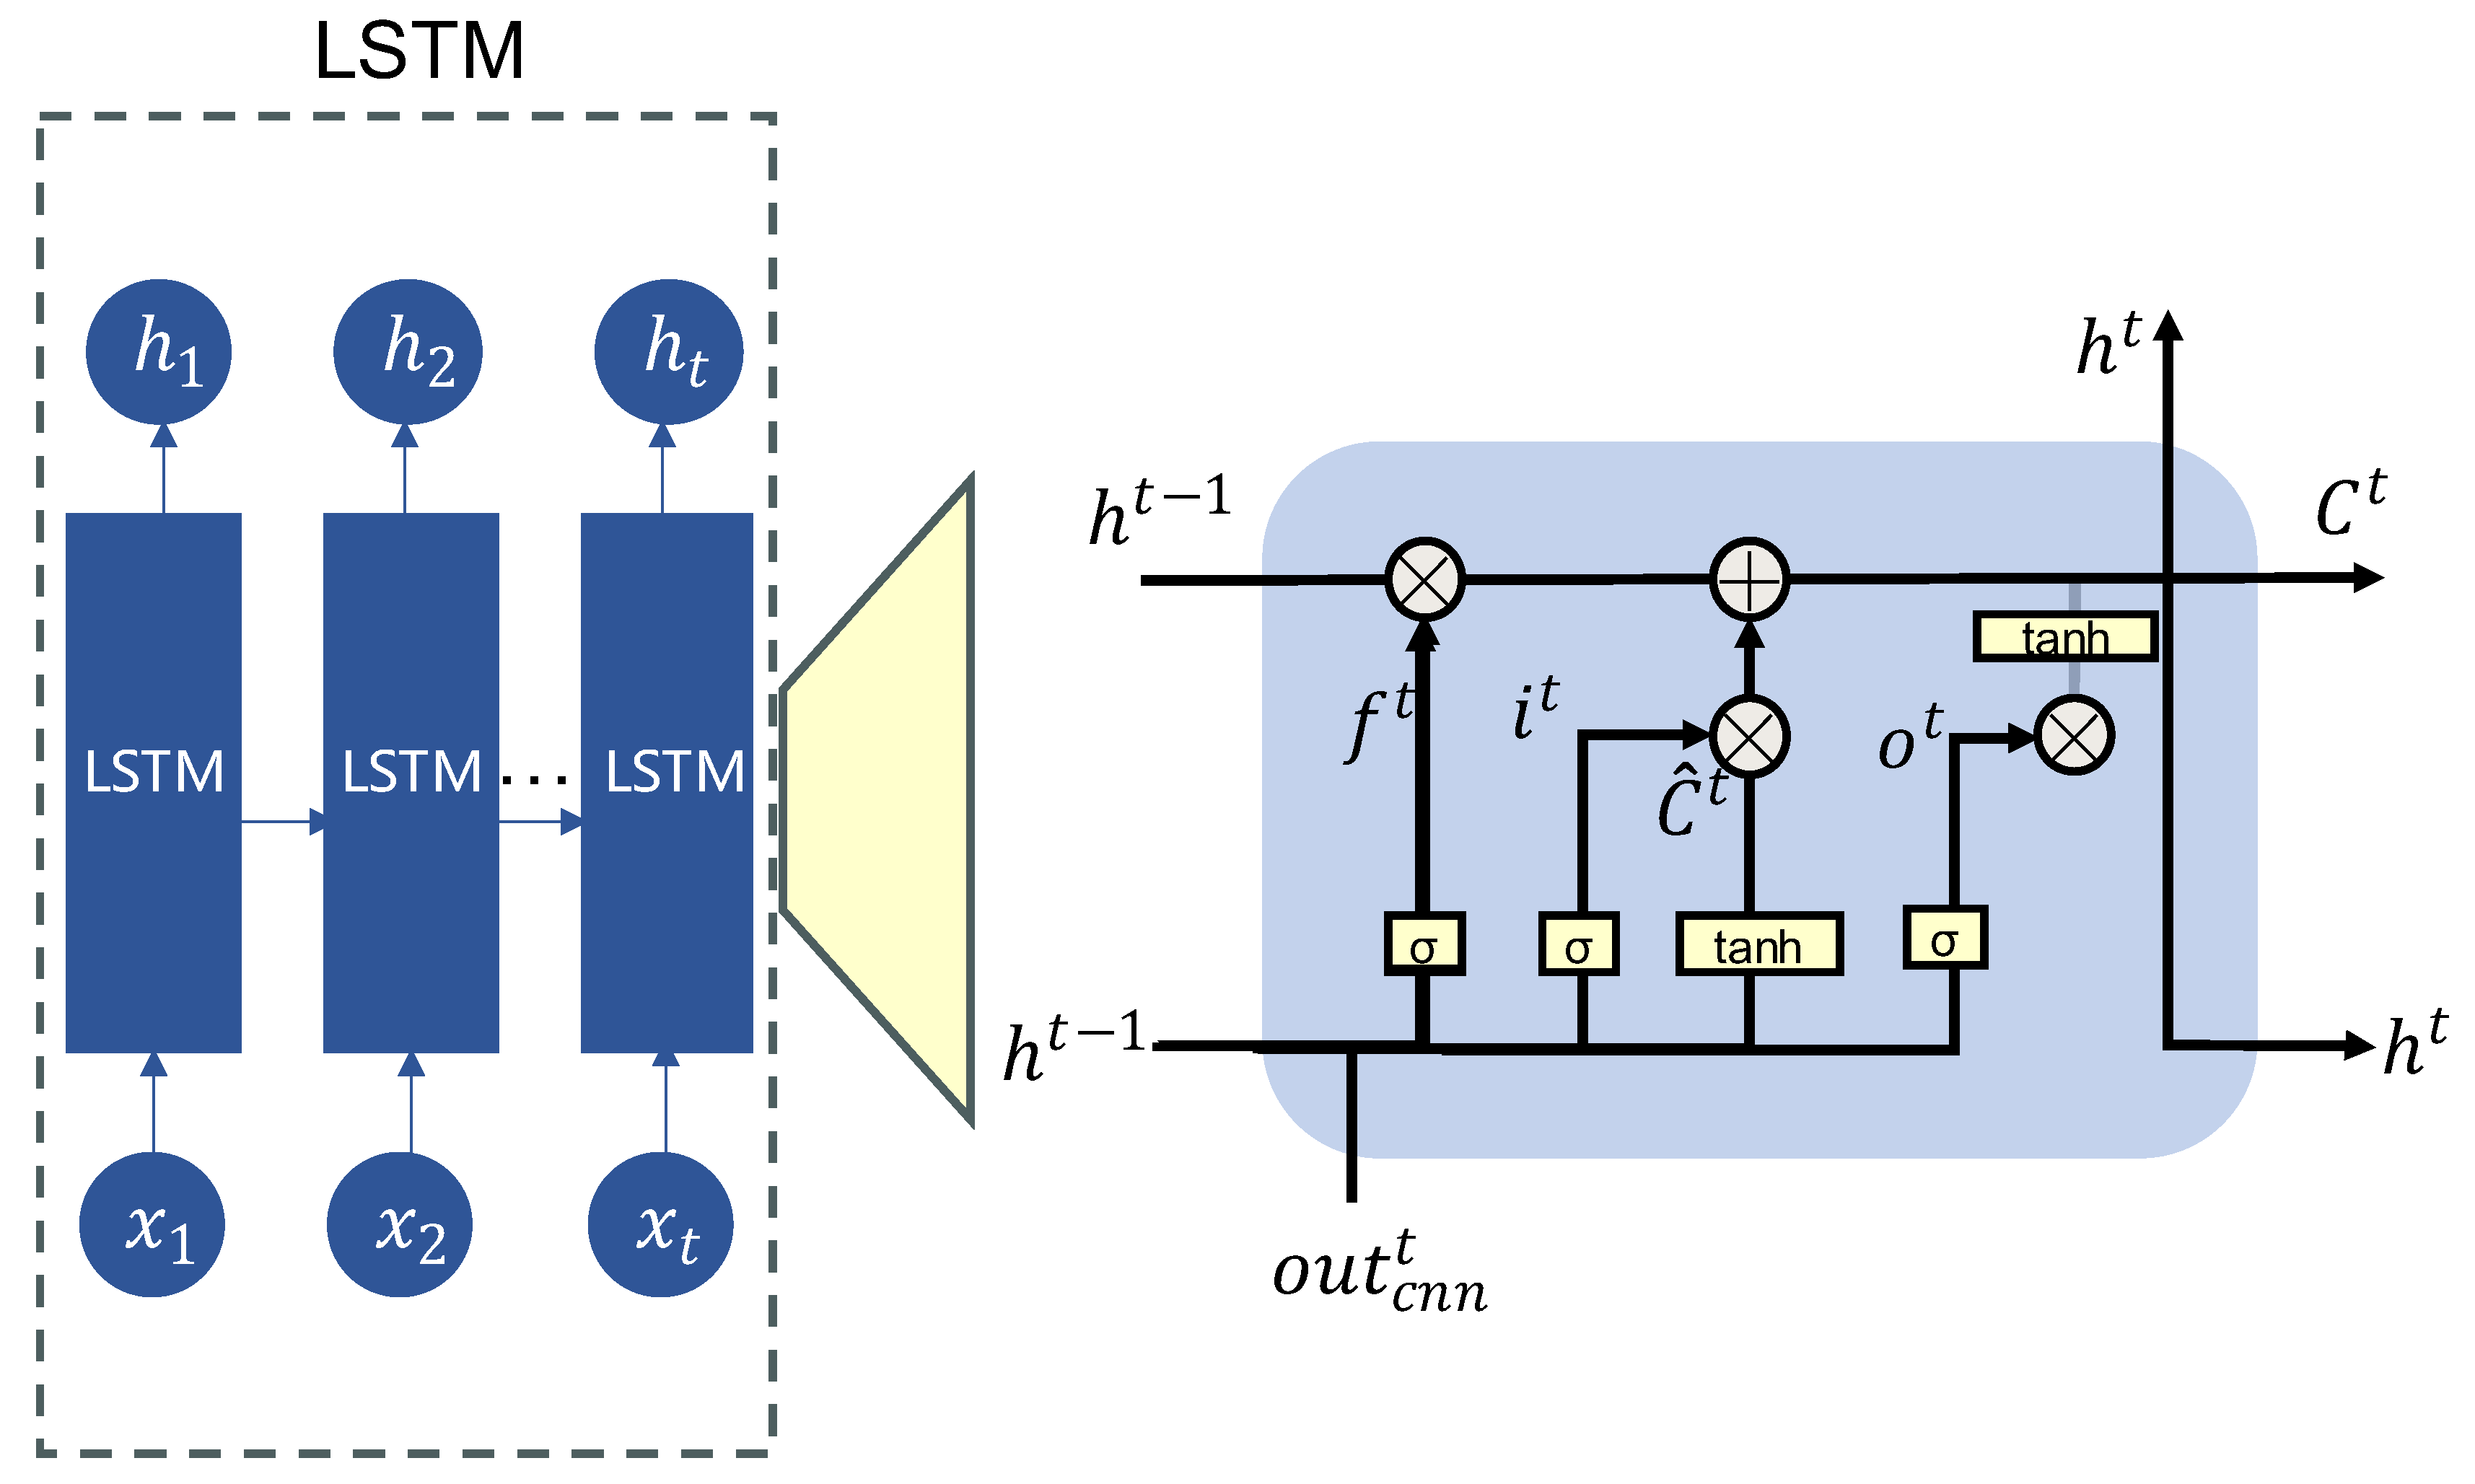
Figure 6.
Scatter plots of the predicted and observed during the seven model prediction phases.
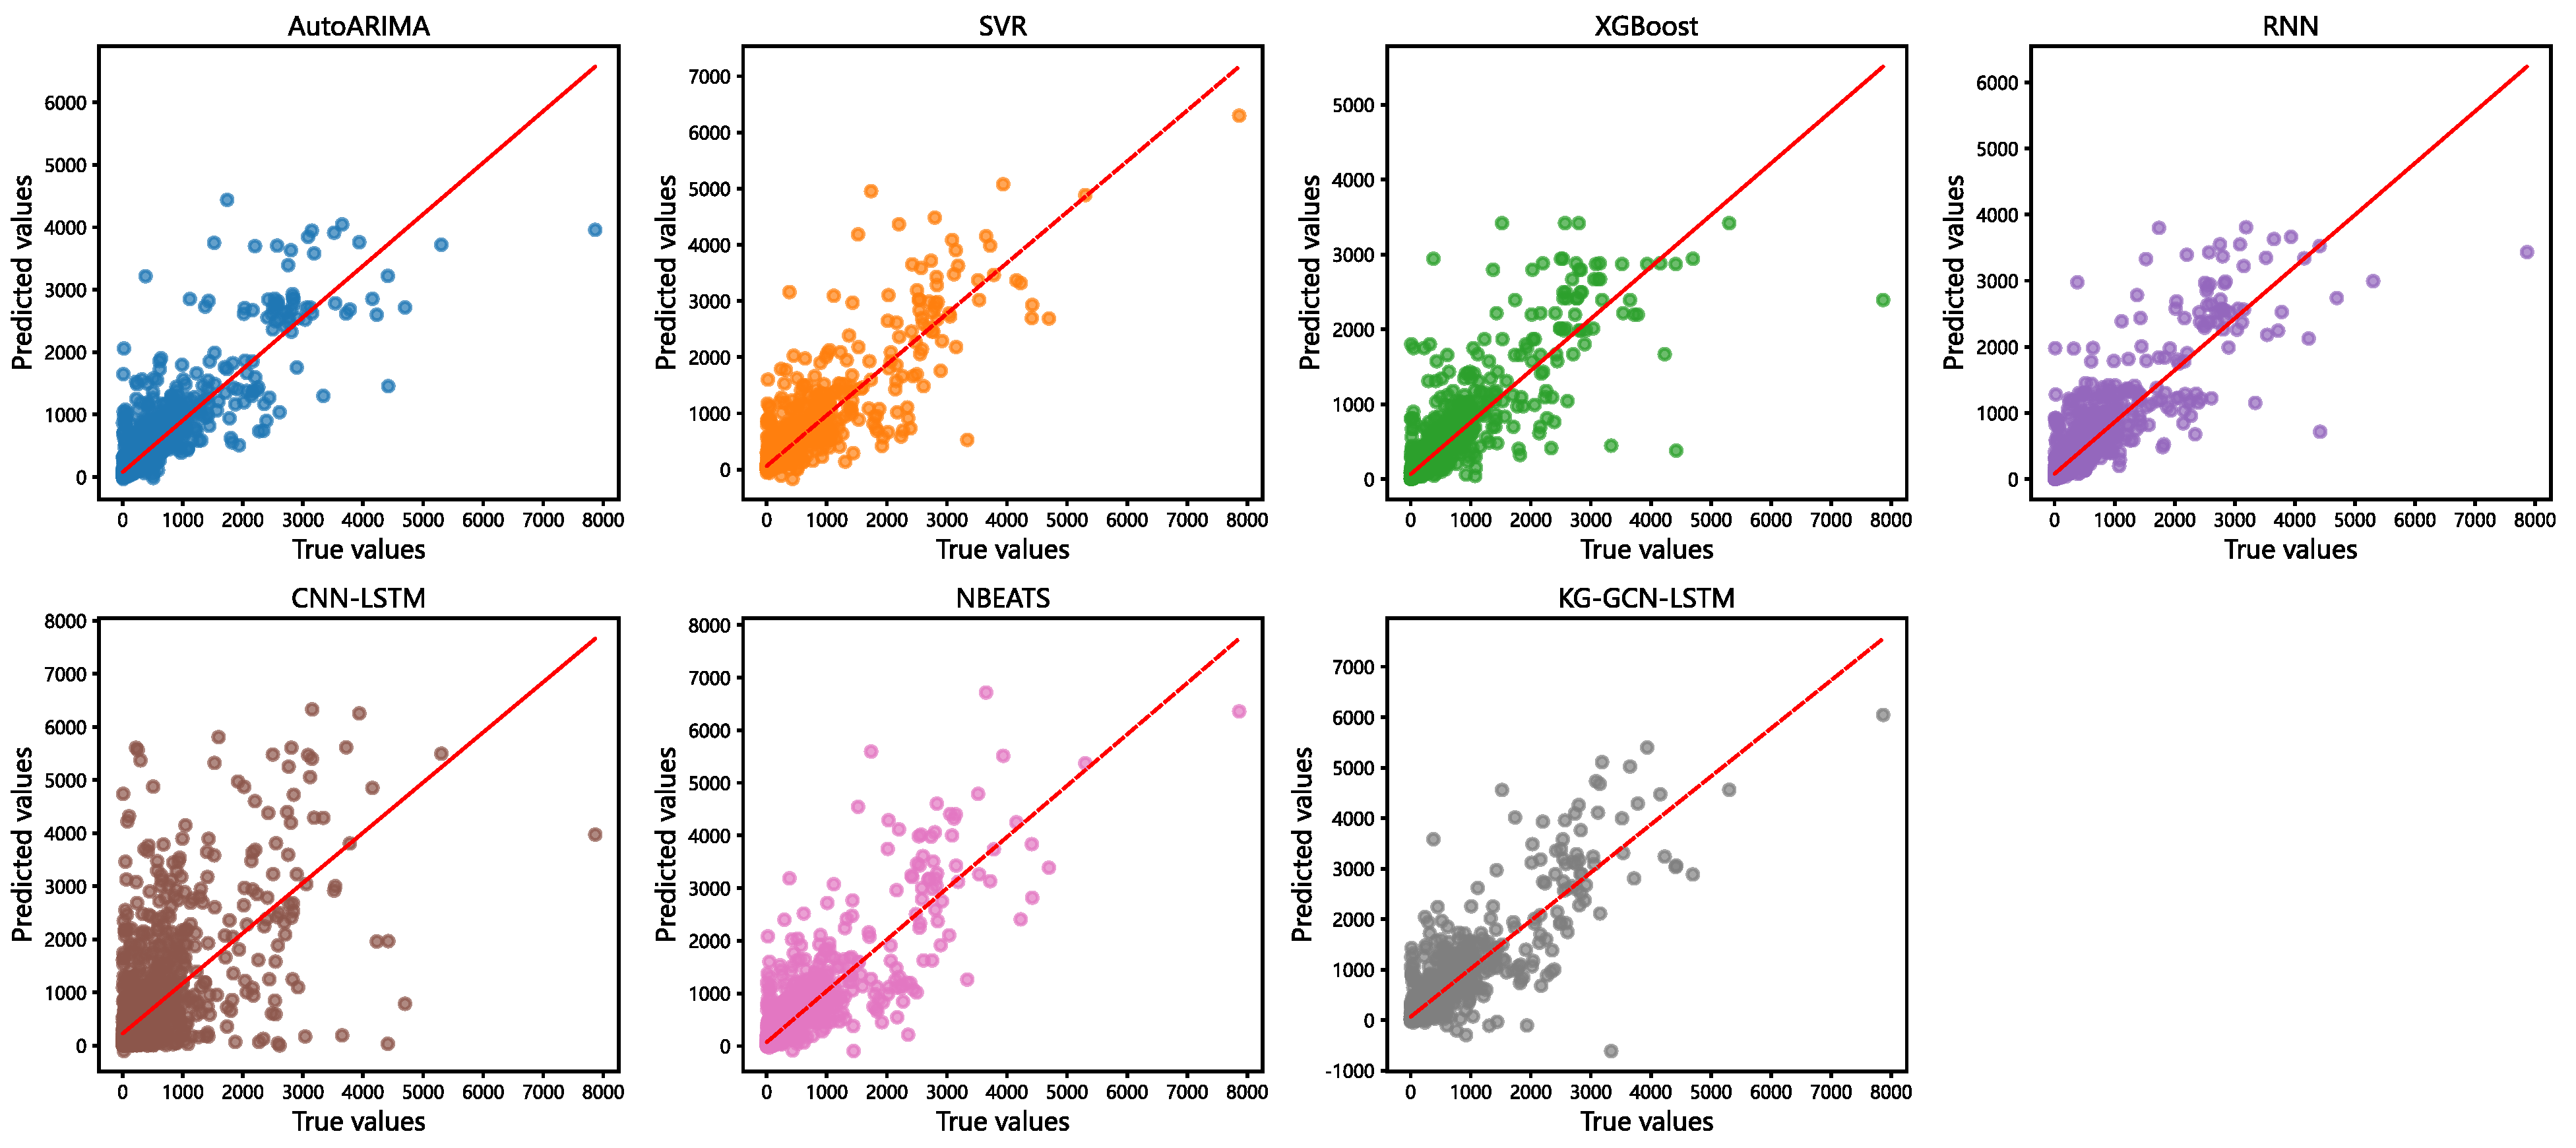
Figure 7.
Comparison of true and predicted demand of all modes.
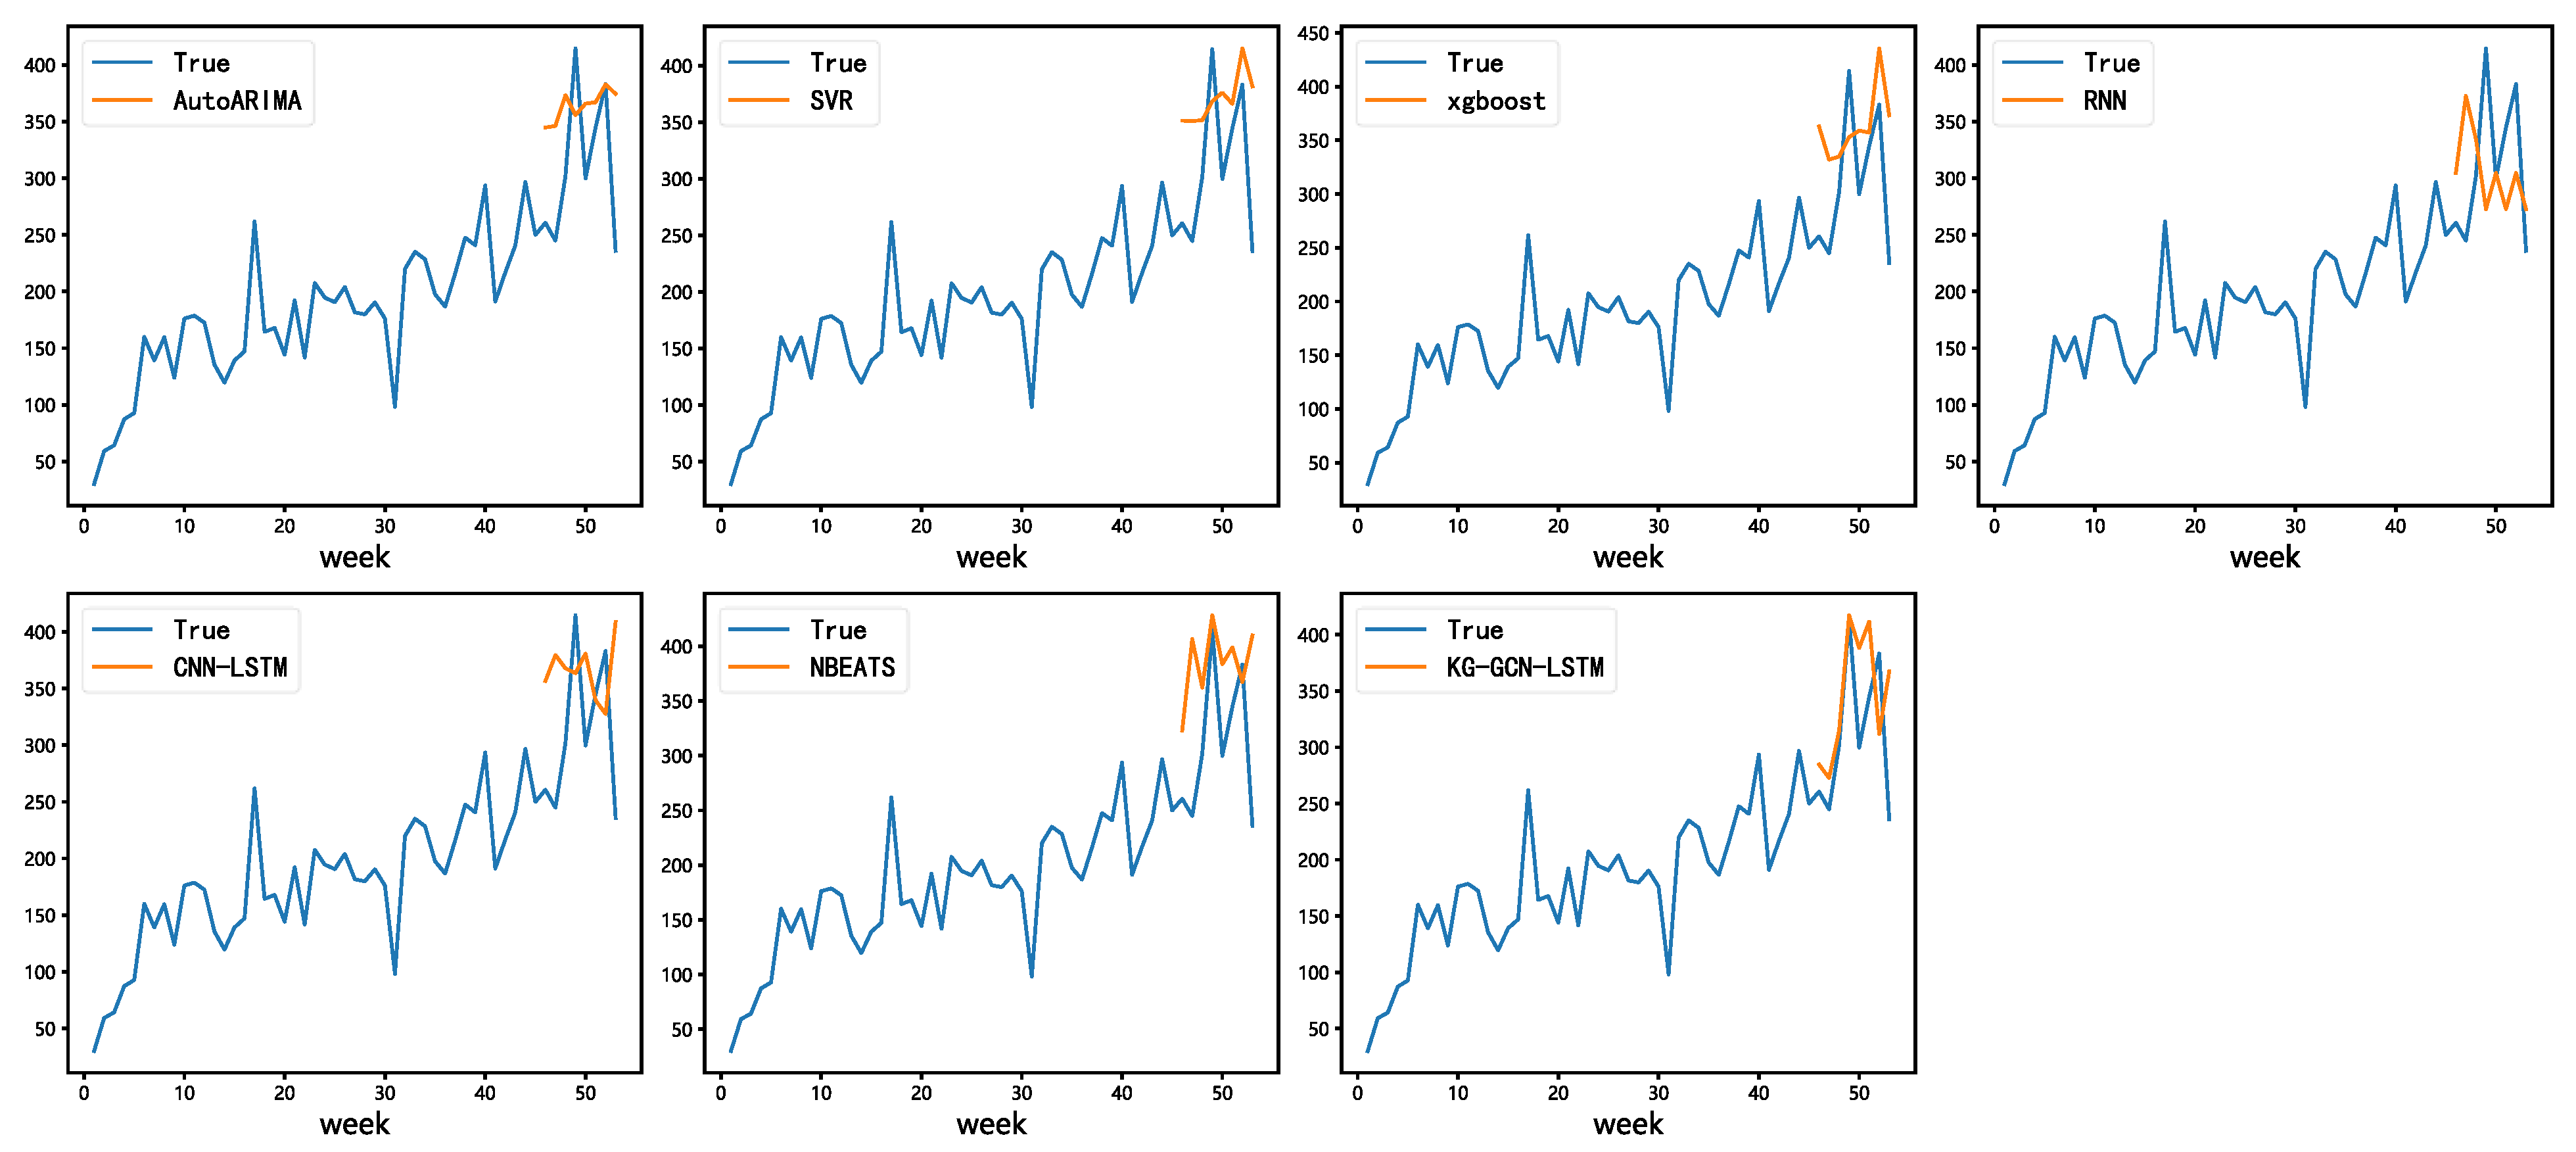
Figure 8.
Comparison of true and predicted demand with ablation model.
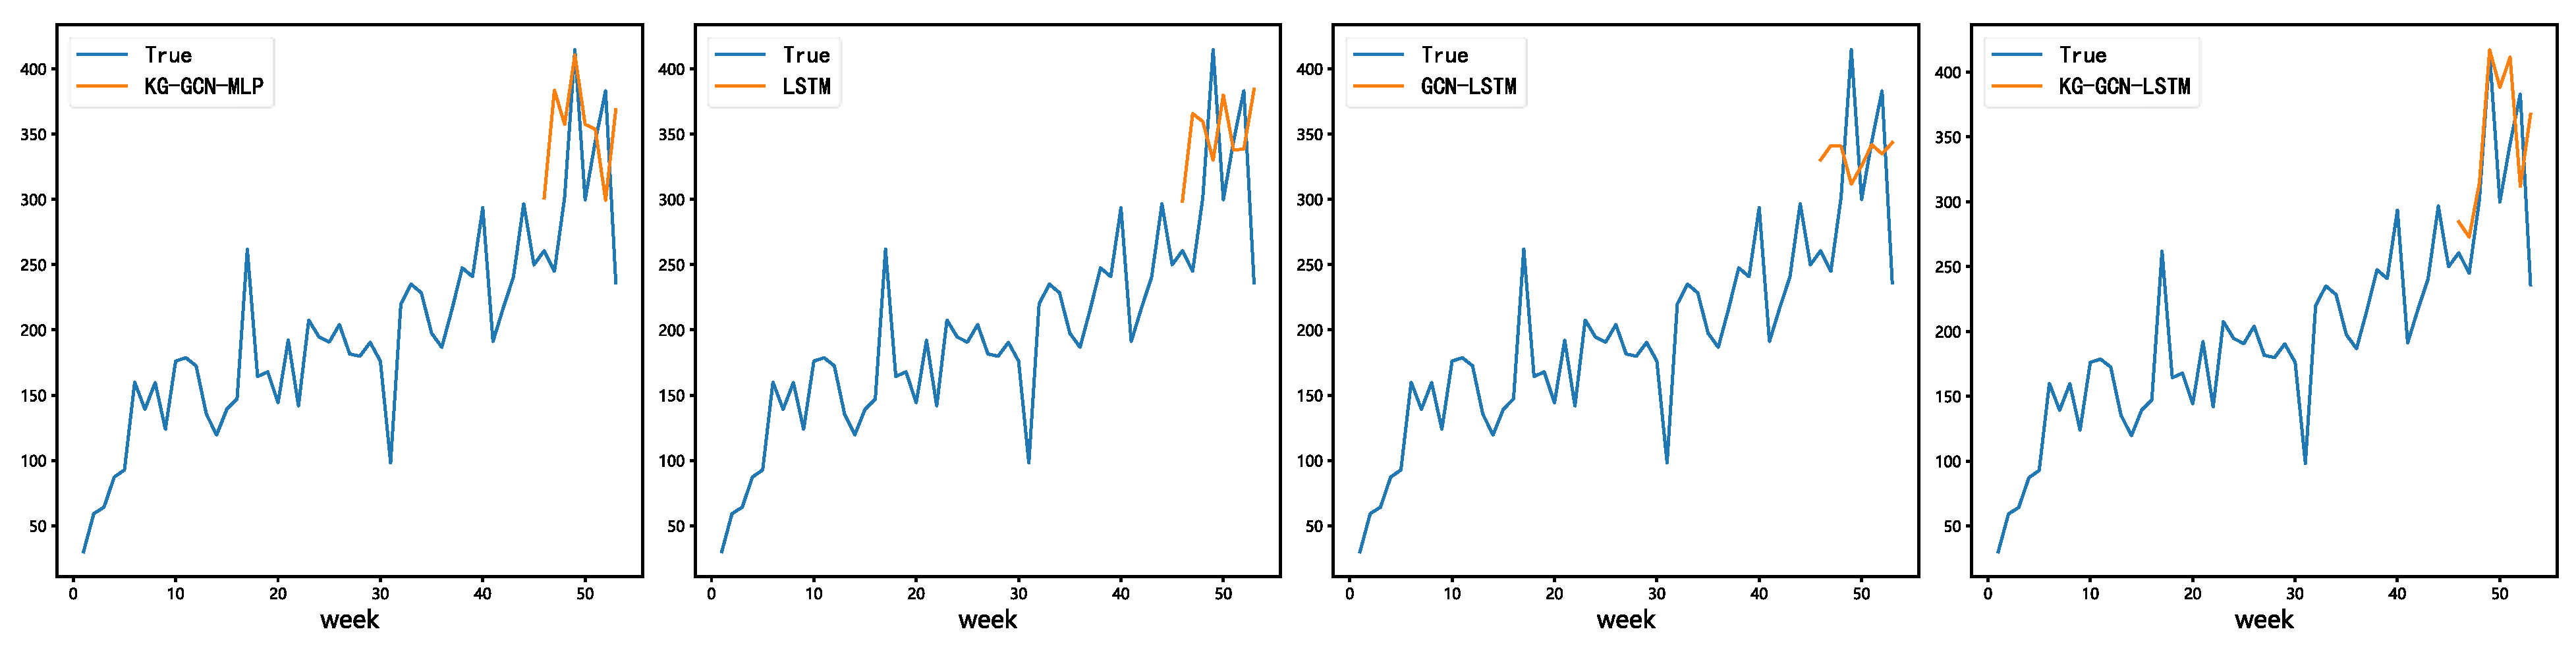

Table 1.
Baseline models and key parameters.
| Model | Description | Key parameters |
|---|---|---|
| auto-ARIMA | ARIMA is a classical time series forecasting model that captures linear dependencies through autoregressive, differencing, and moving average components. | The parameters p, d, and q are selected by minimizing the AIC, with up to 100 iterations. |
| SVR | SVR is a machine learning regression method based on support vector machines, suitable for small-scale and nonlinear data. | Kernel = RBF, C=100, gamma=0.01, epsilon = 0.1 |
| XGBoost | XGBoost is a powerful gradient boosting framework using decision trees, known for its accuracy and handling of complex non-linear patterns. | max_depth=6, eta=0.1, subsample=0.8, n_estimators=100 |
| RNN | The RNN baseline models sequential dependencies using recurrent hidden states, making it suitable for time series forecasting. | hidden_size=64, num_layers=1, dropout=0.2, |
| CNN-LSTM | CNN-LSTM integrates CNN for short-term feature extraction and LSTM for long-term sequence modeling. | CNN kernel size = 3, filters = 64, LSTM hidden_size=64, dropout=0.2, |
| NBEATS (Neural Basis Expansion Analysis for Interpretable Time Series) |
N-BEATS is a deep learning architecture for time series forecasting that employs backward and forward residual blocks to capture both trend and seasonal components in a fully interpretable manner. | number of stacks = 3, block layers = 2, hidden units = 512, dropout = 0.2, batch size = 256 |
| KG-GCN-LSTM (Proposed Model) | KG-GCN-LSTM combines graph convolutional networks to model relational dependencies between drugs and LSTM to capture temporal dynamics. | GCN: layers = 2, hidden dimension = 64, LSTM:hidden_size=64, dropout=0.2, |
Table 2.
Performance Comparison of Forecasting Models.
| Model | MAE | RMSE | SMAPE (%) |
|---|---|---|---|
| AutoARIMA | 67.8769 | 79.0307 | 10.63% |
| SVR | 71.1110 | 81.1767 | 11.02% |
| XGBoost | 68.1974 | 77.6257 | 10.56% |
| RNN | 67.3514 | 80.8032 | 10.68% |
| CNN-LSTM | 82.7919 | 96.0930 | 12.60% |
| NBEATS | 78.2468 | 96.3988 | 11.86% |
| KG-GCN-LSTM | 53.9080 | 65.4058 | 8.24% |
Table 3.
Ablation study on the contributions of GCN and LSTM in KG-GCN-LSTM.
| Model | MAE | RMSE | SMAPE (%) |
| KG-GCN-MLP | 65.2841 | 80.7454 | 10.32% |
| LSTM | 72.6728 | 84.4461 | 11.21% |
| GCN-LSTM | 61.6119 | 72.4715 | 9.85% |
| KG-GCN-LSTM | 53.9080 | 65.4058 | 8.24% |
Disclaimer/Publisher’s Note: The statements, opinions and data contained in all publications are solely those of the individual author(s) and contributor(s) and not of MDPI and/or the editor(s). MDPI and/or the editor(s) disclaim responsibility for any injury to people or property resulting from any ideas, methods, instructions or products referred to in the content. |
© 2025 by the authors. Licensee MDPI, Basel, Switzerland. This article is an open access article distributed under the terms and conditions of the Creative Commons Attribution (CC BY) license (http://creativecommons.org/licenses/by/4.0/).
Copyright: This open access article is published under a Creative Commons CC BY 4.0 license, which permit the free download, distribution, and reuse, provided that the author and preprint are cited in any reuse.


