
Submitted:
17 October 2025
Posted:
20 October 2025
You are already at the latest version
Abstract
Background: Recent data show that approximately 3.8% of the global population has a diagnosis of depression. Understanding psychological risk and protective factors is crucial for improving prevention strategies and mental health interventions. Among these, worry and Emotional Intelligence (EI) have emerged as relevant, yet rarely studied together. To date, no studies that analyzed the relationship between Emotional Intelligence, worry, and depression together have been found. Therefore, this study aims to investigate the association among EI, worry, and depression. Methods: This study included 924 participants (N = 806 non-clinical and N =118 subclinical sample with elevated depressive symptoms), with mean age of M = 25.55 years (SD = 11.38). A total of 118 participants (12.8%) met the criteria for clinical depression based on the BDI-II cut-off. All participants completed the Penn State Worry Questionnaire (PSWQ; Meyer et al., 1990), the Beck Depression Inventory-II (Beck et al., 1996), and the Emotional Intelligence Scale (EIS; Schutte et al., 1998). To examine the relationships among all variables examined zero-order correlation coefficients were calculated. To investigate the predictive power of EI and worry on depression, Bayesian linear regression was conducted. Results: The results showed significant and positive correlations between worry and depression in both samples. EI showed significant and negative correlations with both depression and worry in both subclinical sample with elevated depressive symptoms and non-clinical sample. Finally, worry emerged as the strongest contributor of the somatic dimension of depression in both groups. In the subclinical sample with elevated depressive symptoms, age and Evaluation and Expression of Emotion to Self, along with worry, were the best predictors of somatic symptoms. Conclusions: Our data suggest that high worry levels increase depression risk, whereas higher EI may serve as a protective buffer. Training programs designed to enhance EI could help mitigate the impact of negative events, improve problem solving skills, and enhance the expression of one’s own emotions.
Keywords:
worry
; depression
; emotional intelligence
; association
1. Introduction
Depression is characterized by a pervasive low mood, anhedonia (i.e., a lack of pleasure in most daily activities) and other symptoms such as changes in appetite or weight, sleep disturbances, psychomotor retardation or agitation, fatigue or loss of energy, feelings of guilt or worthlessness, and difficulty concentrating or making decisions [1]. Cognitive dysregulation is a core feature of depression, encompassing cognitive biases and maladaptive cognitive emotion regulation strategies. Cognitive biases include a negative self-referential process, negative attentional bias toward negative stimuli, negative interpretation of ambiguous stimuli and situations, and enhanced recall of negative events (Balsamo, 2010; Balsamo & Saggino, 2007; Balsamo et al., 2015; Beach & Whisman, 2012; Maurer et al., 2018; Ruan-Iu et al., 2023). Maladaptive cognitive emotion regulation strategies refer to the emotional elaboration of a stimulus, aimed at coping by reducing emotional impact. These strategies are characterized by excessive rumination (dwelling on past negative events), limited distraction, and reduced cognitive reappraisal of negative emotion (LeMoult & Gotlib, 2019; Sarkisian et al., 2019).
Recent epidemiological data indicate that the estimated prevalence of depressive symptoms among adults in the Italian general population is 6% between 2016 and 2019. Additionally, depression ranks as the second costliest pathology after cardiovascular diseases, and it is projected to become the leading cause of years loss of ill health by 2030 (Italian National Institute of Health [ISS], 2022). A recent meta-analysis (Cenat et al., 2022) documents an increase in depression rates, particularly from 2020 onwards among young adults and adults across North America, Europe, Latin America, and Australia. Globally, approximately 3.8% of the population has a diagnosis of depression, with a higher incidence among females (Chahal et al., 2020; World Health Organization [WHO], 2022). The higher occurrence of depressive symptoms in women, is attributed to both psychological and biological factors. Biologically, hormonal fluctuations during specific life periods (e.g., premenstrual phase) and low estrogen levels increase vulnerability. Psychologically, women exhibit a higher number of internalizing behaviors (Akhtar-Danesh & Landeen, 2007; Albert, 2015; Piccinelli & Wilkinson, 2000; Sergi et al., 2023). Italian data further reveal a prevalence of depressive symptoms of 6.6% in the age group18-34 years, 5.6% in the 35-49 group, and 7.3% in the 50-69 group.
Age emerges as a salient factor in depression prevalence (Islam &Adnan, 2017; Salk et al., 2017). Several studies document associations between age and depression in both male and female populations (Akhtar-Danesh & Landeen, 2007; Islam & Adnan, 2017; Schaakxs et al., 2017; Stordal et al., 2003), with some showing age as a predictor in clinical samples (Akhtar-Danesh & Landeen, 2007; Islam & Adnan, 2017). However, findings are mixed, potentially due to sample differences or measurement variability (Hwu et al., 1996; Knight, 1984; Salk et al., 2017). An interaction effect between age and gender may account for variability, as depressive symptoms appear to increase more sharply with age in women, possibly due to psychosocial stressors and hormonal changes (Albert, 2015; Salk et al., 2017). Understanding such interactions is critical to elucidate depressive disorder development and progression.
Beyond sociodemographic factors, genetic and family influences play a critical role in the onset of depression. Twin studies estimate the heritability of major depressive disorder at approximately 40% (Kendler et al., 2006). Moreover, early-life events such as childhood trauma and abuse have been consistently linked to increased risk of depression later in life (Heim & Nemeroff, 2001; Gilbert et al., 2009). Neurobiological evidence suggests maltreatment during critical developmental periods can alter brain structures implicated in emotion regulation, heightening vulnerability to depressive disorders (Teicher et al., 2016). Including these factors provides a more comprehensive understanding of depression’s multifactorial etiology.
1.1. The Role of Worry and Emotional Intelligence in Depression
The study of psychological risk factors for depression facilitates understanding its course, prevention, and the development of mental health promotion programs (Thapar et al., 2022). Worry is a maladaptive, future-oriented and persistent cognitive-emotional process focused on potential negative outcomes (Gustavson et al., 2018; Rood et al., 2009; Wells, 1995) that has been consistently identified as a risk factor for depression. Numerous longitudinal studies and meta-analyses have demonstrated its predictive role. For instance, Jacobson and Newman (2017) conducted a meta-analysis of 66 longitudinal studies and found that anxiety symptoms—of which worry is a core feature—predict depressive symptoms. Emotional Intelligence (EI) is considered a protective factor against affective disorders, including depression. A recent meta-analysis (Sánchez-Álvarez et al., 2015) found a significant and positive correlation between EI and subjective well-being in a sample of 8520 participants, indicating that emotional competencies help manage stress and promote positive emotions. Furthermore, Mestre et al. (2017) found that higher levels of EI are associated with increased resilience, which facilitates better anxiety symptoms. Moreover, Wapaño (2021) showed that EI positively predicted self-efficacy and resilience, while negatively predicted anxiety and depression, indicating that emotionally intelligent individuals are more likely to respond positively to their environment.
Worry, traditionally viewed as an anxiety correlate, has since been conceptualized as an independent construct (Davey et al., 1992). Correlational studies reveal consistent positive, significant associations between worry and depression across clinical and non-clinical samples (Borkovec et al., 1983; Calmes & Roberts, 2007; de Jong-Meyer et al., 2009; Dugas et al., 1997; Hong, 2007, 2013; McEvoy & Brans, 2013; Nolen-Hoeksema, 2000; Roberts & Robichaud, 2005; among others). Some studies show that worry predicts depression (De Vlieger et al., 2006; Eisma et al., 2017; Hong, 2007), although others have failed to replicate this finding (Dar et al., 2017; Fergus et al., 2013). Experimental research demonstrates higher depression levels in worry conditions compared to controls (Andrews & Borkovec, 1988; Borkovec et al., 1983).
The Beck Cognitive Behavioral Model of depression emphasizes maladaptive cognitive styles such as worry in maintaining depressive symptoms. The Emotional Contrast Avoidance Model (Llera & Newman, 2010, 2014) suggests worry acts as an emotional regulation strategy buffering against sudden negative emotional spikes, maintaining a relatively constant intrapersonal negativity. This aligns with the Tripartite Model (Clark & Watson, 1991), which posits negative affect as a shared dimension of anxiety and depression, with worry as a transdiagnostic cognitive-emotional mechanism involved in both disorders.
In contrast, Emotional Intelligence (EI) is a pivotal construct that could play a protective role against depression (Abdellatif et al., 2017). “Trait EI” can be defined as a series of self-perceptions about the ability to identify emotions (Petrides & Furnham, 2000; 2001; 2003). In this context, there are training programs designed to enhance EI, focusing on emotion regulations to mitigate the impact of negative events, improve problem solving skills, and enhance the expression of one’s own emotions (Jahangard et al., 2012).
Regarding the association between Emotional Intelligence and depression, several studies have demonstrated negative and significant correlations between the two constructs and the predictive power of EI on depression in both adult and adolescent samples, even after controlling for gender and age (Picconi al., 2019). Abdellatif et al. (2017) found significant and negative correlations among positive expressivity, attending to emotion, and empathy of EI and depression, measured through the BDI-II, in a sample of patients with depression. These findings are consistent with other studies in which EI predicts depression (Abdollahi et. al., 2013; Aradilla-Herrero et al., 2014; Extremera & Fernández-Berrocal, 2006; Fernandez-Berrocal et al., 2006; Lloyd et al., 2012; Sergi et al., 2012; Salguero et al., 2012). Ciarocchi et al. (2002) found significant and negative correlations between Managing Self Emotion of EI and depression, measured through BDI-II, in a sample of undergraduate students. Another study showed the following factors of EI: Emotional Recognition and Expression, Understanding Emotions External, Emotions Direct Cognition, Emotional Management, and Emotional Control of EI predict depression, measured through the BDI-II, in a sample of adults with depression (Downey et al., 2008). These results are confirmed by Davis and Humphrey (2012), who found significant and negative correlations between the total score of EI and depression in a sample of non-clinical adolescents. The total score of EI was a predictor of depression. More recently, Sergi et al. (2021) found significant and negative correlations between EI and depression, measured through Teate Depression Inventory (TDI; Balsamo & Saggino, 2013, 2014; Balsamo et al., 2014) in a sample of non-clinical adults. Correlations ranged from r = -.412; p<.01 for “Social Skills” to r = -.208; p<.01 in males; correlations range from r = -.283; p<.01 for “Social Skills” to r = -.136; p<.01 for Optimism/Mood regulation in females. Results show that the Social Skills factor was the best predictor of depression. Moreover, Vucenovic et al. (2023) found significant and negative correlations among Expressing and Naming Emotion and Managing Emotions of EI and depression in a sample of high-school students, measured through Depression Anxiety Stress Scale. Finally, several studies (Andrei et al., 2016; Batselé et al., 2019; Gomez-Baya et al., 2017; Karim & Weisz, 2010; Miller et al., 2020; Moeller et al., 2020; Saklofske et al., 2003; Sergi et al., 2012) found significant and negative correlations between depression and Global EI, which served as a predictor of depression in non-clinical samples. These results were further supported in clinical samples (Batool & Khalid, 2009; Korkmaz et al., 2020).
While worry and EI operate at different psychological levels (process vs. trait/ability), their joint evaluation offers a balanced model examining vulnerabilities and resilience factors in depression. This dual approach aligns with literature suggesting that effective mental health screening and prevention should target both risk mechanisms and protective resources. To date, no studies have been found that examined the relationship between Emotional Intelligence, worry and depression, limitating current understanding of their interrelations. Clarifying this relationship between worry, EI, and depression enables clinicians to design target interventions-such as training in emotion regulation and cognitive strategies-that improve patients’ ability to maintain positive affect and reduce maladaptive negative thought patterns (Liu et al., 2018). The present study addresses this gap by proposing testing a three-tiered model that integrates demographic, psychological, and behavioral components contributing to depression risk. This model reflects the multilevel nature of vulnerability and protective factors associated with depression.
Therefore, based on the literature reviewed above, the first aim of this work is to analyze the association among EI, worry, and depression on a sample drawn from the relevant general population. We hypothesized different associations among variables investigated. In particular, the first hypothesis is divided into five sub- hypotheses:
- H1a: Worry could be positively related to affective factors of depression both in clinical and non-clinical samples;
- H1b: Worry could be positively related to somatic factor of depression both in clinical and non-clinical samples.
- H1c: EI could be negatively related to affective factor of depression both in clinical and non-clinical samples;
- H1d: EI could be negatively related to somatic factors of depression both in clinical and non-clinical samples;
- H1e: EI could be negatively related to worry both in clinical and non-clinical samples.
The second aim of this work is to analyze the contribution of psychological risk factors and age to depression. In particular, the second hypothesis is divided into four sub- hypotheses:
- H2a: We examine whether the posterior estimates supported a relationship between worry and the affective factor of depression in both participants above BDI threshold and non-clinical sample;
- H2b: Worry was expected to contribute to the explanation of the somatic factor of depression in both participants above BDI threshold and non-clinical sample;
- H2c: Both worry and were expected to be associated with the affective factor of depression in both participants above BDI threshold and non-clinical sample;
- H2d: Both worry and EI were expected to contribute to the explanation of the somatic factor of depression in both participants above BDI threshold and non-clinical sample.
The third aim of this work is to study the mean difference between subclinical samples with elevated depressive symptoms and non-clinical samples among EI, depression, and worry. We hypothesize that the non-clinical sample has higher means in Emotional Intelligence than the subclinical sample with elevated depressive symptoms, while the participants above BDI threshold have higher means than the non-clinical sample.
2. Materials and Methods
Participants and Procedure. A total of 924 participants (67.3% females; missing = 0.2%) are included in the study on a voluntary basis. Inclusion criteria are the following: 1) participants fluent in Italian living in Italy; 2) age ≥ 18 years. The sample was recruited in person by trained professionals in the psychometric and clinical fields, following standardized procedures.The survey was administered entirely face to face. The participants were drawn from the general reference population. The mean age of the total sample was 25.55 years (minimum = 18 years and maximum = 70 years; SD = 11.38). Eighteen participants (1.9%) did not declare their age. Participants partially overlapped with those included in Sergi et al. (2021) (N= 1725).
The Sample was divided into subclinical sample with elevated depressive symptoms and non-clinical sample on the Beck Depression Inventory Total Score (BDI-II; Beck et al., 1996). Scores ≥ 20 indicate a Moderate depression. Based on this cut-off 118 participants (78.8% females) met the criteria for elevated depressive symptoms, while 806 participants formed the non-clinical group.
The non-clinical sample Included 529 females (65.6%), with a mean of 25.69 yrs and a SD of 11.58 yrs. The majority (75.4%) were undergraduate students; other occupational categories included employment (4.7%), housewives (3.3%), office clerks (3.2%), freelancers (3.1%), workers (2.9%), teachers (1.9%), traders (1.1%), armed forces personnel (1.0%), technical workers (0.9%), nurses (0.6%), doctors (0.6%), social operators (0.1%), with 1.1% missing data..
Subclinical sample with elevated depressive symptoms was composed by 118 subjects. 93 participants were females (78.8%), with a mean of 24.63 yrs and a SD of 9.92 yrs. 78.0% were undergraduate students, 5.9% were in other employments, 5.9% were housewives, 2.5% were in technical employments, 2.5% were freelancers, 0.8% were social operators, 0.8% were doctors, and there was a missing data rate of 3.4%.
All participants provided written informed consent prior to participation, in accordance with the Declaration of Helsinki (World Medical Association, 2013). Participants’ anonymity and privacy were guaranteed according to the Italian and the European laws about privacy (Italian law n. 196/2003 and EU GDPR 679/2016, respectively). The study obtained the ethical approval from the Department of Medicine and Aging Science, Italy (number 2223/07.09.2021).
2.1. Measures
Emotional Intelligence Scale. The Emotional Intelligence Scale (EIS; Schutte et al., 1998) assesses Emotional Intelligence based on the model of Salovey and Mayer (1990). The self-report instrument consists of 33 items on a 5-point Likert scale from 1 (“Totally disagree”) to 5 (“Totally agree”). The instrument comprises four factors: Evaluation and Expression of Emotion to Self (α = .75); Evaluation and Expression of Emotion to Other (α = .76); Social Skills (α = .73) and Optimism/Mood Regulation (α = .64) (Sergi et al., 2021).
Beck Depression Inventory-II. The Beck Depression Inventory-II (BDI-II; Beck et al., 1996) is a self-report instrument used to measure the severity of depression in adults. The BDI-II consists of 21 items based on the diagnostic criteria for major depressive disorder (MMD) and the instrument comprises two factors: affective (α = .80) and somatic symptoms (α = .82).
Penn State Worry Questionnaire. Worry is assessed through the Penn State Worry Questionnaire (PSWQ; Meyer et al., 1990). The self-report instrument consists of 16 items on a 5-point Likert scale from 1 (“Not at all typical of me”) to 5 (“Very typical of me”). This instrument has a total score, deriving from the sum of all items (α = .89 in our total sample).
2.2. Statistical Analyses
Descriptive statistics. Descriptive statistics for the collected data are means, standard deviations, skewness and kurtosis. Skewness and kurtosis values between -2 and 2 indicate a normal distribution of the data (Gravetter & Wallnau, 2014).
Reliability. Psychological scales internal consistency was assessed using Cronbach’s Alpha.
Correlations. To examine the relationships among Emotional Intelligence, Depression and Worry zero-order correlation coefficient is calculated.
Bayesian linear regression. We used Bayesian linear regression to estimate the relationships among variables. This method explicitly models the uncertainty associated with parameter estimates and allows the comparison of multiple models without relying on traditional significance thresholds. Bayesian regression begins with a prior probability distribution that reflects initial knowledge or assumptions about the relationships among variables. When new data D are observed for a given model Mj, the prior is updated via Bayes’ theorem to produce a posterior distribution (Bergh et al., 2021). The extent of the update is quantified using the Bayes Factor (BFMj), which represents the ratio of the posterior odds to the prior odds (Bishop et al., 2003; Dunson et al., 2007; Gelman et al., 2019; Greenland, 2007; Minka, 2000; Vandekerckhove et al., 2018).
For example, a Bayes Factor BF10 = 5 means the data are five times more likely under Model 1 than under Model 0. Conversely, BF10 = 0.5 (i.e., BF01 = 2) means the data are two times more likely under Model 0. Interpretation thresholds include:
- -
- 1–3: weak evidence
- -
- 3–10: moderate evidence
- -
- 10–30: strong evidence
- -
- 30–100: very strong evidence
- -
- >100: extreme evidence for one model over another.
We used noninformative (default) priors to ensure an objective estimation process.
If BF10 = 5, it means that the data is 5 times more likely under Model M1 than under M0. For instance, if BF10 = 0.50, then = 2, which means that the data are 2 times more likely under M0 than under M1. Values between indicate moderate evidence for M0; Values between indicate strong evidence for M0; values equal to indicate very strong evidence for M0; values < to an extreme evidence for M0 (Bergh et al., 2021).
Welch’s ANOVA. To investigate the mean differences between the non-clinical and subclinical sample with elevated depressive symptoms among EIS dimensions, Affective and Somatic symptoms, and worry were estimated Welch’s ANOVA given the unequal simple sizes. All statistical analyses are conducted using JASP version 18.1 (Jasp Team, 2023).
3. Results
Table 1 presents descriptive statistics of EIS dimensions, depression, and worry in non-clinical sample and subclinical sample with elevated depressive symptoms. All scores showed normal values of skewness and kurtosis. For the subclinical sample with elevated depressive symptoms (n = 118), the assumption of univariate normality was assessed by computing standardized skewness and kurtosis values, following the criteria outlined by Kim (2013). Specifically, z-scores were obtained by dividing the skewness and kurtosis values by their respective standard errors. All Z- skewness values were within the acceptable range (absolute z < 3.29) for medium-sized samples, except for the Optimism/Mood Regulation variable, which showed a slight deviation from normality (Z- skewness = 4.49). All Z- kurtosis values were below the critical threshold of an absolute z-value of 3.29, indicating no substantial departure from normality.
Table 2 presented the association among EIS dimensions, depression, and worry in non-clinical sample and subclinical sample with elevated depressive symptoms. In both groups, the results generally showed significant correlations among the variable investigated. Specifically, in the non-clinical sample, significant and negative correlations were observed between the Somatic symptoms of depression and Emotional Intelligence (ranging from r = -.081; p<.05 between Expression and Evaluation of Emotion to Self and the Somatic symptoms, to r = -.154; p<.001 between Somatic symptoms and Social skills).
Moreover, significant and negative correlations were found between the Affective symptoms of depression and Emotional Intelligence (ranging from r = -.184; p<.001 between Expression and Evaluation of Emotion to Self and Affective symptoms, to r = -.127; p<.001 between Affective symptoms and Social skills).
Worry showed significant and negative correlations with Social skills (r = -.139; p<.001) and between Optimism/Mood regulation (r = -.110; p<.001). Finally, significant and positive correlations were found between worry and Affective and Somatic symptoms of depression (r = .363; p<.001 and r = .288; p<.001, respectively).
In the subclinical sample with elevated depressive symptoms, significant and negative correlations were observed between Somatic symptoms of depression and Expression and Evaluation of Emotion to Self (r = -.202; p<.05). Moreover, significant and positive correlations were observed among worry, Affective, and Somatic symptoms of depression (r = .189; p<.05 and r =.201; p<.05, respectively).
Table 3 presented Bayesian linear regression for Affective symptoms in the non-clinical sample. In this model, the predictors included Evaluation and Expression of Emotion to Self, Evaluation and Expression of Emotion to Others, Social Skills, Optimism/Mood Regulation, worry, and age, while Affective symptoms were the dependent variable. The Bayes factor BF01 compares all models to the null model. In female sample, the best model was Evaluation and Expression of Emotion to Self + worry, while in the male sample, the best model was worry + Evaluation and Expression of Emotion to Self. These results were confirmed by Table 4, where posterior inclusion probabilities in females (.997 for Evaluation and Expression of Emotion to Self, .283 for worry) and males (1.000 for worry, .997 for Evaluation and Expression of Emotion to Self) were near 1. Therefore, worry and Evaluation and Expression of Emotion to Self-predicted Affective symptoms in the female and male samples in the non-clinical sample.
Table 5 presented Bayesian linear regression for Somatic symptoms in the non-clinical sample. In this model, the predictors were Evaluation and Expression of Emotion to Self, Evaluation and Expression of Emotion to Others, Social Skills, Optimism/Mood Regulation, worry, and age, while Somatic symptoms were the dependent variable. The Bayes factor BF01 compares all models to the null model. In both female and male samples, worry predicted Somatic symptoms. These results were supported by Table 6, in which posterior inclusion probabilities in females (1.000) and males (.202) were near 1. Therefore, worry is included in the model for both the female and male samples.
Table 7 presented Bayesian linear regression for Affective symptoms in the subclinical sample with elevated depressive symptoms. In this model, the predictors included Expression and Evaluation of Emotion to Self, Evaluation and Expression of Emotion to Others, Social Skills, Optimism/Mood Regulation, worry, and age, while Affective symptoms were the dependent variable. The Bayes factor BF01 compares all models to the null model. In both female and male samples, Worry predicted Affective symptoms. These results were confirmed by Table 8, in which posterior inclusion probabilities in females (.519) and males (.535) are near 1. Therefore, worry was included in the model for both the female and male samples.
Table 9 presented Bayesian linear regression for Somatic symptoms in the subclinical sample with elevated depressive symptoms. In this model, the predictors were Expression and Evaluation of Emotion to Self, Evaluation and Expression of Emotion to Others, Social Skills, Optimism/Mood Regulation, worry, and age were the predictors, while Somatic symptoms were the dependent variable. The Bayes factor BF01 compares all models to the null model. In the female sample, the best model was worry +Evaluation and Expression of Emotion to Self + age, while in male samples, the best model was Evaluation and Expression of Emotion to Self +worry + age. These results were confirmed by Table 10, in which posterior inclusion probabilities in females (.724 for worry, .614 for Evaluation and Expression of Emotion to Self, .733 for age) and males (.292 for Evaluation and Expression of Emotion to Self, .614 for Worry, .733 for Age) were near 1. Therefore, age, worry, and Evaluation and Expression of Emotion to Self were included in the model for both the female and male samples.
Table 11 showed that the mean differences between samples were significant for Evaluation and Expression of Emotion to Self, Social Skills, Optimism/Mood Regulation, Affective symptoms, Somatic symptoms, and Worry, while there were no significant differences for Evaluation and Expression of Emotion to Other. Table 1 indicated that the non-clinical sample had higher means in Evaluation and Expression of Emotion to Self, Social Skills, and Optimism/Mood Regulation, while the clinical sample had higher means in Affective symptoms, Somatic symptoms, and Worry.
4. Conclusions
The Multilevel Model of Depression Risk conceptualizes depression vulnerability and resilience as involving interrelated demographic, psychological, and behavioral factors (Figure 1). At Level 1 (Demographic Factors), age emerged as a significant predictor of somatic symptoms in the subclinical group. At Level 2 (Psychological Resources and Risks), emotional intelligence (EI)—particularly the ability to evaluate and express emotion to oneself—operates as a protective factor against depressive symptoms and worry, while worry functions as a cognitive-emotional vulnerability factor contributing to the maintenance of depressive symptomatology. At Level 3 (Behavioral Patterns), the clinical/subclinical sample exhibited increased severity of affective and somatic symptoms concomitant with maladaptive behaviors exemplified by worry and emotional dysregulation. This integration highlights how demographic factors create the base of vulnerability, while EI and worry modulate the risk and manifestation of depressive symptoms.
Existing literature underscores the importance of psychological processes underlying worry and EI in depression’s development and maintenance of worry (Abdellatif et al., 2017; Clarke et al., 2017; Goodwin et al., 2017; Kotsou et al., 2019; Newman & Llera, 2011). Our findings contribute to the increasing literature emphasizing the significance of investigating the psychological processes in clinical and non-clinical samples that are at risk of developing depressive symptoms (Clarke et al., 2017; Goodwin et al., 2017; Newman & Llera, 2011). This study complements prior work by examining these factors concurrently in Italian adults, marking the first such investigation regionally.
The first aim of this work is to examine associations among worry, EI, and depression. In relation to our first aim, hypothesis H1a and H1b are confirmed. Our results indeed reveal significant and positive correlations between worry and depression in both samples. These findings align with prior research (Borkovec et al., 1983; de Jong-Meyer et al., 2009; De Vlieger et al., 2006; de Vito et al., 2019; Dugas et al., 1997; Eisma et al., 2017; Goring & Papageorgiou, 2008; Hong, 2007, 2013; Hughes et al., 2008; Manfredi et al., 2011; McEvoy & Brans, 2013; Mourady et al., 2017; Naragon-Gainey et al., 2017; Nolen-Hoeksema, 2000; Perini et al., 2006; Robichaud & Dugas, 2005; Segerstrom et al., 2000; Short & Mazmanian, 2013; Siegle et al., 2004; Sorg et al., 2012; Vickers & Vogeltanz-Holm, 2003; Watkins & Moulds, 2009). Additionally, hypotheses H1c, H1d, and H1e find partially confirmation in our findings. Indeed, our results demonstrate that Emotional Intelligence has, in general, significant and negative correlations with depression and worry, corroborating previous research (Andrei et al., 2016; Aradilla-Herrero et al., 2014; Batool & Khalid, 2009; Ciarocchi et al., 2002; Davis & Humphrey, 2012; Downey et al., 2008; Extremera & Fernández-Berrocal, 2006; Fernandez-Berrocal et al., 2006; Gomez-Baya et al., 2017; Karim & Weisz, 2010; Korkmaz et al., 2020; Lloyd et al., 2012; Moeller et al., 2020; Picconi et al., 2019; Saklofske et al., 2003; Salguero et al., 2012; Sergi et al., 2012; Sergi et al., 2021; Vucenovic et al. 2023; Zysberg & Zisberg, 2022). In the non-clinical sample, higher scores of Evaluation and Expression of Emotion to Self are associated with lower scores of Affective and Somatic symptoms of depression. Moreover, higher levels of worry are associated with higher scores of Social Skills and Optimism. In the subclinical sample with elevated depressive symptoms higher scores of Evaluations and Expression of Emotion to Self are associated with lower scores of Somatic symptoms of depression, while higher levels of worry are associated with higher scores of Evaluation and Expression of Emotion to Others. This latter result can be explained by a high fear of other people’s judgement, increasing worry levels.
The second aim of this work was to analyze the contribution of psychological risk factors to depression. In relation to our second aim, hypotheses H2a: We examine whether the posterior estimates supported a relationship between worry and the affective factor of depression in both participants above BDI threshold and non-clinical sample and H2c: Both worry and were expected to be associated with the affective factor of depression in both participants above BDI threshold and non-clinical sample are confirmed. Evaluation and Expression of Emotion to Self and worry show an association with the affective factor of depression in both samples. Moreover, hypotheses H2b: Worry was expected to contribute to the explanation of the somatic factor of depression in both samples and H2d: Both worry, and EI were expected to contribute to the explanation of the somatic factor of depression in both samples are confirmed. Worry is associated with Somatic factor of depression in both participants above BDI threshold and non-clinical sample. In the subclinical sample with elevated depressive symptoms age and Evaluation and Expression of Emotion to Self together with worry are the strongest contributors of Somatic symptoms of depression. These findings align with prior research (Abdollahi et. al., 2013; Andrei et al., 2016; Aradilla-Herrero et al., 2014; Batool & Khalid, 2009; Batselé et al., 2019; Davis & Humphrey, 2012; Extremera & Fernández-Berrocal, 2006; Fernandez-Berrocal et al., 2006; Gomez-Baya et al., 2017; Karim & Weisz, 2010; Korkmaz et al., 2020; Lloyd et al., 2012; Miller et al., 2020; Moeller et al., 2020; Saklofske et al., 2003; Sergi et al., 2012; Salguero et al., 2012).
Finally, our results indicate that the non-clinical sample demonstrated greater abilities in expressing and processing their own emotions, as well as higher levels of optimism and social skills, compared to the clinical sample. In contrast, the subclinical sample with elevated depressive symptoms exhibited higher levels of Somatic and Affective symptoms of depression, as well as elevated levels of worry compared to the non-clinical sample.
Our study analyzed the role of risk factors of depression that permit us to develop protective strategies for depression (Abdellatif et al., 2017; Abdollahi et al., 2013; Ciarrocchi et al., 2002; Downey et al., 2008; Lloyd et al., 2012; Vucenovic et al. 2023). Higher EI enables better understanding and processing of emotions associated with events, reducing repetitive negative thoughts and emotions, which, in turn, facilitates better control of worry and depressive symptoms (Watkins & Baracaia, 2001). Indeed, EI allows for a positive mood, providing protection against several psychopathologies, such as depression (Armstrong et al., 2011; Bauld & Brown, 2009; Di Fabio, 2011; Fernandez-Berrocal et al., 2005; Martins et al., 2010; Nielsen-Prohl et al., 2013; Picconi et al., 2019; Schutte & Malouff, 2011; Sergi et al., 2021; Sharif et al., 2013; Slaski & Cartwright, 2003; Yalcin et al., 2008). In particular, the ability to understand own emotional states or emotional problems permits a better adaptation to stressful situations, reducing the impact of negative emotions, and increasing well-being (Abdellatif et al., 2017; Abdollahi et al., 2013; Delhom et al., 2018; Lloyd et al., 2012; Sergi et al., 2021). These scientific evidence could elucidate why the clinical sample exhibits lower scores in Emotional Intelligence factors compared to the non-clinical sample.
Other risk factors for depression were the negative attribution style to daily events and worry (Girgus & Yang, 2015). Our results show as the fixation on negative and uncontrollable future thoughts and images is associated with depression. In particular, the ability to understand and to express own emotions and worry are the best contributors of Affective symptoms of depression in the non-clinical sample; when Evaluation and Expression of Emotion to Self and worry are associated with age they become the best predictor of Somatic symptoms of depression. These findings could explain why the clinical sample has higher worry scores compared to the non-clinical sample. Taken together, our findings highlight the importance of measuring both maladaptive processes, such as worry, and protective factors, such as Emotional Intelligence, to advance a more comprehensive understanding and prevention of depression.
Our study has several limitations. Firstly, as the Bayesian regression model only examines associations among the variables analyzed in the present research, causality cannot be estimated. Secondly, the limited generalizability of our results to clinical samples is a limitation. The study does not assess the presence of diagnoses or mental health-related conditions, history of mental disorders/psychological difficulties, and the comorbidity with anxiety. Furthermore, there is an imbalance between groups, which may have affected the comparability and generalizability of the results. Although some correlations reached statistical significance at the 95% confidence level, their strength was generally weak. Given the large size, it is possible the statistical significance was driven by the number of observations. Finally, the use of a single-instrument cut-off score (BDI-II) to distinguish between participants with higher and lower depressive symptoms represents a limitation. Dichotomizing a continuous variable such as depression can lead to a loss of statistical power and reduced precision of the results. Future research should consider maintaining depression scores as continuous variables and exploring non-linear relationships with predictors.
Future research should replicate our study with more different clinical samples and should investigate other potential psychological processes underlying worry and EI in predicting depression. Additionally, future studies could use predictive models of depression with Machine Learning. Finally, future research will be directed toward experimental studies with emotion regulation training programs, as well as the exploration of mediating and moderating variables such as gender or trauma.
In conclusion, our data suggests that higher levels of worry are associated with higher levels of depression. Furthermore, difficulties in understanding, expressing, and regulating emotions correlate with higher levels of worry and depression. A In particular, the ability to appraise and express emotions emotions in oneself, coupled with effective regulation of worry, appears to serve as protective factor against depression. Therefore, individuals with greater emotional competence are more likely to exert better control over worry, resulting in lower levels of depression.
Practical Implications
The findings hold important implications for psychotherapeutic and clinical fields. The interplay between worry and depression might be exacerbated by poor Emotional Intelligence characterized by difficulties in expressing, using, and understanding one’s own and others’ emotions. Intervention programs focused on enhancing emotional intelligence in individuals exhibiting depressive symptoms and excessive worry could bolster their ability to manage these negative emotional experiences. Psychological interventions that focus on identifying and controlling negative emotions, such as anger or sadness, and understanding the relationship between emotions and physical reactions, could be particularly effective in promoting Emotional Intelligence (Gigantesco et al., 2015; Karahan & Yalcin, 2009). Additionally, the development and use of adaptive coping strategies—like cognitive flexibility, problem-focused coping, and emotion-focused coping—could diminish depression's negative impact (Vucenovic et al., 2023). Indeed, mental health promotion initiatives might integrate emotion management skills training for individuals without formal mental disorders to enhance resilience and emotional regulation, thereby preventing psychological distress. Cognitive-behavioral techniques such as role-playing, assertiveness training, and restructuring dysfunctional thinking patterns can foster positive affect. (Gigantesco et al., 2015). Additionally, The European Year of Youth has organized new activities for young people and designed new platforms for peer-to-peer relationships among youth (The Lancet Regional Health–Europe, 2022). A final practical implication of our results for practitioners concerns school-based programs that could also focus on risk factors for depression or other psychopathologies, such as bullying (Thapar et al., 2022).
Author Contributions
Conceptualization, M.R.S.; methodology, M.R.S. and M.T.; software, M.R.S. and M.T.; formal analysis, M.R.S. and M.T.; investigation, M.R.S.; data curation, M.R.S.; writing—original draft preparation, M.R.S and M.T.; writing—review and editing, A.S., M.B, L.C. and M.TERREI.; visualization, M.TERREI.; supervision, L.C. and M.B. All authors have read and agreed to the published version of the manuscript.
Funding
This research received no external funding.
Institutional Review Board Statement
The study was conducted in accordance with the Declaration of Helsinki, and approved by the Department of Medicine and Aging Science, Italy (number 2223/07.09.2021).
Informed Consent Statement
Informed consent was obtained from all subjects involved in the study.
Data Availability Statement
Data are available through the corresponding author upon reasonable request.
Conflicts of Interest
The authors declare no conflicts of interest.
References
- Abdellatif, S. A., Hussien, E. S. S., Hamed, W. E., & Zoromba, M. A. (2017). Relation between emotional intelligence, socio-demographic and clinical characteristics of patients with depressive disorders. Archives of Psychiatric Nursing, 31(1), 13–23. [CrossRef]
- Abdollahi, A., Hosseini, S. M. E. N., Motalebi, S. A., & Talib, M. A. (2013). Examining the association between emotional Intelligence with depression among Iranian boy students. Depression, 2(3).
- Abramson, L. Y., Metalsky, G. I., & Alloy, L. B. (1989). Hopelessness depression: A theory-based subtype of depression. Psychological Review, 96(2), 358–372. [CrossRef]
- Akhtar-Danesh, N., & Landeen, J. (2007). Relation between depression and sociodemographic factors. International Journal of Mental Health Systems, 1, 1–9.
- Albert, P. R. (2015). Why is depression more prevalent in women? Journal of Psychiatry and Neuroscience, 40(4), 219–221.
- American Psychiatric Association. (2022). Diagnostic and statistical manual of mental disorders, Fifth Edition, Text Revision. American Psychiatric Publishing.
- Andrei, F., Smith, M. M., Surcinelli, P., Baldaro, B., & Saklofske, D. H. (2016). The trait emotional intelligence questionnaire: Internal structure, convergent, criterion, and incremental validity in an Italian sample. Measurement and Evaluation in Counseling and Development, 49(1), 34–45. [CrossRef]
- Andrews, V. H., & Borkovec, T. D. (1988). The differential effects of inductions of worry, somatic anxiety, and depression on emotional experience. Journal of Behavior Therapy and Experimental Psychiatry, 19(1), 21–26. [CrossRef]
- Aradilla-Herrero, A., Tomás-Sábado, J., & Gómez-Benito, J. (2014). Associations between emotional intelligence, depression and suicide risk in nursing students. Nurse Education Today, 34(4), 520–525. [CrossRef]
- Armstrong, A. R., Galligan, R. F., & Crichley, C. R. (2011). Emotional intelligence and psychological resilience to negative life events. Personality and Individual Differences, 51(3), 331–336. [CrossRef]
- Balsamo, M. (2010). Anger and depression: Evidence of a possible mediating role for rumination. Psychological Reports, 106(1), 3–12. [CrossRef]
- Balsamo, M., & Saggino, A. (2007). Test per l'assessment della depressione nel contesto italiano: Un'analisi critica [Depression assessment questionnaires in the Italian context: A critical analysis]. Psicoterapia Cognitiva e Comportamentale, 13(2), 167–199. https://hdl.handle.net/11564/110634.
- Balsamo, M., & Saggino, A. (2013). TDI: Teate depression inventory: Manuale. Hogrefe.
- Balsamo, M., Giampaglia, G., & Saggino, A. (2014). Building a new Rasch-based self-report inventory of depression. Neuropsychiatric Disease and Treatment, 153–165. [CrossRef]
- Balsamo, M., Carlucci, L., Sergi, M. R., Klein Murdock, K., & Saggino, A. (2015). The mediating role of early maladaptive schemas in the relation between co-rumination and depression in young adults. PLoS One, 10(10), e0140177. [CrossRef]
- Batool, S. S., & Khalid, R. (2009). Low emotional intelligence: A risk factor for depression. Journal of Pakistan Psychiatric Society, 6(2), 65–72.
- Batselé, E., Stefaniak, N., & Fantini-Hauwel, C. (2019). Resting heart rate variability moderates the relationship between trait emotional competencies and depression. Personality and Individual Differences, 138, 69–74. [CrossRef]
- Bauld, R., & Brown, R. F. (2009). Stress, psychological distress, psychosocial factors, menopause symptoms and physical health in women. Maturitas, 62(2), 160–165. [CrossRef]
- Beach, S. R., & Whisman, M. A. (2012). Affective disorders. Journal of Marital and Family Therapy, 38(1), 201–219. [CrossRef]
- Beck, A. T., Steer, R. A., & Brown, G. (1996). Beck depression inventory–II [Database record]. APA PsycTests. [CrossRef]
- Bergh, D. V. D., Clyde, M. A., Gupta, A. R. K. N., de Jong, T., Gronau, Q. F., Marsman, M., ... Wagenmakers, E. J. (2021). A tutorial on Bayesian multi-model linear regression with BAS and JASP. Behavior Research Methods, 1–21.
- Bishop, C. M., & Tipping, M. E. (2003). Bayesian regression and classification. Nato Science Series sub Series III Computer And Systems Sciences, 190, 267–288.
- Borkovec, T. D., Robinson, E., Pruzinsky, T., & DePree, J. A. (1983). Preliminary exploration of worry: Some characteristics and processes. Behaviour Research and Therapy, 21(1), 9–16. [CrossRef]
- Calmes, C. A., & Roberts, J. E. (2007). Repetitive thought and emotional distress: Rumination and worry as prospective predictors of depressive and anxious symptomatology. Cognitive Therapy and Research, 31, 343–356. [CrossRef]
- Cenat, J. M., Farahi, S. M. M. M., Dalexis, R. D., Darius, W. P., Bekarkhanechi, F. M., Poisson, H., Broussard C., Ukwu G., Auguste E., Nguyen D. D., Sehabi G., Furyk S. E., Gedeon A. P., Onesi O., El Aouame A. M., Khodabocus S. N., Shah M. S., & Labelle, P. R. (2022). The global evolution of mental health problems during the COVID-19 pandemic: A systematic review and meta-analysis of longitudinal studies. Journal of Affective Disorders, 315, 70–95. [CrossRef]
- Chahal, R., Gotlib, I. H., & Guyer, A. E. (2020). Research Review: Brain network connectivity and the heterogeneity of depression in adolescence–a precision mental health perspective. Journal of Child Psychology and Psychiatry, 61(12), 1282–1298. [CrossRef]
- Ciarrochi, J., Deane, F. P., & Anderson, S. (2002). Emotional intelligence moderates the relationship between stress and mental health. Personality and Individual Differences, 32(2), 197–209. [CrossRef]
- Clark, L. A., & Watson, D. (1991). Tripartite model of anxiety and depression: Psychometric evidence and taxonomic implications. Journal of Abnormal Psychology, 100(3), 316–336. [CrossRef]
- Clarke, J. B., Ford, M., Heary, S., Rodgers, J., & Freeston, M. H. (2017). The relationship between negative problem orientation and worry: A meta-analytic review. Psychopathology Review, 4(3), 319–340. [CrossRef]
- Dar, K. A., Iqbal, N., & Mushtaq, A. (2017). Intolerance of uncertainty, depression, and anxiety: Examining the indirect and moderating effects of worry. Asian Journal of Psychiatry, 29, 129–133. [CrossRef]
- Davey, G. C., Hampton, J., Farrell, J., & Davidson, S. (1992). Some characteristics of worrying: Evidence for worrying and anxiety as separate constructs. Personality and Individual Differences, 13(2), 133–147.
- Davis, S. K., & Humphrey, N. (2012). Emotional intelligence predicts adolescent mental health beyond personality and cognitive ability. Personality and Individual Differences, 52(2), 144–149. [CrossRef]
- de Jong-Meyer, R., Beck, B., & Riede, K. (2009). Relationships between rumination, worry, intolerance of uncertainty and metacognitive beliefs. Personality and Individual Differences, 46(4), 547–551. [CrossRef]
- de Vito, A., Calamia, M., Greening, S., & Roye, S. (2019). The association of anxiety, depression, and worry symptoms on cognitive performance in older adults. Aging, Neuropsychology, and Cognition, 26(2), 161–173. [CrossRef]
- De Vlieger, P., Crombez, G., & Eccleston, C. (2006). Worrying about chronic pain: An examination of worry and problem solving in adults who identify as chronic pain sufferers. Pain, 120(1–2), 138–144. [CrossRef]
- Delhom, I., Gutierrez, M., Mayordomo, T., & Melendez, J. C. (2018). Does emotional intelligence predict depressed mood? A structural equation model with elderly people. Journal of Happiness Studies, 19, 1713–1726. [CrossRef]
- Di Fabio, A. (2011). Emotional Intelligence: New perspectives and applications. In Tech.
- Downey, L. A., Johnston, P. J., Hansen, K., Schembri, R., Stough, C., Tuckwell, V., & Schweitzer, I. (2008). The relationship between emotional intelligence and depression in a clinical sample. European Journal of Psychiatry, 22, 93–98. [CrossRef]
- Dugas, M. J., Freeston, M. H., & Ladouceur, R. (1997). Intolerance of uncertainty and problem orientation in worry. Cognitive Therapy and Research, 21, 593–606. [CrossRef]
- Dunson, D. B., Pillai, N., & Park, J. H. (2007). Bayesian density regression. Journal of the Royal Statistical Society Series B: Statistical Methodology, 69(2), 163–183. [CrossRef]
- Eisma, M. C., Boelen, P. A., Schut, H. A., & Stroebe, M. S. (2017). Does worry affect adjustment to bereavement? A longitudinal investigation. Anxiety, Stress, & Coping, 30(3), 243–252. [CrossRef]
- Extremera, N., & Fernández-Berrocal, P. (2006). Emotional intelligence as predictor of mental, social, and physical health in university students. The Spanish Journal of Psychology, 9(1), 45–51.
- Fergus, T. A., Valentiner, D. P., McGrath, P. B., Gier-Lonsway, S., & Jencius, S. (2013). The cognitive attentional syndrome: Examining relations with mood and anxiety symptoms and distinctiveness from psychological inflexibility in a clinical sample. Psychiatry Research, 210(1), 215–219. [CrossRef]
- Fernandez-Berrocal, P., Alcaide, R., Extremera, N., & Pizzarro, D. (2006). The role of emotional intelligence in anxiety and depression among adolescents. Individual Differences Research, 4, 16–27.
- Fernández-Berrocal, P., Salovey, P., Vera, A., Extremera, N., & Ramos, N. (2005). Cultural influences on the relation between perceived emotional intelligence and depression. International Review of Social Psychology, 18(1), 91–107.
- Gelman, A., Goodrich, B., Gabry, J., & Vehtari, A. (2019). R-squared for Bayesian regression models. The American Statistician, 1–3. [CrossRef]
- Gigantesco, A., Del Re, D., Cascavilla, I., Palumbo, G., De Mei, B., Cattaneo, C., Giovannelli, I., & Bella, A. (2015). A universal mental health promotion programme for young people in Italy. BioMed Research International, 2015, 345926. [CrossRef]
- Gilbert, R., Widom, C. S., Browne, K., Fergusson, D., Webb, E., & Janson, S. (2009). Burden and consequences of child maltreatment in high-income countries. The Lancet, 373(9657), 68–81.
- Girgus, J. S., & Yang, K. (2015). Gender and depression. Current Opinion in Psychology, 4, 53–60. [CrossRef]
- Gomez-Baya, D., Mendoza, R., Paino, S., & de Matos, M. G. (2017). Perceived emotional intelligence as a predictor of depressive symptoms during mid-adolescence: A two-year longitudinal study on gender differences. Personality and Individual Differences, 104, 303–312. [CrossRef]
- Goodwin, H., Yiend, J., & Hirsch, C. R. (2017). Generalized Anxiety Disorder, worry and attention to threat: A systematic review. Clinical Psychology Review, 54, 107–122. [CrossRef]
- Goring, H. J., & Papageorgiou, C. (2008). Rumination and worry: Factor analysis of self-report measures in depressed participants. Cognitive Therapy and Research, 32, 554–566. [CrossRef]
- Gravetter, F., & Wallnau, L. (2014). Essentials of Statistics for the Behavioral Sciences (8th ed.). Cengage Learning.
- Greenland, S. (2007). Bayesian perspectives for epidemiological research. II. Regression analysis. International Journal of Epidemiology, 36(1), 195–202.
- Gustavson, D. E., du Pont, A., Whisman, M. A., & Miyake, A. (2018). Evidence for transdiagnostic repetitive negative thinking and its association with rumination, worry, and depression and anxiety symptoms: A commonality analysis. Collabra: Psychology, 4(1), 13. [CrossRef]
- Heim, C., & Nemeroff, C. B. (2001). The role of childhood trauma in the neurobiology of mood and anxiety disorders: Preclinical and clinical studies. Biological Psychiatry, 49(12), 1023–1039.
- Hong, R. Y. (2007). Worry and rumination: Differential associations with anxious and depressive symptoms and coping behavior. Behaviour Research and Therapy, 45(2), 277–290. [CrossRef]
- Hughes, M. E., Alloy, L. B., & Cogswell, A. (2008). Repetitive thought in psychopathology: The relation of rumination and worry to depression and anxiety symptoms. Journal of Cognitive Psychotherapy, 22(3), 271–288. [CrossRef]
- Hwu, H. G., Chang, I. H., Yeh, E. K., Chang, C. J., & Yeh, L. L. (1996). Major depressive disorder in Taiwan defined by the Chinese diagnostic Interview Schedule. The Journal of Nervous and Mental Disease, 184(8), 497–502.
- Islam, M. R., & Adnan, R. (2017). Socio-demographic factors and their correlation with the severity of major depressive disorder: A population based study. World Journal of Neuroscience, 7(02), 193.
- Italian National Institute of Health. (2021). Sorveglianza PASSI. https://www.epicentro.iss.it/passi/dati/depressione.
- Italian National Institute of Health, Working Group "Consensus on Psychological Therapies for Anxiety and Depression". (2022, January). Consensus Conference on Psychological Therapies for Anxiety and Depression. Final Document. English Version. https://www.iss.it/documents/20126/0/Consensus_1_2022_EN.pdf.
- Jacobson, N. C., & Newman, M. G. (2017). Anxiety and depression as bidirectional risk factors in longitudinal studies: A meta-analysis of 66 longitudinal studies. Psychological Bulletin, 143(11), 1155–1200. [CrossRef]
- Jahangard, L., Haghighi, M., Bajoghli, H., Ahmadpanah, M., Ghaleiha, A., Zarrabian, M. K., & Brand, S. (2012). Training emotional intelligence improves both emotional intelligence and depressive symptoms in inpatients with borderline personality disorder and depression. International Journal of Psychiatry in Clinical Practice, 16(3), 197–204. [CrossRef]
- JASP Team. (2023). JASP (Version 0.18.1) [Computer Software]. https://jasp-stats.org/download/.
- Karajan, T. F., & Yalçın, B. M. (2009). The effects of an emotional intelligence skills training program on the emotional intelligence levels of Turkish university students. Eurasian Journal of Educational Research, 36, 193–208.
- Karim, J., & Weisz, R. (2010). Discriminant and concurrent validity of trait and ability emotional intelligence measures: A cross-cultural study. International Journal of Arts and Sciences, 3(14), 428–449.
- Kendler, K. S., Gatz, M., Gardner, C. O., & Pedersen, N. L. (2006). A Swedish national twin study of lifetime major depression. American Journal of Psychiatry, 163(1), 109–114.
- Kim, H. Y. (2013). Statistical notes for clinical researchers: Assessing normal distribution (2) using skewness and kurtosis. Restorative Dentistry & Endodontics, 38(1), 52.
- Knight, R. G. (1984). Some general population norms for the short form Beck Depression Inventory. Journal of Clinical Psychology, 40(3), 751–753.
- Korkmaz, S., Keleş, D. D., Kazgan, A., Baykara, S., Gürok, M. G., Demir, C. F., & Atmaca, M. (2020). Emotional intelligence and problem solving skills in individuals who attempted suicide. Journal of Clinical Neuroscience, 74, 120–123. [CrossRef]
- Kotsou, I., Mikolajczak, M., Heeren, A., Grégoire, J., & Leys, C. (2019). Improving emotional intelligence: A systematic review of existing work and future challenges. Emotion Review, 11(2), 151–165. [CrossRef]
- LeMoult, J., & Gotlib, I. H. (2019). Depression: A cognitive perspective. Clinical Psychology Review, 69, 51–66. [CrossRef]
- Liu, M., & Ren, S. (2018). Moderating effect of emotional intelligence on the relationship between rumination and anxiety. Current Psychology, 37, 272–279. [CrossRef]
- Llera, S. J., & Newman, M. G. (2010). Effects of worry on physiological and subjective reactivity to emotional stimuli in generalized anxiety disorder and nonanxious control participants. Emotion, 10(5), 640.
- Llera, S. J., & Newman, M. G. (2014). Rethinking the role of worry in generalized anxiety disorder: Evidence supporting a model of emotional contrast avoidance. Behavior Therapy, 45(3), 283–299.
- Lloyd, S. J., Malek-Ahmadi, M., Barclay, K., Fernandez, M. R., & Chartrand, M. S. (2012). Emotional intelligence (EI) as a predictor of depression status in older adults. Archives of Gerontology and Geriatrics, 55(3), 570–573. [CrossRef]
- Manfredi, C., Caselli, G., Rovetto, F., Rebecchi, D., Ruggiero, G. M., Sassaroli, S., & Spada, M. M. (2011). Temperament and parental styles as predictors of ruminative brooding and worry. Personality and Individual Differences, 50(2), 186–191. [CrossRef]
- Martins, A., Ramalho, N., & Morin, E. (2010). A comprehensive meta-analysis of the relationship between Emotion Intelligence and health. Personality and Individual Differences, 49, 554–564. [CrossRef]
- Maurer, D. M., Raymond, T. J., & Davis, B. N. (2018). Depression: Screening and diagnosis. American Family Physician, 98(8), 508–515.
- McEvoy, P. M., & Brans, S. (2013). Common versus unique variance across measures of worry and rumination: Predictive utility and mediational models for anxiety and depression. Cognitive Therapy and Research, 37(1), 183–196. [CrossRef]
- Mestre, J. M., Núñez-Lozano, J. M., Gómez-Molinero, R., Zayas, A., & Guil, R. (2017). Emotion regulation ability and resilience in a sample of adolescents from a suburban area. Frontiers in Psychology, 8, 1980.
- Meyer, T. J., Miller, M. L., Metzger, R. L., & Borkovec, T. D. (1990). Development and validation of the Penn State worry questionnaire. Behaviour Research and Therapy, 28(6), 487–495. [CrossRef]
- Miller, M. E., Borowski, S., & Zeman, J. L. (2020). Co-rumination moderates the relation between emotional competencies and depressive symptoms in adolescents: A longitudinal examination. Journal of Abnormal Child Psychology, 48, 851–863. [CrossRef]
- Minka, T. (2000). Bayesian linear regression [Technical report]. MIT.
- Moeller, R. W., Seehuus, M., & Peisch, V. (2020). Emotional intelligence, belongingness, and mental health in college students. Frontiers in Psychology, 11, 93. [CrossRef]
- Mourady, D., Richa, S., Karam, R., Papazian, T., Hajj Moussa, F., El Osta, N., Kesrouani, A., Jabbour, H., Hajj, A., & Rabbaa Khabbaz, L. (2017). Associations between quality of life, physical activity, worry, depression and insomnia: A cross-sectional designed study in healthy pregnant women. PLoS One, 12(5), e0178181. [CrossRef]
- Naragon-Gainey, K., McMahon, T. P., & Chacko, T. P. (2017). The structure of common emotion regulation strategies: A meta-analytic examination. Psychological Bulletin, 143(4), 384–427. [CrossRef]
- Newman, M. G., & Llera, S. J. (2011). A novel theory of experiential avoidance in generalized anxiety disorder: A review and synthesis of research supporting a contrast avoidance model of worry. Clinical Psychology Review, 31(3), 371–382. [CrossRef]
- Nielsen-Prohl, J., Saliger, J., Güldenberg, V., Breier, G., & Karbe, H. (2013). Stress-stimulated volitional coping competencies and depression in multiple sclerosis. Journal of Psychosomatic Research, 74(3), 221–226. [CrossRef]
- Nolen-Hoeksema, S. (2000). The role of rumination in depressive disorders and mixed anxiety/depressive symptoms. Journal of Abnormal Psychology, 109(3), 504–511. [CrossRef]
- Orth, U., Robins, R. W., & Roberts, B. W. (2008). Low self-esteem prospectively predicts depression in adolescence and young adulthood. Journal of Personality and Social Psychology, 95(3), 695–708. [CrossRef]
- Perini, S. J., Abbott, M. J., & Rapee, R. M. (2006). Perception of performance as a mediator in the relationship between social anxiety and negative post-event rumination. Cognitive Therapy and Research, 30, 645–659. [CrossRef]
- Petrides, K. V., & Furnham, A. (2000). On the dimensional structure of emotional intelligence. Personality and Individual Differences, 29(2), 313–320.
- Petrides, K. V., & Furnham, A. (2001). Trait emotional intelligence: Psychometric investigation with reference to established trait taxonomies. European Journal of Personality, 15(6), 425–448.
- Petrides, K. V., & Furnham, A. (2003). Trait emotional intelligence: Behavioural validation in two studies of emotion recognition and reactivity to mood induction. European Journal of Personality, 17(1), 39–57.
- Piccinelli, M., & Wilkinson, G. (2000). Gender differences in depression: Critical review. The British Journal of Psychiatry, 177(6), 486–492.
- Picconi, L., Sergi, M. R., Cataldi, F., Balsamo, M., Tommasi, M., & Saggino, A. (2019). Strumenti di assessment per l'intelligenza emotiva in psicoterapia: Un'analisi critica. Psicoterapia Cognitiva e Comportamentale, 25(2), 165–182. https://hdl.handle.net/11564/714263.
- Robichaud, M., & Dugas, M. J. (2005). Negative problem orientation (Part II): Construct validity and specificity to worry. Behaviour Research and Therapy, 43(3), 403–412. [CrossRef]
- Rood, L., Roelofs, J., Bögels, S. M., Nolen-Hoeksema, S., & Schouten, E. (2009). The influence of emotion-focused rumination and distraction on depressive symptoms in non-clinical youth: A meta-analytic review. Clinical Psychology Review, 29(7), 607–616. [CrossRef]
- Ruan-Iu, L., Pendergast, L. L., Liao, P. C., Jones, P., von der Embse, N., Innamorati, M., & Balsamo, M. (2023). Measuring depression in young adults: Preliminary development of an English version of the Teate Depression Inventory. International Journal of Environmental Research and Public Health, 20(15), 6470. [CrossRef]
- Saklofske, D. H., Austin, E. J., & Minski, P. S. (2003). Factor structure and validity of a trait emotional intelligence measure. Personality and Individual Differences, 34(4), 707–721. [CrossRef]
- Salk, R. H., Hyde, J. S., & Abramson, L. Y. (2017). Gender differences in depression in representative national samples: Meta-analyses of diagnoses and symptoms. Psychological Bulletin, 143(8), 783.
- Salguero, J. M., Extremera, N., & Fernández-Berrocal, P. (2012). Emotional intelligence and depression: The moderator role of gender. Personality and Individual Differences, 53(1), 29–32. [CrossRef]
- Salovey, P., & Mayer, J. D. (1990). Emotional intelligence. Imagination, Cognition and Personality, 9, 185–211. [CrossRef]
- Sánchez-Álvarez, N., Extremera, N., & Fernández-Berrocal, P. (2015). The relationship between emotional intelligence and subjective well-being in adolescents: A meta-analytic investigation. Journal of Adolescence, 93, 251–265. [CrossRef]
- Sarkisian, K. L., Van Hulle, C. A., & Hill Goldsmith, H. (2019). Brooding, inattention, and impulsivity as predictors of adolescent suicidal ideation. Journal of Abnormal Child Psychology, 47, 333–344. [CrossRef]
- Schaakxs, R., Comijs, H. C., van der Mast, R. C., Schoevers, R. A., Beekman, A. T., & Penninx, B. W. (2017). Risk factors for depression: Differential across age? The American Journal of Geriatric Psychiatry, 25(9), 966–977. [CrossRef]
- Schutte, N. S., & Malouff, J. M. (2011). Emotional intelligence mediates the relationship between mindfulness and subjective well-being. Personality and Individual Differences, 50(7), 1116–1119. [CrossRef]
- Schutte, N. S., Malouff, J. M., Hall, L. E., Haggerty, D. J., Cooper, J. T., Golden, C. J., & Dornheim, L. (1998). Development and validation of a measure of emotional intelligence. Personality and Individual Differences, 25(2), 167–177. [CrossRef]
- Segerstrom, S. C., Tsao, J. C., Alden, L. E., & Craske, M. G. (2000). Worry and rumination: Repetitive thought as a concomitant and predictor of negative mood. Cognitive Therapy and Research, 24, 671–688. [CrossRef]
- Sergi, M. R., Picconi, L., & Balsamo, M. (2012). Il ruolo dell'intelligenza emotiva nell'ansia e nella depressione: Uno studio preliminare. In M. Grieco & L. Tommasi (Eds.), Congresso nazionale delle sezioni, Chieti, 20–23 settembre 2012 (p. 155). Espress Edizioni srl.
- Sergi, M. R., Picconi, L., Fermani, A., Bongelli, R., Lezzi, S., Saggino, A., & Tommasi, M. (2023). The mediating role of positive and negative affect in the relationship between death anxiety and Italian students' perceptions of distance learning quality during the COVID-19 pandemic. Societies, 13(7), 163. [CrossRef]
- Sergi, M. R., Picconi, L., Tommasi, M., Saggino, A., Ebisch, S. J. H., & Spoto, A. (2021). The role of gender in the association among the emotional intelligence, anxiety and depression. Frontiers in Psychology, 12, 747702. [CrossRef]
- Sharif, F., Rezaie, S., Keshavarzi, S., Mansoori, P., & Ghadakpoor, S. (2013). Teaching emotional intelligence to intensive care unit nurses and their general health: A randomized clinical trial. The International Journal of Occupational and Environmental Medicine, 4(3), 141–148.
- Short, M. M., & Mazmanian, D. (2013). Perfectionism and negative repetitive thoughts: Examining a multiple mediator model in relation to mindfulness. Personality and Individual Differences, 55(6), 716–721. [CrossRef]
- Siegle, G. J., Moore, P. M., & Thase, M. E. (2004). Rumination: One construct, many features in healthy individuals, depressed individuals, and individuals with lupus. Cognitive Therapy and Research, 28, 645–668. [CrossRef]
- Slaski, M., & Cartwright, S. (2003). Emotional intelligence training and its implications for stress, health and performance. Stress and Health, 19(4), 233–239. [CrossRef]
- Sorg, S., Vögele, C., Furka, N., & Meyer, A. H. (2012). Perseverative thinking in depression and anxiety. Frontiers in Psychology, 3, 20. [CrossRef]
- Spinhoven, P., Drost, J., van Hemert, B., & Penninx, B. W. (2015). Common rather than unique aspects of repetitive negative thinking are related to depressive and anxiety disorders and symptoms. Journal of Anxiety Disorders, 33, 45–52. [CrossRef]
- Stordal, E., Mykletun, A., & Dahl, A. A. (2003). The association between age and depression in the general population: A multivariate examination. Acta Psychiatrica Scandinavica, 107(2), 132–141.
- Teicher, M. H., Samson, J. A., Anderson, C. M., & Ohashi, K. (2016). The effects of childhood maltreatment on brain structure, function and connectivity. Nature Reviews Neuroscience, 17(10), 652–666.
- Thapar, A., Eyre, O., Patel, V., & Brent, D. (2022). Depression in young people. The Lancet, 400(10352), 617–631. [CrossRef]
- The Lancet Regional Health–Europe. (2022). Protecting the mental health of youth. The Lancet Regional Health-Europe, 12, 100306. [CrossRef]
- Vandekerckhove, J., Rouder, J. N., & Kruschke, J. K. (2018). Bayesian methods for advancing psychological science. Psychonomic Bulletin & Review, 25, 1–4.
- Vickers, K. S., & Vogeltanz-Holm, N. D. (2003). The effects of rumination and distraction tasks on psychophysiological responses and mood in dysphoric and nondysphoric individuals. Cognitive Therapy and Research, 27, 331–348. [CrossRef]
- Vîslă, A., Stadelmann, C., Watkins, E., Zinbarg, R. E., & Flückiger, C. (2022). The relation between worry and mental health in nonclinical population and individuals with anxiety and depressive disorders: A meta-analysis. Cognitive Therapy and Research, 46(3), 480–501.
- Vucenovic, D., Sipek, G., & Jelic, K. (2023). The role of emotional skills (competence) and coping strategies in adolescent depression. European Journal of Investigation in Health, Psychology and Education, 13(3), 540–552. [CrossRef]
- Walton, V. A., Romans-Clarkson, S. E., Mullen, P. E., & Herbison, G. P. (1990). The mental health of elderly women in the community. International Journal of Geriatric Psychiatry, 5(4), 257–263.
- Wapaño, M. R. (2021). Emotional intelligence and mental health among adolescents. International Journal of Innovation Management, 5, 467–481.
- Watkins, E., & Baracaia, S. (2001). Why do people ruminate in dysphoric moods? Personality and Individual Differences, 30(5), 723–734. [CrossRef]
- Watkins, E. R., & Moulds, M. L. (2009). Thought control strategies, thought suppression, and rumination in depression. International Journal of Cognitive Therapy, 2(3), 235–251. [CrossRef]
- Weiss Wiesel, T. R., Nelson, C. J., Tew, W. P., Hardt, M., Mohile, S. G., Owusu, C., Klepin H. D., Gross C. P., Gajra A., Lichtman S. M., Ramani R., Katheria V., Zavala L., Hurria A., & Cancer Aging Research Group (CARG). (2015). The relationship between age, anxiety, and depression in older adults with cancer. Psycho-Oncology, 24(6), 712–717. [CrossRef]
- Wells, A. (1995). Meta-cognition and worry: A cognitive model of generalized anxiety disorder. Behavioural and Cognitive Psychotherapy, 23(3), 301–320.
- World Health Organization. (2022, March 2). COVID-19 pandemic triggers 25% increase in prevalence of anxiety and depression worldwide. Wake-up call to all countries to step up mental health services and support. https://www.who.int/news/item/02-03-2022-covid-19-pandemic-triggers-25-increase-in-prevalence-of-anxiety-and-depression-worldwide.
- Yalcin, B. M., Karahan, T. F., Ozcelik, M., & Igde, F. A. (2008). The effects of an emotional intelligence program on the quality of life and well-being of patients with type 2 diabetes mellitus. The Diabetes Educator, 34(6), 1013–1024. [CrossRef]
- Zysberg, L., & Zisberg, A. (2022). Days of worry: Emotional intelligence and social support mediate worry in the COVID-19 pandemic. Journal of Health Psychology, 27(2), 268–277. [CrossRef]
Figure 1.
Proposed Multilevel Model of Depression Risk.
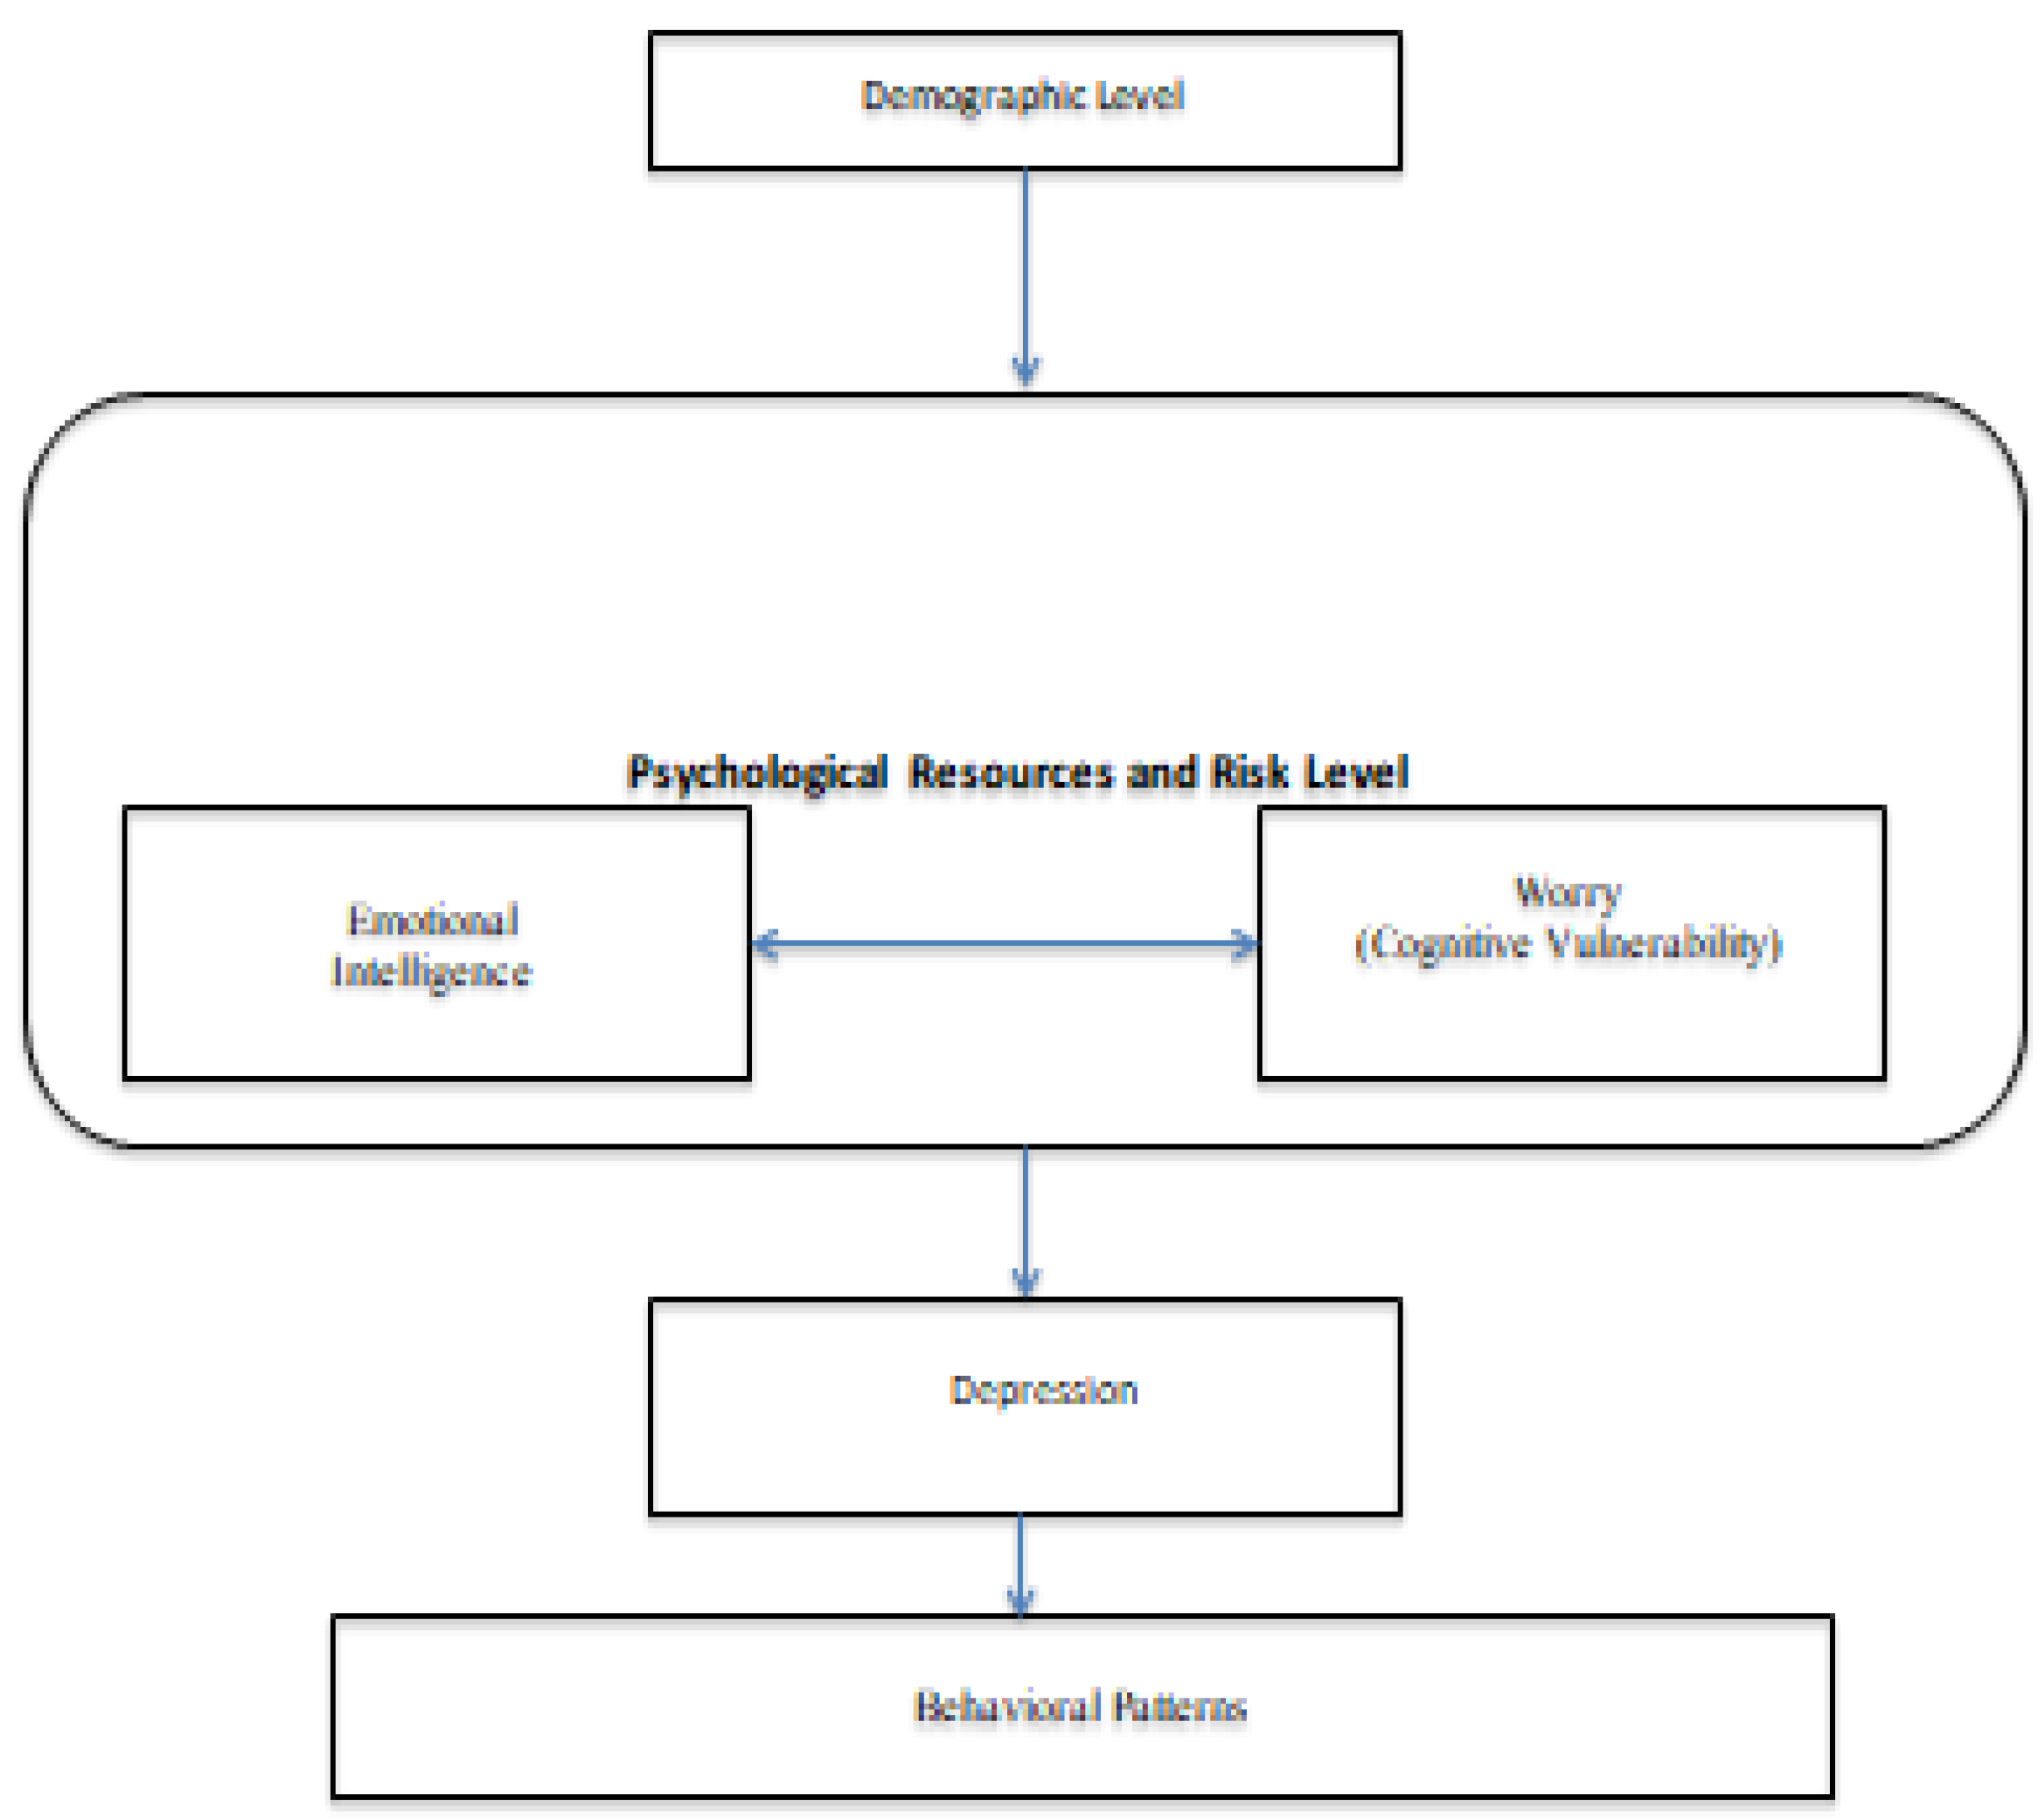

Table 1.
Mean, Standard Deviation, and Normality Indices of EIS dimensions, depression, and worry in total, non-clinical sample and subclinical sample with elevated depressive symptoms.
Table 1.
Mean, Standard Deviation, and Normality Indices of EIS dimensions, depression, and worry in total, non-clinical sample and subclinical sample with elevated depressive symptoms.
| Non-clinical sample (N=806) | Mean |
SD |
Skewness | Kurtosis |
| Evaluation and Expression of Emotion to Self | 35.403 | 4.544 | -0.510 | 0.516 |
| Evaluation and Expression of Emotion to Other | 22.247 | 3.782 | -0.407 | 0.102 |
| Social Skills | 14.701 | 2.906 | -0.277 | -0.255 |
| Optimism/Mood Regulation | 21.201 | 2.601 | -0.767 | 0.594 |
| Affective symptoms | 3.319 | 2.917 | 0.883 | 0.289 |
| Somatic symptoms | 4.536 | 3.197 | 0.532 | -0.060 |
| Worry | 47.744 | 10.585 | -0.056 | -0.087 |
| Subclinical sample with elevated depressive symptoms (N=118) | ||||
| Evaluation and Expression of Emotion to Self | 33.166 | 5.430 | -0.450 | 0.323 |
| Evaluation and Expression of Emotion to Other | 21.898 | 4.877 | -0.574 | -0.319 |
| Social Skills | 12.728 | 3.204 | 0.141 | -0.185 |
| Optimism/Mood Regulation | 20.010 | 3.296 | -1.002 | 1.420 |
| Affective symptoms | 13.129 | 4.173 | 0.707 | 0.602 |
| Somatic symptoms | 13.320 | 3.395 | -0.028 | -0.104 |
| Worry | 59.334 | 10.660 | -0.379 | -0.259 |
Table 2.
Zero-order Correlation Analysis among EIS dimensions, depression, and worry in both samples.
Table 2.
Zero-order Correlation Analysis among EIS dimensions, depression, and worry in both samples.
| Non-clinical sample (N=806) | 1. | 2. | 3. | 4. | 5. | 6. | 7. |
| 1. Evaluation and Expression of Emotion to Self |
|||||||
| 2. Evaluation and Expression of Emotion to Others |
.307*** | ||||||
| 3. Social Skills | .325*** | .338*** | |||||
| 4. Optimism/Mood Regulation | .506*** | .373*** | .269*** | ||||
| 5. Affettive symptoms | -.184*** | -.015 | -.127 *** | -.034 | |||
| 6. Somatic symptoms | -.081* | -.065 | -.154*** | -.002 | .456*** | ||
| 7. Worry | -.048 | -.042 | -.139*** | .110** | .363*** | .288*** | |
| Subclinical sample with elevated depressive symptoms (N=118) | 1. | 2. | 3. | 4. | 5. | 6. | 7. |
| 1. Expression and Evaluation of Emotion to Self |
|||||||
| 2. Evaluation and Expression of Emotion to Others |
.369*** | ||||||
| 3. Social Skills | .447*** | .365*** | |||||
| 4. Optimism/Mood Regulation | .513*** | .518*** | .314*** | ||||
| 5. Affective symptoms | -.117 | .151 | .001 | -.016 | |||
| 6. Somatic symptoms | -.202* | -.011 | -.150 | -.172 | .030 | ||
| 7. Worry | -.074 | .211* | -.088 | .083 | .189* | .201* |
Note.* p<.05; **p<.01; ***p<.001.
Table 3.
The best models from the Bayesian linear regression for Affective symptoms in the non-clinical sample.
Table 3.
The best models from the Bayesian linear regression for Affective symptoms in the non-clinical sample.
| Models in the female sample | p(M) | p(M|) | BFMj | BF01 | R² | ||||||
| Expression and Evaluation of Emotion to Self + Worry | .016 | .389 | 40.091 | 2.273×10⁻¹⁵ | .140 | ||||||
| Models in the male sample | p(M) | p(M|) | BFMj | BF01 | R² | ||||||
| Worry + Expression and Evaluation of Emotion to Self | .016 | 0.389 | 40.091 | 2.273×10⁻¹⁵ | .140 | ||||||
Note. p(M) = prior model probabilities; p(M | D) = posterior model probabilities; BFMj = the change from prior to posterior model odds; BF01 = Bayes factor of the best model; R² = the explained variance of each model.
Table 4.
Model averaged posterior summary for linear regression coefficients of the Affective symptoms in the non-clinical sample.
Table 4.
Model averaged posterior summary for linear regression coefficients of the Affective symptoms in the non-clinical sample.
| 95% Credible Interval | |||||||||||||||||||
| Coefficient in the female sample | p(incl) | P(excl) | p(incl|data) | BFinclusion | M | SD | Lower | Upper | |||||||||||
| Intercept | 1.000 | 0.000 | 1.000 | 1.000 | 3.638 | 0.124 | 3.394 | 3.875 | |||||||||||
| Worry | 0.500 | 0.500 | 0.997 | 361.156 | -0.119 | 0.030 | -0.179 | -0.062 | |||||||||||
| Expression and Evaluation of Emotion to Self | 0.500 | 0.500 | 0.283 | 0.395 | 0.015 | 0.030 | -6.906×10⁻⁴ | 0.099 | |||||||||||
| Evaluation and Expression of Emotion to Others | 0.500 | 0.500 | 0.161 | 0.192 | -0.005 | 0.022 | -0.070 | 0.025 | |||||||||||
| Social Skills | 0.500 | 0.500 | 0.131 | 0.150 | 0.001 | 0.023 | -0.042 | 0.069 | |||||||||||
| Optimism/Mood Regulation | 0.500 | 0.500 | 1.000 | 2.744×10+11 | 0.095 | 0.012 | 0.070 | 0.118 | |||||||||||
| Age | 0.500 | 0.500 | 0.284 | 0.397 | -0.005 | 0.010 | -0.032 | 1.107×10⁻⁴ | |||||||||||
| 95% Credible Interval | |||||||||||||||||||
| Coefficient in the male sample | p(incl) | p(excl) | p(incl|data) | BFinclusion | M | SD | Lower | Upper | |||||||||||
| Intercept | 1.000 | 0.000 | 1.000 | 1.000 | 3.638 | 0.124 | 3.388 | 3.856 | |||||||||||
| Worry | 0.500 | 0.500 | 1.000 | 2.744×10+11 | 0.095 | 0.012 | 0.071 | 0.117 | |||||||||||
| Expression and Evaluation of Emotion to Self | 0.500 | 0.500 | 0.997 | 361.156 | -0.119 | 0.030 | -0.176 | -0.065 | |||||||||||
| Evaluation and Expression of Emotion to Others | 0.500 | 0.500 | 0.283 | 0.395 | 0.015 | 0.030 | -0.002 | 0.088 | |||||||||||
| Social Skills | 0.500 | 0.500 | 0.161 | 0.192 | -0.005 | 0.022 | -0.070 | 0.016 | |||||||||||
| Optimism/Mood Regulation | 0.500 | 0.500 | 0.131 | 0.150 | 0.001 | 0.023 | -0.044 | 0.068 | |||||||||||
| Age | 0.500 | 0.500 | 0.284 | 0.397 | -0.005 | 0.010 | -0.030 | 0.000 | |||||||||||
Table 5.
The best models from the Bayesian linear regression for Somatic symptoms in the non-clinical sample.
Table 5.
The best models from the Bayesian linear regression for Somatic symptoms in the non-clinical sample.
| Models in the female sample | p(M) | p(M |) | BFMj | BF01 | R² | ||||||
| Worry | 0.016 | 0.237 | 19.529 | <.001 | 0.076 | ||||||
| Models in the male sample | p(M) | p(M |) | BFMj | BF01 | R² | ||||||
| Worry | 0.016 | 0.237 | 19.529 | 2.050×10⁻⁸ | 0.076 | ||||||
Note. p(M) = prior model probabilities; p(M | D) = posterior model probabilities; BFMj = the change from prior to posterior model odds;.
Table 6.
Model averaged posterior summary for linear regression coefficients of the Somatic symptoms in the non-clinical sample.
Table 6.
Model averaged posterior summary for linear regression coefficients of the Somatic symptoms in the non-clinical sample.
| 95% Credible Interval | |||||||||||||||||||
| Coefficient in the female sample | p(incl) | P(excl) | p(incl|data) | BFinclusion | M | SD | Lower | Upper | |||||||||||
| Intercept | 1.000 | 0.000 | 1.000 | 1.000 | 4.654 | 0.133 | 4.404 | 4.924 | |||||||||||
| Worry | 0.500 | 0.500 | 1.000 | 2.309×10+7 | 0.082 | 0.013 | 0.057 | 0.108 | |||||||||||
| Expression and Evaluation of Emotion to Self | 0.500 | 0.500 | 0.202 | 0.253 | -0.007 | 0.020 | -0.076 | 0.006 | |||||||||||
| Evaluation and Expression of Emotion to Others | 0.500 | 0.500 | 0.271 | 0.372 | -0.014 | 0.031 | -0.103 | 0.001 | |||||||||||
| Social Skills | 0.500 | 0.500 | 0.431 | 0.758 | -0.037 | 0.053 | -0.155 | 0.000 | |||||||||||
| Optimism/Mood Regulation | 0.500 | 0.500 | 0.153 | 0.181 | 0.005 | 0.028 | -0.033 | 0.085 | |||||||||||
| Age | 0.500 | 0.500 | 0.156 | 0.185 | 0.001 | 0.006 | -0.009 | 0.020 | |||||||||||
| 95% Credible Interval | |||||||||||||||||||
| Coefficient in the male sample | p(incl) | p(excl) | p(incl|data) | BFinclusion | M | SD | Lower | Upper | |||||||||||
| Intercept | 1.000 | 0.000 | 1.000 | 1.000 | 4.654 | 0.133 | 4.388 | 4.912 | |||||||||||
| Worry | 0.500 | 0.500 | 0.202 | 0.253 | -0.007 | 0.020 | -0.068 | 0.011 | |||||||||||
| Expression and Evaluation of Emotion to Self | 0.500 | 0.500 | 0.271 | 0.372 | -0.014 | 0.031 | -0.104 | 0.002 | |||||||||||
| Evaluation and Expression of Emotion to Others | 0.500 | 0.500 | 0.431 | 0.758 | -0.037 | 0.053 | -0.146 | 4.798×10⁻⁴ | |||||||||||
| Social Skills | 0.500 | 0.500 | 0.153 | 0.181 | 0.005 | 0.028 | -0.006 | 0.115 | |||||||||||
| Optimism/Mood Regulation | 0.500 | 0.500 | 0.156 | 0.185 | 0.001 | 0.006 | -0.007 | 0.019 | |||||||||||
| Age | 0.500 | 0.500 | 1.000 | 2.309×10+7 | 0.082 | 0.013 | 0.056 | 0.108 | |||||||||||
Note. p(incl) = the prior inclusion probability; p(incl|data) = the posterior inclusion probability; BFinclusion = the change from prior to posterior inclusion odds; M = posterior Mean of the parameter after model averaging; SD = posterior Standard deviation of the parameter after model averaging.
Table 7.
The best models from the Bayesian linear regression for Affective symptoms in the subclinical sample with elevated depressive symptoms.
Table 7.
The best models from the Bayesian linear regression for Affective symptoms in the subclinical sample with elevated depressive symptoms.
| Models in the female sample | p(M) | p(M|) | BFMj | BF01 | R² | ||||||
| Worry | 0.016 | 0.060 | 4.041 | 1.048 | 0.030 | ||||||
| Models in the male sample | p(M) | p(M|) | BFMj | BF01 | R² | ||||||
| Worry | 0.016 | 0.060 | 4.041 | 1.048 | 0.030 | ||||||
Note. p(M) = prior model probabilities; p(M | D) = posterior model probabilities; BFMj = the change from prior to posterior model odds; BF01 = Bayes factor of the best model; R² = the explained variance of each model.
Table 8.
Model averaged posterior summary for linear regression coefficients of the Affective symptoms in the subclinical sample with elevated depressive symptoms.
Table 8.
Model averaged posterior summary for linear regression coefficients of the Affective symptoms in the subclinical sample with elevated depressive symptoms.
| 95% Credible Interval | |||||||||||||||||||
| Coefficient in the female sample | p(incl) | P(excl) | p(incl|data) | BFinclusion | M | SD | Lower | Upper | |||||||||||
| Intercept | 1.000 | 0.000 | 1.000 | 1.000 | 13.219 | 0.386 | 12.396 | 13.918 | |||||||||||
| Worry | 0.500 | 0.500 | 0.519 | 1.081 | 0.028 | 0.037 | -0.007 | 0.109 | |||||||||||
| Expression and Evaluation of Emotion to Self | 0.500 | 0.500 | 0.535 | 1.151 | -0.064 | 0.081 | -0.246 | 0.001 | |||||||||||
| Evaluation and Expression of Emotion to Others | 0.500 | 0.500 | 0.503 | 1.011 | 0.065 | 0.089 | -0.026 | 0.259 | |||||||||||
| Social Skills | 0.500 | 0.500 | 0.260 | 0.352 | -0.002 | 0.067 | -0.194 | 0.147 | |||||||||||
| Optimism/Mood Regulation | 0.500 | 0.500 | 0.279 | 0.386 | -0.014 | 0.078 | -0.238 | 0.149 | |||||||||||
| Age | 0.500 | 0.500 | 0.374 | 0.598 | 0.015 | 0.030 | -0.013 | 0.093 | |||||||||||
| 95% Credible Interval | |||||||||||||||||||
| Coefficient in the male sample | p(incl) | p(excl) | p(incl|data) | BFinclusion | M | SD | Lower | Upper | |||||||||||
| Intercept | 1.000 | 0.000 | 1.000 | 1.000 | 13.219 | 0.386 | 12.476 | 13.958 | |||||||||||
| Worry | 0.500 | 0.500 | 0.535 | 1.151 | -0.064 | 0.081 | -0.248 | 0.016 | |||||||||||
| Expression and Evaluation of Emotion to Self | 0.500 | 0.500 | 0.503 | 1.011 | 0.065 | 0.089 | -0.015 | 0.256 | |||||||||||
| Evaluation and Expression of Emotion to Others | 0.500 | 0.500 | 0.260 | 0.352 | -0.002 | 0.067 | -0.205 | 0.161 | |||||||||||
| Social Skills | 0.500 | 0.500 | 0.279 | 0.386 | -0.014 | 0.078 | -0.306 | 0.115 | |||||||||||
| Optimism/Mood Regulation | 0.500 | 0.500 | 0.519 | 1.081 | 0.028 | 0.037 | -0.004 | 0.117 | |||||||||||
| Age | 0.500 | 0.500 | 0.374 | 0.598 | 0.015 | 0.030 | -0.018 | 0.093 | |||||||||||
Note. p(incl) = the prior inclusion probability; p(incl|data) = the posterior inclusion probability; BFinclusion = the change from prior to posterior inclusion odds; M = posterior Mean of the parameter after model averaging; SD = posterior Standard deviation of the parameter after model averaging.
Table 9.
The best models from the Bayesian linear regression for Somatic symptoms in the subclinical sample with elevated depressive symptoms.
Table 9.
The best models from the Bayesian linear regression for Somatic symptoms in the subclinical sample with elevated depressive symptoms.
| Models in the female sample | p(M) | p(M|) | BFMj | BF01 | R² | ||||||
| Worry +Expression and Evaluation of Emotion to Self + Age | 0.016 | 0.103 | 7.264 | 0.064 | 0.128 | ||||||
| Models in the male sample | p(M) | p(M|) | BFMj | BF01 | R² | ||||||
| Expression and Evaluation of Emotion to Self+ Worry + Age | 0.016 | 0.103 | 7.264 | 0.064 | 0.128 | ||||||
Note. p(M) = prior model probabilities; p(M | D) = posterior model probabilities; BFMj = the change from prior to posterior model odds; BF01 = Bayes factor of the best model; R² = the explained variance of each model.
Table 10.
Model averaged posterior summary for linear regression coefficients of the Somatic symptoms in the subclinical sample with elevated depressive symptoms.
Table 10.
Model averaged posterior summary for linear regression coefficients of the Somatic symptoms in the subclinical sample with elevated depressive symptoms.
| 95% Credible Interval | |||||||||||||||||||
| Coefficient in the female sample | p(incl) | P(excl) | p(incl|data) | BFinclusion | M | SD | Lower | Upper | |||||||||||
| Intercept | 1.000 | 0.000 | 1.000 | 1.000 | 13.363 | 0.307 | 12.731 | 13.906 | |||||||||||
| Worry | 0.500 | 0.500 | 0.724 | 2.628 | 0.041 | 0.035 | 0.000 | 0.103 | |||||||||||
| Expression and Evaluation of Emotion to Self | 0.500 | 0.500 | 0.614 | 1.588 | -0.067 | 0.073 | -0.213 | 0.009 | |||||||||||
| Evaluation and Expression of Emotion to Others | 0.500 | 0.500 | 0.292 | 0.412 | 0.012 | 0.044 | -0.048 | 0.158 | |||||||||||
| Social Skills | 0.500 | 0.500 | 0.422 | 0.731 | -0.054 | 0.094 | -0.302 | 0.023 | |||||||||||
| Optimism/Mood Regulation | 0.500 | 0.500 | 0.445 | 0.803 | -0.062 | 0.102 | -0.308 | 0.038 | |||||||||||
| Age | 0.500 | 0.500 | 0.733 | 2.741 | 0.046 | 0.038 | -0.002 | 0.114 | |||||||||||
| 95% Credible Interval | |||||||||||||||||||
| Coefficient in the male sample | p(incl) | p(excl) | p(incl|data) | BFinclusion | M | SD | Lower | Upper | |||||||||||
| Intercept | 1.000 | 0.000 | 1.000 | 1.000 | 13.363 | 0.307 | 12.699 | 13.930 | |||||||||||
| Worry | 0.500 | 0.500 | 0.614 | 1.588 | -0.067 | 0.073 | -0.213 | 0.000 | |||||||||||
| Expression and Evaluation of Emotion to Self | 0.500 | 0.500 | 0.292 | 0.412 | 0.012 | 0.044 | -0.056 | 0.141 | |||||||||||
| Evaluation and Expression of Emotion to Others | 0.500 | 0.500 | 0.422 | 0.731 | -0.054 | 0.094 | -0.288 | 0.027 | |||||||||||
| Social Skills | 0.500 | 0.500 | 0.445 | 0.803 | -0.062 | 0.102 | -0.341 | 0.036 | |||||||||||
| Optimism/Mood Regulation | 0.500 | 0.500 | 0.724 | 2.628 | 0.041 | 0.035 | -9.757×10⁻⁴ | 0.103 | |||||||||||
| Age | 0.500 | 0.500 | 0.733 | 2.741 | 0.046 | 0.038 | -2.492×10⁻⁴ | 0.116 | |||||||||||
Note. p(incl) = the prior inclusion probability; p(incl|data) = the posterior inclusion probability; BFinclusion = the change from prior to posterior inclusion odds; M = posterior Mean of the parameter after model averaging; SD = posterior Standard deviation of the parameter after model averaging.
Table 11.
Welch’s ANOVA with corresponding p values for testing samples differences between EIS dimensions, Affective and Somatic symptoms, and worry.
Table 11.
Welch’s ANOVA with corresponding p values for testing samples differences between EIS dimensions, Affective and Somatic symptoms, and worry.
| Variable | Welch’s F | df₁ | df₂ | p-value |
|---|---|---|---|---|
| Expression and Evaluation of Emotion to Self |
18.169 | 1 | 141.996 | < .001 |
| Evaluation and Expression of Emotion to Others |
0.556 | 1 | 138.354 | .457 |
| Social Skills | 39.935 | 1 | 146.583 | < .001 |
| Optimism / Mood Regulation | 14.125 | 1 | 139.133 | < .001 |
| BDI Affective | 898.613 | 1 | 139.144 | < .001 |
| BDI Somatic | 573.732 | 1 | 152.655 | < .001 |
| Worry | 121.900 | 1 | 152.755 | < .001 |
Disclaimer/Publisher’s Note: The statements, opinions and data contained in all publications are solely those of the individual author(s) and contributor(s) and not of MDPI and/or the editor(s). MDPI and/or the editor(s) disclaim responsibility for any injury to people or property resulting from any ideas, methods, instructions or products referred to in the content. |
© 2025 by the authors. Licensee MDPI, Basel, Switzerland. This article is an open access article distributed under the terms and conditions of the Creative Commons Attribution (CC BY) license (http://creativecommons.org/licenses/by/4.0/).
Copyright: This open access article is published under a Creative Commons CC BY 4.0 license, which permit the free download, distribution, and reuse, provided that the author and preprint are cited in any reuse.


