Submitted:
17 October 2025
Posted:
20 October 2025
You are already at the latest version
Abstract
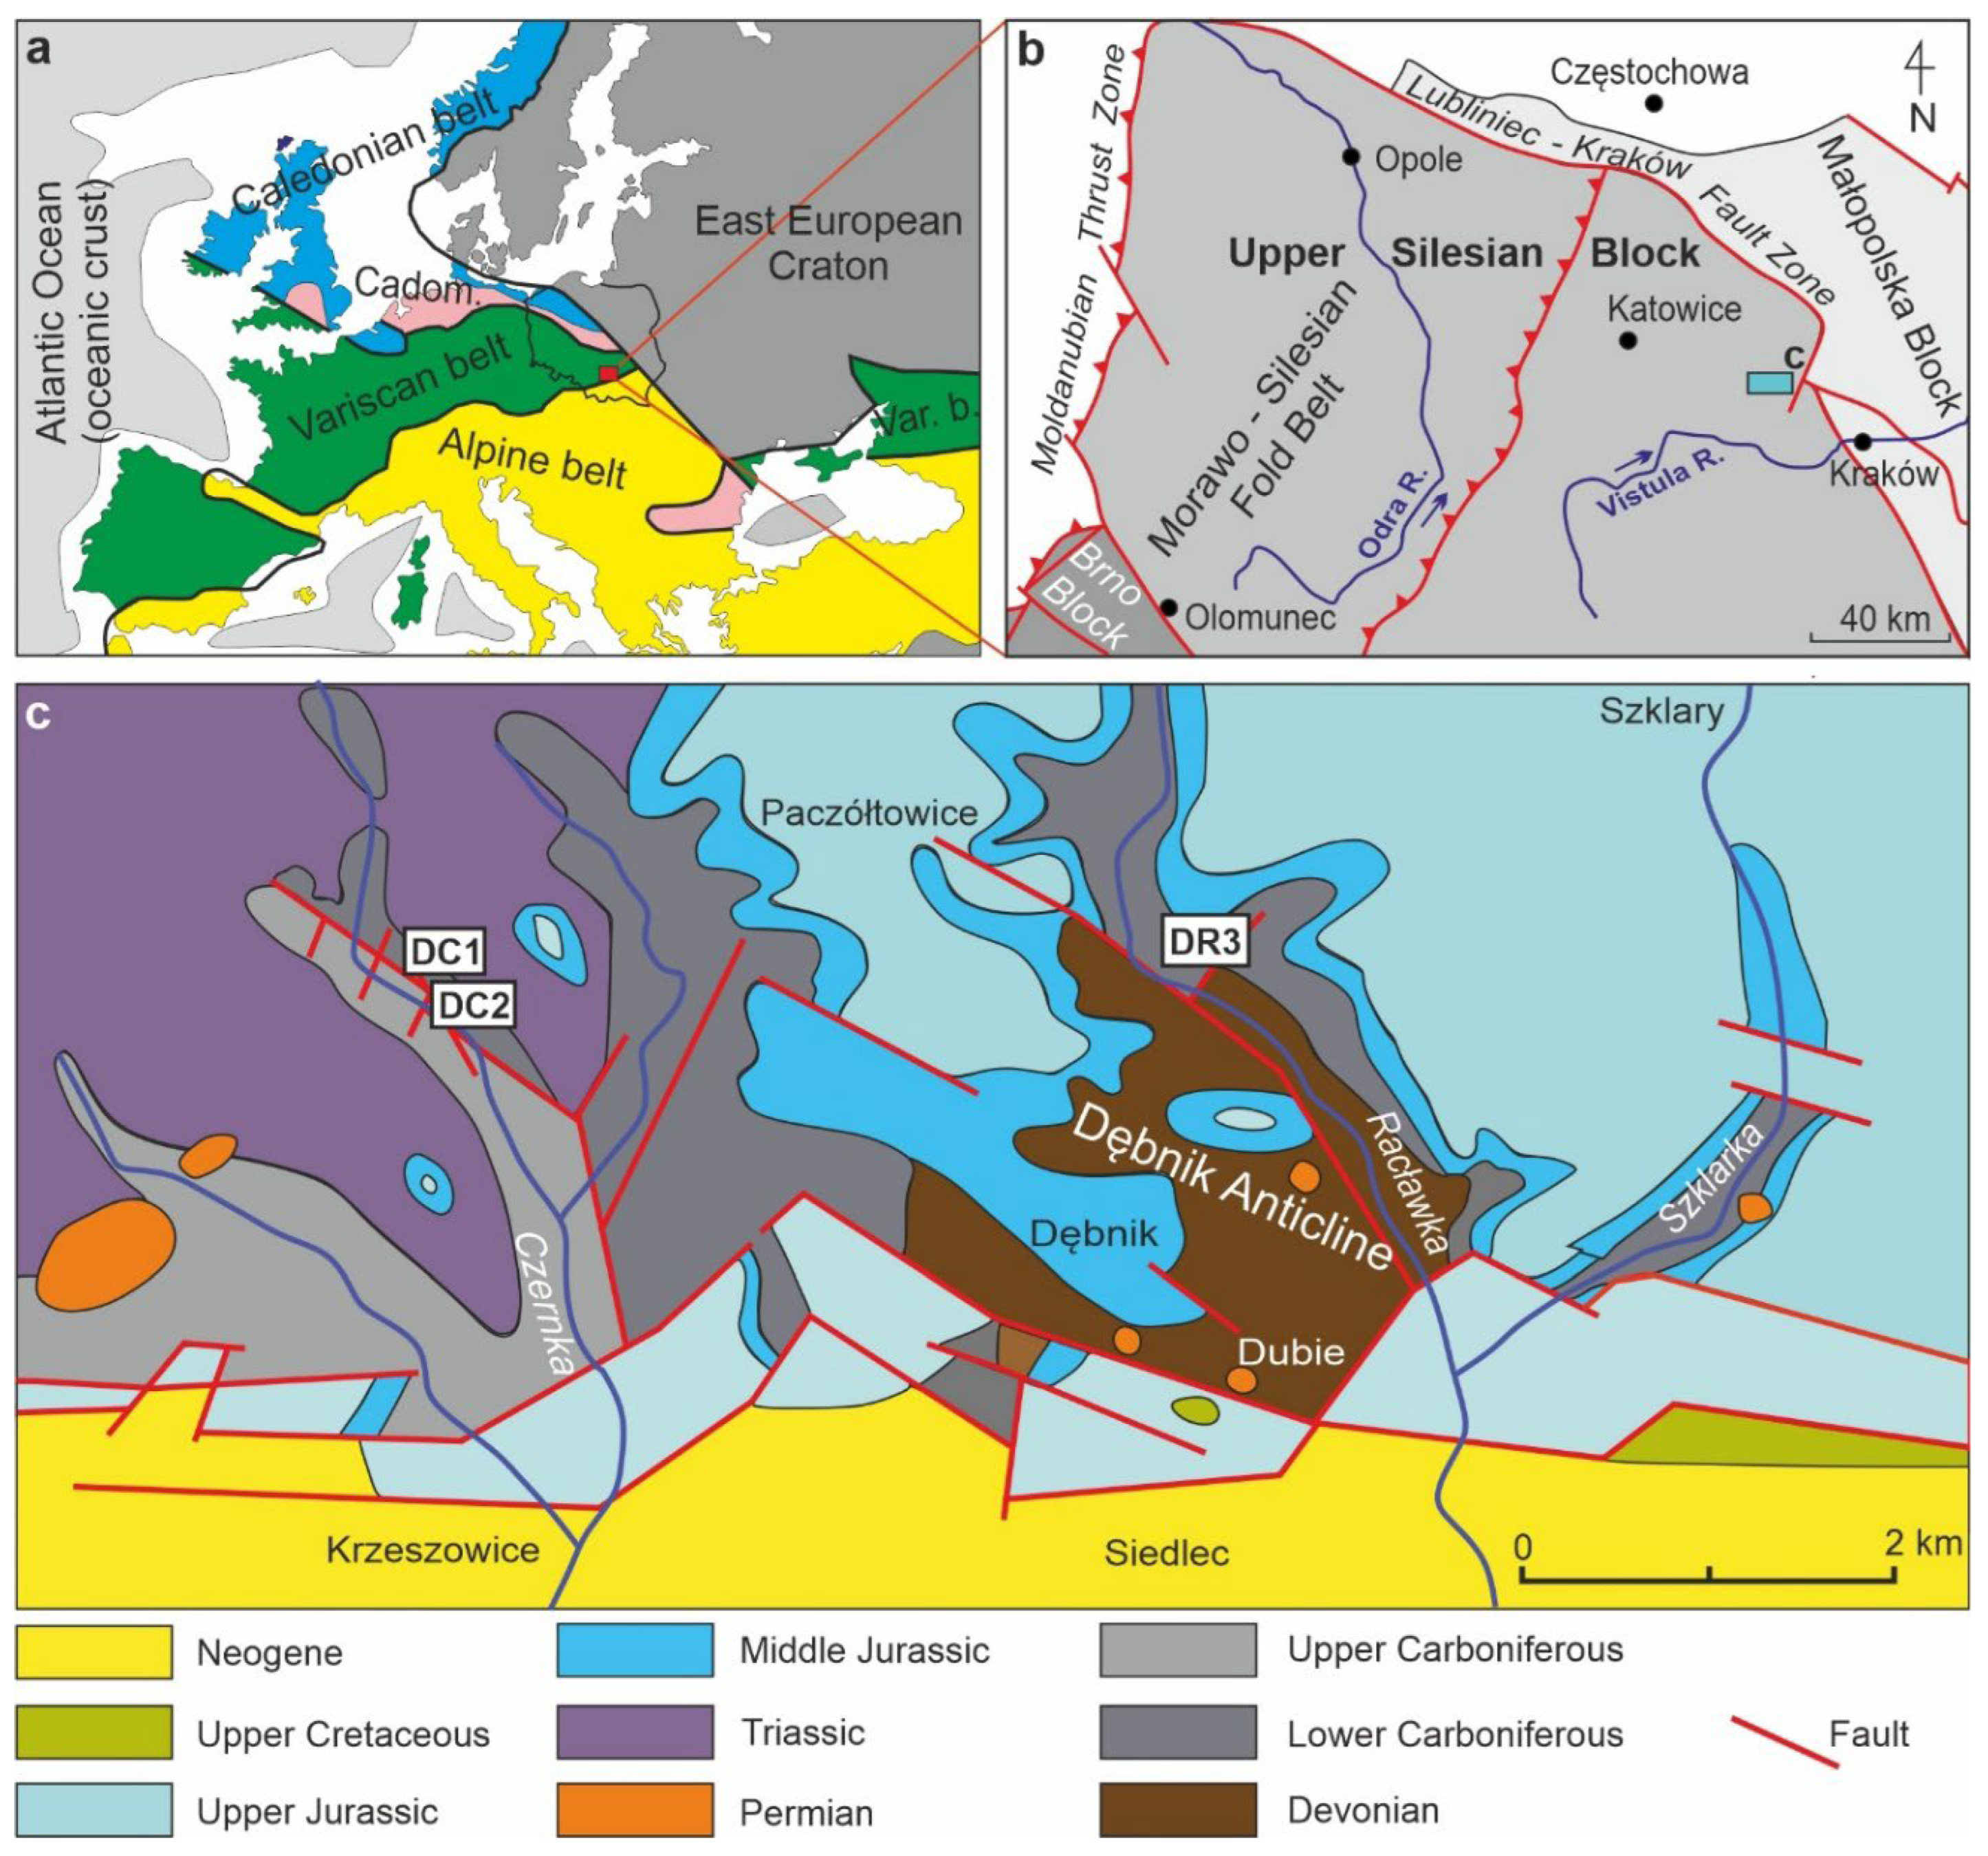
Structures resembling iron-related bacteria (IRB) have been found in the Lower Carboniferous limestones that form a part of the carbonate platform in the Moravo-Silesian Basin that surrounds the Upper Silesian Block, an eastern margin of the Brunovistulicum microcontinent. Microfacial, petrological, and geochemical analyses were used to determine the bacteria-like structures which are present in narrow zones unrelated to bedding. We present here morphology and chemistry of the studied microstructures showing their similarities to IRB from the present-day Sphaerotilus-Leptothrix group, the Galionella group, and the species Mariprofundus ferrooxydans. We suggest that bacterial growth occurred in the originally empty micropores of microfossil skeletons and shells, between bioclasts or in secondary voids formed during the selective dissolution of micrite or smaller sparite crystals. Hydrothermal solutions, associated probably with the post-Variscan magmatism in this area, provided iron compounds for the growth of the IRB.
Keywords:
1. Introduction
2. Geological Setting
3. Material and Methods
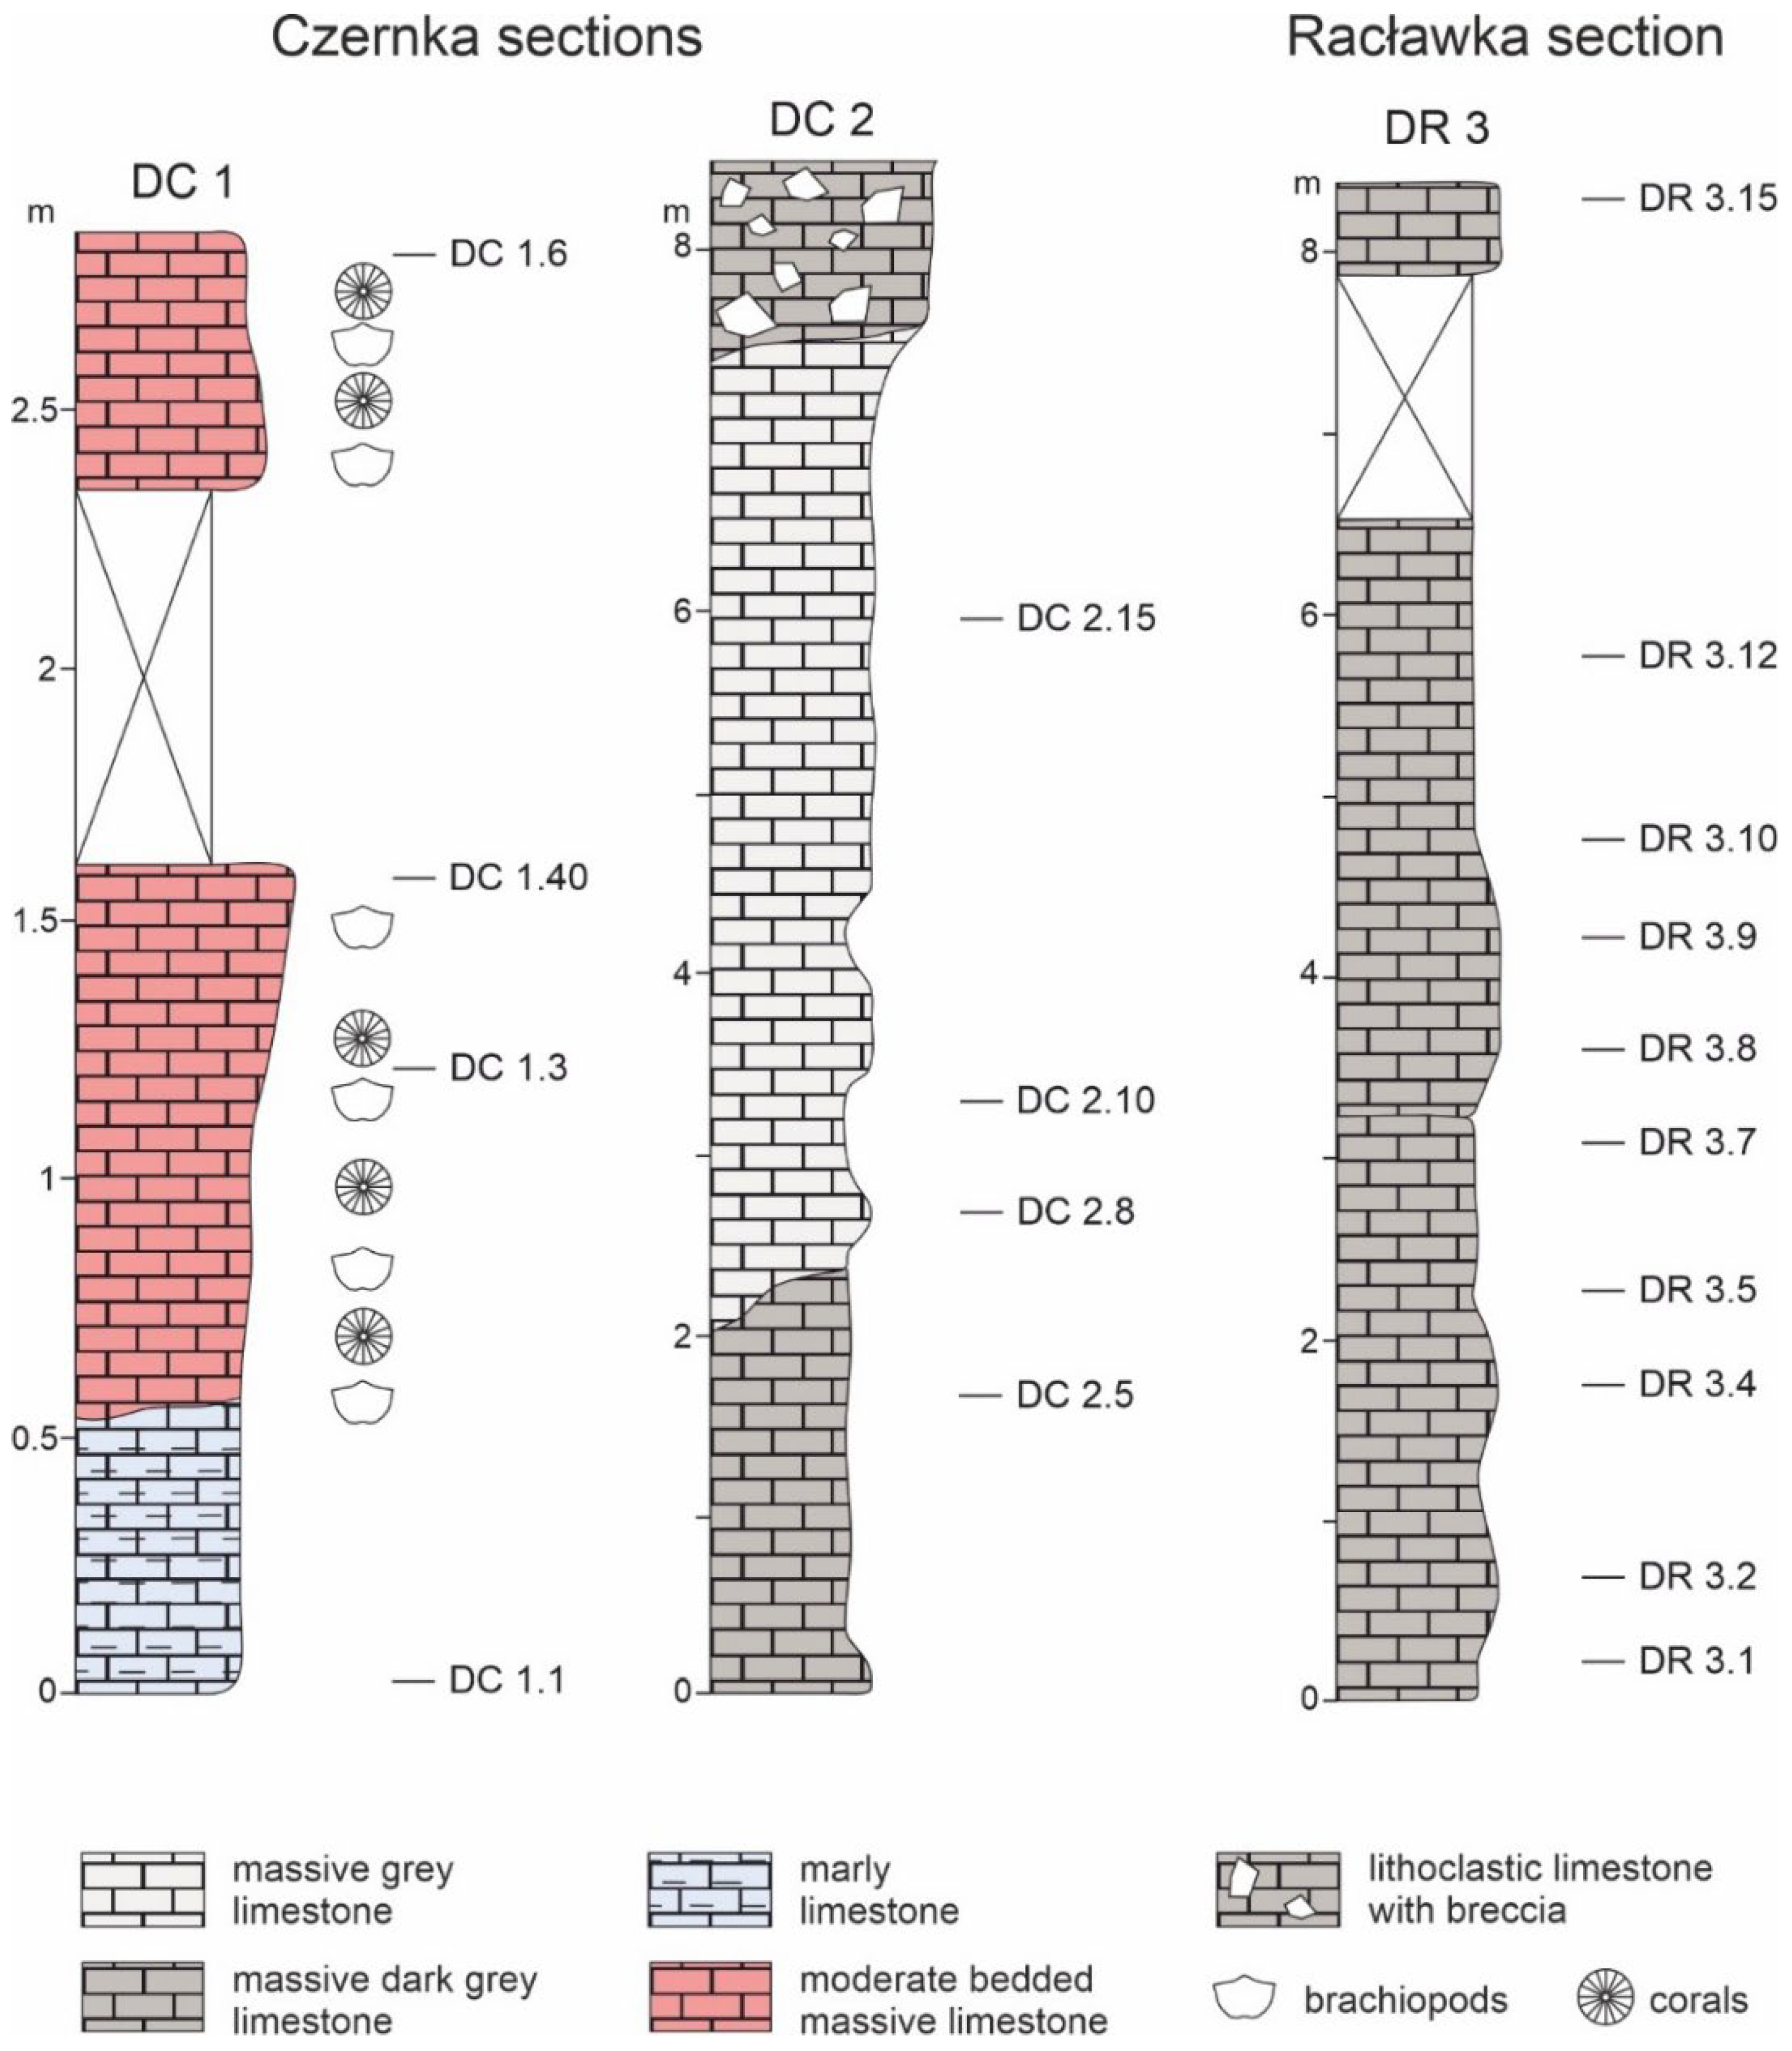
3.1. Sampling
3.2. Petrology and Geochemistry Studies
4. Results
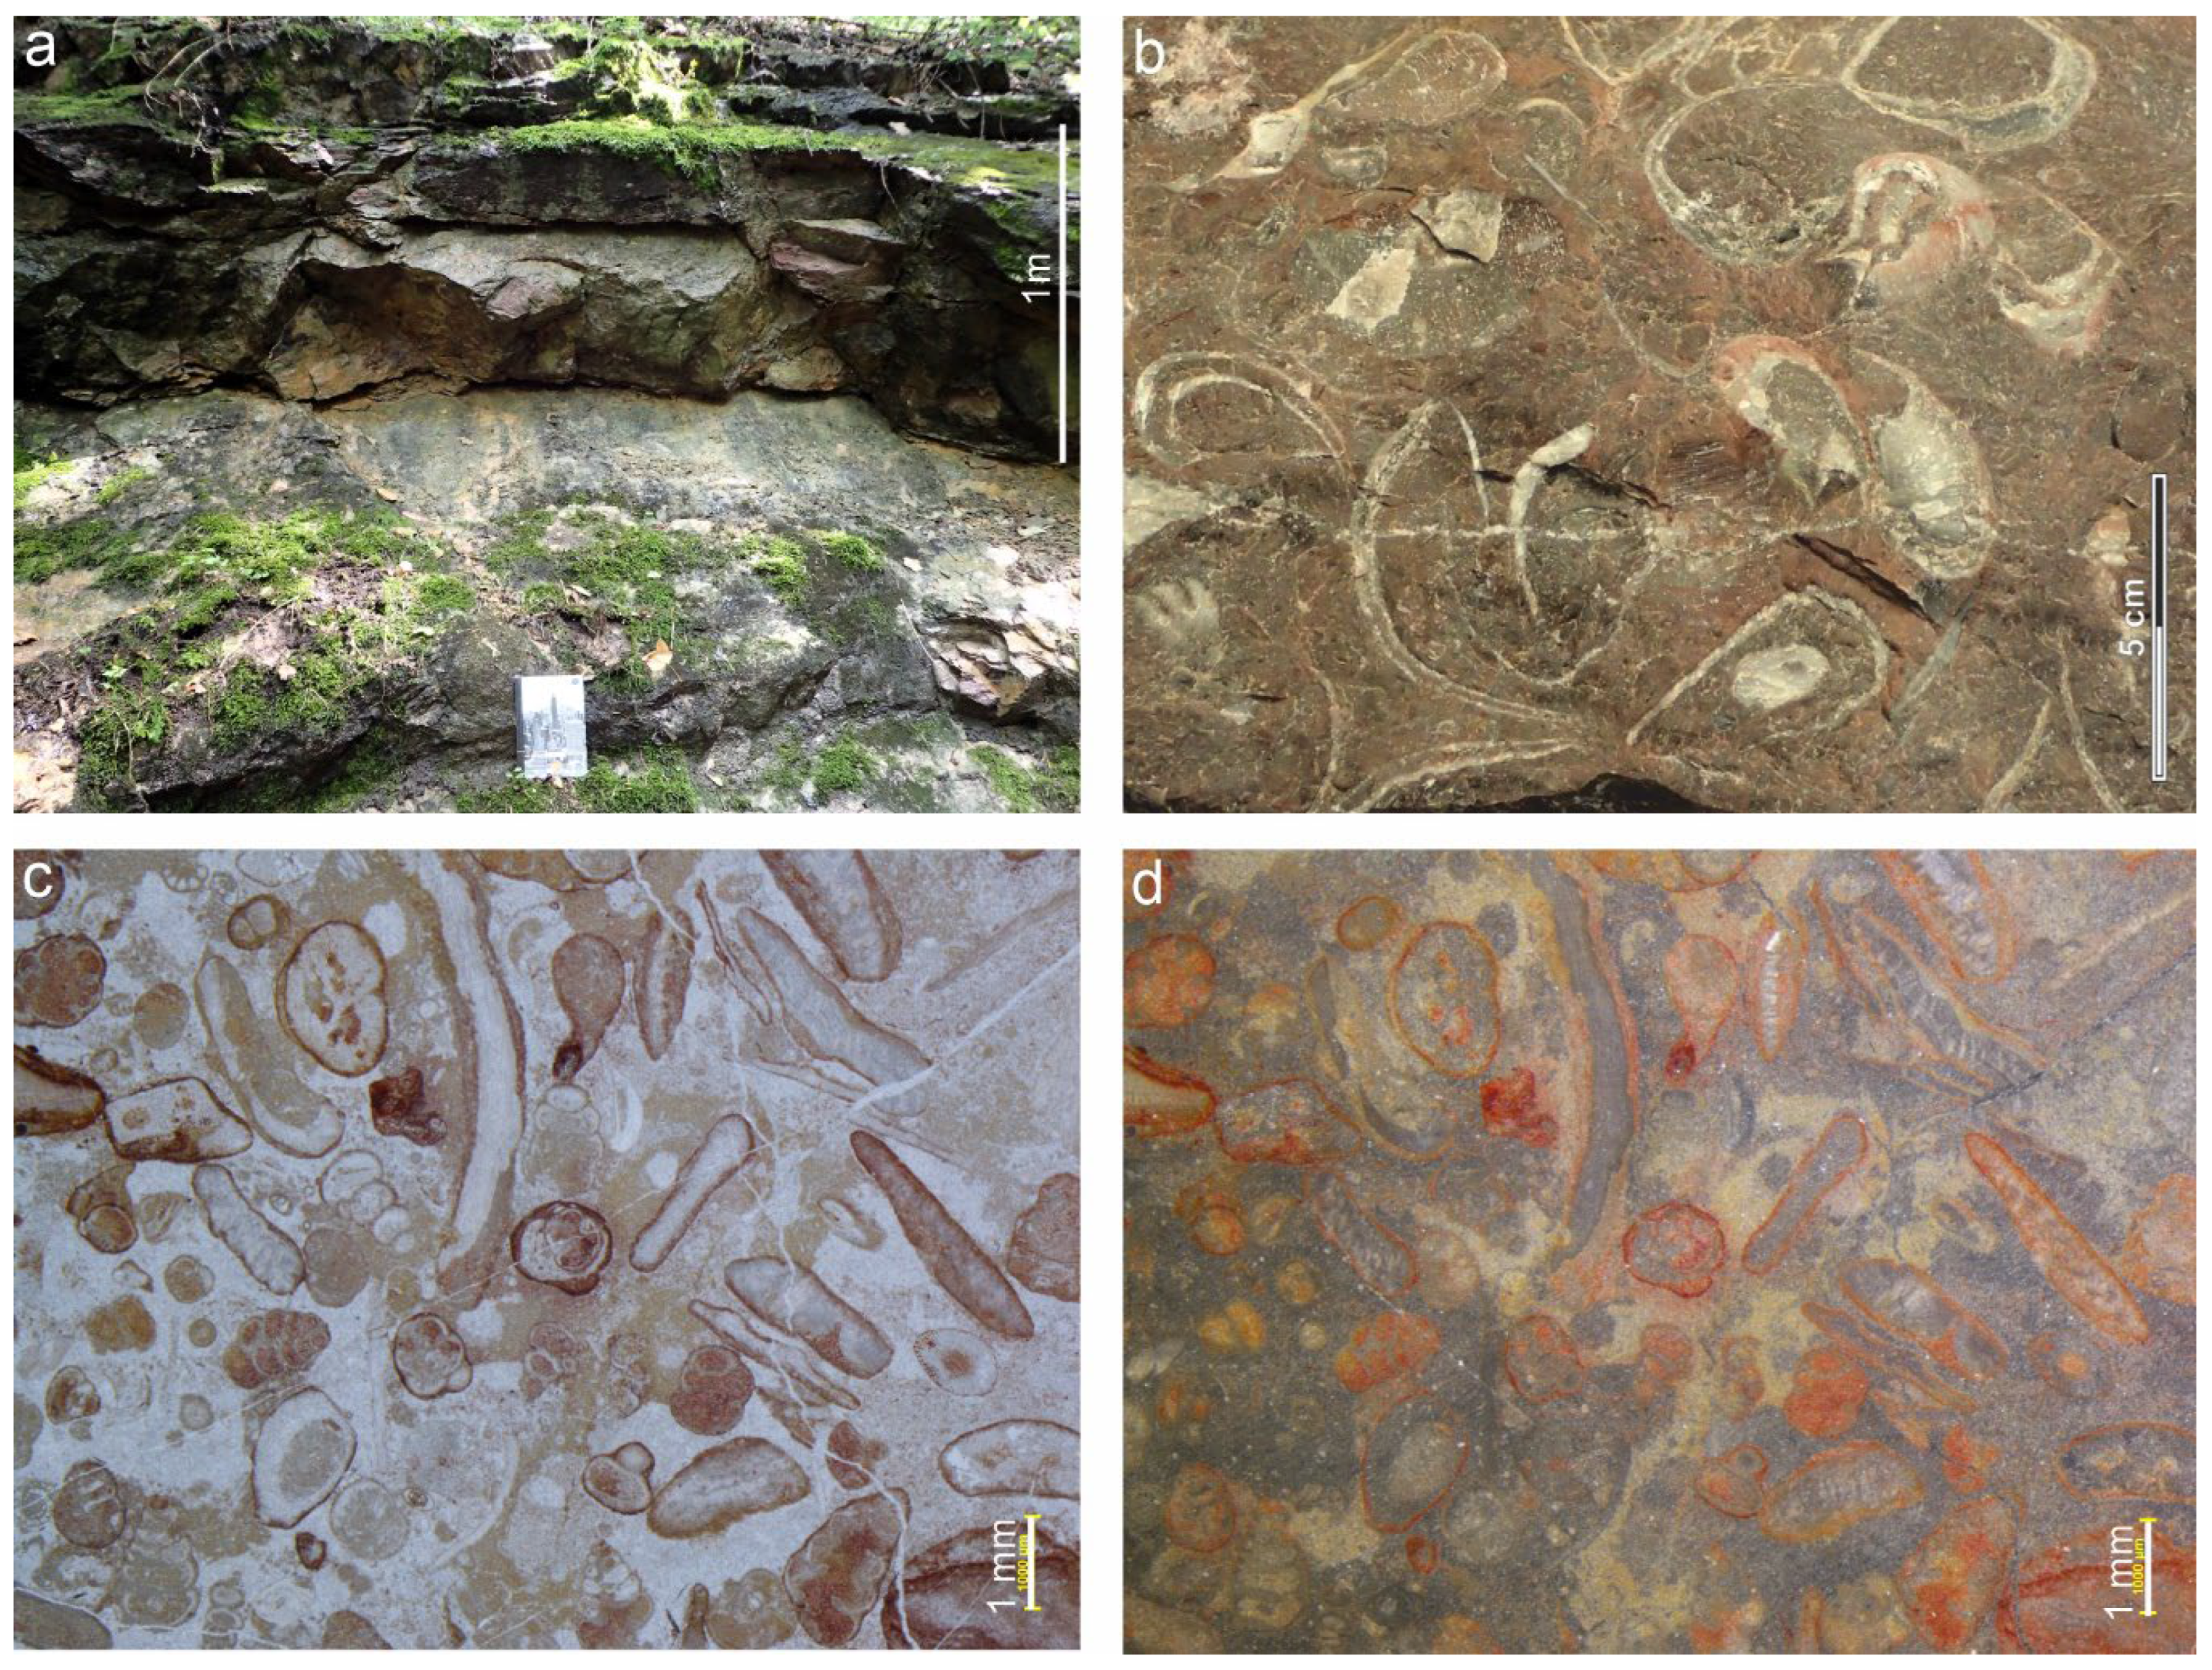
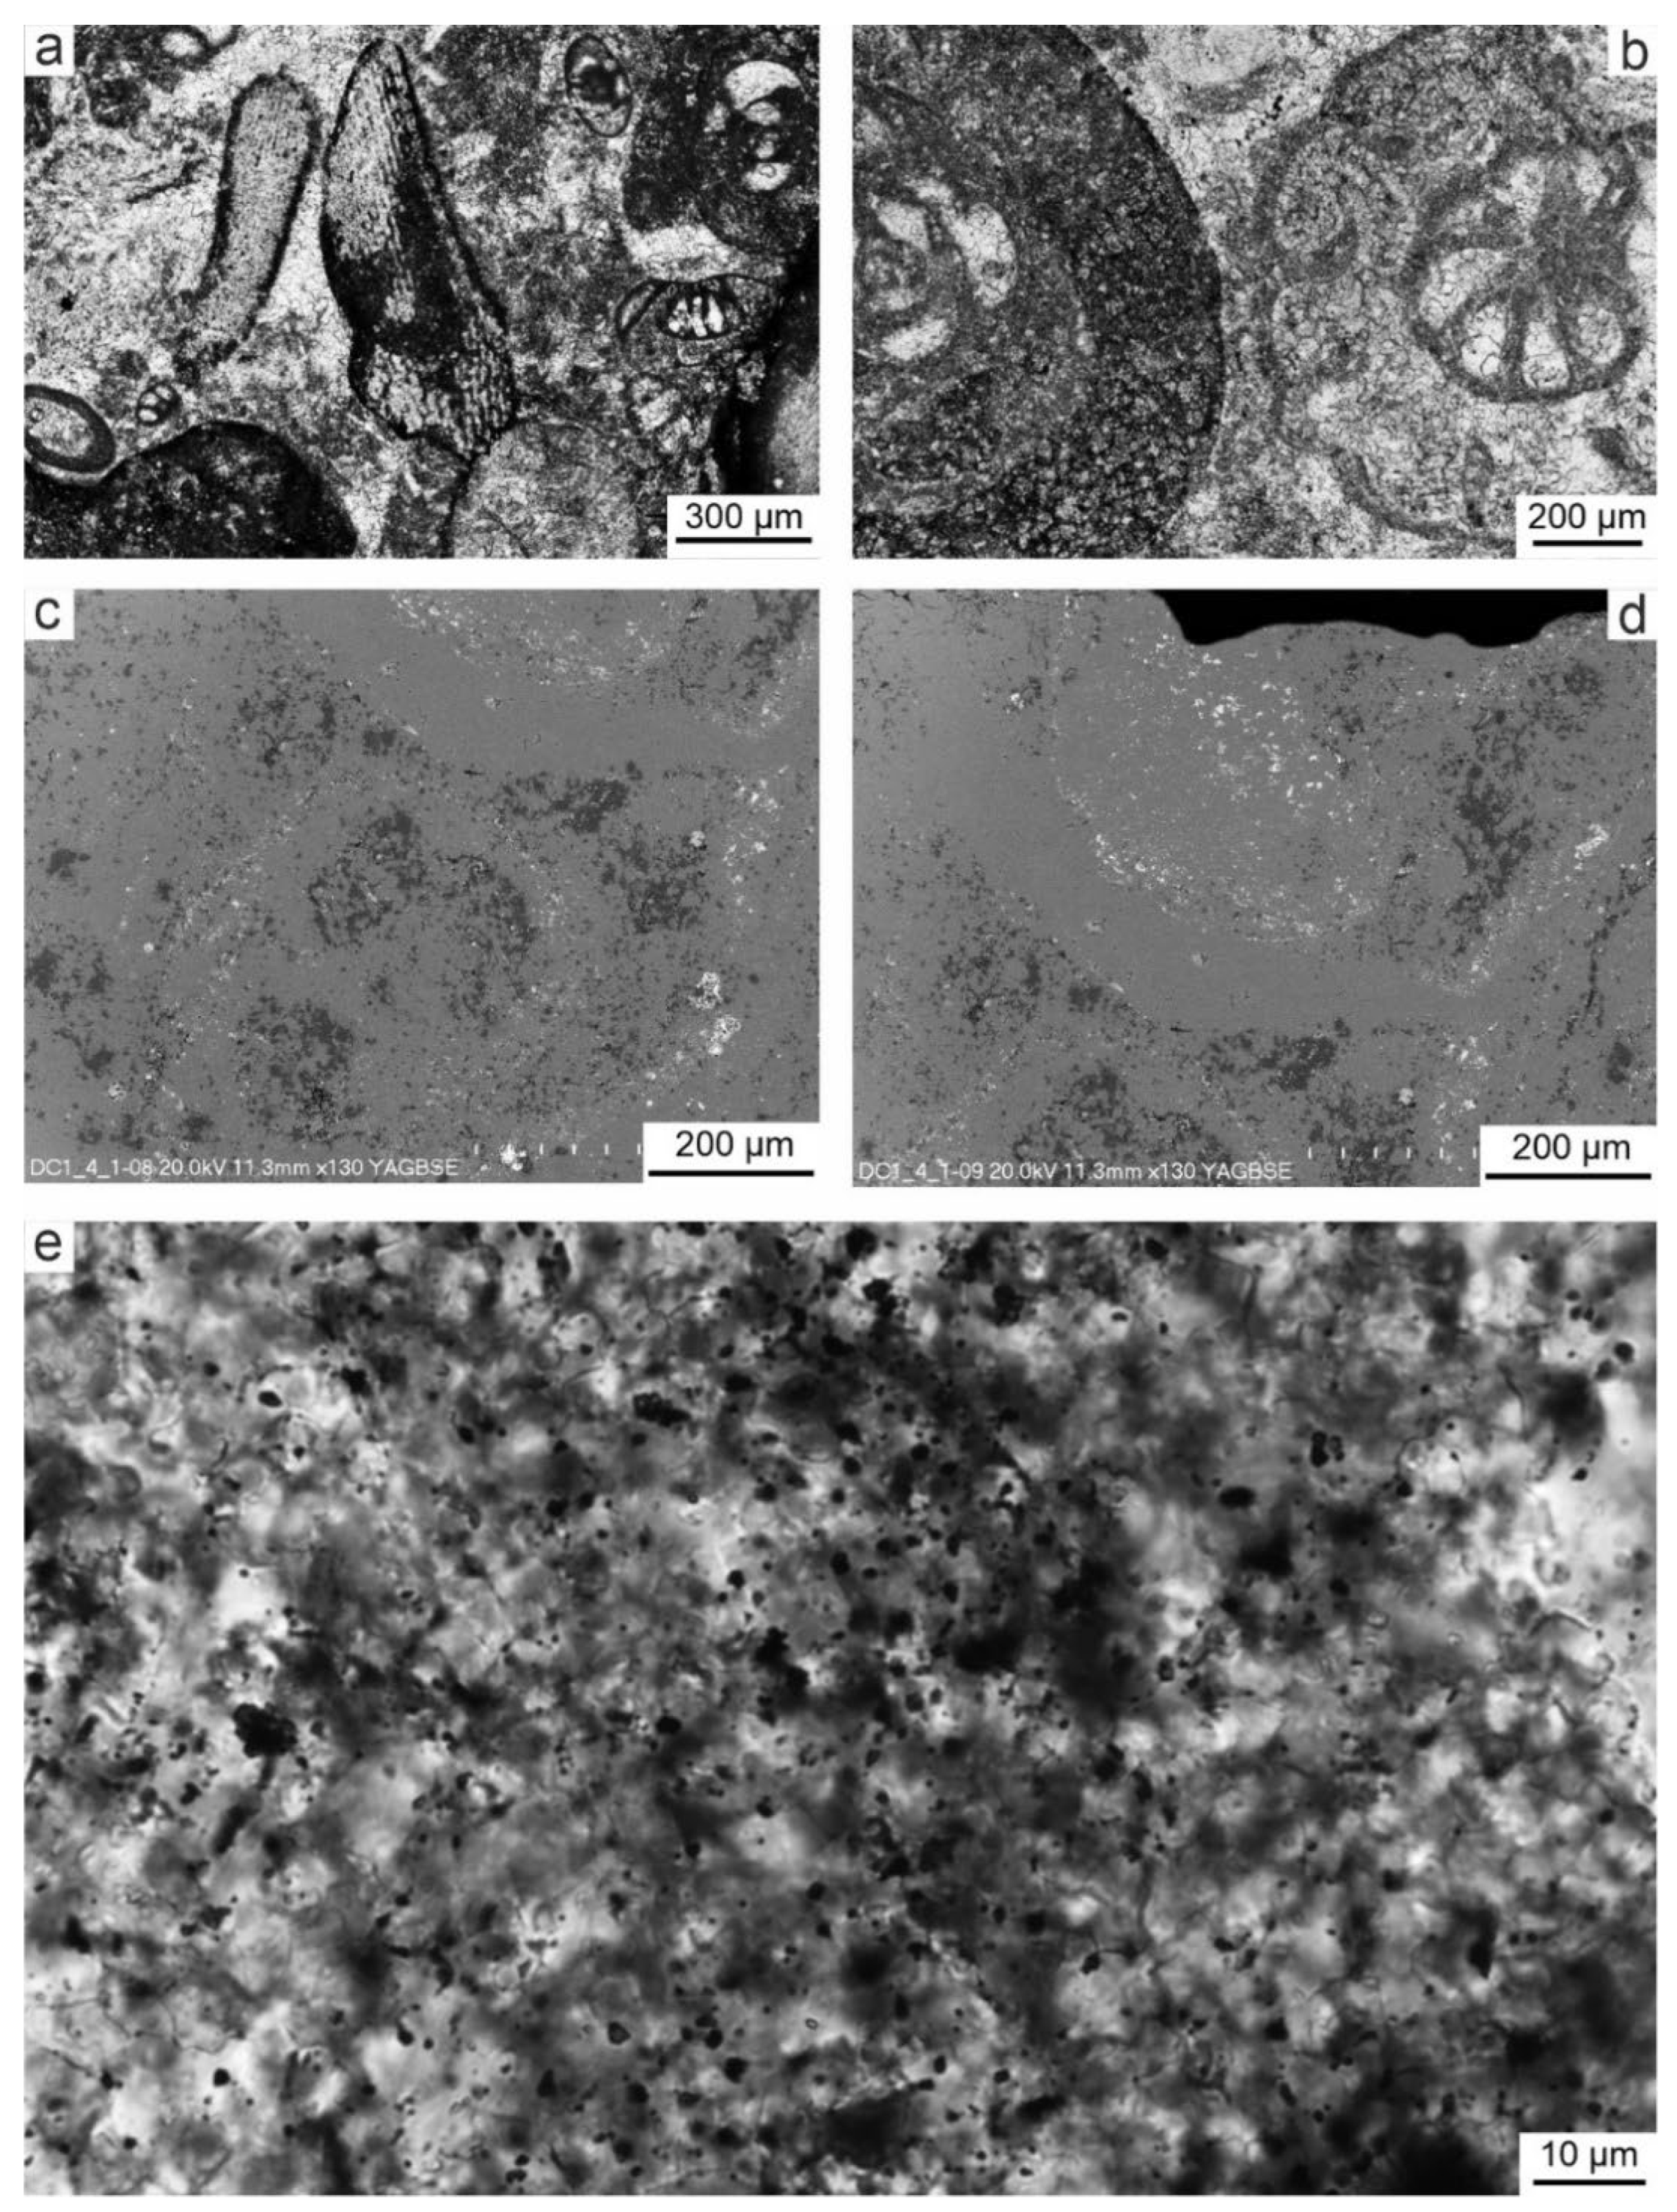
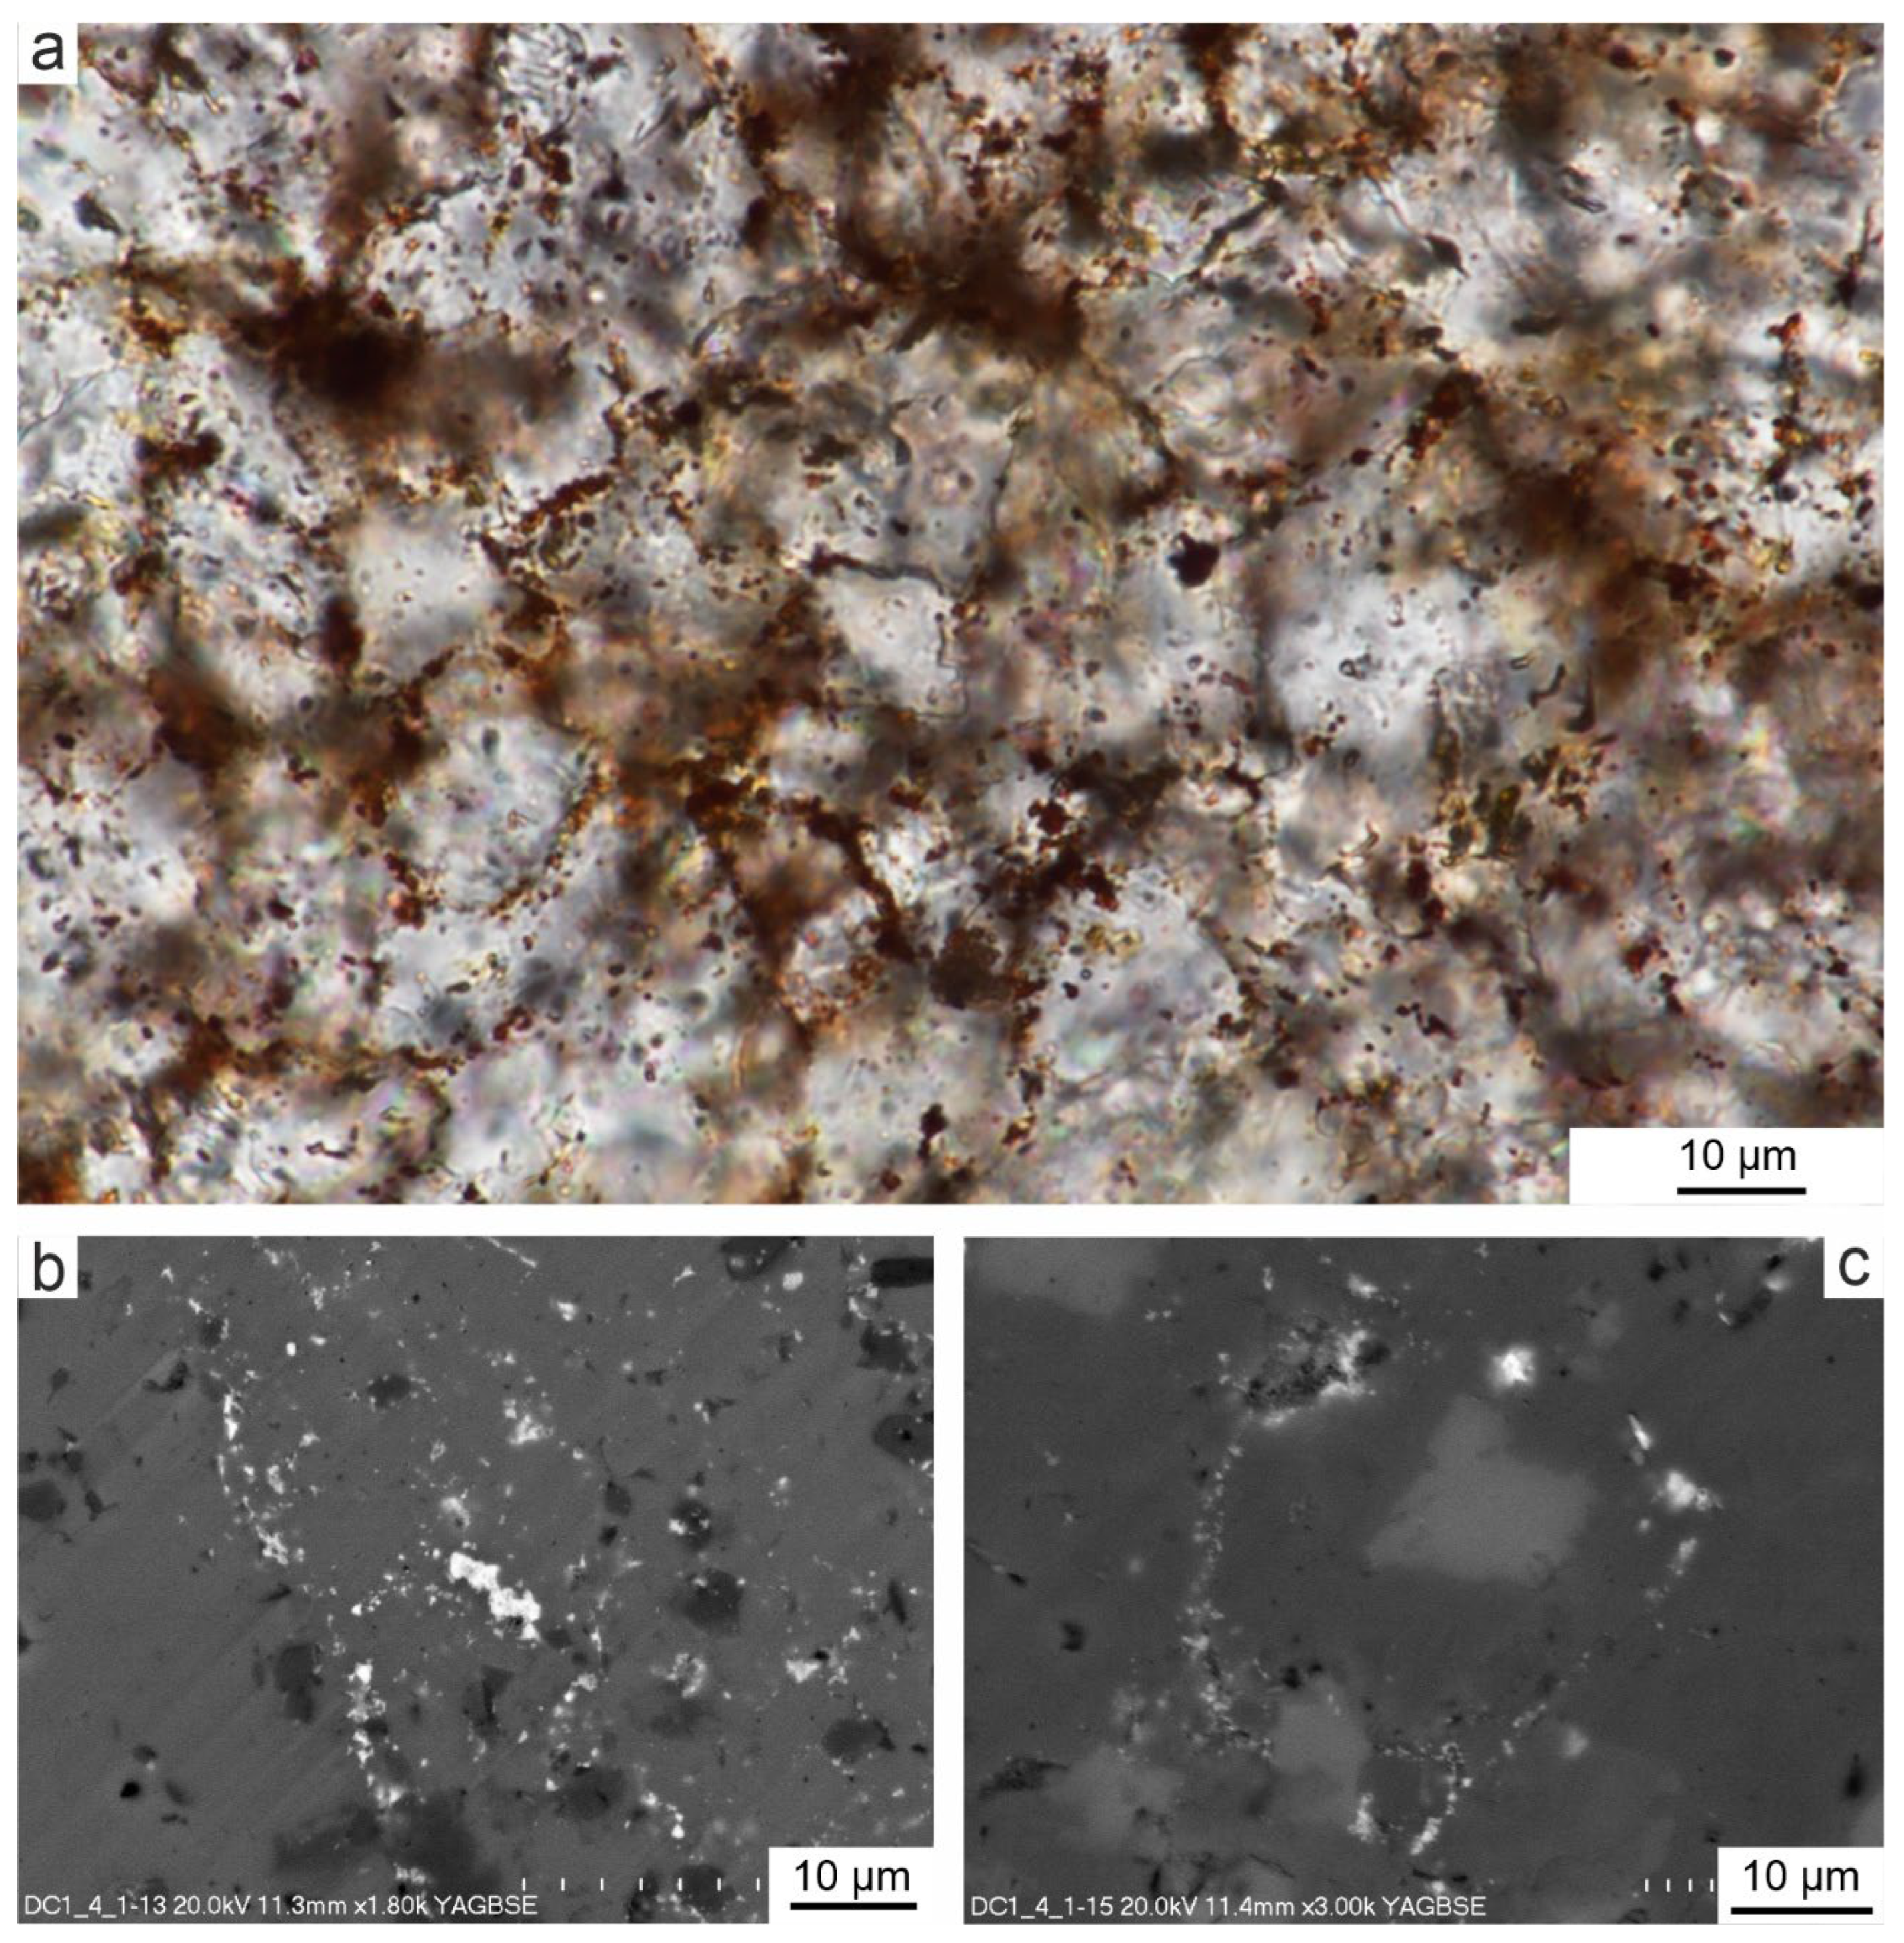
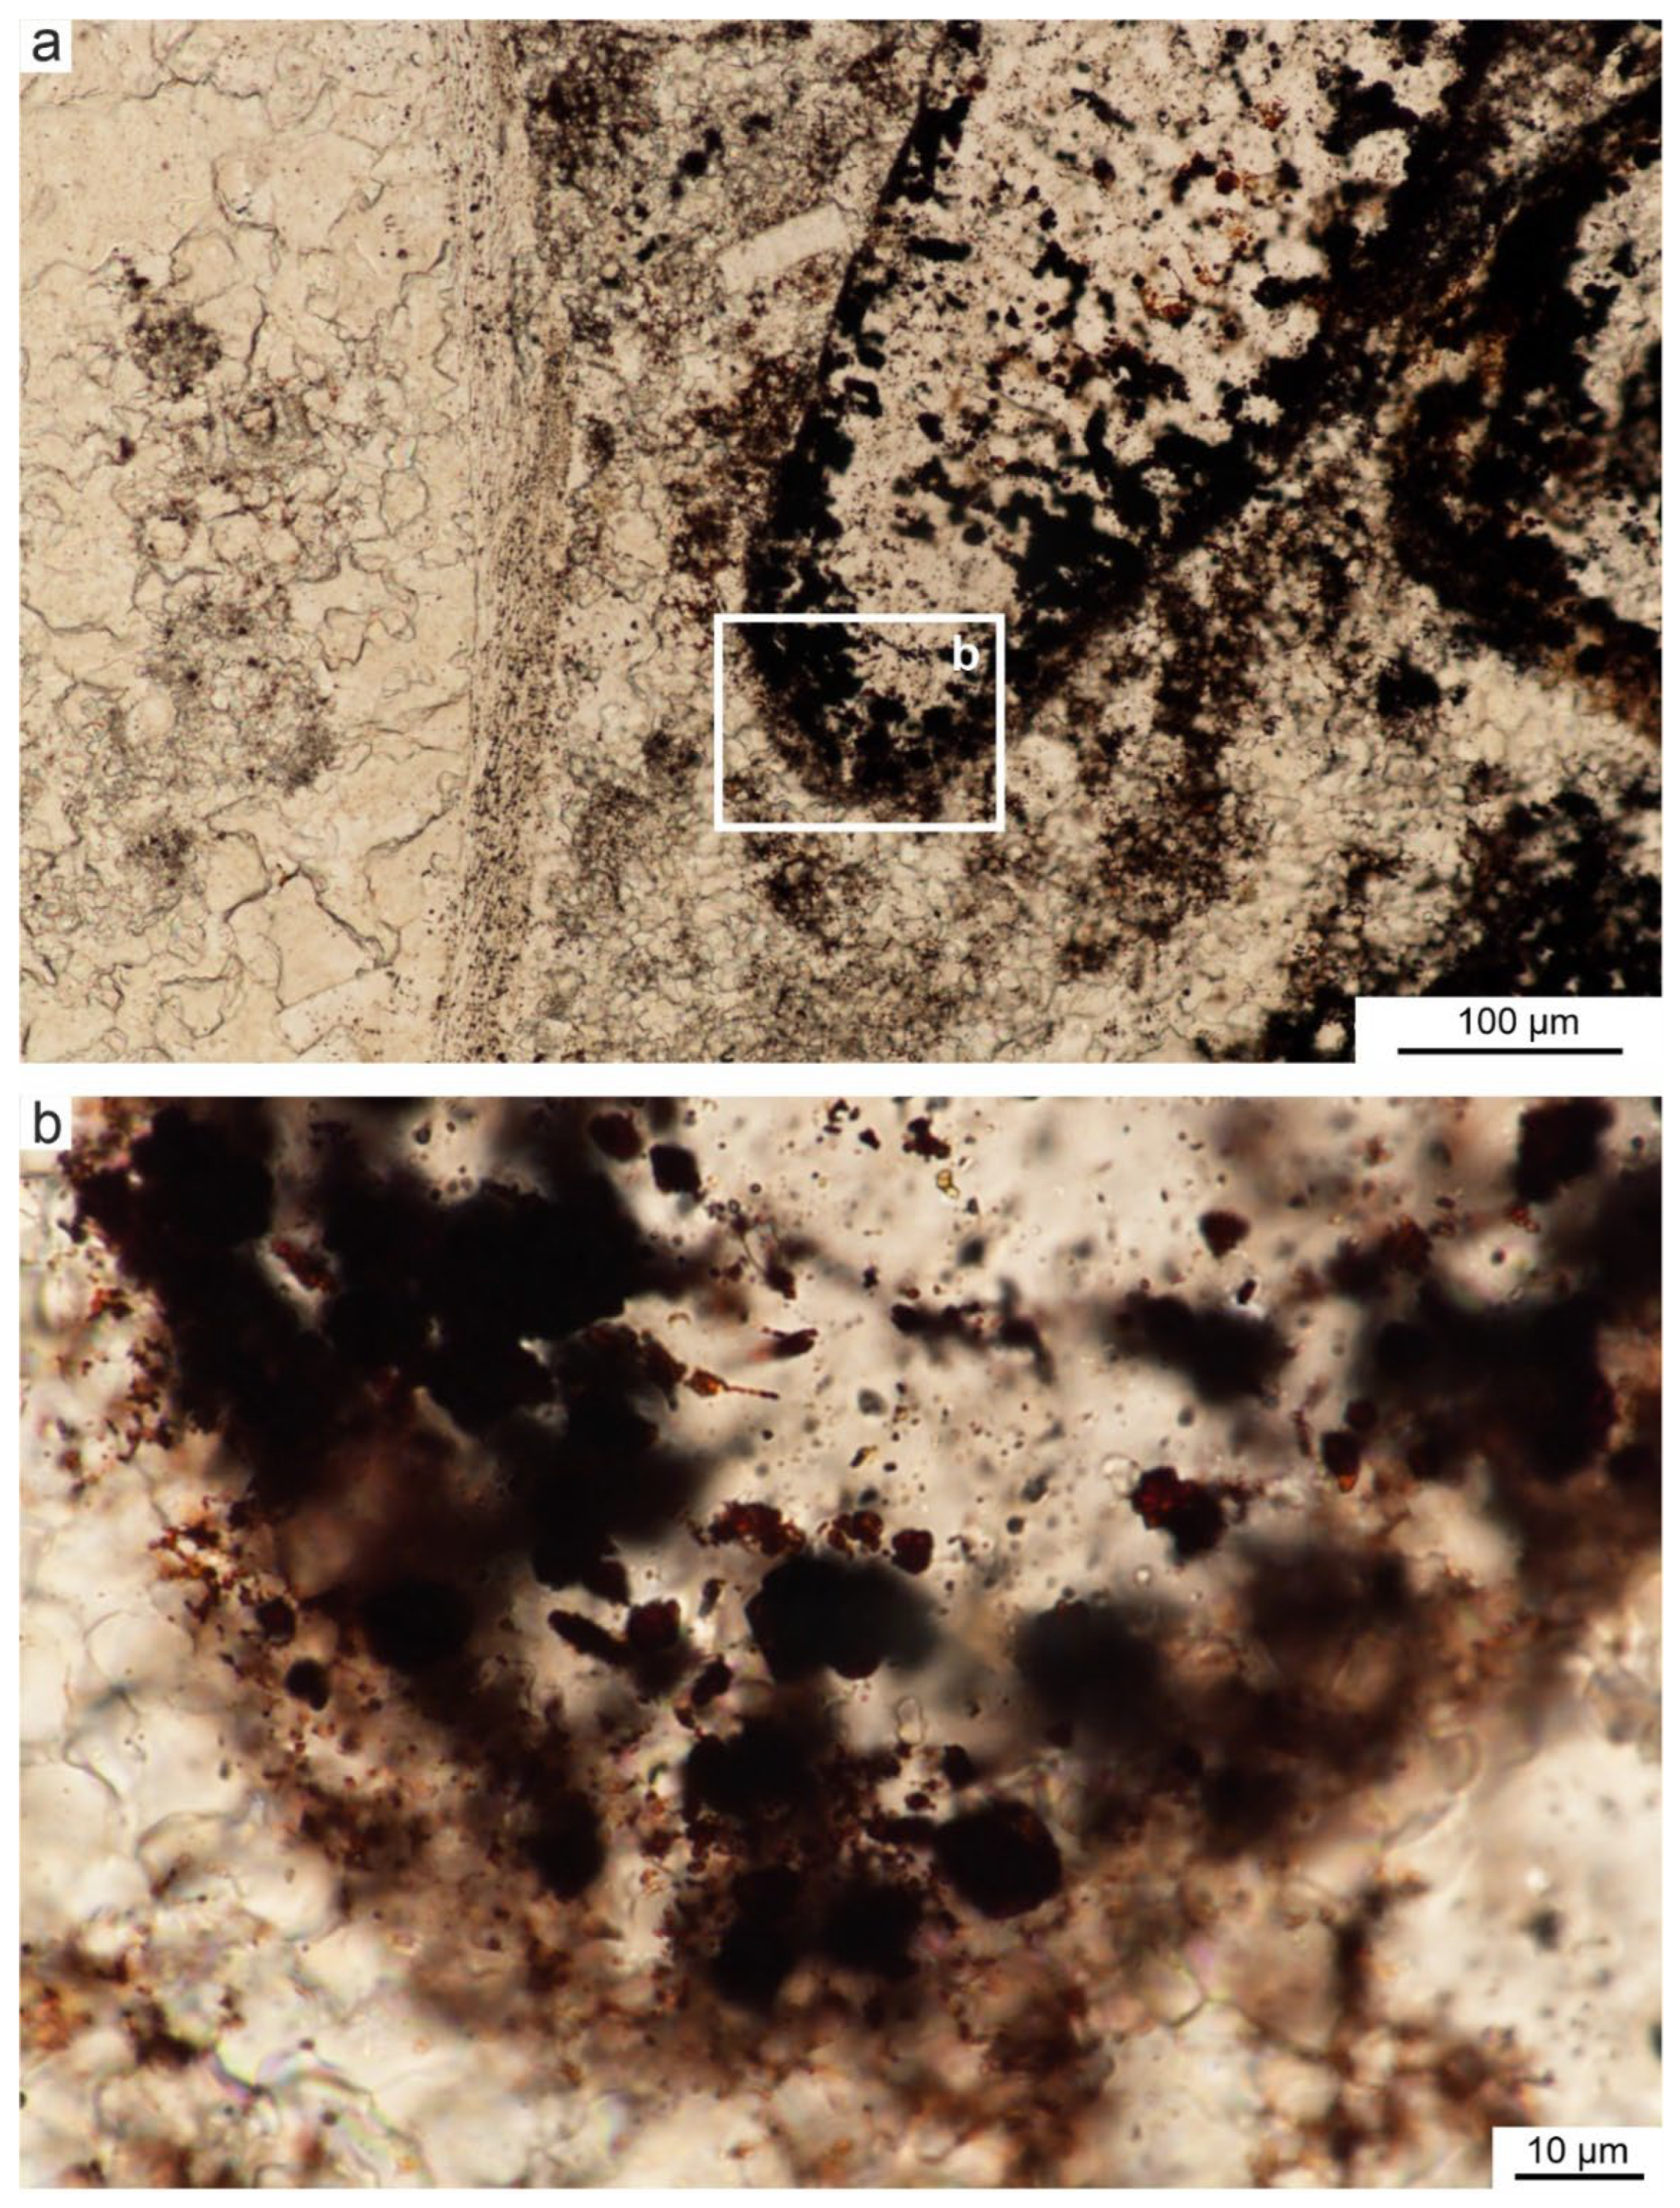
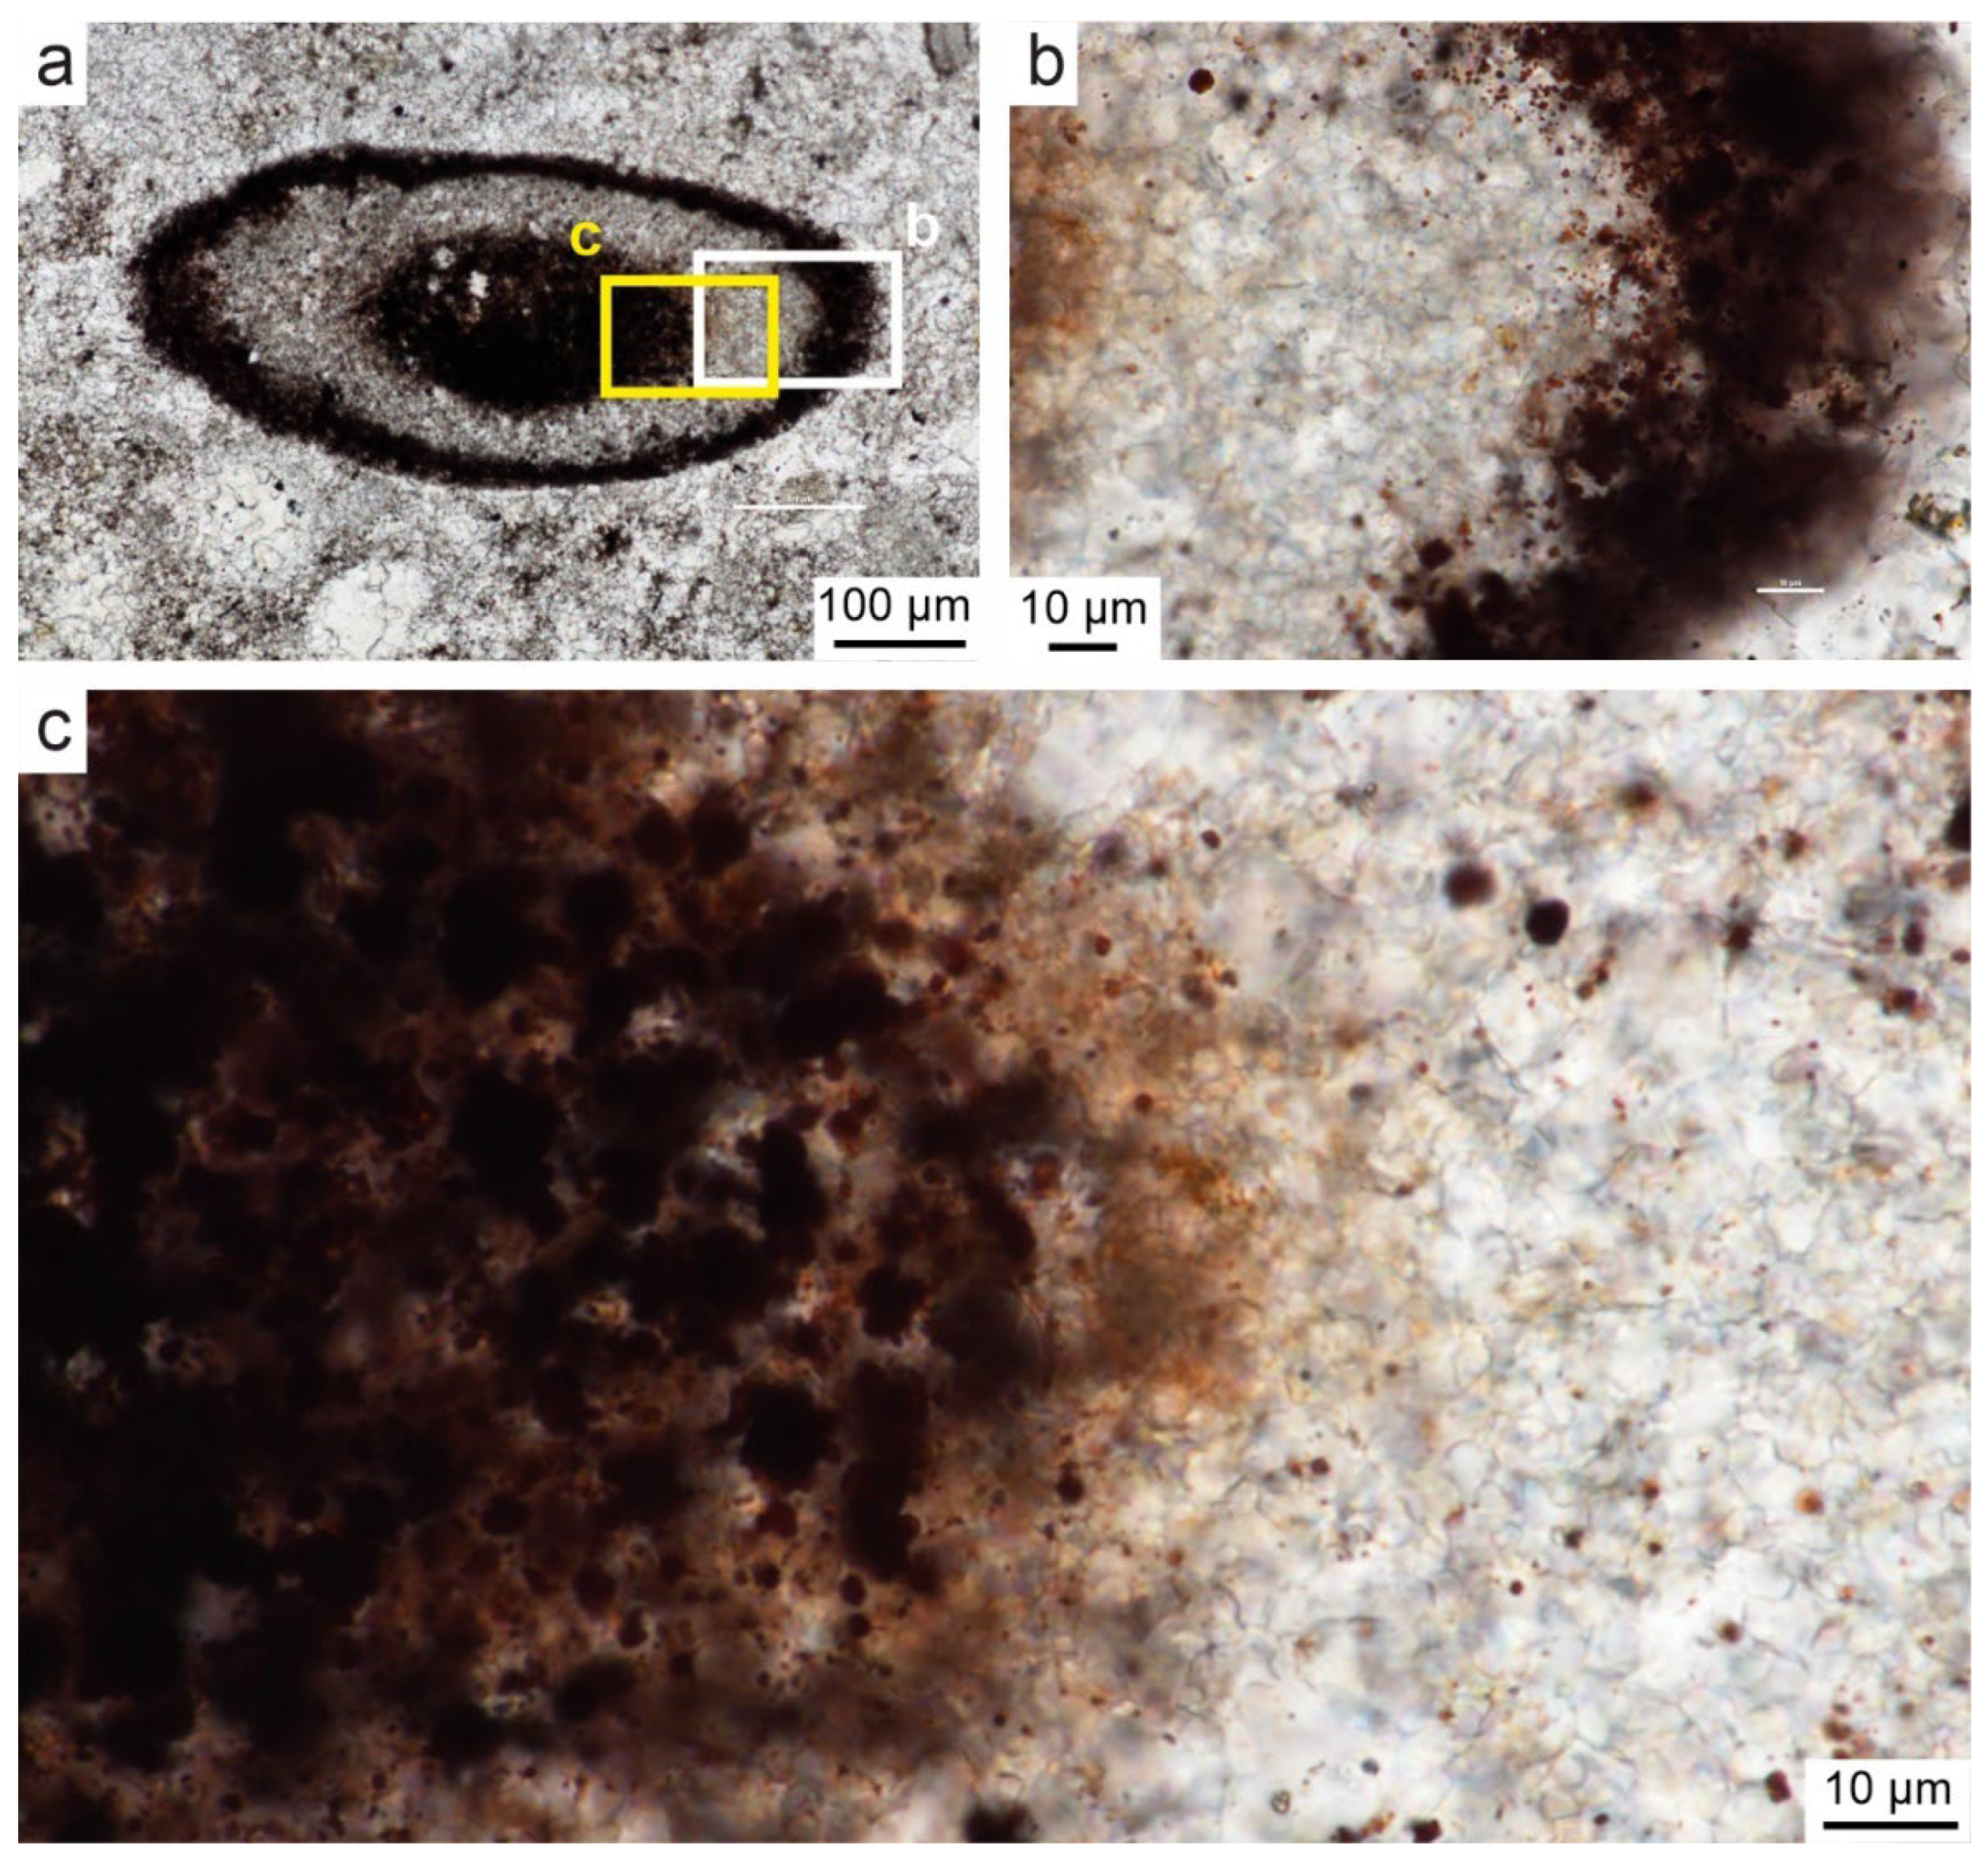
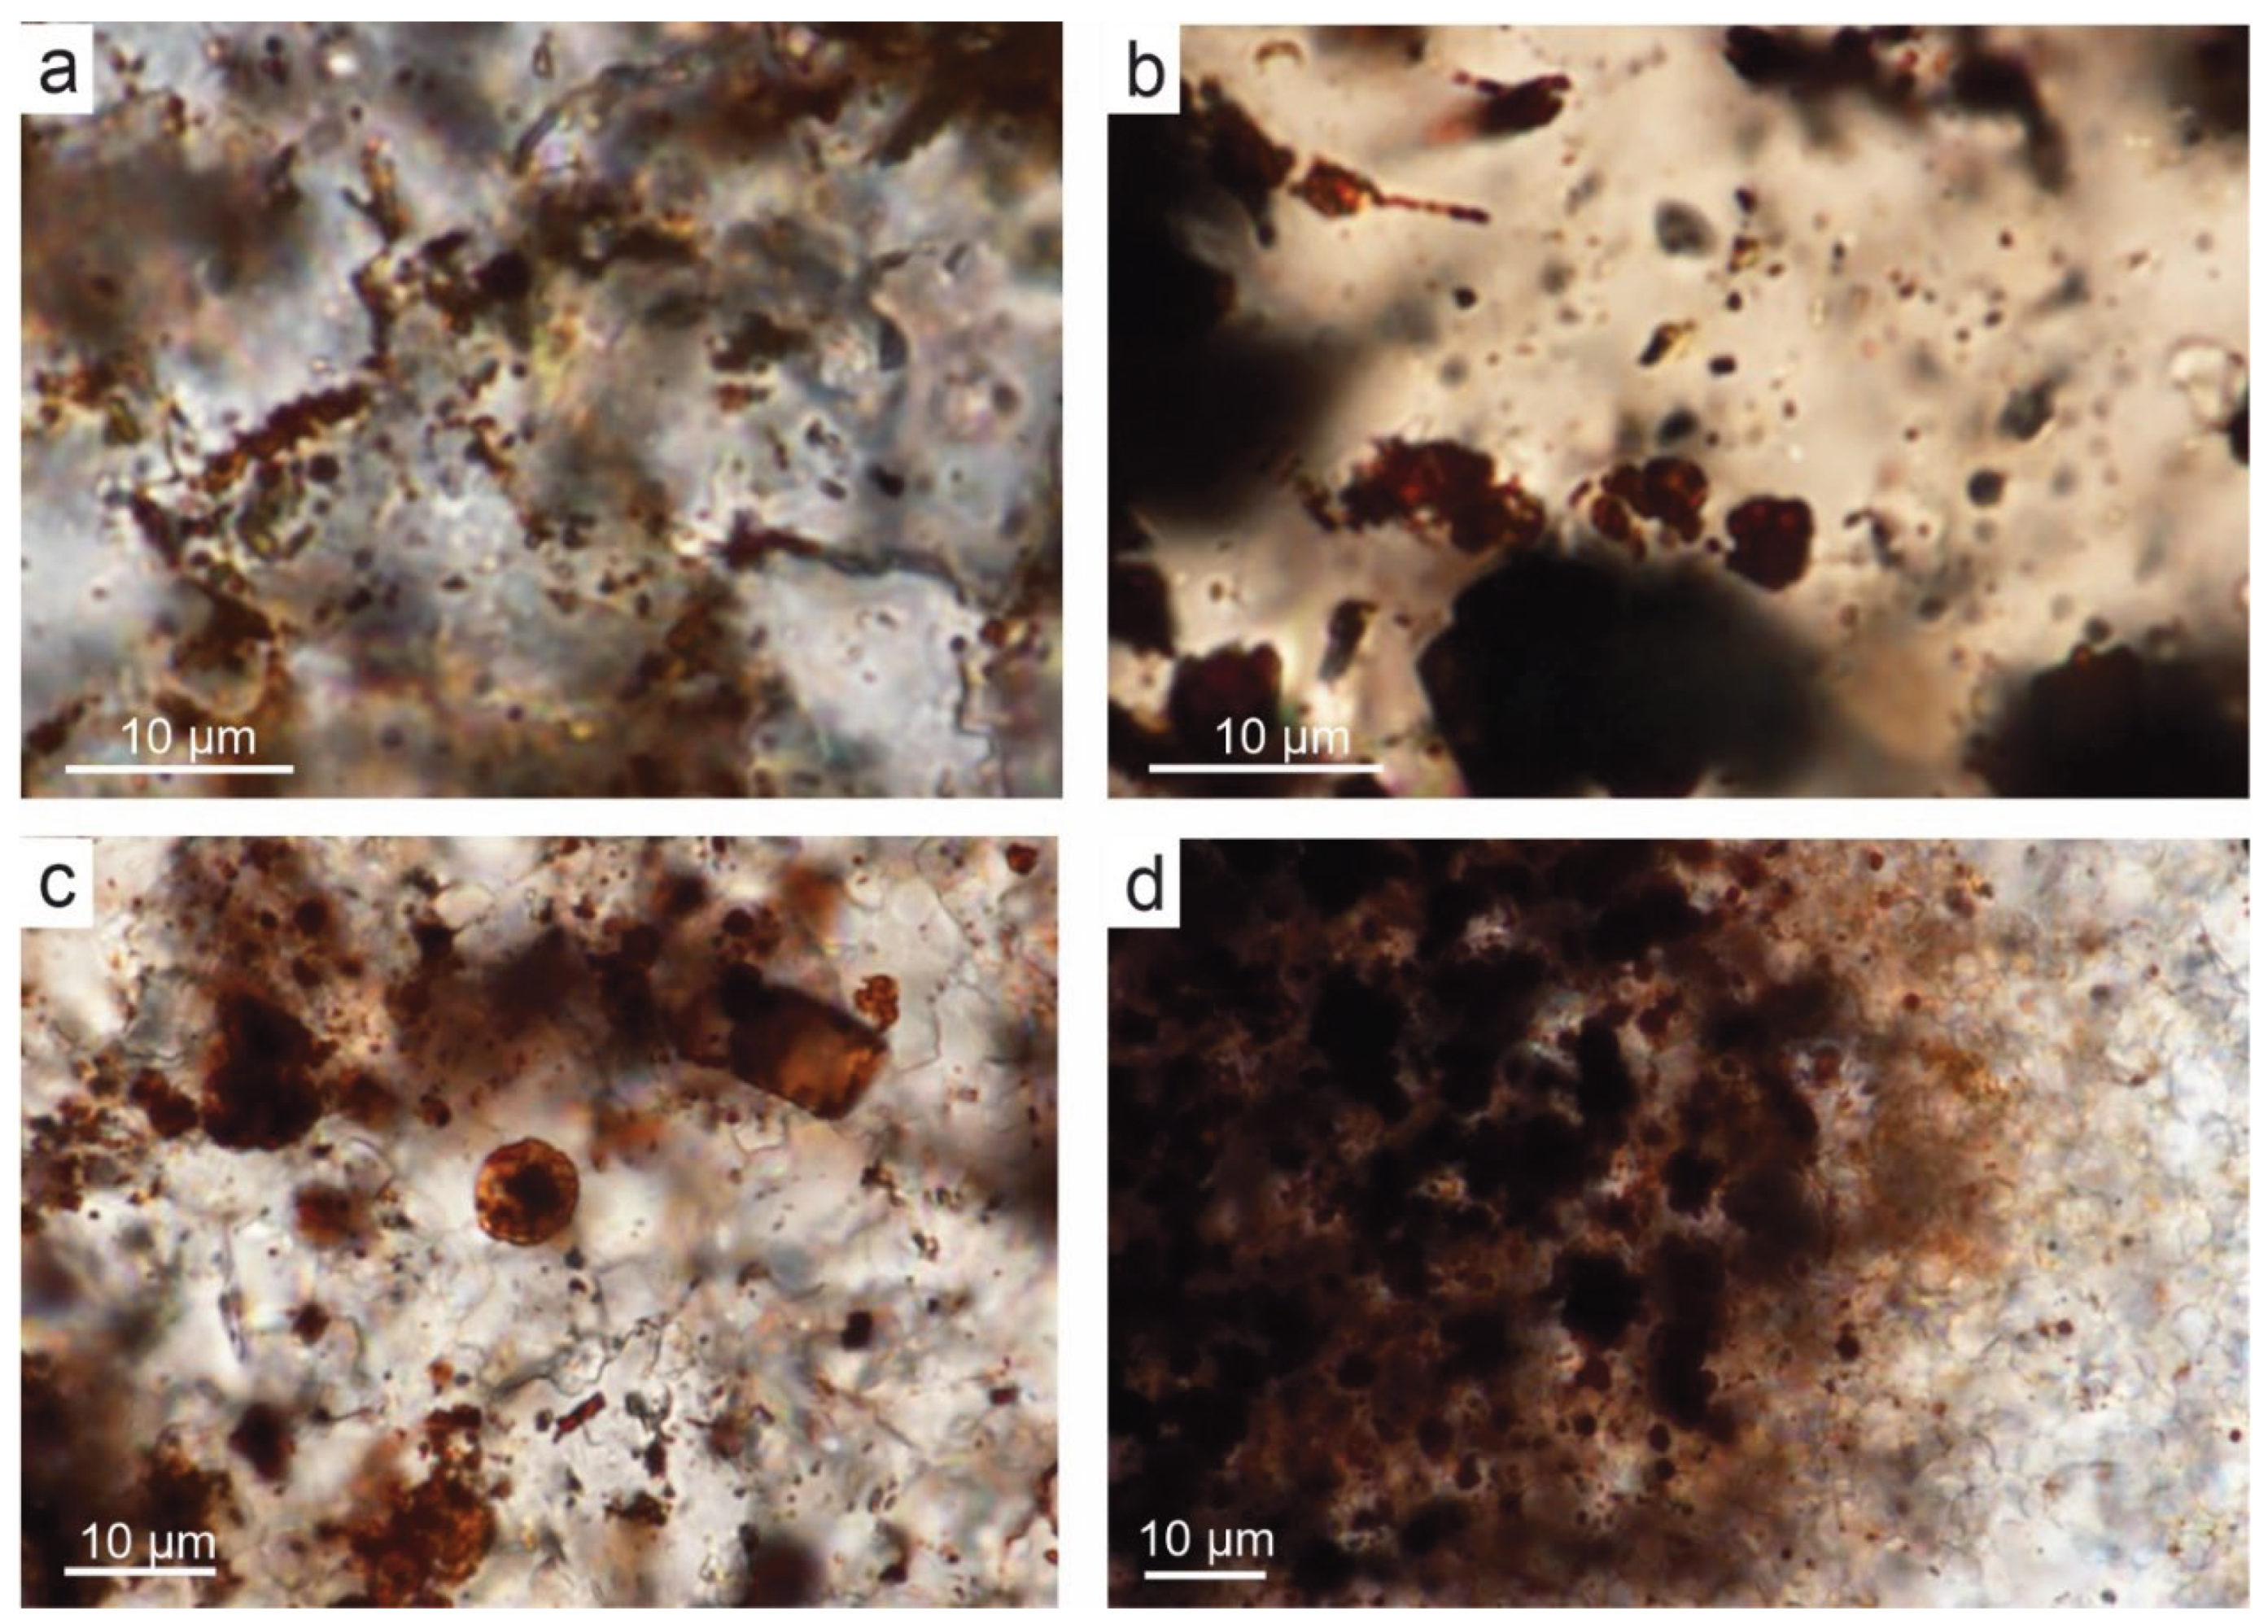
4.1. Microstructure of Limestones with Ferruginous Pigments
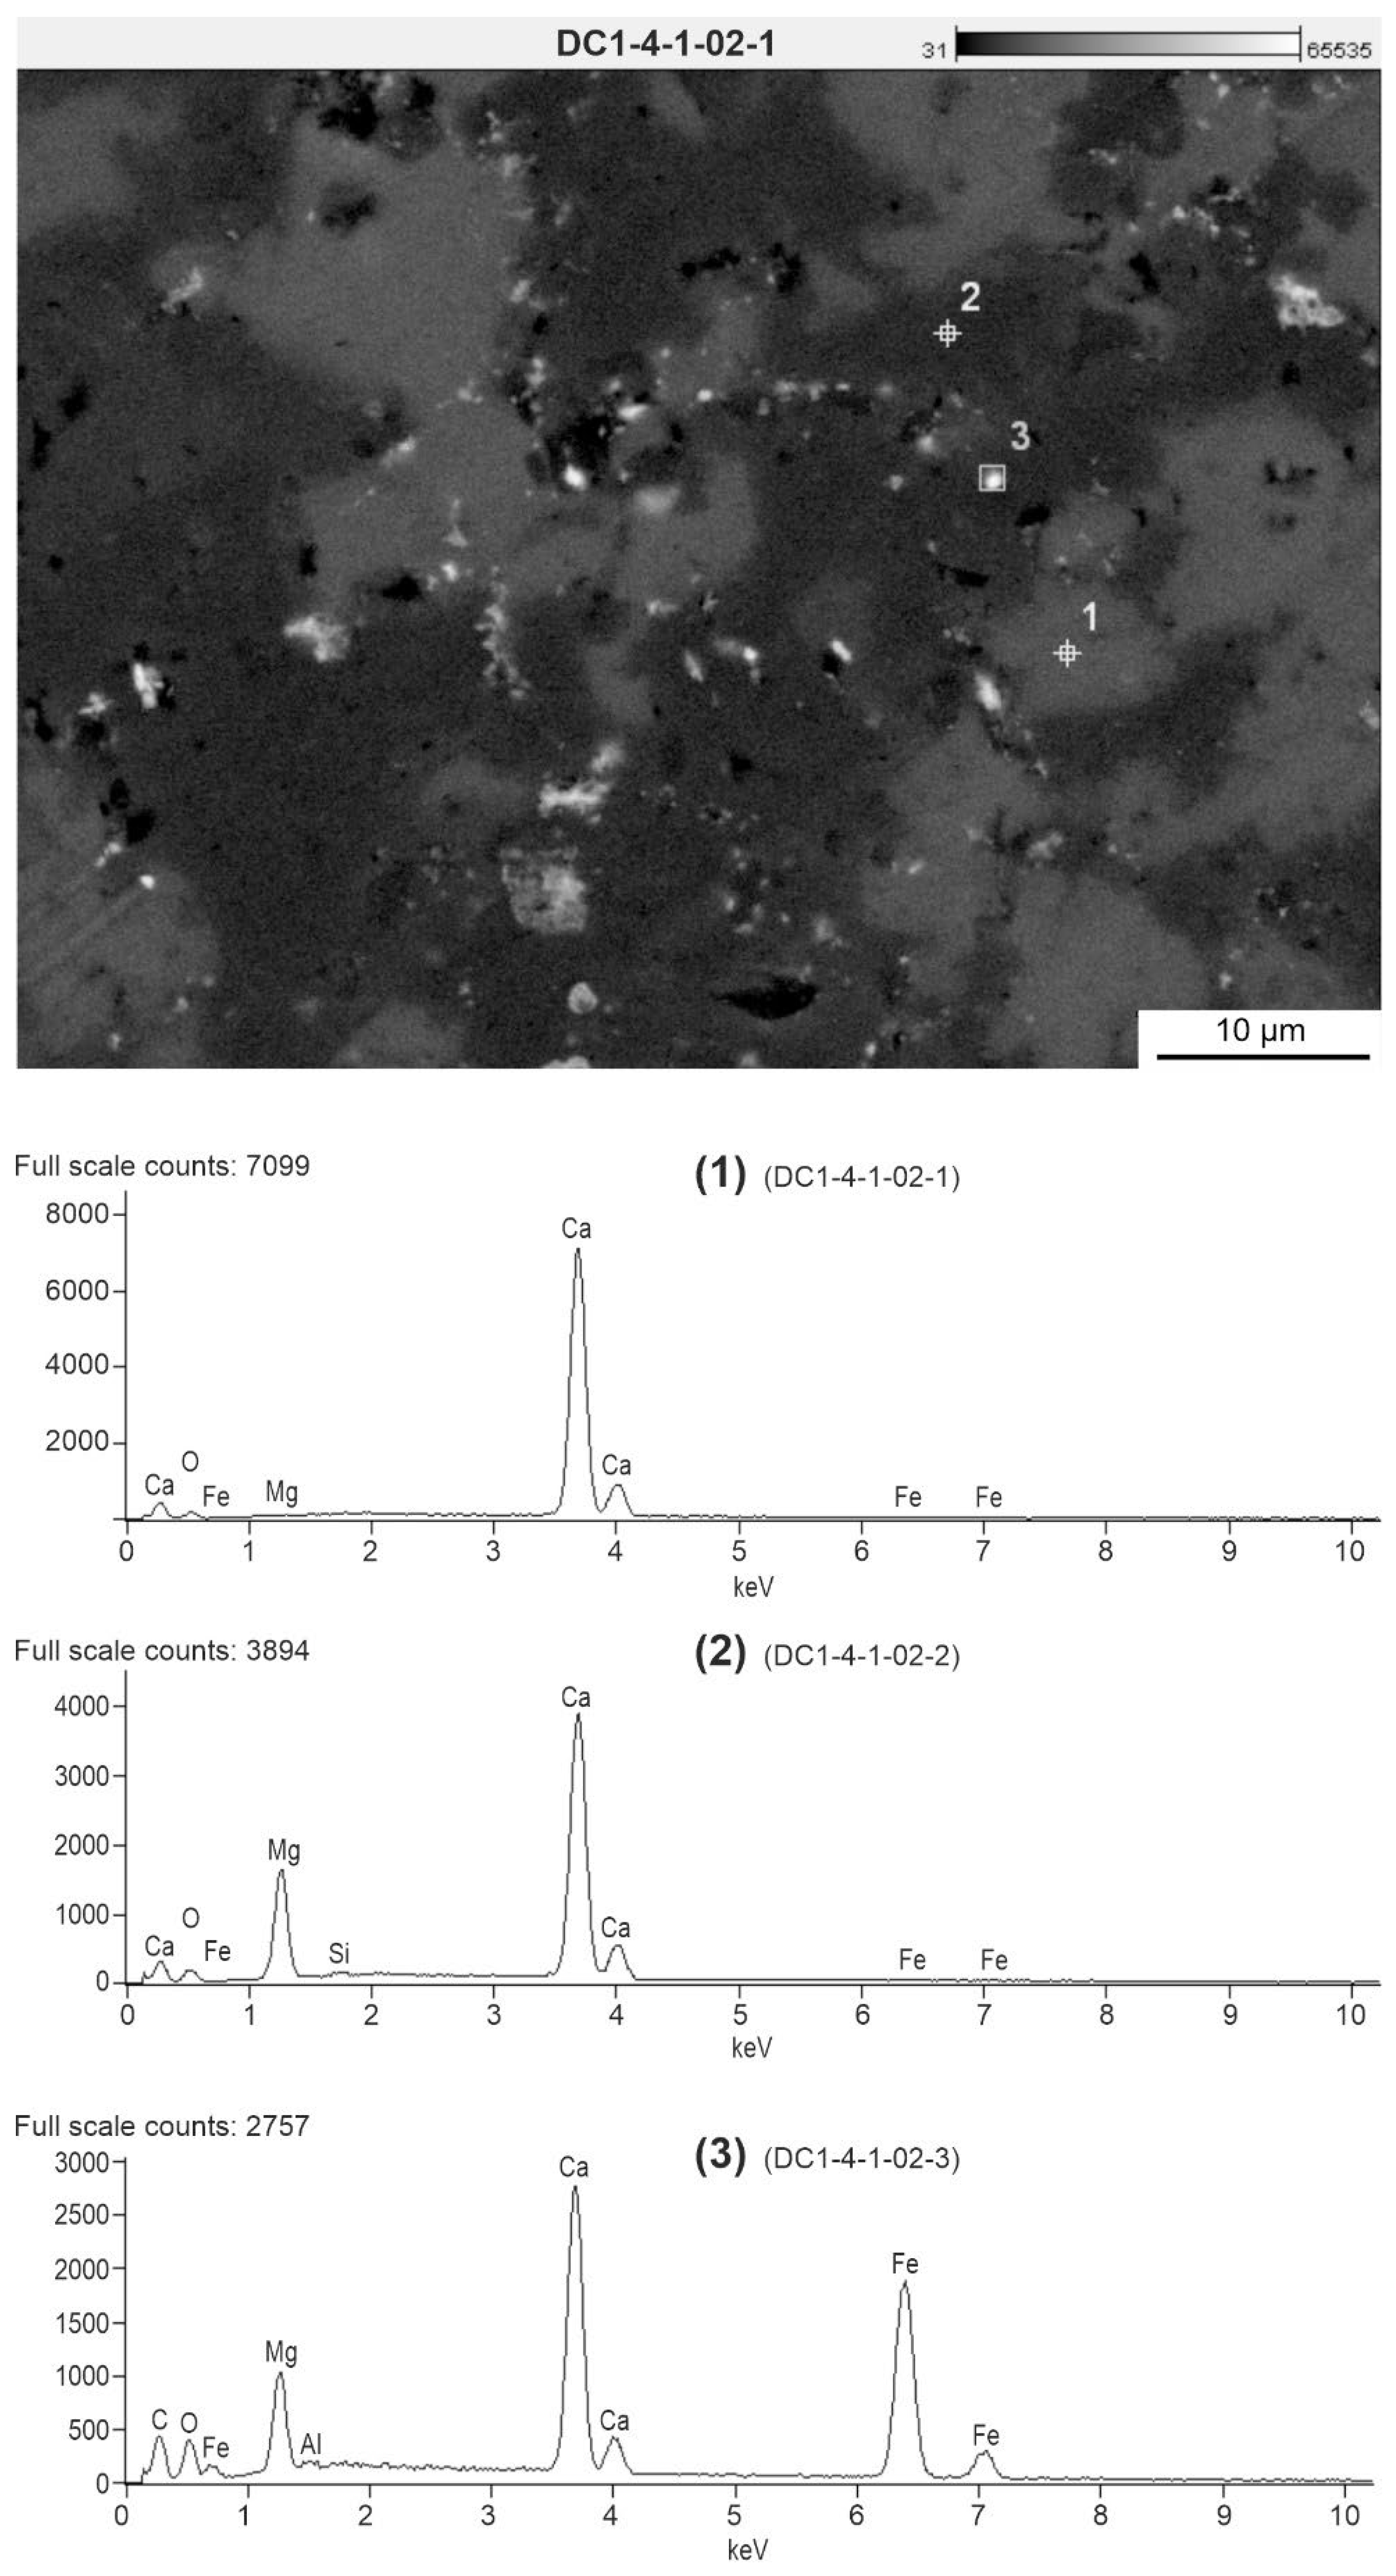
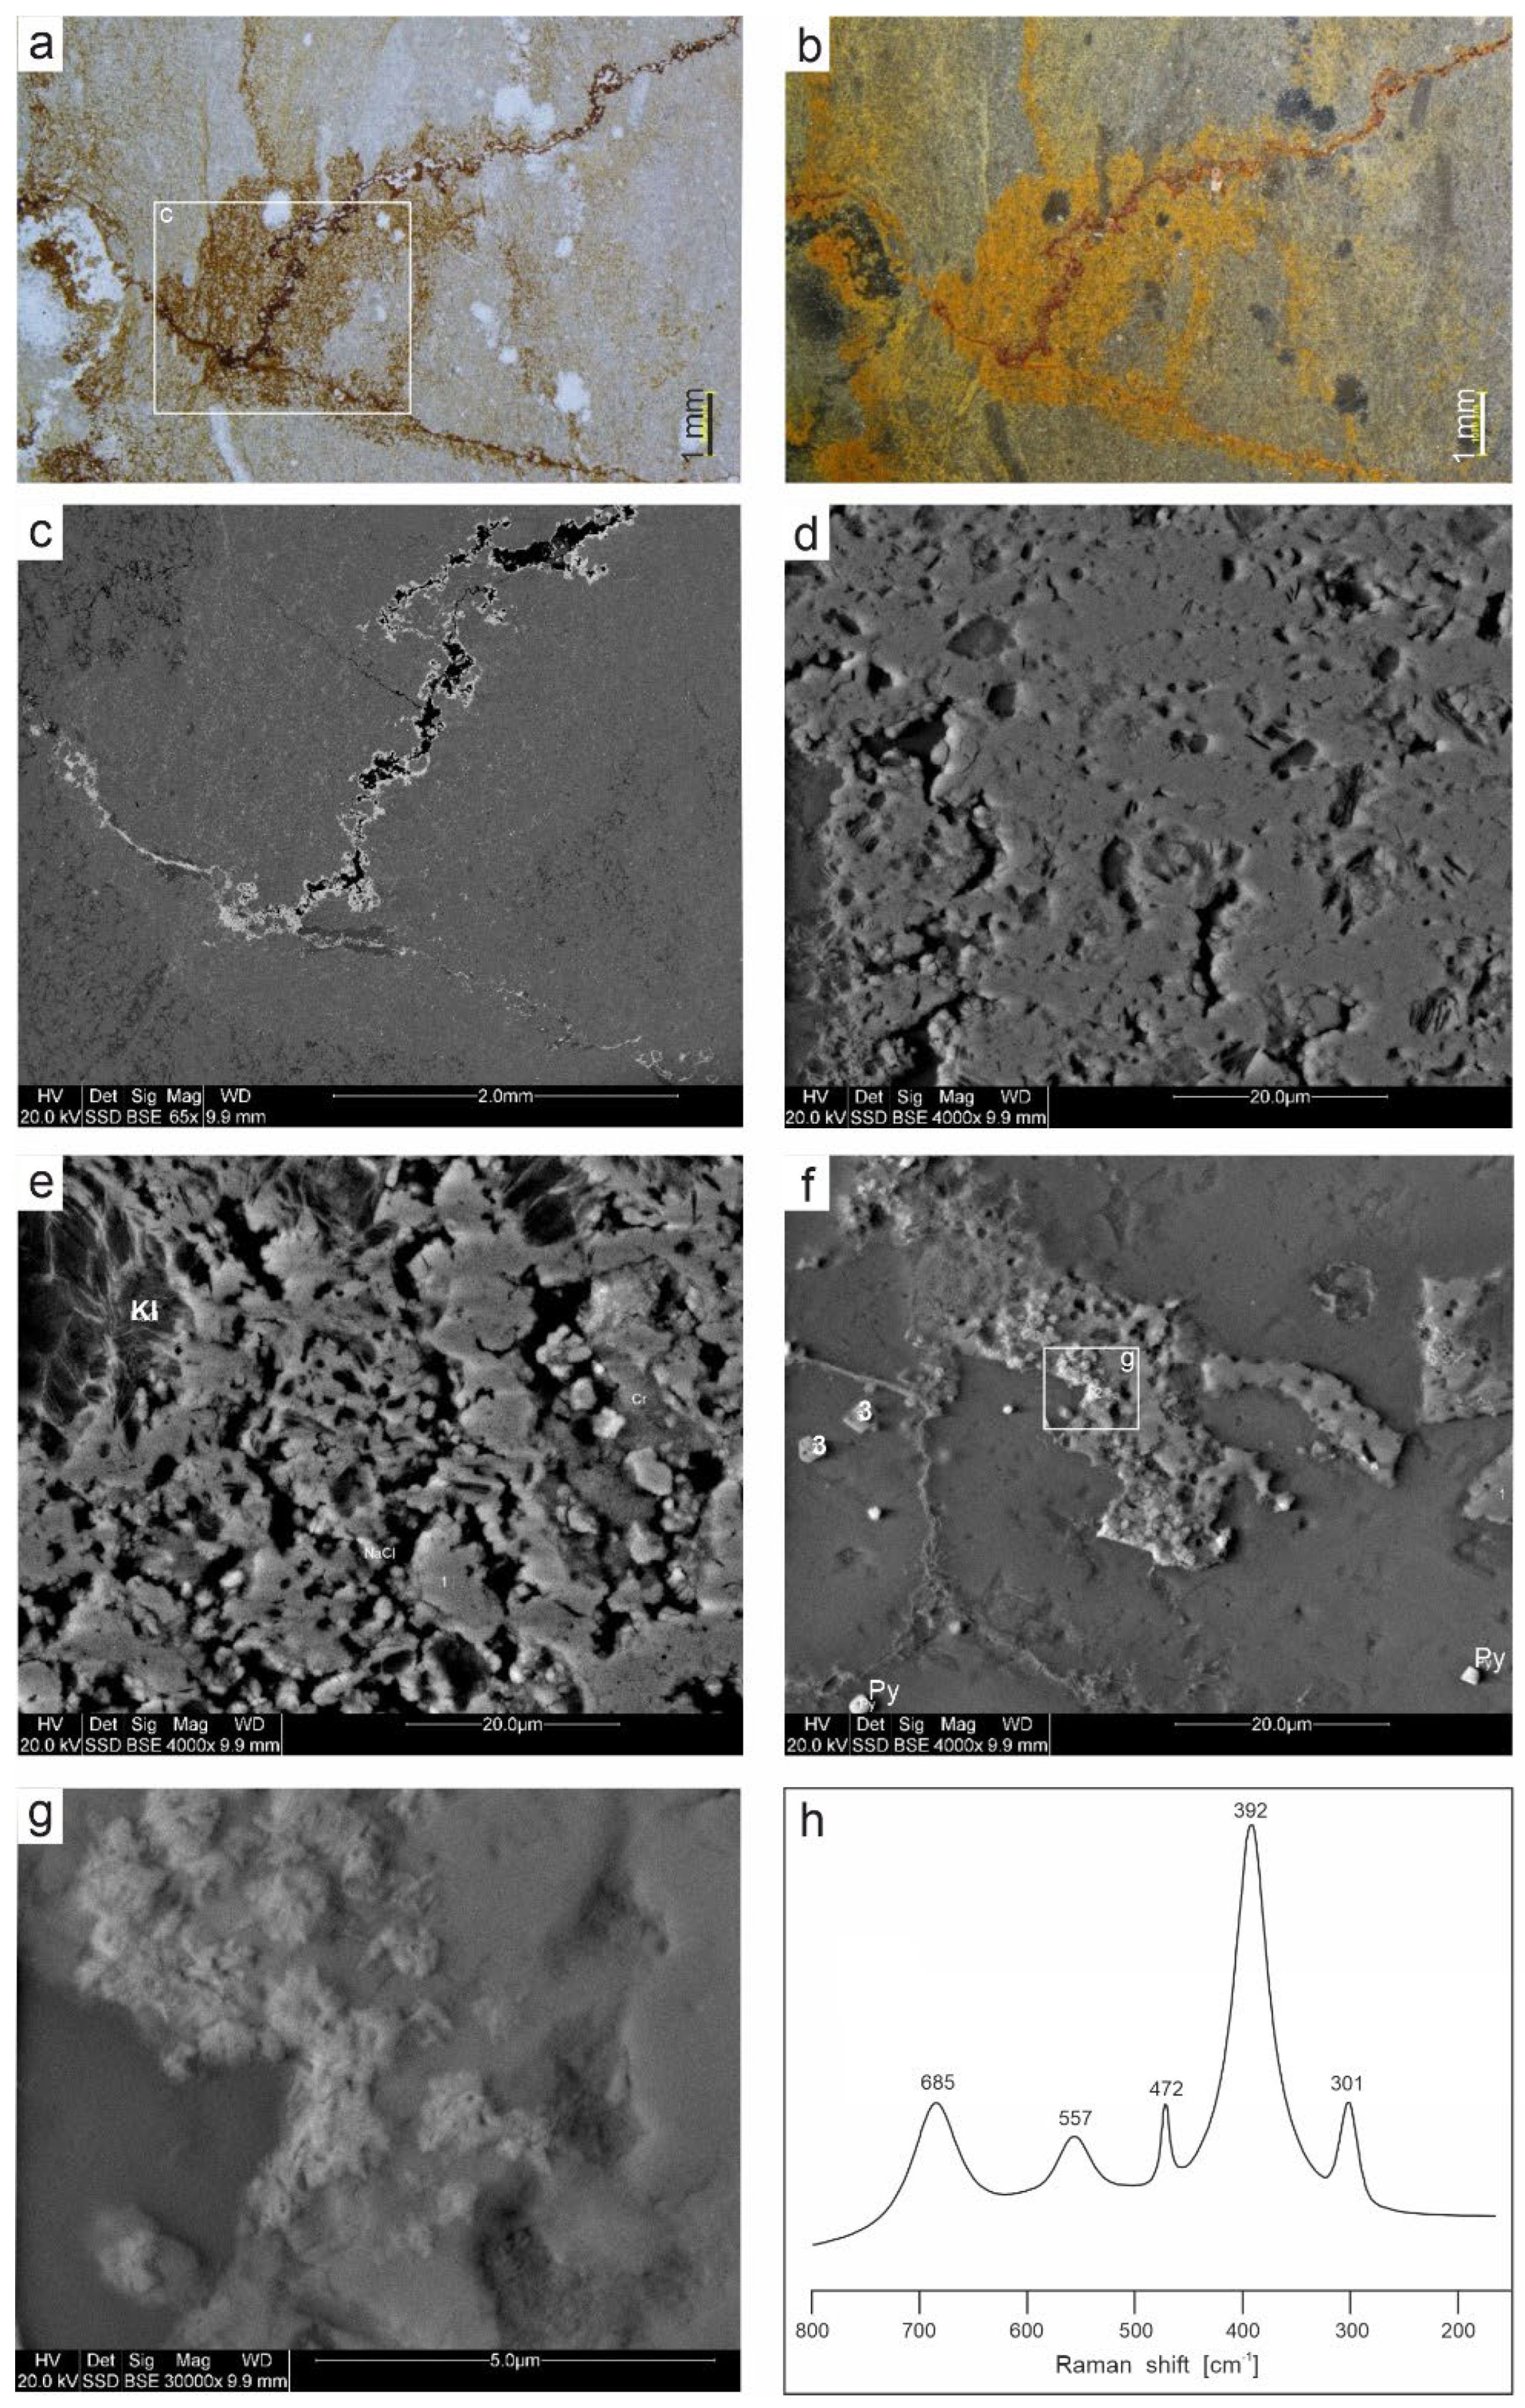
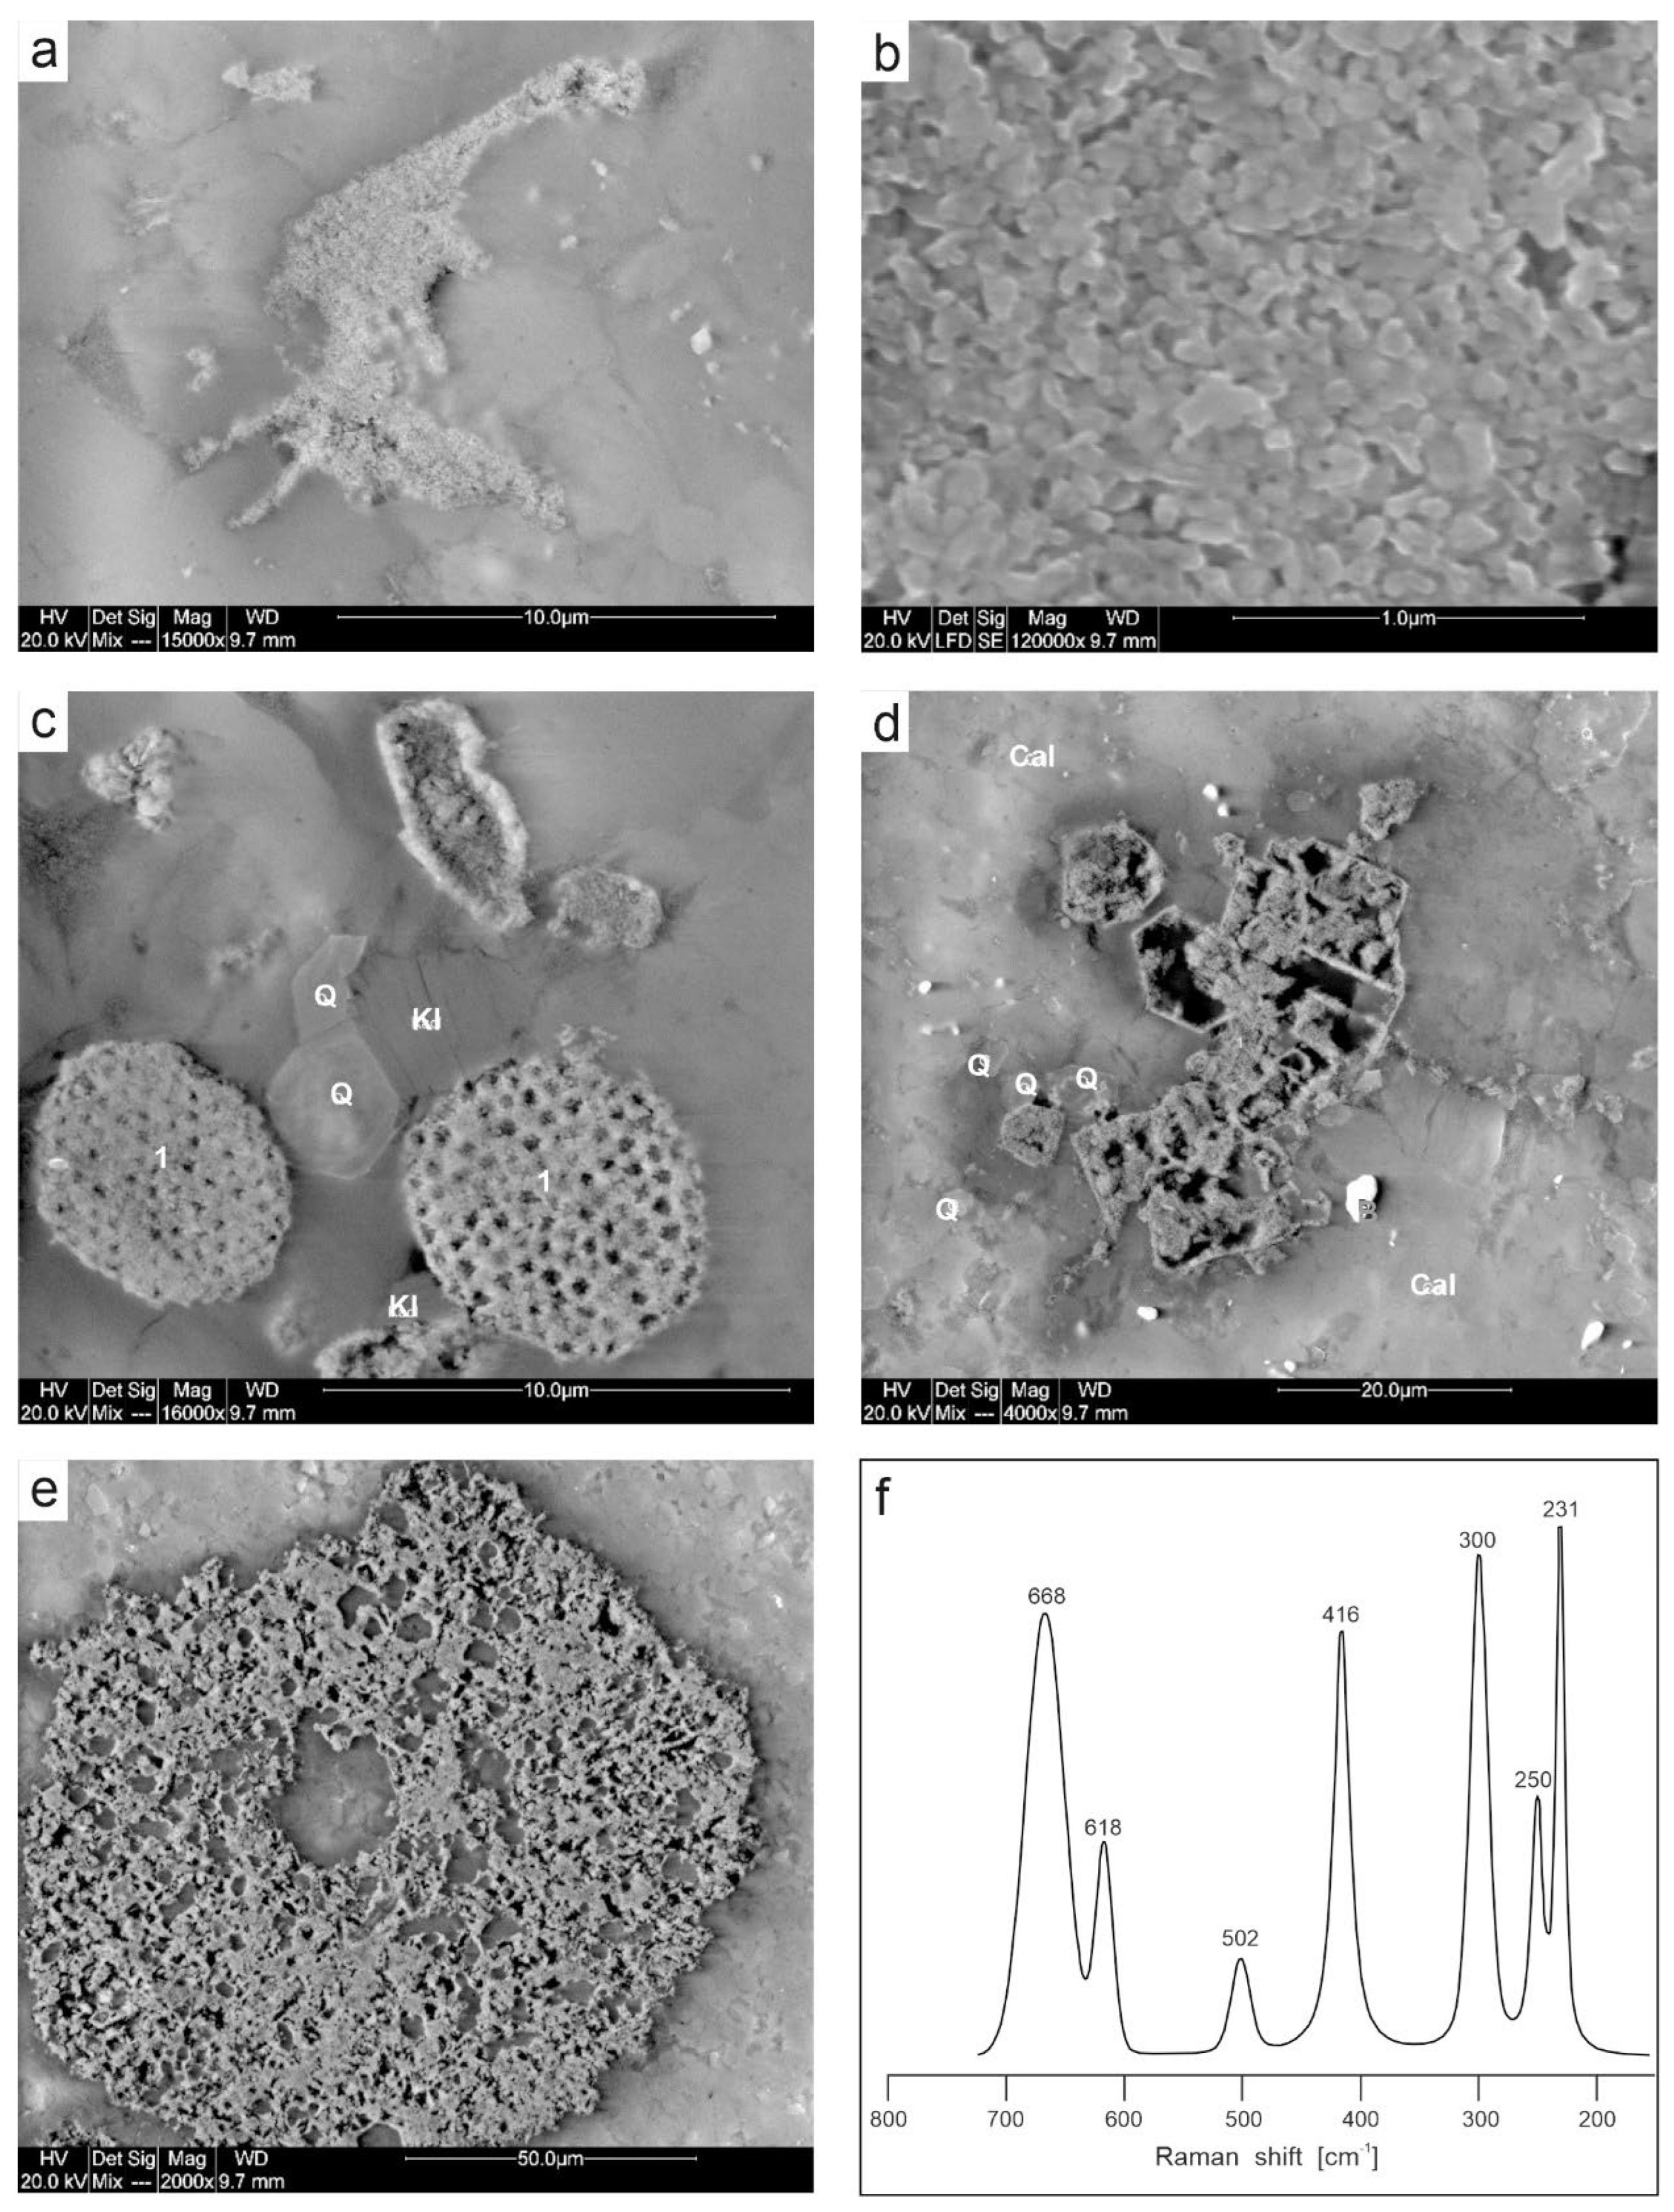
4.2. Mineralogy of Ferruginous Discolourations in Limestones
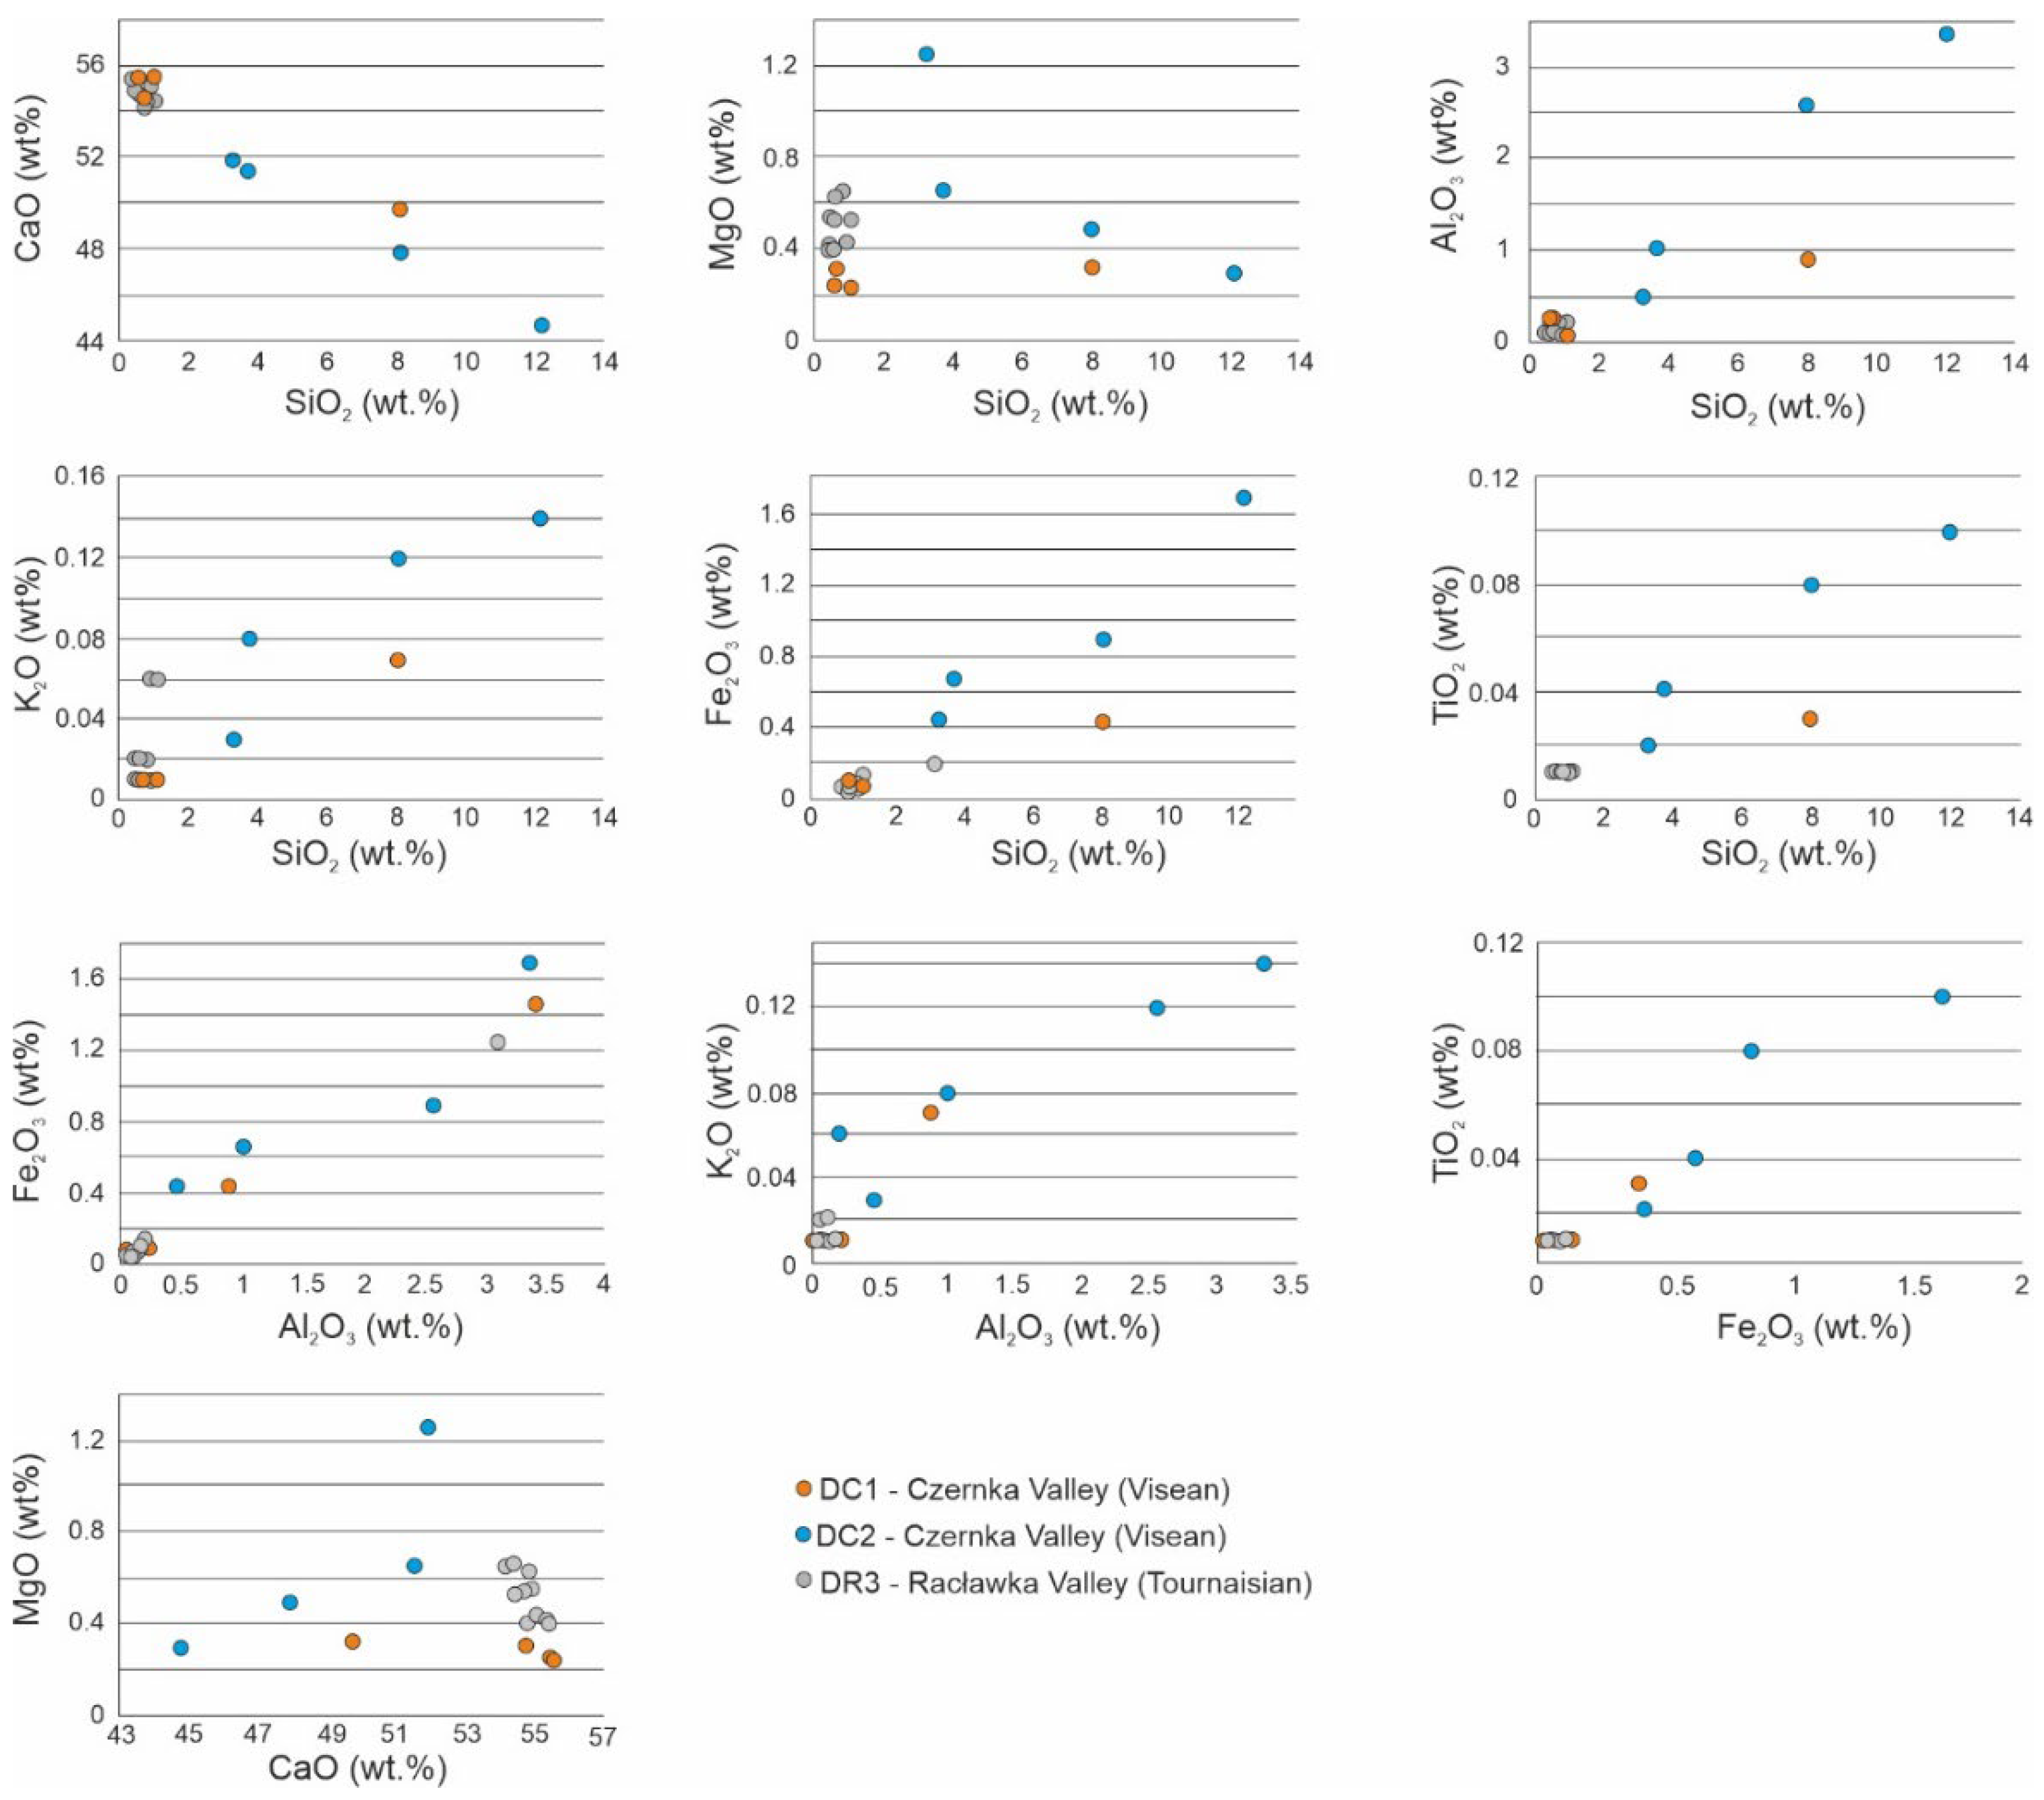
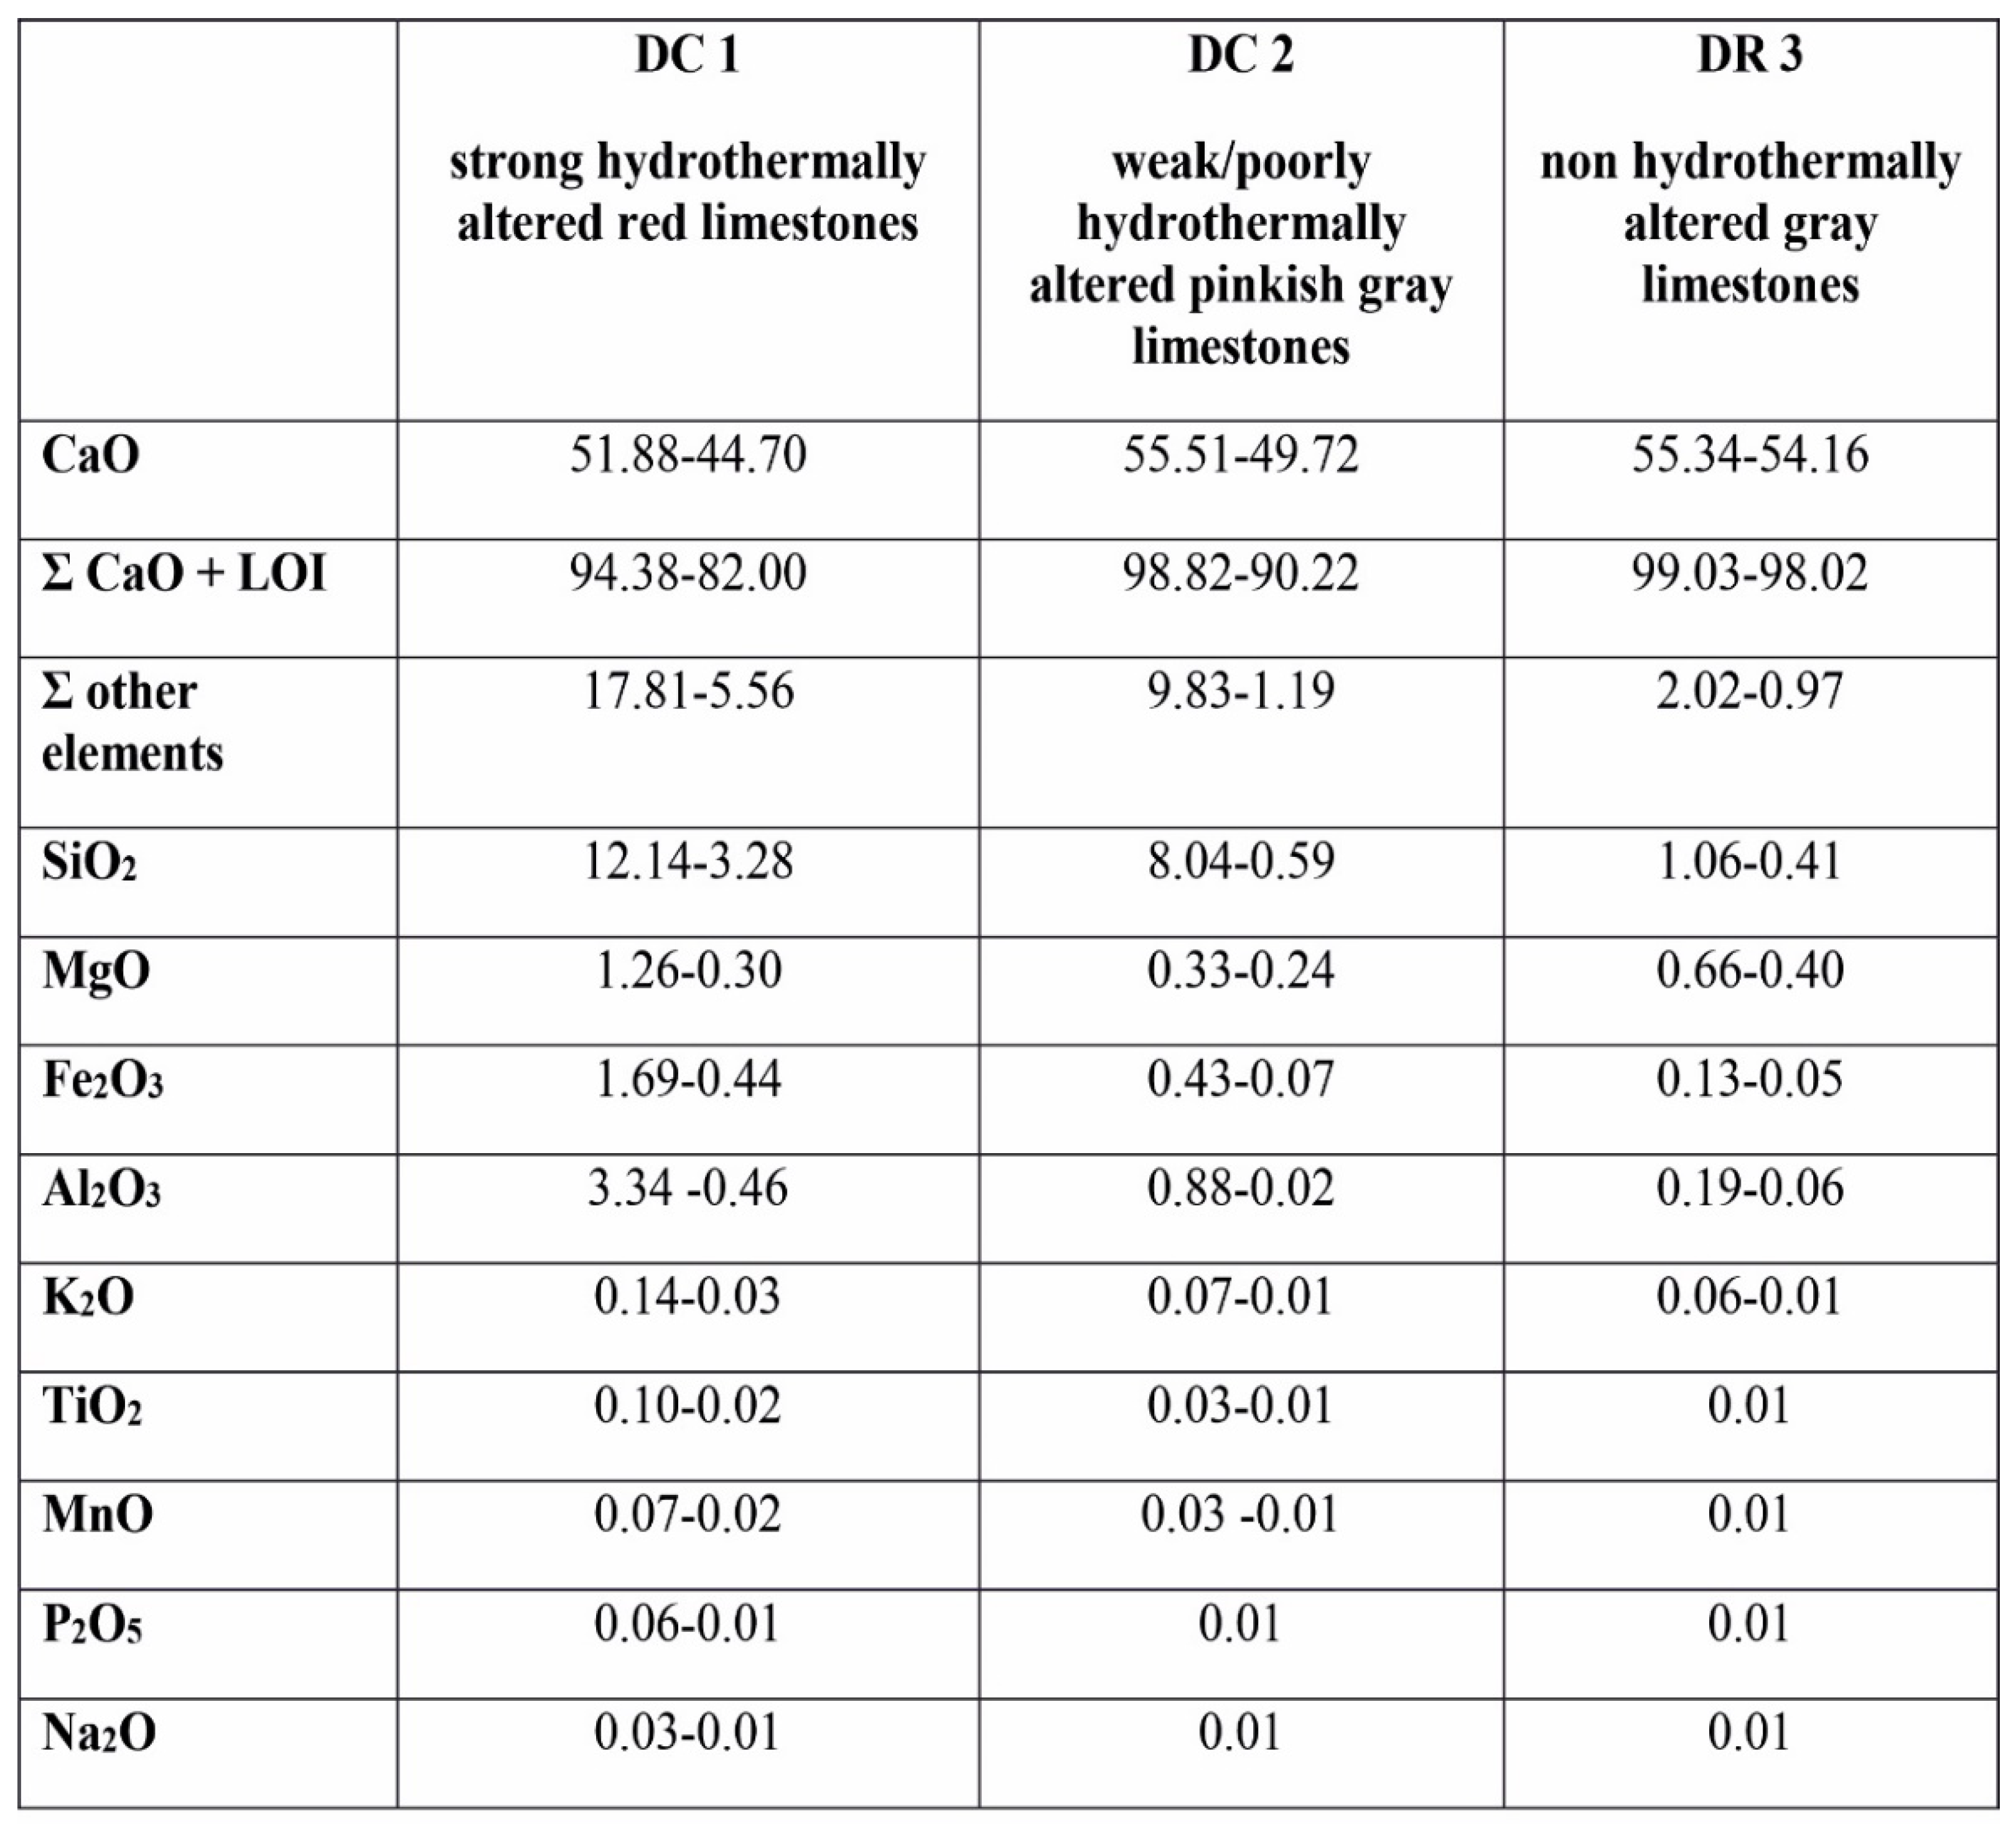
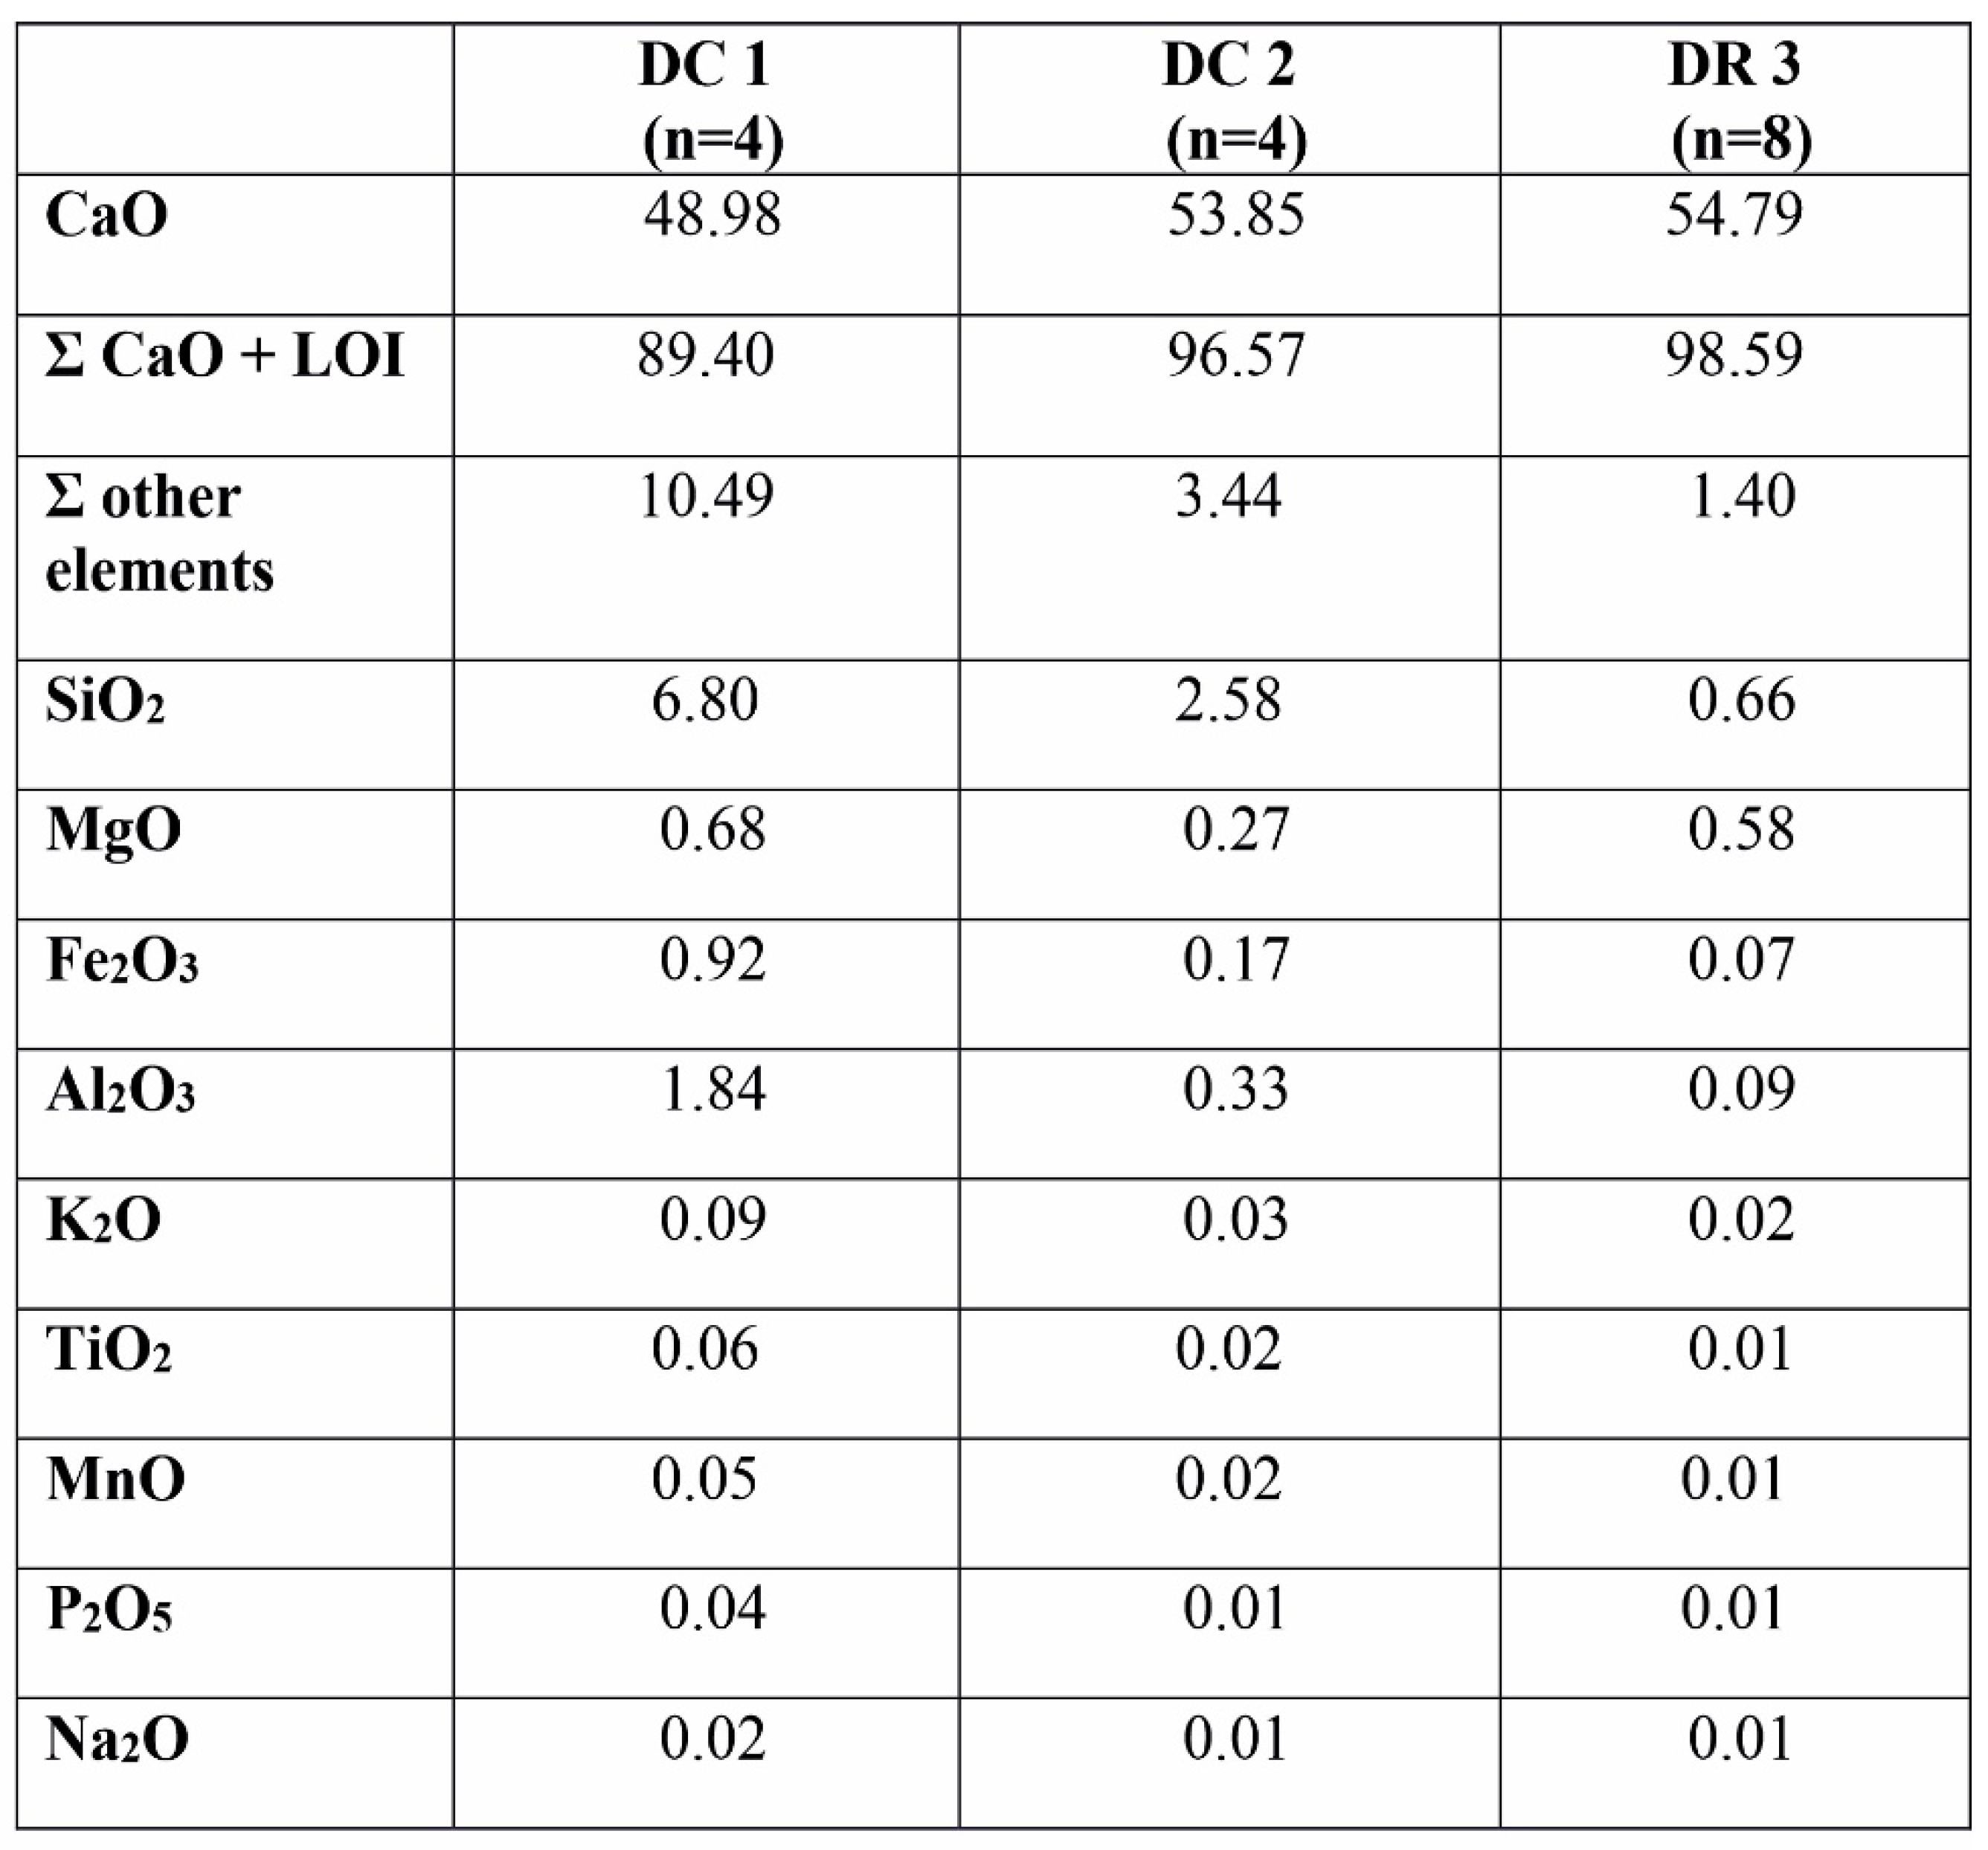
4.3. Geochemistry of Major Oxides and Trace Elements
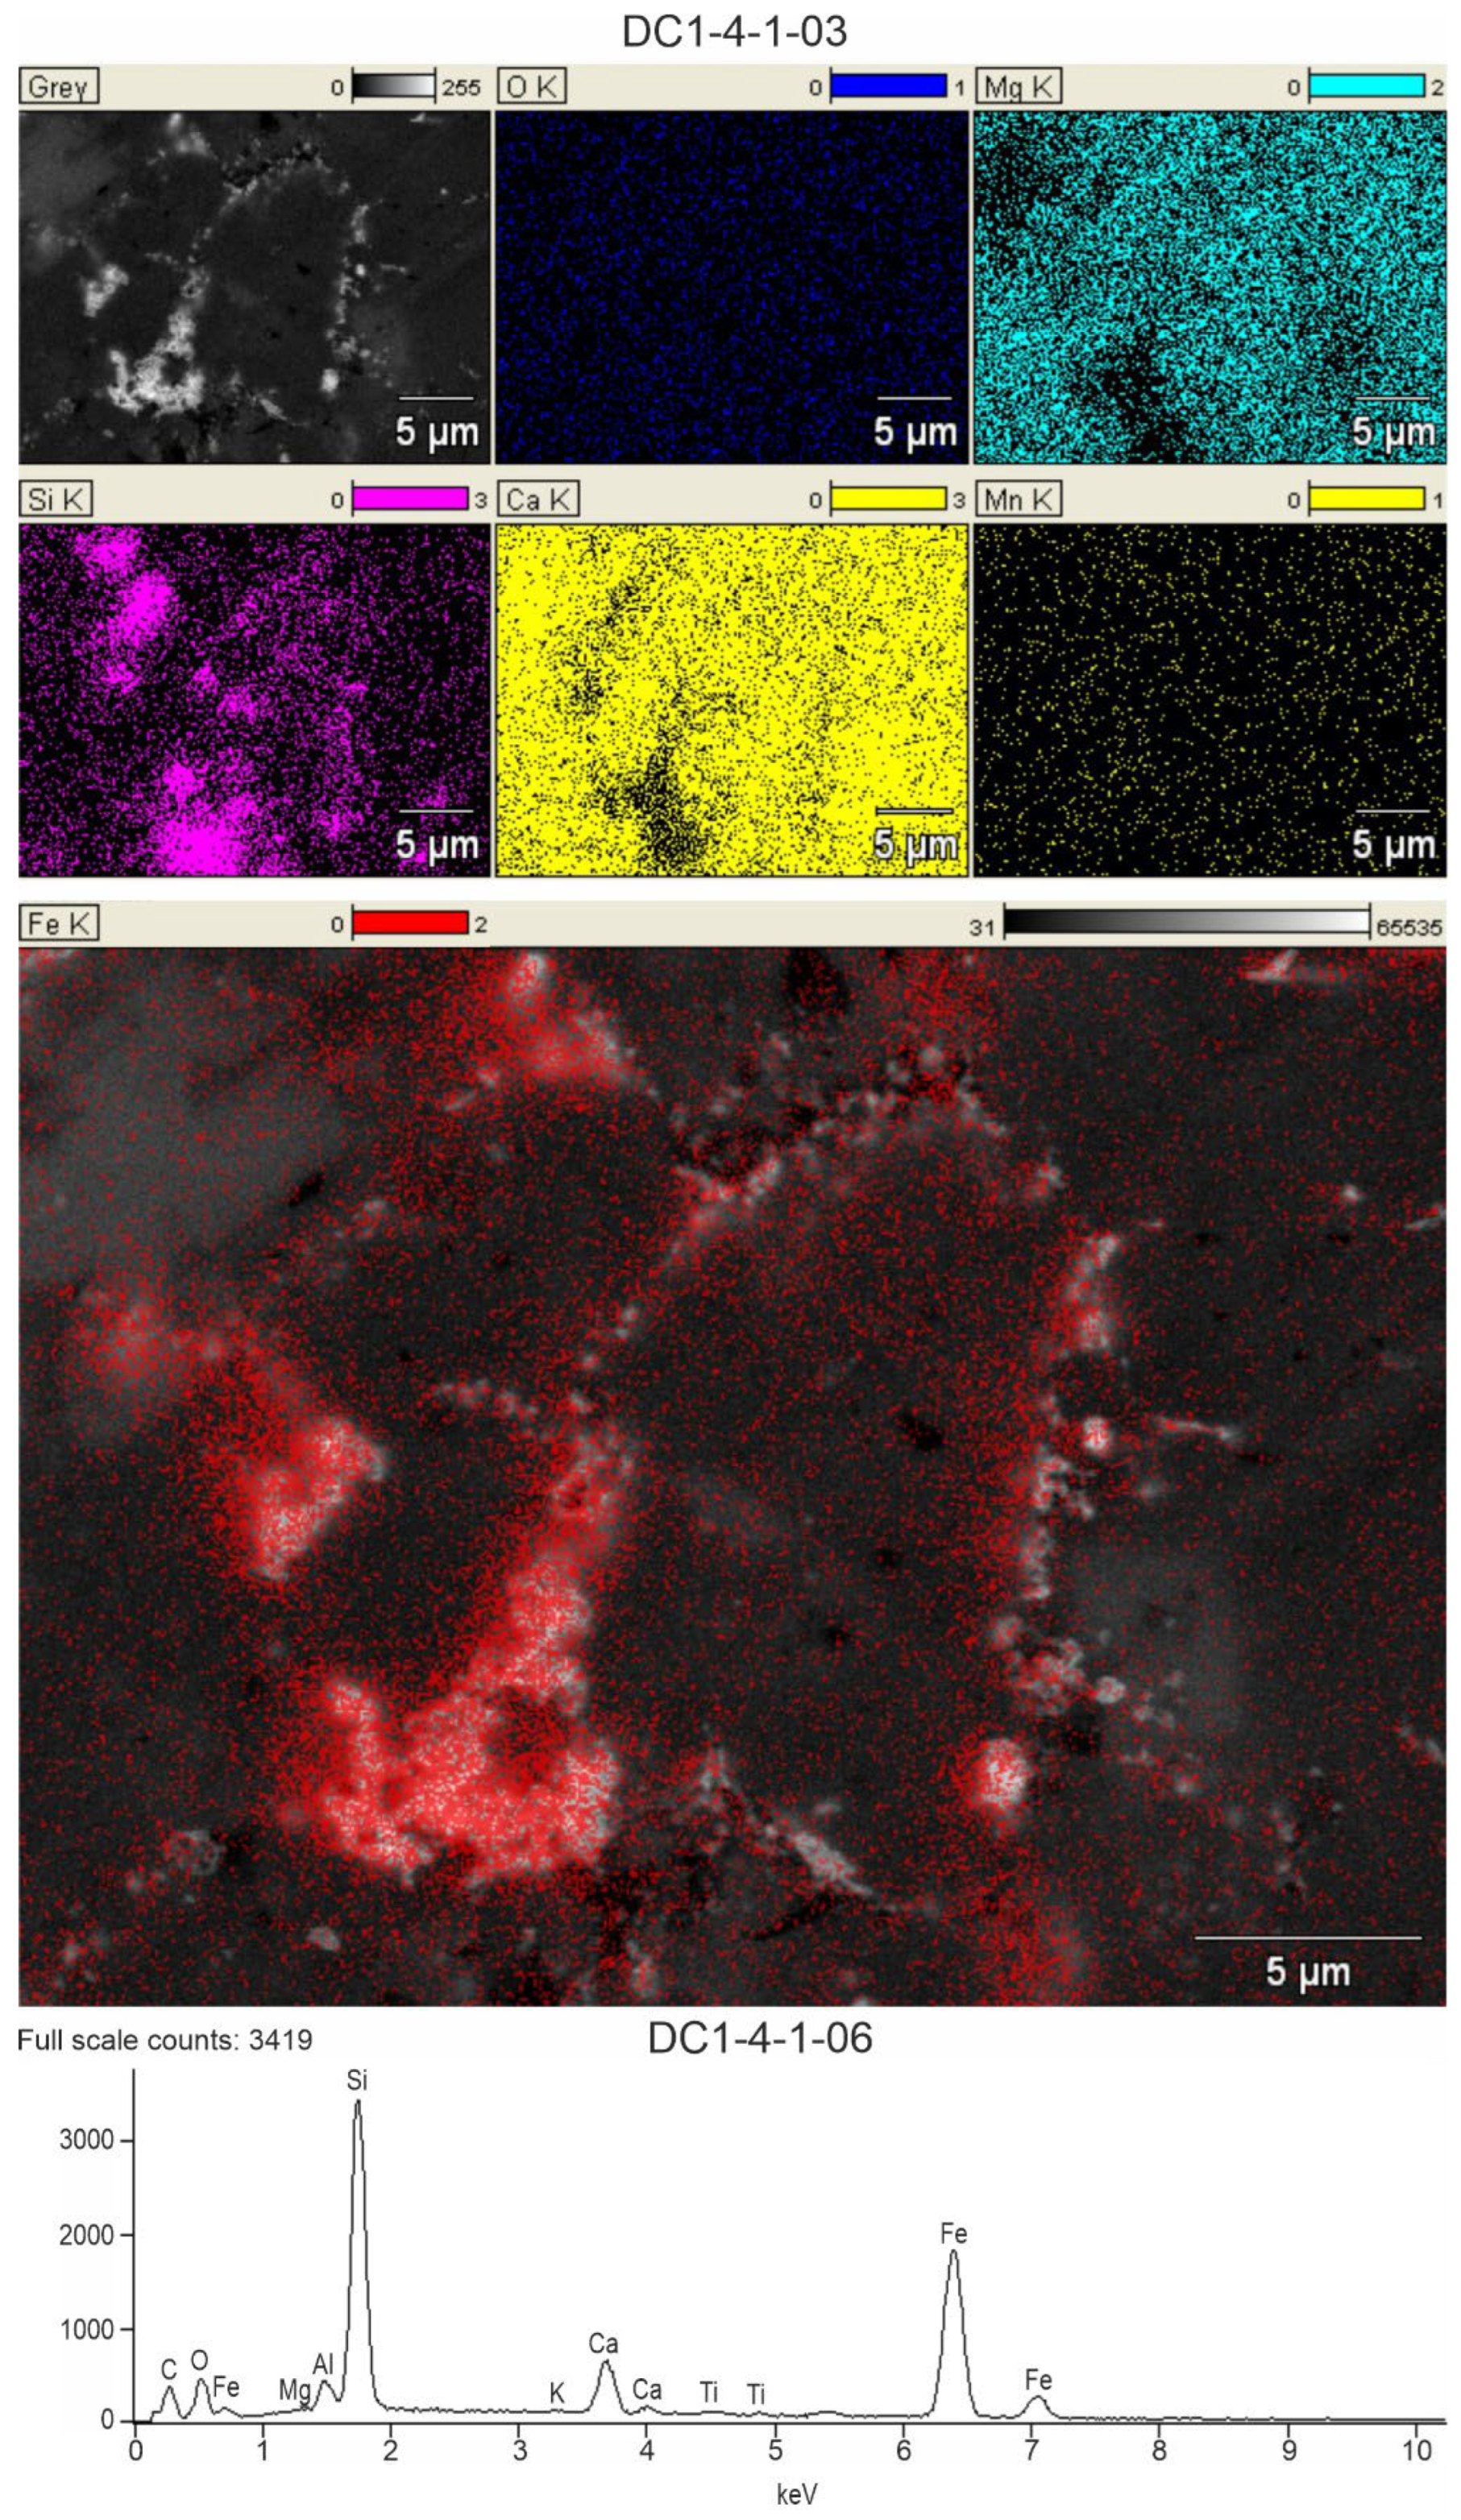
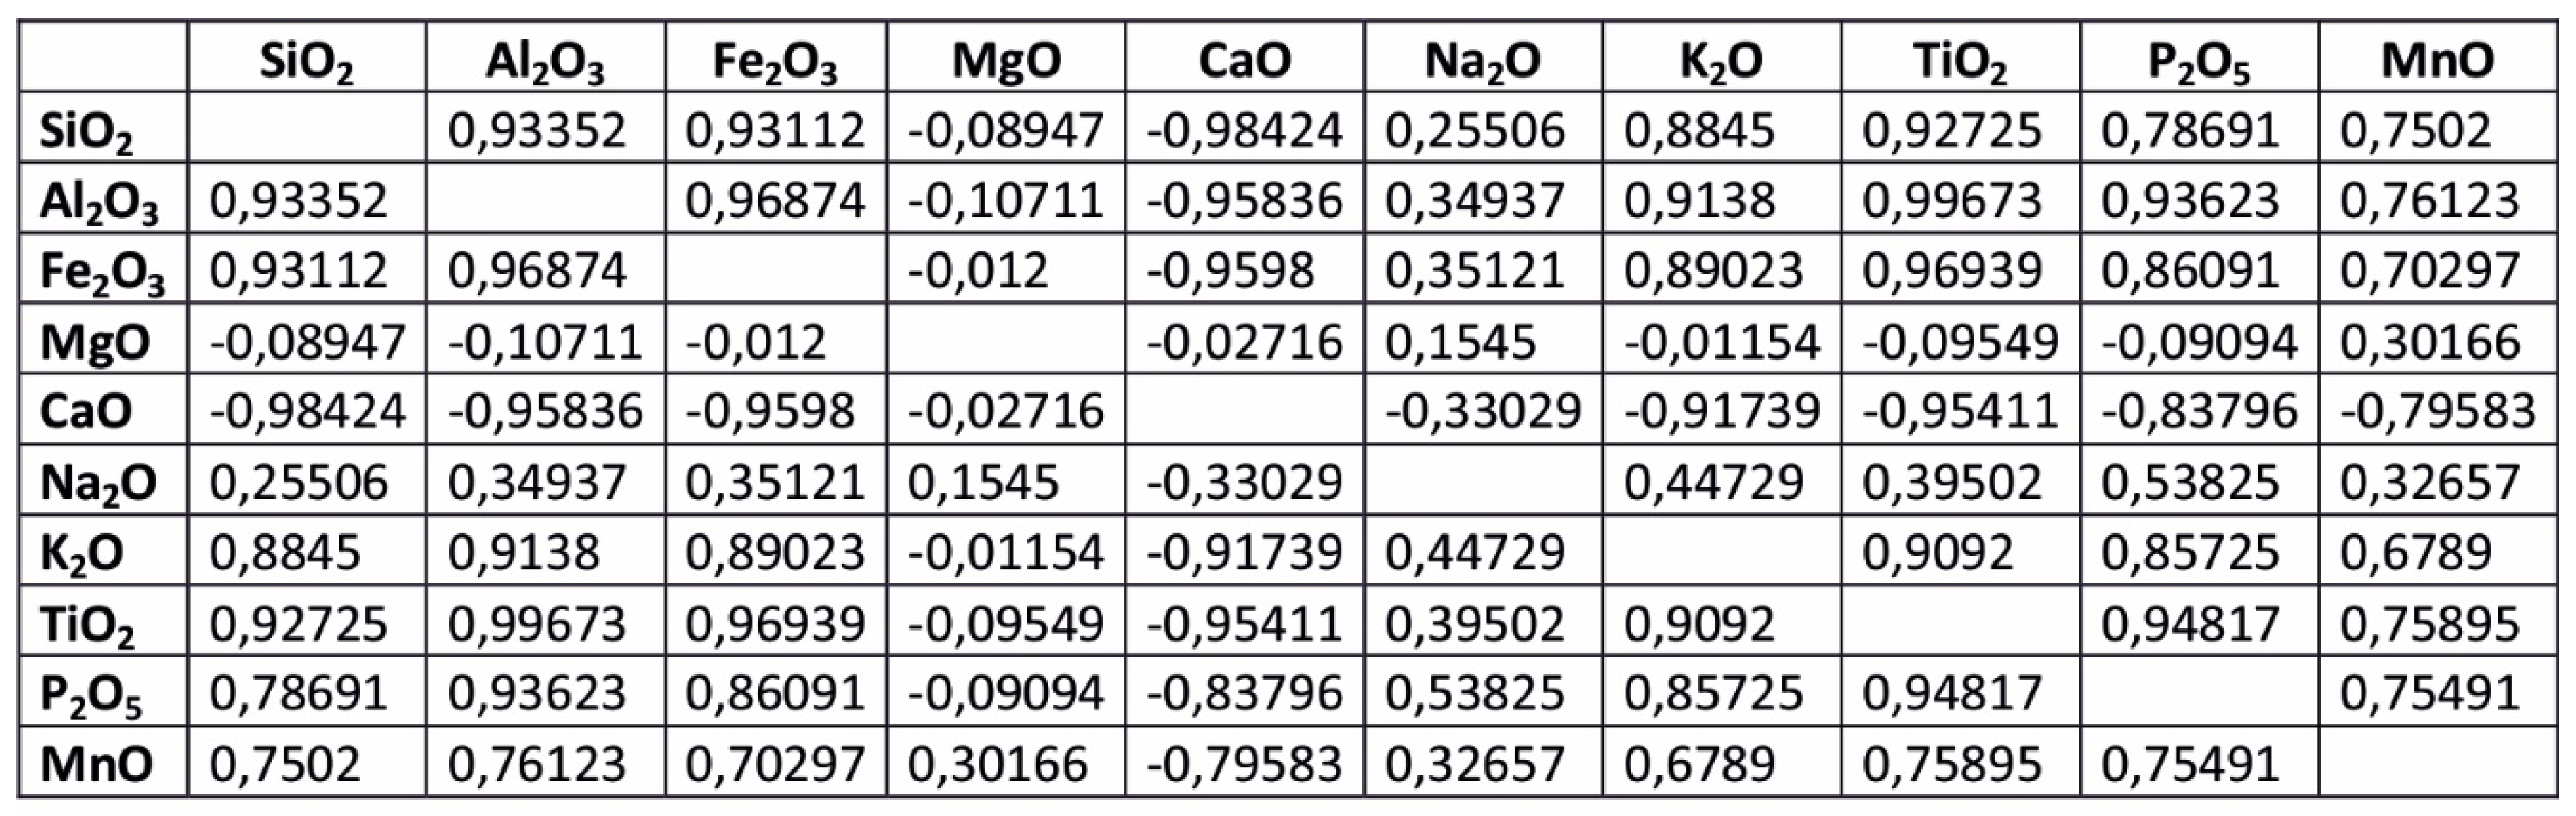
4.4. Correlation Between Main Elements and SEM-EDS Mapping
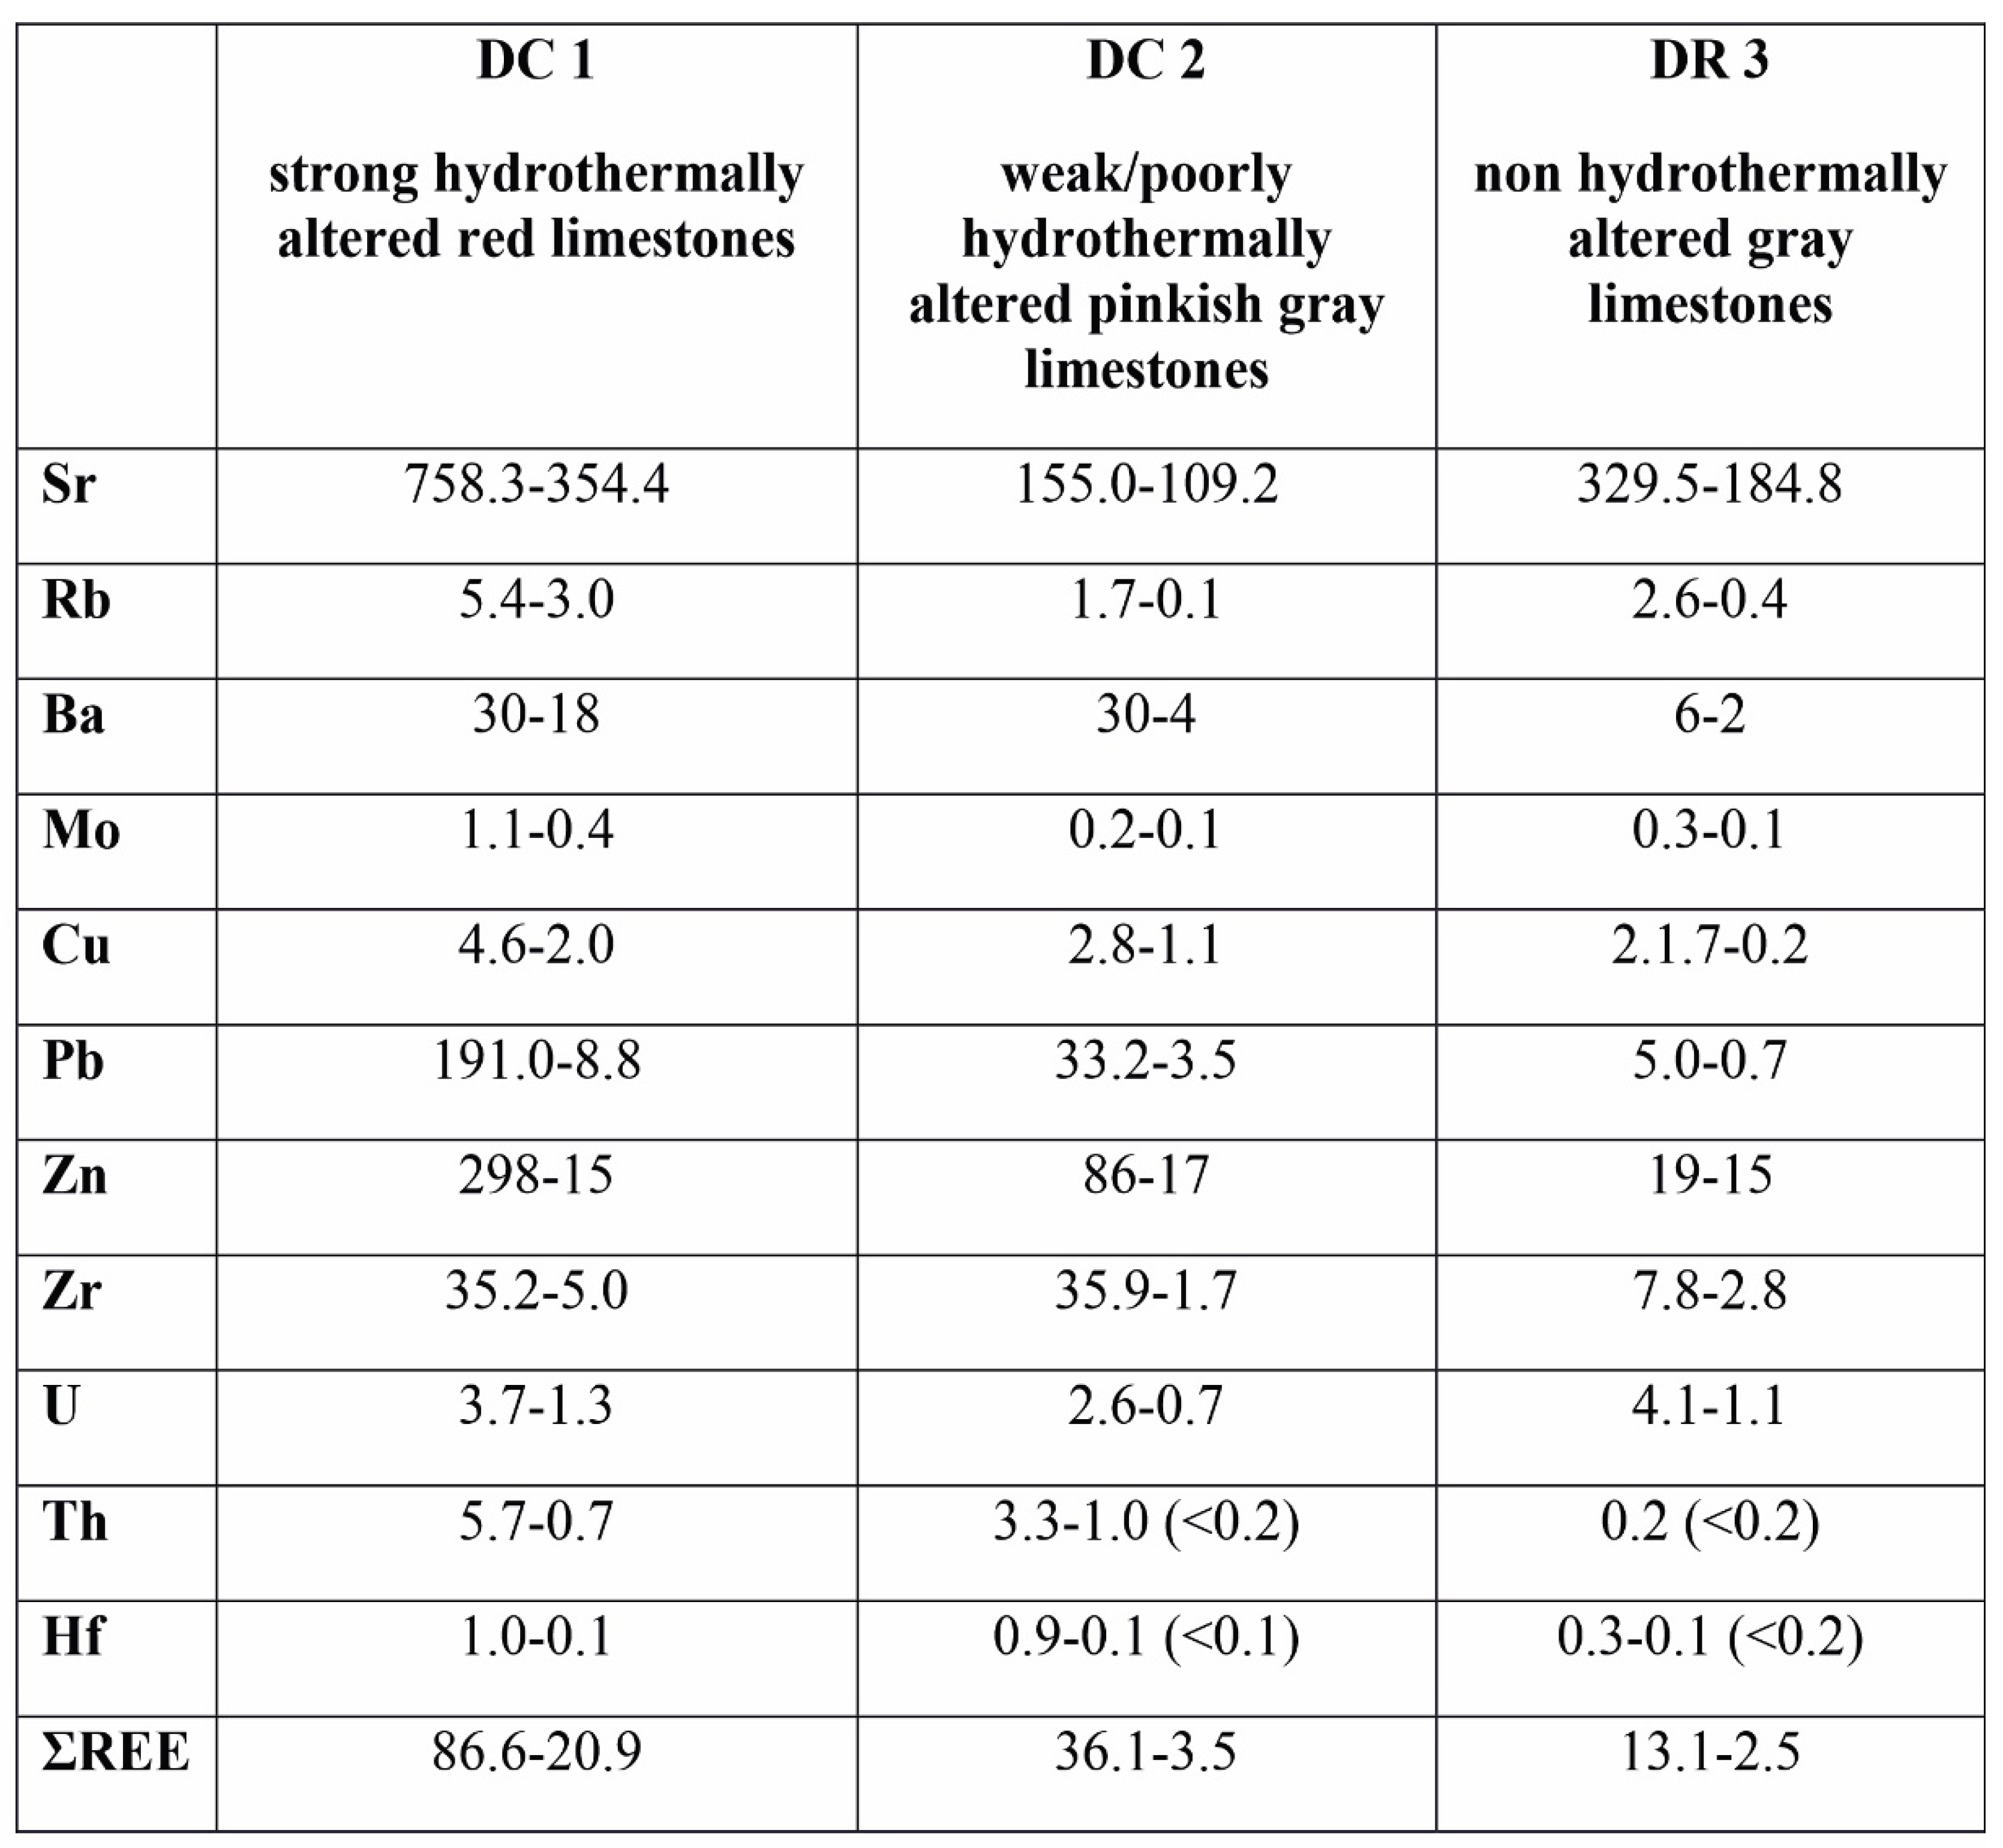
4.5. Trace Elements
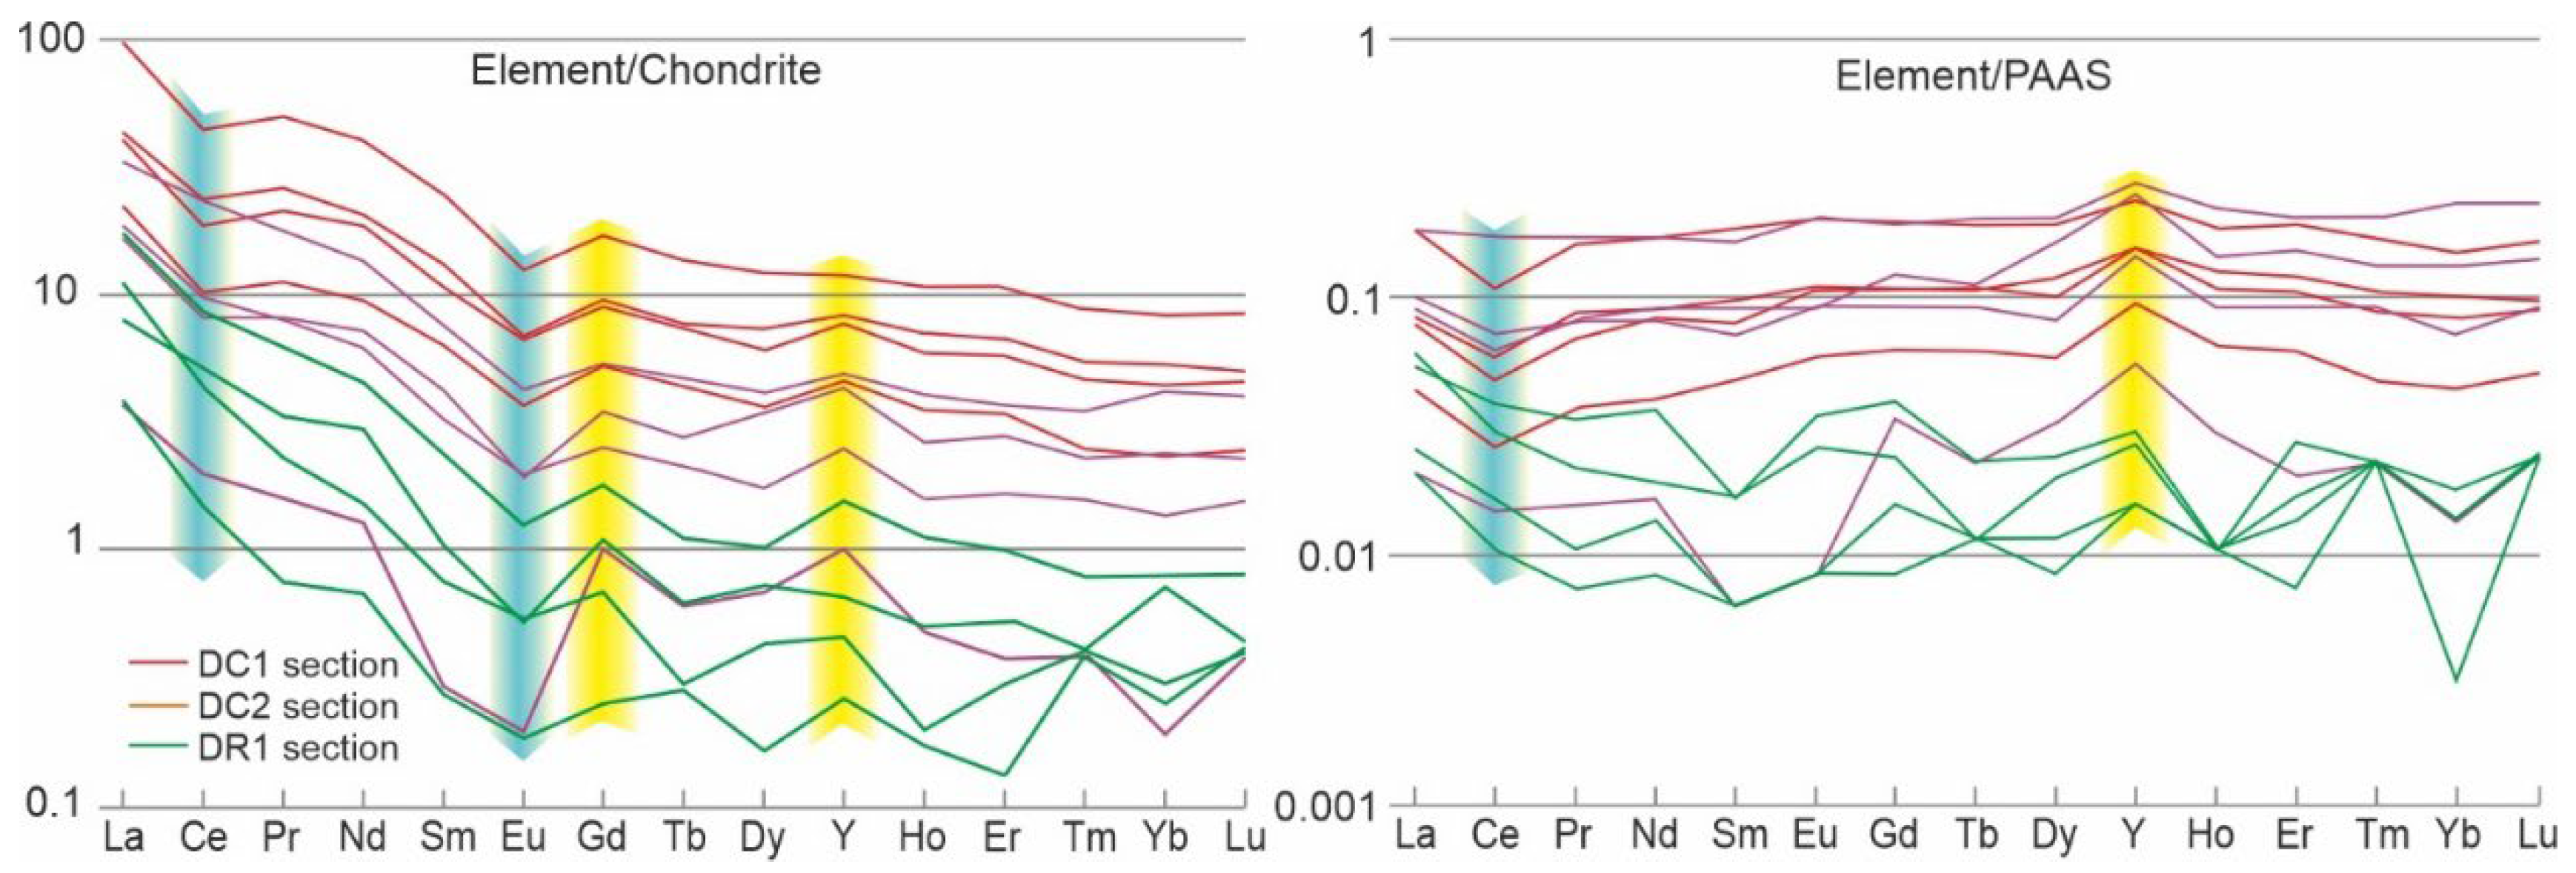
4.6. REE Signatures
5. Discussion
5.1. Bacterial Origin of Rust-Coloured and Brown Pigments
5.2. Timing for IRB Growth
5.3. Potential Sources of Hydrothermal Fluids
6. Conclusions
Data Availability Statement
References
- Volesky, B. Biosorption and Biosorbents. In Biosorption of Heavy Metals, CRC Press: Boca Raton, 1990; pp. 3–5.
- Cygnarowska, K. The use of algae to remove copper and lead from industrial wastewater. Geol., Geoph. and Environ. 2023, 7, 85–93. [CrossRef]
- Gyollai, I.; Polgari, M.; Fintor, K.; Pal-Molnar, E.; Popp, F.; Koeberl, C. Microbial activity records in Marinoan Snowball Earth postglacial transition layers connecting diamictite WITH cap carbonate (Otavi Group, NW-Namibia). Austr. J. Earth Sci. 2017, 110, 4–20. [Google Scholar] [CrossRef]
- Ciurej, A.; Bąk, M.; Szczerba, M. Biostratinomy and diagenetic impact on exceptional preservation of coccospheres from Lower Oligocene coccolith limestones. Minerals 2020, 10, 616. [Google Scholar] [CrossRef]
- Mulder, E.G.; Deinema, M.H. The sheathed bacteria. In The Prokaryotes, A Handbook on the Biology of Bacteria: Ecophysiology, Isolation, Identification, Applications; Balows, A., Ed.; Springer-Verlag, 1992; p. 4126.
- Pan, J.; Zhao, H.; Tucker, M.E.; Zhou, J.; Jiang, M.; Wang, Y.; Zhao, Y.; Sun, B.; Han, Z.; Yan, H. Biomineralization of monohydrocalcite induced by the halophile halomonas smyrnensis WMS-3. Minerals 2019, 9, 632. [Google Scholar] [CrossRef]
- Bąk, M.; Bąk, K.; Górny, Z.; Stożek, B. Evidence of bacteriogenic iron and manganese oxyhydroxides in Albian–Cenomanian marine sediments of the Carpathian realm (Poland). Ann. Soc. Geol. Pol. 2015, 85, 371–385. [Google Scholar] [CrossRef]
- Noike, T.N.; Nakamura, K.; Matsumoto, J. Oxidation of ferrous iron by acidophilic iron-oxidizing bacteria from a stream receiving acid mine drainage. Water Res. 1983, 17, 21–27. [Google Scholar] [CrossRef]
- Schrenk, M.O.; Edwards, K.J.; Goodman, R.M.; Hamers, R.J.; Banfield, J.F. Distribution of Thiobacillus ferrooxidans and Leptospirillum ferrooxidans: implications for generation of acid mine drainage. Science 1998, 279, 1519–1522. [Google Scholar] [CrossRef]
- Kirby, C.S.; Thomas, H.M.; Southam, G.; Donald, R. Relative contributions of abiotic and biological factors in Fe(II) oxidation in mine drainage. App. Geochem. 1999, 14, 511–530. [Google Scholar] [CrossRef]
- Francis, C.A., Tebo, B.M. Marine Bacillus spores as catalysts for the oxidative precipitation and sorption of metals. J. Mol. Microbiol. Biotechnol. 1999, 1, 71–78.
- Konhauser, K.O.; Riding, R. Bacterial biomineralization. In: Fundamentals in Geobiology, Knoll, A.H. et al. Eds; Blackwell Publishing Ltd. 2012; pp. 105–130. Available online: https://robertriding.com/pdf/konhauser_riding2012.pdf.
- Schopf, J.W.; Fairchild, T.R. Late Precambrian microfossils: a new stromatolitic biota from Boorthanna, south Australia. Nature 1973, 242, 537–538. [Google Scholar] [CrossRef]
- Schelble, R.T.; Westall, F.; Allen, C.C. 1.8 Ga iron-mineralized microbiota from the Gunflint Iron Formation, Ontario, Canada: implications for Mars. Adv. Space Res. 2004, 33, 1268–1273. [Google Scholar] [CrossRef]
- Awramik, S.M.; Schopf, J.W., Walter, M.R. Filamentous fossil bacteria from the Archean of Western Australia. Precamb. Res. 1983, 20, 357–374. [CrossRef]
- Sommaruga, R.; Psenner, R. Trophic interactions within the microbial food web in Piburger See (Austria). Archiv Hydrobiol. 1995, 132, 257–278. [Google Scholar] [CrossRef]
- Préat, A.; Loreau, J.P; Durlet, C.; Mamet, B. Petrography and biosedimentology of the Rosso Ammonitico Veronese (Middle–Upper Jurassic, north-eastern Italy). Facies 2006, 52, 265–278. [Google Scholar] [CrossRef]
- Mamet, B.; Préat, A. Iron-bacterial mediation in Phanerozoic red limestones; state of the art. Sedim. Geol. 2006, 185, 147–157. [Google Scholar] [CrossRef]
- Bąk, M.; Natkaniec-Nowak, L.; Naglik, B.; Bąk, K.; Dulemba, P. Organic-walled microfossils from the early Middle Cambrian sediments of the Holy Cross Mountains, Poland: Possible implications for sedimentary environment in the SE margin of the Baltica. Acta Geol. Sin. - English ed. 2017, 91, 39–50. [Google Scholar] [CrossRef]
- Hanert, H.H. Bacterial and chemical iron oxide deposition in a shallow bay on Palaea Kameni, Santorini, Greece: microscopy, electron probe microanalysis, and photometry of in situ experiments. Geomicrobiol. J. 2002, 19, 317–342. [Google Scholar] [CrossRef]
- Hallam, A.; Bradshaw, M.G. Bituminous shales and oolitic ironstones as indicators of transgressions and regressions. J. Geol. Soc. 1979, 136, 157–164. [Google Scholar] [CrossRef]
- Rudmin, R.; Reva, I.; Sokol, E.; Abdullayev, E.; Ruban, A.; Kudryavtsev, A.; Tolkachev, O.; Mazurov, A. Minerals of rare earth elements in high-phosphorus ooidal ironstones of the Western Siberia and Turgai Depression. Minerals 2020, 10, 11. [Google Scholar] [CrossRef]
- Krajewski, K. Pelagic stromatolites from the High-Tatric Albian limestones in the Tatra Mts. Kwart. Geol. 1981, 25, 731–759. [Google Scholar]
- Bąk, M.; Górny, Z.; Bąk, K. Sponge growth on the Cenomanian carbonate shelves of the Carpathian Basin: a record from spicule-rich turbidites. Bull. Geosci. 2015, 90, 651–666. [Google Scholar] [CrossRef]
- Boyd, T.D.; Scott, S.D. Microbial and hydrothermal aspects of ferric oxyhydroxides and ferrosic hydroxides: the example of Franklin Seamount, Western Woodlark Basin, Papua New Guinea. Geochem. Transact. 2001, 7, 45. [Google Scholar] [CrossRef]
- Mazur, S.; Aleksandrowski, P.; Gągała, Ł.; Krzywiec, P.; Żaba, J.; Gaidzik, K. Late Palaeozoic strike--slip tectonics versus oroclinal bending at the SW outskirts of Baltica: case of the Variscan belt’s eastern end in Poland. Int. J. Earth Sci. 2020, 109, 1133–1160. [Google Scholar] [CrossRef]
- Dvorák, J.; Galle, A.; Herbig, H.G.; Krejèí, Z.; Malec, J.; Paszkowski, M.; Racki, G.; Skompski, S.; Szulczewski, M.; Żakowa, H. Evolution of the Polish-Moravian carbonate platform in the Late Devonian and Early Carboniferous: Holy Cross Mts., Krakow Upland, Moravian Karst. In XIII International Congress on Carboniferous-Permian; Guide to Excursion B4; Małecka, J., Ed.; Państwowy Instytut Geologiczny: Warszawa, 1995; pp. 1–35. [Google Scholar]
- Alexandrowicz, S.W.; Siedlecka, A. Lithological profile of Dinantian limestones of Czerna near Krzeszowice. Ann. Soc. Geol. Pol. 1964, 34, 395–423. [Google Scholar]
- Timmerman, M.J. Timing, geodynamic setting and character of Permo-Carboniferous magmatism in the foreland of the Variscan Orogen, NW Europe. Geol. Soc. London Spec. Publ. 2004, 223, 41–74. [Google Scholar] [CrossRef]
- Mikulski, S.Z.; Williams, I.S.; Markowski, M. Carboniferous–Permian magmatism and Mo–Cu (W) mineralization in the contact zone between the Małopolska and Upper Silesia Blocks (south Poland): an echo of the Baltica–Gondwana collision. Int. J. Earth Sci. 2019, 108, 1467–1492. [Google Scholar] [CrossRef]
- Sass-Gustkiewicz, M.; Dżułyński, S.; Ridge, J.D. The emplacement of zinc-lead sulfide ores in the Upper Silesian district – A contribution to the understanding of Mississippi Valley-type deposits. Econ. Geol. 1982, 77, 392–412. [Google Scholar] [CrossRef]
- Żaba, J.; Buła, A.; Jachowicz, M. Principal characteristics of the Upper Silesian Block and Małopolska Block border zone (southern Poland). Geol. Mag. 1997, 5, 669–677. [Google Scholar] [CrossRef]
- Kalvoda, J.; Leichmann, J.; Bábek, O.; Melichar, R. Brunovistulian terrane (Central Europe) and Istanbul Zone (NW Turkey): late Proterozoic and Paleozoic tectonostratigraphic development and paleogeography. Geol. Carp. 2003, 54, 139–152. [Google Scholar]
- Buła, Z.; Habryn, R.; Jachowicz-Zdanowska, M.; Żaba, J. The Precambrian and Lower Paleozoic of the Brunovistulicum (eastern part of the Upper Silesian Block, southern Poland) – the state of the art. Geol. Quart. 2015, 59, 123–134. [Google Scholar] [CrossRef]
- Belka, Z. The development and decline of a Dinantian carbonate platform: an example from the Moravia-Silesia Basin, Poland. In: European Dinantian environments, Miller J., Wright, P.V., Adams, A.E.; Eds; John Wiley & Sons, 1987; pp. 177–188.
- Hladil, J. Structure and microfacies of Middle and Upper Devonian Carbonate Buildups in Moravia, Czechoslovakia. Mem. Canad. Soc. Petrol. Geol. 1988, 14, 607–618. [Google Scholar]
- Szulczewski, M.; Belka, Z.; Skompski, S. The drowning of a carbonate platform: an example from the Devonian–Carboniferous of the south western Holy Cross Mountains, Poland. Sedim. Geol. 1996, 106, 21–49. [Google Scholar] [CrossRef]
- Bábek, O. Thinning and wining upward megasequence in Middle Devonian carbonate slope deposits, Moravia, Czech Republic. N. Jb. Geol. Paläont. Abh. 1996, 202, 409–432. [Google Scholar] [CrossRef]
- Dvořák, J. The Famennian of Moravia (CSSR); the relation between tectonics and sedimentary facies. Ann. Soc. Geol. Belg. 1986, 109, 131–136. [Google Scholar]
- Szulczewski, M. Depositional evolution of the Holy Cross Mts. (Poland) in the Devonian and Carboniferous—a review. Geol. Quart. 1995, 39, 471–488. [Google Scholar]
- Bábek, O., Plikryl, T., Hladil, J. Progressive drowning of carbonate platform in the Moravo-Silesian Basin (Czech Republic) before the Frasnian/Famennian event: facies, compositional variations and gamma-ray spectrometry. Facies 2007, 53, 293–316. [CrossRef]
- Franke, W.; Cocks, R.M.; Torsvik, T.H. The Palaeozoic Variscan oceans revisited. Gondwana Res. 2017, 48, 257–284. [Google Scholar] [CrossRef]
- Słaby, E.; Breitkreuz, C.; Żaba, J.; Domańska-Siuda, J.; Gajdzik, K.; Falenty, K.; Falenty, A. 2010. Magma generation in an alternating transtensional–transpressional regime, the Kraków–Lubliniec Fault Zone, Poland. Lithos 2010, 119, 251–268. [Google Scholar] [CrossRef]
- Harańczyk, C. Mineral parageneses of Cracovides and its cover (Southern Poland). Ann. Soc. Geol. Pol. 1985, 53, 91–126. [Google Scholar]
- Czerny, J.; Muszyński, M. Co-magmatism of the Permian volcanites of the Krzeszowice area in the light of petrochemical data. Miner. Pol. 1997, 28, 3–25. [Google Scholar]
- Lewandowska, A.; Rospondek, M.J.; Nawrocki, J. 2010. Stephanian–Early Permian intermediate volcanic rocks from the Nieporaz-Brodla and Sławków grabens near Kraków, Southern Poland. Ann. Soc. Geol. Pol. 2010, 80, 227–251. [Google Scholar]
- Lewandowska, A.; Rospondek, M.J.; Kobuszewski, Ł. Alleged Carboniferous (Viséan) volcanism at the eastern margin of the Moravo-Silesian Basin, Kraków region, southern Poland. Ann. Soc. Geol. Pol. 2018, 88, 59–69. [Google Scholar] [CrossRef]
- Nawrocki, J.; Lewandowska, A.; Fanning, M. Isotope and paleomagnetic ages of the Zalas rhyodacites (S Poland). Przegl. Geol. 2007, 55, 476–478. [Google Scholar]
- Nawrocki, J.; Fanning, M.; Lewandowska, A.; Polechońska, O.; Werner, T. Palaeomagnetism and the age of the Cracow volcanic rocks (S Poland). Geoph. J. Intern. 2008, 174, 475–488. [Google Scholar] [CrossRef]
- Nawrocki, J.; Krzemiński, L.; Pańczyk, M. 40Ar-39Ar ages of selected rocks and minerals from the Kraków–Lubliniec Fault Zone, and their relation to the Paleozoic structural evolution of the Malopolska and Brunovistulian terranes (S Poland). Geol. Quart. 2010, 54, 289–300. [Google Scholar]
- Szulc, J. Anisian–Carnian evolution of the Germanic basin and its eustatic, tectonic and climatic controls. Zentralblatt für Geologie und Paläeontologie 1999, 1, 813–852. [Google Scholar]
- Leach, D.L.; Viets, J.G.; Kozłowski, A.; Kibitlewski, S. Geology, geochemistry, and genesis of the Silesia-Kraków zinc-lead district, southern Poland. Soc. Econ. Geol. Spec. Publ. 1996, 4, 171–181. [Google Scholar]
- Szuwarzyński, M. Ore bodies in the Silesia-Cracow Zn-Pb ore district, Poland. Prace Państw. Inst. Geol. 1996, 154, 9–24. [Google Scholar]
- Mikulski, S.Z.; Oszczepalski, S.; Sadłowska, K.; Chmielewski, A.; Małek, R. The occurrence of associated and critical elements in selected documented Zn-Pb, Cu-Ag, Fe-Ti-V, Mo-Cu-W, Sn, Au-As and Ni deposits in Poland. (In Polish). Biul. Państw. Inst. Geol. 2018, 472, 21–52. [Google Scholar] [CrossRef]
- Szczurek, S. Late Devonian–Early Carboniferous Foraminifera of the Upper Silesian Block (Kraków region, southern Poland). Geol. Quart. 2023, 67, 36. [Google Scholar] [CrossRef]
- Lawrence, M.G.; Kamber, B.S. The behaviour of the rare earth elements during estuarine mixing—revisited. Mar. Chem. 2006, 100, 147–161. [Google Scholar] [CrossRef]
- Morse, J.W.; Mackenzie, F.T. Geochemistry of sedimentary carbonates. In Developments in Sedimentology; Elsevier: Amsterdam, 1990, 48, 706 pp.
- Shields, G.A.; Webb, G.R. Has the REE Composition of Seawater Changed over Geological Time? Chem. Geol., 2004, 1–2, 103–107. [Google Scholar] [CrossRef]
- Chan, C.S.; Fakra, S.C.; Emerson, D.; Fleming, E.J.; Edwards, K.J. Lithotrophic iron-oxidizing bacteria produce organic stalks to control iron mineral growth: implications for biosignature formation. ISME J. 2011, 5, 717–727. [Google Scholar]
- Comolli, L.R.; Luef, B.; Chan, C.S. High-resolution 2D and 3D cryo-TEM reveals structural adaptations of two stalk-forming bacteria to an Fe-oxidizing lifestyle. Environ. Microbiol. 2011, 13, 2915–2929. [Google Scholar] [CrossRef]
- Emerson, D.; Moyer, C.L. Microbiology of Seamounts: Common Patterns Observed in Community Structure. Oceanography, 2002, 23, 148–163. [Google Scholar] [CrossRef]
- Van Veen, W.L.; Mulder, E.G; Deinema, M.H. The Sphaerotilus-Leptothrix group of bacteria. Microbiol. Rev. 1978, 42, 329–356. [Google Scholar] [CrossRef]
- Paszkowski, M., Description of stops-Cracow region. In Evolution of the Polish-Moravian carbonate platform in the Late Devonian and Early Carboniferous: Holy Cross Mts., Krakow Upland, Moravian Karst; J. Dvorák et al., Eds. XIII International Congress on Carboniferous-Permian, Excursion, B-4; Państwowy Instytut Geologiczny: Warszawa, 1995; pp. 23–28.
- Kalvoda, J.; Bábek, O.; Leichmann, J.; Fatka, O.; Laichmann, J.; Melichar, R.; Nechyba, S.; Spacek, P. Brunovistulian terrane (Bohemian Massif, Central Europe) from late Proterozoic to late Paleozoic: a review. Int. J. Earth Sci. 2007, 97, 497–518. [Google Scholar] [CrossRef]
- Belka, Z.; Valverde-Vaquero, P.; Dörr, W.; Ahrendt, H.; Wemmer, K.; Franke, W.; Schafer, J. Accretion of first Gondwana-derived terranes at the margin of Baltica. Geol. Soc. London, Sp. Public. 2002, 201, 19–36. [Google Scholar] [CrossRef]
- Madondo, J.; Canet, C.; Núñez-Useche, F.; González-Partida, E. Geology and geochemistry of jasperoids from the ‘Montaña de Manganeso’ district, San Luis Potosí, north-central Mexico. Rev. Mexic. Cien. Geol. 2021, 38, 193–209. [Google Scholar] [CrossRef]
- Piepgras, D.J.; Gacobsen, S.B. The behavior of rare earth elements in seawater: Precise determination of variations in the North Pacific water column. Geochim. Cosmochim. Acta 1992, 56, 1851–1862. [Google Scholar] [CrossRef]
- Piper, D.Z.; Bau, M. Normalized rare earth elements in water, sediments, and wine: identifying sources and environmental redox conditions. Am. J. Analyt. Chem. 2013, 4, 69–83. [Google Scholar] [CrossRef]
- Siedlecka, A.; Krysowska, M. Studies of origin and distribution of the Karniowice sandstones north of the Krzeszowice graben. Ann. Soc. Geol. Pol. 1962, 32, 371–398. [Google Scholar]
- Wolska, A. Petrology and geochemistry of granitoids and their mafc microgranular enclaves (MME) in marginal part of the Małopolska Block (S Poland). Mineralogia 2012, 43, 3–127. [Google Scholar] [CrossRef]
- Truszel, M.; Karwowski, Ł.; Lasoń, K.; Markiewicz, J.; Żaba, J. Magmatism and metamorphism of the Kraków–Lubliniec tectonic zone as a clue to the occurrence of polymetallic deposits. (English summary). Biul. Państw. Inst. Geol. 2006, 418, 55–103. [Google Scholar]
- Piekarski, D. Metallogenic and prognostic analysis of the Paleozoic sequence of the NE margin of the Upper Silesian Coal Basin. Ann. Soc. Geol. Pol. 1985, 53, 207–234. [Google Scholar]
- Harańczyk, C.; Lankosz, A.; Wolska, A. Jerzmanowice granodioryte, porphyres and Co-Mo ores. (in Polish). Rudy i Metale Nieżelazne 1995, 40, 334–341. [Google Scholar]
- Koszowska, E.; Wolska, A. Mineralogical and geochemical study of thermally altered country rocks of granodioritic intrusion in the Będkowska Valley near Kraków (S Poland). Ann. Soc. Geol. Pol. 2000, 70, 261–280. [Google Scholar]
- Truszel, M.; Karwowski, Ł. Skarns and skarn mineralization in the Cracow-Lubliniec region (Southern Poland). Mineral. Soc. Poland Spec. Papers 2003, 23, 175–178. [Google Scholar]
- Oszczepalski, S.; Markowiak, M.; Mikulski, S.Z.; Lasoń, K.; Buła, Z.; Habryn, R. Porphyry Mo–Cu–W mineralization within Precambrian-Paleozoic rocks—prospectivity analysis of the border zone of the Upper Silesia and Małopolska Blocks. (in Polish with English summary). Biul. Państw. Inst. Geol. 2010, 439, 339–354. [Google Scholar]
- Mikulski, S.Z.; Oszczepalski, S.; Markowiak, M. The occurrence and prospective resources of molybdenum and tungsten ores in Poland. (English summary). Biul. Państw. Inst. Geol. 2012, 465, 297–314. [Google Scholar]
- Markowiak, M. Description of ore mineralization against the background of thermal-metasomatic alterations of rocks in the Żarki-Kotowice area. (in Polish). Prace Państw. Inst. Geol. 2015, 203, 74. [Google Scholar]
- Mikulski, S.Z.; Markowiak, M.; Sadłowska, K.; Chmielewski, A.; Zieliński, G. Pilot studies of rare earths (REE) in the contact zone of the Upper Silesia Block with the Małopolska Block. (English summary). Biul. Państw. Inst. Geol. 2015, 465, 77–98. [Google Scholar] [CrossRef]
- Małek, R. Porphyry-type Cu-Mo mineralization in the Będkowska Valley region of the Kraków-Częstochowa Upland. (English summary). Prz. Geol. 2018, 66, 252–258. [Google Scholar]
- Sass-Gustkiewicz, M.; Dżułyński, S. On the origin of strata-bound Zn-Pb ores in the Upper Silesia, Poland. An. Geol. Soc. Pol. 1998, 68, 267–278. [Google Scholar]
- Heijlen, W., Muchez, P., Banks, D.A., Schneider, J., Kucha, H., 2003. Carbonate-hosted Zn-Pb deposits in Upper Silesia, Poland: Origin and evolution of mineralizing fluids and constraints on genetic models. Econ. Geol. 2003, 9, 911–932. [CrossRef]
- Mikulski, S.Z.; Oszczepalski, S.; Sadłowska, K.; Chmielowski, A.; Małek, R. Trace Element Distributions in the Zn-Pb (Mississippi Valley-Type) and Cu-Ag (Kupferschiefer) Sediment-Hosted Deposits in Poland. Minerals 2020, 10, 75. [Google Scholar] [CrossRef]
- Żelaźniewicz, A.; Aleksandrowski, P.; Buła, Z; Karnkowski, P.H.; Konon, A.; Oszczypko, N.; Ślączka, A.; Żaba, J.; Żytko, K. Tectonic subdivision of Poland. Komitet Nauk Geologicznych PAN, Wrocław, 2011; 60 pp. Available online: https://www.kngpan.agh.edu.pl/wp-content/uploads/Regionalizacja_Tektoniczna_Polski_20111.pdf.
- Gradziński, R. Przewodnik Geologiczny po okolicach Krakowa. (in Polish) Wydawnictwa Geologiczne: Warszawa, 1972; 334 pp.
- McDonough, W.F.; Sun, S.S. Composition of the Earth. Chem.Geol. 1995, 120, 223–253. [Google Scholar] [CrossRef]
- Taylor, S.R.; McLennan, S.M. The Continental Crust: Its Composition and Evolution: An Examination of the Geochemical Record Preserved in Sedimentary Rocks. Carlton: Blackwell Scientific Publication: Oxford, 1985; 312 pp. Available online: https://core.ac.uk/download/621678419.pdf.
- McLennan, S.M. Relationships between the trace element composition of sedimentary rocks and upper continental crust. Geochem. Geoph. Geosys. 2001, 2, 1–24. [Google Scholar] [CrossRef]

 |
 |
 |
 |
 |
Disclaimer/Publisher’s Note: The statements, opinions and data contained in all publications are solely those of the individual author(s) and contributor(s) and not of MDPI and/or the editor(s). MDPI and/or the editor(s) disclaim responsibility for any injury to people or property resulting from any ideas, methods, instructions or products referred to in the content. |
© 2025 by the authors. Licensee MDPI, Basel, Switzerland. This article is an open access article distributed under the terms and conditions of the Creative Commons Attribution (CC BY) license (http://creativecommons.org/licenses/by/4.0/).


