Submitted:
14 October 2025
Posted:
15 October 2025
You are already at the latest version
Abstract
The environmental footprint of cryptocurrency networks, particularly the electricity-intensive Bitcoin (BTC) blockchain, has raised growing concern among policymakers, investors, and environmental organisations. This study examines how major global environmental events and climate policy announcements influence Bitcoin’s return and risk dynamics, linking digital asset markets to sustainability debates. Thirteen events between 2012 and 2023—including multilateral agreements (e.g., the Paris Agreement), COP summits, extreme weather disasters, and national policy interventions—are analysed using an event study framework integrated with the Capital Asset Pricing Model (CAPM) and GARCH-based volatility modelling. We hypothesize that highly visible policy events generate stronger short-run abnormal returns than climate disasters, while disasters produce more persistent effects on volatility. Results confirm this distinction: events such as the U.S. Paris Agreement withdrawal triggered immediate and significant reactions, whereas major weather disasters induced longer-term volatility adjustments. While overall systematic risk remained stable, event-specific responses revealed shifts in Bitcoin’s sensitivity to global equity markets. Climate-related signals shape speculative digital asset markets, with implications for sustainable finance, climate risk assessment, and regulatory policy design. climate-related news can shape investor perceptions of energy-intensive digital assets, with implications for environmental policy design, sustainable finance strategies, and climate risk assessment. For policymakers, the results highlight the potential of environmental signals to influence speculative markets, supporting the case for integrating financial market behaviour into environmental management and regulatory planning.
Keywords:
Bitcoin (BTC)
; cryptocurrency markets
; environmental events
; climate policy
; sustainable finance
1. Introduction
The rapid expansion of the cryptocurrency market, led by Bitcoin (BTC), has drawn increasing attention from academics, regulators, and environmental policymakers [1,2,3]. As a decentralised digital asset underpinned by an energy-intensive proof-of-work consensus mechanism, Bitcoin’s market valuation is shaped not only by macro-financial and technological factors but also by its substantial environmental footprint. The network’s electricity consumption, carbon emissions, electronic waste, and water usage position it as a focal point in global sustainability debates. According to the Digiconomist Bitcoin Energy Consumption Index, Bitcoin consumes approximately 175.87 terawatt-hours (TWh) of electricity annually, comparable to the energy usage of Poland, emitting around 98.10 million tonnes of CO₂, which parallels Qatar’s annual carbon footprint. Additionally, the network generates roughly 20.40 kilotons of electronic waste, akin to that of the Netherlands, and consumes an estimated 2,772 gigalitres of water, matching Switzerland’s yearly usage.1 These environmental externalities underscore Bitcoin’s relevance to environmental management, particularly in the context of climate change mitigation and energy policy.
Climate-related events, ranging from multilateral agreements and regulatory measures to extreme weather disasters, act as high-visibility informational shocks that can reshape investor perceptions of Bitcoin’s long-term viability. Such events have the potential to influence expectations about regulatory intervention, reputational risk, and the future sustainability of energy-intensive digital assets. From an environmental management perspective, understanding how financial markets respond to these events is essential for anticipating the broader socio-economic implications of climate policy and for designing regulatory frameworks that consider market dynamics. While previous research has extensively explored cryptocurrency price reactions to macroeconomic, geopolitical, and regulatory announcements [4,5], far less attention has been paid to the influence of environmental news, particularly climate-related shocks, on cryptocurrency returns and risk. Moreover, existing event studies often focus solely on price efficiency, without incorporating volatility dynamics or environmental dimensions that are increasingly relevant in sustainable finance [6,7].
This gap is significant for three reasons. First, Bitcoin’s environmental footprint has become a growing concern for institutional investors, financial regulators, and environmental advocates, raising questions about its compatibility with global net-zero commitments [8,9]. Second, climate-related events increasingly shape the discourse on sustainable finance, influencing capital allocation and investment strategies across asset classes [10]. Third, the integration of environmental policy considerations into financial risk assessment is central to advancing climate-resilient economies, making it necessary to examine whether and how cryptocurrency markets internalise sustainability-related information [11,12]
This study addresses these gaps by investigating the short-run return and risk responses of Bitcoin to thirteen globally significant environmental events between 2012 and 2023. The events span multilateral climate agreements (e.g., Paris Agreement, COP summits), national climate policy actions (e.g., U.S. Inflation Reduction Act, China’s plastics ban), and extreme weather disasters (e.g., Typhoon Haiyan). By combining an event study framework with the Capital Asset Pricing Model (CAPM) [11] and GARCH-based volatility modelling [13,14], the analysis captures abnormal returns, shifts in systematic risk, and changes in volatility before and after each event.
The contribution of this research is twofold. Empirically, it provides novel evidence on the heterogeneous nature of cryptocurrency market reactions to environmental and climate policy events, distinguishing between immediate, short-lived adjustments and persistent post-event effects. Conceptually, it extends the environmental finance literature by positioning Bitcoin’s market behaviour within the broader framework of environmental management, offering insights into how climate-related signals can influence speculative markets. For policymakers and environmental managers, the findings have practical implications for designing regulatory strategies that address the environmental impact of emerging digital technologies while considering their market sensitivities.
Results indicate that certain events, especially those with high policy visibility, such as the U.S. Paris Agreement withdrawal, generate immediate and statistically significant abnormal returns, while others, including major climate disasters, produce more persistent post-event effects. Aggregate systematic risk remains largely unchanged; however, event-specific analysis reveals heterogeneous responses, with some announcements significantly altering Bitcoin’s sensitivity to global equity markets. These findings extend the environmental finance literature by demonstrating that climate-related news can shape investor perceptions of energy-intensive digital assets, with implications for environmental policy design, sustainable finance strategies, and climate risk assessment. For policymakers, the results highlight the potential of environmental signals to influence speculative markets, supporting the case for integrating financial market behaviour into environmental management and regulatory planning.
The remainder of the paper is structured as follows. Section 2 reviews the literature on cryptocurrency market dynamics, environmental finance, and event study applications. Section 3 outlines the data and methodology, including the event selection process and econometric models. Section 4 presents the empirical results on returns, systematic risk, and volatility. Section 5 concludes and proposes directions for future research.
2. Literature Review
Over the past decade, Bitcoin (BTC) has evolved into a central component of the global cryptocurrency ecosystem, attracting sustained interest from academics, institutional investors, and regulators [1,2,5]. Its decentralisation, high volatility, and minimal regulatory oversight have positioned it both as a technological innovation and as a speculative financial instrument [15,16]. Although initially conceptualised as a peer-to-peer payment system, empirical evidence shows that Bitcoin’s extreme price volatility, speculative trading patterns, and limited adoption as a medium of exchange limit its practical use in commerce [17,18,19].
This speculative nature has direct implications for its responsiveness to new information. Under the Efficient Market Hypothesis [11], financial assets should instantaneously incorporate all publicly available information into prices. However, studies reveal mixed evidence of efficiency in cryptocurrency markets. Ref [2] found weak-form inefficiency in Bitcoin that improved over time, whereas ref [20] suggested that efficiency depends on the transformation of returns. Other works—such as [1,21], and ref. [22] report persistent inefficiencies linked to speculative bubbles, liquidity constraints, and herd behaviour. Efficiency also appears to vary over time and across market regimes: [23] observed stronger efficiency in Bitcoin prior to the COVID-19 pandemic, while Ethereum displayed greater efficiency during the recovery. Ref. [24] found that BTC and ETH regained efficiency quickly after the pandemic’s initial shock. Similar patterns are documented by refs. [25,26], whereas refs. [21,27] highlight recurring speculative cycles as a cause of inefficiency.
The Adaptive Market Hypothesis [12] provides an alternative framework, proposing that efficiency evolves as market participants adapt to changing conditions. Evidence supporting this view comes from refs. [28,29], who document time-varying efficiency in Bitcoin and Ethereum linked to institutional changes and investor behaviour. Ref. [30] conclude that BTC markets are “almost efficient” but susceptible to structural shifts, while [31] find that BTC and ETH generally exhibit higher efficiency than other cryptocurrencies.
Beyond market efficiency, researchers have explored Bitcoin’s role as a diversification tool or safe-haven asset. Re. [32] noted post-2008 financial crisis interest in Bitcoin as a decentralised, politically neutral asset akin to gold. Re. [33] found positive BTC returns in response to negative macroeconomic news (e.g., rising unemployment), but weak reactions to GDP or CPI changes, implying that its safe-haven role is conditional. Ref. [34] similarly note potential diversification benefits in specific market conditions.
An expanding body of research examines cryptocurrency sensitivity to news shocks, including macroeconomic announcements and regulatory developments. Studies such as refs. [35,36] find that such events can prompt significant price adjustments. The studies by refs. [36,37] emphasise that the impact depends on regional and regulatory contexts, with markets sometimes overreacting or underreacting, thus diverging from informational efficiency expectations. Event study methodologies have been increasingly applied to cryptocurrencies to measure these reactions. For example, ref. [38] document nonlinear beta behaviour under informational stress, while [6,7] demonstrate significant abnormal returns and volatility following non-financial news events such as terrorist attacks or drug busts.
While this literature highlights the role of informational shocks, most prior studies focus on macroeconomic, geopolitical, or crypto-specific news, with little emphasis on environmental and climate-related events. This omission is notable given Bitcoin’s substantial environmental footprint [8] and the growing policy attention on the environmental governance of energy-intensive technologies. Research in environmental finance and climate policy has shown that markets for carbon allowances, renewable energy, and fossil fuels are highly sensitive to climate agreements, environmental regulations, and extreme weather events [39,40,41]. Such findings suggest that environmental events can act as market-moving signals beyond their direct physical or regulatory implications, particularly in asset classes with reputational or policy exposure to sustainability concerns.
The intersection of environmental news and cryptocurrency markets therefore represents an underexplored but increasingly relevant research area. Given Bitcoin’s global dominance—accounting for more than 60% of total cryptocurrency market capitalisation (CoinMarketCap, 2025)—and its high energy consumption, climate-related shocks could affect its perceived long-term viability and regulatory risk. This study builds on event study methodology [42,43] by integrating the Capital Asset Pricing Model with GARCH-based volatility models to capture both return and risk dynamics around major global environmental events. In doing so, it contributes to filling the gap between the environmental management literature and the growing body of cryptocurrency market research.
3. Methodology
This study applies an event study methodology to investigate the effect of major global environmental events on the return and risk behaviour of the cryptocurrency market, with a specific focus on Bitcoin (BTC). The methodological framework is grounded in the Efficient Market Hypothesis (EMH) as proposed by [11], which posits that asset prices fully reflect all publicly available information. Under this hypothesis, environmental announcements that convey new or material information should be rapidly absorbed into asset prices. Accordingly, the presence of statistically significant abnormal returns or shifts in volatility following such announcements may suggest inefficiencies in how environmental information is processed by the cryptocurrency market.
To ensure the robustness of return estimations, the study employs a multi-model asset pricing approach. The Capital Asset Pricing Model (CAPM) is used as the primary benchmark due to its prominence in empirical finance and event study applications. To account for potential model misspecification and omitted variable bias, several alternative models are incorporated, including a rolling mean model, the Fama–French three-factor model, the Carhart four-factor model, the Fama–French five-factor model, and a market integration model. This comparative framework enables the cross-validation of abnormal return estimates under different assumptions about expected returns.
To complement the return-based analysis and capture time-varying risk, the study incorporates a GARCH (1,1) model [14]. GARCH modelling is well-suited for financial time series exhibiting volatility clustering and conditional heteroskedasticity—features that are especially prevalent in cryptocurrency markets. This approach allows the investigation of how market volatility responds to environmental announcements in both the immediate and short-term aftermath.
The empirical procedure is structured in three stages. First, expected returns are estimated over a pre-defined estimation window using the selected asset pricing models. Second, abnormal returns are calculated as deviations from expected returns during the event window. As illustrated in Figure 1, the study adopts an event window of [−3, +6] trading days surrounding each environmental event, which allows for the detection of both anticipatory responses and delayed adjustments. An estimation window of 260 trading days prior to the event is used to establish baseline expectations under normal market conditions. This extended estimation period helps improve the reliability of model parameters while mitigating short-term noise or event clustering. Third, changes in systematic risk are assessed using CAPM regressions augmented with event-specific dummy variables, while GARCH models are applied to evaluate shifts in conditional volatility across the event horizon.
Table 2012. and 2023. These include multilateral climate agreements (e.g., the Paris Agreement, COP26, and COP28), national-level climate and energy policies (e.g., the U.S. Inflation Reduction Act and China’s single-use plastics ban), and major climate-related natural disasters (e.g., Typhoon Haiyan). Events were selected based on their policy relevance, international visibility, and media salience, and were validated using official sources. To clearly present the scope, nature, and classification of the selected events. Table 1 provides a comprehensive summary of the 13 global environmental events analysed in this study.
illustrates the event study timeline, consistent with the frameworks developed by [42,43]. The timeline is divided into two distinct periods: an estimation window and an event window. The estimation window spans 260 trading days prior to the event window (from day –260 to day –4) and is used to model normal return behaviour in the absence of event-related shocks. The event window, which extends from day –3 to day +6 relative to the announcement date (day 0), is used to capture both anticipatory and delayed market reactions. This configuration allows for the identification of abnormal returns and risk shifts attributable to each news event, while mitigating noise from unrelated market dynamics.
3.1. Data Sources and Variables
The empirical analysis focuses on Bitcoin (BTC), which serves as a representative digital asset for the cryptocurrency market throughout the study. As of 24 July 2025, Bitcoin accounted for approximately 60.8% of the total cryptocurrency market capitalization, with a market value of USD 2.37 trillion out of a global total of USD 3.89 trillion (CoinMarketCap, 2025). This dominant market share, together with Bitcoin’s high liquidity, historical significance, and institutional prominence, makes it an analytically efficient proxy for capturing the digital asset market’s response to environmental developments. Furthermore, Bitcoin’s proof-of-work mining mechanism is among the most energy-intensive systems globally, making it particularly salient to sustainability analysis.
The sample period spans from 19 July 2010 to 19 July 2024, capturing major transitions in both the cryptocurrency market and international environmental governance. Daily closing price data for Bitcoin were collected from CoinMarketCap, a widely recognized provider of comprehensive and high-frequency digital asset data. Further, to estimate expected returns and systematic risk, several global and regional equity indices are used as benchmarks. The MSCI All Country World Index (ACWI) is employed to represent global equity market performance. Regional exposures are captured through the MSCI USA Index, the MSCI Europe Index, and the MSCI AC Asia ex Japan Index, representing North America, Europe, and emerging Asia (excluding Japan), respectively.
Corresponding risk-free rates are sourced from Datastream. The U.S. 3-month interbank rate is used for both the global and U.S. markets; the Euro 3-month interbank rate (formerly LIBOR) serves as the risk-free proxy for the European market; and the Singapore 3-month interbank rate is used for the Asian market. This region-specific structure enhances the precision of return estimations in globally diversified financial environments. Meanwhile, to support multi-factor asset pricing models, additional variables were downloaded from the Kenneth R. French Data Library. These include the size (SMB) and value (HML) factors used in the Fama–French three-factor model, the momentum factor used in the Carhart four-factor model, and the profitability and investment factors incorporated in the Fama–French five-factor model.
Environmental event data were manually identified and validated using only official and authoritative sources. These include the United Nations (UN), the United Nations Framework Convention on Climate Change (UNFCCC), the Intergovernmental Panel on Climate Change (IPCC), the National Aeronautics and Space Administration (NASA), and the International Renewable Energy Agency (IRENA). These institutions were selected for their global scientific authority, policy leadership, and consistent reporting on climate and environmental developments. Each event was cross-referenced across multiple official platforms to ensure accuracy in timing, classification, and relevance.
3.2. Return Analysis
To assess the influence of major global environmental events on the performance of Bitcoin, this study employs an event study methodology grounded in abnormal return estimation. Daily logarithmic returns for Bitcoin are calculated using the standard formula:
where Pit denotes the closing price of Bitcoin on trading day t. This measure captures the continuously compounded rate of return, offering appropriate sensitivity to high-frequency financial data, such as Bitcoin prices.
To isolate the effect of environmental events on the cryptocurrency market performance, abnormal returns are calculated as the deviation between observed daily returns and expected returns :
Expected returns are estimated using a series of asset pricing models to ensure robustness and capture multiple sources of systematic risk. The Capital Asset Pricing Model (CAPM) serves as the baseline, specified as:
where is the global market return proxied by the MSCI All Country World Index (ACWI), and is the risk-free rate proxied by the U.S. 3-month interbank rate, is the intercept, and is the estimated coefficient over a period of the previous 260 days2.
To validate the CAPM estimates, the study also employs several alternative models including: (I) Rolling Average Model; (II) Market Integration Model; (III) Fama-French Three-Factor Model; (IV) Carhart Four-Factor Model; and (V) Fama-French Five-Factor Model. All models use a 260-day estimation window prior to the event to enhance statistical reliability. After abnormal returns are computed, average abnormal returns are derived by aggregating across all events:
To evaluate statistical significance, the standard t-statistic is applied:
where represents the standard deviation of abnormal returns, calculated over 244 trading days pre-event and 15 days post-event 3.
Given the potential for delayed information processing in cryptocurrency markets, the analysis uses an event window of [−3, +6] trading days. This captures anticipatory, contemporaneous, and post-event market behaviour. Cumulative abnormal returns over this window are computed as:
The t-test is also used to determine the statistical significance of cumulative returns, given by the following equation:
These return-based tests allow us to explore how environmental events—whether policy-driven or climate-induced—impact short-term investor sentiment and pricing behaviour in the Bitcoin market.
3.4. Risk Analysis
Beyond return behaviour, this study investigates whether major global environmental events lead to significant changes in systematic risk, as measured by variations in beta (β) for Bitcoin. Leveraging the Capital Asset Pricing Model (CAPM) as the foundational framework, the analysis incorporates dummy-interacted regression models to capture shifts in beta following environmental announcements. Two complementary model specifications are employed to examine the impact on risk: the Aggregate Dummy (AD) Model and the Individual Dummy (ID) Model.
The AD Model estimates the average change in beta across all selected events and is specified as follows:
where is the return of Bitcoin at time t, is the risk-free rate, is the global market return, is a dummy variable that takes the value of one on the event date and zero otherwise, is the intercept of the regression equation (E () = 0), is the average short-term systematic risk (i.e., beta) of Bitcoin, measures shifts in the intercept during the event period, captures changes in beta due to the environmental shock, and is the error term. This specification provides an estimate of the average effect of environmental announcements on Bitcoin’s systematic risk profile.
To further capture the heterogeneous impact of individual events, the ID Model introduces a separate dummy for each of the 13 environmental events examined. Each dummy equals one on the corresponding event date and zero otherwise. These are interacted with the market risk premium to detect event-specific changes in beta. The ID Model is expressed as:
where represents an individual event dummy for the Eth event (E = 1 to 13), and captures the marginal change in systematic risk associated with the specific event. This disaggregated approach is particularly relevant in cryptocurrency markets, where the impact of environmental developments may vary substantially depending on the nature, severity, and public visibility of the event. The ID model thus provides a more nuanced understanding of how each event shapes Bitcoin’s beta relative to global equity markets.
3.5. Volatility Modelling and Long-Term Risk Dynamics
In addition to assessing short-term changes in systematic risk, this study also investigates the long-term effects of major news events on the risk profile of cryptocurrencies. To achieve this, Equations (8) and (9) are re-estimated using adjusted dummy variables that take a value of zero prior to the event date and one for all subsequent days. This modification allows for the detection of persistent shifts in systematic risk beyond the immediate post-event window.
For instance, the Chow test is used to detect the presence of structural breaks in the regression series around event dates, while the Wald test examines whether certain variables are redundant, potentially signalling multicollinearity issues. To control for autocorrelation in the time series, autoregressive (AR) and moving average (MA) terms are incorporated into the model where appropriate. Additionally, a range of GARCH-type models is employed to account for time-varying volatility and volatility clustering, which are well-documented characteristics of cryptocurrency returns.
The baseline specification for volatility modelling in this study is the GARCH (1,1) model, which estimates the conditional variance as follows:
where is a constant term, is the ARCH term, capturing the impact of past squared residuals, and is the GARCH term, representing the influence of prior conditional variance. The GARCH (1,1) model is designed to reflect volatility clustering, a phenomenon often observed in financial time series, where periods of high volatility tend to be followed by similar periods. This model helps capture day-of-week effects, such as heightened volatility around Mondays or Fridays (Bollerslev, 1986).
To further enhance robustness, several alternative GARCH specifications are applied. The Threshold ARCH (TARCH) model accounts for asymmetric volatility, where negative shocks may have a larger impact on volatility than positive ones of equal magnitude [13]. The Exponential GARCH (EGARCH) model is used to test for leverage effects, allowing volatility to respond differently to positive and negative returns. Lastly, the Power ARCH (PARCH) model is included to generalize the transformation of the residual term, offering a more flexible framework for capturing different forms of conditional heteroscedasticity. Together, these models provide a comprehensive framework for evaluating how events investigated influence not only short-term abnormal returns and risk, but also the persistence and asymmetry of volatility in the cryptocurrency market.
4. Empirical Result
This section presents the main empirical findings regarding the response of Bitcoin (BTC) to a set of 13 global significant environmental events. The analysis covers abnormal return behaviour, shifts in systematic risk, and volatility patterns across the event window.
4.1. Return Analysis Results
The return analysis begins with a descriptive assessment of Bitcoin’s daily abnormal returns (ARs), computed using the CAPM model over 260--day estimation windows. Table 2 reports the summary statistics for the 3,395 observations, providing an overview of BTC’s return behaviour across the full sample. The mean AR is −0.001 with a median of 0.000, indicating no systematic deviation from expected returns under normal conditions. The standard deviation of 0.052 and the range from −0.678 to +0.463 highlight the high volatility and occasional extreme movements typical of cryptocurrency markets. The distribution is negatively skewed (−1.255) and highly leptokurtic (19.529), reflecting fat tails and frequent extreme negative returns. These characteristics are central to the study objective: they show that Bitcoin exhibits volatile and non--normal return behaviour, making it suitable for examining how global environmental events can trigger short--term market reactions. The skewed and fat--tailed distribution also reinforces the need for robust event--study inference in subsequent analyses.
Table 3 presents the CARs for Bitcoin (BTC) over the event window [−3, +6], estimated using six asset pricing models. Pre-event CARs (CAR-3 to CAR-1) are consistently positive across all models (1.93%–2.60%) but statistically insignificant, indicating little evidence of information leakage or anticipatory trading prior to environmental announcements. The most notable and statistically significant reaction occurs on the announcement day under CAPM, with an abnormal return of 11.92% (t = 9.27***). This sharp spike suggests that certain environmental events, particularly those with high policy visibility, such as major climate agreements, trigger immediate repricing as investors reassess Bitcoin’s long-term risk profile in light of its environmental footprint. The absence of significance in multi-factor models may reflect the influence of additional risk factors that absorb part of the return variation.
Post-event CARs (+1 to +5) remain small and insignificant, implying that most adjustments occur on the event date. By Day +6, CARs turn positive again across models (3.05%–4.55%), though without statistical significance, possibly indicating short-lived speculative momentum rather than sustained revaluation. Overall, the findings point to a short, concentrated price reaction to environmental events, consistent with semi-strong form efficiency in terms of adjustment speed, but with the magnitude of the CAPM event-day effect highlighting Bitcoin’s sensitivity to sustainability-related policy and environmental development.
Figure 2 presents the average cumulative abnormal returns (CARs) for Bitcoin, estimated using the Capital Asset Pricing Model (CAPM), over the CAR–1, CAR0, and CAR+1 event windows for the 13 global environmental events listed in Table 1. The figure provides a concise visual summary of short-term market responses that are examined in more detail in Table 4, Table 5 and Table 6. Consistent with the statistical results, Event 6 (U.S. Paris Agreement withdrawal announcement) displays a strong and significant positive CAR–1 that remains elevated at CAR+1, reflecting anticipatory trading and continued adjustment in favour of Bitcoin. Event 2 (Typhoon Haiyan) also records positive CAR–1 values, although these effects are more modest and fade quickly after the event. In contrast, Event 8 (Global Climate Strike) shows a marked drop at CAR+1, aligning with the significant negative CARs observed in the post-event windows, likely due to heightened concerns over Bitcoin’s environmental impact. Event 12 (COP28 – UAE Climate Summit) demonstrates moderate gains from CAR0 to CAR+1, suggesting a positive interpretation of the summit’s outcomes. Overall, the figure reinforces the table-based findings that certain events trigger clear anticipatory effects, while others prompt immediate negative or positive reassessments, with the direction and persistence of the impact closely tied to the nature and perceived economic or regulatory implications of each event.
Tables 4, 5, and 6 present the cumulative abnormal returns (CARs) of Bitcoin (BTC) around 13 major global environmental events, measured over the one-day pre-event window (−1), the two-day post-event window (+2), and the six-day post-event window (+6), respectively. These CARs are estimated using multiple asset pricing models to ensure robustness, including the Capital Asset Pricing Model (CAPM), the Fama–French 3-factor model, the Carhart 4-factor model, the 5-factor model, a 260-day rolling average model, and a market integration model. The multi-model approach captures varying dimensions of systematic risk and market integration effects, allowing for a more comprehensive assessment of Bitcoin’s price dynamics in response to environmental developments.
The pre-event results in Table 4 reveal that Bitcoin frequently reacts in anticipation of major environmental events, with several CARs showing statistical significance one day before the announcement. The strongest positive anticipatory reaction is observed for Event 6 (U.S. Paris Agreement withdrawal announcement), which records consistently significant positive CARs across all models, suggesting market expectations of reduced environmental regulation and potential macroeconomic shifts favourable to Bitcoin demand. Event 2 (Typhoon Haiyan) also shows positive and significant CARs in several models, indicating anticipatory positioning ahead of climate disaster impacts. In contrast, Event 13 (Global Renewables Pledge) yields significantly negative CARs in some models, consistent with concerns that stronger renewable energy commitments could increase regulatory pressure on Bitcoin due to its environmental footprint.
The post-event windows show that market reactions often extend beyond the announcement day. Over the +2-day window (Table 5), Event 6 maintains consistently positive and significant CARs across all models, reflecting sustained optimism following the policy announcement. Event 12 (COP28 outcome) shows positive and significant CARs in several models, indicating initial market approval of the summit’s outcomes. Conversely, Event 8 (Global Climate Strike) yields uniformly negative and significant CARs, likely reflecting concerns over heightened public and political scrutiny of Bitcoin’s environmental impact. By the +6-day window (Table 6), Event 2 (Typhoon Haiyan) displays the strongest and most persistent positive CARs across models, suggesting a delayed but robust reassessment of Bitcoin’s value in the wake of a major climate disaster. Event 6 remains positive but declines to marginal significance at the 10% level, while Event 8 continues to exert a persistent negative influence. Event 12’s initially positive effects weaken considerably over the extended horizon, pointing to short-lived market enthusiasm for multilateral climate commitments.
Overall, these results indicate that Bitcoin’s price dynamics are shaped by both anticipatory trading and extended post-event adjustments, with the magnitude and persistence of effects depending on the nature of the event. Policy shocks with clear regulatory implications (Event 6) are priced in quickly and strongly, climate disasters (Event 2) generate sustained positive momentum, activism-driven events (Event 8) impose persistent downward pressure, and multilateral policy agreements (Event 12) produce short-lived gains. While the tables highlight only the most statistically significant results, full results for other pre-event and post-event windows are available upon request.
4.2. Risk Analysis Results
This section examines the impact of 13 major global environmental events on the short-run systematic risk of Bitcoin (BTC) using two models: The Aggregate Dummy (AD) model and the Individual Dummy (ID) model. The AD model captures the average effect of all events collectively, providing an overall measure of how Bitcoin’s market risk profile responds to environmental news shocks, whereas the ID model isolates the risk response to each event individually.
The AD model results, reported in Table 7, show that Bitcoin’s pre-event beta was estimated at 0.93, indicating a strong positive correlation with the global equity market prior to environmental announcements. This suggests that, under normal conditions, Bitcoin tends to move in line with broader market trends rather than acting as a hedge. Following the events, beta declined by 4.51 units (z = –1.88), although the change is statistically insignificant at conventional levels. While this magnitude points to a possible reduction in market-related risk exposure, the absence of statistical significance implies that, on average, environmental news shocks do not consistently alter Bitcoin’s short-run systematic risk. Similarly, the change in the intercept term is negligible (0.00; z = 0.02), reinforcing the interpretation that aggregate environmental events have little immediate impact on Bitcoin’s excess returns beyond what is explained by overall market movements. These findings differ from earlier evidence on cryptocurrencies’ hedging properties in response to broader financial or geopolitical shocks, where significant shifts in systematic risk have been observed. In the context of environmental news, the aggregate results suggest that Bitcoin’s risk profile remains relatively stable, with any adjustments being event-specific rather than systematic across all events. The subsequent ID model analysis provides a more granular view of how individual events drive variations in systematic risk, allowing for the identification of specific environmental developments that exert stronger or weaker influences on Bitcoin’s market sensitivity.
The ID model results, reported in Table 8, provide a more granular view of Bitcoin’s short-run systematic risk adjustments in response to individual environmental events. The coefficients reveal that the magnitude and direction of risk changes vary substantially across events, underscoring the heterogeneous nature of market responses to environmental news. Notably, the announcement of Typhoon Haiyan (Event 2) produced the most pronounced and statistically significant reduction in Bitcoin’s beta (–23.843; z = –8.734), suggesting that the market perceived this extreme climate disaster as a shock prompting a temporary decoupling from global equity market movements. In contrast, the China Plastic Ban (Event 9) generated the largest positive shift in beta (+131.792), indicating a sharp increase in Bitcoin’s market-related risk exposure, albeit without statistical significance. Other events such as the US Inflation Reduction Act (Event 11) and COP26 Glasgow Pact (Event 10) also registered sizeable negative beta shifts, while COP28 UAE (Event 12) and the IPCC 1.5 °C Report (Event 7) had relatively minor effects.
The diversity of these responses suggests that Bitcoin’s sensitivity to environmental developments depends not only on the event’s scale and severity but also on the perceived economic and regulatory implications for cryptocurrency markets. Events framed as signalling long-term regulatory tightening or heightened environmental scrutiny—such as COP26 and the Inflation Reduction Act—tend to lower systematic risk, potentially reflecting reduced speculative positioning. Conversely, events perceived as indirectly supporting Bitcoin’s role in sustainability debates or prompting broader market uncertainty can increase beta, as seen with the China Plastic Ban.
Overall, the AD and ID model findings together indicate that Bitcoin’s risk profile is shaped less by environmental news as a broad category and more by the specific nature, framing, and market interpretation of each event. While aggregate measures show stability in systematic risk, individual events can exert meaningful but varied effects, offering insights for both short-run trading strategies and longer-term portfolio risk management in the context of environmental developments.
5. Conclusions
This study examined the short-run impact of thirteen major global environmental events on Bitcoin’s returns and systematic risk using an event study framework that combined multiple asset pricing models with GARCH-based volatility estimation. The results show that Bitcoin’s market response to environmental developments is both event-specific and time-dependent. Events with strong policy or regulatory implications, such as the U.S. Paris Agreement withdrawal, produced immediate and significant abnormal returns, while climate disasters like Typhoon Haiyan generated more persistent post-event effects. Activism-driven events, including the Global Climate Strike, tended to exert sustained downward pressure, whereas multilateral climate agreements showed shorter-lived price impacts.
From a risk perspective, aggregate results indicate no statistically significant shift in Bitcoin’s systematic risk across all events. However, the individual-event analysis highlights substantial heterogeneity in risk responses, with some announcements producing marked changes in beta, reflecting shifts in Bitcoin’s sensitivity to global equity market movements. This divergence underscores that environmental news shocks do not uniformly alter Bitcoin’s market risk profile but can significantly influence it under specific circumstances.
Overall, the findings contribute to understanding the intersection between environmental developments and cryptocurrency markets, suggesting that Bitcoin’s risk–return profile is shaped less by environmental events in general than by the specific nature, market perception, and policy implications of each event. For investors, this implies the need to monitor environmental policy signals and event timing when managing cryptocurrency exposures. For policymakers, the results highlight that climate-related measures, especially those tied to energy use and regulatory enforcement can indirectly affect digital asset markets.
In summary, Bitcoin’s price and risk adjustments to environmental events are selective, heterogeneous, and context dependent. While aggregate impacts on systematic risk are muted, certain events exert substantial influence on market dynamics, with implications for both investment strategies and environmental policy design. Future research could extend this analysis to a broader set of digital assets, incorporate higher-frequency data, and explore sentiment-driven transmission channels.
Author Contributions
Conceptualization, methodology, validation, formal analysis, and writing, L.M. M.K. and M.S. All authors have read and agreed to the published version of the manuscript.
Funding
This research received no external funding.
Institutional Review Board Statement
Not applicable.
Informed Consent Statement
Not applicable.
Data Availability Statement
No new data were created or analyzed in this study. Data sharing is not applicable to this article.
Conflicts of Interest
The author has no relevant financial or non-financial interests to disclose.
| 1 | According to Digiconomist, https://digiconomist.net/. |
| 2 | 260 days represents a one-year trading period (5 business days × 52 weeks) and is used frequently in the event study literature in an estimation process called rolling forecast, see for example [44]. |
| 3 | Following [45] this paper uses the standard t-test to determine the statistically significant abnormal returns in which the standard deviation (SD) of cryptocurrency abnormal returns is estimated using a rolling-window of 260 days (244 days prior to the event date, event date, and 15 days after the event date). |
References
- Kristoufek, L. On Bitcoin markets (in) efficiency and its evolution. Physica A: statistical mechanics and its applications, 2018 503, 257-262.
- Urquhart, A. The inefficiency of Bitcoin. Economics Letters. 2020, 148, 80–82. [Google Scholar] [CrossRef]
- Corbet, S. , Cumming, D. J., Lucey, B. M., Peat, M., & Vigne, S. A. The destabilising effects of cryptocurrency cybercriminality. Economics Letters. 2020, 191, 108741. [Google Scholar]
- Baur, D. G. , & Dimpfl, T. Asymmetric volatility in cryptocurrencies. Economics Letters. 2018, 173, 148–151. [Google Scholar]
- Cheah, E. T. , & Fry, J. Speculative bubbles in Bitcoin markets? An empirical investigation into the fundamental value of Bitcoin. Economics letters. 2015, 130, 32–36. [Google Scholar]
- Almaqableh, L. , Reddy, K., Pereira, V., Ramiah, V., Wallace, D., & Veron, J. F. An investigative study of links between terrorist attacks and cryptocurrency markets. Journal of Business Research. 2022, 147, 177–188. [Google Scholar]
- Almaqableh, L. , Wallace, D., Pereira, V., Ramiah, V., Wood, G., Veron, J. F., & Watson, A. Is it possible to establish the link between drug busts and the cryptocurrency market? Yes, we can. International Journal of Information Management. 2023, 71, 102488. [Google Scholar]
- Gallersdörfer, U. , Klaaßen, L., & Stoll, C. Energy consumption of cryptocurrencies beyond bitcoin. Joule 2020 4, 1843–1846.
- Krause, M. J. , & Tolaymat, T. Quantification of energy and carbon costs for mining cryptocurrencies. Nature Sustainability. 2018 1, 711–718.
- Bouri, E. , Gupta, R., Tiwari, A. K., and Roubaud, D. Does Bitcoin hedge global uncertainty? Evidence from wavelet-based quantile-in-quantile regressions. Finance Research Letters. 2017, 23, 87–95. [Google Scholar] [CrossRef]
- Fama, E. F. Efficient capital markets: A review of theory and empirical work. The Journal of Finance. 1970, 25, 383–417. [Google Scholar] [CrossRef]
- Lo, A. W. The Adaptive Markets Hypothesis. The Journal of Portfolio Management. 2004, 30, 15–29. [Google Scholar] [CrossRef]
- Engle, R. F. Autoregressive conditional heteroscedasticity with estimates of the variance of United Kingdom inflation. Econometrica: Journal of the econometric society, 1007; 1982, 987-1007. [Google Scholar]
- Bollerslev, T. Generalized autoregressive conditional heteroskedasticity. Journal of econometrics. 1986, 31, 307–327. [Google Scholar] [CrossRef]
- Nakamoto, S. Bitcoin: A peer-to-peer electronic cash system. 2008, Satoshi Nakamoto.
- Christidis, K. , & Devetsikiotis, M. Blockchains and smart contracts for the Internet of Things. IEEE Access. 2016, 4, 2292–2303. [Google Scholar]
- Yermack, D. (2015). Is Bitcoin a Real Currency? An Economic Appraisal. In Handbook Of Digital Currency, Academic Press. 2015, pp. 29-40.
- Böhme, R. , Christin, N., Edelman, B., and Moore, T. Bitcoin: Economics, technology, and governance. Journal of Economic Perspectives. 2015, 29, 213–238. [Google Scholar] [CrossRef]
- Glaser, F. , Zimmermann, K., Haferkorn, M., Weber, M. C., & Siering, M. Bitcoin-asset or currency? revealing users’ hidden intentions. Revealing Users’ Hidden Intentions. 2014, ECIS.
- Nadarajah, S. , and Chu, J. (2017). On the inefficiency of Bitcoin. Economics Letters. 2017, 150, 6–9. [Google Scholar] [CrossRef]
- Alvarez-Ramirez, J. , Rodriguez, E., and Ibarra-Valdez, C. Long-range correlations and asymmetry in the Bitcoin market. Physica A: Statistical Mechanics and its Applications. 2018, 492, 948–955. [Google Scholar] [CrossRef]
- Bariviera, A. F. The inefficiency of Bitcoin revisited: A dynamic approach. Economics Letters. 2017 161, 1–4. [CrossRef]
- Mnif, E. , Jarboui, A., & Mouakhar, K. How the cryptocurrency market has performed during COVID-19? A multifractal analysis. Finance research letters. 2020, 36, 101647. [Google Scholar]
- Naeem, M. A. , Bouri, E., Peng, Z., Shahzad, S. J. H., & Vo, X. V. Asymmetric efficiency of cryptocurrencies during COVID-19. Physica A: Statistical Mechanics and its Applications. 2021, 565, 125562. [Google Scholar]
- Köchling, G. , Müller, J., & Posch, P. N. Does the introduction of futures improve the efficiency of Bitcoin? Finance Research Letters. 2019, 30, 367–370. [Google Scholar]
- Nan, Z. , & Kaizoji, T. Market efficiency of the bitcoin exchange rate: Weak and semi-strong form tests with the spot, futures, and forward foreign exchange rates. International Review of Financial Analysis. 2019, 64, 273–281. [Google Scholar]
- Al-Mansour, B. Y. Cryptocurrency market: Behavioral finance perspective. The Journal of Asian Finance, Economics and Business. 2020, 7, 159–168. [Google Scholar] [CrossRef]
- Noda, A. On the evolution of cryptocurrency market efficiency. Applied Economics Letters. 2021 28, 433–439. [CrossRef]
- Keshari Jena, S. , Tiwari, A. K., Doğan, B., & Hammoudeh, S. Are the top six cryptocurrencies efficient? Evidence from time--varying long memory. International Journal of Finance & Economics. 2022, 27, 3730–3740. [Google Scholar]
- Yi, E. , Yang, B., Jeong, M., Sohn, S., & Ahn, K. Market efficiency of cryptocurrency: evidence from the Bitcoin market. Scientific Reports. 2023, 13, 4789. [Google Scholar]
- Naif, I. , Oqla, M., & Sameer, L. Inspecting the efficiency of cryptocurrency markets: New evidence. Asian Economic and Financial Review. 2024, 14, 29–42. [Google Scholar]
- Uddin, M. A. , Ali, M. H., & Masih, M. Bitcoin—A hype or digital gold? Global evidence. Australian economic papers. 2020, 59, 215–231. [Google Scholar]
- Corbet, S. , Larkin, C., Lucey, B. M., Meegan, A., & Yarovaya, L. The impact of macroeconomic news on Bitcoin returns. The European Journal of Finance. 2020, 26, 1396–1416. [Google Scholar]
- Shahzad, S. J. H. , Bouri, E., Roubaud, D., Kristoufek, L., & Lucey, B. Is Bitcoin a better safe-haven investment than gold and commodities? International Review of Financial Analysis. 2019, 63, 322–330. [Google Scholar]
- Hashemi Joo, M. , Nishikawa, Y., & Dandapani, K. Announcement effects in the cryptocurrency market. Applied Economics. 2020, 52, 4794–4808. [Google Scholar]
- Corbet, S. , Larkin, C., Lucey, B., Meegan, A., & Yarovaya, L. Cryptocurrency reaction to fomc announcements: Evidence of heterogeneity based on blockchain stack position. Journal of Financial Stability. 2020, 46, 100706. [Google Scholar]
- Ramos, S. , Pianese, F., Leach, T., & Oliveras, E. A great disturbance in the crypto: Understanding cryptocurrency returns under attacks. Blockchain: Research and Applications, 2021 2, 100021.
- Li, Z. , Chen, L., & Dong, H. What are bitcoin market reactions to its-related events? International Review of Economics & Finance. 2021, 73, 1–10. [Google Scholar]
- Gkillas, K. , Gupta, R., & Pierdzioch, C. Forecasting realized volatility of bitcoin returns: Tail events and asymmetric loss. The European Journal of Finance. 2021, 27, 1626–1644. [Google Scholar]
- Bohl, M. T. , Stefan, M., & Wellenreuther, C. An Introduction to ESMA’s Commitments of Traders Reports: Do Hedgers Really Hedge? 2019, Center for Quantitative Economics (CQE), University of Muenster.
- Chevallier, J. A model of carbon price interactions with macroeconomic and energy dynamics. Energy economics. 2011, 33, 1295–1312. [Google Scholar] [CrossRef]
- Ji, C. , Cheng, K., Nayak, D., & Pan, G. Environmental and economic assessment of crop residue competitive utilization for biochar, briquette fuel and combined heat and power generation. Journal of Cleaner Production. 2018, 192, 916–923. [Google Scholar]
- MacKinlay, A. C. Event studies in economics and finance. Journal of economic literature. 1997, 35, 13–39. [Google Scholar]
- Strong, N. Modelling abnormal returns: A review article. Journal of Business Finance & Accounting. 1992, 19, 533–553. [Google Scholar]
- Ramiah, V. , & Graham, M.. The impact of domestic and international terrorism on equity markets: evidence from Indonesia. International Journal of Accounting & Information Management. 2013, 21, pp. [Google Scholar]
- Ramiah, V. , Pichelli, J., & Moosa, I. (2015). Environmental regulation, the Obama effect and the stock market: some empirical results. Applied Economics. 2015, 47, 725–738. [Google Scholar]
Figure 1.
The Timeline of Event Study Methodology.
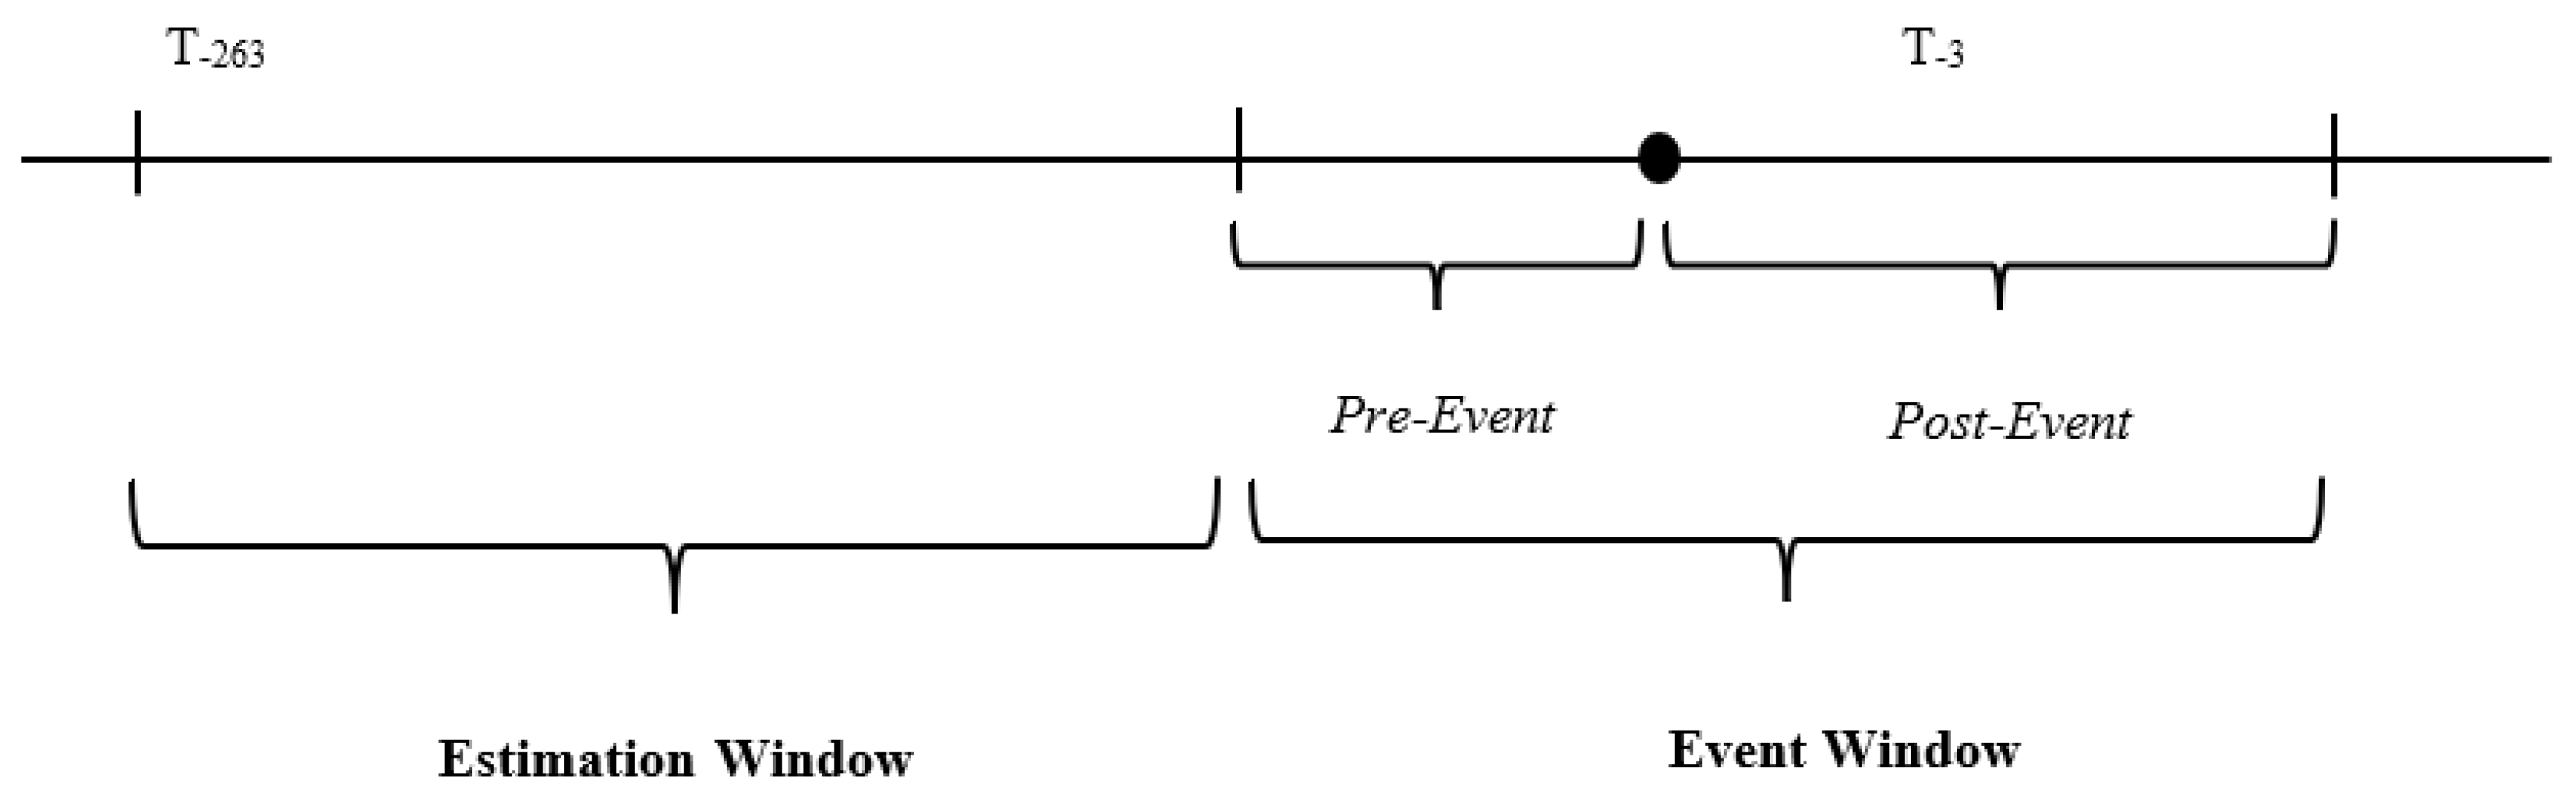
Figure 2.
Average Cumulative Abnormal Returns Around 13 Global Environmental Events.
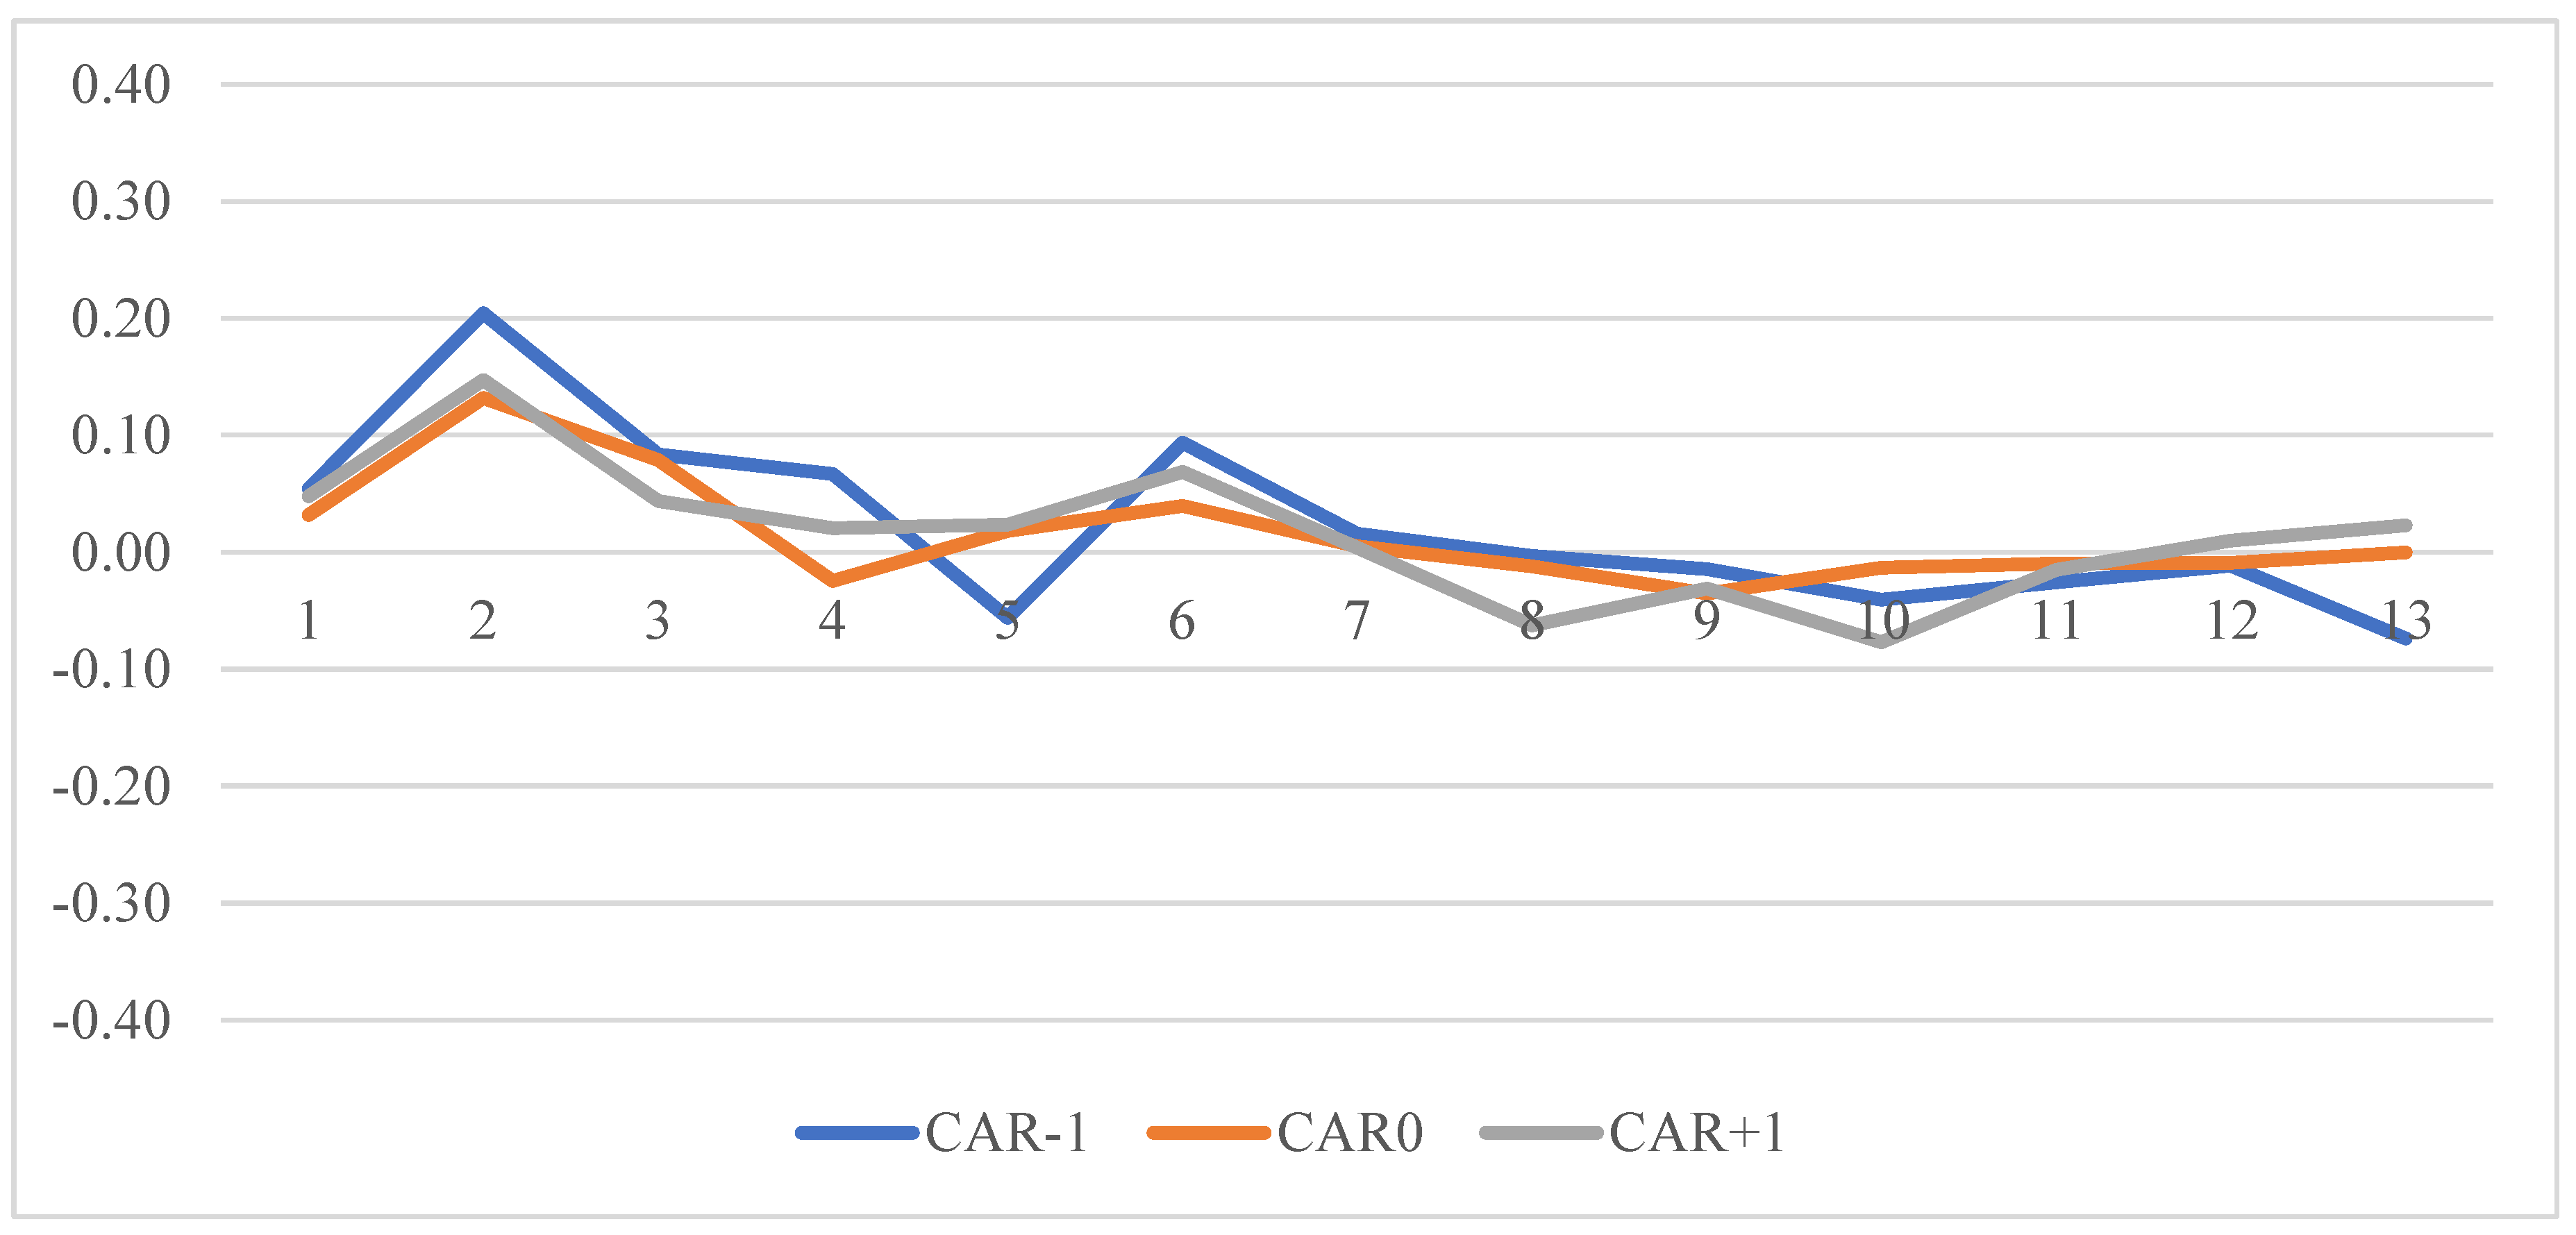

Table 1.
List of Major Environmental Events Organized by Event Date.
| No. | Event / Policy | Event Date | Location | Description | Source |
|---|---|---|---|---|---|
| 1 | Rio+20 UN Conference | 20-Jun-12 | Rio de Janeiro, Brazil | Reaffirmed global commitment to sustainability | UN |
| 2 | Typhoon Haiyan Landfall | 08-Nov-13 | Philippines | One of the strongest tropical cyclones in history | NASA |
| 3 | UN Climate Summit 2014 | 23-Sep-14 | New York, USA | Political momentum ahead of COP21 negotiations | UN |
| 4 | Paris Agreement Adopted (COP21) | 12-Dec-15 | Paris, France | Treaty adopted to limit global warming | UNFCCC |
| 5 | Paris Agreement Enters into Force | 04-Nov-16 | Global | Became legally binding after ratification | UNFCCC |
| 6 | US Paris Withdrawal Announcement | 01-Jun-17 | Washington D.C., USA | US withdrawal citing economic concerns | White House |
| 7 | IPCC 1.5 °C Special Report | 08-Oct-18 | Incheon, South Korea | Warned of dire impacts if global warming exceeds 1.5 °C | IPCC |
| 8 | Global Climate Strike Launch | 20-Sep-19 | Global | Mass global protest initiated by youth activists | Fridays for Future |
| 9 | China Plastics Ban Announcement | 19-Jan-20 | China | Nationwide ban on single-use plastics | China Daily |
Note: Table 1 lists the 13 environmental events examined in this study. Events 4, 9, and 10 occurred during weekends; therefore, their market impact was assessed on the following Monday, the next business day.
Table 2.
Summary Statistics of Bitcoin Daily Abnormal Returns.
| Variable | Observations | Mean | Median | Std. Dev | Min | Max | Skewness | Kurtosis |
|---|---|---|---|---|---|---|---|---|
| Bitcoin (BTC) | 3395 | -0.001 | 0 | 0.052 | -0.678 | 0.463 | -1.255 | 19.529 |
Note: Table 2 presents the summary statistics of Bitcoin’s daily abnormal returns (ARs), computed using the Capital Asset Pricing Model (CAPM) with a 260--day estimation window. The table provides a concise overview of the distributional characteristics of ARs, which form the basis for the subsequent event--study analysis of Bitcoin’s short--term response to global environmental events.
Table 3.
Cumulative Abnormal Returns (CARs) of Bitcoin Around Global Environmental Events: Multi-Model Estimates.
Table 3.
Cumulative Abnormal Returns (CARs) of Bitcoin Around Global Environmental Events: Multi-Model Estimates.
| CARs | CAPM | 3 Factor Model | 4 Factor Model | 5 Factor Model | 260 Days Average | Market Integration | ||||||
|---|---|---|---|---|---|---|---|---|---|---|---|---|
| % | t-stat | % | t-stat | % | t-stat | % | t-stat | % | t-stat | % | t-stat | |
| CAR-3 | 1.96 | 0.67 | 2.13 | 0.70 | 1.93 | 0.61 | 2.10 | 0.74 | 2.35 | 0.79 | 1.93 | 0.64 |
| CAR-2 | 1.63 | 0.69 | 2.00 | 0.86 | 1.68 | 0.68 | 1.92 | 0.87 | 2.08 | 0.89 | 1.67 | 0.70 |
| CAR-1 | 2.26 | 1.07 | 2.56 | 1.18 | 2.47 | 1.05 | 2.43 | 1.16 | 2.60 | 1.21 | 2.28 | 1.08 |
| AR (0) | 11.92 | 9.27*** | 1.64 | 1.29 | 1.61 | 1.16 | 1.45 | 1.21 | 1.60 | 1.26 | 1.54 | 1.21 |
| CAR+1 | 1.56 | 0.97 | 1.31 | 0.82 | 1.15 | 0.67 | 1.36 | 0.85 | 1.38 | 0.89 | 1.57 | 0.97 |
| CAR+2 | 1.31 | 0.52 | 0.90 | 0.35 | 0.53 | 0.20 | 0.93 | 0.36 | 1.08 | 0.44 | 1.34 | 0.53 |
| CAR+3 | 0.62 | 0.17 | -0.40 | -0.11 | -0.97 | -0.24 | -0.49 | -0.13 | -0.09 | -0.02 | 0.41 | 0.11 |
| CAR+4 | 0.29 | 0.08 | -1.17 | -0.30 | -1.53 | -0.38 | -1.21 | -0.32 | -0.68 | -0.18 | 0.12 | 0.03 |
| CAR+5 | 0.56 | 0.15 | -0.65 | -0.18 | -1.08 | -0.28 | -0.57 | -0.16 | -0.31 | -0.09 | 0.41 | 0.11 |
| CAR+6 | 4.55 | 0.71 | 3.24 | 0.50 | 3.05 | 0.47 | 3.48 | 0.54 | 3.83 | 0.60 | 4.40 | 0.68 |
Note: This table reports the cumulative abnormal returns (CARs) for Bitcoin (BTC) resulting from the 13 events over different windows, ranging from 3 days before the event date to 6 days after. Augmented to the base model (CAPM) as well as the 3, 4, and 5-factor models, a simple rolling average model (260) days, and market integration model. Statistical significance is denoted by (*), (**), and (***) for the 10%, 5%, and 1% levels, respectively.
Table 4.
Cumulative Abnormal Returns (CARs -1) of Bitcoin One Day Prior to Global Environmental Events: Multi-Model Estimates.
Table 4.
Cumulative Abnormal Returns (CARs -1) of Bitcoin One Day Prior to Global Environmental Events: Multi-Model Estimates.
| Event No. | CAPM | 3 Factor model | 4 Factor model | 5 Factor model | 260 Days Average | Market Integration | ||||||
|---|---|---|---|---|---|---|---|---|---|---|---|---|
| CAR-1 | t-stat | CAR-1 | t-stat | CAR-1 | t-stat | CAR-1 | t-stat | CAR-1 | t-stat | CAR-1 | t-stat | |
| 1 | 0.05 | 0.52 | 0.07 | 0.64 | 0.07 | 0.65 | 0.07 | 0.63 | 0.07 | 0.64 | 0.06 | 0.54 |
| 2 | 0.20 | 1.64 | 0.22 | 1.76* | 0.24 | 1.91** | 0.20 | 1.58 | 0.21 | 1.71* | 0.21 | 1.64 |
| 3 | 0.08 | 0.91 | 0.09 | 1.02 | 0.10 | 1.13 | 0.09 | 1.02 | 0.10 | 1.08 | 0.08 | 0.91 |
| 4 | 0.07 | 1.09 | 0.06 | 1.02 | 0.06 | 0.98 | 0.07 | 1.14 | 0.06 | 1.02 | 0.07 | 1.16 |
| 5 | -0.06 | -1.24 | -0.05 | -1.04 | -0.05 | -1.05 | -0.05 | -1.07 | -0.05 | - 1.17 | -0.06 | -1.24 |
| 6 | 0.09 | 1.82*** | 0.09 | 1.75* | 0.09 | 1.77* | 0.09 | 1.76* | 0.09 | 1.78* | 0.09 | 1.74* |
| 7 | 0.02 | 0.21 | 0.01 | 0.07 | -0.00 | -0.04 | 0.00 | 0.03 | 0.01 | 0.08 | 0.01 | 0.12 |
| 8 | -0.00 | - 0.05 | -0.00 | -0.00 | -0.02 | -0.28 | 0.00 | 0.03 | -0.00 | -0.04 | -0.01 | -0.11 |
| 9 | -0.01 | -0.23 | -0.01 | -0.23 | -0.03 | -0.42 | -0.01 | -0.23 | -0.02 | -0.27 | -0.02 | -0.24 |
| 10 | -0.04 | -0.61 | -0.03 | -0.43 | -0.03 | -0.42 | -0.03 | -0.37 | -0.03 | -0.42 | -0.03 | -0.45 |
| 11 | -0.03 | -0.50 | -0.04 | -0.60 | -0.04 | -0.62 | -0.04 | -0.66 | -0.02 | -0.29 | -0.03 | -0.49 |
| 12 | -0.01 | -0.27 | -0.01 | -0.26 | -0.01 | -0.26 | -0.01 | -0.22 | -0.01 | -0.22 | -0.01 | -0.26 |
| 13 | -0.07 | -1.76* | -0.07 | -1.62 | -0.07 | -1.60 | -0.07 | -1.67* | -0.07 | -1.70* | -0.08 | -1.79* |
Note: This table reports the cumulative abnormal returns (CARs) for Bitcoin (BTC) one day prior to each of the 13 global environmental events. Estimates are produced using the base model (CAPM), the Fama–French 3-factor model, the Carhart 4-factor model, the 5-factor model, a 260-day rolling average model, and the market integration model. Statistical significance is denoted by (*), (**), and (***) for the 10%, 5%, and 1% levels, respectively.
Table 5.
Cumulative Abnormal Returns (CARs +2) of Bitcoin Two Days After Global Environmental Events: Multi-Model Estimates.
Table 5.
Cumulative Abnormal Returns (CARs +2) of Bitcoin Two Days After Global Environmental Events: Multi-Model Estimates.
| Event No. | CAPM | 3 Factor model | 4 Factor model | 5 Factor model | 260 Days Average | Market Integration | ||||||
|---|---|---|---|---|---|---|---|---|---|---|---|---|
| CAR-1 | t-stat | CAR-1 | t-stat | CAR-1 | t-stat | CAR-1 | t-stat | CAR-1 | t-stat | CAR-1 | t-stat | |
| 1 | 0.04 | 0.29 | 0.01 | 0.08 | 0.01 | 0.08 | 0.01 | 0.07 | 0.02 | 0.17 | 0.03 | 0.23 |
| 2 | 0.17 | 1.10 | 0.16 | 1.08 | 0.15 | 1.01 | 0.17 | 1.12 | 0.16 | 1.07 | 0.17 | 1.12 |
| 3 | -0.01 | -0.07 | 0.01 | 0.05 | 0.02 | 0.17 | 0.00 | 0.01 | 0.01 | 0.06 | -0.01 | -0.11 |
| 4 | -0.01 | -0.10 | -0.01 | -0.17 | 0.00 | -0.03 | 0.00 | -0.02 | 0.00 | -0.04 | -0.01 | -0.07 |
| 5 | 0.03 | 0.57 | 0.02 | 0.45 | 0.02 | 0.46 | 0.02 | 0.35 | 0.02 | 0.45 | 0.03 | 0.63 |
| 6 | 0.14 | 2.26** | 0.15 | 2.33** | 0.14 | 2.30** | 0.15 | 2.31** | 0.14 | 2.21** | 0.15 | 2.32** |
| 7 | 0.02 | 0.17 | -0.01 | -0.13 | -0.03 | -0.28 | -0.01 | -0.15 | -0.01 | -0.13 | 0.02 | 0.18 |
| 8 | -0.18 | -2.27** | -0.18 | -2.21** | -0.21 | -2.64*** | -0.18 | -2.17** | -0.18 | -2.25** | -0.18 | -2.24** |
| 9 | -0.04 | -0.53 | -0.04 | -0.45 | -0.05 | -0.70 | -0.04 | -0.46 | -0.04 | -0.48 | -0.05 | -0.60 |
| 10 | -0.07 | -0.84 | -0.07 | -0.83 | -0.07 | -0.82 | -0.07 | -0.81 | -0.08 | -0.88 | -0.07 | -0.80 |
| 11 | -0.02 | -0.35 | -0.06 | -0.75 | -0.05 | -0.64 | -0.05 | -0.71 | -0.03 | -0.41 | -0.02 | -0.37 |
| 12 | 0.09 | 1.78* | 0.10 | 2.00** | 0.10 | 2.01** | 0.10 | 2.04** | 0.09 | 1.88* | 0.09 | 1.78* |
| 13 | 0.02 | 0.32 | 0.04 | 0.73 | 0.04 | 0.74 | 0.03 | 0.58 | 0.03 | 0.63 | 0.02 | 0.33 |
Note: This table reports the cumulative abnormal returns (CARs) for Bitcoin (BTC) two days following each of the 13 global environmental events. Estimates are produced using the base model (CAPM), the Fama–French 3-factor model, the Carhart 4-factor model, the 5-factor model, a 260-day rolling average model, and the market integration model. Statistical significance is denoted by (*), (**), and (***) for the 10%, 5%, and 1% levels, respectively.
Table 6.
Cumulative Abnormal Returns (CARs +6) of Bitcoin Sex Days After Global Environmental Events: Multi-Model Estimates.
Table 6.
Cumulative Abnormal Returns (CARs +6) of Bitcoin Sex Days After Global Environmental Events: Multi-Model Estimates.
| Event No. | CAPM | 3 Factor model | 4 Factor model | 5 Factor model | 260 Days Average | Market Integration | ||||||
|---|---|---|---|---|---|---|---|---|---|---|---|---|
| CAR-1 | t-stat | CAR-1 | t-stat | CAR-1 | t-stat | CAR-1 | t-stat | CAR-1 | t-stat | CAR-1 | t-stat | |
| 1 | 0.06 | 0.27 | 0.01 | 0.06 | 0.01 | 0.04 | 0.01 | 0.05 | 0.04 | 0.19 | 0.06 | 0.25 |
| 2 | 0.74 | 3.01*** | 0.71 | 2.91*** | 0.70 | 2.89*** | 0.71 | 2.95*** | 0.72 | 2.97*** | 0.74 | 2.99*** |
| 3 | -0.11 | -0.53 | -0.08 | -0.41 | -0.05 | -0.26 | -0.07 | -0.32 | -0.08 | -0.38 | -0.11 | -0.52 |
| 4 | -0.05 | -0.48 | -0.05 | -0.51 | -0.05 | -0.45 | -0.05 | -0.43 | -0.05 | -0.47 | -0.05 | -0.47 |
| 5 | 0.01 | 0.13 | 0.02 | 0.25 | 0.03 | 0.34 | 0.00 | -0.01 | 0.00 | 0.04 | -0.01 | -0.07 |
| 6 | 0.16 | 1.67* | 0.17 | 1.80* | 0.16 | 1.72* | 0.18 | 1.84* | 0.16 | 1.67* | 0.16 | 1.75* |
| 7 | 0.00 | 0.01 | -0.03 | -0.20 | -0.04 | -0.27 | -0.04 | -0.23 | -0.03 | -0.16 | -0.01 | -0.06 |
| 8 | -0.23 | -1.73* | -0.23 | -1.72* | -0.28 | -2.11** | -0.22 | -1.67* | -0.22 | -1.72* | -0.23 | -1.76* |
| 9 | 0.01 | 0.05 | 0.03 | 0.28 | 0.03 | 0.21 | 0.03 | 0.27 | 0.03 | 0.23 | 0.00 | -0.04 |
| 10 | -0.11 | -0.85 | -0.13 | -0.95 | -0.14 | -0.95 | -0.12 | -0.88 | -0.14 | -1.02 | -0.10 | -0.76 |
| 11 | -0.03 | -0.34 | -0.16 | -1.44 | -0.14 | -1.23 | -0.16 | -1.40 | -0.10 | -0.91 | -0.03 | -0.34 |
| 12 | 0.13 | 1.52 | 0.13 | 1.71* | 0.13 | 1.72* | 0.13 | 1.67* | 0.13 | 1.64 | 0.13 | 1.54 |
| 13 | 0.02 | 0.25 | 0.03 | 0.42 | 0.03 | 0.39 | 0.04 | 0.50 | 0.03 | 0.41 | 0.02 | 0.24 |
Note: This table reports the cumulative abnormal returns (CARs) for Bitcoin (BTC) sex days following each of the 13 global environmental events. Estimates are produced using the base model (CAPM), the Fama–French 3-factor model, the Carhart 4-factor model, the 5-factor model, a 260-day rolling average model, and the market integration model. Statistical significance is denoted by (*), (**), and (***) for the 10%, 5%, and 1% levels, respectively.
Table 7.
Aggregate Change (AD) in the Short-run Systematic Risks.
| Cryptocurrency | Beta | z-Statistic | ∆ Beta | z-Statistic | ∆ Intercept | z-Statistic |
|---|---|---|---|---|---|---|
| Bitcoin | 0.93 | 21.02*** | - 4.51 | - 1.88* | 0.00 | 0.02 |
Note: This table reports the change in short-run systematic risk for Bitcoin (BTC) in an aggregate manner using the Aggregate Dummy (AD) model based on the GARCH framework. A negative change in beta (Δ Beta) indicates a reduction in systematic risk relative to the pre-event beta estimate (Beta) following the 13 major global environmental events. The z-statistic tests whether the change in beta is statistically different from zero. Statistical significance is denoted by (*), (**), and (***) for the 10%, 5%, and 1% levels, respectively.
Table 8.
Individual Change (ID) in the Short-run Systematic Risks.
| Event No. | Event Details | Bitcoin (BTC) | |
|---|---|---|---|
| Coefficient | z-Statistic | ||
| 1st _ID | Rio+20 Earth Summit | 12.693 | 0.000 |
| 2nd _ID | Typhoon Haiyan | -23.843 | -8.734*** |
| 3rd _ID | UN Climate Summit 2014 | -15.677 | -0.000 |
| 4th _ID | Paris Agreement Signed | 6.739 | 0.000 |
| 5th _ID | Paris Agreement Enforced | -5.816 | -0.000 |
| 6th _ID | US Paris Exit Announcement | 6.010 | 0.000 |
| 7th _ID | IPCC 1.5 °C Report | -1.230 | -0.000 |
| 8th _ID | Global Climate Strike | 2.554 | 0.000 |
| 9th _ID | China Plastic Ban | 131.792 | 0.000 |
| 10th _ID | COP26 Glasgow Pact | -13.595 | -0.000 |
| 11th _ID | US Inflation Reduction Act | -20.566 | -0.000 |
| 12th _ID | COP28 UAE | -2.762 | -0.000 |
| 13th _ID | Global Renewables Pledge | 0.156 | 0.000 |
Notes: This table presents the change in short-run systematic risk for Bitcoin (BTC) in response to each of the 13 major global environmental events, estimated using the Individual Dummy (ID) model within the GARCH framework. The coefficients represent the change in beta (Δ Beta) for each event relative to the pre-event beta estimate. A negative coefficient indicates a reduction in systematic risk, whereas a positive coefficient reflects an increase. The z-statistic tests whether the change is statistically different from zero. Statistical significance is denoted by (*), (**), and (***). for the 10%, 5%, and 1% levels, respectively.
Disclaimer/Publisher’s Note: The statements, opinions and data contained in all publications are solely those of the individual author(s) and contributor(s) and not of MDPI and/or the editor(s). MDPI and/or the editor(s) disclaim responsibility for any injury to people or property resulting from any ideas, methods, instructions or products referred to in the content. |
© 2025 by the authors. Licensee MDPI, Basel, Switzerland. This article is an open access article distributed under the terms and conditions of the Creative Commons Attribution (CC BY) license (http://creativecommons.org/licenses/by/4.0/).
Copyright: This open access article is published under a Creative Commons CC BY 4.0 license, which permit the free download, distribution, and reuse, provided that the author and preprint are cited in any reuse.


