3. Results
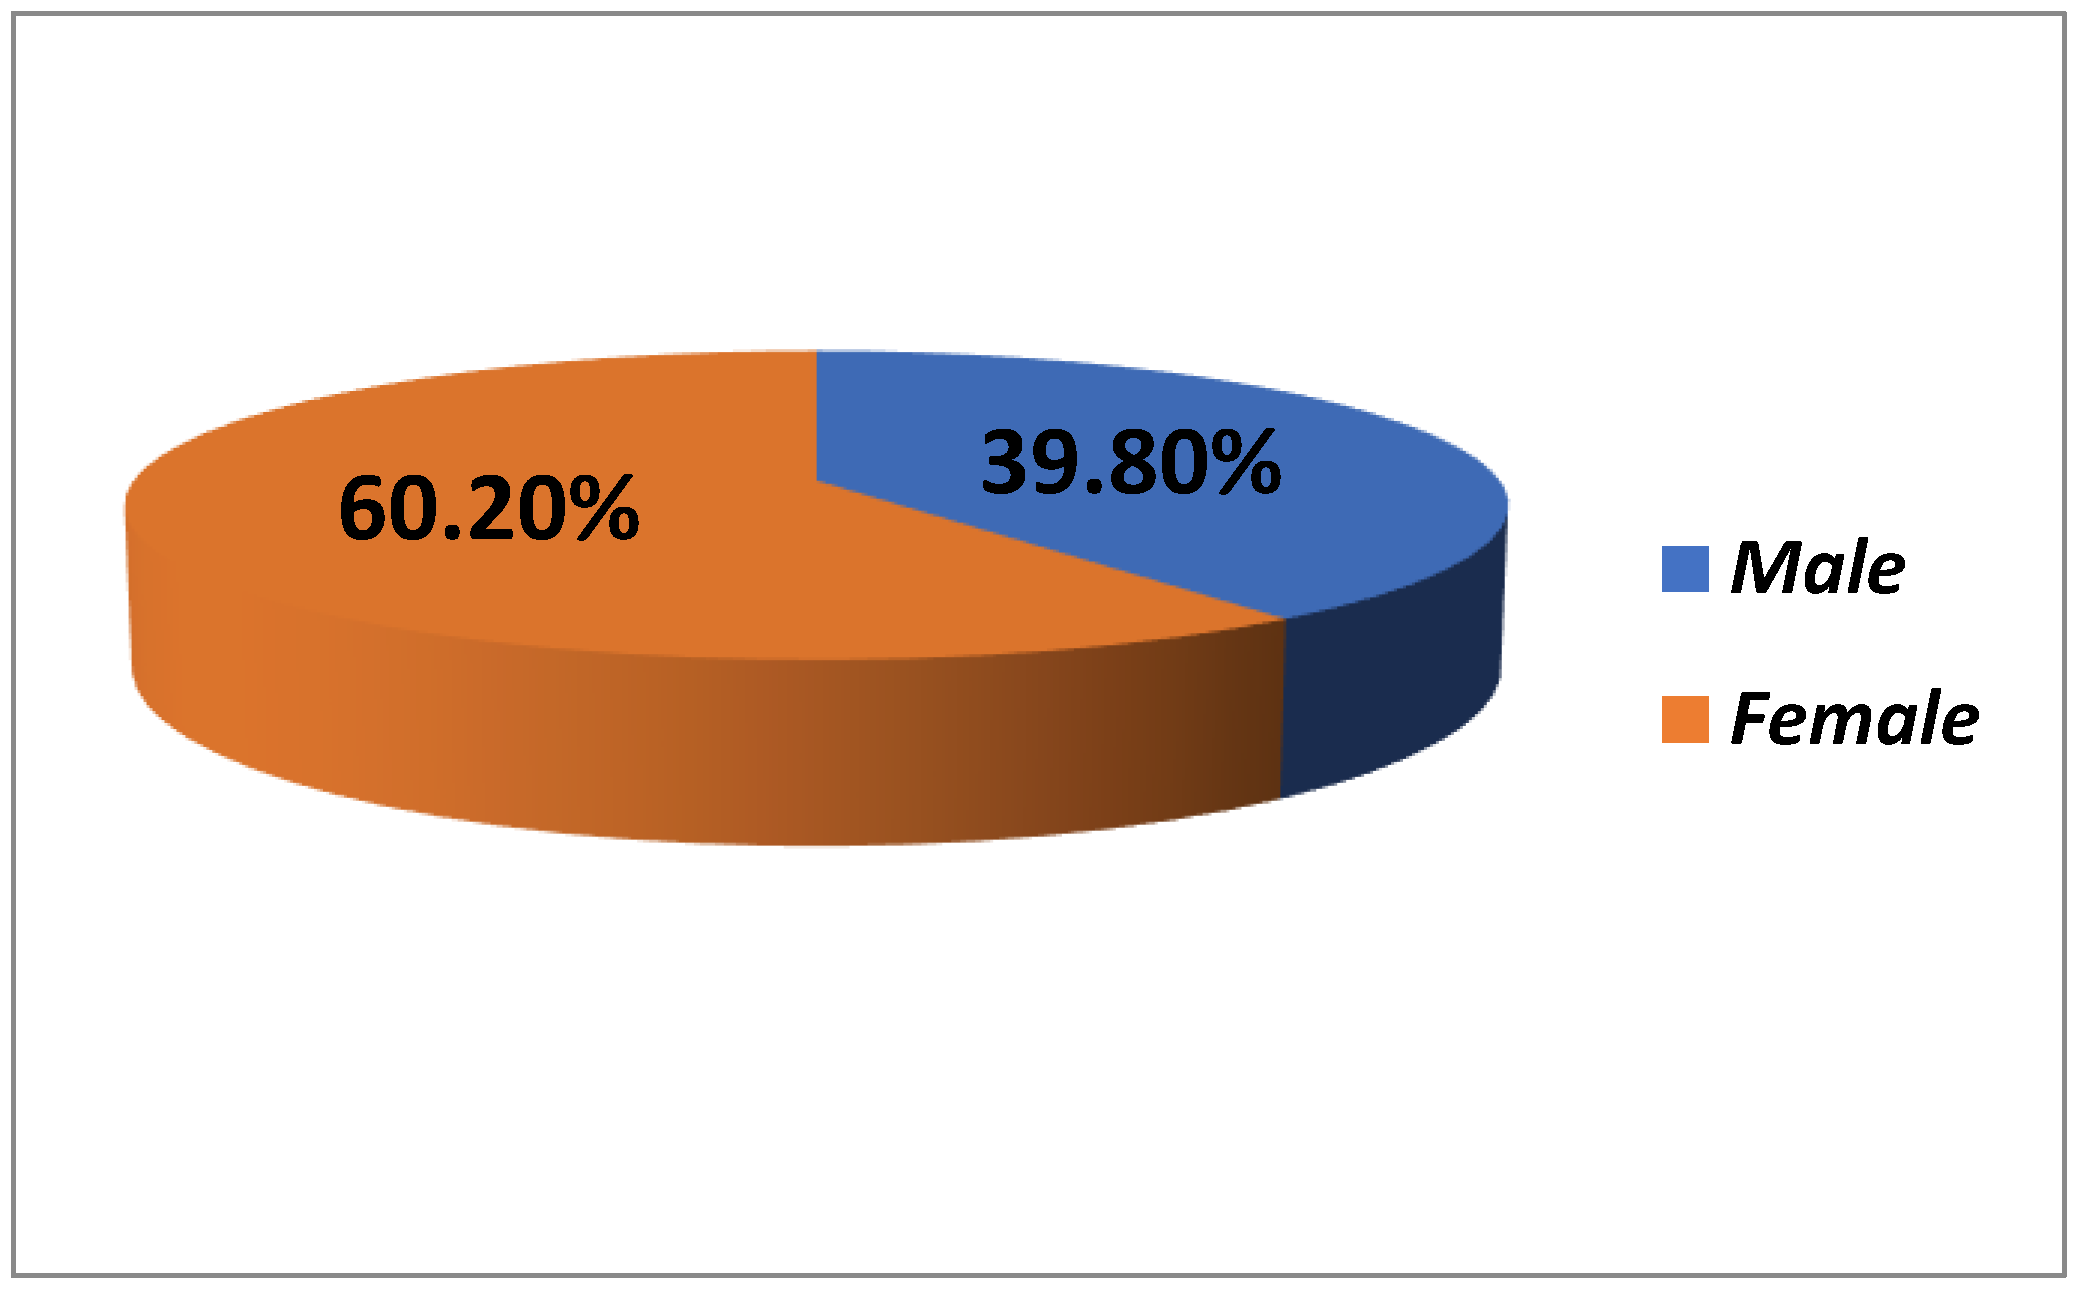
The demographic characteristics of the study participants (N = 118) provide a comprehensive view of the sample composition. The gender distribution shows that 39.8% of the participants (47 individuals) were male, while 60.2% (71 individuals) were female, indicating a majority of female representation [
Figure 1].
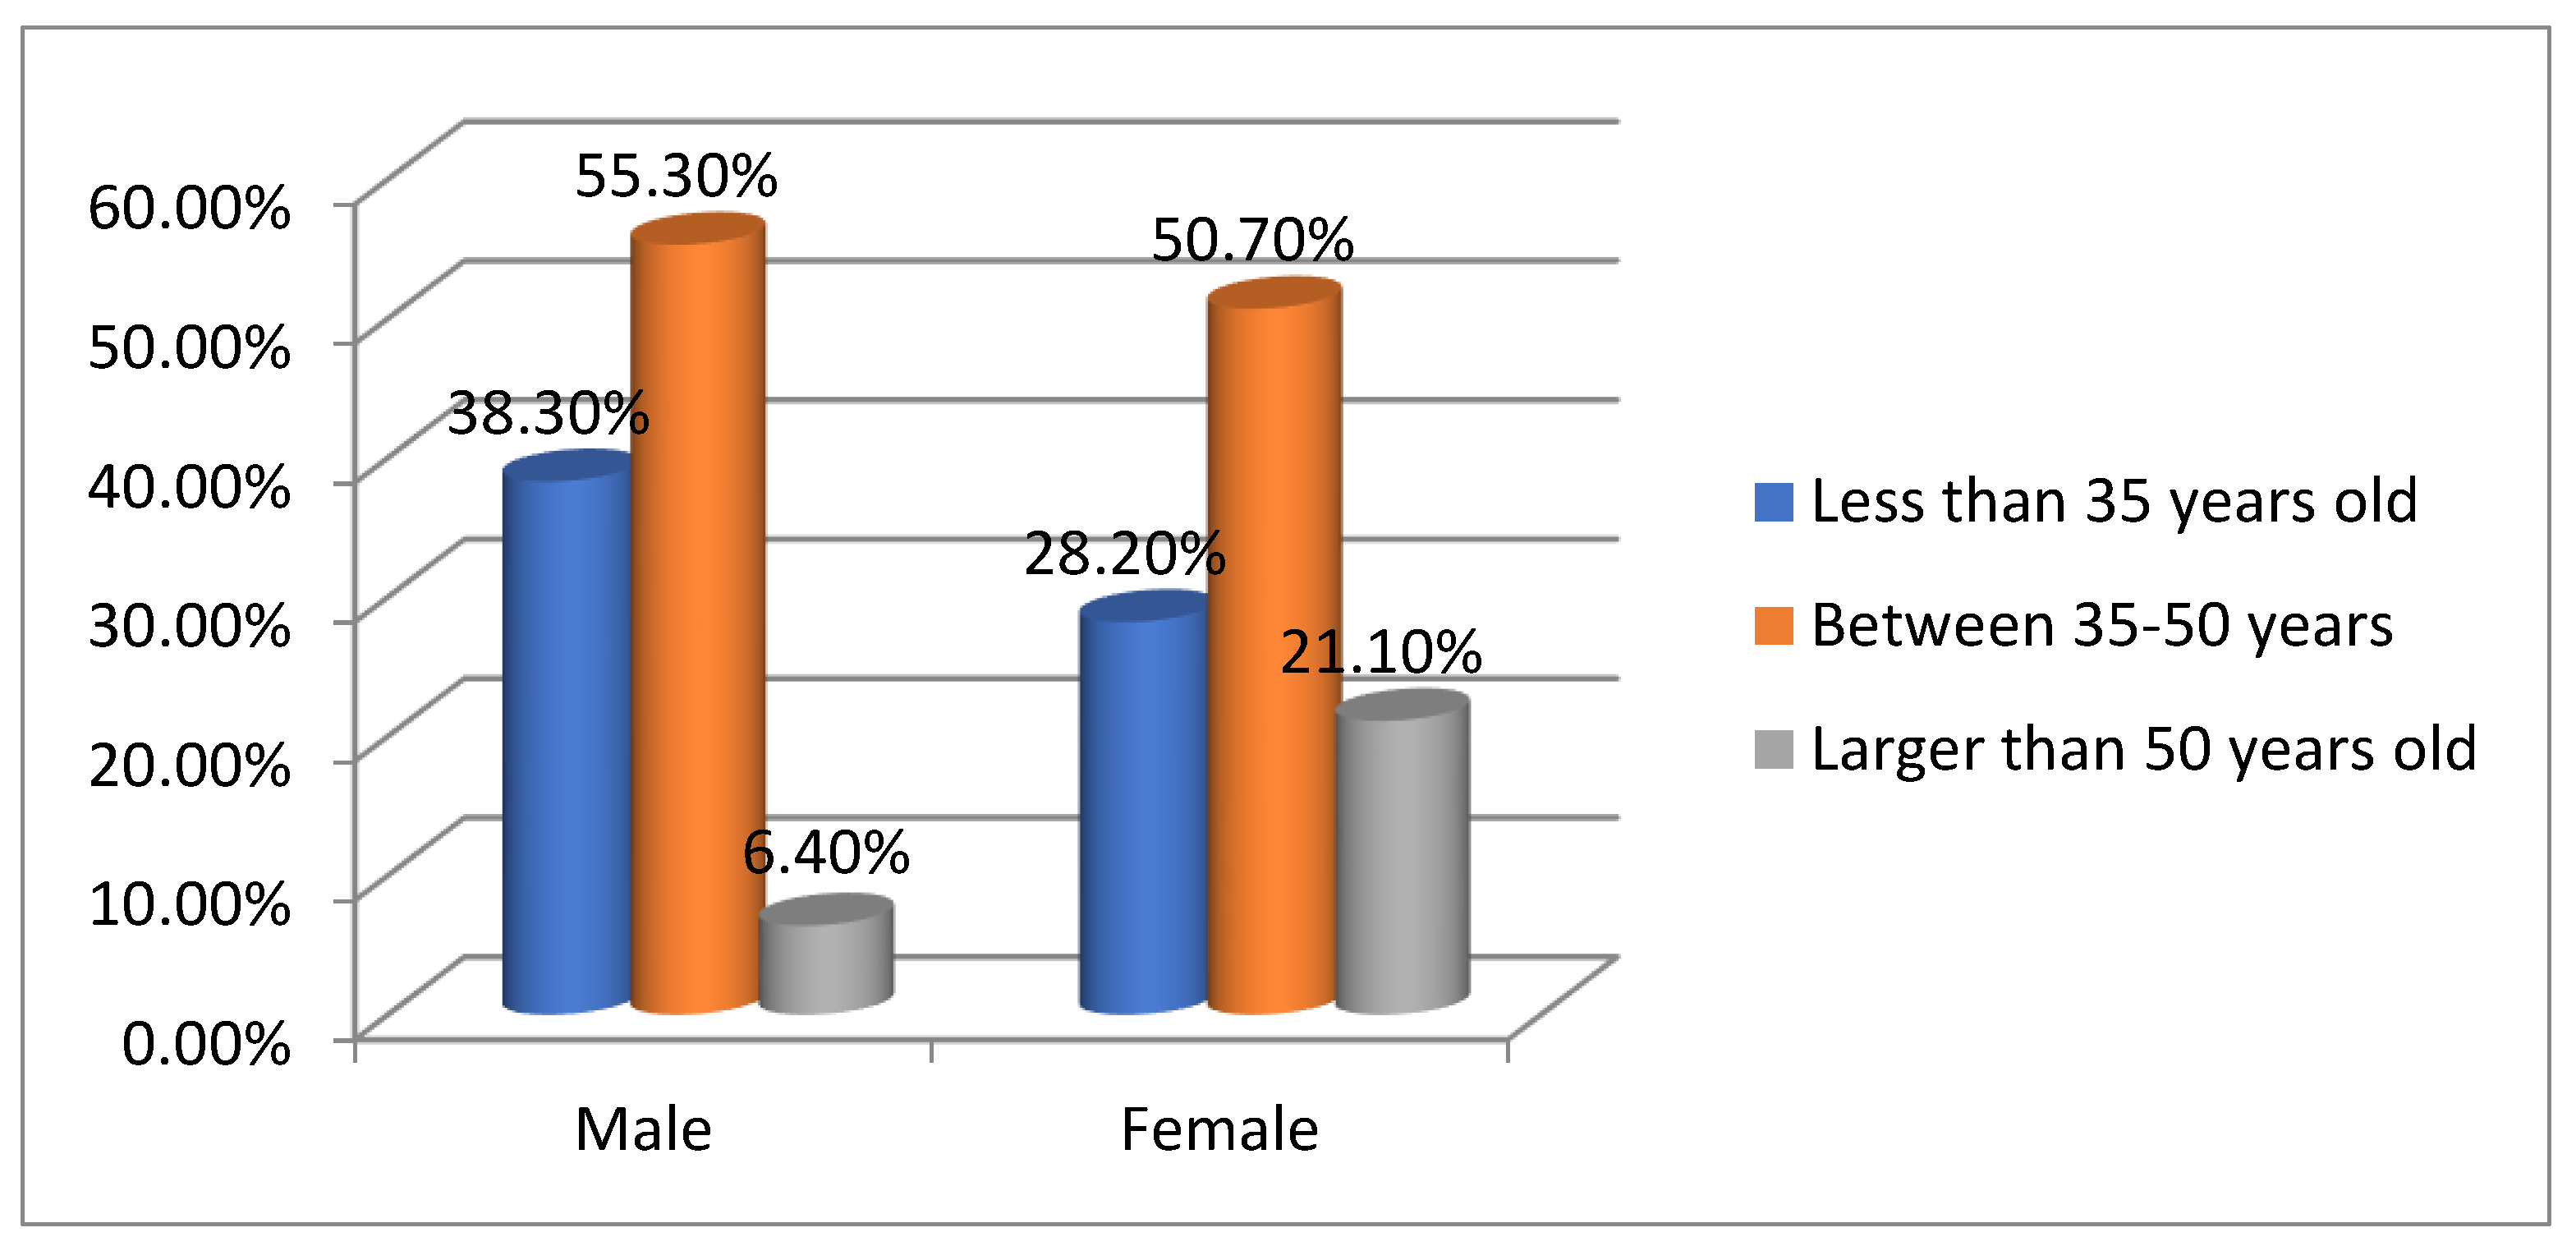
Figure 2 shows that the largest group of participants (52.5%) was aged 35–50, followed by 32.2% under 35 and 15.3% over 50, indicating a middle-aged demographic likely relevant to the study's focus. Gender comparisons reveal differences in age distribution: 55.3% of males are 35–50, 38.3% under 35, and 6.4% over 50. Among females, 50.7% are 35–50, 28.2% are under 35, and 21.1% are over 50. Overall, the 35–50 age group makes up 52.5% of the sample, with 32.2% under 35 and 15.3% over 50. A chi-square value of 5.046 and a p-value of 0.080 suggest no significant association between gender and age group distribution (p > 0.05), indicating observed differences are not statistically significant. [
Table 2].
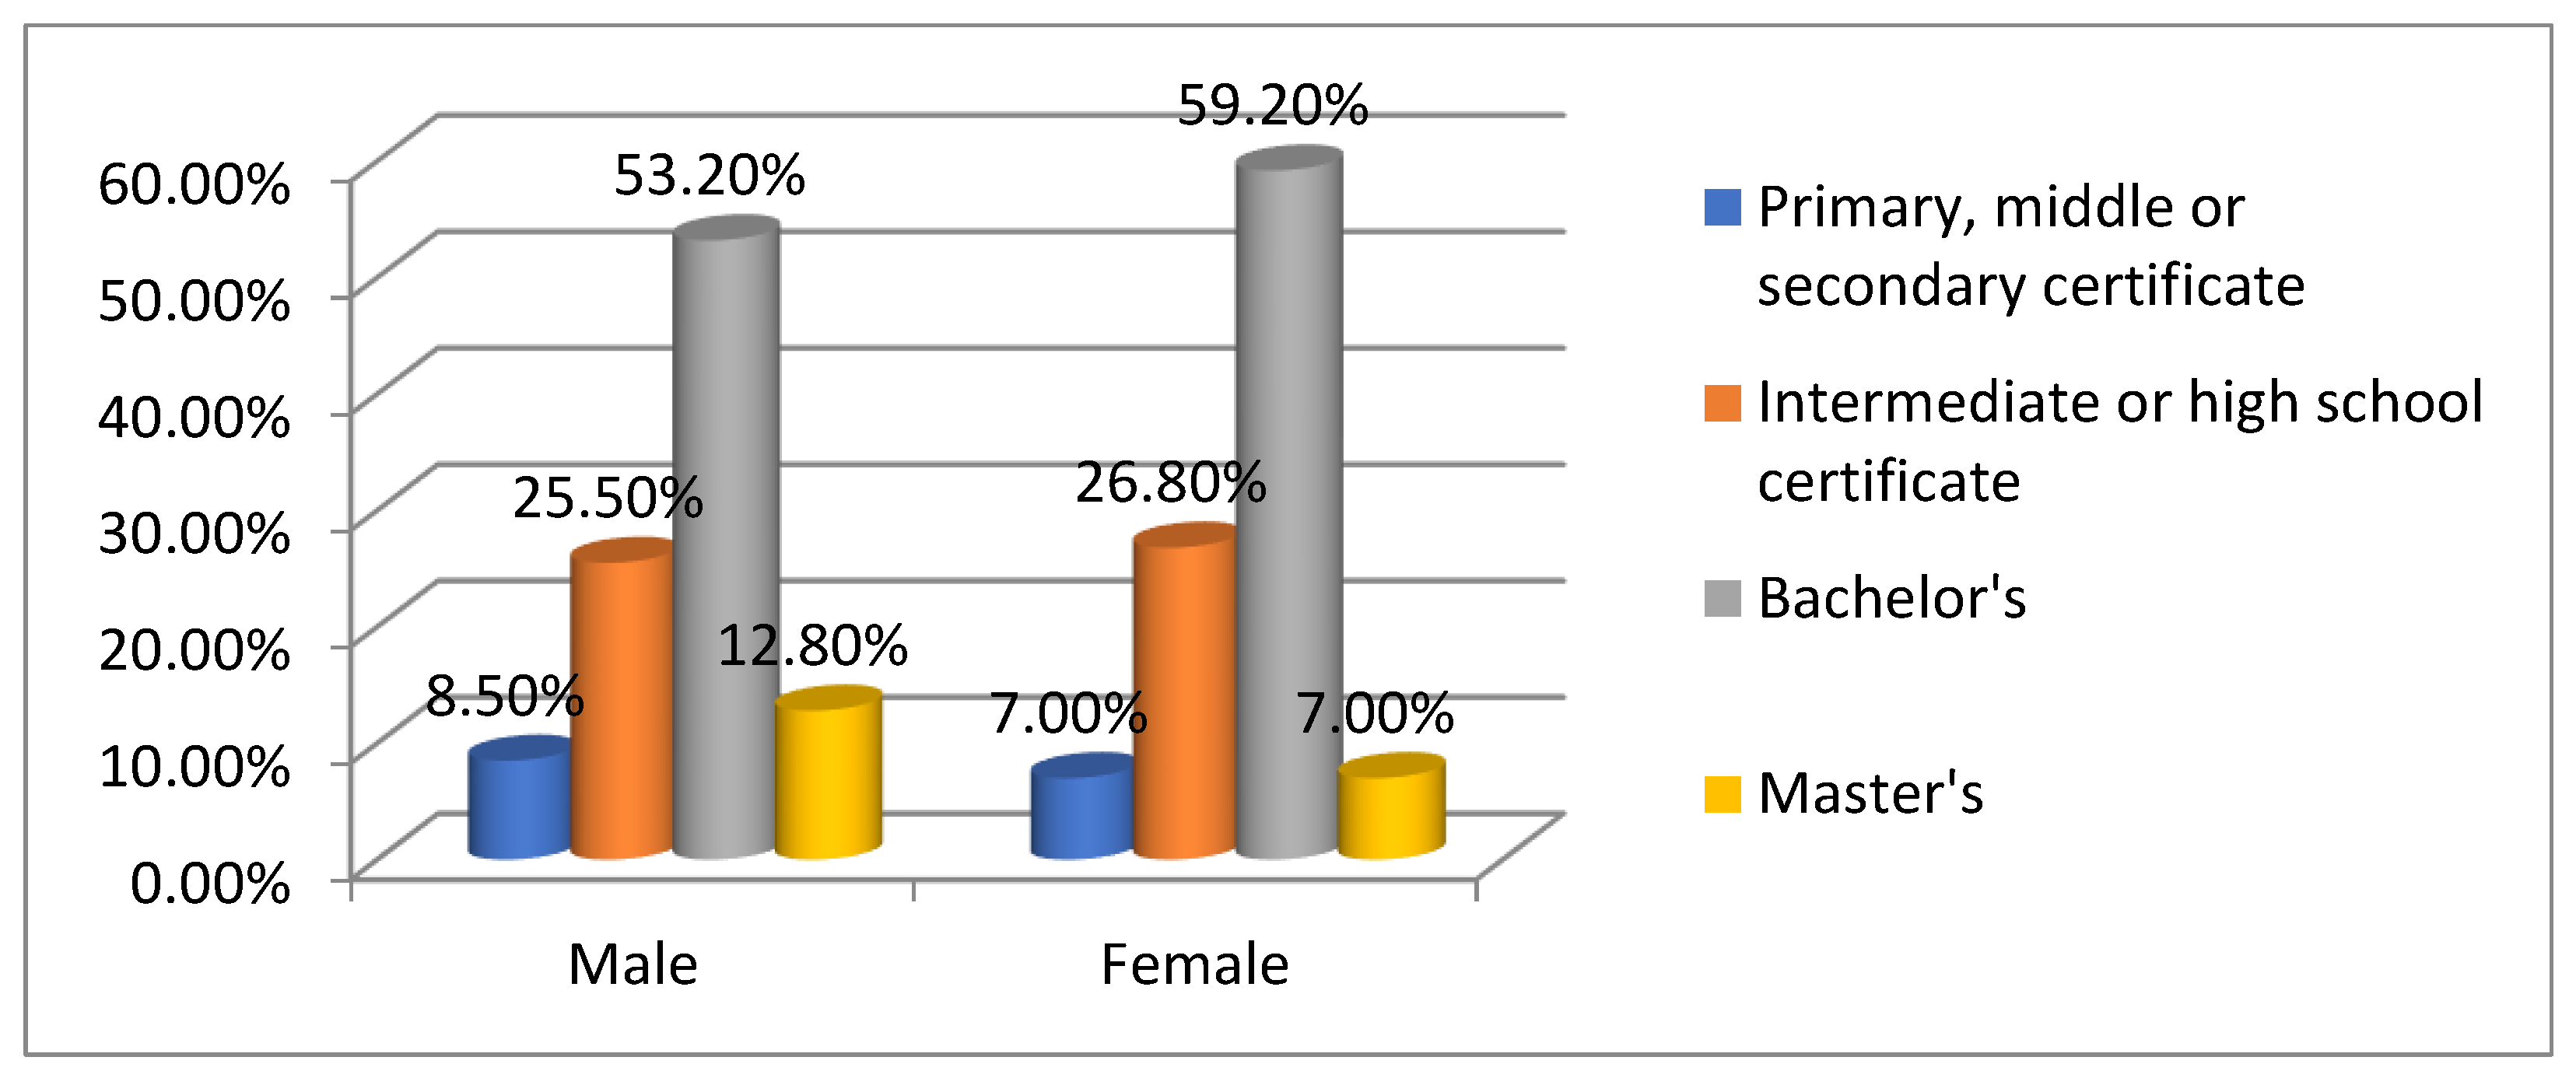
Figure 3 depicts that most participants (56.8%) held a Bachelor’s degree, while 26.3% completed an intermediate or high school certificate. Fewer participants attained a Master’s degree (9.3%), and only 7.6% had primary, middle, or secondary certification. This indicates a predominantly educated participant pool, potentially influencing familiarity with study-related tools. The demographic profile suggests a diverse sample leaning towards educated, middle-aged females, affecting the study's findings. Comparing education levels between genders shows notable patterns: 53.2% of males hold a Bachelor's degree, followed by 25.5% with an intermediate or high school certificate, 12.8% with a Master’s, and 8.5% with a lower certification. Among females, 59.2% hold a Bachelor's degree, 26.8% have an intermediate high school certificate, 7.0% have a Master’s degree, and 7.0% have a lower certification. Overall, females hold slightly more Bachelor's degrees than males, whereas males have a higher representation in Master's degrees. This distribution reflects a well-educated sample with minor variations in higher education attainment. [
Table 3].
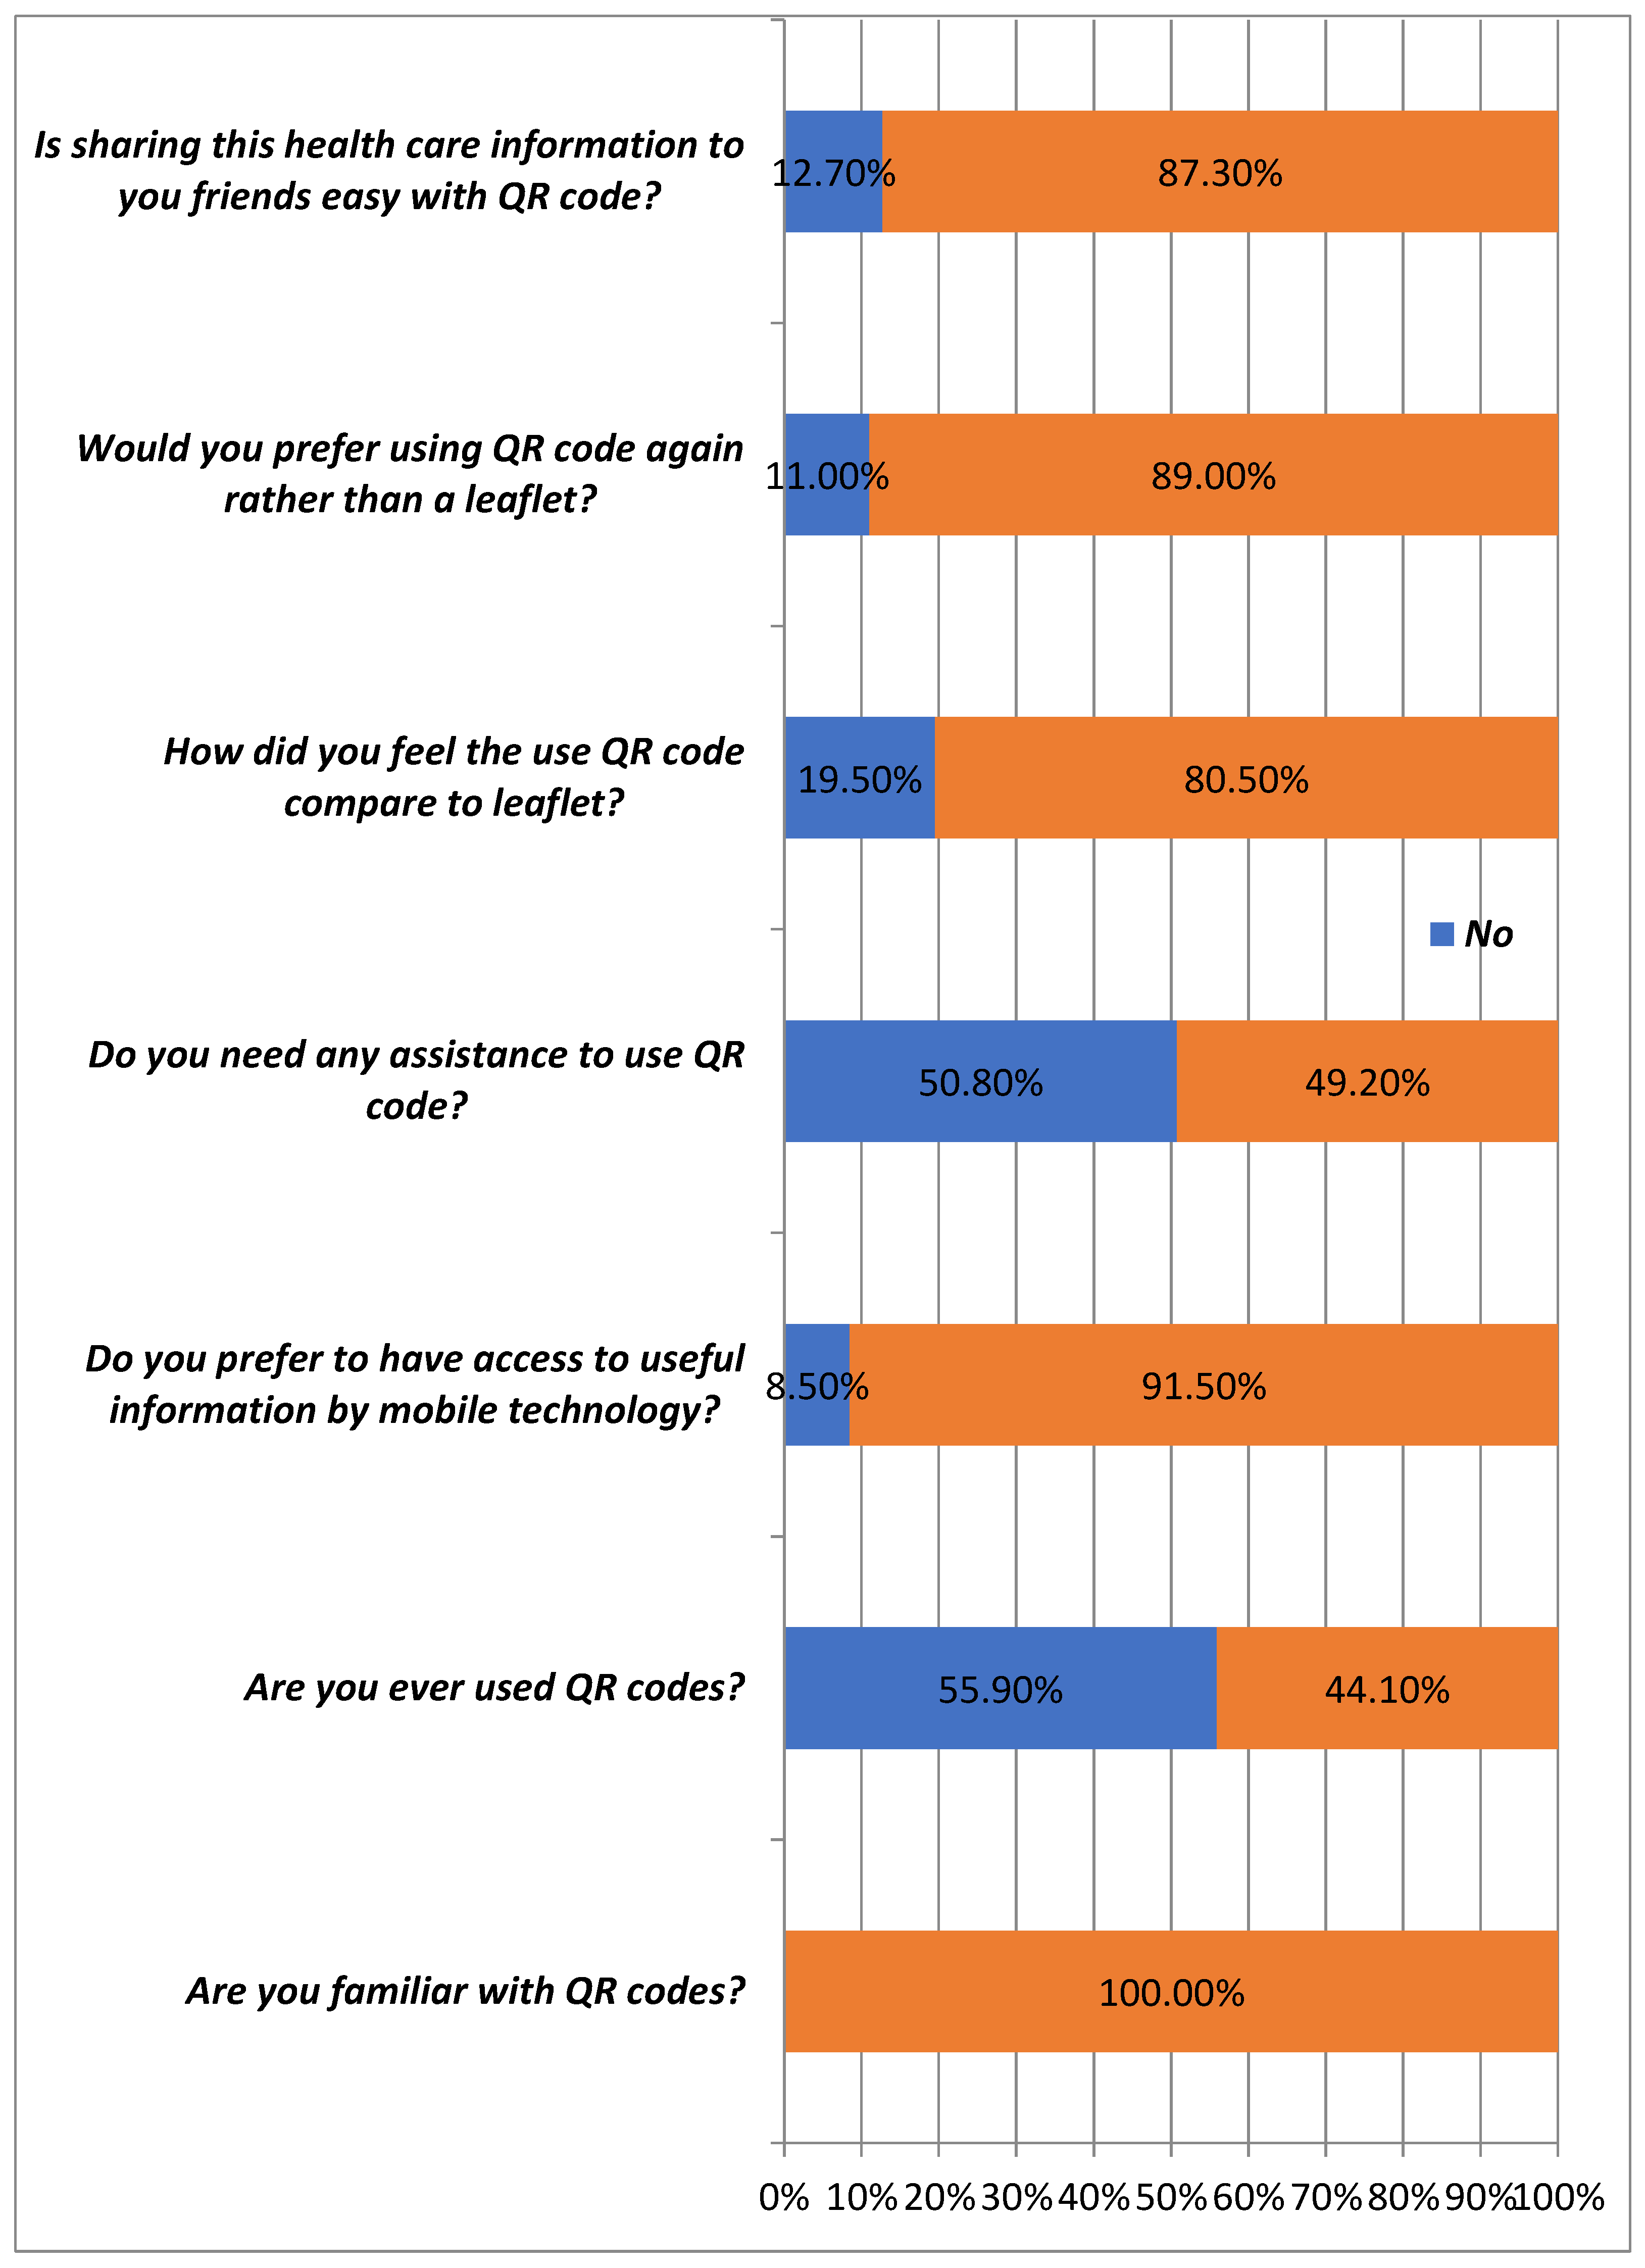
The study's participants (N=118) provide insights into their familiarity with QR codes. All participants (100%) knew about QR codes, indicating widespread awareness. However, only 44.1% had used them, while 55.9% had not, revealing a gap between familiarity and usage [
Figure 4].
Table 4 shows that while 100% of the participants reported familiarity with QR codes, only 44.1% had actually used them, with 100% familiarity among male (47) and female (71) participants, totaling 118. The chi-square and p-values are NA, indicating uniform responses, making statistical testing unnecessary. This consistent awareness supports further analysis of QR code usage preferences.
Table 5 and
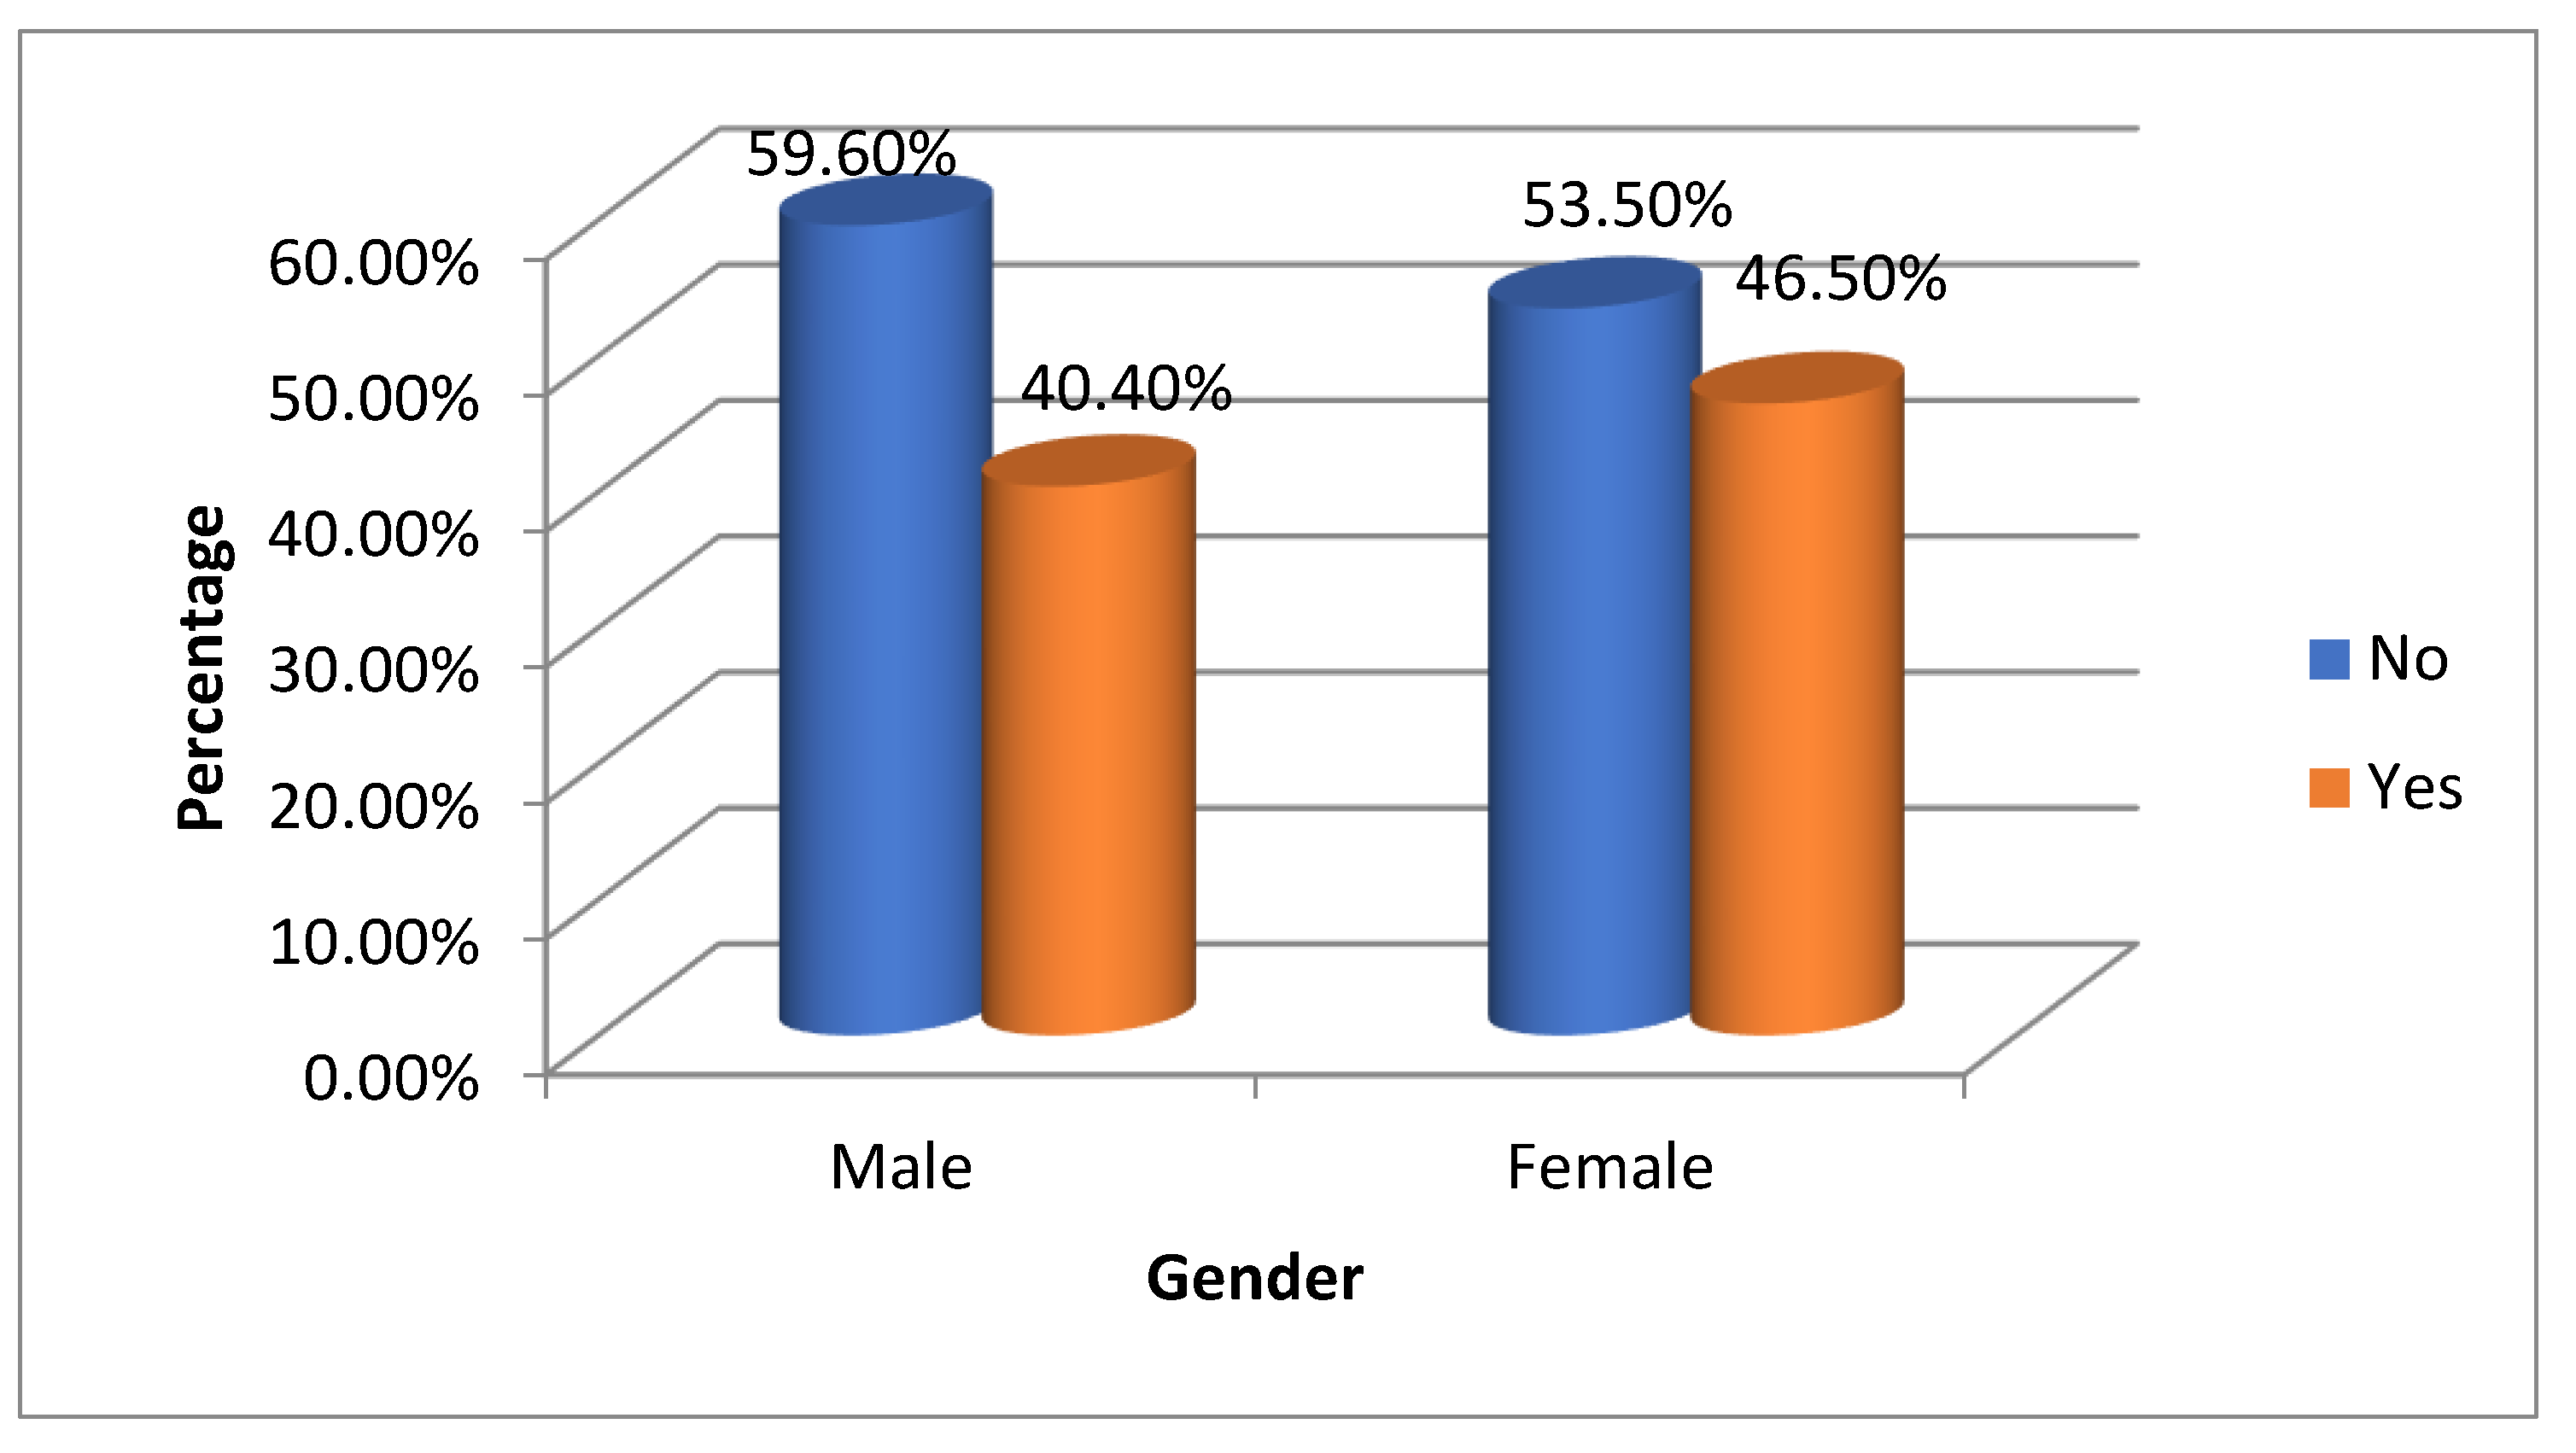
Figure 5 analyze QR code usage by gender. Among males, 59.6% (28) reported never using a QR code, while 40.4% (19) did. For females, 53.5% (38) had not used one, whereas 46.5% (33) had. Overall, 55.9% (66) of participants never used QR codes, compared to 44.1% (52) who had [
Figure 4].
The chi-square value is 0.420 with a p-value of 0.517, signaling no significant association between gender and QR code usage (p > 0.05). This indicates a slight difference in usage between genders but no substantial variation within this sample.
Have you ever used a QR code?
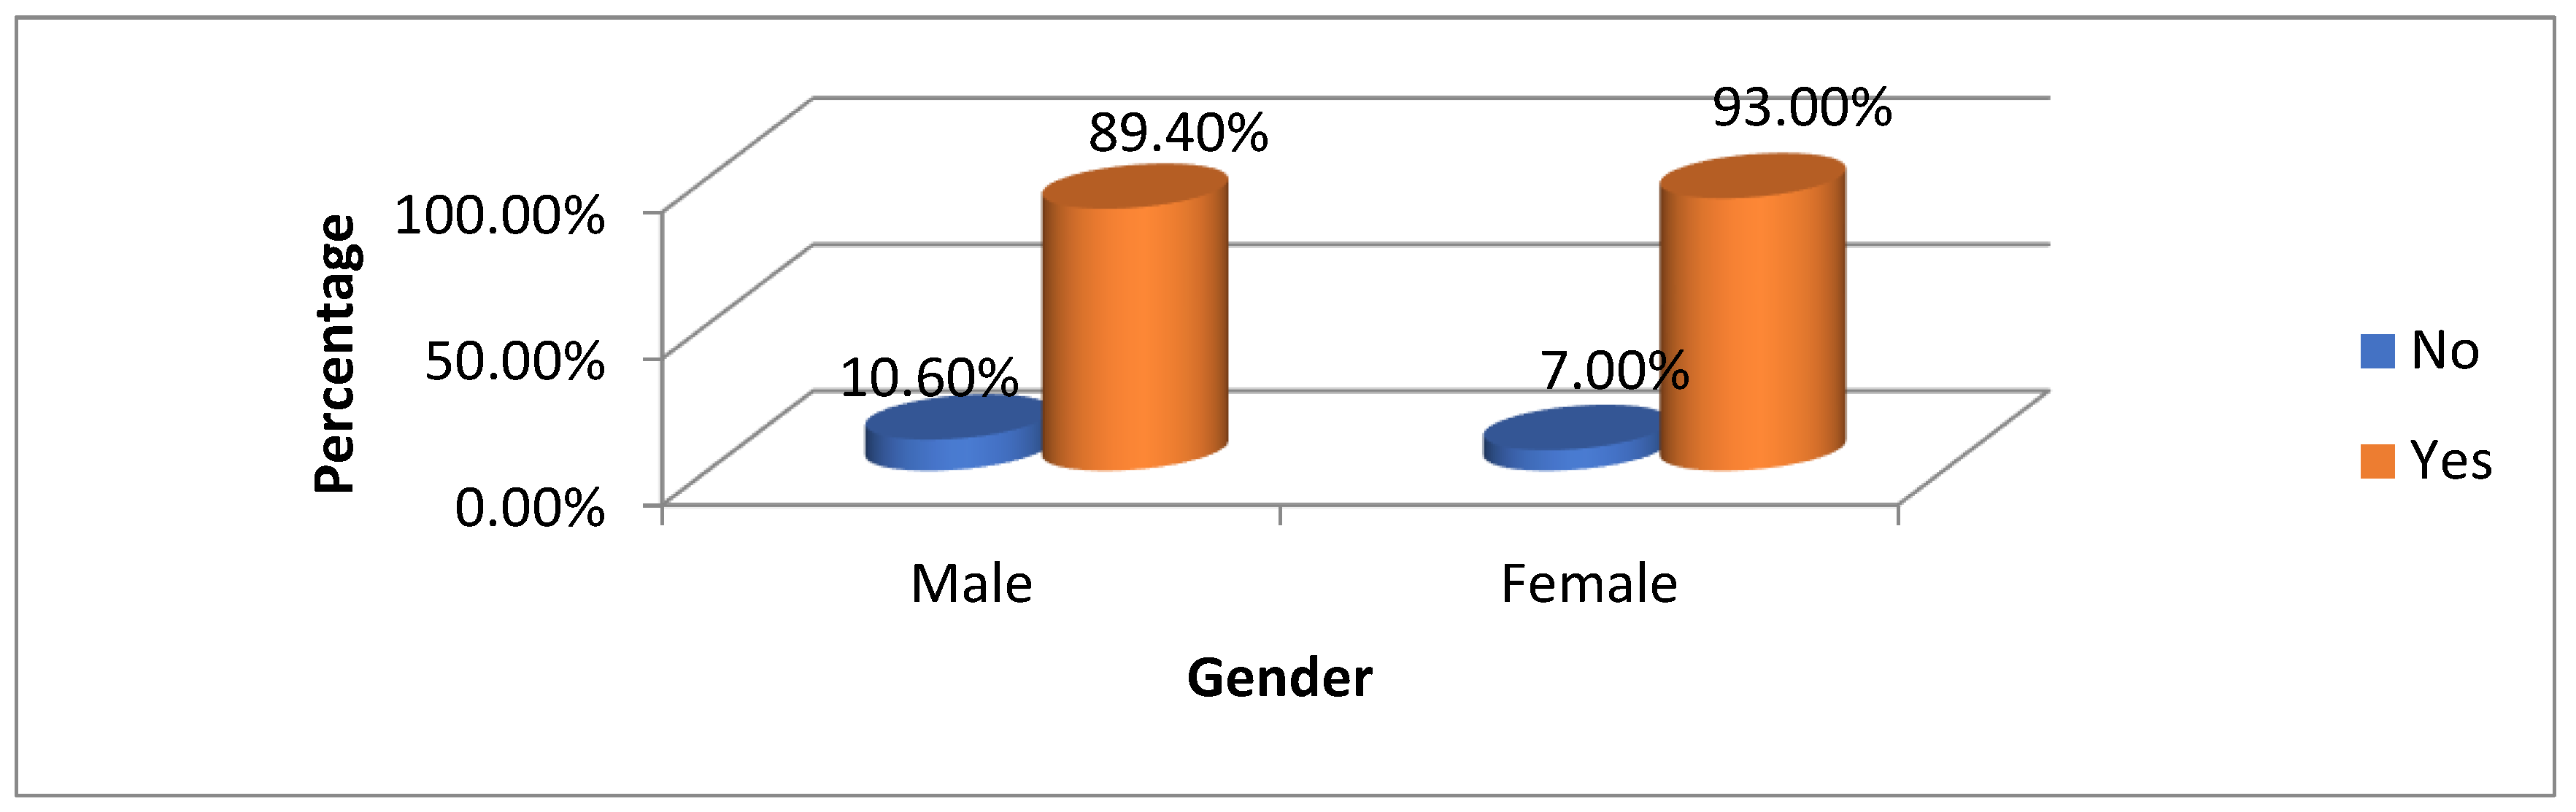
Table 6 and
Figure 6 illustrate gender preferences for mobile technology use. Among males, 89.4% (42) preferred mobile, while 10.6% (5) did not. For females, 93.0% (66) preferred mobile, with 7.0% (5) having no preference. Overall, 91.5% of participants (108) favored mobile access, with 8.5% (10) preferring otherwise. The chi-square value of 0.471 and p-value of 0.492 indicate no significant association between gender and mobile preference (p > 0.05), suggesting both genders strongly favor mobile access with minor differences between them.
Do you prefer to have access to helpful information via mobile technology?
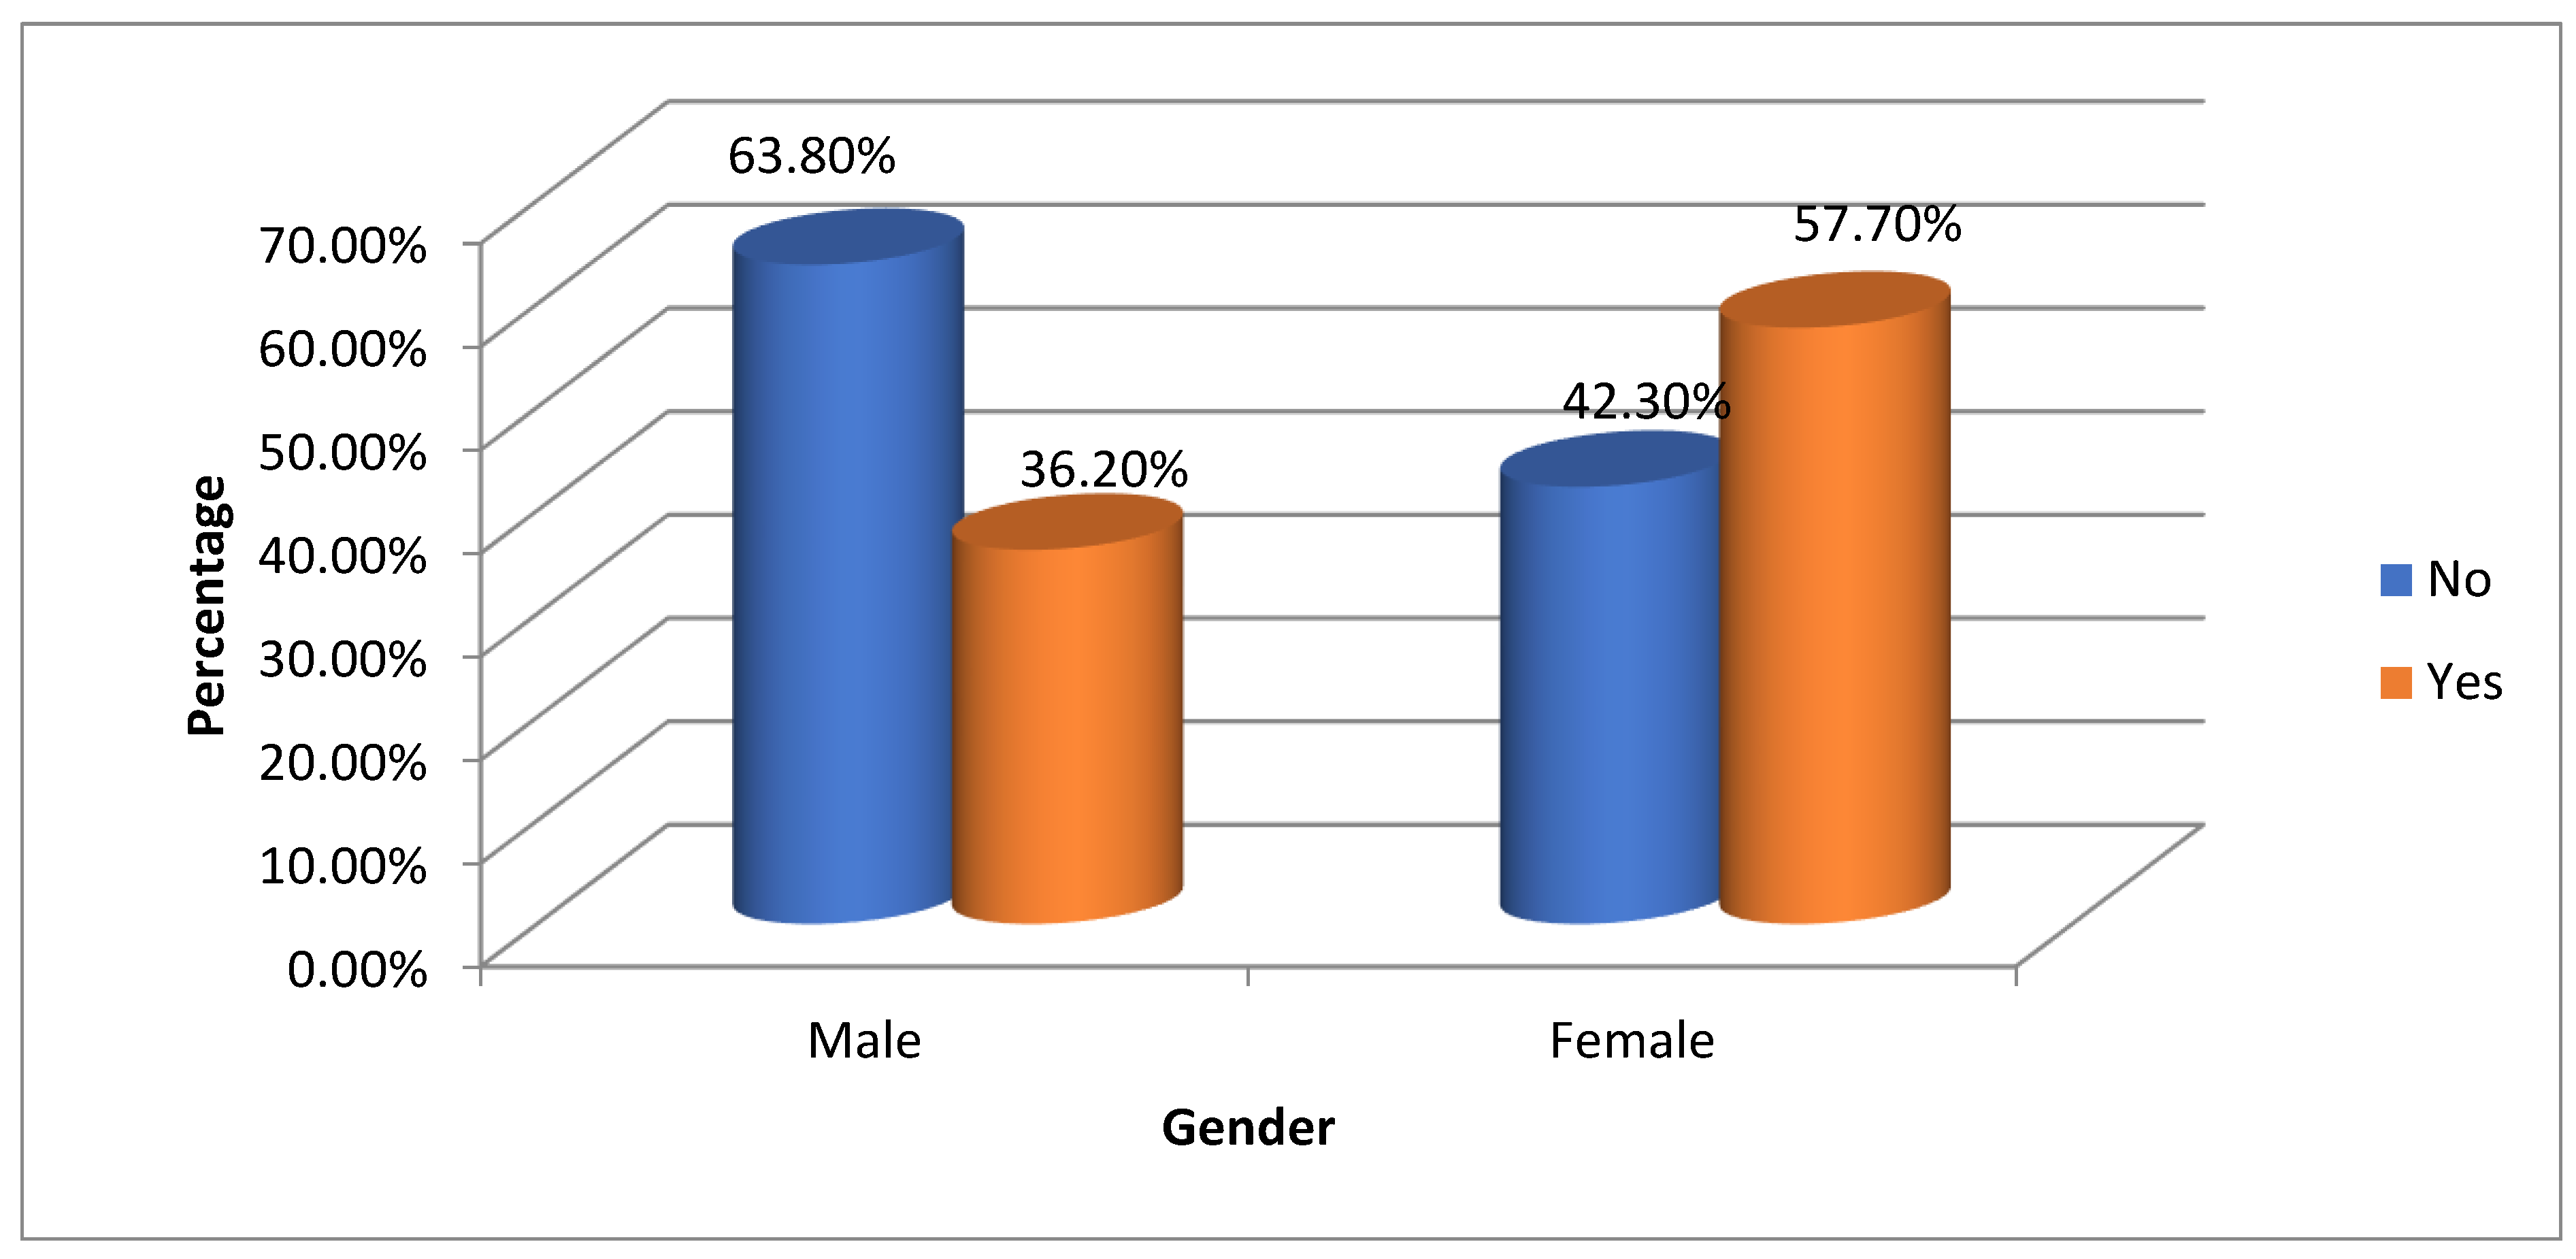
Table 7 and
Figure 7 analyze QR code assistance needs by gender. Among males, 63.8% (30) reported no need for help, while 36.2% (17) required assistance. In contrast, 42.3% (30 women) did not need help, compared to 57.7% (41) who did. Overall, 50.8% of participants (60) felt no assistance was necessary, whereas 49.2% (58) needed help. The chi-square test showed a value of 5.268 and a p-value of 0.022*, indicating a significant association between gender and QR code assistance needs (p < 0.05). This indicates that females are more likely than males to need help, highlighting a potential gender disparity in comfort with this technology.
Table 8 and
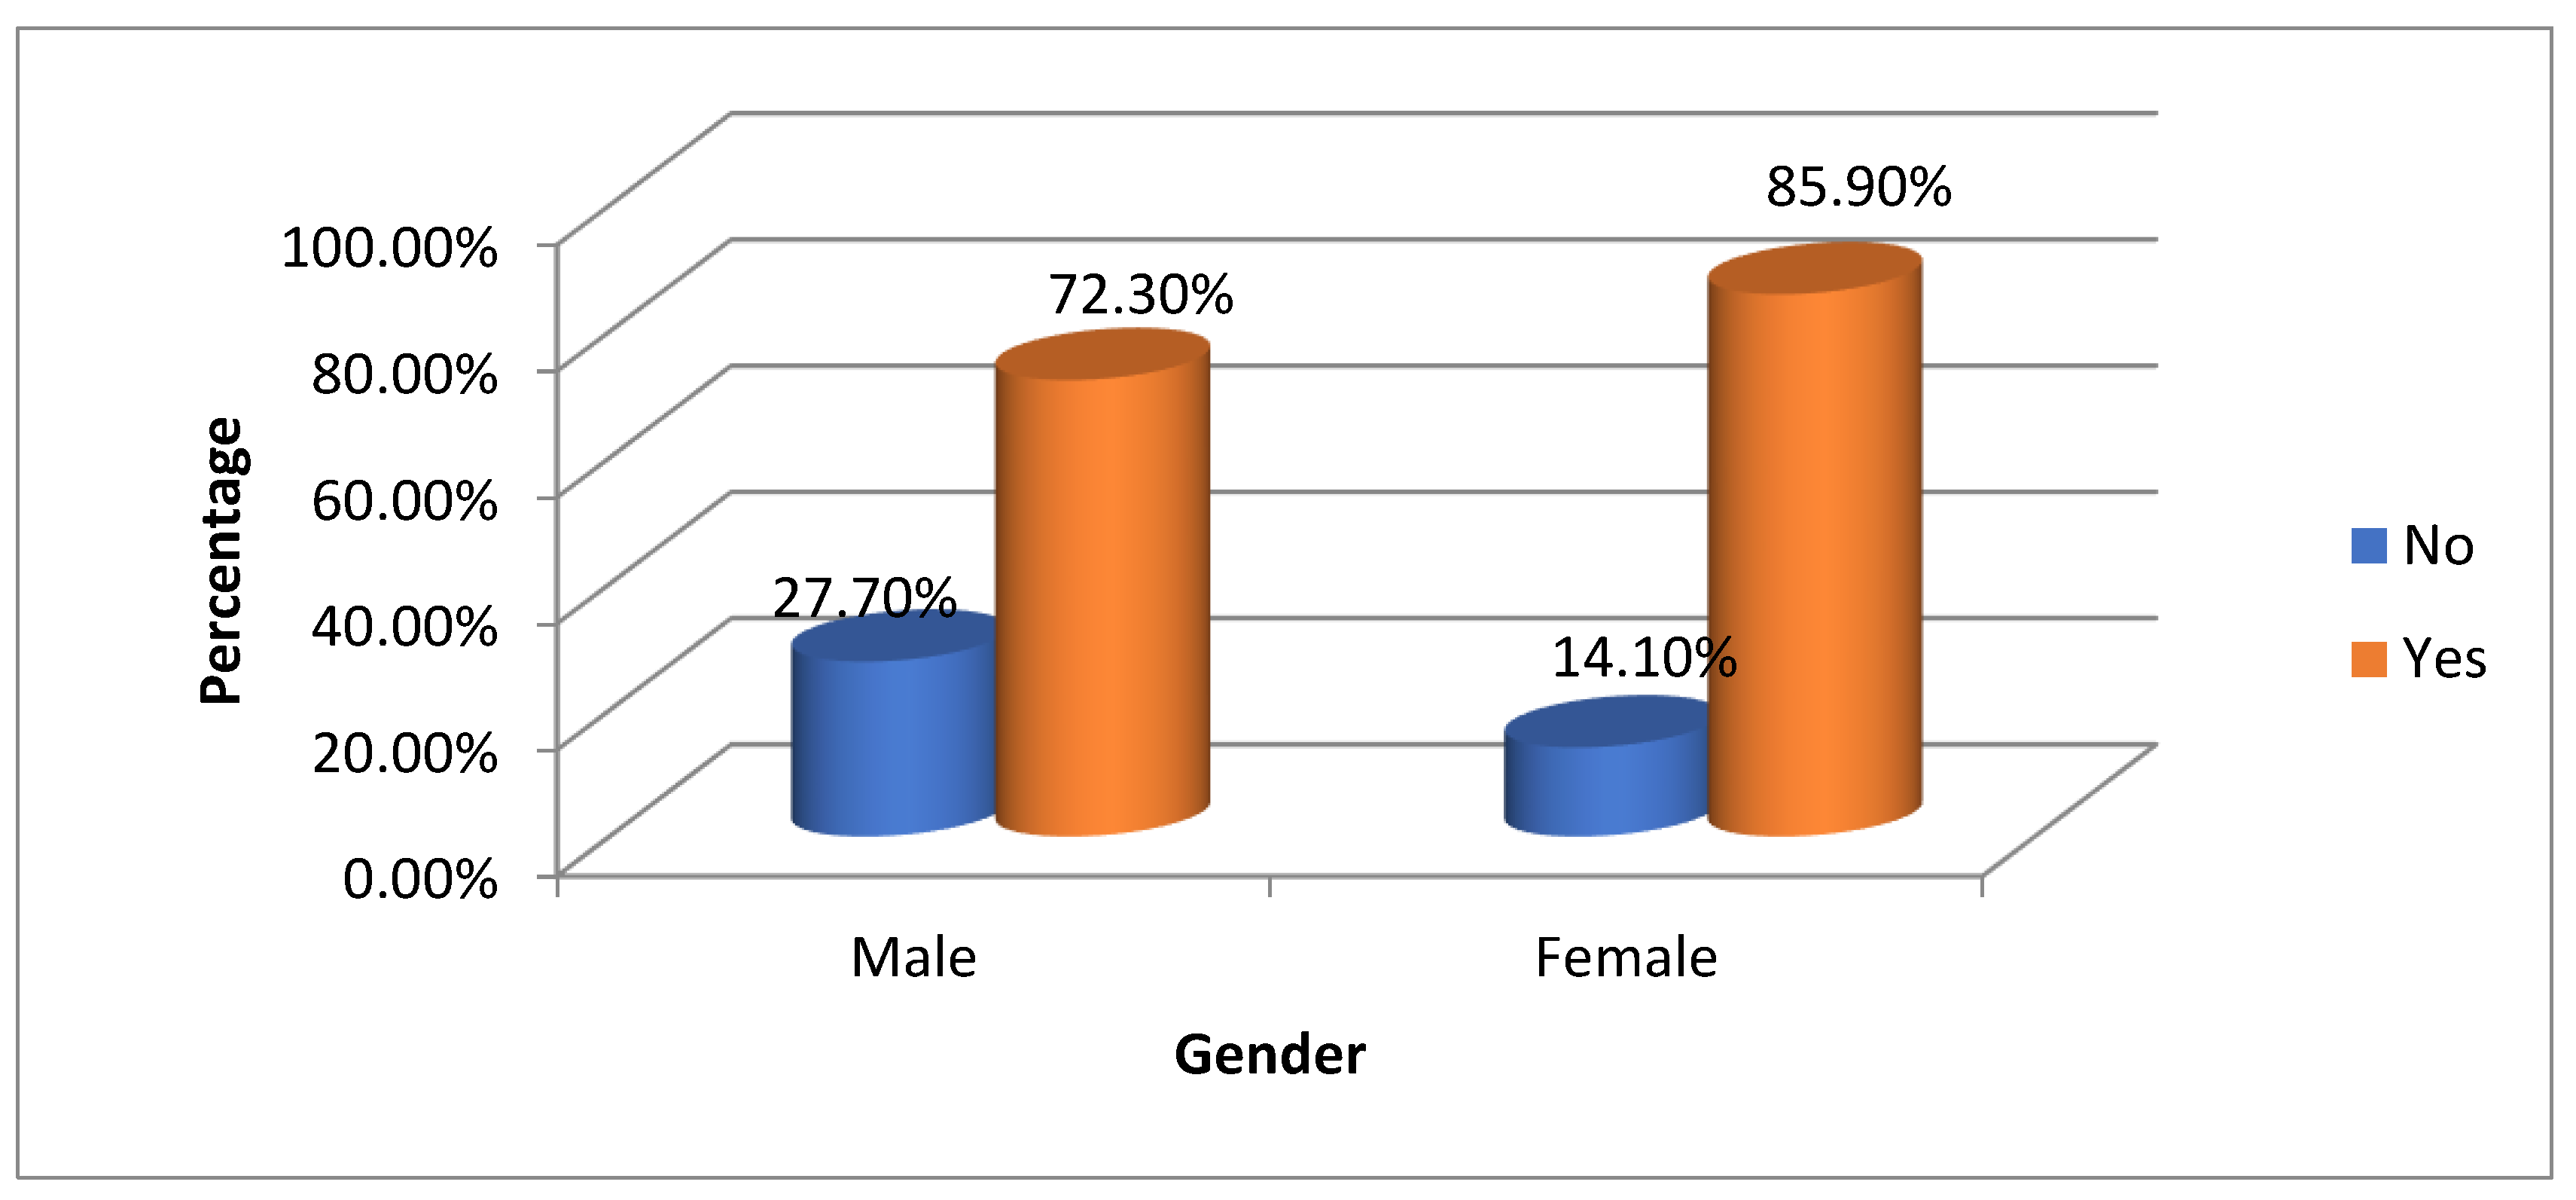
Figure 8 examine perceptions of QR codes versus leaflets by gender. Among males, 72.3% (34) preferred QR codes, while 27.7% (13) did not. In contrast, 85.9% of females (61) preferred QR codes, with 14.1% (10) favoring leaflets. Overall, 80.5% of participants (95) preferred QR codes, while 19.5% (23) did not. The chi-square value is 3.321 with a p-value of 0.068, indicating no significant association between gender and preference (p > 0.05). Although females show a stronger preference for QR codes, the difference is not statistically meaningful. This suggests a general trend toward QR codes without significant gender context distinction.
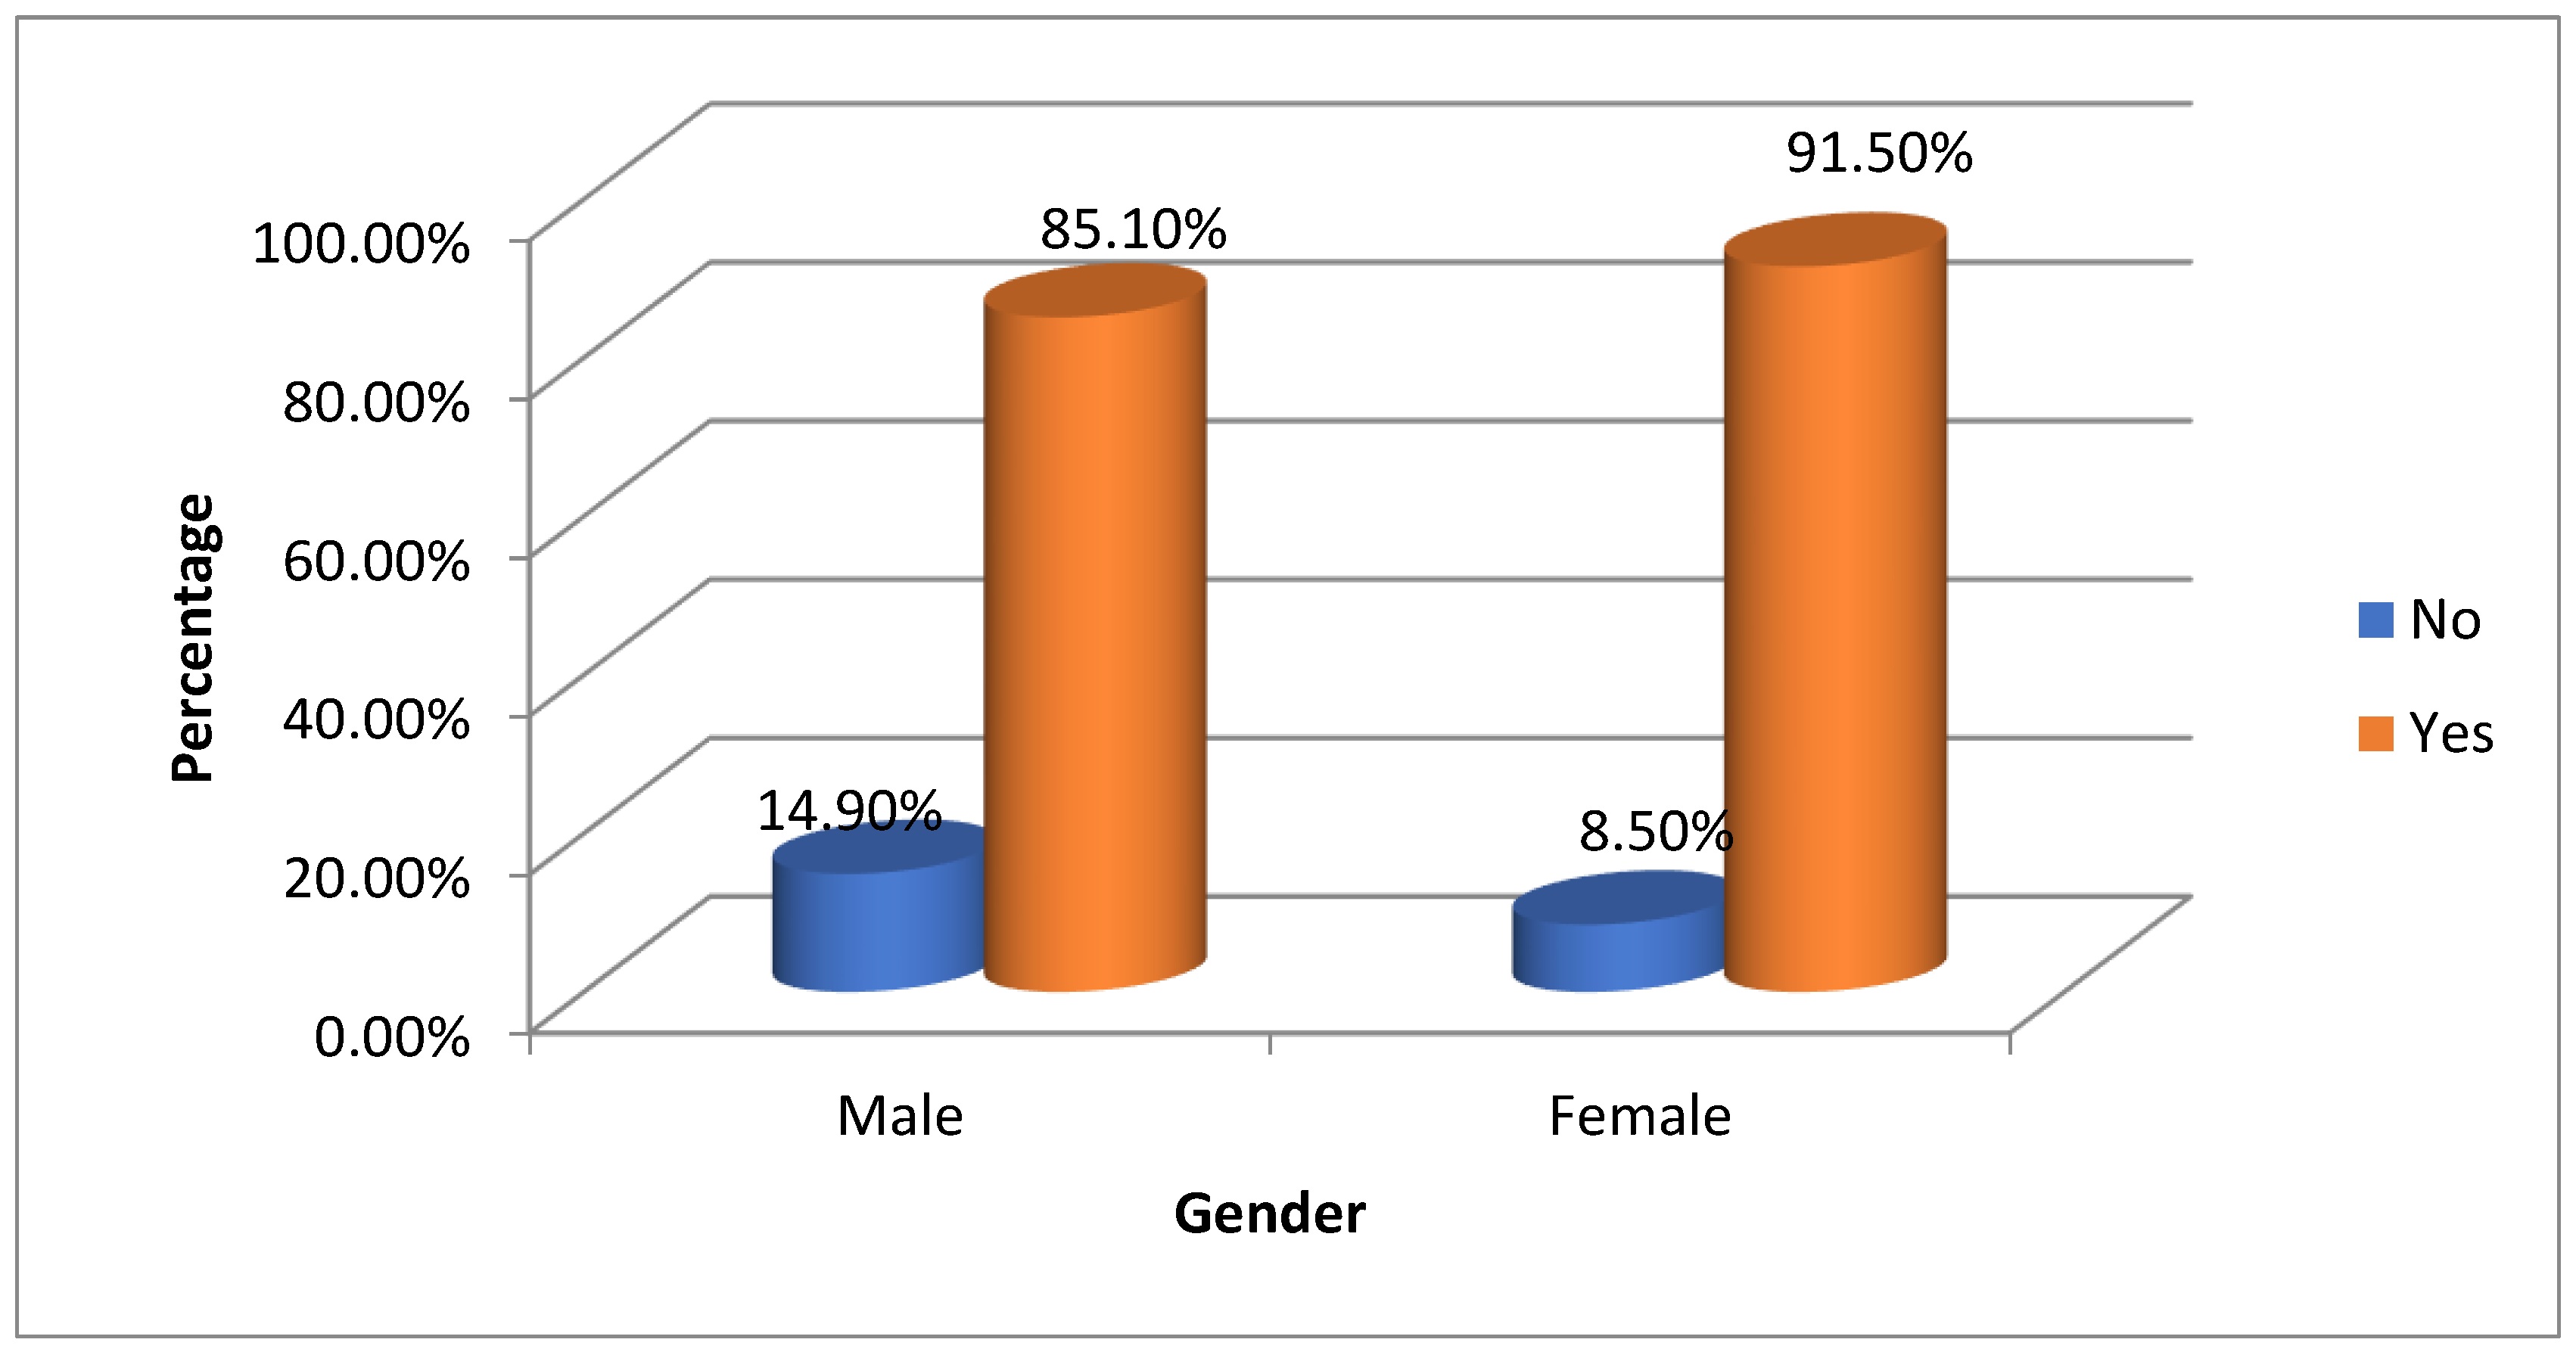
Table 9 and
Figure 9 show participants' preferences for QR codes versus leaflets by gender. Among males, 85.1% (40) preferred QR codes, while 14.9% (7) did not. For females, 91.5% (65) favored QR codes, and 8.5% (6) chose not to. Overall, 89.0% (105) preferred QR codes, compared to 11.0% (13) for leaflets [
Figure 10]. A chi-square test found no significant association between gender and QR code preference (p = 0.274), indicating both genders favor QR codes with minor differences. This highlights QR codes as preferred over traditional leaflets (
Figure 10)
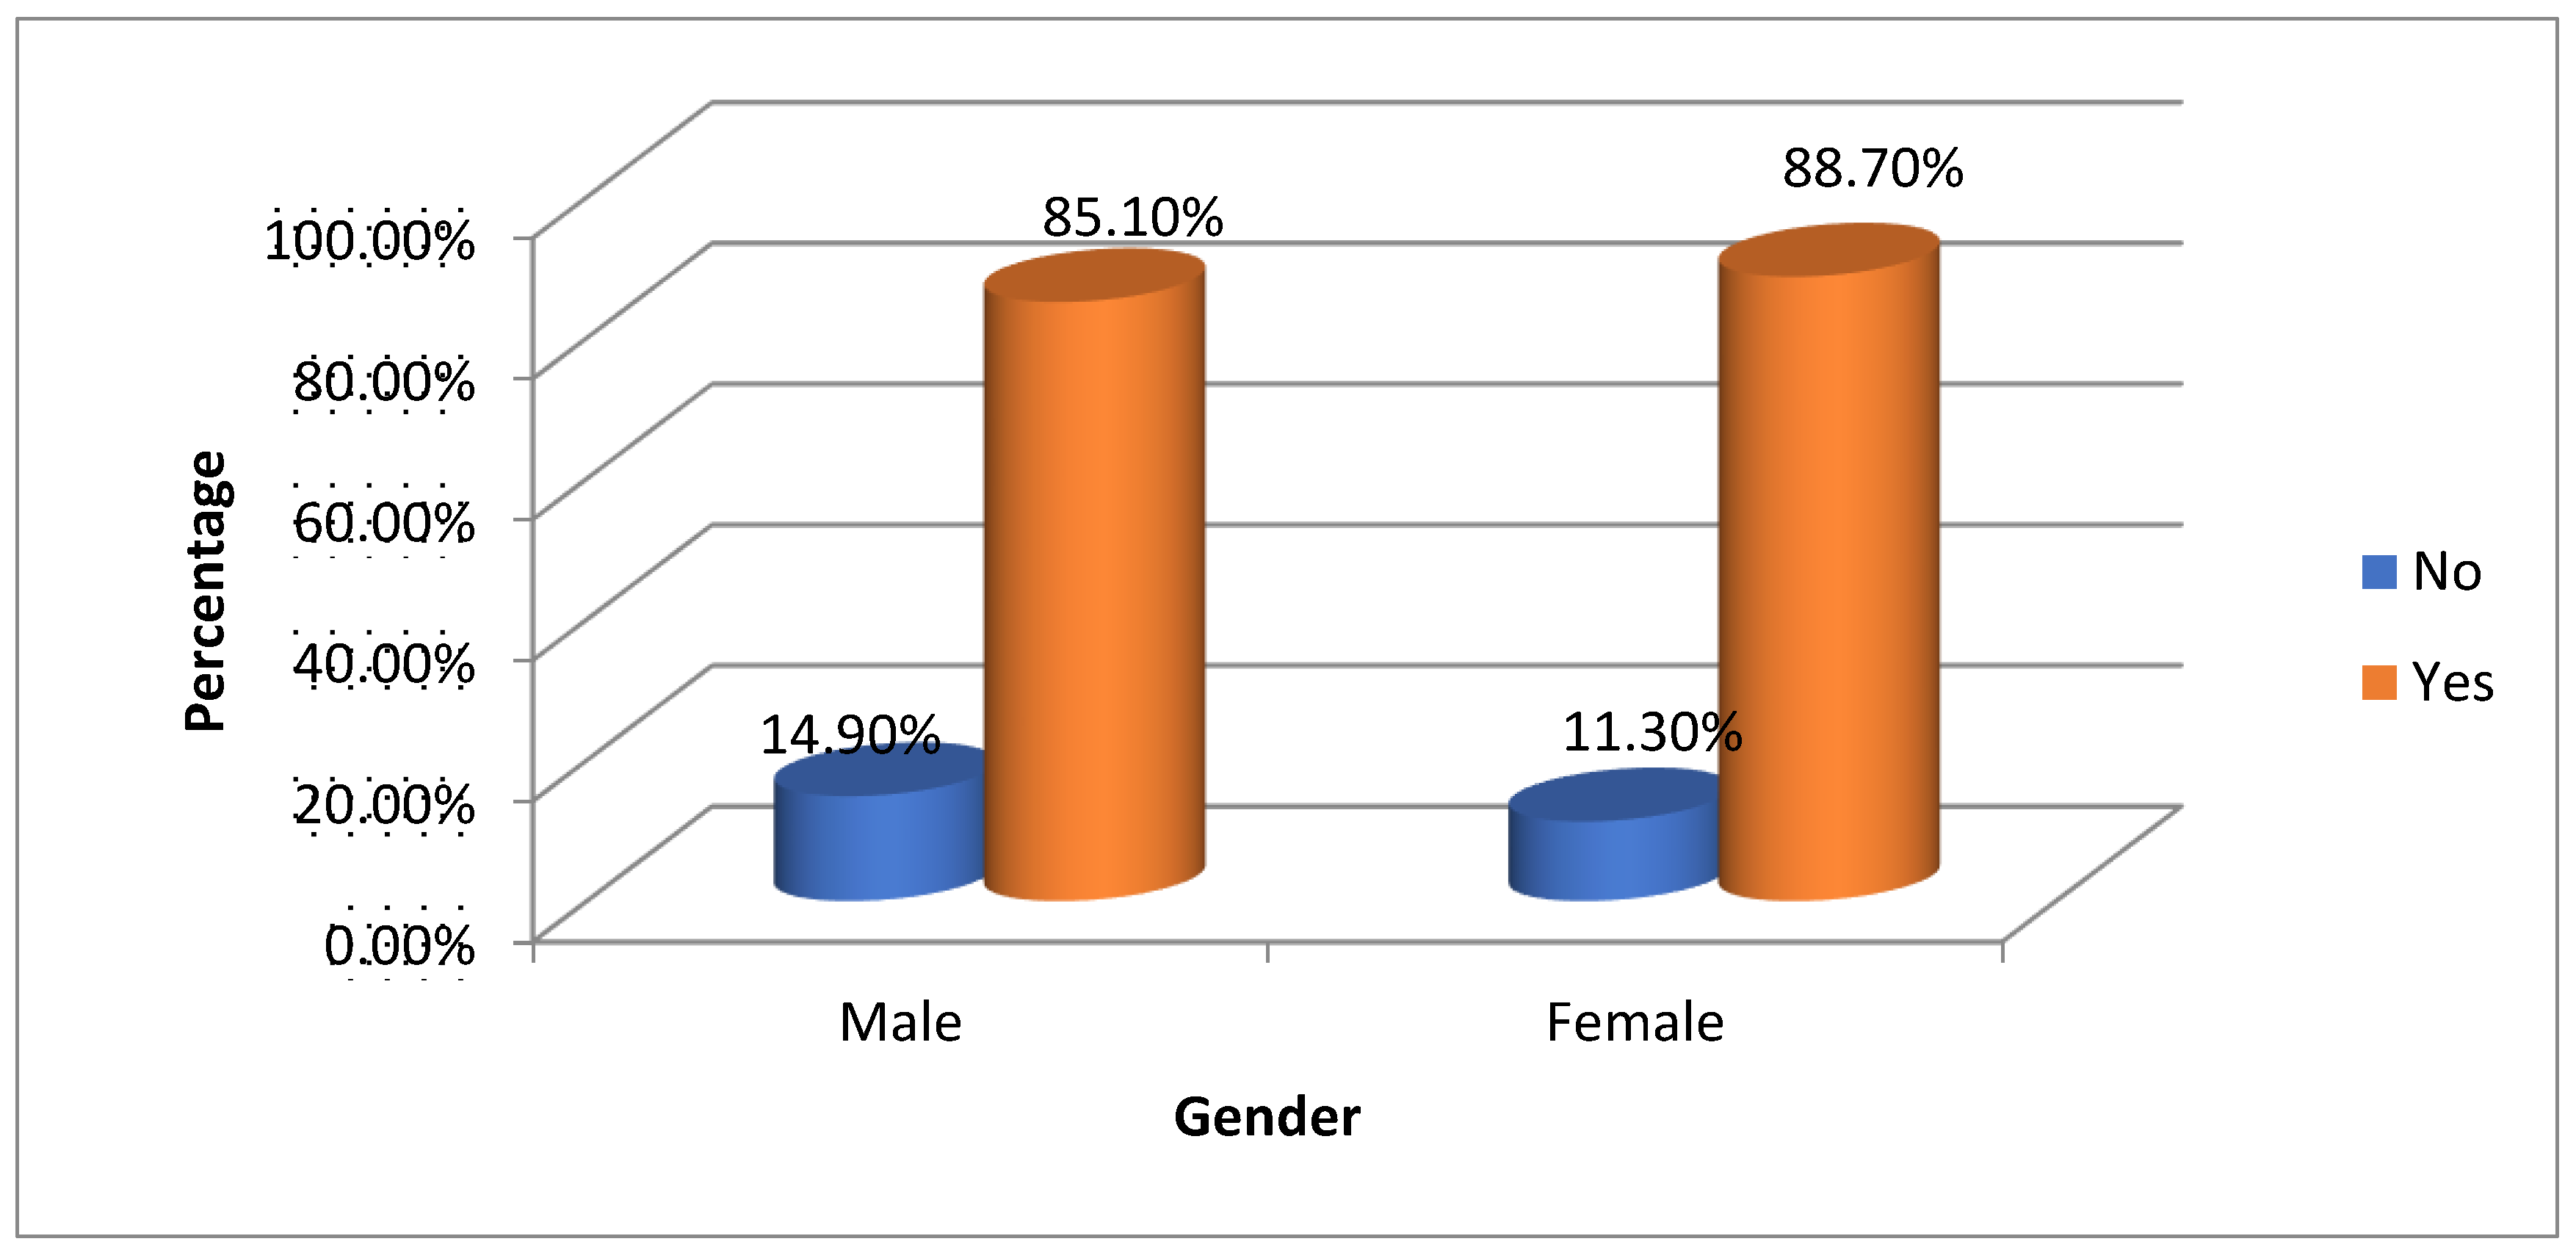
Table 10 and
Figure 10 evaluate the ease of sharing healthcare information via QR codes by gender. Among males, 85.1% (40) found it easy, while 14.9% (7) did not. For females, 88.7% (63) reported ease, with 11.3% (8) finding it challenging. Overall, 87.3% (103) found sharing easy, compared to 12.7% (15) who did not [
Figure 11]. The chi-square test value of 0.335 and p-value of 0.563 show no significant association between gender and the perceived ease of sharing (p > 0.05). This indicates both genders largely agree on QR code convenience for sharing healthcare information, with minor response variations, demonstrating QR codes' effectiveness for information dissemination.
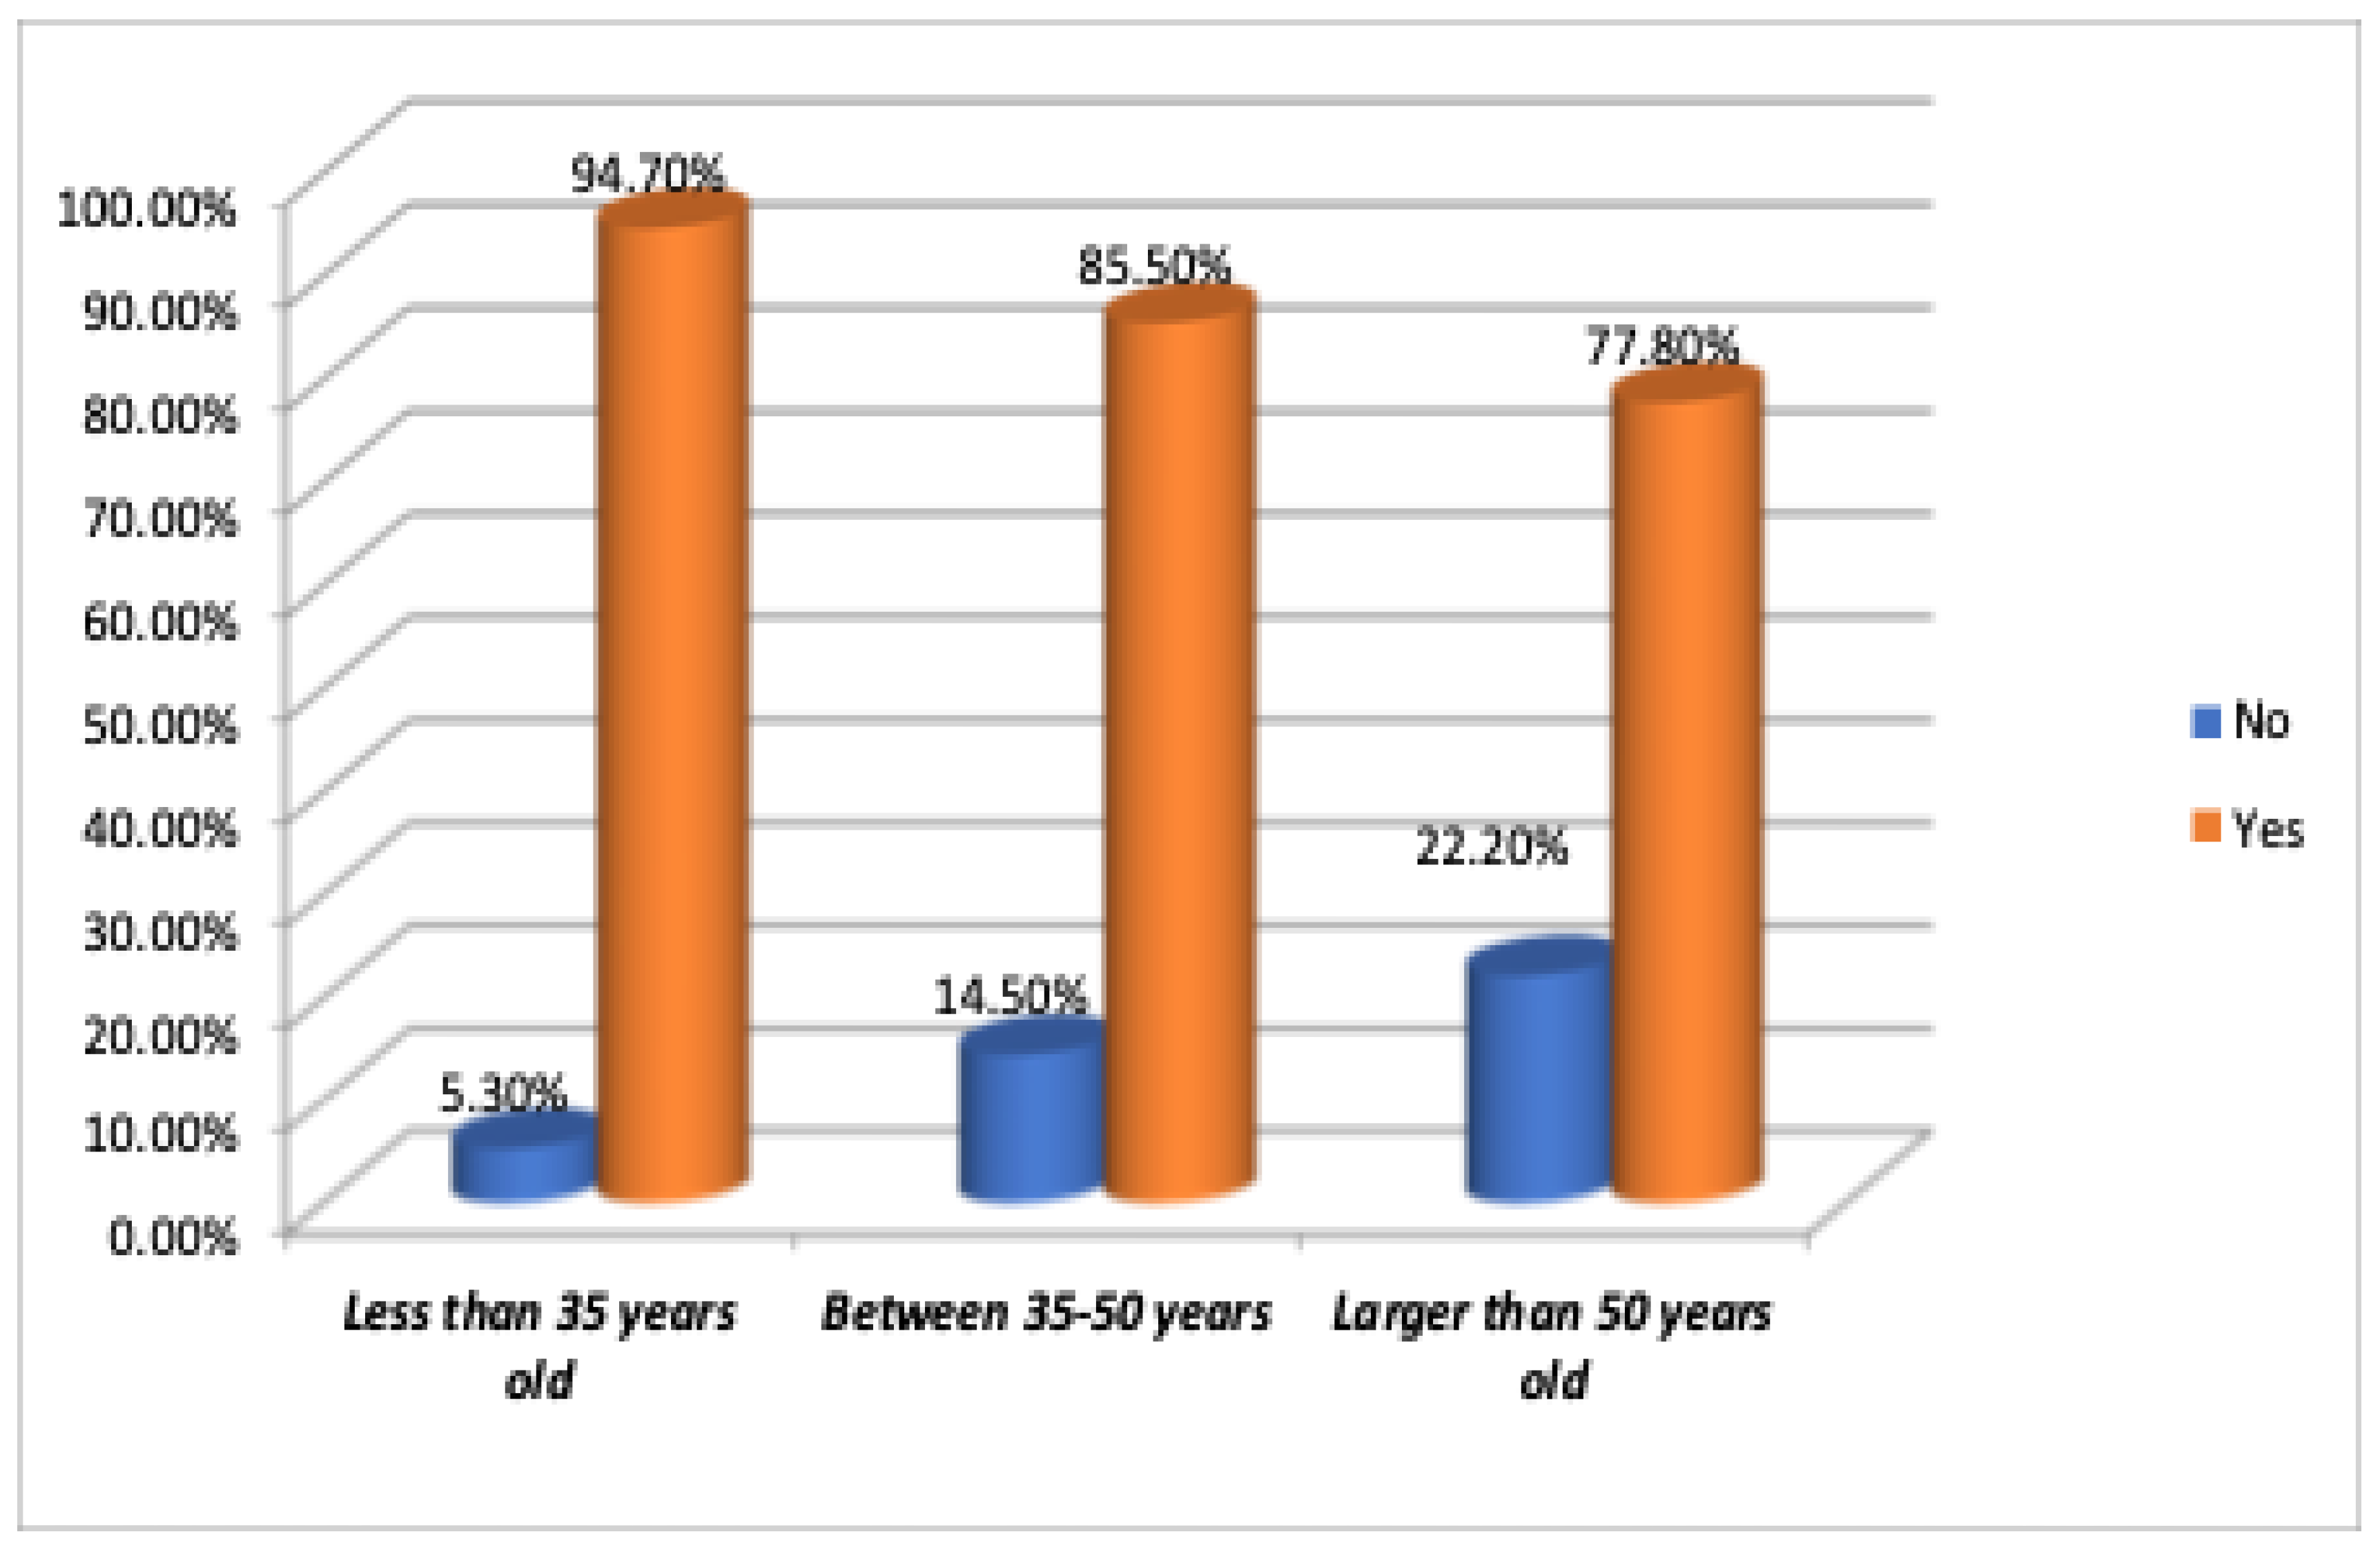
Table 11 and
Figure 11 show that most respondents across all age groups find sharing healthcare information via QR codes easy. Among 118 participants, 87.3% answered "Yes" and 12.7% "No." Specifically, 94.7% of those under 35, 85.5% aged 35-50, and 77.8% over 50 find QR codes easy to use. A chi-square value of 3.549 and a p-value of 0.170 indicate no significant age difference in perceptions of QR code ease. Overall, participants strongly agree that QR codes effectively share healthcare information, regardless of age.
3.1. Familiarity with QR Codes
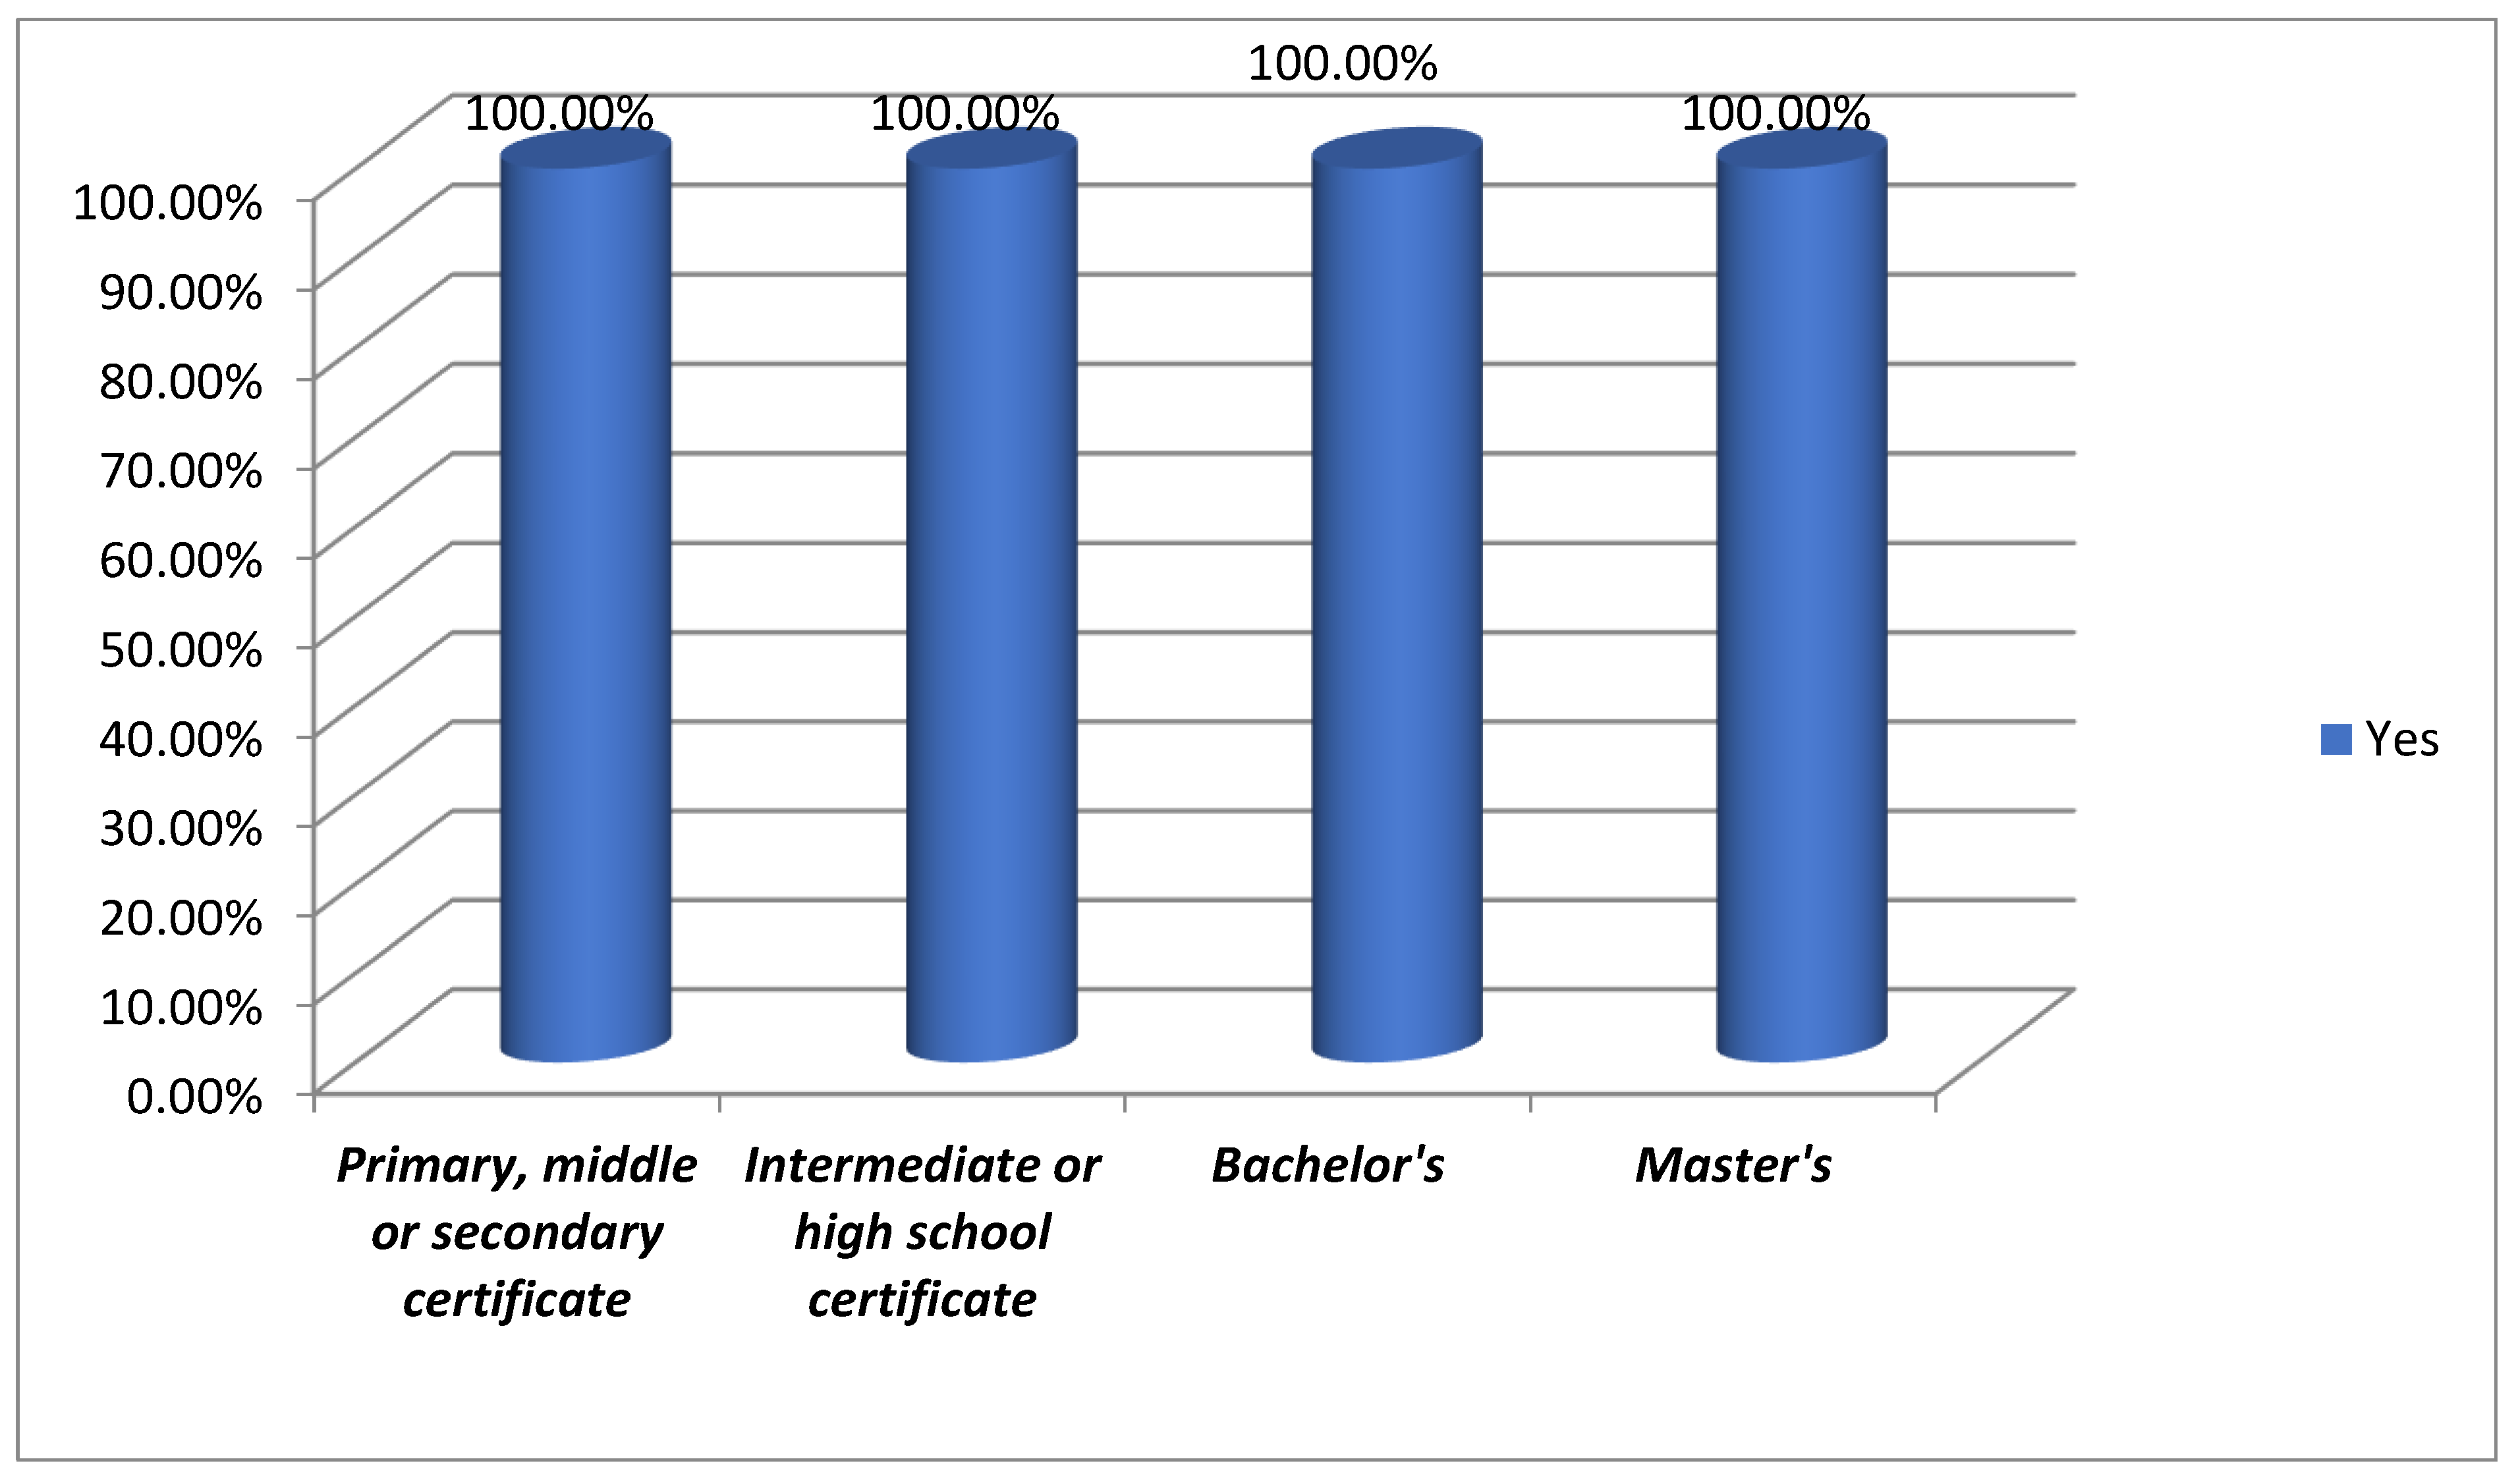
QR codes are familiar across all education levels. From primary to higher education, individuals recognize QR codes, highlighting their presence in modern life. Notably, respondents with Master’s, Bachelor’s, and intermediate degrees show equal familiarity, indicating that QR codes are a mainstream technology understood across diverse demographics. [
Figure 12 and
Table 12].
3.1. Usage of QR Codes
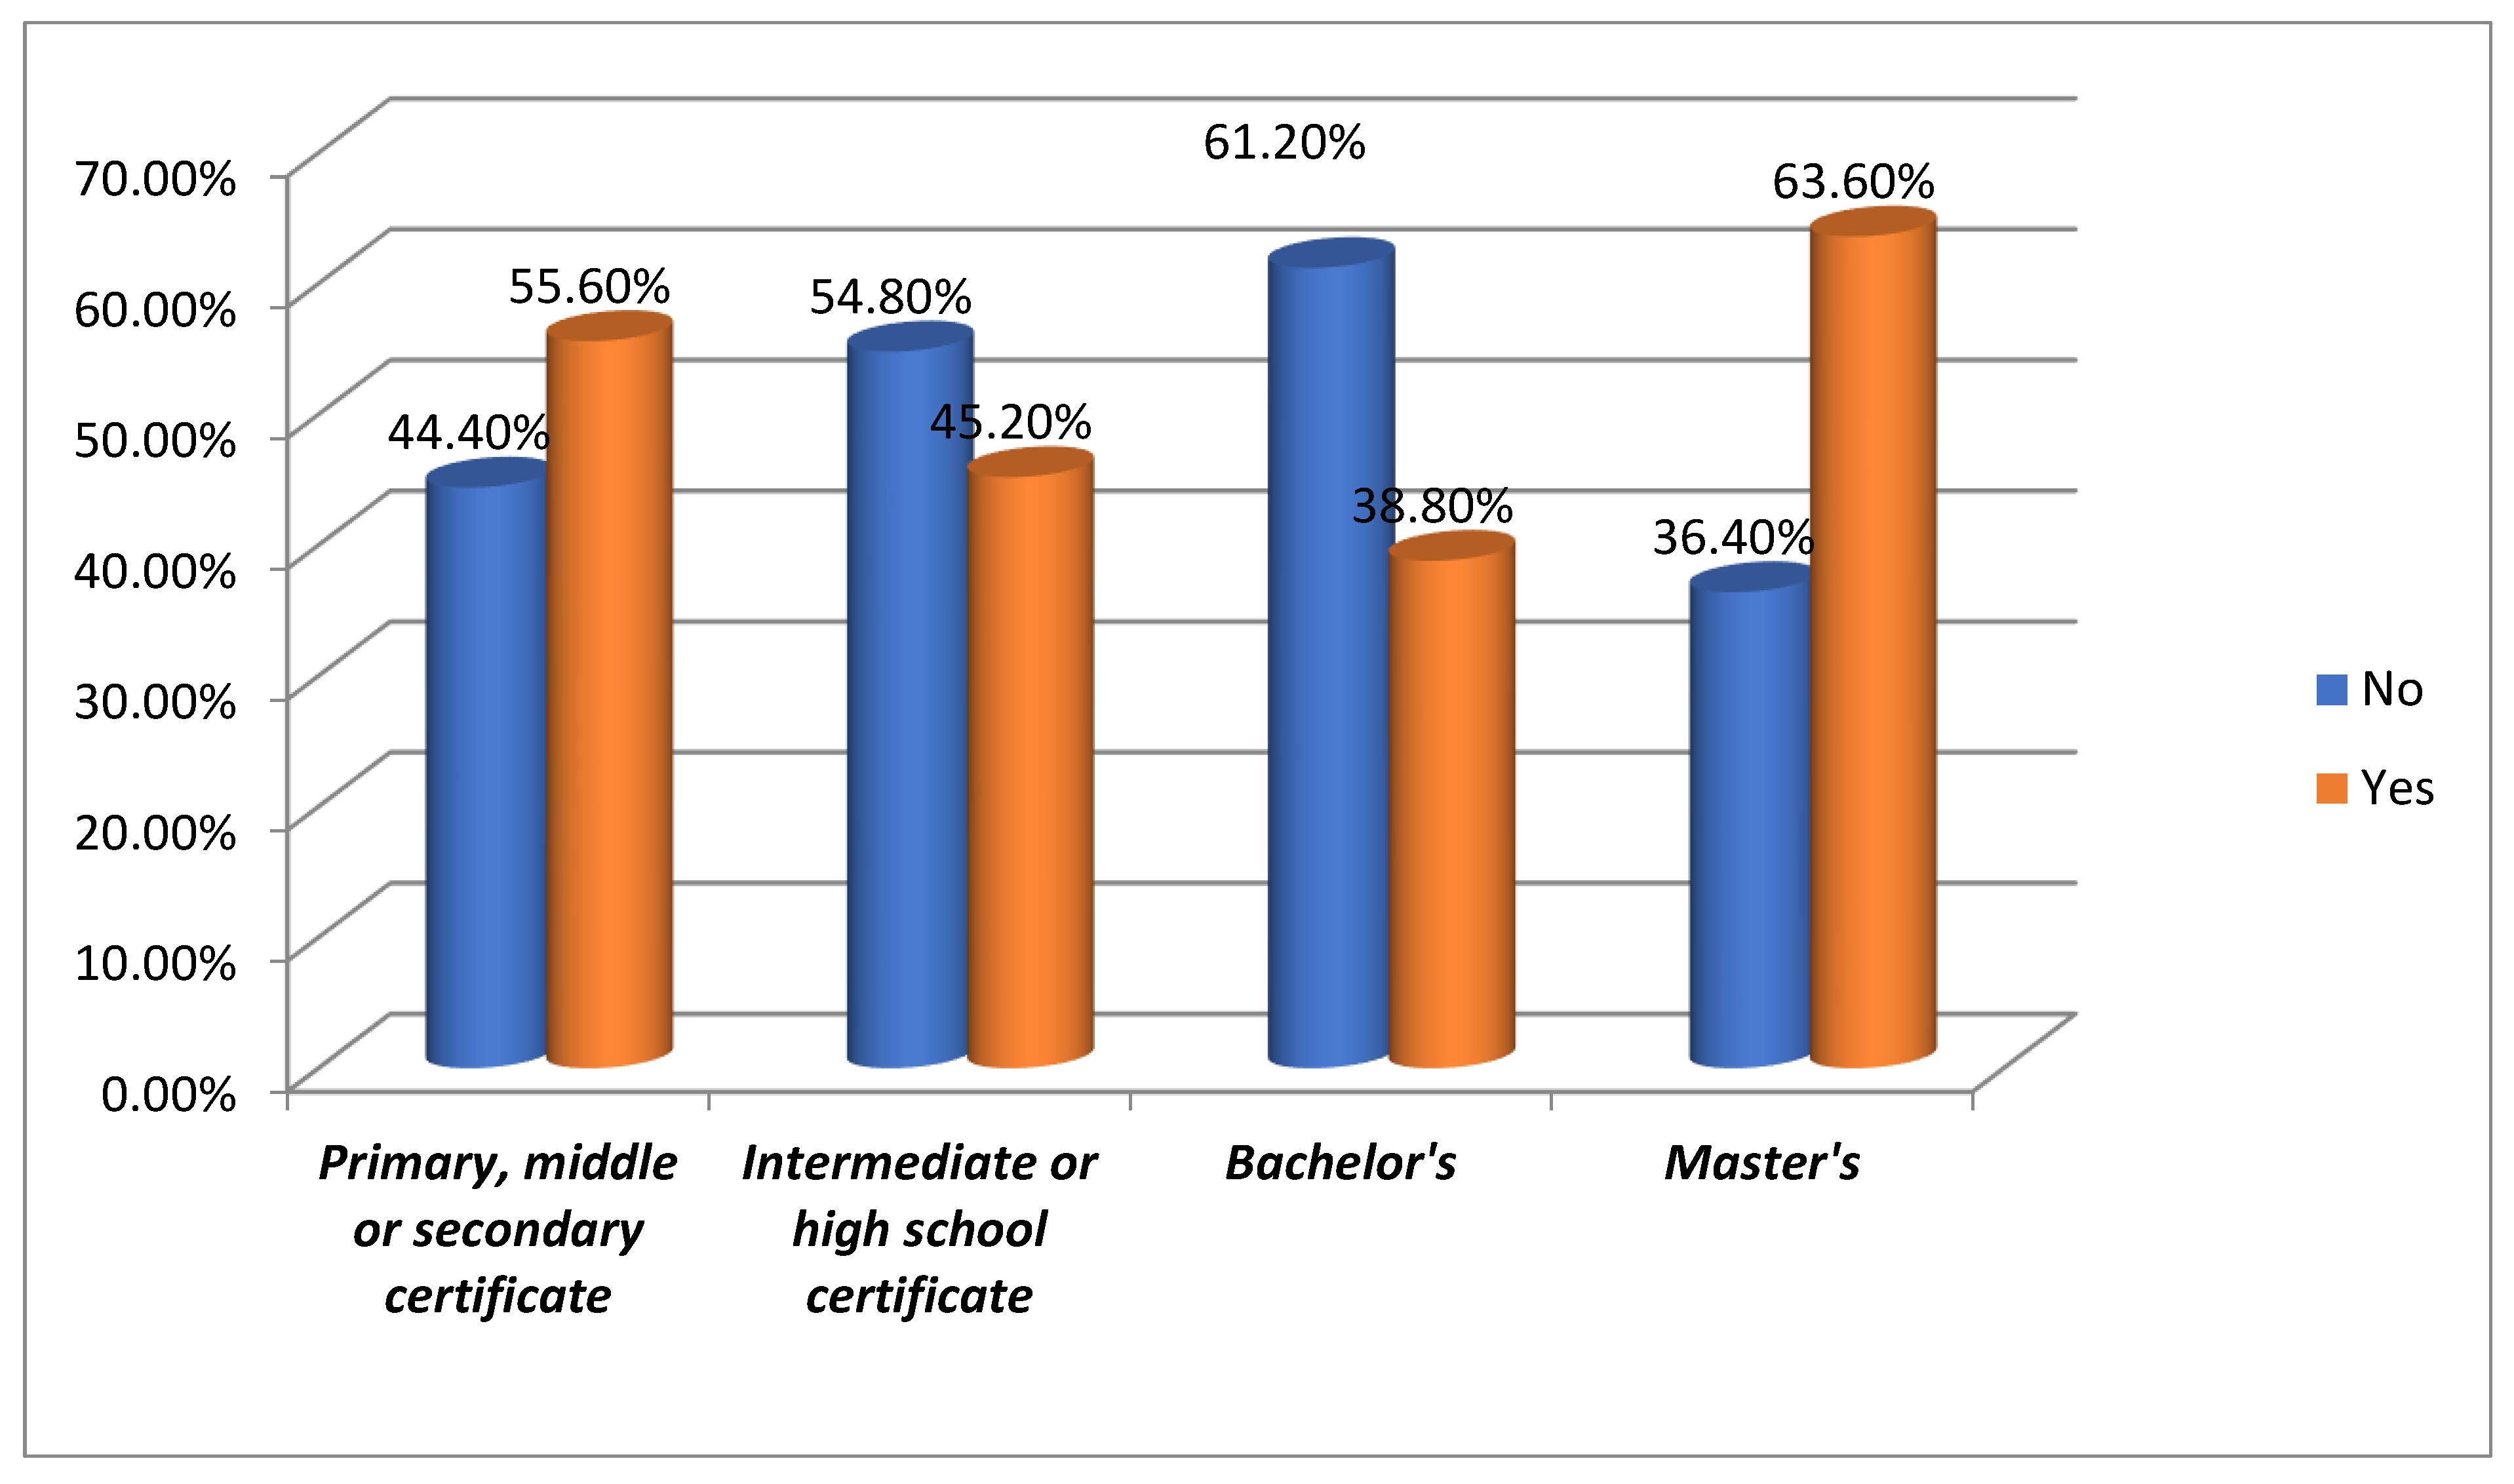
The usage of QR codes varies by educational level. In the group with a primary, middle, or secondary certificate, 55.6% used QR codes, but 44.4% did not. This indicates that while QR codes are recognized, actual usage is less prevalent in this group. Among those with an intermediate or high school certificate, 45.2% have used QR codes, with 54.8% not using them. In contrast, respondents with a Bachelor’s degree show a higher rate of non-usage (61.2%), though 38.8% still engage with QR codes. This trend is even more pronounced in the Master’s degree group, where 63.6% have used QR codes, showcasing a higher usage rate in individuals with advanced education. 44.1% of the respondents have used QR codes, and 55.9% have not, indicating a notable gap between familiarity and active usage [
Figure 13 and
Table 12].
3.3. Preference for Mobile Technology
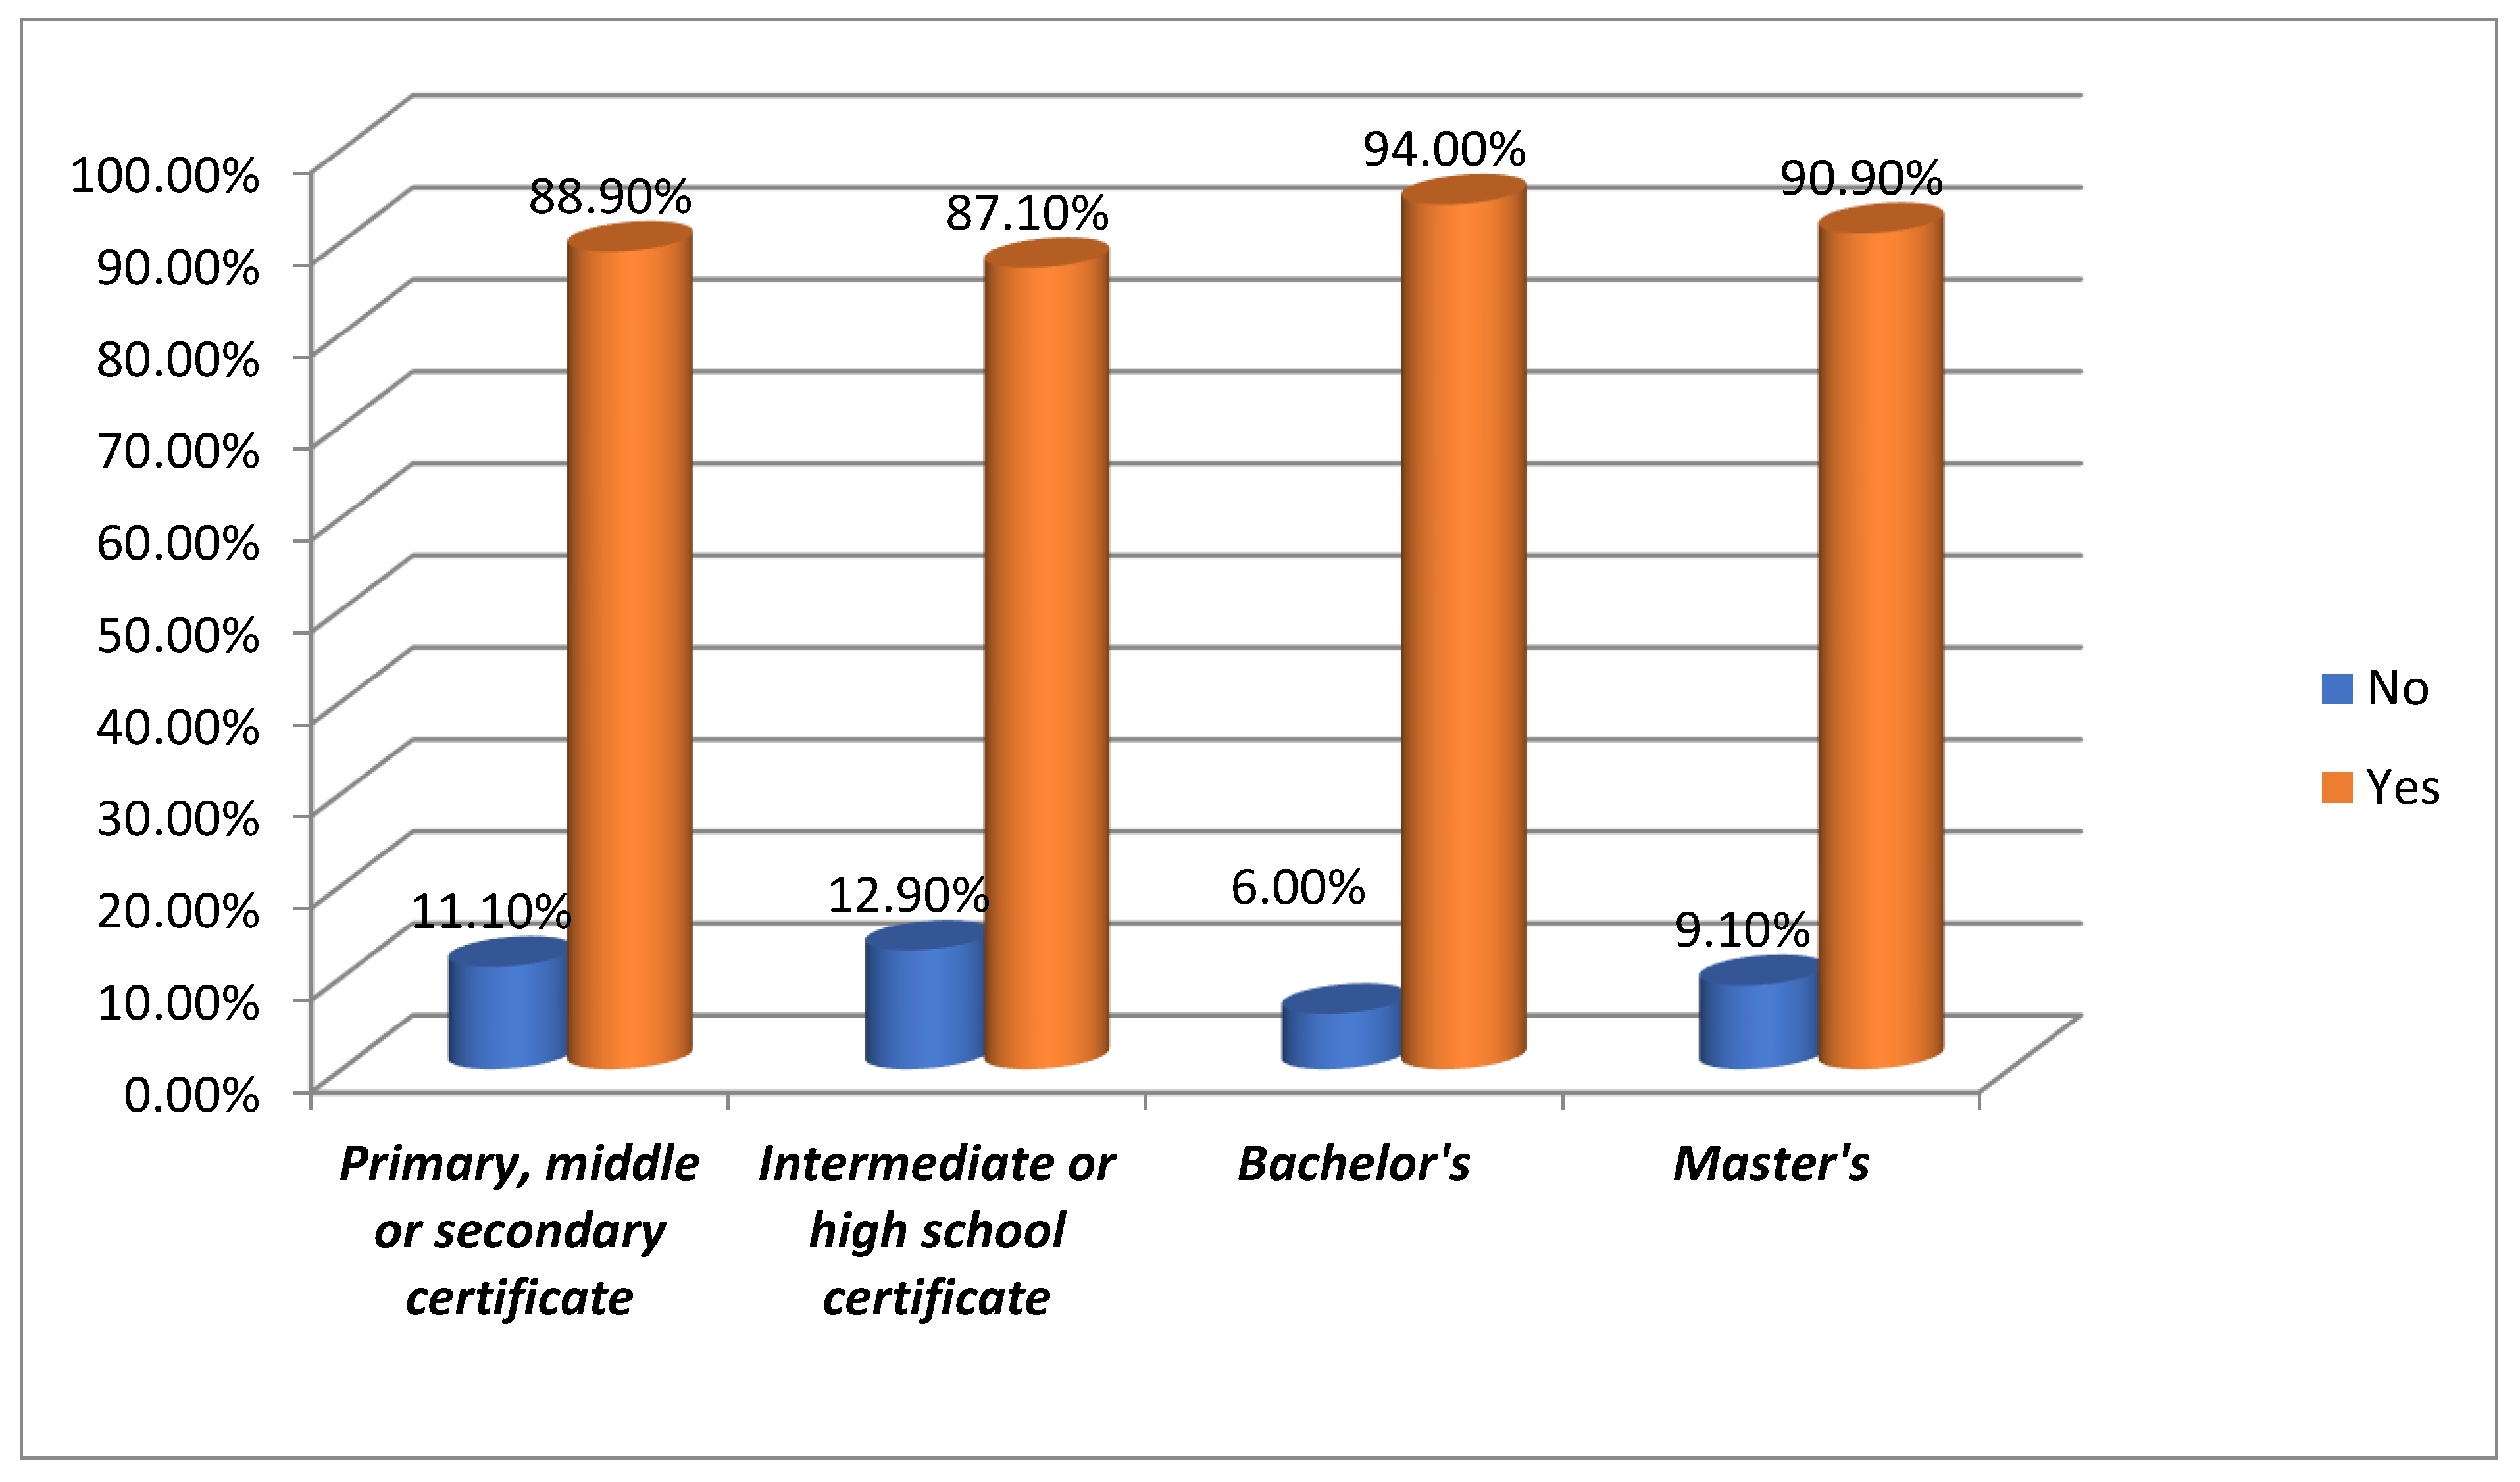
Mobile technology is highly preferred for accessing information across all education levels. Among those with primary, middle, or secondary certificates, 88.9% favor it. This trend continues with 87.1% of intermediate or high school graduates, 94% of Bachelor’s degree holders, and 90.9% of Master’s alumni. This showcases mobile devices as the top choice for information access in today’s digital age, irrespective of education level. [
Figure 14 and
Table 12 ]
3.4. Need for Assistance to Use QR Codes
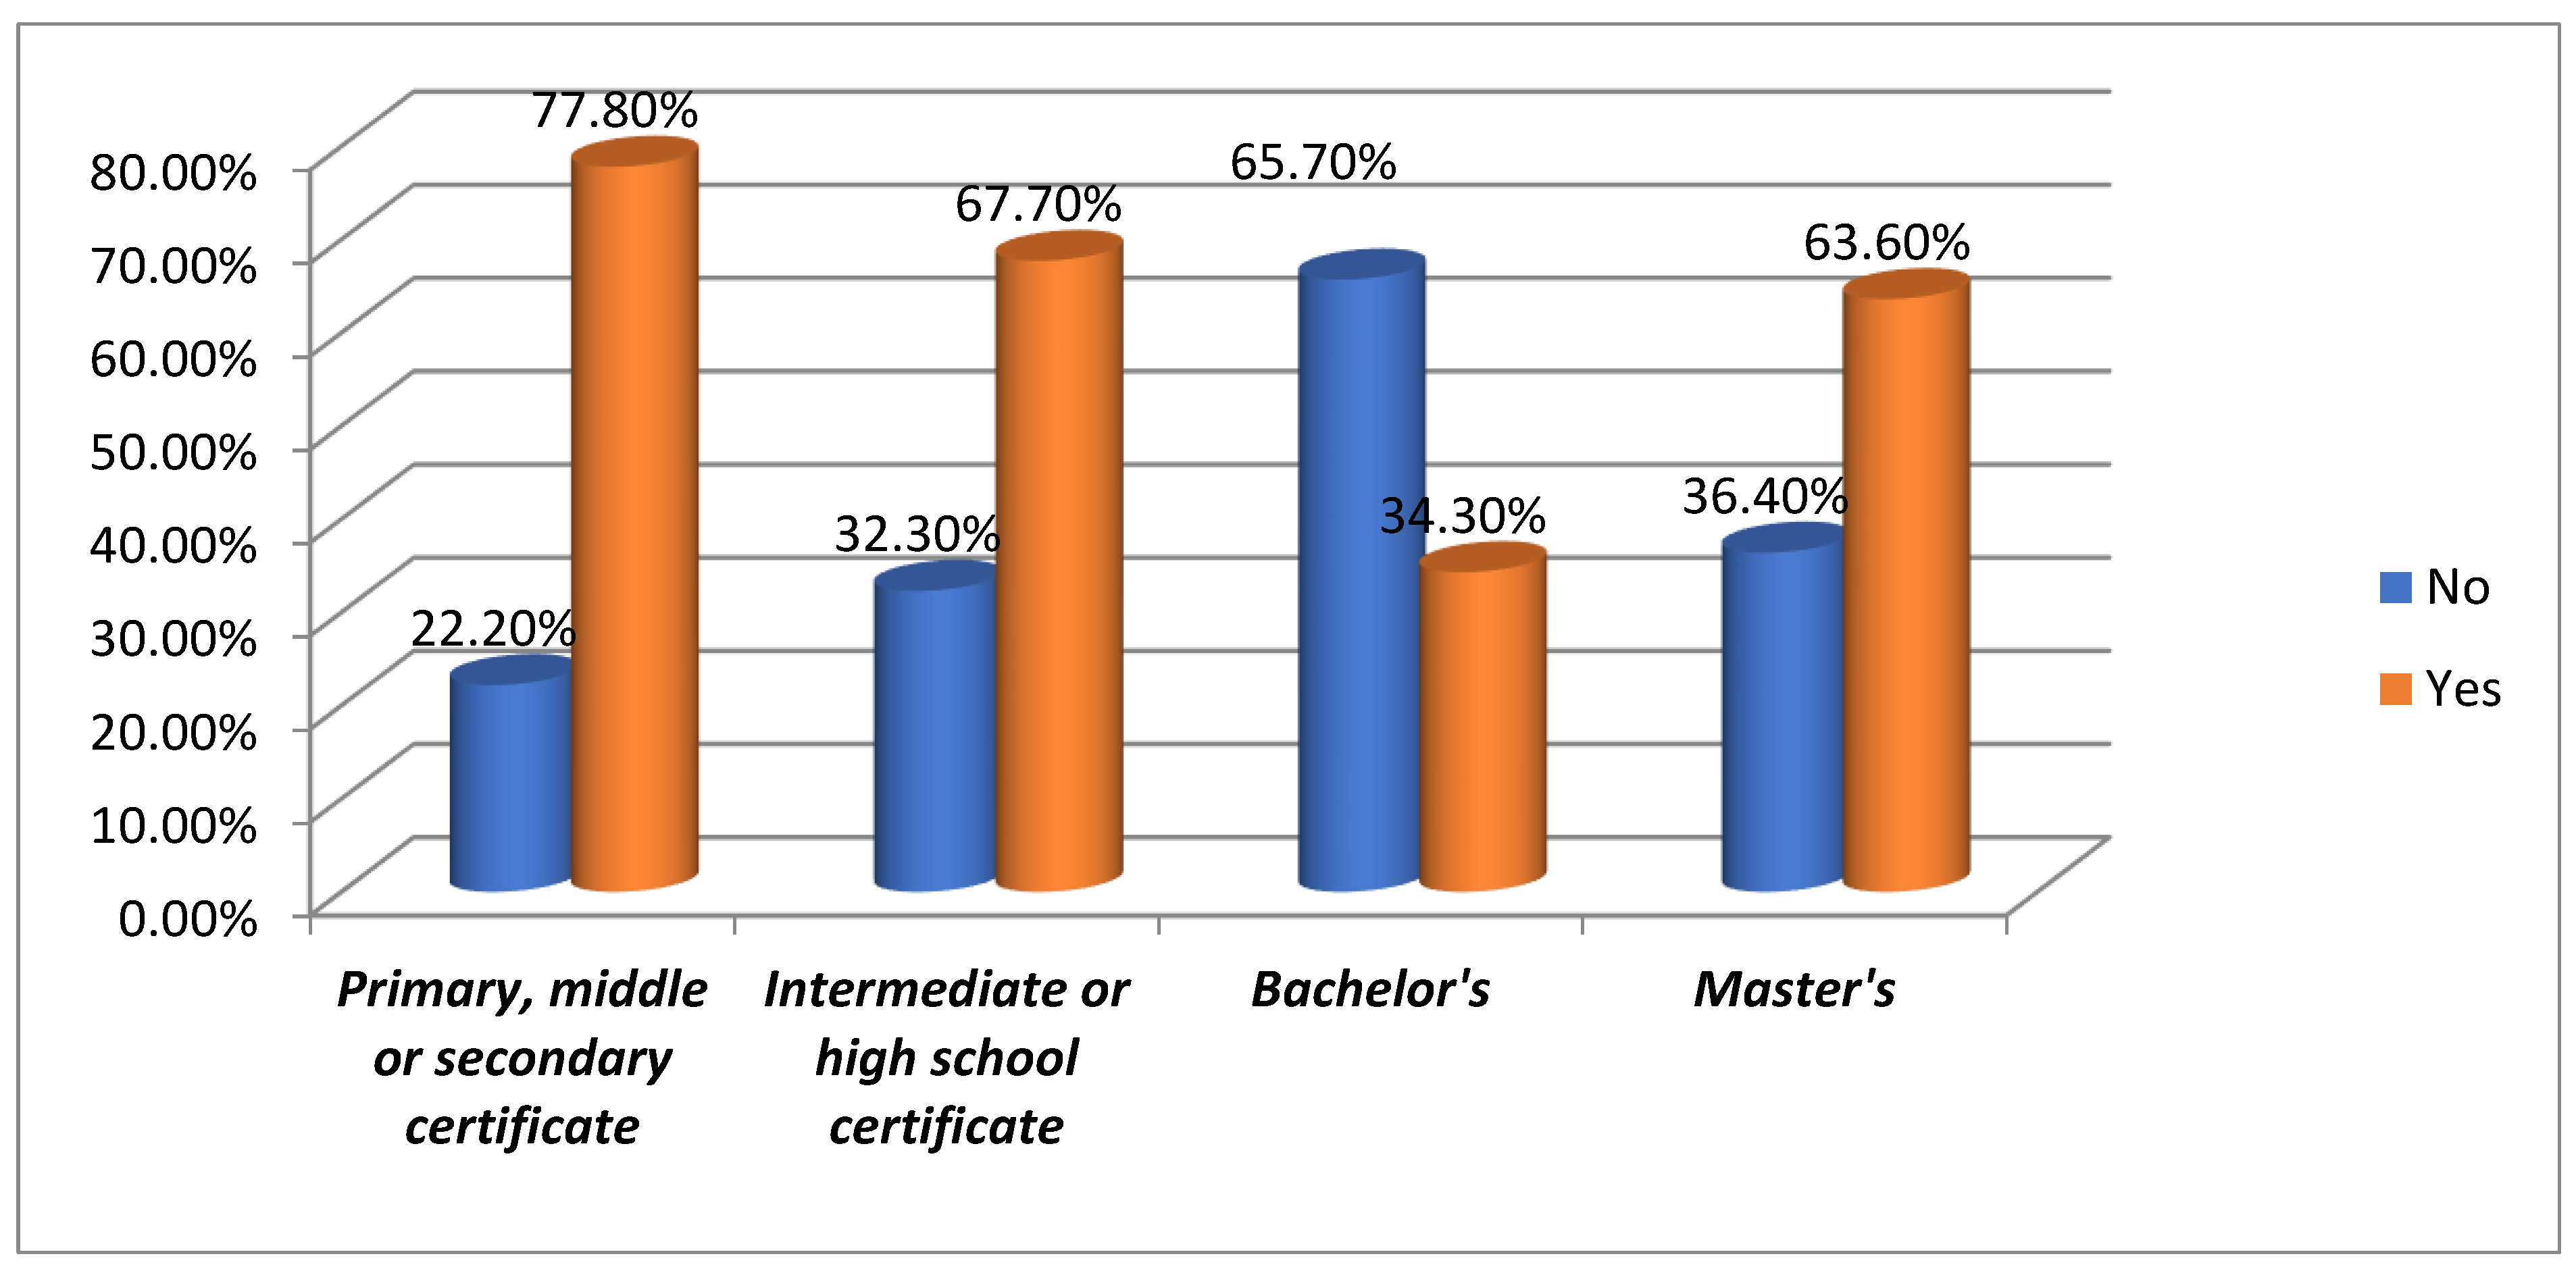
Most respondents reported not needing assistance with QR codes. In the primary, middle, and secondary certificate groups, 77.8% are comfortable using them. The intermediate or high school group is close behind at 67.7%. Among Bachelor’s degree holders, 65.7% can use QR codes independently, while 63.6% of Master’s degree holders show similar autonomy. Overall, 49.2% of participants can use QR codes without help, indicating they have become intuitive for many. [
Figure 15 and
Table 12].
(Responses: 'Yes' = assistance required, 'No' = no assistance required)".
3.5. Comparison to Leaflets
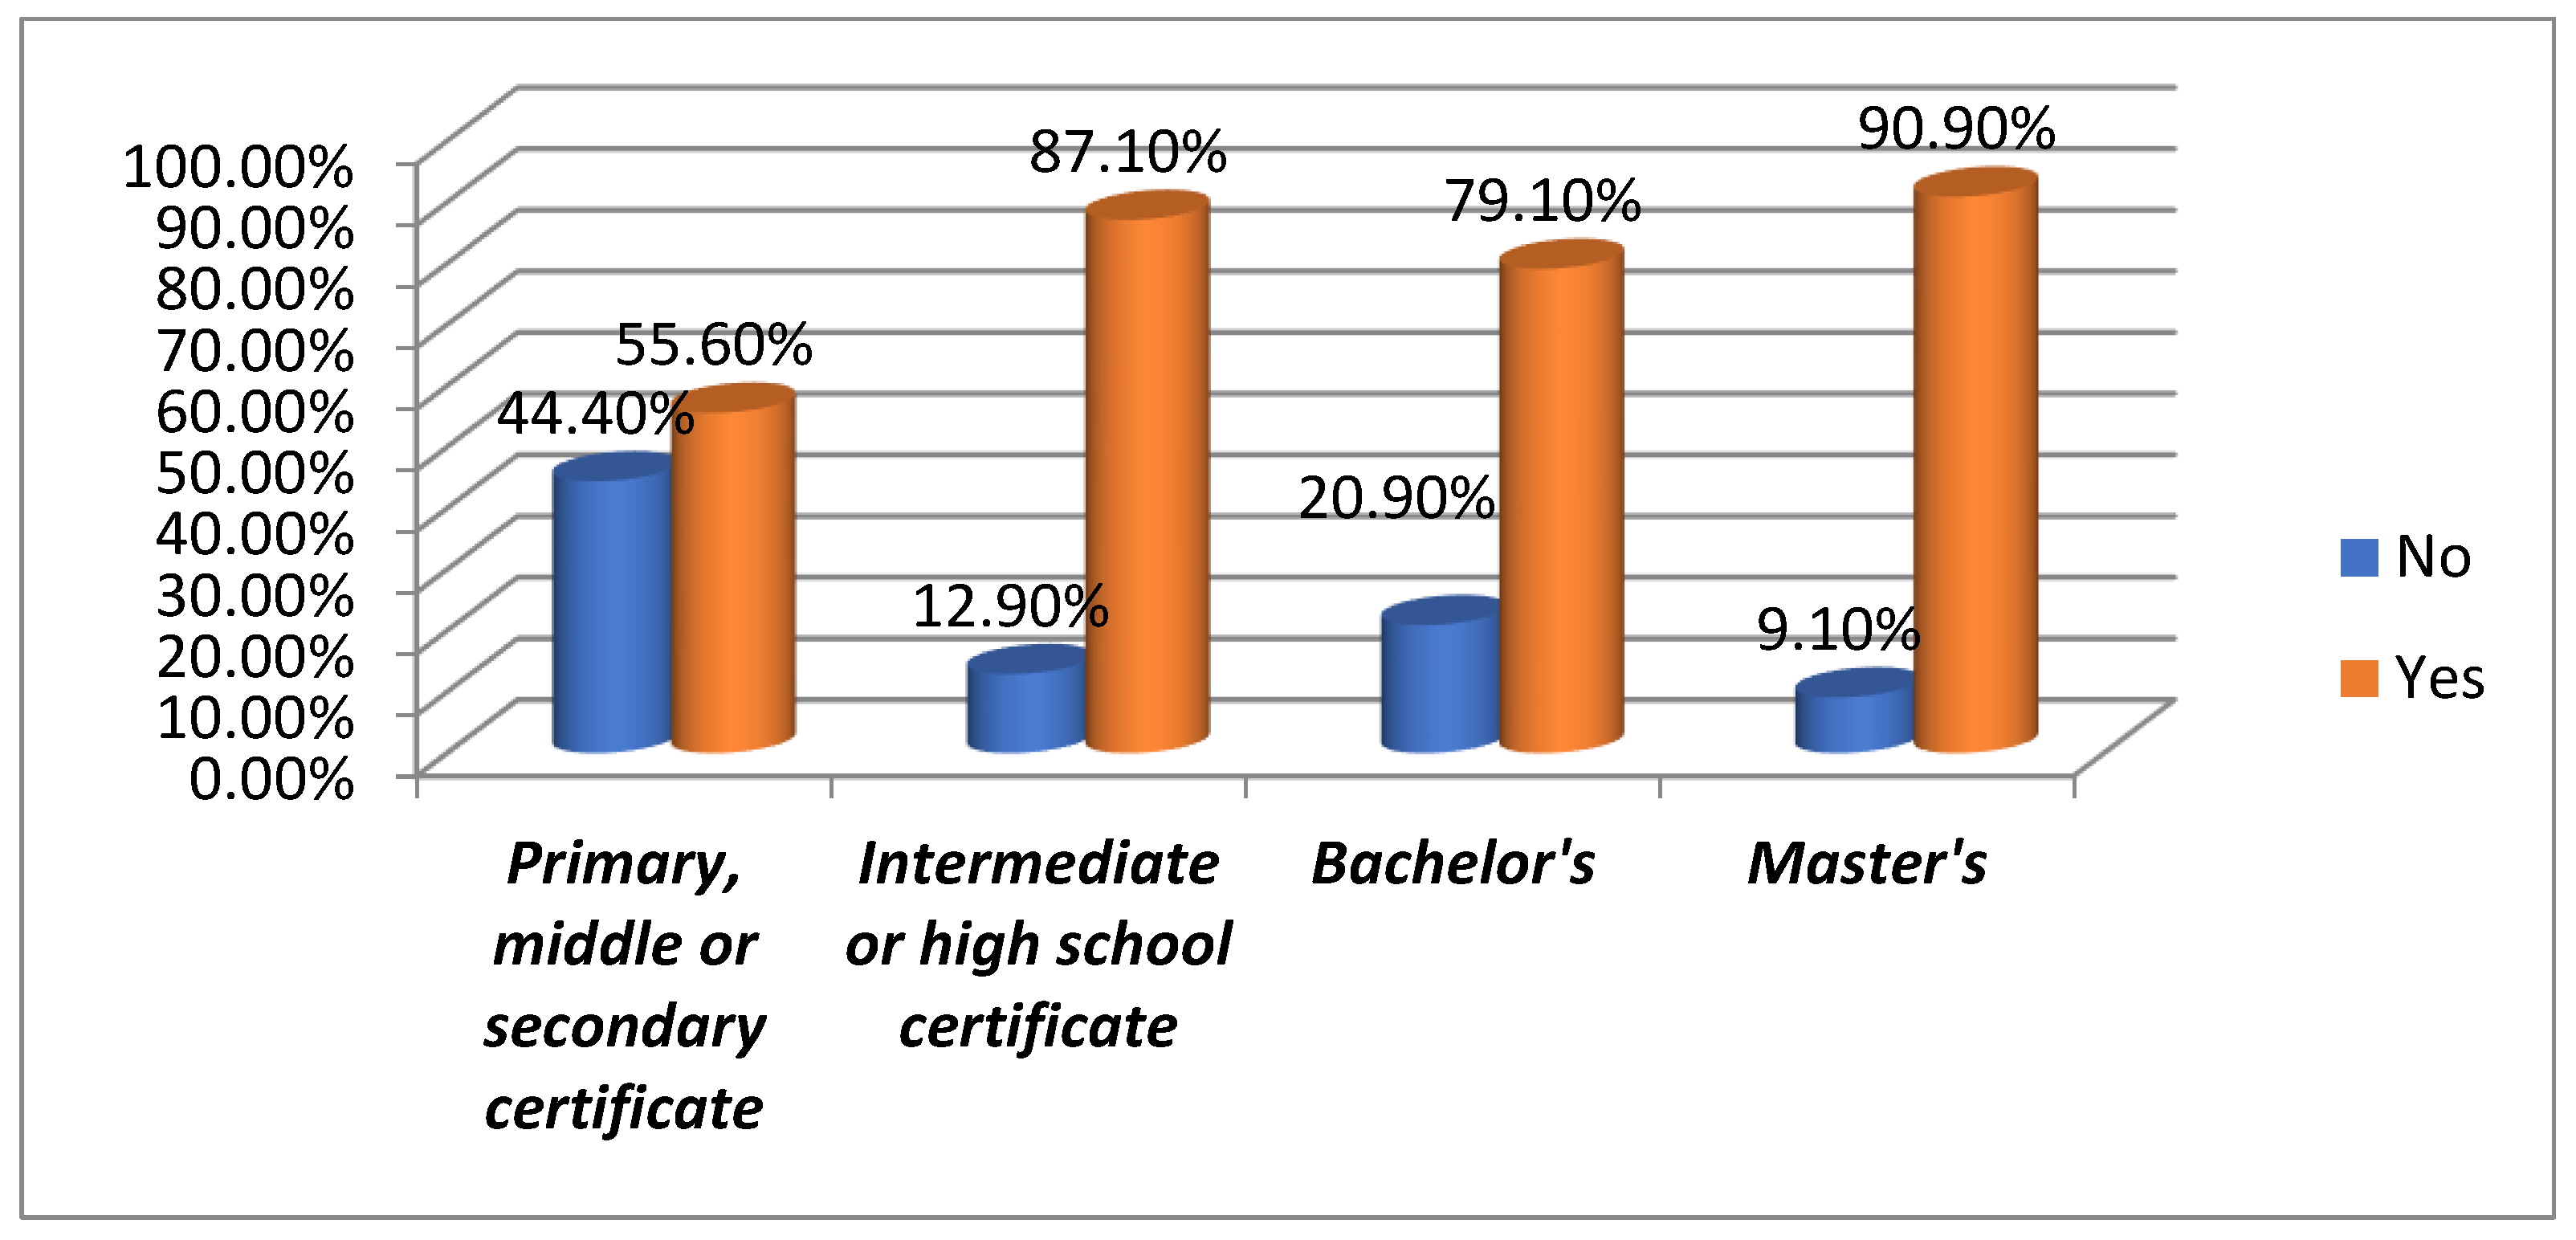
When comparing QR codes to traditional leaflets, a noticeable preference is observed for QR codes, especially among the intermediate or high school certificate group, where 87.1% prefer QR codes over leaflets. Bachelor’s degree holders also strongly preferred QR codes at 79.1%, and Master’s degree holders showed a higher preference at 90.9%. Even in the primary, middle, or secondary certificate group, 55.6% favor QR codes, although a smaller proportion (44.4%) still prefer leaflets. Overall, 80.5% of all participants prefer QR codes over leaflets, indicating that QR codes are increasingly more efficient, accessible, and convenient for accessing information than traditional printed materials. [
Figure 16 and
Table 12].
3.6. Preference for QR Codes Over Leaflets
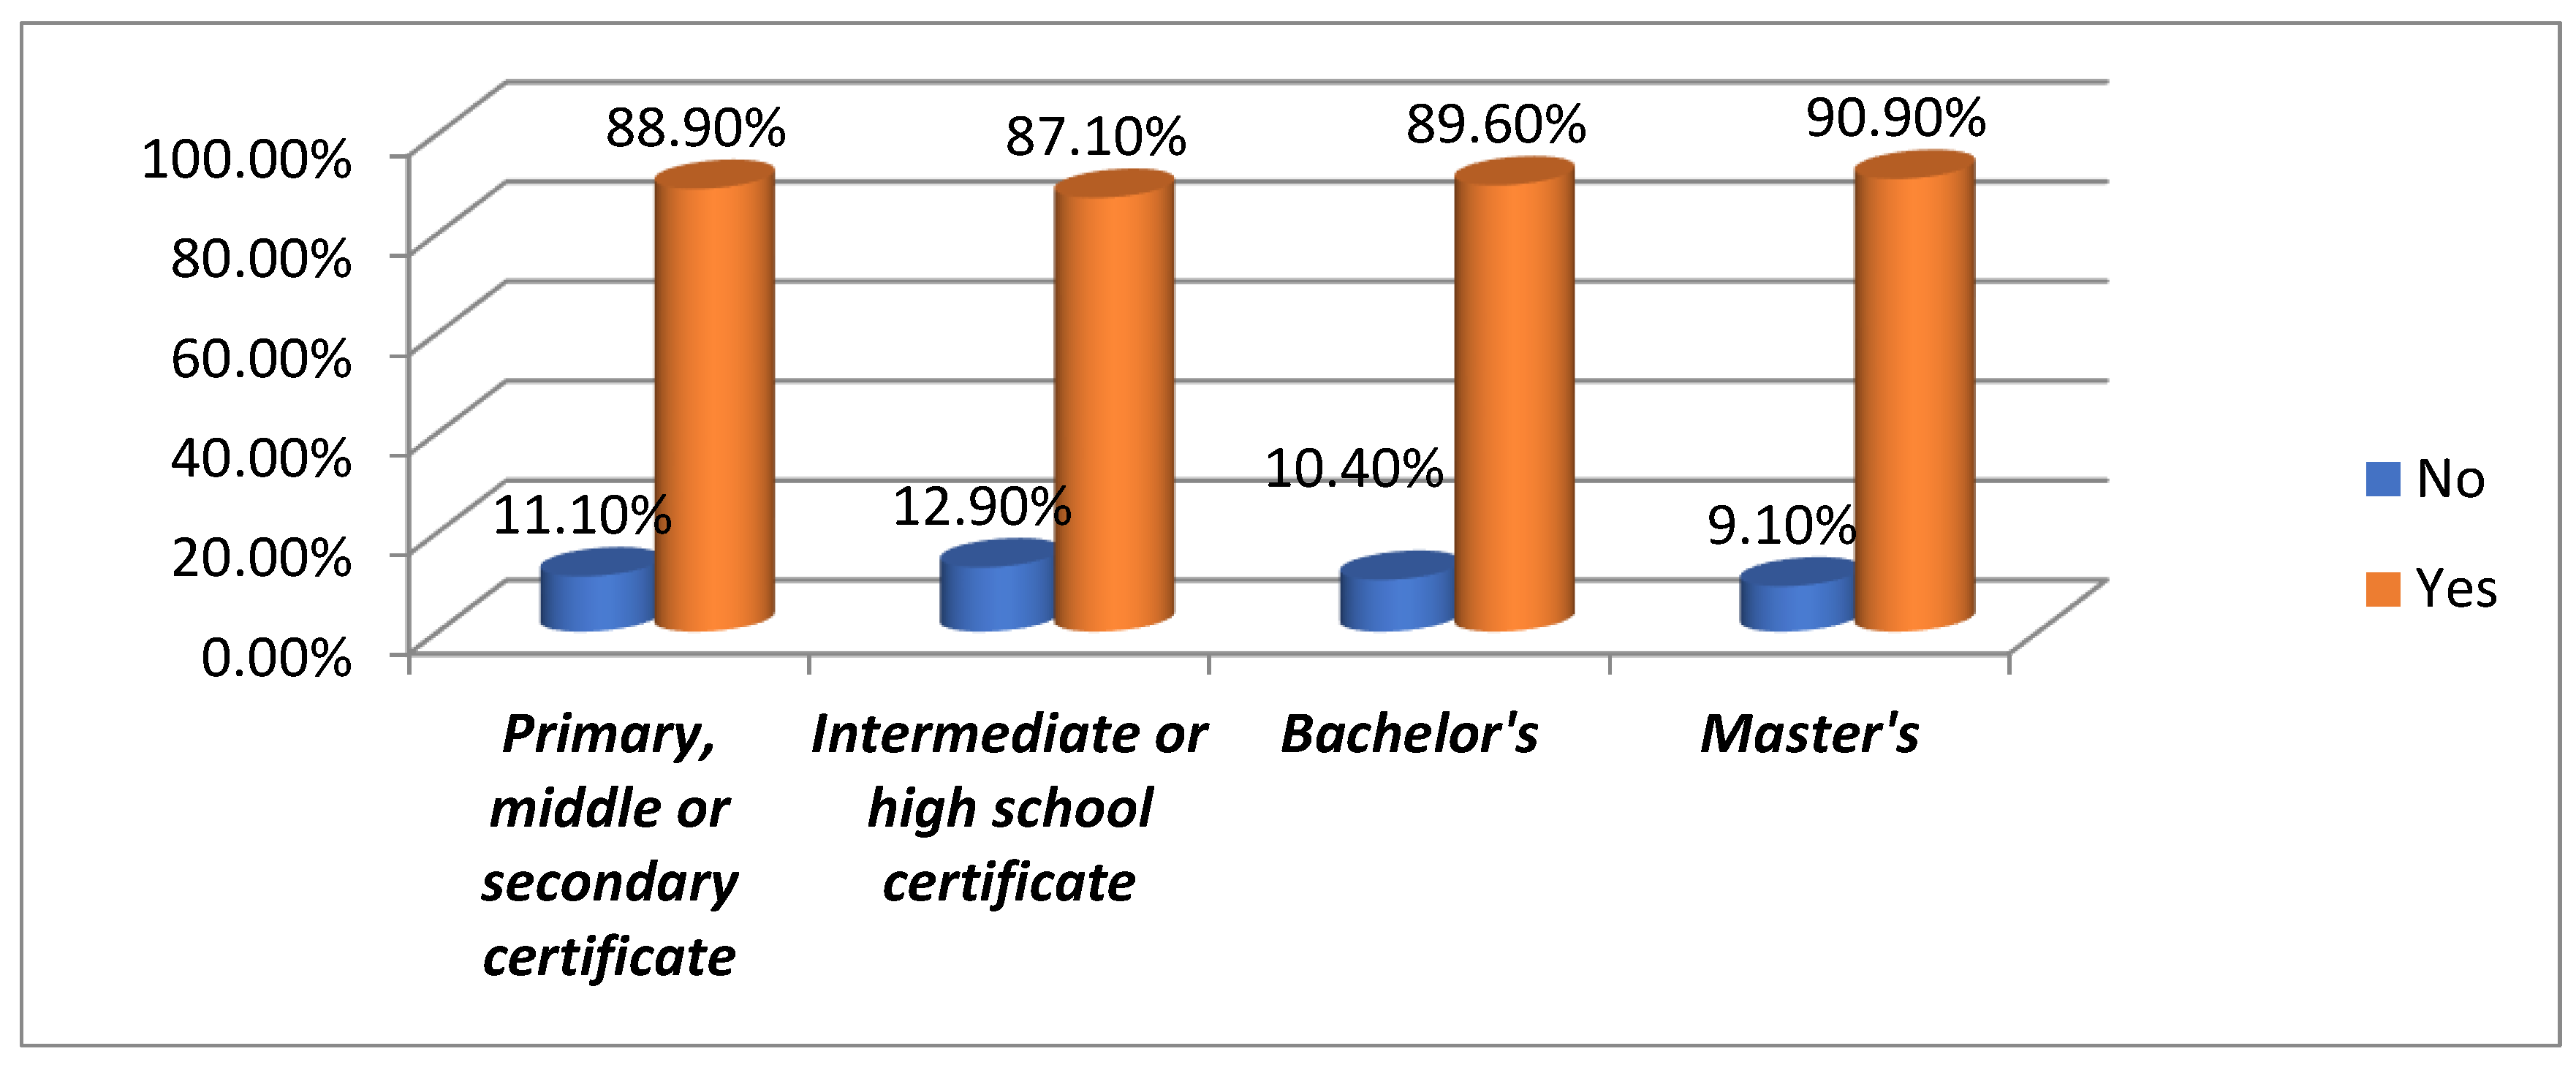
Most participants preferred QR codes over leaflets. In the primary, middle, or secondary certificate group, 88.9% favored QR codes despite some preference for leaflets. Similarly, 87.1% in the intermediate or high school group and 89.6% in the Bachelor’s group also chose QR codes, rising to 90.9% in the Master’s group. This trend highlights the shift to digital, as QR codes offer convenience and accessibility that leaflets often lack. [
Figure 17 and
Table 12].
3.7. Ease of Sharing Healthcare Information Using QR Codes
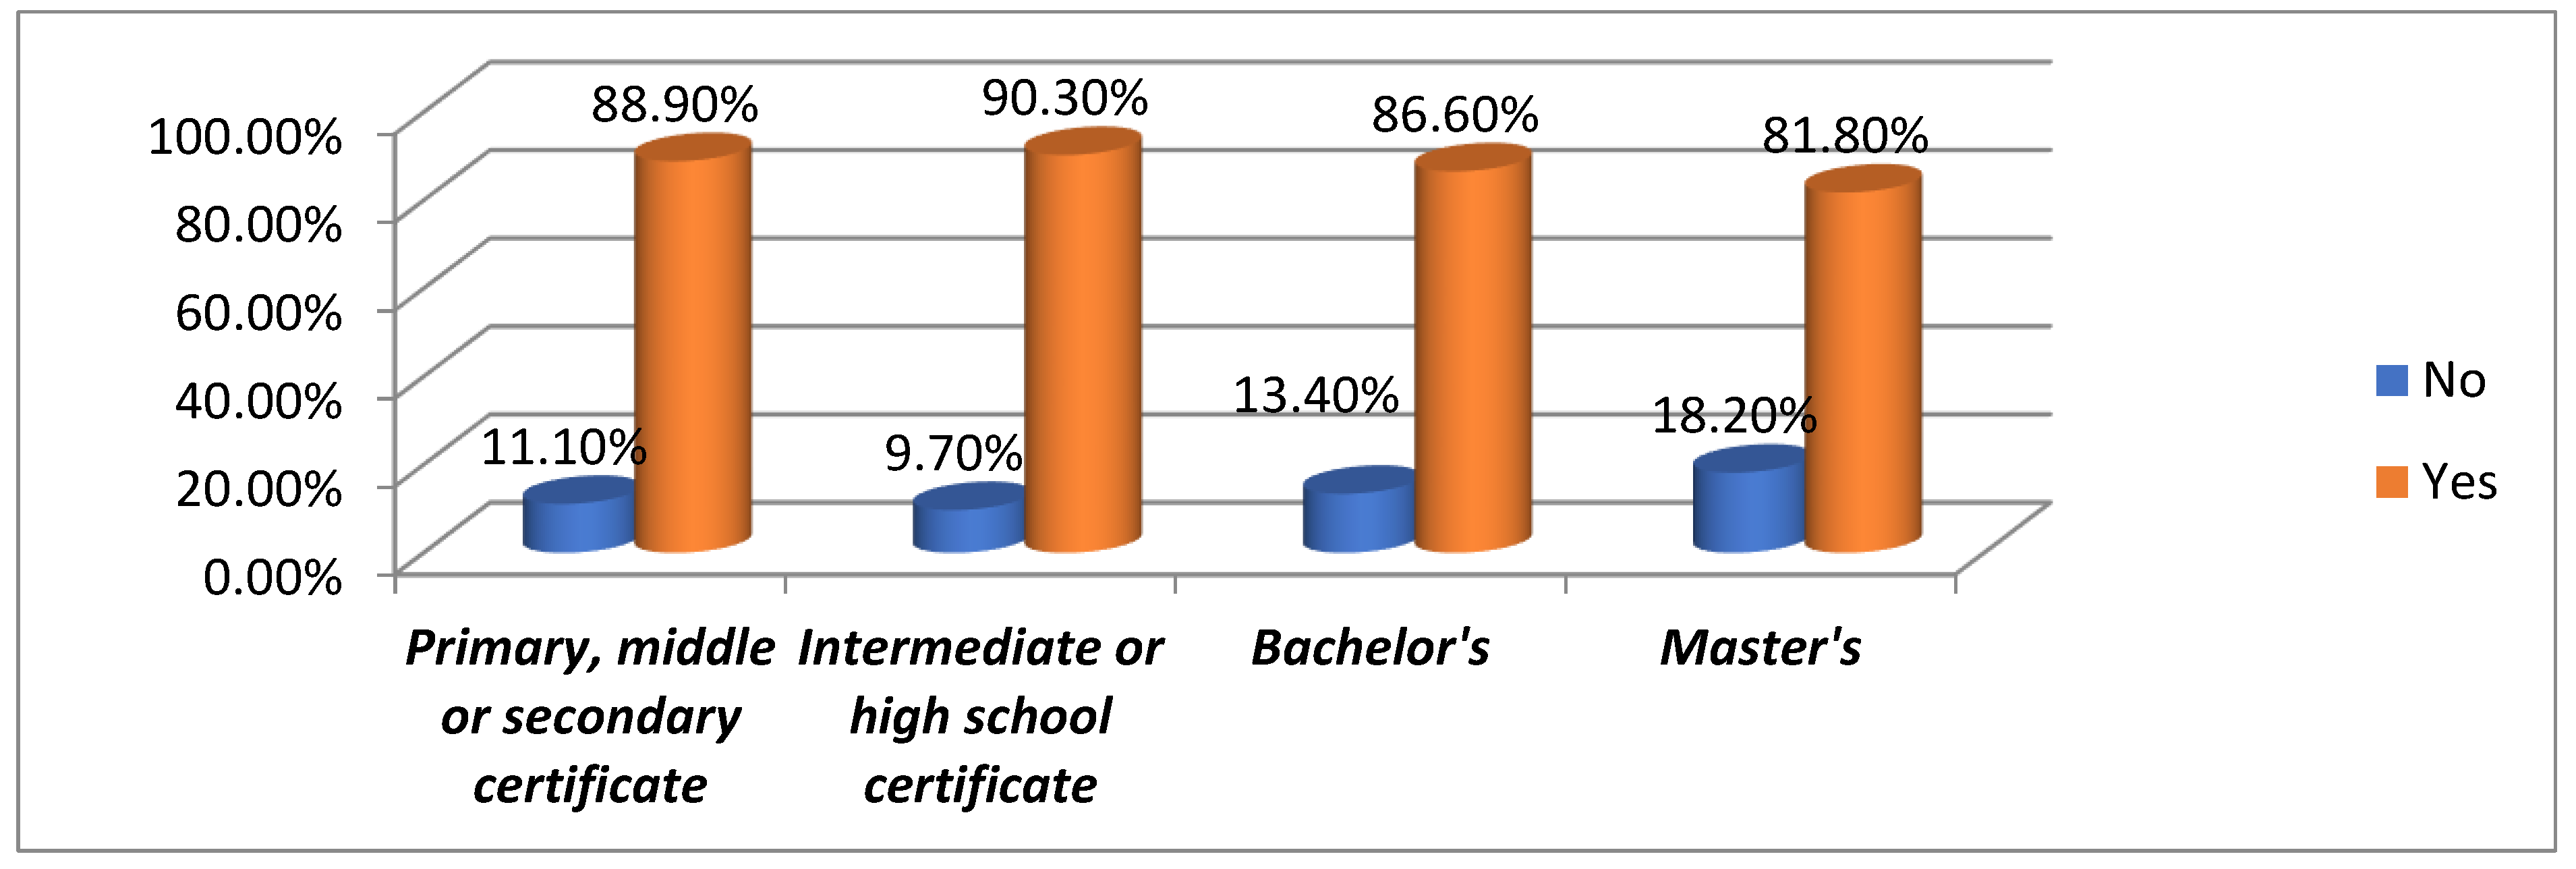
QR codes for sharing healthcare information are positively received across all education levels. Among primary and secondary certificate holders, 88.9% find it easy to use QR codes, similar to 90.3% in the intermediate and high school group. For Bachelor’s degree holders, 86.6% agree, and 81.8% of Master’s degree holders share this view. Overall, 87.3% of participants seek QR codes for easy healthcare information sharing, highlighting their role in efficient dissemination in healthcare contexts. [
Figure 18 and
Table 12].