

Submitted:
11 October 2025
Posted:
14 October 2025
You are already at the latest version
Abstract
Background: Circulating tumor DNA (ctDNA) analysis offers a non-invasive approach to molecular profiling. While RAS mutations are well-established predictive biomarkers in metastatic colorectal cancer (mCRC), the prognostic value of their variant allele fre-quency (VAF) remains unclear.
Methods: We retrospectively analyzed individual patient data with mCRC who un-derwent ctDNA testing using the FoundationOne® Liquid CDx assay. The primary objective was to determine the optimal RAS VAF cutoff for overall survival (OS) prog-nostication.
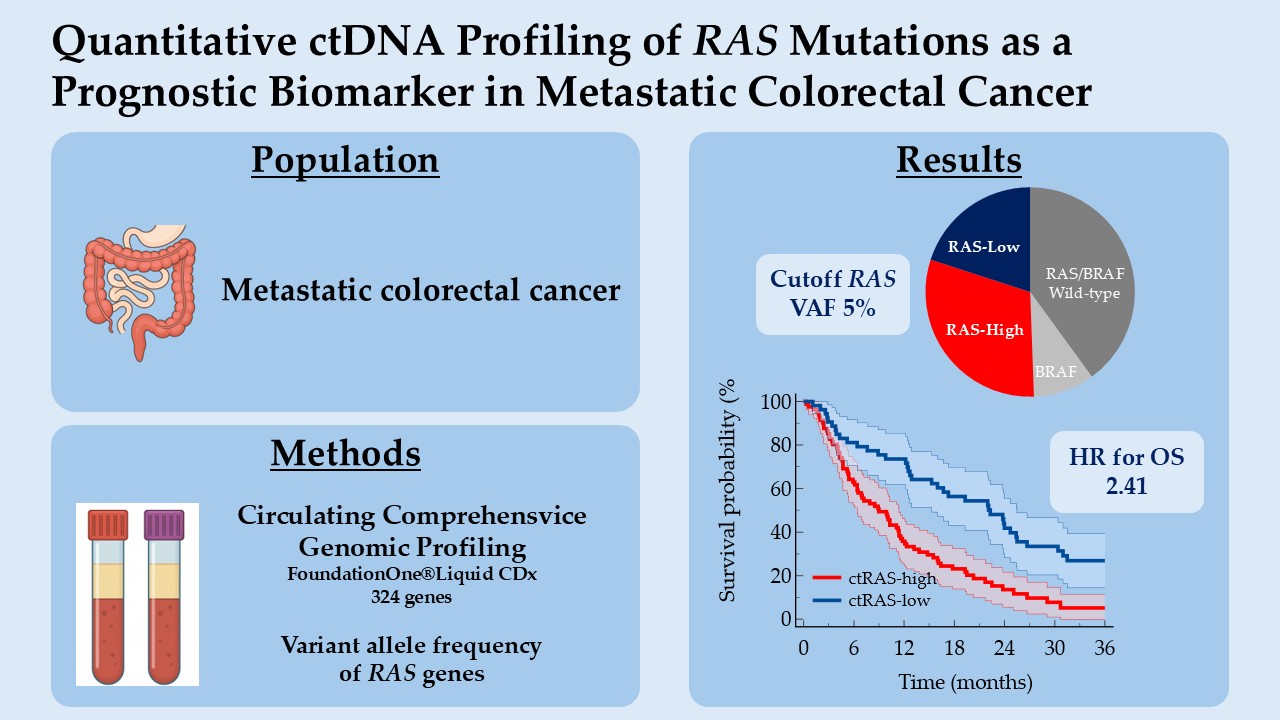
Results: Between November 2020 and July 2024, 282 patients were enrolled. Among 265 eligible patients, 134 (50.6%) were ctRAS mutant, 25 (9.4%) ctBRAF V600E mutant, and 106 (40.0%) were ctRAS/BRAF wild-type. A RAS VAF threshold of 5% yielded the highest prognostic discrimination for OS (HR = 2.41; 95% CI: 1.65–3.55; p < 0.0001; C-index = 0.601). ctRAS-high mutant tumors (VAF ≥ 5%) were associated with syn-chronous metastatic disease, multiple metastatic sites, higher blood tumor mutational burden, and elevated tumor fraction. ctRAS-low mutant tumors (VAF < 5%) were more frequently metachronous, presented with a single metastatic site, and liver involve-ment.
Conclusion: High RAS VAF in ctDNA is a strong and independent prognostic marker for OS in mCRC. Quantitative ctDNA profiling may enhance risk stratification and guide personalized management strategies.
Keywords:
colorectal cancer
; circulating tumor DNA
; variant allele frequency
; RAS mutation
; comprehensive genomic profiling
; liquid biopsy
; biomarkers
; prognosis
; precision medicine
; survival analysis
1. Introduction
Colorectal cancer (CRC) is the third most common cancer worldwide and the second leading cause of cancer death [1]. Advances in molecular profiling have significantly improved our understanding of CRC biology, with mutations in the RAS gene family—particularly V-Ki-ras2 Kirsten rat sarcoma viral oncogene homolog (KRAS) and neuroblastoma RAS viral oncogene homolog (NRAS)—emerging as key biomarkers for guiding therapeutic decisions in metastatic CRC (mCRC) [2,3]. These mutations are known to predict resistance to anti-epithelial growth factor receptor (EGFR) monoclonal antibodies such as cetuximab and panitumumab, and are routinely assessed in clinical practice [4,5,6,7].
Beyond their predictive role, the prognostic significance of RAS mutations—especially their variant allele frequency (VAF)—remains insufficiently characterized. Circulating tumor DNA (ctDNA) analysis via liquid biopsy has enabled non-invasive, real-time monitoring of tumor molecular dynamics, offering a more comprehensive view of tumor burden and clonal heterogeneity than traditional tissue biopsies [8,9]. VAF, defined as the proportion of sequencing reads harboring a specific mutation, may reflect tumor aggressiveness and heterogeneity.
In this study, we explore the prognostic value of circulating RAS VAF in patients with mCRC, focusing on its association with overall survival (OS). By integrating molecular quantification with clinical outcomes, we aim to determine whether RAS VAF can serve as a biomarker of prognostic relevance and contribute to improved risk stratification in mCRC.
2. Materials and Methods
2.1. Study Design and Patient Population
This retrospective study included adult patients diagnosed with mCRC, irrespective of treatment line, who underwent liquid biopsy for ctDNA testing as part of routine molecular profiling. All patients provided written informed consent prior to blood collection, in accordance with ethical standards and institutional guidelines. Patients were treated according to standard-of-care protocols. Clinical data were collected from electronic medical records (DxCare software, version 8.2021.2.8, Dedalus, France).
2.2. Circulating Comprehensive Genomic Profiling (CGP)
Blood sampling was centralized at Hôpital Franco-Britannique – Fondation Cognacq-Jay (Levallois-Perret, France) and was done using FoundationOne®Liquid CDx cfDNA blood collection tubes (8.5 mL nominal fill volume per tube, 2 tubes per patient). The FoundationOne®Liquid CDx assay was performed using cfDNA isolated from plasma derived from anti-coagulated peripheral whole blood [10]. Extracted cfDNA undergoes whole-genome shotgun library construction and hybridization-based capture of 324 cancer-related genes including coding exons and select introns of 309 genes, as well as only select intronic regions or non-coding regions of 15 genes. VAFs, representing the fraction of sequencing reads in which a variant is observed, were reported. The ctDNA fraction (TF), the blood tumor mutational burden (bTMB) and microsatellite instability (MSI) were also evaluated (Appendix A.1) [10,11].
2.3. Molecular Co-Alterations and Pathways
Selected genes were classified into seven prespecified molecular pathways: mitogen activated protein kinase (MAPK), phosphoinositide 3 kinase/protein kinase B/mammalian target of rapamycin (PIK3/AKT/mTOR), DNA damage repair (DDR) system, transforming growth factor beta (TGFb), Wingless-related integrated site (Wnt), cell cycle, and immune (Appendix A.2). Regarding genomic co-alterations, mutation status was dichotomized as mutated versus non-mutated, irrespective of the VAF level. When multiple co-alterations were present, the variant with the highest VAF was retained.
2.4. Statistical Analysis
To evaluate the prognostic impact of the VAF of RAS genes on survival, we performed a series of manual dichotomizations based on VAF amount. For each dichotomization, patients were stratified into low and high groups, and survival outcomes were compared using Kaplan-Meier estimates and the log-rank test. Harrell's C-index were also calculated [12]. The confidence interval (CI) of Harrell's C-index was calculated using the modified τ method [13]. The cut-off yielding the most significant separation between survival curves—defined by a clinically meaningful hazard ratio (HR), the lowest log-rank p-value and the highest C-index — was selected as the optimal threshold. This approach, although exploratory, allowed for transparent assessment of the variable’s discriminative capacity while maintaining interpretability within a clinical context.
Demographic, clinical, and genomic characteristics were obtained using descriptive statistics. Categorical variables were summarized in numbers and percentages, continuous variables were presented as means with standard deviation (SD) and medians with minima and maxima. OS was defined as the time interval between the date of liquid biopsy and the date of death from any cause. Alive patients were censored to the last date known to be alive. Kaplan-Meier method was used for survival, the reverse Kaplan-Meier method for follow-up, and Cox regression for multivariate analyses. A P value < 0.05 was considered statistically significant. All analyses were conducted using MedCalc® Statistical Software version 22.021 (MedCalc Software Ltd, Ostend, Belgium; https://www.medcalc.org; 2023).
3. Results
3.1. Patient Population
Between November 2020 and July 2024, liquid biopsy was performed in 282 patients with mCRC. Seventeen patients were excluded due to technical failure (n = 8), absence of reportable genomic alterations (n = 6), unavailable variant allele frequency (VAF) for RAS genes (n = 2), or consent withdrawal (n = 1). Among 265 eligible patients, 106 patients (40.0%) were ctRAS/BRAF wild-type, 134 (50.6%) harbored ctRAS mutations, and 25 (9.4%) carried the ctBRAF V600E mutation. (Figure 1)
3.2. Sampling and Blood Analysis
Liquid biopsies were performed in first-line setting in 149 (56.2%) patients and second- or subsequent line setting in 116 (43.8%) patients. The median turnaround time was 12.0 days (range 7.0 to 23.0).
3.3. Determination of VAF Threshold
The cut-off corresponding to VAF 5% yielded the most significant separation in overall survival (P<0.0001), with a HR for death in the high-expression group of 2.41 (95% CI, 1.63 to 3.55), indicating an unfavorable prognostic association. Moreover, this cut-off also yielded the highest concordance index (C-index 0.601, 95%CI 0.555-0.648). (Table 1, Figure 2)
Based on these findings, the 5% value of VAF for RAS genes was selected as the optimal cut-off for subsequent analyses. The mean VAFs were 1.5% (SD 1.4) and 25.9% (SD 18.8) in patients with ctRAS-low and ctRAS-high tumors, respectively.
3.4. Patient and Tumor Characteristics
Patient and tumor characteristics at the time of circulating CGP are summarized in Table 2. The overall mean age of patients was 64.4 years (SD 13.5), while ctRAS mutant patients had a mean age of 65.0 years (SD 12.7).
The ctRAS-low (VAF <5%) and ctRAS-high (VAF ≥5%) subgroups exhibited significant clinical and biological divergence. ctRAS-low tumors were more commonly associated with metachronous metastatic presentation (P = 0.046), a solitary metastatic site (P = 0.017), and predominant hepatic involvement (P = 0.001). Conversely, ctRAS-high tumors exhibited significantly elevated blood tumor mutational burden (bTMB; P < 0.0001) and increased TF (P < 0.0001). Metachronous dissemination was more frequently observed in ctRAS-low and ctRAS/BRAF wild-type profiles, whereas synchronous metastatic disease was significantly enriched in ctRAS-high and ctBRAF-mutant cases (P = 0.020).
Patients with ctRAS-mutant tumors exhibited distinct clinical and molecular characteristics across treatment lines, with high-grade histology, prior resection of the primary tumor, presence of multiple metastatic sites, pulmonary involvement, and elevated bTMB occurring more frequently in those receiving second-line or subsequent therapies compared to those treated in the first-line setting. (Table B1).
3.5. Prognostic Analysis of VAF
The median follow-up for overall survival (OS) was 35.3 months (95% CI, 32.1–58.6). Stratification using a RAS VAF threshold of 5% revealed a significantly increased risk of death, with a HR of 2.41 (95% CI, 1.63–3.55; P < 0.0001) (Table 1, Figure 3). No statistically significant difference in OS was observed between the ctRAS/BRAF wild-type and ctRAS-low subgroups (HR = 1.40; 95% CI, 0.98–2.00). Moreover, patients with ctRAS-high mutant tumors exhibited survival outcomes comparable to those with ctBRAF V600E mutations (HR = 0.98; 95% CI, 0.51–1.91).
The poor prognostic impact of RAS-high on OS was observed in all pre-specified subgroups, confirming consistent prognostic impact of VAF RAS in mCRC. (Table A2, Figure 4)
The strongest prognostic value of VAF RAS was observed in patients with metachronous metastatic disease (HR 8.87, 95%CI 3.64 to 21.6), lung involvement (HR 4.56, 95%CI 2.38 to 8.75) and high-grade tumors (HR 4.41, 95%CI 1.01 to 19.25). Of note, there was no statistically significant association between VAF RAS and OS in a small subset of patients with either NRAS (N=9) or exon 3 (N=12) tumors.
In first-line setting, median OS were 31.5 months (95%CI 12.5 to 31.5) and 11.6 months (95%CI 6.4 to 19.3) in ctRAS-low and ctRAS-high, respectively (HR 2.89, 95%CI 1.57 to 5.33; P=0.0006). In later lines, median OS were 16.7 months (95%CI 9.8 to 31.0) and 7.2 months (95%CI 4.7 to 23.8) in ctRAS-low and ctRAS-high, respectively (HR 2.68, 95%CI 1.57 to 4.58; P=0.0003) (Table B1).
Multivariate analysis was conducted incorporating variables that demonstrated statistical significance in univariate assessments (Table B2). Independent adverse prognostic factors for OS included elevated (≥10%) tumor fraction (HR 2.58, 95% CI 1.69–3.95; P<0.0001), administration of second- or later treatment line (HR 2.46, 95% CI 1.61–3.75; P<0.0001), and increased (≥10) bTMB (HR 1.71, 95% CI 1.09–2.70; P=0.021).
3.6. Molecular Characteristics and Co-Occuring Alterations
ctRAS-high mutant tumors were associated with higher bTMB (P<0.0001) and higher TF (P<0.0001) than ctRAS-low mutant tumors. There was no difference between the 2 subgroups in terms of location or type of mutation. Both ctAPC and ctTP53 mutant high (VAF ≥5%) tumors were significantly more frequent in patients with ctRAS-high than ctRAS-low tumors. Significant differences were observed in terms of molecular co-alterations between the 2 groups (P=0.006), TGFb and Wnt/b-catenin pathways being more frequently altered in patients with ctRAS-high than ctRAS-low tumors. (Table 3)
4. Discussion
This study demonstrates that the VAF of RAS mutations detected via ctDNA is a robust prognostic biomarker for OS in patients with mCRC. Stratifying patients based on the value of 5% VAF for RAS genes provided the most significant prognostic discrimination for OS. This threshold yielded a clear separation between survival curves, with a HR for death of 2.41 indicative of a clinically meaningful increase in mortality risk among patients with higher VAF value (≥5%).
Although the cut-off was selected through exploratory testing rather than a statistically corrected optimization procedure, the approach remains valid within a clinical research framework, particularly when supported by biological plausibility and reproducibility across subgroups. The prognostic significance of RAS VAF was particularly consistent across treatment settings, with ctRAS-high status associated with significantly reduced OS both in first-line (HR 2.89) and later-line therapies (HR 2.68), indicating that its adverse prognostic effect is preserved irrespective of treatment line. Furthermore, in the context of metachronous metastatic disease, a high RAS VAF was associated with particularly poor prognosis, reflected by a markedly elevated HR for death of 8.87. These findings underscore the clinical relevance of quantitative ctDNA metrics beyond mere RAS mutation status.
Our results suggest that higher RAS VAF reflects a more aggressive tumor biology, characterized by synchronous presentation, multiple metastatic sites, and elevated tumor burden—as evidenced by higher bTMB and TF. Additionally, ctRAS-high mutant tumors were associated with molecular co-alterations from TGFb or Wnt/b-catenin pathways. Conversely, ctRAS-low tumors were more frequently metachronous, limited to a single metastatic site, and predominantly involved the liver, suggesting a less disseminated disease phenotype.
The use of liquid biopsy offers several advantages, including non-invasive sampling, real-time monitoring, and the ability to capture tumor heterogeneity [14,15,16]. Importantly, our sensitivity analyses confirmed the prognostic value of high RAS VAF across all clinical subgroups, reinforcing its potential utility in routine risk stratification. These findings may inform clinical decision-making, particularly in considering early therapeutic escalation for patients with high ctRAS VAF.
In previous studies, it has been shown that ctDNA metrics provide deeper insights into tumor biology, reflecting disease aggressiveness and burden [17]. Moreover, ctDNA metrics are prognostic for survival.
In the RASANC study, circulating tumor DNA (ctDNA) mutant allele frequency—defined as the highest observed frequency among mutated genes—demonstrated significant prognostic relevance [18]. At the optimal cut-off of 20%, the HR for death was 2.58 (95%CI 2.02 to 3.28). In a translational analysis of the Valentino study, the maximum VAF detected among mutated genes was taken as an estimate of the ctDNA amount in patients with RAS wild-type mCRC [19]. Patients with high VAF (superior to the median of 12.6%) presented with liver metastases and synchronous presentation, and had poorer survival compared to those with low VAF (HR: 1.82, 95%CI 1.20 to 2.76).
Limitations of this study include its retrospective design, treatment heterogeneity, and the absence of longitudinal ctDNA testing. We acknowledge the limitations inherent to retrospective designs. To mitigate selection bias, we included all consecutive patients with mCRC who underwent ctDNA testing at our center during the study period. Exclusion criteria were strictly technical or ethical (e.g., consent withdrawal), and no patients were excluded based on clinical outcomes or treatment response. While treatment heterogeneity exists, our primary endpoint—OS—was chosen to minimize confounding from specific therapeutic regimens. Sensitivity analyses across subgroups confirmed the prognostic impact of RAS VAF regardless of treatment line. Additionally, while the FoundationOne® Liquid CDx assay offers standardized quantification, inter-platform variability in VAF measurement warrants further validation across different technologies.
These findings suggest that circulating RAS VAF may serve as a useful stratification tool in future trials and could inform risk-adapted treatment strategies. Further validation in independent cohorts and prospective studies is warranted to confirm its prognostic utility and generalizability.
5. Conclusions
In conclusion, our study highlights the prognostic significance of RAS VAF in ctDNA, with a ≥5% threshold identifying patients at higher risk of poor survival. Integrating quantitative ctDNA metrics into clinical practice may enhance personalized management strategies in mCRC.
Author Contributions
Conceptualization, B.C.; methodology, B.C.; formal analysis, B.C.; investigation, B.C., E.C., H.M., P.G., A.S., O.O., H.M., H.R., I.I., H.G., A.T. and A.G.; writing—original draft preparation, B.C.; writing—review and editing, EC, HM, P.J. and J.B.; supervision, B.C.; All authors have read and agreed to the published version of the manuscript.
Funding
This research received no external funding.
Institutional Review Board Statement
Ethical review and approval were waived for this study. Indeed, this study is part of a scientific research project based exclusively on the analysis of health data collected during routine care, extracted from the electronic medical records of patients diagnosed with cancer. No additional interventions were performed on the patients as part of this study. In accordance with applicable French regulations, this research qualifies as a Non-Interventional Study Involving Human Subjects (RNIPH). Data processing was carried out in compliance with the principle of data minimization, retaining only the information strictly necessary for the scientific objectives pursued.
Informed Consent Statement
Informed consent was obtained prior to sample collection from all subjects involved in the study.
Data Availability Statement
The data supporting the findings of this study are available on request from the corresponding author, MD. The data are not publicly available due to their containing information that could compromise the privacy of research participants.
Acknowledgments
The authors would like to thank the patients and their families.
Conflicts of Interest
The authors declare no conflicts of interest.
Abbreviations
The following abbreviations are used in this manuscript:
| CRC | Colorectal cancer |
| KRAS | V-Ki-ras2 Kirsten rat sarcoma viral oncogene homolog |
| NRAS | neuroblastoma RAS viral oncogene homolog |
| mCRC | Metastatic colorectal cancer |
| EGFR | Epithelial Growth Factor Receptor |
| VAF | Variant allele frequency |
| cfDNA | Circulating free DNA |
| ctDNA | Circulating tumor DNA |
| bTMB | Blood tumor mutational burden |
| TF | Tumor fraction |
| MSI | Microsatellite instability |
| CI | Confidence interval |
| HR | Hazard ratio |
| SD | Standard deviation |
| CGP | Comprehensive genomic profiling |
| APC | Adenomatous polyposis coli |
| TP53 | Tumor protein 53 |
| MAPK | Mitogen activated protein kinase |
| PIK3 | Phosphoinositide 3 kinase |
| AKT | Protein kinase B |
| mTOR | Mammalian target of rapamycin |
| DDR | DNA damage repair |
| TGFb | Transforming growth factor beta |
| Wnt | Wingless-related integrated site |
Appendix A
Appendix A.1. Description of Genomic Signatures Determination
ctDNA fraction (TF)
TF is a determination of the amount of ctDNA as a fraction of total cfDNA in a blood sample. ctDNA TF was quantified by combining multiple methods. For samples with significant aneuploidy, the purity assessment from a robust copy-number model that accounts for both the observed coverage variation and allele frequencies of genome-wide SNP allele frequencies is used to determine the TF estimate. When significant aneuploidy is not present, the allele frequencies of short variants and rearrangements deemed very likely to be somatic are used to estimate TF. In addition, an assessment of cfDNA fragment sizes was used to exclude clonal hematopoiesis (CH)-derived aneuploidy from copy-number modeling.
Blood Tumor Mutational Burden (bTMB)
bTMB is measured by counting all synonymous and non-synonymous variants present at 0.5% allele frequency or greater and filtering out potential germline variants according to published databases of known germline polymorphisms including dbSNP and ExAC. Additional germline alterations are assessed for potential germ line status and filtered out using a somatic-germline/zygosity algorithm. Furthermore, known and likely driver mutations are filtered out to exclude bias of the data set. The resulting mutation number is then divided by the coding region corresponding to the number of total variants counted, or approximately 750 kilobases (kb). The resulting number is reported in units of mutations per megabase (mut/Mb).
Microsatellite instability (MSI) signature
To determine MSI status, approximately 2000 repetitive loci (minimum of 5 repeat units of mono-, di-, and trinucleotides) were assessed to determine what repeat lengths are present in the sample. A locus containing a repeat length present in an internal database generated using >3000 clinical samples was considered to be ’unstable’. An MSI indicator is generated by calculating the fraction of unstable loci, considering only those loci that achieve adequate coverage for consideration for the sample. Samples with >0.5% unstable loci were considered to be MSI-High.
Appendix A.2. List of genes or genomic signatures of seven prespecified genomic pathways
| Pathways | Genes |
| MAPK | ARAF, RAF1, ERBB1 (EGFR), ERBB2 (HER2), ERBB3 (HER3), ERBB4, FLT3, FGFR1-4, HRAS, HGF, MAP2K1 (MEK1), MAP2K2 (MEK2), MAP2K4, MAP3K1, MAP3K13, MAPK1, MET, MST1R, NF1 |
| PIK3/AKT/mTOR | AKT1-3, ARID1A, CCND2, CTNNB1, FBXW7, FLCN, MTOR, PIK3CA, PRKAR1A, PTEN, RPTOR, STK11, TSC2 |
| DDR | ATM, BAP1, BARD1, BRCA1-2, BRIP1, CHEK2, FANCA, FANC, FANCG, FANCL, INPP4B, MRE11A, MUTYH, NBN, PALB2, RAD51, RAD51B, RAD51C, RAD51D, SETD2, STAG2 |
| TGFb | KDM5C, SMAD2, SMAD4, TGFBR2 |
| Wnt | FAM123B, CDC73, CDK8, CTNNB1, MYC, RNF43 |
| Cell cycle | CCND3, CCNE1, CDK4, CDK6, CDKN1B, CDKN2AB, GATA3, KDM5A, MEN1, PARK2, PPPR1A, QKI, RB1, SMARCA4, SMARCB1 |
| Immune | ctMSI, bTMB-high (≥20), CD274 (PD-L1), MLH1, MSH2, MSH3, MSH6, PMS2, POLD1, POLE |
Appendix B

Table B1.
Clinical and molecular characteristics in ctRAS mutant group according to treatment setting
Table B1.
Clinical and molecular characteristics in ctRAS mutant group according to treatment setting
| Covariate | All patients | First-line | Second- and later lines | P-value |
|---|---|---|---|---|
| No of patients | 134 | 63 | 71 | |
| Age, years | 0.209 | |||
| <70 | 82 (61.2) | 35 (55.6) | 47 (66.2) | |
| ≥70 | 52 (38.8) | 28 (44.4) | 24 (33.8) | |
| Sex | 0.219 | |||
| Female | 65 (48.5) | 27 (42.9) | 38 (53.5) | |
| Male | 69 (51.5) | 36 (57.1) | 33 (46.5) | |
| Tumor sidedness | 0.371 | |||
| Right-sided | 37 (27.6) | 21 (33.3) | 16 (22.5) | |
| Left-sided | 95 (70.9) | 41 (65.1) | 54 (76.1) | |
| Both | 2 (1.5) | 1 (1.6) | 1 (1.4) | |
| Grading | 0.030 | |||
| Low | 110 (82.1) | 55 (87.3) | 55 (77.5) | |
| High | 11 (8.2) | 1 (1.6) | 10 (14.1) | |
| Missing | 13 (9.7) | 7 (11.1) | 6 (8.5) | |
| Initial stage | 0.942 | |||
| Non metastatic | 94 (70.1) | 44 (69.8) | 50 (70.4) | |
| Metastatic | 40 (29.9) | 19 (30.2) | 21 (29.6) | |
| Primary resection | <0.0001 | |||
| No | 34 (25.4) | 27 (42.9) | 7 (9.9) | |
| Yes | 100 (74.6) | 36 (57.1) | 64 (90.1) | |
| No of met. Sites | 0.031 | |||
| 0-1 | 74 (55.2) | 41 (65.1) | 33 (46.5) | |
| >1 | 60 (44.8) | 22 (34.9) | 38 (53.5) | |
| Liver involvement | 0.324 | |||
| No | 44 (32.8) | 18 (28.6) | 26 (36.6) | |
| Yes | 90 (67.2) | 45 (71.4) | 45 (63.4) | |
| Lung involvement | 0.027 | |||
| No | 78 (58.2) | 43 (68.3) | 35 (49.3) | |
| Yes | 56 (41.8) | 20 (31.7) | 36 (50/7) | |
| Node involvement | 0.945 | |||
| No | 106 (79.1) | 50 (79.4) | 56 (78.9) | |
| Yes | 28 (20.9) | 13 (20.6) | 15 (21.1) | |
| Peritoneal involvement | 0.814 | |||
| No | 103 (76.9) | 49 (77.8) | 54 (76.1) | |
| Yes | 31 (23.1) | 14 (22.2) | 17 (23.9) | |
| bTMB, Mut/Mb | 0.004 | |||
| <10 | 102 (76.1) | 55 (87.3) | 47 (66.2) | |
| ≥10 | 32 (23.9) | 8 (12.7) | 24 (33.8) | |
| Tumor fraction, % | 0.926 | |||
| <10 | 58 (43.3) | 27 (42.9) | 31 (43.7) | |
| ≥10 | 76 (56.7) | 36 (57.1) | 40 (56.3) | |
| Exon | 0.708 | |||
| 2 | 112 (84.2) | 53 (85.3) | 59 (83.1) | |
| 3-4 | 21 (15.8) | 9 (14.5) | 12 (16.9) | |
| VAF, % | 0.463 | |||
| <5 | 53 (39.6) | 27 (42.9) | 26 (36.6) | |
| ≥5 | 81 (60.4) | 36 (57.1) | 45 (63.4) |
Table B2.
Univariate and multivariate analysis for OS in ctRAS mutant subgroup
| Covariate | Univariate | Multivariate | ||||||
|---|---|---|---|---|---|---|---|---|
| Covariate | No of patients | No of events | HR | 95%CI | P-value | HR | 95%CI | P-value |
| Age, years | ||||||||
| <70 | 82 | 65 | ||||||
| ≥70 | 52 | 45 | 1.40 | 0.94-2.08 | 0.099 | |||
| Sex | ||||||||
| Female | 65 | 51 | ||||||
| Male | 69 | 59 | 0.98 | 0.67-1.42 | 0.898 | |||
| Tumor sidedness | ||||||||
| Right-sided | 37 | 27 | ||||||
| Left-sided | 95 | 81 | 1.48 | 0.99-2.21 | ||||
| Both | 2 | 2 | 4.99 | 0.34-73.8 | 0.026 | |||
| Grading | ||||||||
| Low | 110 | 90 | ||||||
| High | 11 | 10 | 1.33 | 0.64-2.79 | ||||
| Missing | 13 | 10 | 0.95 | 0.51-1.80 | 0.666 | |||
| Initial stage | ||||||||
| Non metastatic | 40 | 27 | ||||||
| Metastatic | 94 | 83 | 1.69 | 1.14-2.51 | 0.009 | |||
| Primary resection | ||||||||
| No | 34 | 30 | ||||||
| Yes | 100 | 80 | 0.51 | 0.31-0.84 | 0.008 | |||
| No of met. Sites | ||||||||
| 0-1 | 74 | 59 | ||||||
| >1 | 60 | 51 | 1.22 | 0.83-1.79 | 0.304 | |||
| Liver involvement | ||||||||
| No | 44 | 36 | ||||||
| Yes | 90 | 74 | 1.13 | 0.76-1.66 | 0.564 | |||
| Lung involvement | ||||||||
| No | 78 | 60 | ||||||
| Yes | 56 | 50 | 1.26 | 0.86-1.85 | 0.237 | |||
| Node involvement | ||||||||
| No | 106 | 88 | ||||||
| Yes | 28 | 22 | 0.85 | 0.54-1.33 | 0.474 | |||
| Peritoneal involvement | ||||||||
| No | 103 | 84 | ||||||
| Yes | 31 | 26 | 1.21 | 0.76-1.93 | 0.414 | |||
| Treatment setting | ||||||||
| First-line | 63 | 44 | ||||||
| Subsequent lines | 71 | 66 | 2.28 | 1.54-3.38 | <0.0001 | 2.46 | 1.61-3.75 | <0.0001 |
| bTMB, Mut/Mb | ||||||||
| <10 | 102 | 79 | ||||||
| ≥10 | 32 | 31 | 4.06 | 2.30-7.16 | <0.0001 | 1.71 | 1.09-2.70 | 0.021 |
| Tumor fraction, % | ||||||||
| <10 | 58 | 41 | ||||||
| ≥10 | 76 | 69 | 2.59 | 1.75-3.83 | <0.0001 | 2.58 | 1.69-3.95 | <0.0001 |
| Exon | ||||||||
| 2 | 112 | 92 | ||||||
| 3-4 | 21 | 18 | 1.40 | 0.80-2.47 | 0.239 | |||
| VAF, % | ||||||||
| <5 | 53 | 37 | ||||||
| ≥5 | 81 | 73 | 2.41 | 1.63-3.55 | <0.0001 | |||
| C-index 0.68 | 0.63-0.74 | <0.0001 | ||||||
References
- Siegel, R.L.; Kratzer, T.B.; Giaquinto, A.N.; Sung, H.; Jemal, A. Cancer statistics, 2025. CA Cancer J. Clin. 2025, 75, 10–45. [Google Scholar] [CrossRef]
- Cervantes, A.; Adam, R.; Roselló, S.; Arnold, D.; Normanno, N.; Taïeb, J.; Seligmann, J.; De Baere, T.; Osterlund, P.; Yoshino, T.; Martinelli, E.; ESMO Guidelines Committee. Metastatic colorectal cancer: ESMO clinical practice guideline for diagnosis, treatment and follow-up. Ann. Oncol. 2023, 34, 10–32. [Google Scholar] [CrossRef]
- Udagawa, S.; Ooki, A.; Shinozaki, E.; Fukuda, K.; Yamaguchi, K.; Osumi, H. Circulating tumor DNA: The dawn of a new era in the optimization of chemotherapeutic strategies for metastatic colorectal cancer focusing on RAS mutation. Cancers 2023, 15, 1473. [Google Scholar] [CrossRef] [PubMed]
- Lièvre, A.; Bachet, J.B.; Boige, V.; Cayre, A.; Le Corre, D.; Buc, E.; et al. KRAS mutations as an independent prognostic factor in patients with advanced colorectal cancer treated with cetuximab. J. Clin. Oncol. 2008, 26, 374–379. [Google Scholar] [CrossRef] [PubMed]
- Douillard, J.Y.; Oliner, K.S.; Siena, S.; Tabernero, J.; Burkes, R.; Barugel, M.; et al. Panitumumab–FOLFOX4 treatment and RAS mutations in colorectal cancer. N. Engl. J. Med. 2013, 369, 1023–1034. [Google Scholar] [CrossRef] [PubMed]
- Amado, R.G.; Wolf, M.; Peeters, M.; Van Cutsem, E.; Siena, S.; Freeman, D.J.; et al. Wild-type KRAS is required for panitumumab efficacy in patients with metastatic colorectal cancer. J. Clin. Oncol. 2023, 41, 3278–3286. [Google Scholar] [CrossRef] [PubMed]
- Karapetis, C.S.; Khambata-Ford, S.; Jonker, D.J.; O'Callaghan, C.J.; Tu, D.; Tebbutt, N.C.; et al. K-ras mutations and benefit from cetuximab in advanced colorectal cancer. N. Engl. J. Med. 2008, 359, 1757–1765. [Google Scholar] [CrossRef] [PubMed]
- Nicolazzo, C.; Belardinilli, F.; Caponnetto, S.; Gradilone, A.; Cortesi, E.; Giannini, G.; Gazzaniga, P. Why the therapeutic impact of RAS mutation clearance in plasma ctDNA deserves to be further explored in metastatic colorectal cancer. Front. Oncol. 2019, 9, 1414. [Google Scholar] [CrossRef] [PubMed]
- Thierry, A.R.; Mouliere, F.; El Messaoudi, S.; Mollevi, C.; Lopez-Crapez, E.; Rolet, F.; et al. Clinical validation of the detection of KRAS and BRAF mutations from circulating tumor DNA. Nat. Med. 2014, 20, 430–435. [Google Scholar] [CrossRef] [PubMed]
- Woodhouse, R.; et al. Clinical and analytical validation of FoundationOne Liquid CDx, a novel 324-gene cfDNA-based comprehensive genomic profiling assay for cancers of solid tumor origin. PLoS ONE 2020, 15, e0237802. [Google Scholar] [CrossRef] [PubMed]
- Rolfo, C.D.; Madison, R.W.; Pasquina, L.W.; Brown, D.W.; Huang, Y.; Hughes, J.D.; et al. Measurement of ctDNA Tumor Fraction Identifies Informative Negative Liquid Biopsy Results and Informs Value of Tissue Confirmation. Clin. Cancer Res. 2024, 30, 2452–2460. [Google Scholar] [CrossRef] [PubMed]
- Harrell, F.E. Jr.; Lee, K.L.; Mark, D.B. Multivariable prognostic models: Issues in developing models, evaluating assumptions and adequacy, and measuring and reducing errors. Stat. Med. 1996, 15, 361–387. [Google Scholar] [CrossRef]
- Pencina, M.J.; D'Agostino, R.B. Overall C as a measure of discrimination in survival analysis: Model specific population value and confidence interval estimation. Stat. Med. 2004, 23, 2109–2123. [Google Scholar] [CrossRef] [PubMed]
- Alix-Panabières, C.; Pantel, K. Liquid biopsy: From discovery to clinical application. Cancer Discov. 2021, 11, 858–873. [Google Scholar] [CrossRef] [PubMed]
- Patelli, G.; Lazzari, L.; Crisafulli, G.; Sartore-Bianchi, A.; Bardelli, A.; Siena, S.; Marsoni, S. Clinical utility and future perspectives of liquid biopsy in colorectal cancer. Commun. Med. 2025, 5, 137. [Google Scholar] [CrossRef] [PubMed]
- Grasselli, J.; Elez, E.; Caratù, G.; Matos, I.; Vidal, J.; Cassinotti, A.; et al. Concordance of blood- and tumor-based detection of RAS mutations to guide anti-EGFR therapy in metastatic colorectal cancer. Ann. Oncol. 2017, 28, 1294–1301. [Google Scholar] [CrossRef] [PubMed]
- Schwarzenbach, H.; Hoon, D.S.; Pantel, K. Cell-free nucleic acids as biomarkers in cancer patients. Nat. Rev. Cancer 2011, 11, 426–437. [Google Scholar] [CrossRef] [PubMed]
- Bachet, J.B.; Laurent-Puig, P.; Meurisse, A.; Bouché, O.; Mas, L.; Taly, V.; et al. Circulating tumour DNA at baseline for individualised prognostication in patients with chemotherapy-naïve metastatic colorectal cancer: An AGEO prospective study. Eur. J. Cancer 2023, 189, 112934. [Google Scholar] [CrossRef] [PubMed]
- Manca, P.; Corallo, S.; Lonardi, S.; Fucà, G.; Busico, A.; Leone, A.G.; et al. Variant allele frequency in baseline circulating tumour DNA to measure tumour burden and to stratify outcomes in patients with RAS wild-type metastatic colorectal cancer: A translational objective of the Valentino study. Br. J. Cancer 2022, 126, 449–455. [Google Scholar] [CrossRef] [PubMed]
Figure 1.
Study Flowchart of Patient Inclusion and Exclusion. Out of 282 patients who underwent ctDNA testing, 17 were excluded due to technical failure (n = 8), absence of reportable genomic alterations (n = 6), unavailable RAS VAF (n = 2), or consent withdrawal (n = 1). The final cohort included 265 patients.
Figure 1.
Study Flowchart of Patient Inclusion and Exclusion. Out of 282 patients who underwent ctDNA testing, 17 were excluded due to technical failure (n = 8), absence of reportable genomic alterations (n = 6), unavailable RAS VAF (n = 2), or consent withdrawal (n = 1). The final cohort included 265 patients.
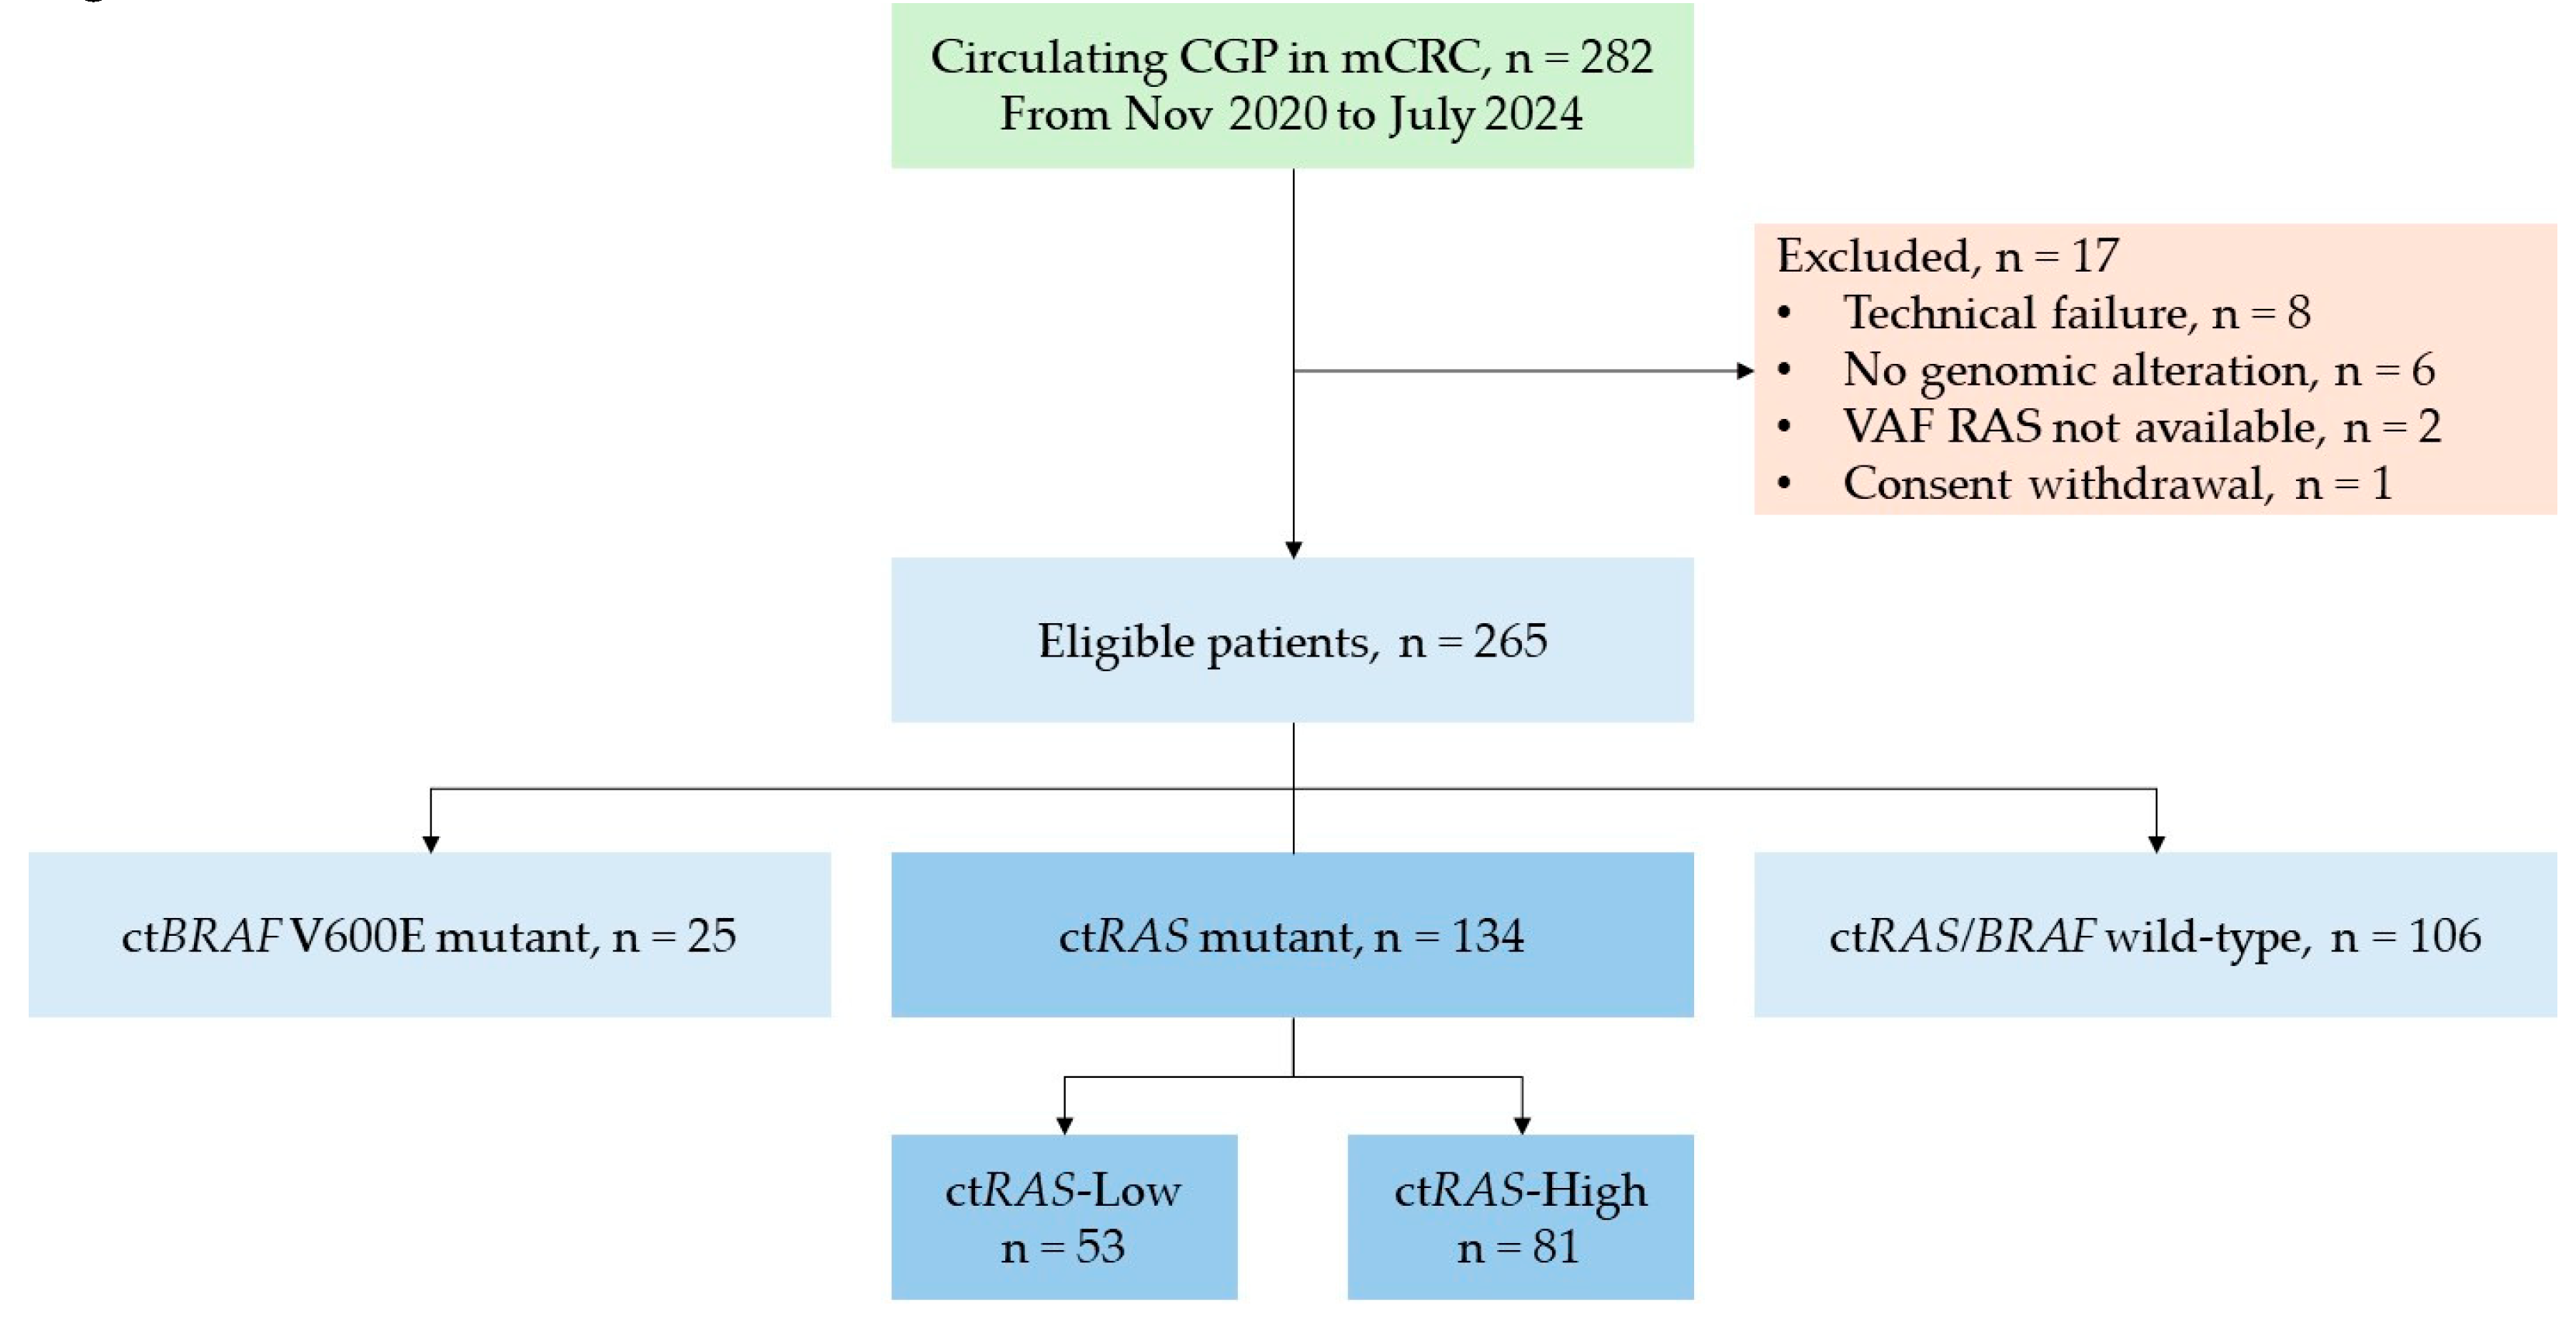
Figure 2.
Distribution of RAS Variant Allele Frequency (VAF) in ctDNA. (a) Normal plot showing the distribution of RAS VAF across the 134 ctRAS-mutant patients. The horizontal axis of the Normal plot shows the hazard ratio (HR) for death, and the vertical axis shows the corresponding expected number of standard deviations from the mean (z-score), based on the ranks of the observed values; (b) Forest plot. The horizontal axis shows the observed values of Harrel’s C-index, and the vertical axis shows the value of variant allele frequency (VAF, %) of RAS genes. The central values are represented by markers and the confidence intervals by horizontal lines.
Figure 2.
Distribution of RAS Variant Allele Frequency (VAF) in ctDNA. (a) Normal plot showing the distribution of RAS VAF across the 134 ctRAS-mutant patients. The horizontal axis of the Normal plot shows the hazard ratio (HR) for death, and the vertical axis shows the corresponding expected number of standard deviations from the mean (z-score), based on the ranks of the observed values; (b) Forest plot. The horizontal axis shows the observed values of Harrel’s C-index, and the vertical axis shows the value of variant allele frequency (VAF, %) of RAS genes. The central values are represented by markers and the confidence intervals by horizontal lines.
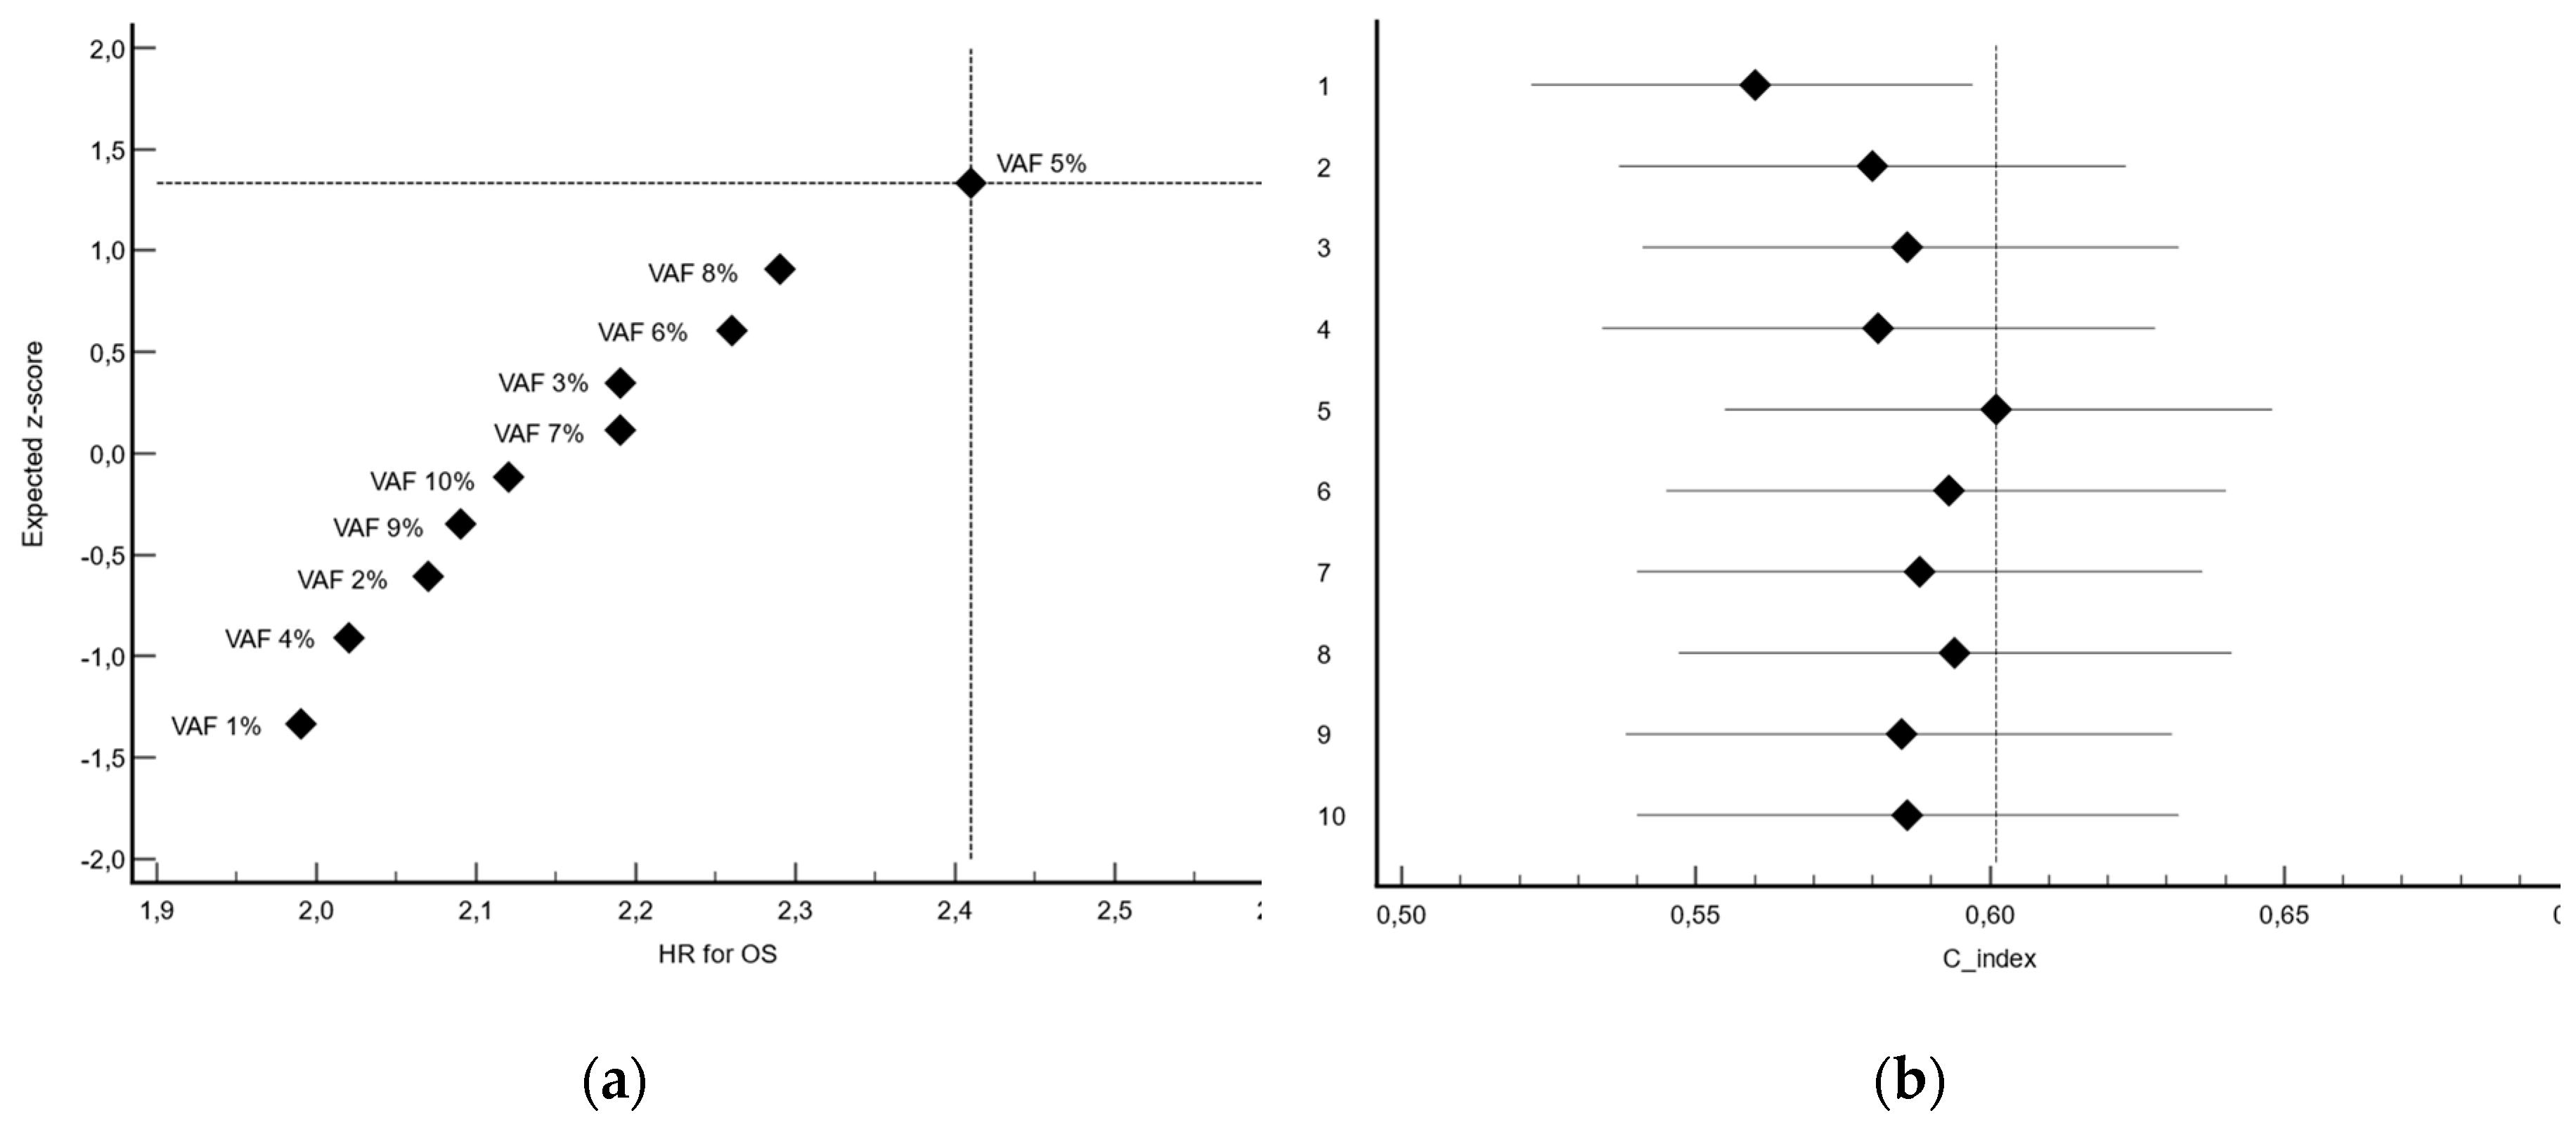
Figure 3.
Kaplan-Meier curves for overall survival stratified by molecular subgroups and VAF RAS level. Patients were dichotomized using the median value of the biomarker. The high-expression group demonstrated significantly poorer survival compared to the low-expression group (log-rank p < 0.0001; HR = 2.41; 95% CI, 1.63 to 3.55).
Figure 3.
Kaplan-Meier curves for overall survival stratified by molecular subgroups and VAF RAS level. Patients were dichotomized using the median value of the biomarker. The high-expression group demonstrated significantly poorer survival compared to the low-expression group (log-rank p < 0.0001; HR = 2.41; 95% CI, 1.63 to 3.55).
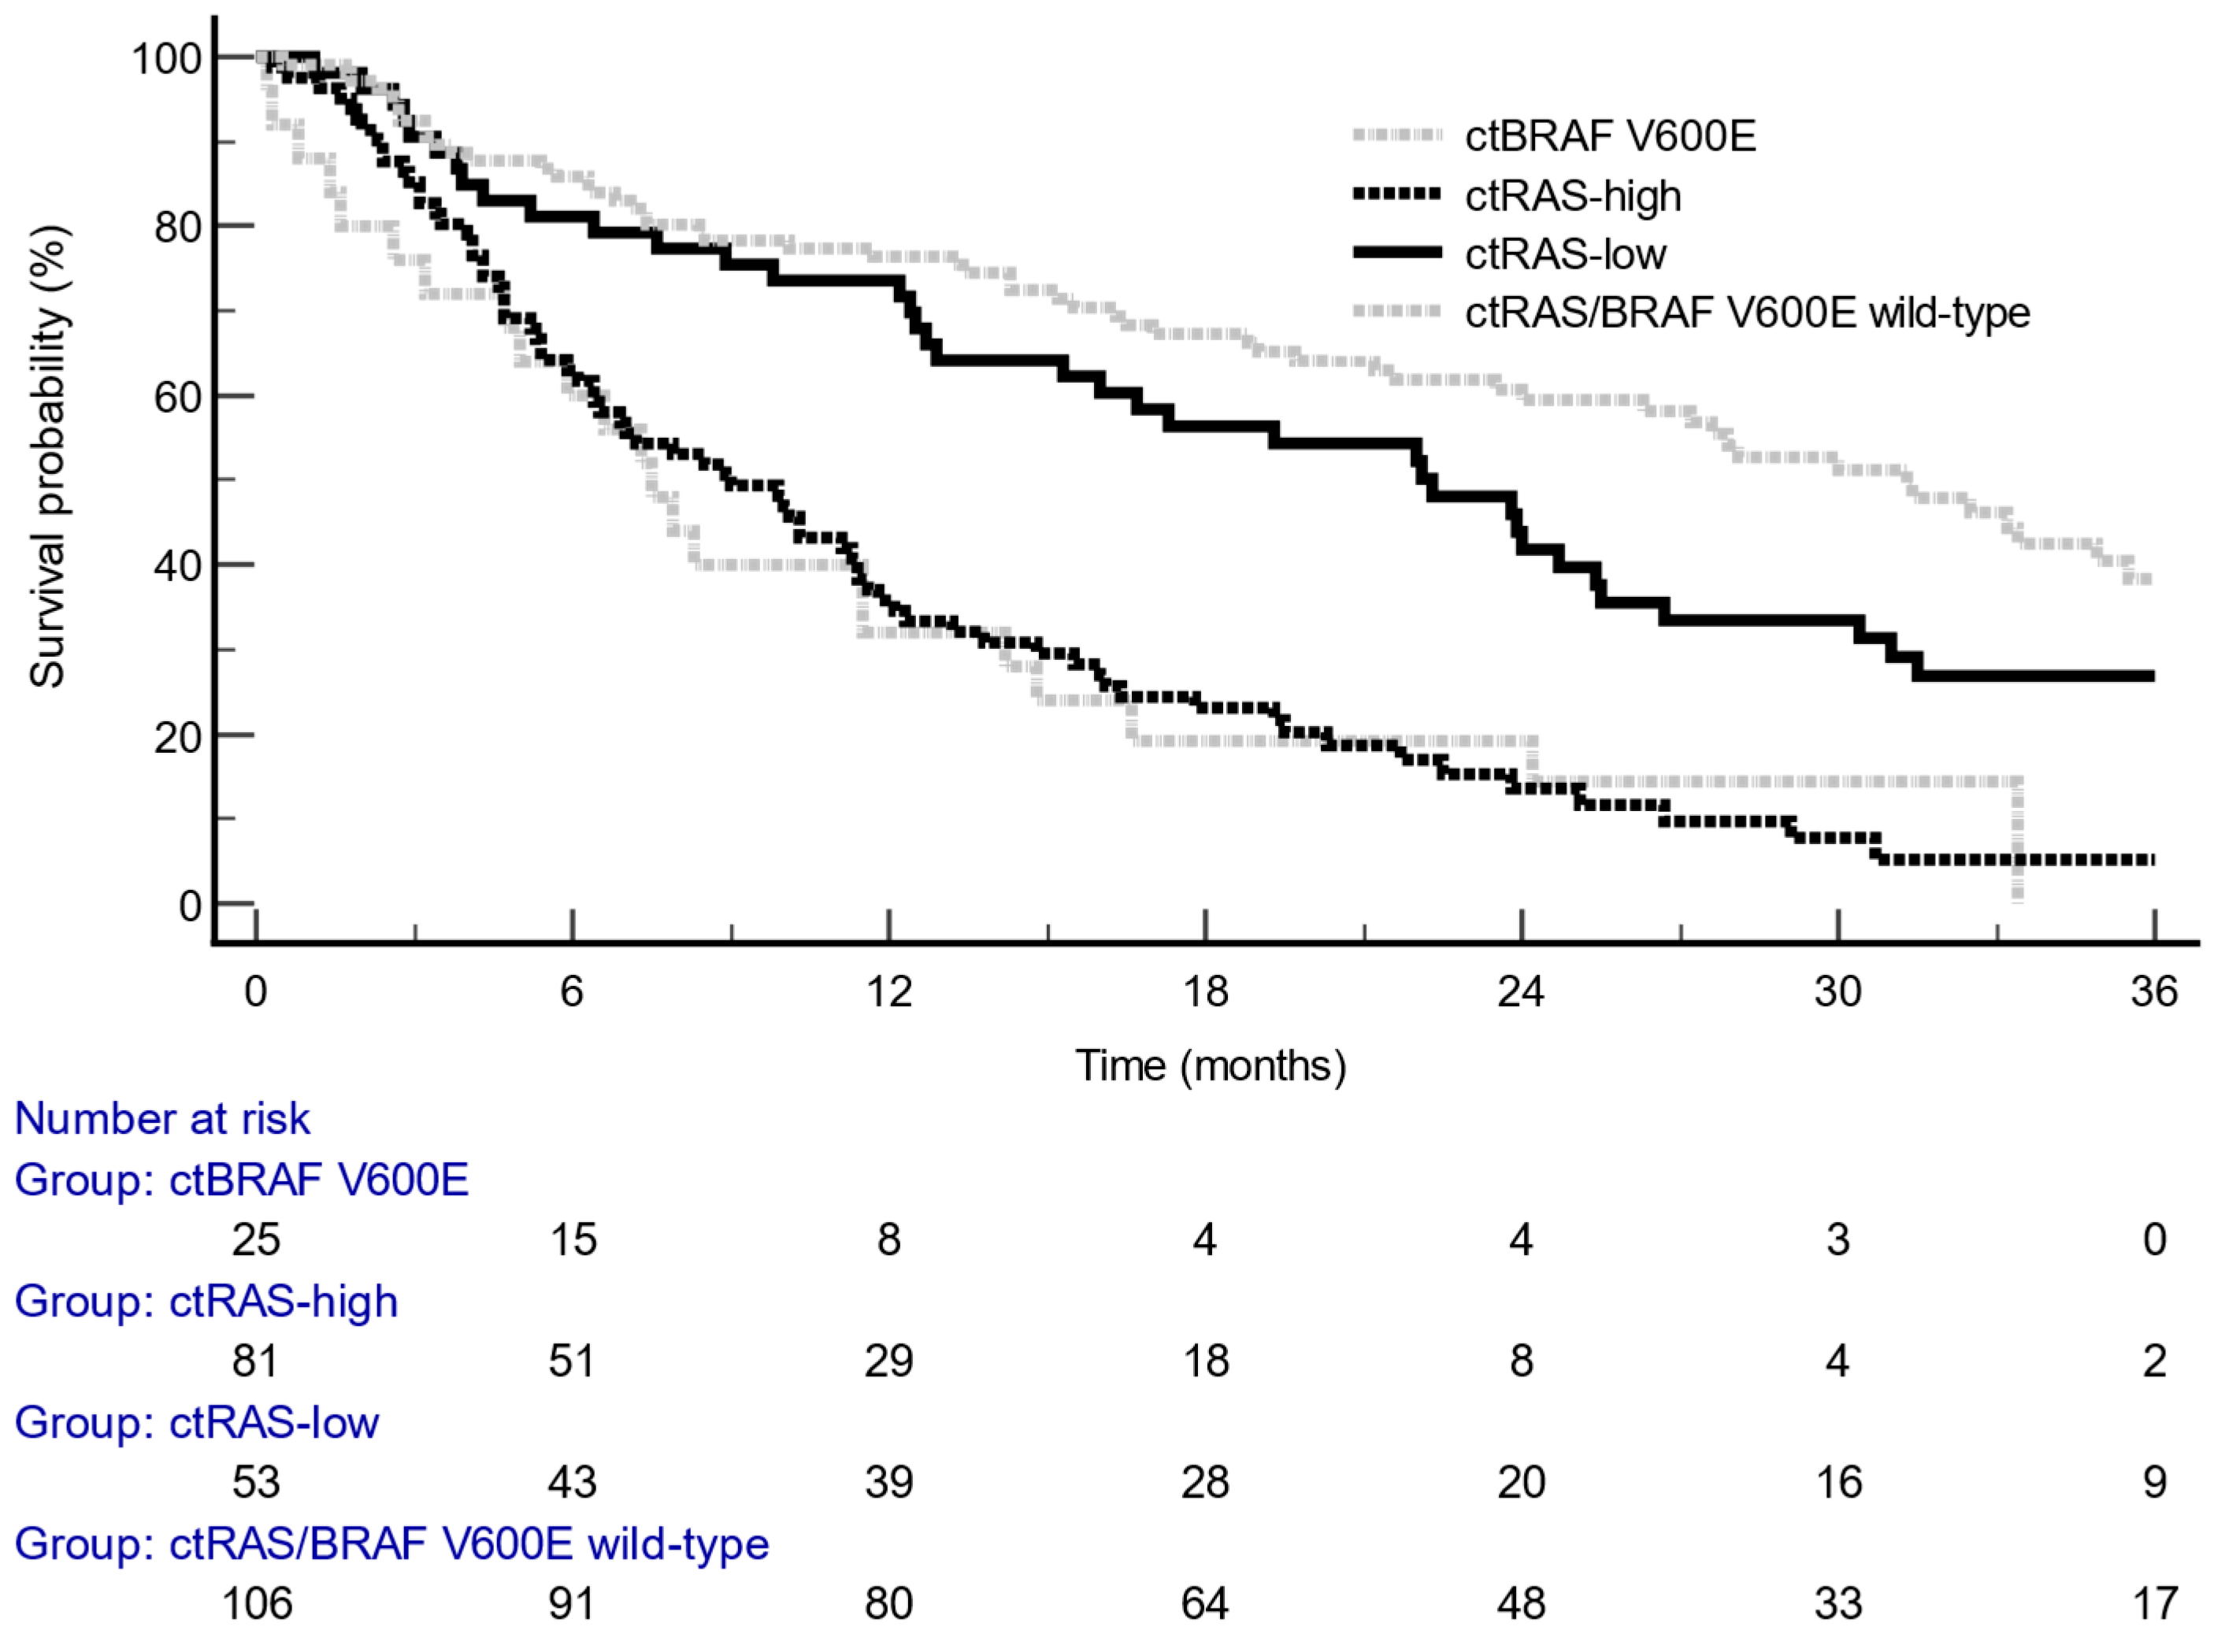
Figure 4.
Forest Plot of Sensitivity Analyses. Forest plot showing hazard ratios for overall survival associated with high RAS VAF (≥5%) across predefined subgroups (e.g., age, sex, metastatic sites, treatment line), confirming consistent prognostic impact.
Figure 4.
Forest Plot of Sensitivity Analyses. Forest plot showing hazard ratios for overall survival associated with high RAS VAF (≥5%) across predefined subgroups (e.g., age, sex, metastatic sites, treatment line), confirming consistent prognostic impact.
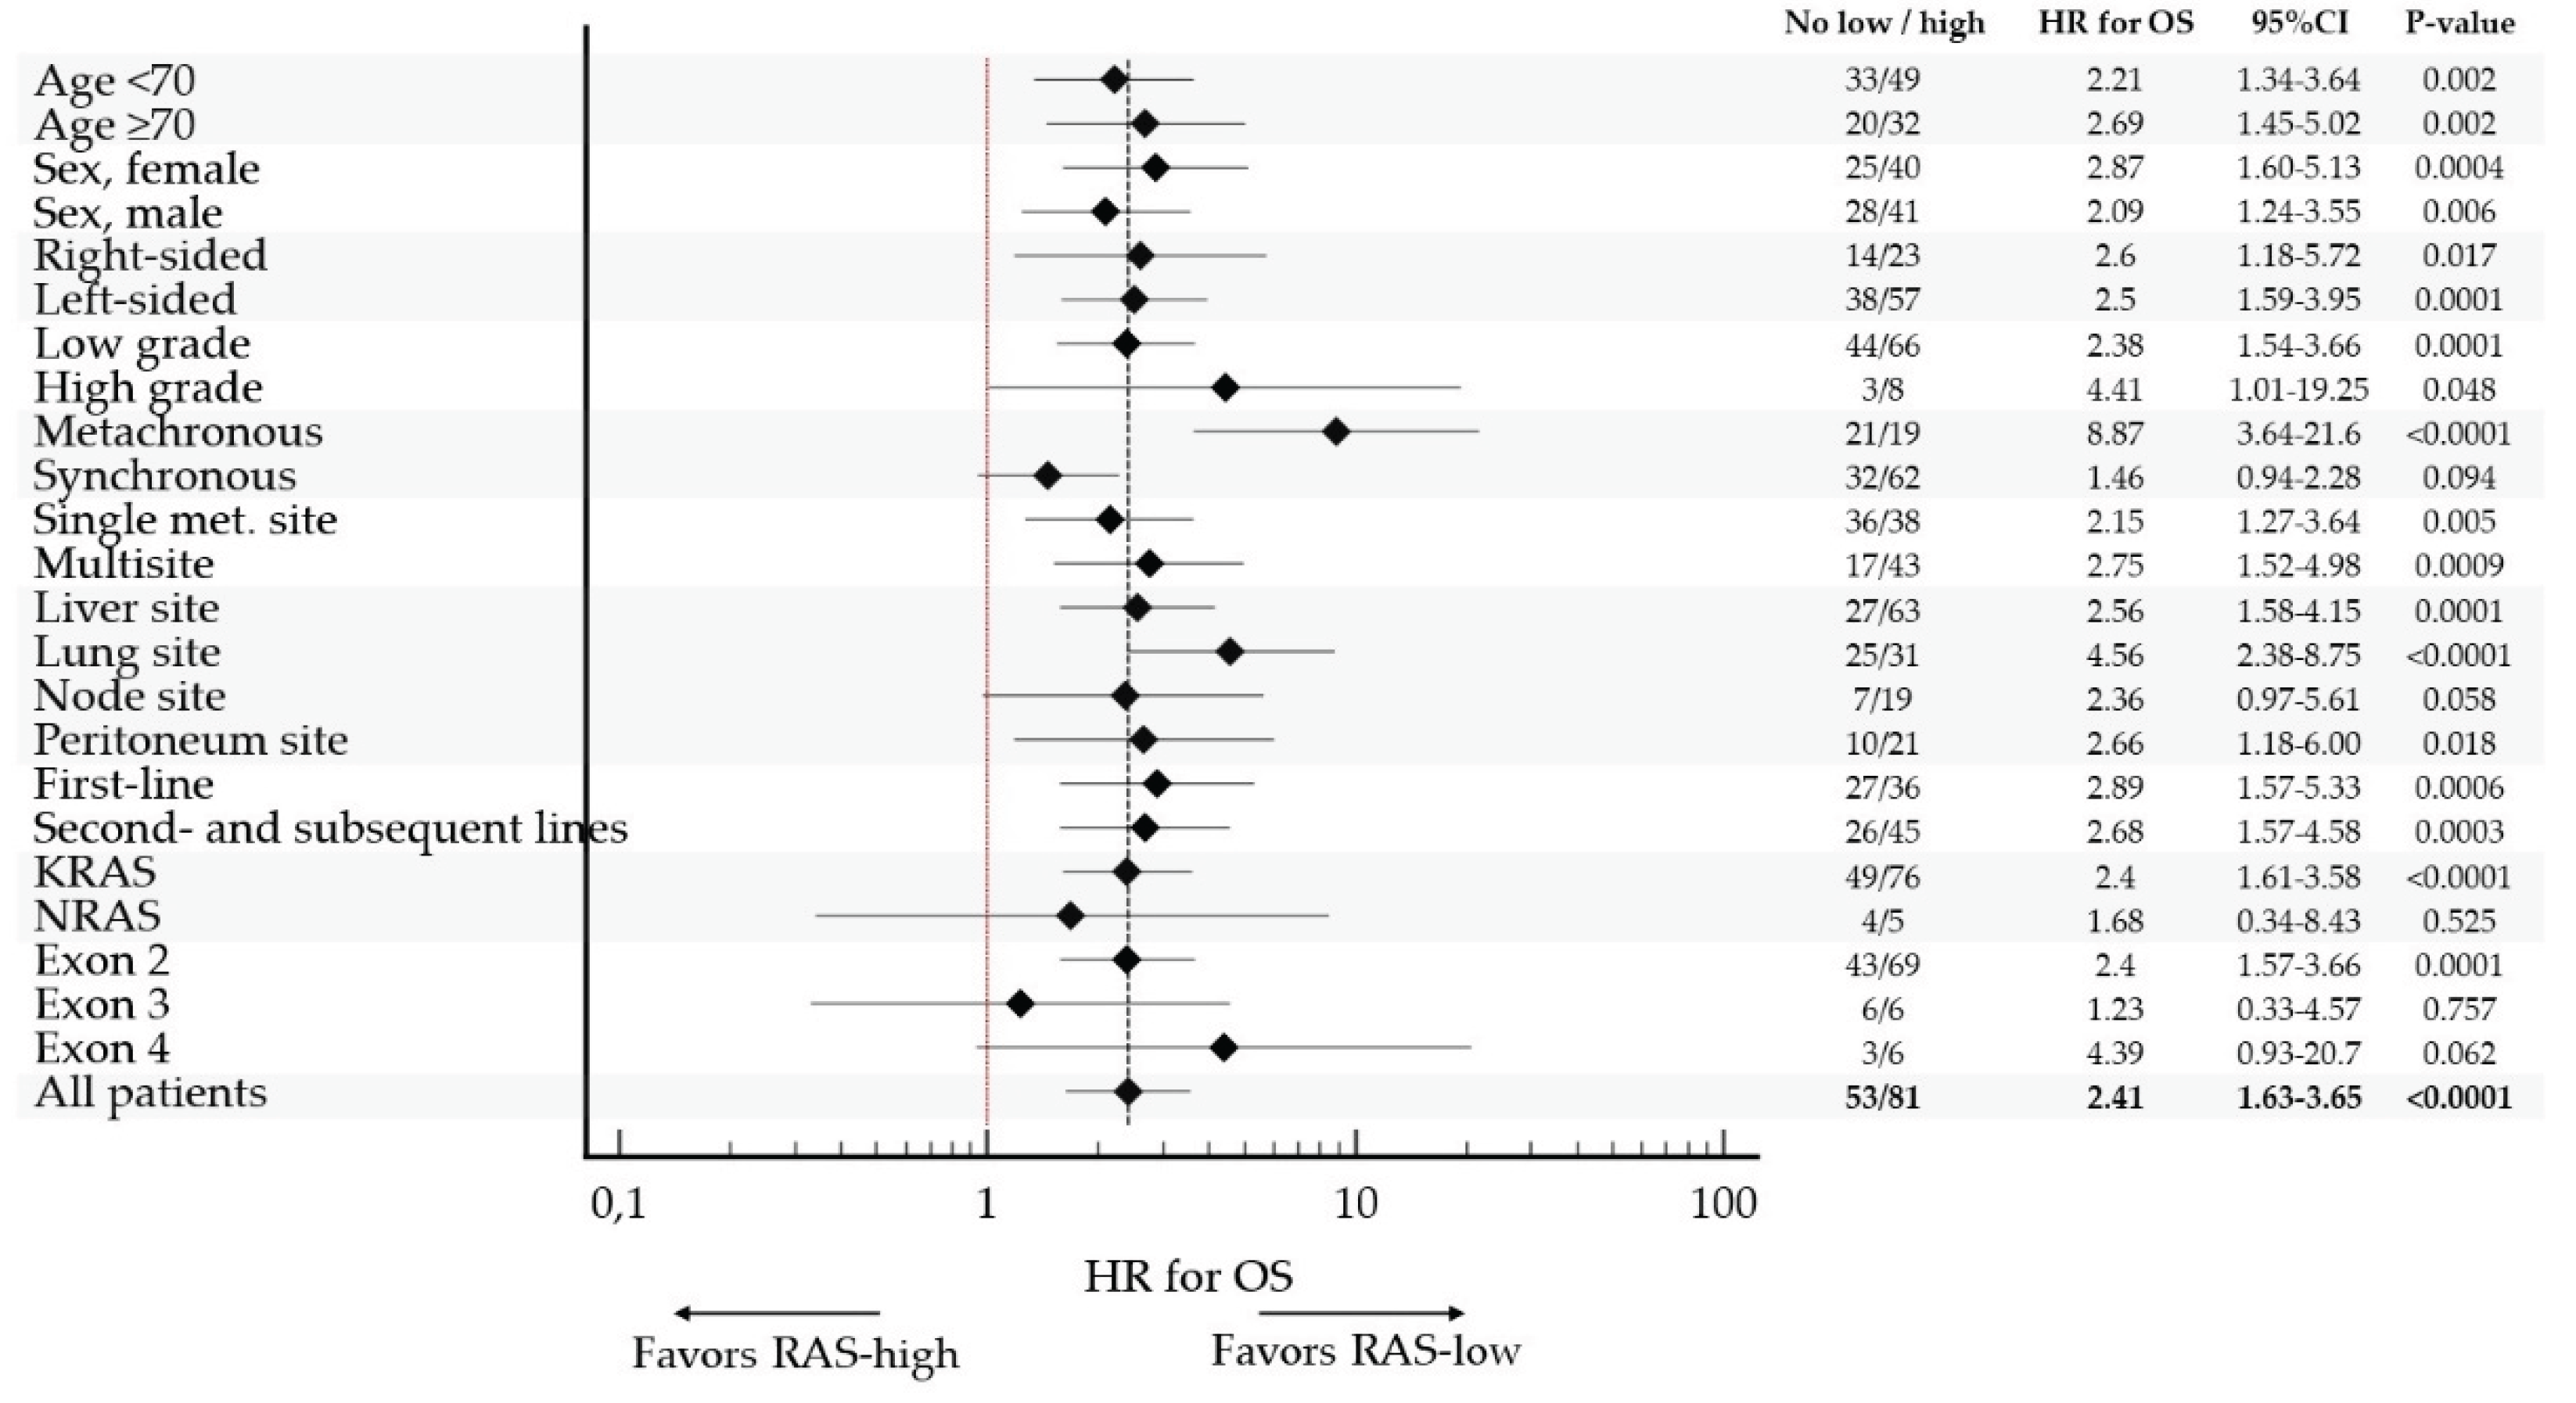
Table 1.
Determination of VAF RAS cut-off.
| VAF cut-off (%) | No. Low | No. High | HR | HR 95%CI | P-value | C-index | C-index 95%CI |
|---|---|---|---|---|---|---|---|
| 1 | 25 | 109 | 1.99 | 1.29-3.06 | 0.0018 | 0.560 | 0.522-0.597 |
| 2 | 35 | 99 | 2.07 | 1.40-3.08 | 0.0003 | 0.580 | 0.537-0.623 |
| 3 | 43 | 91 | 2.19 | 1.48-3.22 | 0.0001 | 0.586 | 0.541-0.632 |
| 4 | 49 | 85 | 2.02 | 1.37-2.96 | 0.0003 | 0.581 | 0.534-0.628 |
| 5 | 53 | 81 | 2.41 | 1.63-3.55 | <0.0001 | 0.601 | 0.555-0.648 |
| 6 | 61 | 73 | 2.26 | 1.53-3.34 | <0.0001 | 0.593 | 0.545-0.640 |
| 7 | 62 | 72 | 2.19 | 1.48-3.24 | 0.0001 | 0.588 | 0.540-0.636 |
| 8 | 66 | 68 | 2.29 | 1.54-3.42 | <0.0001 | 0.594 | 0.547-0.641 |
| 9 | 71 | 63 | 2.09 | 1.40-3.13 | 0.0003 | 0.585 | 0.538-0.631 |
| 10 | 74 | 60 | 2.12 | 1.41-3.19 | 0.0003 | 0.586 | 0.540-0.632 |
Table 2.
Patient and tumor characteristics.
| Covariate | All patients |
ctBRAF |
ctRAS-high (VAF ≥5%) |
ctRAS-low (VAF <5%) |
ctRAS/BRAF WT |
P-value (all) |
P-value (RAS) |
|---|---|---|---|---|---|---|---|
| No of patients | 265 | 25 | 81 | 53 | 106 | ||
| Age, years | 0.099 | 0.838 | |||||
| <70 | 163 (61.5) | 10 (40.0) | 49 (60.5) | 33 (62.3) | 71 (67.0) | ||
| ≥70 | 102 (38.5) | 15 (60.0) | 32 (39.5) | 20 (37.7) | 35 (33.0) | ||
| Sex | 0.699 | 0.803 | |||||
| Female | 130 (49.1) | 15 (60.0) | 40 (49.4) | 25 (47.2) | 50 (47.2) | ||
| Male | 135 (50.9) | 10 (40.0) | 41 (50.6) | 28 (52.8) | 56 (52.8) | ||
| Tumor sidedness | <0.0001 | 0.930 | |||||
| Right-sided | 85 (32.1) | 20 (80.0) | 23 (28.4) | 14 (26.4) | 28 (26.4) | ||
| Left-sided | 175 (66.0) | 5 (20.0) | 57 (70.4) | 38 (71.7) | 75 (70.8) | ||
| Both | 5 (1.9) | 0 | 1 (1.2) | 1 (1.9) | 3 (2.8) | ||
| Grading | 0.016 | 0.411 | |||||
| Low | 207 (87.7) | 14 (66.7) | 66 (89.2) | 44 (93.6) | 83 (88.3) | ||
| High | 29 (12.3) | 7 (33.3) | 8 (10.8) | 3 (6.4) | 11 (11.7) | ||
| Missing | 29 | 4 | 7 | 6 | 12 | ||
| Initial stage | 0.020 | 0.046 | |||||
| Non metastatic | 86 (32.5) | 4 (16.0) | 19 (23.5) | 21 (39.6) | 42 (39.6) | ||
| Metastatic | 179 (67.5) | 21 (84.0) | 62 (76.5) | 32 (60.4) | 64 (60.4) | ||
| Primary resection | 0.089 | 0.028 | |||||
| No | 62 (23.4) | 7 (28.0) | 26 (32.1) | 8 (15.1) | 21 (19.8) | ||
| Yes | 203 (76.6) | 18 (72.0) | 55 (67.9) | 45 (84.9) | 85 (80.2) | ||
| Disease stage | 0.107 | - | |||||
| Locally advanced | 4 (1.5) | 0 | 0 | 0 | 4 (3.8) | ||
| Metastatic | 261 (98.5) | 25 (100.0) | 81 (100.0) | 53 (100.0) | 102 (96.2) | ||
| No of met. Sites | 0.002 | 0.017 | |||||
| 0-1 | 151 (57.0) | 8 (32.0) | 38 (46.9) | 36 (67.9) | 69 (65.1) | ||
| >1 | 114 (43.0) | 17 (68.0) | 43 (53.1) | 17 (32.1) | 37 (34.9) | ||
| Liver involvement | 0.009 | 0.001 | |||||
| No | 90 (34.0) | 11 (44.0) | 18 (22.2) | 26 (49.1) | 35 (33.0) | ||
| Yes | 175 (66.0) | 14 (56.0) | 63 (77.8) | 27 (50.9) | 71 (67.0) | ||
| Lung involvement | 0.004 | 0.309 | |||||
| No | 179 (67.5) | 17 (68.0) | 50 (61.7) | 28 (52.8) | 84 (79.2) | ||
| Yes | 86 (32.5) | 8 (32.0) | 31 (38.3) | 25 (47.2) | 22 (20.8) | ||
| Node involvement | 0.029 | 0.369 | |||||
| No | 207 (78.1) | 14 (56.0) | 62 (76.5) | 44 (83.0) | 87 (82.1) | ||
| Yes | 58 (21.9) | 11 (44.0) | 19 (23.5) | 9 (17.0) | 19 (17.9) | ||
| Peritoneal involvement | 0.124 | 0.345 | |||||
| No | 197 (74.3) | 14 (56.0) | 60 (74.1) | 43 (81.1) | 80 (75.5) | ||
| Yes | 68 (25.7) | 11 (44.0) | 21 (25.9) | 10 (18.9) | 26 (24.5) | ||
| Treatment setting | 0.019 | 0.463 | |||||
| First-line | 149 (56.2) | 16 (64.0) | 36 (44.4) | 27 (50.9) | 70 (66.0) | ||
| Subsequent lines | 116 (43.8) | 9 (36.0) | 45 (55.6) | 26 (49.1) | 36 (34.0) |
Table 3.
Molecular characteristics of ctRAS mutant tumors according to VAF level (ctRAS-low, VAF <5%; ctRAS-high, VAF ≥5%).
Table 3.
Molecular characteristics of ctRAS mutant tumors according to VAF level (ctRAS-low, VAF <5%; ctRAS-high, VAF ≥5%).
| Covariate | All RAS | ctRAS-high | ctRAS-low | P-value |
|---|---|---|---|---|
| No of patients | 134 | 81 | 53 | |
| ctMSI | 0.251 | |||
| Detected | 2 (1.5) | 2 (2.5) | 0 | |
| Not detected | 132 (98.5) | 79 (97.5) | 53 (100.0) | |
| Blood TMB, Mut/Mb | <0.0001 | |||
| <5 | 54 (40.3) | 19 (23.5) | 35 (66.0) | |
| 5 to 10 | 48 (35.8) | 35 (43.2) | 13 (24.5) | |
| ≥10 | 32 (23.9) | 27 (33.3) | 5 (9.4) | |
| Tumor fraction, % | <0.0001 | |||
| <10 | 58 (43.3) | 11 (13.6) | 47 (88.7) | |
| ≥10 | 76 (56.7) | 70 (86.4) | 6 (11.3) | |
| Codon | 0.335 | |||
| 12 | 88 (65.7) | 51 (63.0) | 37 (69.8) | |
| 13 | 24 (17.9) | 18 (22.2) | 6 (11.3) | |
| 22 | 1 (0.7) | 0 | 1 (1.9) | |
| 61 | 11 (8.2) | 5 (6.2) | 6 (11.3) | |
| 117 | 1 (0.7) | 1 (1.2) | 0 | |
| 146 | 9 (6.7) | 6 (7.4) | 3 (5.7) | |
| Selected RAS variants | ||||
| G12A | 12 (9.0) | 3 (3.7) | 9 (17.0) | 0.009 |
| G12C | 8 (6.0) | 4 (4.9) | 4 (7.5) | 0.535 |
| G12D | 34 (25.4) | 20 (24.7) | 14 (26.4) | 0.823 |
| G12V | 26 (19.4) | 18 (22.2) | 8 (15.1) | 0.309 |
| APC | <0.0001 | |||
| Wild-type | 16 (11.9) | 8 (9.9) | 8 (15.1) | |
| Mutant-Low | 43 (32.1) | 7 (8.6) | 36 (67.9) | |
| Mutant-High | 75 (56.0) | 66 (81.5) | 9 (17.0) | |
| TP53 | <0.0001 | |||
| Wild-type | 22 (16.4) | 7 (8.6) | 15 (28.3) | |
| Mutant-Low | 38 (28.4) | 8 (9.9) | 30 (56.6) | |
| Mutant-High | 74 (55.2) | 66 (81.5) | 8 (15.1) | |
| Co-altered pathways | 0.006 | |||
| MAPK | 11 (8.2) | 6 (7.4) | 5 (9.4) | |
| PIK3/AKT/mTOR | 28 (20.9) | 19 (23.5) | 9 (17.0) | |
| TGFb | 19 (14.2) | 16 (19.8) | 3 (5.7) | |
| Wnt/b-catenin | 10 (7.5) | 10 (12.3) | 0 | |
| DNA damage repair | 9 (6.7) | 6 (7.4) | 3 (5.7) | |
| Cell cycle progression | 4 (3.0) | 2 (2.5) | 2 (3.8) | |
| Immune | 3 (2.2) | 2 (2.5) | 1 (1.9) | |
| Other | 24 (17.9) | 11 (13.6) | 13 (24.5) | |
| None | 26 (19.4) | 9 (11.1) | 17 (32.1) |
Disclaimer/Publisher’s Note: The statements, opinions and data contained in all publications are solely those of the individual author(s) and contributor(s) and not of MDPI and/or the editor(s). MDPI and/or the editor(s) disclaim responsibility for any injury to people or property resulting from any ideas, methods, instructions or products referred to in the content. |
© 2025 by the authors. Licensee MDPI, Basel, Switzerland. This article is an open access article distributed under the terms and conditions of the Creative Commons Attribution (CC BY) license (http://creativecommons.org/licenses/by/4.0/).
Copyright: This open access article is published under a Creative Commons CC BY 4.0 license, which permit the free download, distribution, and reuse, provided that the author and preprint are cited in any reuse.