

Submitted:
12 October 2025
Posted:
14 October 2025
Read the latest preprint version here
Abstract
This study re-evaluates ROC-AUC for binary classification under severe class imbalance (<3% positives). Despite widespread use, ROC-AUC can mask operationally salient differences among classifiers when false-positive and false-negative costs are asymmetric. Using three benchmarks, credit-card fraud detection (0.17%), yeast protein localization (1.35%), and ozone level detection (2.9%), we compare ROC-AUC with Matthews Correlation Coefficient (MCC), F2-score, H-measure, and area under the precision–recall curve (PR-AUC). Our empirical analyses span 20 classifier–sampler configurations per dataset, four classifiers (Logistic Regression, Random Forest, XGBoost, and CatBoost) crossed with four oversampling methods plus a no-resampling baseline (no resampling, SMOTE, Borderline-SMOTE, SVM-SMOTE, ADASYN). ROC-AUC exhibits pronounced ceiling effects, yielding high scores even for underperforming pipelines. In contrast, MCC and F2 align more closely with deployment-relevant costs and achieve the highest Kendall’s τ rank concordance across datasets; PR-AUC provides threshold-independent ranking, and H-measure integrates cost sensitivity. We quantify uncertainty and differences using stratified bootstrap confidence intervals, DeLong’s test for ROC-AUC, and Friedman–Nemenyi critical-difference diagrams, which collectively underscore ROC-AUC’s limited discriminative value in rare-event settings. The findings support a shift to a multi-metric evaluation framework, recommending MCC and F2 as primary indicators, supplemented by PR-AUC and H-measure where ranking granularity and principled cost integration are required. This evidence encourages researchers and practitioners to move beyond sole reliance on ROC-AUC when evaluating classifiers in highly imbalanced data.
Keywords:
binary classification
; evaluation metrics
; H-measure
; imbalanced data
; MCC
; PR-AUC
; ROC-AUC
1. Introduction and Background
Rare-event binary classification remains a significant challenge across various domains, including but not limited to fraud detection, bioinformatics, environmental monitoring, cybersecurity, medical diagnosis, manufacturing fault detection, and autonomous systems. In these settings, the positive class typically constitutes a small fraction of the data, making accurate detection both technically difficult and operationally critical. Standard tools for model evaluation—particularly Area Under the Receiver Operating Characteristic Curve (ROC-AUC)—often yield inflated assessments due to their insensitivity to class imbalance and asymmetric error costs. As machine learning systems become integral to decision-making in high-stakes, real-world environments, it is essential to critically evaluate both the data preprocessing methods and performance metrics used in model assessment. This study presents a comprehensive, metric-centred investigation of classifier evaluation under highly imbalanced data conditions, focusing on resampling strategies and metric behaviour. The subsections below provide background on the methodological foundations that guide our analysis.
1.1. Resampling Strategies in Imbalanced Data
When the minority-class prior
empirical risk minimisation with a symmetric loss favours the majority class [1]. One cure is resampling, i.e., constructing a training set whose posterior prior is closer to 0.5. Let , denote the counts of minority (class 1) and majority (class 0) instances, and let be an oversampling factor applied to the minority class. After oversampling,
A perfectly balanced set, therefore, corresponds to . The subsections below summarise the major families of resampling and highlight their theoretical motivations.
Random undersampling, randomly discarding the majority of instances, reduces to ≈0.5 [2]. While computationally attractive, it may eliminate informative majority examples and increase estimator variance; ensemble variants such as EasyEnsemble and BalanceCascade mitigate this by building multiple classifiers on independently undersampled subsets and aggregating their predictions.
Random oversampling replicating minority observations to reach the desired ratio is unbiased in expectation but can cause exact duplicate rows, leading to over-fitting [4]. The expected Bayes risk decreases only if the learner regularises against memorisation.
To avoid duplication, synthetic minority over-sampling generates artificial instances
where xi is a minority point and xNN one of its k minority nearest neighbours [5]. Extensions refine the neighbourhood criterion:
- Borderline-SMOTE focuses on minority points whose nearest neighbours are predominantly majority, increasing density near the decision boundary [6].
- SVM-SMOTE exploits the support vectors of a cost-sensitive SVM to guide synthesis [7].
- Safe-Level-SMOTE assigns a safety level and chooses theinterpolation factor λ so that the synthetic point lies closer to the parent with a higher safelevel score to avoid generating samples in dangerous regions [8].
- ADASYN adaptively varies the number of synthetic samples per minority point according to the local imbalance ratiowhere is the proportion of majority neighbours [9]. This shifts density toward sparsely represented minority areas.
Combining oversampling with Tomek links deletion or Edited Nearest Neighbours removes the majority of points lying within the minority manifold, reducing class overlap [12]. Empirically, SMOTE + ENN often yields smoother decision surfaces than either step alone [13].
Density-aware and generative approaches employ information-theoretic or generative criteria. G-SMOTE replaces linear interpolation with a Gaussian mixture model of the minority class [14], while GAN-based oversamplers learn implicitly via adversarial training [15]. Theoretical analyses show that, under a Lipschitz assumption on the Bayes decision boundary, synthetic samples drawn from a contiguous minority manifold can reduce the upper bound on the classification error by tightening the margin [16].
1.2. Performance Metrics in Binary Classification
Let the confusion matrix for a binary classifier at threshold be
and
Any scalar score reduces this 2×2 matrix—or, in
threshold-free form, the ranking of class scores s(x)—to a single real number.
The following subsections review metrics' principal families, mathematical
properties, and known limitations.
1.2.1. Threshold-independent Discrimination
The receiver-operating-characteristic area is
where , are the score distributions for positives and negatives [17,18]. ROC-AUC is equivalent to the Mann–Whitney statistic and is invariant under strictly monotone score transformations. Its major weakness is class-imbalance insensitivity: when , significant changes in FP translate into tiny variations of the false-positive rate [19]. Consider a binary classifier that assigns each instance a score and applies a threshold to decide between positive and negative. The two axes of its ROC curve are then
In many practical settings, the number of positive cases is vanishingly small compared to negatives . In that extreme imbalance, the FPR denominator is effective , so even a significant absolute change in false positives (FP) produces only a barely perceptible shift in the ROC curve.
This distortion carries over to the AUC itself. Equivalently expressed as
the statistic is overwhelmed by comparisons among the abundant negative–negative pairs. As long as a model avoids egregious score inversions, moderate numbers of false alarms or misses scarcely register in AUC.
The upshot is that, under severe imbalance, nearly any non-degenerate
classifier achieves an ROC-AUC in the 0.90–0.99 range, obscuring the errors
that drive operational cost. By treating false positives and false negatives
(FN) symmetrically, ROC-AUC “wins” without ever “paying” for the mistakes that,
in domains like fraud or medical diagnosis, are most consequential.
Replacing the x-axis with recall yields the
precision–recall curve; its area
has a baseline equal to the minority prevalence . Davis and Goadrich prove that Area Under the Precision–Recall Curve (PR-AUC) is strictly more informative than ROC-AUC when is small.
In a similar effort, the H-measure is a coherent alternative to the area under the ROC curve that explicitly incorporates the relative cost of false positives and false negatives via a user-specified distribution over misclassification cost-ratios. Rather than treating all operating points equally, the H-measure defines a weighting density on the cost-ratio and computes the
expected misclassification loss
where and are the class priors, and is the threshold minimizing the cost for a given . By default, one chooses to be the density, yielding a
neutral prior that neither over- nor under-emphasizes extreme cost ratios. The
H-measure is then normalized by the worst-possible expected loss under the same
density, producing a summary score in [0,1]:
In contrast to ROC-AUC—which is dominated by the vast
number of negative–negative score-pair comparisons under severe imbalance and
thus remains artificially high even when a classifier makes many costly
errors—the H-measure penalizes errors proportionally to their operational
importance. In highly skewed scenarios (e.g., fraud detection, rare-disease
screening), it provides a more discriminating evaluation: classifiers that
sacrifice minority-class sensitivity or incur excessive false alarms receive a
substantially lower H-measure, whereas ROC-AUC remains saturated.
1.2.2. Single-threshold Confusion-matrix Scores
The Matthews correlation coefficient (MCC) and the Fβ score are two widely used scalars.
MCC is a special case of Pearson’s between prediction and truth. MCC treats both classes symmetrically and remains well defined even when one row or column is small [23].
Unlike MCC, ignores true negatives; it is therefore sensitive to prevalence and may exaggerate performance in dense negative regions [25]. An alternative that explicitly accounts for prevalence is balanced accuracy
recently advocated for class-imbalance evaluation [26].
Another related metric, Cohen’s κ (kappa), is a chance-corrected measure of agreement that quantifies how much better a classifier’s predictions agree with the true labels than would be expected by random chance [27]. For a two-category problem, let
be the observed and expected agreement, respectively, where and are the counts of predicted and true instances in class . Then
which ranges from −1 (complete disagreement) through 0 (no better than chance) to 1 (perfect agreement).
Unlike raw accuracy, κ corrects for any agreement that would arise simply from the marginal class frequencies—an important feature when classes are highly imbalanced. In such settings, a naive classifier can achieve high accuracy (and thus high ) by always predicting the majority class, yet its κ will remain low because is large. Interpretive benchmarks suggest that κ<0.00 indicates “poor” agreement, 0.00–0.20 “slight,” 0.21–0.40 “fair,” 0.41–0.60 “moderate,” 0.61–0.80 “substantial,” and > 0.80 “almost perfect.”
Cohen’s κ was deliberately excluded from our evaluation because it offers little independent information beyond existing confusion–matrix–based metrics in the context of extreme class imbalance. Our study employs the F₂ score to capture threshold-specific recall-weighted performance, the MCC for chance-corrected balance, ROC-AUC and PR-AUC for threshold-agnostic discrimination, and the H-measure for cost-sensitive integration. Since κ and MCC both correct for class-marginal effects and in practice produce virtually identical classifier rankings on ultra-skewed data, including κ would have been redundant and risked obscuring the clarity of our comparative analysis.
1.3. Contribution of the Study
Prior work has highlighted metric pitfalls in imbalanced learning [19, 23, 29], arguing that PR curves/PR-AUC are more informative than ROC on skewed data and that MCC is preferable to accuracy/F1; some even propose replacing ROC-AUC outright with MCC. Yet, we still lack a statistically rigorous, cross-domain comparison of ROC-AUC against MCC, F₂, PR-AUC, and the H-measure under ultra-imbalanced prevalence and realistic resampling pipelines. Saito & Rehmsmeier focus on PRC vs. ROC in imbalance but do not examine MCC or H-measure or analyze sampler–classifier pipelines. Chicco & Jurman advocate MCC over accuracy/F1 but do not position MCC against ROC-AUC/PR-AUC/H-measure in rare-event scenarios or under resampling. Chicco & Jurman argue MCC vs. ROC-AUC conceptually, without an empirical, multi-metric treatment combining rare-event settings, resampling, and statistical testing. Meanwhile, Richardson et al. reopen the debate by contending that ROC-AUC remains robust under imbalance while PR-AUC is prevalence-sensitive—an observation that, rather than endorsing a single “best” metric, motivates a multi-metric protocol that separates ranking from cost and thresholding. In response, we deliver a multi-metric, cost-aligned package—MCC and F₂ (primary threshold-dependent metrics) with PR-AUC (threshold-free ranking) and H-measure (principled cost integration)—evaluated in ultra-imbalanced (<3%) regimes across resampling pipelines and supported by bootstrap confidence intervals, DeLong’s tests, Kendall’s τ, and Friedman–Nemenyi analyses; we also include a prevalence-sensitivity check showing how shifts in class balance affect PR-AUC and H-measure on our datasets, reinforcing the need to report complementary metrics rather than rely on ROC-AUC alone.
To address this gap, we conduct a cross-domain analysis of 20 classifier–sampler configurations per dataset—four classifiers (logistic regression, random forest, XGBoost, and CatBoost) crossed with five sampling strategies (no oversampling, SMOTE, Borderline-SMOTE, SVM-SMOTE, and ADASYN)—on three rare-event benchmarks: credit-card fraud (0.17% positives), yeast protein localization (POX) (1.35%), and ozone exceedance (≈3%).
Our contributions are fourfold:
- Empirical characterization of ROC-AUC in rare-event regimes. We quantify ceiling effects and show that ROC-AUC can overstate model quality by remaining relatively insensitive to operationally costly misclassifications when prevalence is <3%, even as false positives and false negatives vary substantially across pipelines.
- A pragmatic, cost-aware multi-metric alternative. Using Kendall’s τ rankings and paired significance testing, we show that MCC and F₂ better reflect asymmetric error costs and deployment priorities. In contrast, PR-AUC (threshold-free ranking) and the H-measure (principled cost weighting) provide complementary views. We distill this into a portable reporting protocol: use MCC + F₂ as primaries, with PR-AUC + H-measure as companions; report ROC-AUC only with explicit caveats in ultra-imbalanced settings.
- Statistically rigorous, resampling-aware evaluation. We pair model selection with robust inference—stratified bootstrap confidence intervals, DeLong’s tests for ROC-AUC, Kendall’s τ for rank concordance, and Friedman–Nemenyi critical-difference analysis—to reveal practically meaningful differences that ROC-AUC alone can mask.
- Actionable guidance for practitioners and researchers. We provide a replicable framework for evaluating classifiers under extreme class imbalance that integrates threshold-dependent (MCC/F₂) and threshold-free (PR-AUC/H-measure) metrics, aligns with stakeholder cost asymmetries, and transfers across domains (finance, bioinformatics, environmental monitoring).
These contributions move beyond single-metric advocacy toward a multi-metric, cost-aligned evaluation protocol empirically validated in ultra-imbalanced, real-world scenarios.
2. Related Work
Quantitative comparison of performance metrics has
attracted sustained interest because the choice of metric can alter scientific
conclusions and deployment decisions. Early empirical surveys [31, 32]
catalogued divergences among accuracy, ROC-based, and cost-based criteria,
noting that overall accuracy
is dominated by the majority class when
For instance, Hanley and McNeil justified ROC-AUC as the probability that a randomly chosen positive receives a higher score than a randomly chosen negative. However, Hand showed that AUC implicitly assigns unequal, prevalence-dependent misclassification costs, violating many decision contexts. Building on that critique, Davis and Goadrich derived the monotone transformation that maps any ROC point (FPR, TPR) to (R, P) space and proved that the PR curve dominates ROC when . Saito and Rehmsmeier
confirmed the theoretical claim with biomedical data, where ROC-AUC varied less
than 0.02 while PR-AUC varied over 0.50 for the same algorithms. Very recent
work has reopened the debate. Richardson et al. contend, via simulation and an
epitope-prediction case study, that ROC-AUC remains robust to imbalance,
whereas PR-AUC “over-penalises” legitimate classifiers. Their critique hinges
on the fact that precision is a function of both TPR and prevalence, making
PR-AUC sensitive to evaluation-set sampling. Conversely, Zhang and Geng
demonstrate that PR-AUC’s prevalence sensitivity is a feature, not a bug, when
the deployment environment shares the same class skew. The persisting
disagreement underscores the need for multi-metric reporting.
The MCC was initially proposed for protein secondary-structure prediction [22]. Chicco and Jurman provided simulations and genomics case studies where MCC ranked classifiers more consistently with domain utility than F1 or balanced accuracy. In 2023, these authors argued that MCC should replace ROC-AUC as the “standard statistic” for binary classification, citing ROC’s hidden cost bias and MCC’s symmetry. Itaya et al. derived asymptotic confidence intervals for single and paired MCC estimates, enabling formal hypothesis testing between classifiers.
Elkan formalised expected cost (EC)
arguing that threshold choice must minimise EC under a user-supplied cost matrix. Hernández-Orallo extended ROC analysis to dominance curves, constructing the convex hull of cost points to identify potentially optimal classifiers under all cost/prevalence pairs. Hand proposed H-measure, integrating EC over a beta-distributed cost parameter to mitigate AUC’s hidden-cost flaw.
While discrimination metrics assess ranking, Niculescu-Mizil and Caruana compared log-loss
with Brier score and AUC, showing that well-calibrated probabilities can be critical for cost-sensitive decisions even when AUC is
identical. Flach and Kull further decomposed log-loss into calibration and refinement components, providing diagnostic insight omplementary to ROC analysis.
He and Garcia reviewed algorithmic and evaluation issues in imbalanced learning, recommending PR-AUC and G-mean. More recently, Blagus and Lusa demonstrated that with β>1 is preferable to F1 for rare disease prediction, and Imani et al. [41,42] examined how varying class-imbalance ratios affect classifier performance and the apparent efficacy of resampling (e.g., SMOTE and its variants), evaluating both threshold-dependent and threshold-free metrics, including ROC-AUC, PR-AUC, MCC, F1-score, and Cohen’s κ. Complementing these findings, a comprehensive churn-prediction review reports that ROC-AUC remains one of the most commonly reported metrics in practice, reflecting established reporting conventions in the literature [43]. This persistence motivates providing clearer guidance on metric selection under class imbalance.
3. Datasets
This study evaluates classifier performance on three publicly available benchmark datasets exhibiting extreme class imbalance, see Table 1. Prior to modelling, all features were standardized to zero mean and unit variance. As is common in many operational settings, no instance-level cost annotations were available. Details of each dataset are provided in Subsections 3.1–3.3.
- European Credit-Card Fraud Detection: This widely studied dataset comprises 284807 card-transaction records, of which 492 are confirmed frauds (imbalance rate ≈ 0.17 %). Each observation is represented by 28 principal components derived from the original monetary attributes.
- UCI Yeast Protein Localisation (“POX”): The UCI Yeast benchmark contains 1484 protein sequences described by eight physicochemical descriptors. The minority class “POX” appears in only 20 instances (≈ 1.35 %).
- UCI Ozone Level Detection: This dataset consists of 2536 hourly measurements of atmospheric conditions, each with 73 features, and 57 recorded ozone-exceedance events (≈ 3 %).
3.1. Fraud Dataset (Credit-Card Fraud Detection)
The Credit-Card Fraud Detection dataset comprises 284807 credit-card transactions made by European cardholders over a two-day period in September 2013 [43]. Only 492 transactions are labelled as fraudulent, representing approximately 0.17 % of the data. Each record consists of 31 features, 28 anonymized principal components (V1–V28) obtained via PCA to preserve confidentiality, a “Time” feature (seconds elapsed since the first transaction), and “Amount” (transaction value in Euros). The target column “Class” takes the value 0 for legitimate transactions and 1 for fraud.
Because PCA was used to mask original feature identities, V1–V28 do not have explicit semantic meaning; nevertheless, they capture the essential structure distinguishing fraudulent from legitimate activity [44]. The extreme rarity of fraud events underscores why this dataset is a standard benchmark in imbalanced-learning research [19].
3.2. Yeast Dataset (UCI version; POX Subset)
The Yeast dataset is available from the UCI Machine Learning Repository [45]. Initially, each of the 1484 instances and 11 features describes characteristics of proteins via eight continuous features and a single “Localization” label that can take one of ten categories (CYT, NUC, MIT, ME1, ME2, ME3, EXC, VAC, POX, ERL). Of particular interest is the POX class, which appears only 20 times (≈1.35%) out of 1484 instances [45].
Since the UCI version encodes localization as a single categorical field, we extract the POX cases and recode them as the positive class (1), with all other localizations merged into a single negative class (0). This one-versus-all transformation yields a binary problem with POX representing 1.35% of instances—thus serving as a rare-class benchmark in line with prior literature [47].
3.3. Ozone Dataset
The one-hour ozone exceedance dataset originates from the UCI Machine Learning Repository’s Air Quality Evaluation collection [46], capturing 2536 timed atmospheric chemistry and meteorology observations recorded at an urban monitoring station in California across multiple summer seasons. Each record includes a suite of 73 continuous features—such as temperature, barometric pressure, wind speed, relative humidity, and concentrations of nitrogen oxides (NOx), hydrogen cyanide (HCN), and volatile organic compounds—paired with a binary target indicating whether the one-hour average ozone (O₃) concentration exceeded the regulatory threshold of 0.08 ppm.
Following preprocessing, entries with missing values are discarded, and the original timestamp column is removed to focus purely on predictive measurements. To conform with prevalent imbalance-learning benchmarks, a literature-standard split retains all 57 confirmed class 1 instances and randomly selects the corresponding 1791 class 0 instances, producing an extreme imbalance ratio of 31.4:1. Prior to model training, all features are standardized to zero mean and unit variance, and the data are partitioned into stratified training and testing subsets that preserve the native class proportions. The pronounced skew toward non-exceedance cases underscores the challenges of rare-event prediction. This dataset is
particularly suitable for evaluating sampling techniques, ensemble methods, and cost-sensitive learning algorithms.
3.4. Data Preprocessing
Data preprocessing was conducted uniformly across all three
datasets to facilitate fair comparison under severe class imbalance. To prevent
label leakage, the target label was excluded from the test set’s feature matrix
for each dataset. All preprocessing and resampling steps were fitted on the
training split only, and the resulting fitted preprocessors (e.g., scalers,
encoders) were then applied to the test features; no statistics were
re-estimated on the test data, and the test labels were used solely for final
evaluation. In the Credit Card Fraud dataset, the “Time” feature was excluded
to avoid confounding with temporal dependence under static resampling.
Transaction amounts exhibited extreme right skew and were log-transformed via
Subsequently, all 29 features were standardized to zero mean and unit variance [49]. A stratified train–test split (70%/30%) preserved the original 0.17 % fraud ratio, with oversampling techniques applied exclusively to the training subset [44].
The multi-class localization labels were recoded into a binary target in the UCI Yeast dataset, assigning label 1 to the “POX” class and 0 to all other localizations.
This yielded 20 positive and 1464 negative instances (≈ 1.35 %). The eight continuous features were standardized via z-score normalization to ensure equal weighting in distance-based sampling. A stratified 70%/30% train–test split was performed, maintaining the class ratio in both sets, with oversampling restricted to the training partition [45].
The UCI Ozone Level Detection dataset underwent complete-case analysis: any record containing missing values was removed, reducing the sample from 2536 to 1848 observations. The timestamp column was dropped to avoid non-numeric data in subsequent analyses. A literature-standard subset was constructed by retaining all 57 positive instances and randomly sampling 1791 negatives to achieve an imbalance ratio of 31.4:1. All 73 features were standardized to zero mean and unit variance. Finally, a stratified split (70% training, 30% testing) preserved the class distribution, with oversampling applied solely to the training set.
4. Methods
Our goal was to examine how alternative evaluation metrics behave when the minority class is vanishingly rare, and to test whether a small, theory-driven bundle of metrics can travel intact across disparate application areas. We therefore built a deliberately symmetrical experimental protocol: one script, three datasets, twenty classifier–sampler variants, one set of metrics, and one statistical lens. This section walks through each step.
4.1. Classifier-Sampling Framework
All experiments were conducted in Python 3.11 using scikit-learn 1.5, imbalanced-learn 0.12, CatBoost 1.3, and XGBoost 2.0. We evaluated four classifiers—logistic regression (LR) with L₂ regularization, Random Forest (RF) with 300 trees (RF), XGBoost (XGB) with depth = 6 and learning rate η = 0.1, and CatBoost with 500 iterations (CB)—each under one baseline (no oversampling) and four oversampling techniques (SMOTE, Borderline-SMOTE, SVM-SMOTE, and ADASYN). This yields unique classifier–sampler configurations per dataset. We applied these 20 configurations independently to each of the three datasets, for a total of 60 model evaluations.
Performance for each configuration was estimated via stratified 10-fold cross-validation. Oversampling was applied only to the training set within each fold to avoid information leakage. We recorded ROC-AUC, PR-AUC, the H-measure, MCC, F₂-score, and the raw confusion-matrix counts from every run.
4.2. Rank-correlation Analysis Between Metrics
To quantify how consistently the candidate metrics rank the 60 classifier-sampler configurations, we computed the pair-wise Kendall rank correlation coefficient τ ([50]) for every metric pair .
Let and denote the values of metrics and for configuration .Kendall’s statistic is
The numerator counts concordant minus discordant configuration pairs, and the denominator is the total number of unordered pairs.
Kendall’s rank-correlation coefficient (τ) is preferred to the Pearson product-moment coefficient (r) for assessing agreement among evaluation metrics in highly imbalanced learning because it aligns with the methodological aim—comparing metric-induced rankings rather than raw magnitudes. Kendall τ is a non-parametric statistic that depends only on the ordering of observations; it remains invariant under any strictly monotone transformation of the metric scores and is therefore insensitive to the heterogeneous, bounded scales of MCC (-1 … 1), PR-AUC (0 … 1), and ROC-AUC (0 … 1) [51]. Unlike , which assumes joint normality and homoscedasticity, τ makes no distributional assumptions and is robust to the heavy skew, ceiling effects, and frequent ties (e.g., TP = 0, FP = 0 → identical MCC) that characterise rare-event experiments. Furthermore, τ admits an intuitive probabilistic interpretation—τ = 0.60 implies 80 % concordant versus 20 % discordant pairs—facilitating substantive discussion of metric concordance. These properties render Kendall’s coefficient a statistically reliable and conceptually faithful measure for ranking-consistency studies under extreme class imbalance [50,52].
4.3. Statistical Testing and Confidence Intervals
We generated 95 % confidence intervals (CIs) for each metric via a stratified bootstrap (2000 replicates per test fold, preserving class prevalence). ROC-AUC differences between any two classifier-sampler configurations were evaluated with the paired-sample DeLong test ([53]), and p-values are reported. When comparing more than two methods, we applied the Friedman aligned-ranks test followed by the Nemenyi Critical-Difference (CD) procedure (α = 0.05).
5. Results and Discussions
This section presents a detailed empirical investigation into the performance of twenty classifier–sampler configurations across three highly imbalanced datasets: credit card fraud detection, Yeast protein localization, and Ozone level detection. Under extreme class imbalance, the primary objective is to examine the sensitivity and reliability of five evaluation metrics—ROC-AUC, PR-AUC, F₂-score, MCC, and H-measure. Rather than comparing classifiers per se, the focus lies on understanding how each metric responds to variations in false positives and false negatives induced by different sampling techniques. Results highlight notable inconsistencies in ROC-AUC’s ability to reflect practical performance costs, whereas alternative metrics demonstrate more substantial alignment with operational realities and domain expert expectations.
5.1. Detailed Per-dataset Results (Fraud Dataset)
This section contrasts the behaviour of twenty classifier–sampler configurations on three thematically unrelated yet similarly skewed datasets: the credit-card fraud collection, the Yeast protein-localisation set, and the Ozone Level Detection.
5.1.1. Fraud Dataset
Table 2 presents the results of 20 distinct classifier–sampler configurations, including the corresponding confusion matrix components and five evaluation metrics, and all evaluations were conducted on the test set (unseen data) of the Fraud dataset. Since the study’s objective is metric evaluation, not model comparison, we examine how each metric responds to the dramatic swings in FP and FN counts that arise under extreme class-imbalance. The empirical evaluation conducted on the Fraud dataset demonstrates clearly the limitations inherent in relying on ROC-AUC as an evaluation metric for rare-event binary classification tasks. Although ROC-AUC scores across various classifiers and sampling methods remain consistently high, a deeper inspection of the performance using alternative metrics reveals significant shortcomings in ROC-AUC’s reliability for highly imbalanced datasets.
Taking the Logistic Regression classifier with ADASYN sampling as a notable example, the ROC-AUC score is observed to be impressively high at 0.968. However, this apparently robust performance contrasts with extremely poor values for other critical metrics: an F2-score of just 0.090, MCC of 0.126, and an H-measure of 0.638. Further exacerbating this discrepancy is the notably large number of false positives (FP=6595), illustrating clearly that the ROC-AUC cannot adequately penalize the misclassification of negative class instances.
Similarly, another striking contradiction is observed when examining LR with SMOTE sampling. Despite achieving a high ROC-AUC score of 0.968, this combination demonstrates poor F2 (0.237), MCC (0.227), and H-measure (0.651) scores, compounded by an extremely high false positive rate (FP=2019). This trend persists across multiple combinations, highlighting ROC-AUC’s inability to reflect meaningful performance deficiencies in classifiers when dealing with highly imbalanced datasets.
The inconsistency in performance indicated by ROC-AUC compared to more practically relevant metrics is further exemplified by the LR classifier combined with Borderline-SMOTE sampling, where an acceptable ROC-AUC score of 0.935 is recorded. Nonetheless, substantial performance issues arise, as clearly evidenced by an F2-score of 0.448, MCC of 0.360, and H-measure of 0.558, coupled with a high false positive count (FP=647). These results underscore the critical failure of ROC-AUC in capturing and penalizing the actual misclassification cost associated with rare-event classes.
Conversely, metrics such as MCC, F2, and H-measure exhibit greater consistency in identifying performance inadequacies, effectively distinguishing between well-performing and poorly performing models. For instance, the baseline Random Forest classifier achieves strong, stable performance across MCC (0.855), F2 (0.796), and H-measure (0.761) with low FP (5), clearly indicative of genuine classification effectiveness.
In summary, the empirical evidence firmly establishes that
despite its widespread use, ROC-AUC frequently offers an overly optimistic and
misleading assessment of classifier performance in highly imbalanced contexts.
Alternative metrics, specifically MCC, F2, and H-measure, are more
effective and accurate indicators of genuine predictive performance and should
be preferred in evaluation methodologies involving rare-event classification.
Table 3 summarizes the analysis conducted on the Fraud dataset, encapsulating the observed performance ranges, sensitivity to variations in false positives and false negatives, and key observations for ROC-AUC, PR-AUC, F₂-score, MCC, and H-measure. This comparative overview underscores significant discrepancies between ROC-AUC and alternative metrics, highlighting ROC-AUC's insufficient sensitivity to misclassification costs in highly imbalanced datasets.
Complementing the scalar summaries in Table 3, a concise cross-metric visualization aids interpretation. Figure 1(a)–(e) provide small-multiples radar plots that compare five evaluation criteria— F2, H-measure, MCC, ROC-AUC, and PR-AUC—for RF, LR, XGB, and CB under each resampling strategy. Axes are fixed across panels and scaled to [0, 1]; polygons report fold-wise means. The purpose is illustrative: to visualize pattern and separation across metrics, complementing the confidence-interval and rank-based analyses reported later.
Two consistent regularities are apparent across all samplers. First, ROC-AUC exhibits a ceiling effect: for every classifier and sampler, the ROC-AUC spoke lies close to the outer ring, producing minimal model separation. Second, the threshold-dependent/cost-aligned metrics—MCC and F2—expose substantial differences that ROC-AUC masks. In particular, LR deteriorates sharply under synthetic-minority schemes: under SMOTE and ADASYN, the LR polygon collapses on the MCC and F2 axes while remaining near-maximal on ROC-AUC, indicating severe precision loss (inflated false positives) that does not materially affect rank-based AUC. The tree/boosted models (RF, XGB, CB) remain comparatively stable on MCC/F2 across samplers, with XGB/RF typically forming the largest polygons (i.e., strongest across the bundle).
The Baseline panel serves as a reference: ensembles
dominate on MCC/F2, while LR trails but does not collapse. Moving to
SMOTE and ADASYN, the LR degradation intensifies—MCC and F2 shrink
markedly—even though PR-AUC and H-measure decline only moderately, and ROC-AUC
stays saturated. This pattern is consistent with decision-boundary distortion
and score miscalibration induced by aggressive oversampling at a prevalence of
0.17%, which disproportionately inflates false positives at practically
relevant thresholds. Borderline-SMOTE and SVM-SMOTE show the same qualitative
behavior but with milder LR degradation; ensembles retain broad, well-rounded
polygons, reflecting robustness to these resampling variants.
Taken together, the radars visualize the complementarity
within the proposed metric bundle. PR-AUC and H-measure track the MCC/F2
separations (though less dramatically), reinforcing their role as
threshold-free and cost-sensitive companions, respectively. Conversely, the
near-constant ROC-AUC across panels underscores its limited diagnostic value in
this ultra-imbalanced setting. These visual regularities align with our
Kendall-τ concordance results (strong agreement among MCC/F2/H/PR-AUC;
weak with ROC-AUC) and the critical-difference rankings that favor tree/boosted
models. We therefore use the radars as an intuitive summary of
sampler–classifier interactions and as corroborating evidence for the central
claim: relying solely on ROC-AUC can misrepresent practical performance,
whereas a multi-metric, cost-aligned protocol reveals operationally meaningful
differences.
5.1.2. Yeast Dataset
Table 4 presents the
results of 20 distinct classifier–sampler configurations, including the
corresponding confusion matrix components and five evaluation metrics, and all
evaluations were conducted on the test set (unseen data) of the Yeast dataset.
The empirical evaluation conducted on the Yeast dataset clearly demonstrates
the limitations inherent in relying on ROC-AUC as an evaluation metric for
rare-event binary classification tasks. Although ROC-AUC scores across various
classifiers and sampling methods frequently appear stable or relatively high,
deeper analysis using alternative metrics uncovers significant shortcomings in
ROC-AUC’s reliability for highly imbalanced datasets.
For instance, the Logistic Regression classifier combined
with SMOTE sampling yields an apparently high ROC-AUC score of 0.908. However,
this performance is contradicted sharply by considerably lower scores in
crucial alternative metrics such as F2 (0.207), MCC (0.174), and
H-measure (0.677). The substantial false positive rate observed in this
scenario (FP=92) further highlights ROC-AUC’s inability to reflect the
practical costs associated with increased false alarms effectively.
Similarly, the XGBoost classifier combined with SMOTE
sampling produces a ROC-AUC score of 0.884, which at first glance appears
moderate. However, detailed metrics including F (0.484), MCC (0.455), and
H-measure (0.353) expose critical weaknesses in performance, particularly when
considering that even a relatively modest increase in false positives (FP=4)
can negatively impact the practical effectiveness of the model.
Additionally, analysis of the Logistic Regression
classifier with ADASYN sampling provides further evidence of ROC-AUC’s
limitations. Despite maintaining a high ROC-AUC score (0.908), this combination
demonstrates poor performance in alternative metrics: F2 at 0.146,
MCC at 0.125, and H-measure at 0.677. Moreover, this classifier configuration
suffers from an extremely high false positive count (FP=142), further
underscoring ROC-AUC’s inadequate sensitivity to misclassification costs.
Conversely, metrics such as MCC, F2, and
H-measure consistently provide a more accurate representation of classifier
performance, effectively distinguishing between models performing well and
those not. For example, the baseline Random Forest classifier achieves stable
and relatively high scores across MCC (0.608), F2 (0.536), and
H-measure (0.577) while maintaining a low false positive count (FP=1), clearly
signalling robust classification capability.
In summary, the empirical evidence from the Yeast dataset
conclusively illustrates that ROC-AUC frequently presents a misleadingly
optimistic view of classifier performance in highly imbalanced scenarios.
Alternative metrics such as MCC, F2, and H-measure emerge as more
reliable and practically meaningful model performance indicators in rare-event
classification problems.
Table 5 summarizes
the detailed analysis conducted on the Yeast dataset, presenting the
performance range, sensitivity to false positives and false negatives, and key
observations for ROC-AUC, PR-AUC, F₂-score, MCC, and H-measure. This summary
clearly highlights ROC-AUC’s inadequacy and supports alternative metrics’
practical relevance and greater accuracy for highly imbalanced datasets.
In addition to the scalar results in Table 5, a compact cross-metric perspective provides an integrated view. Figure 2(a)–2(e) present small-multiples radar plots for the Yeast dataset (1.35% positives), comparing F2, H-measure, MCC, ROC-AUC, and PR-AUC for RF, LR, XGB, and CB under each resampling strategy. Axes are fixed across panels, scaled to [0,1], and polygons report fold-wise means. As with the Fraud radars, the goal is illustrative: to visualize patterns and separation across metrics, complementing the following confidence-interval and rank-based analyses.
Two regularities again emerge. First, ROC-AUC remains near
the outer ring for all models and samplers, yielding limited separation.
Second, threshold-dependent/cost-aligned metrics (MCC and F2) reveal
material differences that ROC-AUC alone obscures, with PR-AUC and H-measure
generally moving in the same direction, albeit less sharply.
Dataset-specific nuances are notable. In the Baseline
panel, XGB exhibits a pronounced collapse on F2, MCC, PR-AUC, and H,
despite a high ROC-AUC spoke—an archetypal instance of AUC saturation masking
practically relevant errors. CB and LR form larger, more rounded polygons, and
RF sits in between. Under SMOTE and ADASYN, LR shows a mixed profile: PR-AUC
and H increase substantially, yet MCC (and at times F2) contracts,
indicating that oversampling improves ranking and cost-weighted separation
while simultaneously inflating false positives at decision-useful thresholds
(score–threshold miscalibration). Borderline-SMOTE moderates this tension, with
milder LR degradation on MCC/F2 and stable ensemble performance.
SVM-SMOTE yields the most balanced polygons overall—especially for LR and
CB—suggesting that margin-aware synthesis can enhance both ranking-based and
threshold-dependent metrics on Yeast.
Taken together, these radars (i) make the ROC-AUC ceiling
effect visually explicit; (ii) highlight sampler–classifier interactions that
matter operationally (e.g., XGB’s baseline collapse; LR’s oversampling
trade-offs); and (iii) show PR-AUC and H-measure qualitatively tracking the MCC/F2
separations. The visual patterns are consistent with the Kendall-τ concordance
and critical-difference rankings reported for Yeast, reinforcing the central
claim that relying solely on ROC-AUC is insufficient. In contrast, a
multi-metric, cost-aligned protocol reveals differences of practical
consequence.
5.1.3. Ozone Dataset
Table 4 presents the
results of 20 distinct classifier–sampler configurations, including the
corresponding confusion matrix components and five evaluation metrics, and all
evaluations were conducted on the Ozone dataset's test set (unseen data). The
empirical evaluation conducted on the Ozone dataset provides further compelling
evidence of the limitations inherent in using ROC-AUC as an evaluation metric
for rare-event binary classification tasks. Despite ROC-AUC scores consistently
appearing moderate to high across multiple classifiers and sampling methods,
detailed examination using alternative metrics reveals substantial shortcomings
in ROC-AUC’s reliability for highly imbalanced datasets.

Table 6.
The results on the Ozone dataset.
| Baseline | SMOTE | Borderline-SMOTE | SVM-SMOTE | ADASYN | ||||||||||||||||
|---|---|---|---|---|---|---|---|---|---|---|---|---|---|---|---|---|---|---|---|---|
| RF | LR | XGB | CB | RF | LR | XGB | CB | RF | LR | XGB | CB | RF | LR | XGB | CB | RF | LR | XGB | CB | |
| ROC-AUC | 0.882 | 0.881 | 0.875 | 0.894 | 0.863 | 0.860 | 0.879 | 0.895 | 0.833 | 0.879 | 0.874 | 0.908 | 0.856 | 0.878 | 0.864 | 0.906 | 0.854 | 0.860 | 0.884 | 0.902 |
| PR-AUC | 0.211 | 0.232 | 0.196 | 0.225 | 0.362 | 0.195 | 0.250 | 0.251 | 0.339 | 0.223 | 0.236 | 0.293 | 0.323 | 0.214 | 0.226 | 0.259 | 0.325 | 0.204 | 0.219 | 0.258 |
| F2 | 0.071 | 0.135 | 0.130 | 0.068 | 0.407 | 0.336 | 0.372 | 0.309 | 0.417 | 0.372 | 0.337 | 0.368 | 0.309 | 0.375 | 0.337 | 0.385 | 0.361 | 0.338 | 0.333 | 0.316 |
| MCC | 0.164 | 0.184 | 0.143 | 0.094 | 0.381 | 0.225 | 0.307 | 0.240 | 0.407 | 0.262 | 0.294 | 0.300 | 0.318 | 0.266 | 0.294 | 0.330 | 0.357 | 0.228 | 0.285 | 0.251 |
| H | 0.080 | 0.102 | 0.064 | 0.089 | 0.237 | 0.105 | 0.125 | 0.125 | 0.215 | 0.094 | 0.095 | 0.203 | 0.209 | 0.085 | 0.095 | 0.111 | 0.175 | 0.105 | 0.083 | 0.139 |
| FP | 1 | 4 | 7 | 4 | 11 | 57 | 19 | 23 | 9 | 44 | 15 | 20 | 8 | 43 | 15 | 16 | 9 | 56 | 16 | 21 |
| FN | 16 | 15 | 15 | 16 | 10 | 8 | 10 | 11 | 10 | 8 | 11 | 10 | 12 | 8 | 11 | 10 | 11 | 8 | 11 | 11 |
| TP | 1 | 2 | 2 | 1 | 7 | 9 | 7 | 6 | 7 | 9 | 6 | 7 | 5 | 9 | 6 | 7 | 6 | 9 | 6 | 6 |
| TN | 537 | 534 | 531 | 534 | 527 | 481 | 519 | 515 | 529 | 494 | 523 | 518 | 530 | 495 | 523 | 522 | 529 | 482 | 522 | 517 |
For example, the Logistic Regression classifier combined
with SMOTE sampling achieves an ROC-AUC of 0.860, which initially might suggest
acceptable model performance. However, this apparent performance contrasts
sharply with notably weaker results in critical alternative metrics: F2-score
at 0.336, MCC at 0.225, and H-measure at 0.105. This combination also records a
substantial false positive rate (FP=57), highlighting ROC-AUC’s failure to
capture the practical implications of increased false alarms adequately.
Similarly, XGBoost with Borderline-SMOTE achieves a
relatively moderate ROC-AUC of 0.874, but deeper inspection through alternative
metrics reveals significant shortcomings. Despite its ROC-AUC score, the
combination yields a relatively low F2-score (0.337), MCC (0.294),
and H-measure (0.095), alongside an elevated false positive count (FP=15).
These findings further underscore ROC-AUC’s inability to reflect
misclassification costs sensitively.
Another illustrative case is observed with Logistic
Regression using ADASYN sampling. The ROC-AUC score of 0.860 might initially
seem satisfactory; however, alternative metrics such as F2 (0.338),
MCC (0.228), and H-measure (0.105) clearly indicate substantial deficiencies in
performance. Moreover, the high false positive count (FP=56) strongly
emphasizes ROC-AUC’s limited sensitivity to the actual cost of
misclassification.
In contrast, metrics such as MCC, F2, and
H-measure consistently provide a more precise representation of classifier
performance by distinguishing between models performing genuinely well and
those performing inadequately. For instance, the Random Forest classifier
combined with Borderline-SMOTE sampling exhibits relatively strong and balanced
performance across MCC (0.407), F2 (0.417), and H-measure (0.215)
with a comparatively low false positive rate (FP=9), clearly indicating
effective classification performance.
In summary, empirical evidence from the Ozone dataset
strongly reinforces that ROC-AUC is often misleadingly optimistic when
assessing classifier performance in highly imbalanced scenarios. Alternative
metrics, particularly MCC, F2, and H-measure, provide a more
reliable and practical assessment of classifier effectiveness in rare-event
classification tasks.
Table 7 summarizes
the comprehensive analysis of the Ozone dataset, capturing the observed
performance ranges, sensitivity to false positive and false negative
variations, and key observations for ROC-AUC, PR-AUC, F₂-score, MCC, and
H-measure. This comparative overview reinforces ROC-AUC’s inadequacies and
underscores the greater practical relevance and accuracy of MCC, F₂, and
H-measure for assessing classifier performance on highly imbalanced datasets.
Beyond the scalar summaries in Table 7, a compact cross-metric view is useful. Figure 3(a)–3(e) show small-multiples radar plots for the Ozone dataset (≈3% positives), comparing F2, H-measure, MCC, ROC-AUC, and PR-AUC for RF, LR, XGB, and CB under each
resampling strategy. Axes are fixed across panels, scaled to [0,1], and polygons report fold-wise means. As in the prior datasets, these plots are illustrative—a compact view of pattern and separation across metrics that complements the subsequent confidence-interval
and rank-based analyses.
Two regularities recur. First, ROC-AUC lies close to the outer ring for all models and samplers, yielding limited discriminatory power among classifiers. Second, the threshold-dependent/cost-aligned metrics—MCC and F2—exhibit meaningful spread, with PR-AUC and H-measure generally moving in the same qualitative direction (though less sharply), thereby
visualizing the complementarity within the proposed metric bundle.
Dataset-specific nuances are evident. In the Baseline
panel, RF forms the broadest, most balanced polygon, leading on MCC, F2,
and PR-AUC, while CB is competitive and LR/XGB trail—despite uniformly high
ROC-AUC for all four models. Under SMOTE, polygons contract on MCC and F2
across models (with only modest changes in PR-AUC/H), indicating that naive
oversampling degrades performance at decision-relevant thresholds even as
rank-based AUC remains high. Borderline-SMOTE and SVM-SMOTE partially recover
this loss: RF again dominates on MCC/ F2, and CB closes the gap,
whereas LR/XGB improve mainly on PR-AUC/H with smaller gains on MCC/F2.
The most pronounced divergence occurs under ADASYN: LR exhibits a marked
increase in PR-AUC (and occasionally H-measure) while collapsing on MCC and F2,
a signature of oversampling-induced score/threshold miscalibration that
inflates false positives at practical operating points. In contrast, the
ensemble methods maintain relatively rounded polygons across samplers,
reflecting greater robustness to resampling variance.
Overall, the Ozone radars (i) make the ROC-AUC ceiling
effect visually explicit, (ii) reveal consequential sampler–classifier
interactions (e.g., ADASYN’s trade-off for LR), and (iii) show PR-AUC/H
qualitatively tracking the separations exposed by MCC/F2. These
visual regularities align with the Kendall-τ concordance and
critical-difference rankings reported for Ozone, reinforcing the central
conclusion that relying solely on ROC-AUC is insufficient. In contrast, a
multi-metric, cost-aligned protocol surfaces operationally meaningful
differences among models.
5.2. Cross-Domain Kendall Rank Correlations
5.2.1. Kendall Rank Correlations Between Metrics (Fraud Dataset)
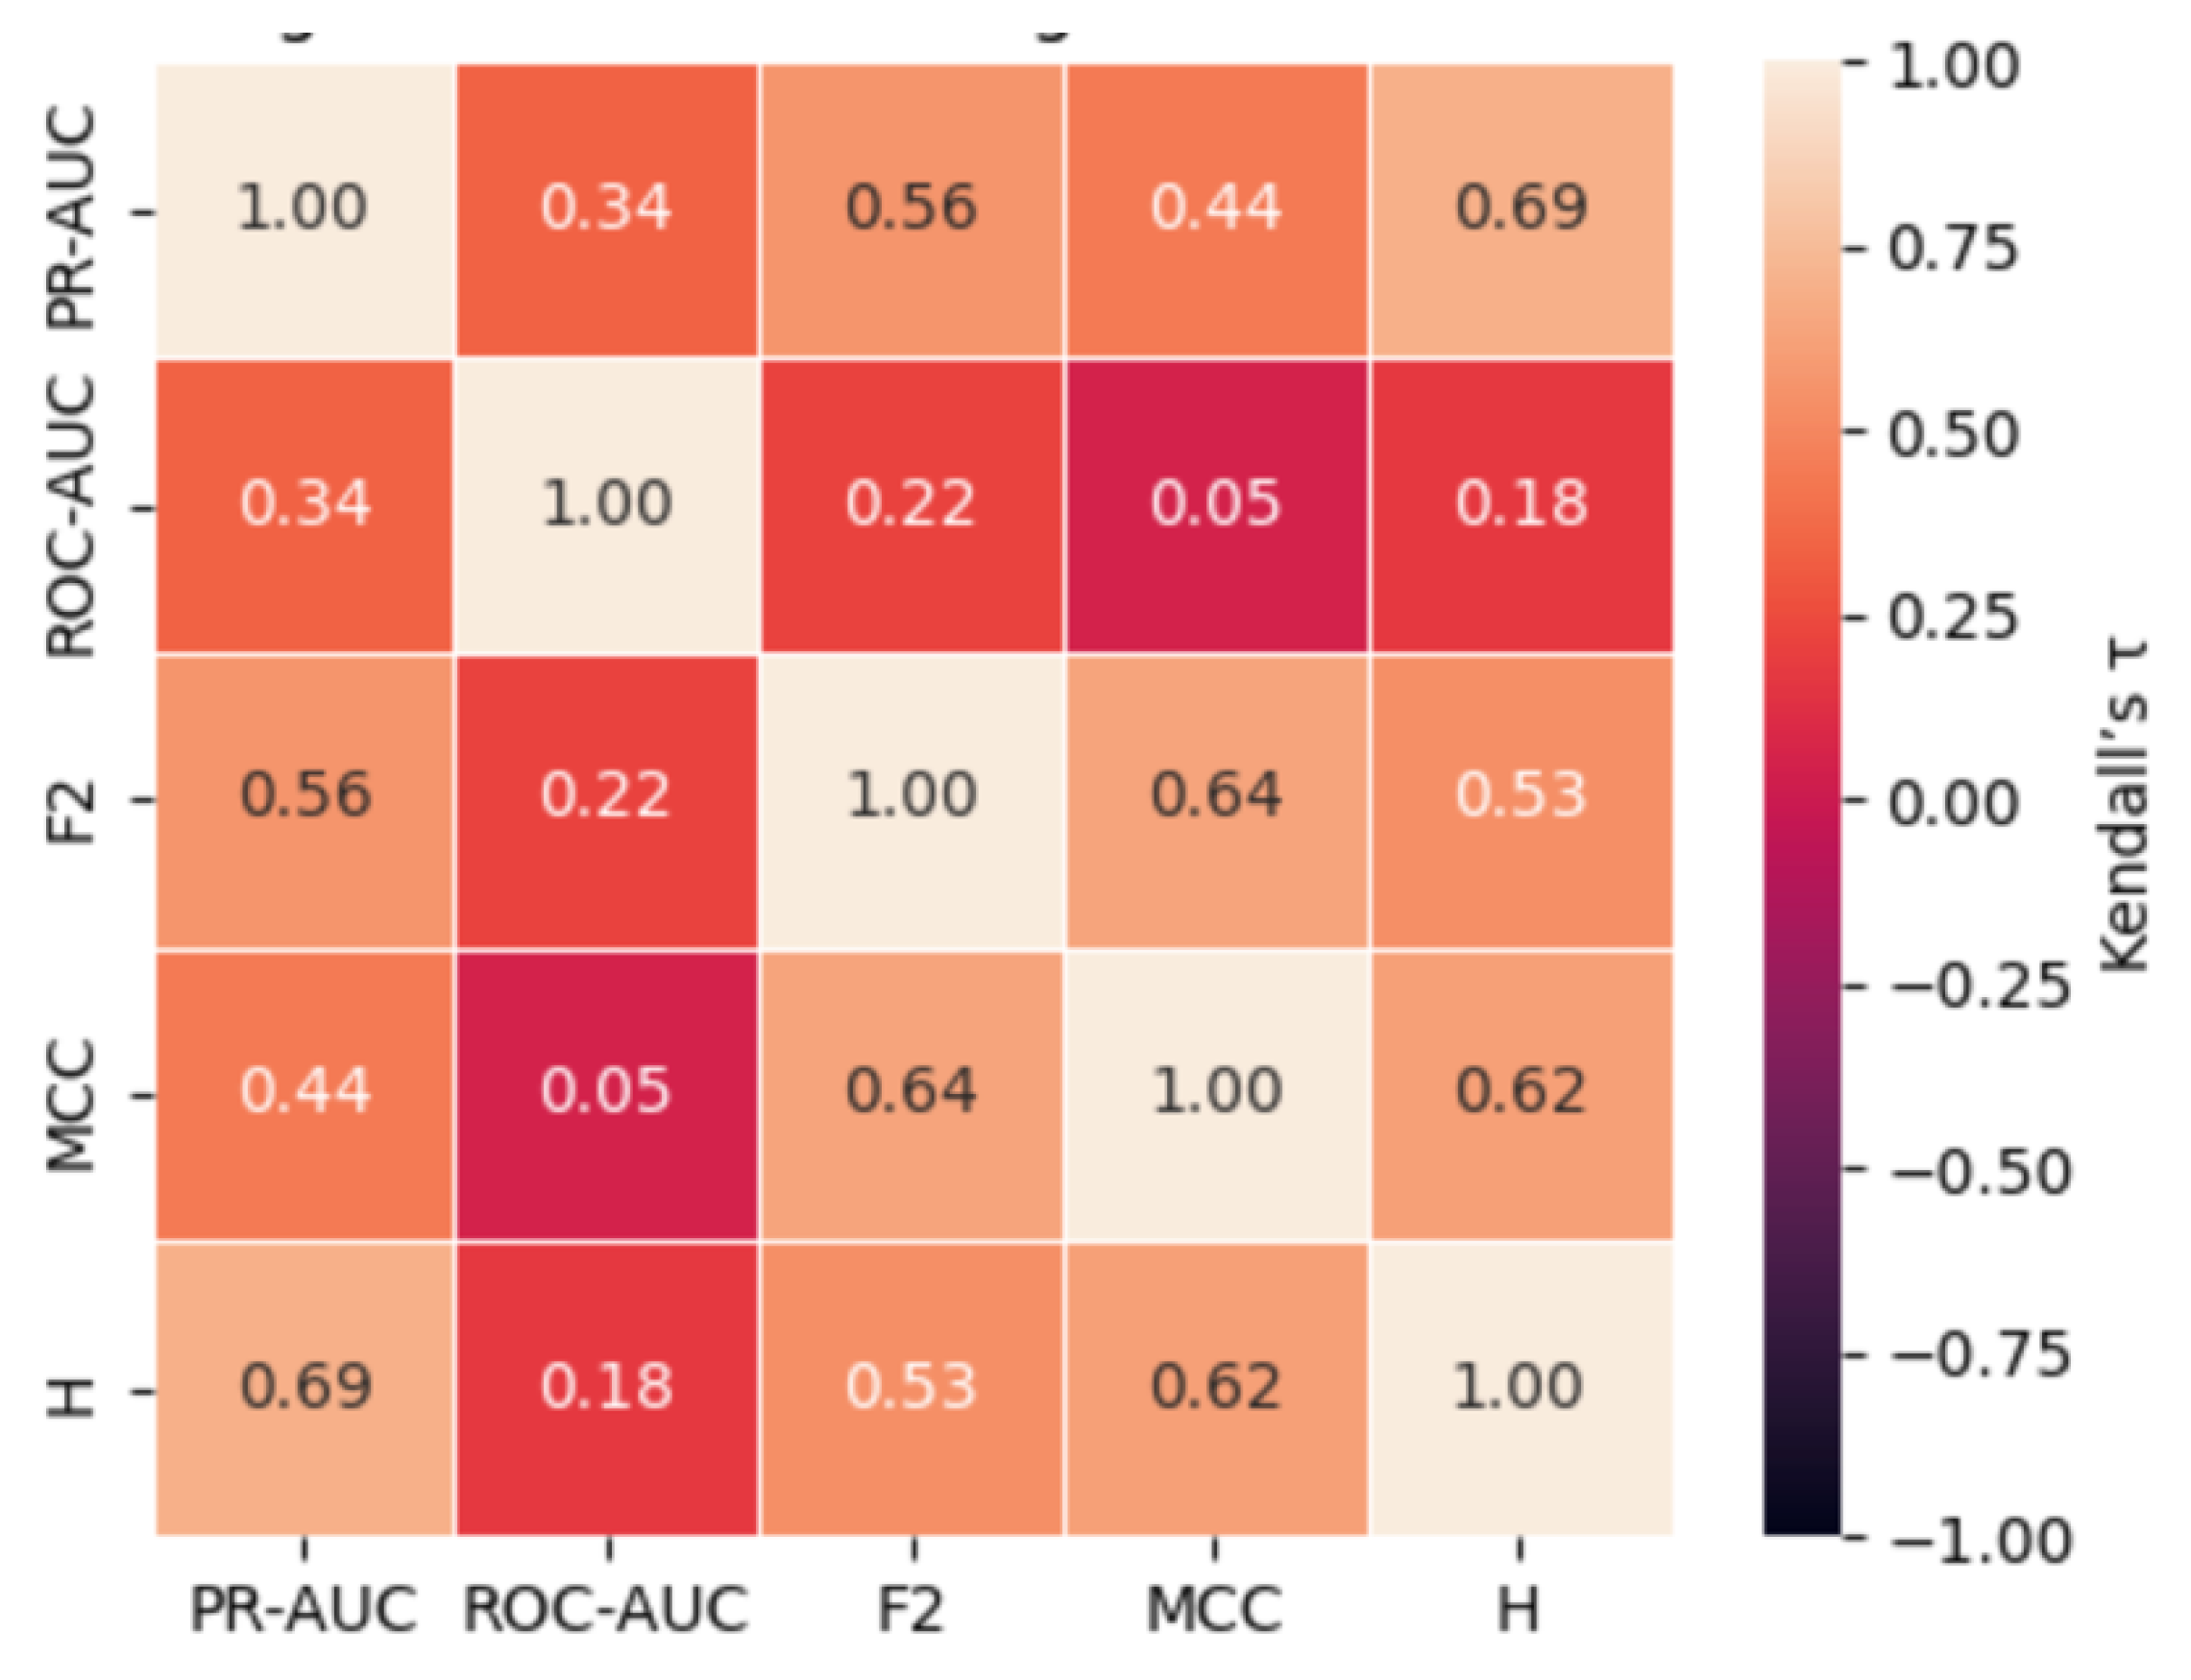
The pairwise Kendall rank correlation coefficients, summarized in Table 8 and illustrated in Fig. 4, reveal a statistically coherent structure in how the five evaluation metrics rank the 20 classifier–sampler configurations evaluated on the Fraud dataset, exhibiting a minority class prevalence of approximately 0.17%. Throughout the analysis, τ denotes Kendall’s rank correlation coefficient, and p-values refer to the two-sided significance level derived from the exact null distribution, following the formulation by Kendall [50].
An additional layer of analysis on the Fraud dataset was conducted using pairwise Kendall rank correlation coefficients (τ), accompanied by two-sided significance levels (p-values) calculated from the exact null distribution [50]. This analysis aimed to evaluate the degree of concordance between different performance metrics and further highlight the relative alignment or divergence of ROC-AUC with metrics more sensitive to rare-event classification.
The results reveal a relatively weak positive correlation between PR-AUC and ROC-AUC (τ = 0.337, p = 0.0398), suggesting that although some concordance exists, it is neither strong nor robust. This weak association supports the notion that ROC-AUC may fail to track changes in precision-recall performance under highly imbalanced conditions reliably. More notably, ROC-AUC exhibits very low and statistically insignificant correlations with F₂ (τ = 0.216, p = 0.183), MCC (τ = 0.047, p = 0.770), and H-measure (τ = 0.179, p = 0.288). These findings emphasize that ROC-AUC rankings are disconnected mainly from metrics prioritizing misclassification costs and rare-event detection effectiveness.
In contrast, strong and statistically significant
correlations are observed among the alternative metrics. PR-AUC shows
moderate-to-strong correlations with F₂ (τ = 0.565, p = 0.0005), MCC (τ =
0.438, p = 0.0071), and H-measure (τ = 0.695, p = 0.000003), indicating that
these metrics capture similar aspects of classifier performance. Similarly, F₂
correlates strongly with MCC (τ = 0.640, p = 0.000085) and H-measure (τ =
0.533, p = 0.0010), while MCC and H-measure themselves exhibit a strong
concordance (τ = 0.617, p = 0.0001).
These results highlight two critical insights: first,
ROC-AUC is weakly aligned with metrics that account for precision, recall, and
misclassification asymmetry; second, alternative metrics such as F₂, MCC, and
H-measure display substantial agreement, reinforcing their utility as
complementary and reliable indicators for performance evaluation in highly
imbalanced datasets.
Figure 4.
Kendall rank correlations (τ) heatmap between metrics on the Fraud dataset.
5.2.2. Kendall Rank Correlations Between Metrics (Yeast Dataset)
The pairwise Kendall rank correlation coefficients,
summarized in Table 9 and illustrated in
Fig. 5, reveal a statistically coherent structure in how the five evaluation
metrics rank the 20 classifier–sampler configurations evaluated on the Yeast
dataset, exhibiting a minority class prevalence of approximately 1.35%.
Throughout the analysis, τ denotes Kendall’s rank correlation coefficient, and p-values
refer to the two-sided significance level derived from the exact null
distribution, following the formulation by Kendall [50].
An additional layer of analysis on the Yeast dataset was
conducted using pairwise Kendall rank correlation coefficients (τ), accompanied
by two-sided significance levels (p-values) calculated from the exact null
distribution [50]. This analysis aimed to
assess the degree of concordance between different performance metrics and
further investigate ROC-AUC’s alignment with alternative measures sensitive to
rare-event classification.
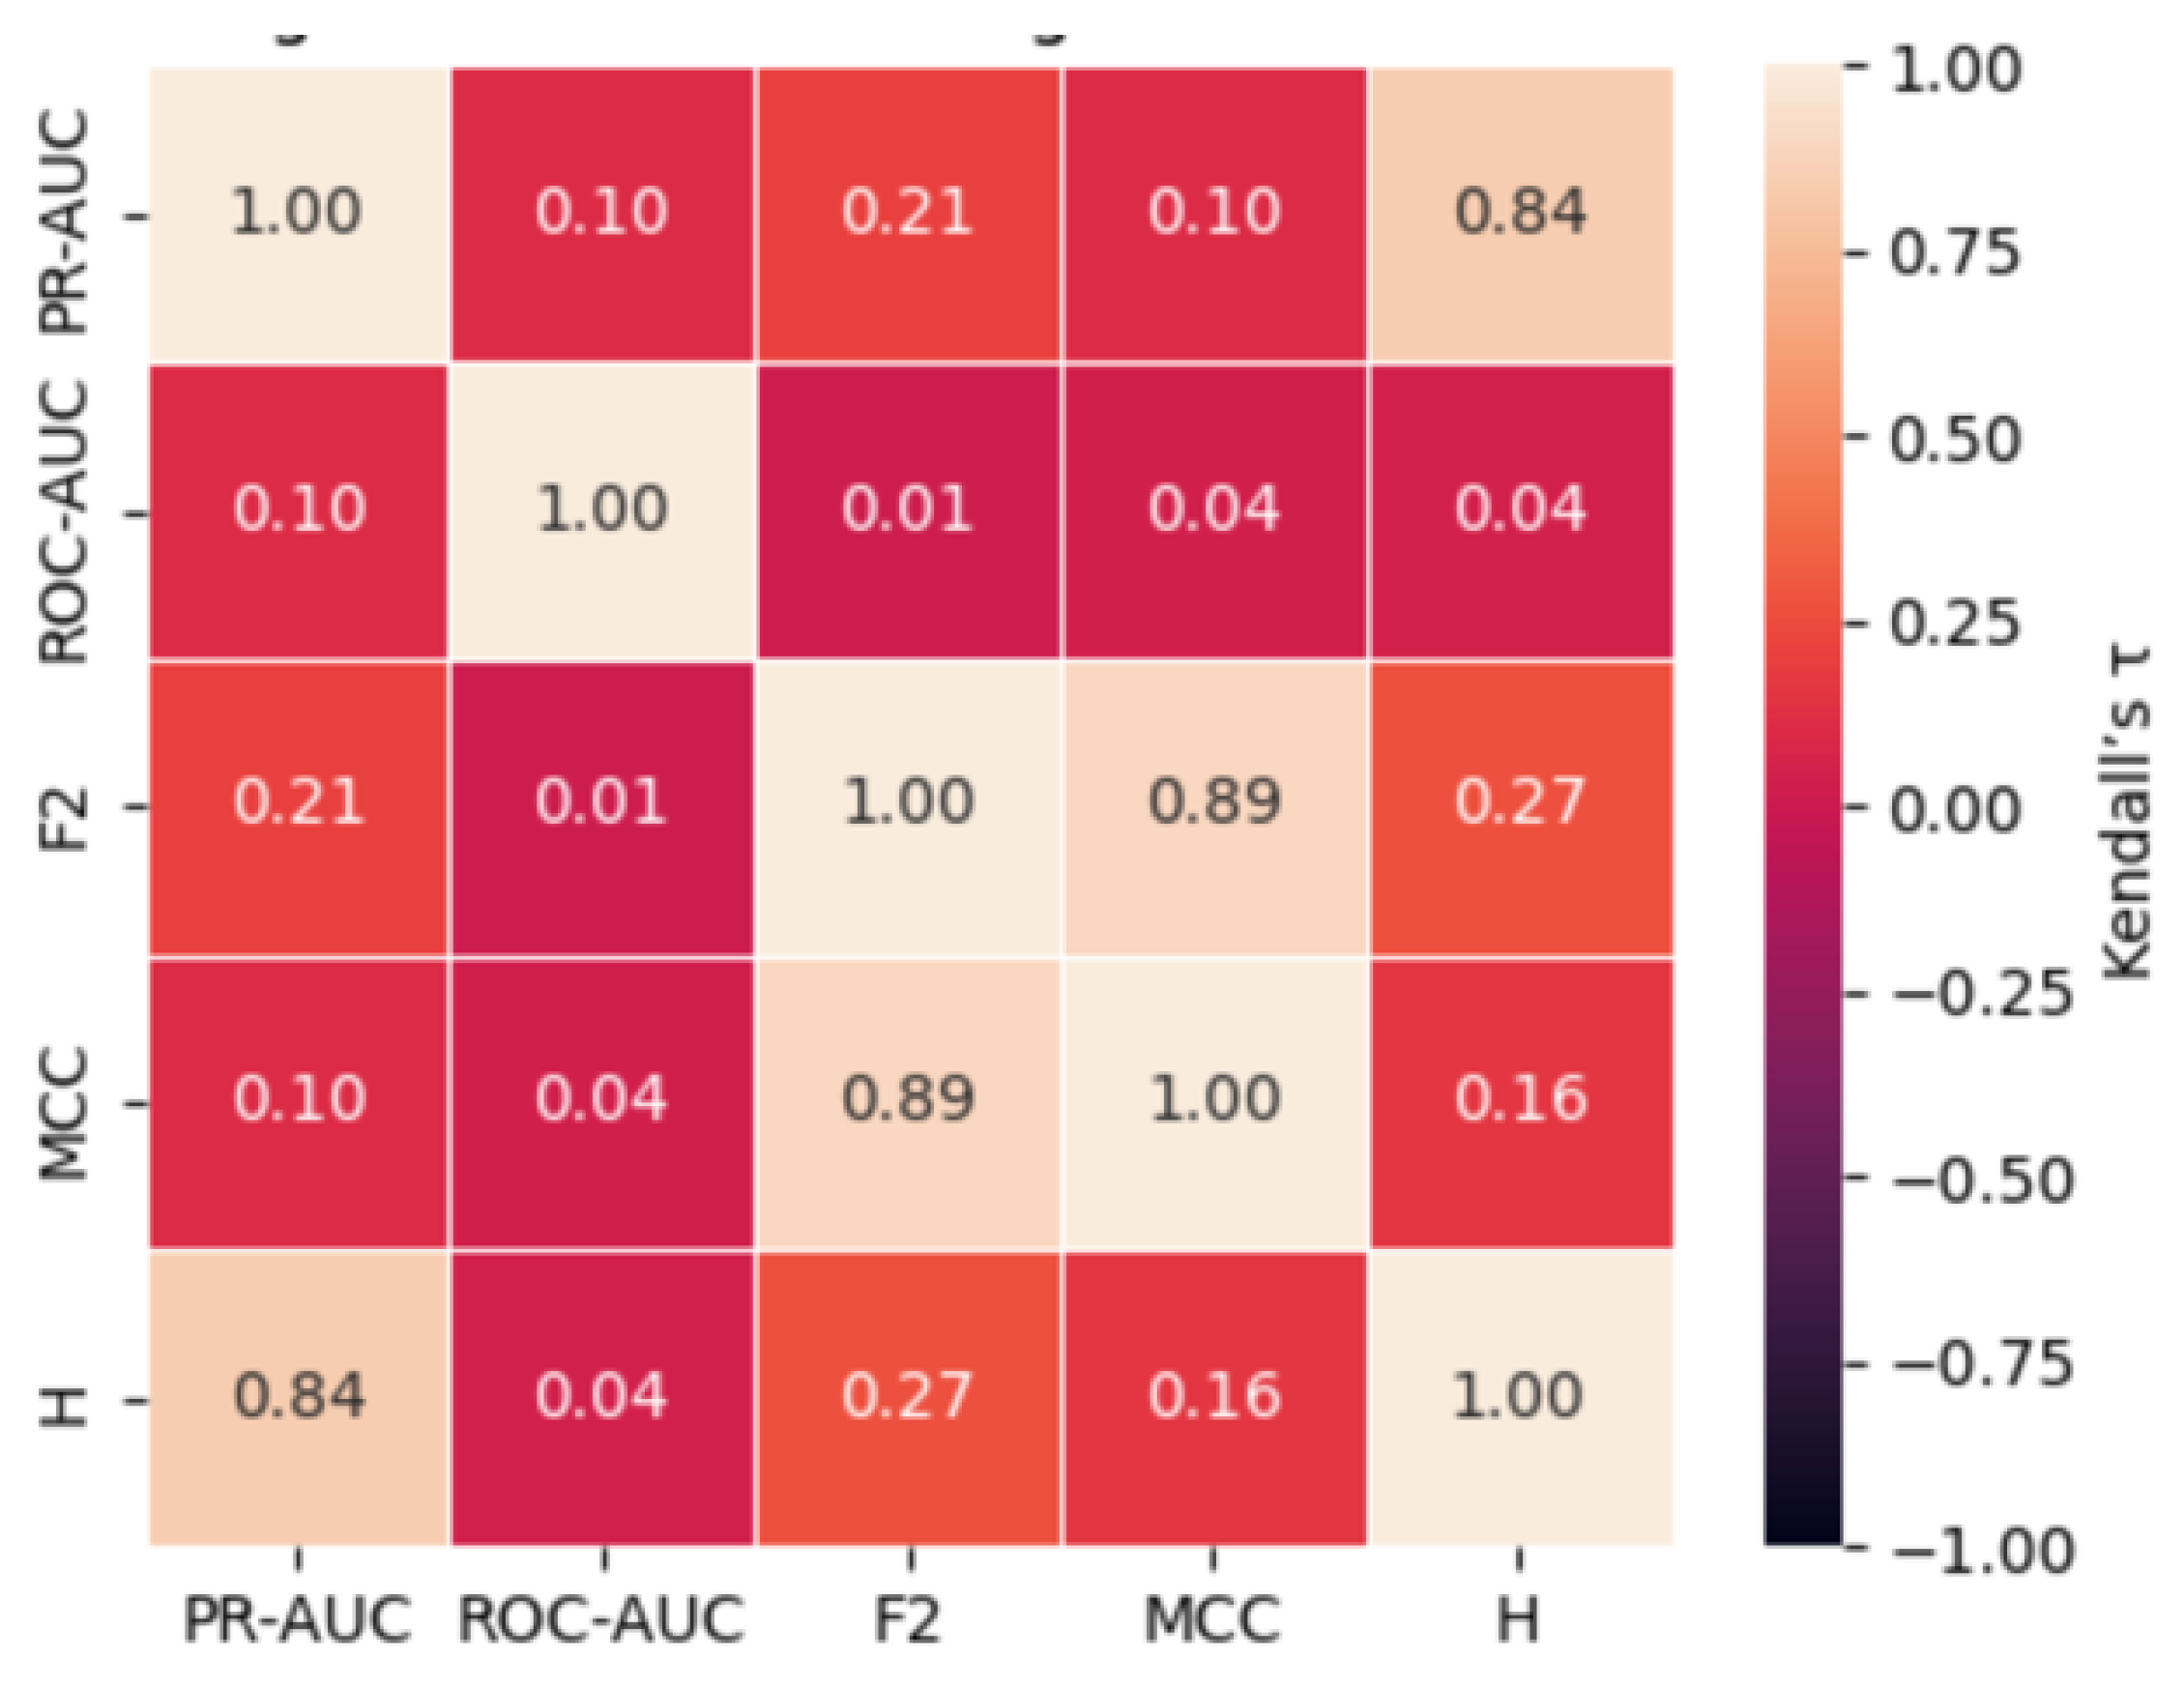
The results reveal an extremely weak and statistically
insignificant correlation between PR-AUC and ROC-AUC (τ = 0.105, p = 0.5424),
indicating a lack of meaningful concordance between these metrics. Furthermore,
ROC-AUC exhibits negligible and non-significant correlations with F₂ (τ =
0.011, p = 0.9475), MCC (τ = 0.039, p = 0.8178), and H-measure (τ = 0.043, p =
0.7947). These findings underscore the disconnect between ROC-AUC and metrics
prioritizing detecting rare events and penalizing misclassification costs.
In contrast, notable correlations are observed among
alternative metrics. PR-AUC shows a strong and statistically significant
correlation with H-measure (τ = 0.840, p < 0.0001), suggesting a high degree
of agreement in how these metrics rank classifier performance. F₂ and MCC
demonstrate a robust concordance (τ = 0.893, p < 0.0001), highlighting their
mutual sensitivity to class imbalances. However, F₂ and H-measure (τ = 0.268, p
= 0.1132) and MCC and H-measure (τ = 0.162, p = 0.3389) show weaker and statistically
non-significant associations.
Overall, these results emphasize two key insights: ROC-AUC
shows minimal alignment with alternative metrics, reinforcing its inadequacy in
highly imbalanced scenarios; and strong correlations among specific pairs of
alternative metrics—particularly F₂ and MCC—demonstrate their consistency and
relevance for evaluating classifier performance in rare-event classification
tasks.
Figure 5.
Kendall rank correlations (τ) heatmap between metrics on the Yeast dataset.
5.2.3. Kendall Rank Correlations Between Metrics (Ozone Dataset)
The pairwise Kendall rank correlation coefficients,
summarized in Table 10 and illustrated in
Fig. 6, reveal a statistically coherent structure in how the five evaluation
metrics rank the 20 classifier–sampler configurations evaluated on the Ozone
dataset, exhibiting a minority class prevalence of approximately 3.1%.
Throughout the analysis, τ denotes Kendall’s rank correlation coefficient, and p-values
refer to the two-sided significance level derived from the exact null
distribution, following the formulation by [50].
An additional layer of analysis on the Ozone dataset was
conducted using pairwise Kendall rank correlation coefficients (τ), accompanied
by two-sided significance levels (p-values) calculated from the exact null
distribution [50]. This analysis aimed to
evaluate the degree of concordance between different performance metrics and to
assess ROC-AUC’s alignment with alternative measures sensitive to rare-event
classification.
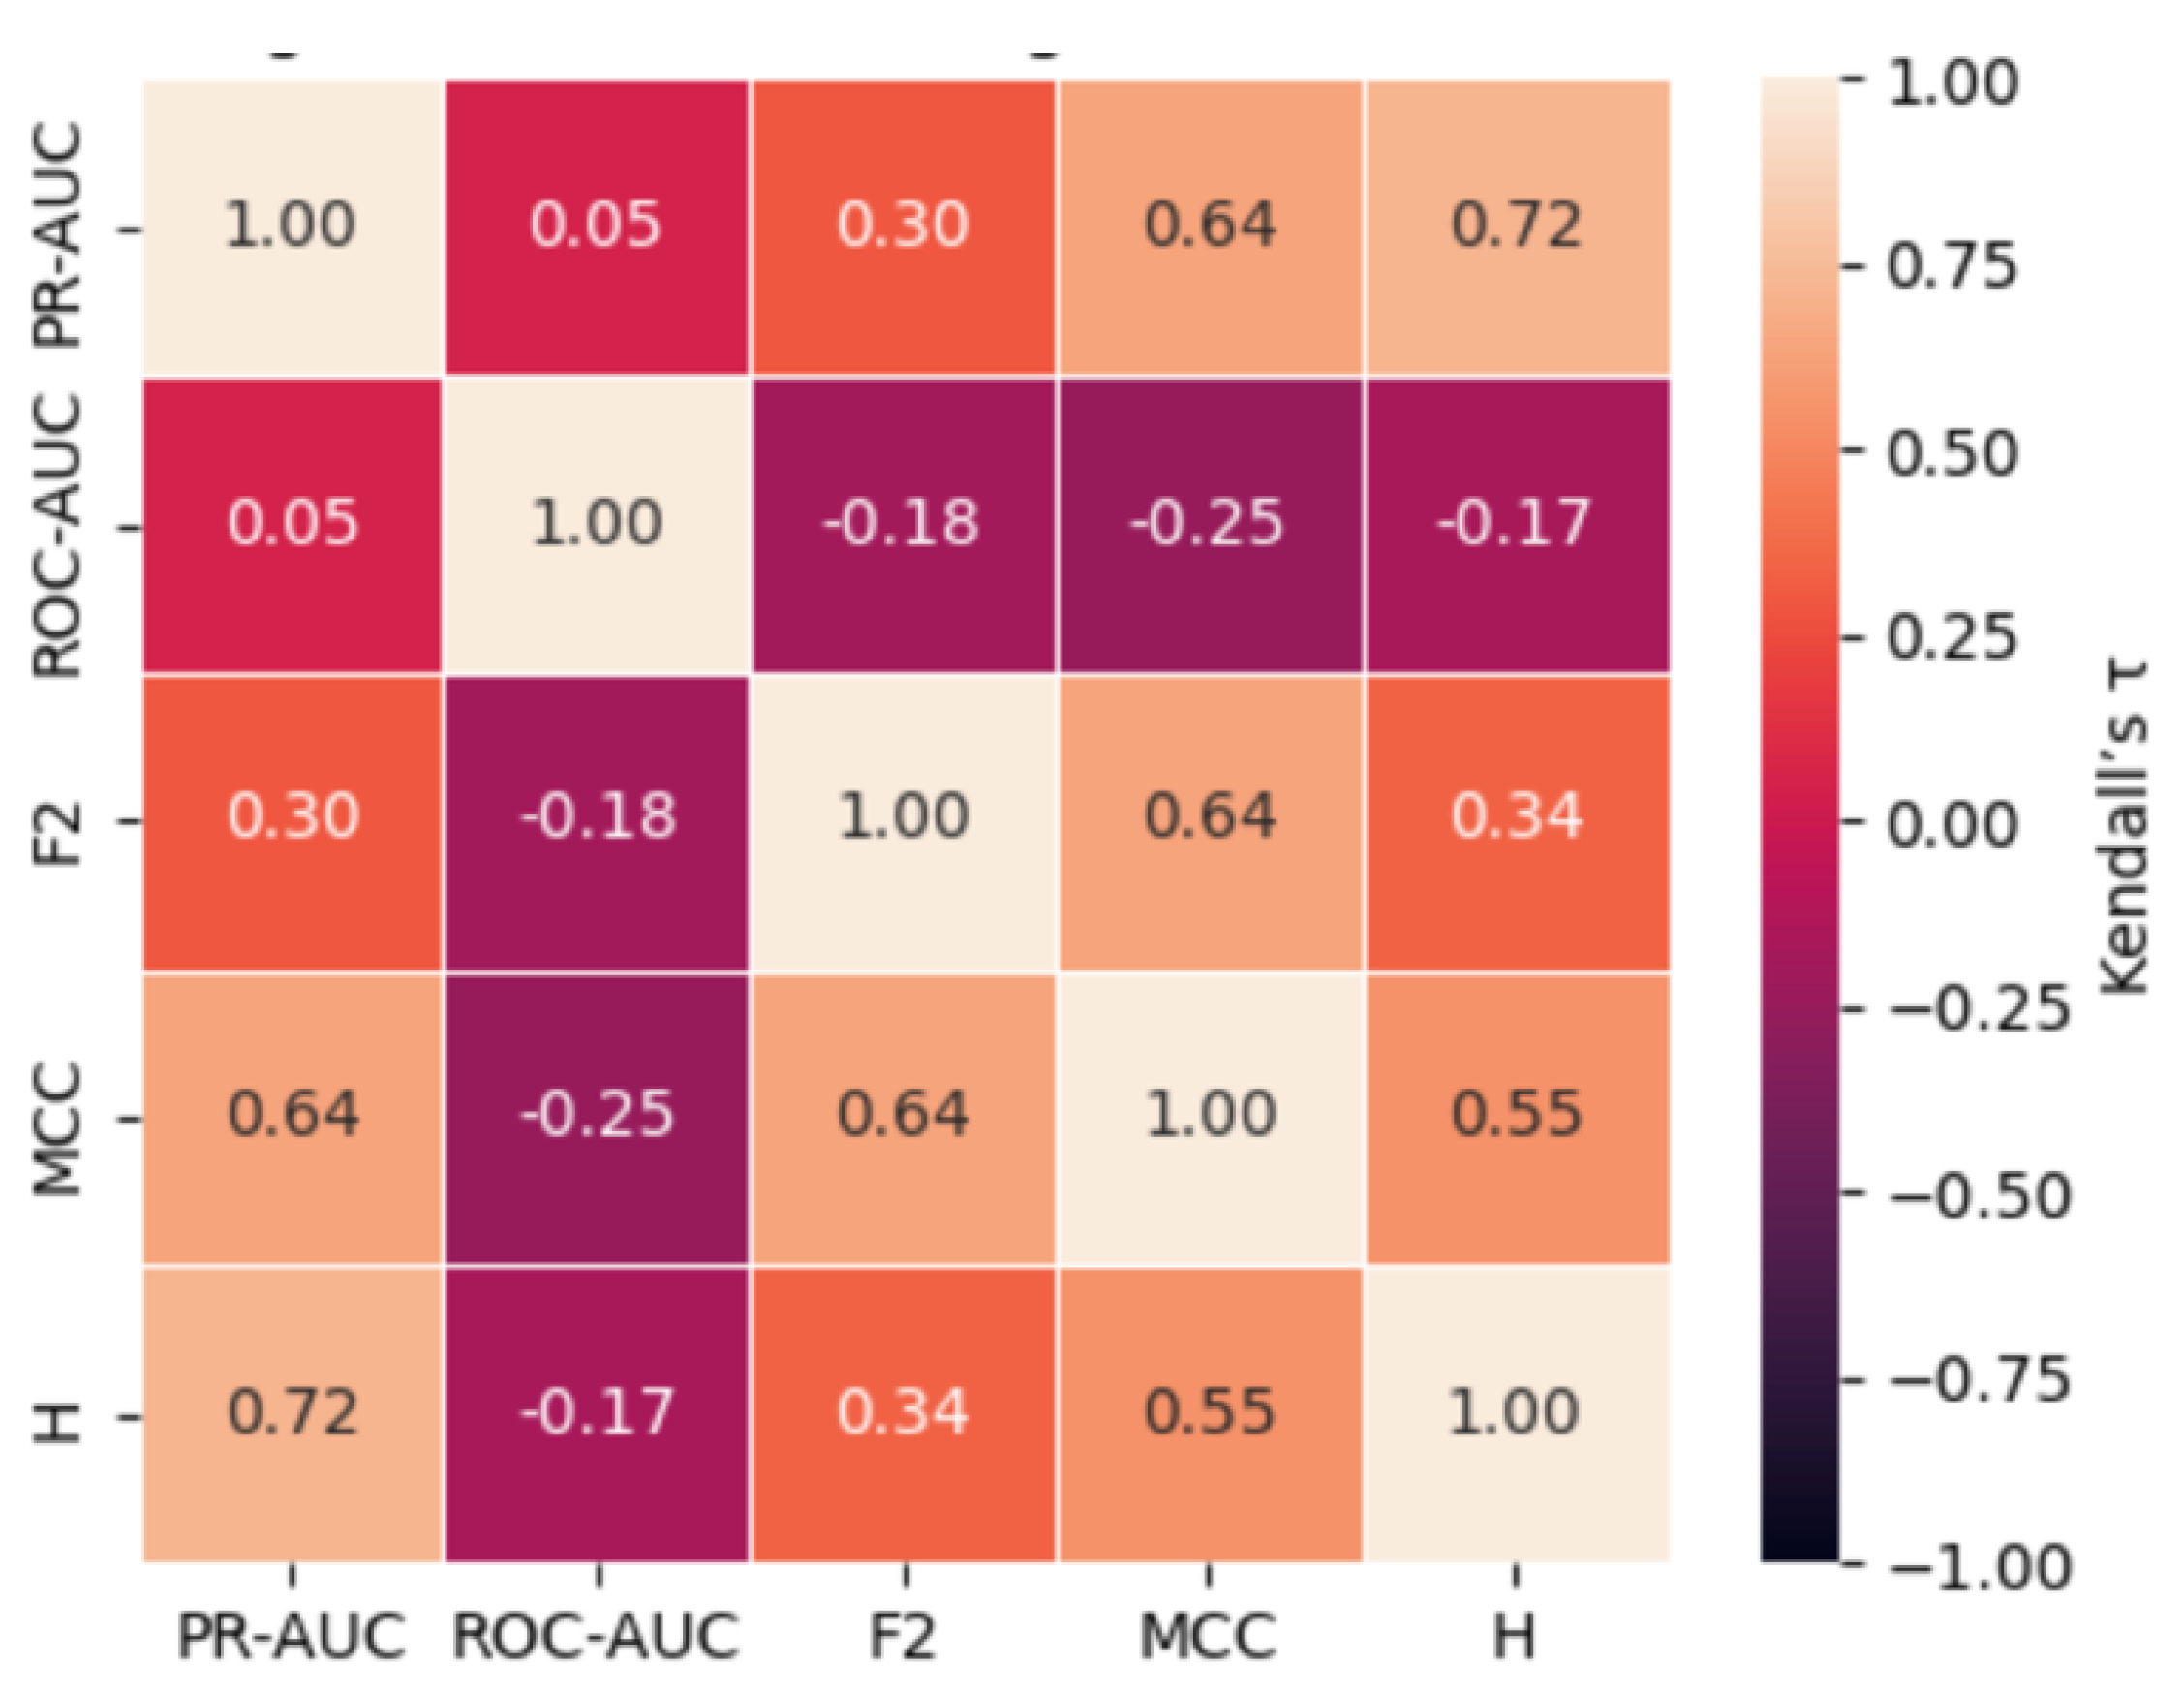
The results show an extremely weak and statistically insignificant
correlation between PR-AUC and ROC-AUC (τ = 0.053, p = 0.7732), suggesting
almost no concordance between these metrics. More concerningly, ROC-AUC
demonstrates negative correlations with F₂ (τ = -0.185, p = 0.2559), MCC (τ =
-0.248, p = 0.1271), and H-measure (τ = -0.168, p = 0.3189), though these
associations are not statistically significant. These findings indicate that
ROC-AUC fails to align with alternative metrics and may rank classifier
performance inversely in some instances, further underscoring its inadequacy
for imbalanced data evaluation.
In contrast, strong and statistically significant positive
correlations are observed among the alternative metrics. PR-AUC exhibits
substantial concordance with MCC (τ = 0.639, p = 0.000086) and H-measure (τ =
0.716, p < 0.0001), highlighting shared sensitivity to precision-recall
trade-offs and misclassification costs. Similarly, F₂ correlates strongly with
MCC (τ = 0.640, p = 0.000085) and moderately with H-measure (τ = 0.343, p =
0.0349), while MCC and H-measure also display a robust association (τ = 0.554,
p = 0.0007).
These findings reinforce two critical insights: ROC-AUC is
poorly aligned with alternative metrics and may produce misleading performance
rankings in highly imbalanced contexts; meanwhile, the strong concordance among
PR-AUC, F₂, MCC, and H-measure underscores their suitability as reliable and
complementary metrics for evaluating rare-event classification performance.
Figure 6.
Kendall rank correlations (τ) heatmap between metrics on the Ozone dataset.
5.3. Cross-Metric Synthesis and Evaluation Strategy
The synthesis of results across the Fraud, Yeast, and Ozone datasets reinforces a clear hierarchy among the evaluated metrics. Kendall’s rank correlation analyses consistently demonstrate that τ(MCC, F₂) ≫ τ(PR-AUC, MCC or F₂) ≫ τ(ROC-AUC, any other metric). This ordering highlights MCC and F₂ as capturing similar operational trade-offs, PR-AUC as offering a compatible but threshold-free perspective, and ROC-AUC as providing minimal practical guidance in ultra-imbalanced settings. Consequently, we recommend a reporting bundle of MCC + PR-AUC, with F₂ included when high recall is mission-critical, while relegating ROC-AUC to supplementary material accompanied by explicit caution regarding its limitations. Table 11 shows that the cross-domain analysis of the three datasets yields consistent conclusions.
The findings reinforce that MCC and F₂-score capture
complementary aspects of model performance, reflecting trade-offs between false
positives and false negatives at a fixed decision threshold. While MCC offers a
symmetric, prevalence-agnostic summary, F₂ is more sensitive to recall and
proves particularly useful when the cost of false negatives outweighs that of
false positives. PR-AUC, although threshold-independent, aligns reasonably well
with these metrics, providing a global view of ranking quality that remains
valuable when decision thresholds are not yet defined. ROC-AUC, by contrast,
consistently misaligns with operational needs in ultra-imbalanced settings. Its
scores remain artificially high even when models exhibit severe false-positive
inflation, thus obscuring practical deficiencies that MCC, F₂, and PR-AUC
readily expose.
These observations point to a clear recommendation: PR-AUC
and MCC should form the core of any evaluation framework for rare-event
classification. Where high recall is critical—for instance, in fraud detection
or medical screening—the inclusion of F₂ offers additional insight aligned with
stakeholder priorities. ROC-AUC may only be reported for completeness or legacy
comparisons if accompanied by a clear disclaimer outlining its insensitivity to
class imbalance and misalignment with operational costs.
These conclusions are not merely theoretical; they
translate into actionable strategies for practitioners working with datasets
where the minority class comprises less than 3% of the population. The primary
recommendation is to adopt PR-AUC to evaluate global ranking ability and MCC as
a threshold-specific measure of balanced performance. In domains where false
negatives carry disproportionate risk, such as missed fraud cases or
undiagnosed patients, the F₂-score is a vital complement, emphasizing recall without
discarding the need for precision.
The consistent misbehavior of ROC-AUC in our study warrants
caution. In multiple cases, ROC-AUC ranked models favorably even when both MCC
and PR-AUC indicated poor discriminative performance. For example, the
combination of Logistic Regression with SMOTE in the fraud dataset achieved a
ROC-AUC well above 0.90 despite a massive spike in false positives (FP = 2019,
MCC = 0.23), effectively masking operational failure. Such discordance between
ROC and MCC rankings—especially when discrepancies exceed 10 percentile
points—should be treated as a red flag in model validation pipelines.
Oversampling methods, too, must be evaluated contextually.
While techniques like SMOTE can offer measurable gains in some domains (e.g.,
the Yeast dataset), they may introduce detrimental artifacts elsewhere. It is
therefore critical that researchers assess the impact of oversampling not only
on headline metrics but also on raw confusion-matrix components.
Finally, in settings where the economic or human cost of
misclassification is asymmetric, the flexible F_β family offers tailored
sensitivity. Selecting β between 2 and 4 allows evaluators to reflect
real-world stakes—emphasizing recall where it matters most, while retaining the
interpretability of a single scalar score.
5.4. Statistical Testing and Confidence Intervals
To assess the statistical reliability of performance
estimates, 95% confidence intervals were constructed for each evaluation metric
using a stratified bootstrap procedure. This involved generating 2000 resampled
replicates per test fold while maintaining the original class distribution to
preserve the inherent imbalance structure. Pairwise comparisons of ROC-AUC
values between classifier–sampler configurations were conducted using the
DeLong test for correlated receiver operating characteristic curves ([53]), with corresponding p-values reported.
We employed the Friedman aligned-ranks test for comparisons involving more than
two configurations, followed by the Nemenyi post hoc procedure to identify
statistically significant differences at a family-wise significance level of α = 0.05.
5.4.1. Bootstrap CIs and DeLong Test (Fraud Dataset)
Figure 7(a)–(e) display stratified-bootstrap 95 % confidence intervals (CIs) for the Fraud data, while Figure 8 gives the ROC-AUC critical-difference (CD) diagram computed from 200 bootstrap resamples.
The ROC-AUC scores reported in Figure 7(a) exhibit a strong ceiling effect across all classifier–sampler configurations evaluated on the Ozone dataset. Every method achieves an ROC-AUC of at least 0.92, with fifteen out of twenty configurations densely concentrated within the narrow 0.94–0.97 interval. These overlaps in confidence intervals (CIs) reflect the saturation of ROC-AUC under conditions of extreme class imbalance. This observation is quantitatively confirmed by the critical difference (CD) diagram in Figure 8, where only the top-ranked Borderline-SMOTE + CatBoost and the lowest-ranked Borderline-SMOTE + Random Forest are distinguishable beyond the Nemenyi threshold (CD ≈ 2.96). All remaining methods fall within the critical band, rendering ROC-AUC largely ineffective in resolving meaningful differences among most classifiers—an outcome consistent with its known limitations in highly imbalanced domains [54].
By contrast, other evaluation metrics provide a more precise and discriminative perspective. Figure 7(b) shows the PR-AUC results distribute the same twenty methods across a substantially broader interval (0.62–0.88). Baseline XGBoost and SVM-SMOTE + XGBoost emerge as top performers (mean PR-AUC ≈ 0.87; CI: 0.83–0.90), while SMOTE + Logistic Regression and ADASYN + Logistic Regression are positioned at the bottom (≈ 0.65; CI: 0.61–0.69). Metrics based on confusion-matrix outcomes further support this stratification: MCC and F₂ (β = 2), presented in Figure 7(c) and 7(d), respectively, rank SVM-SMOTE + Random Forest and Borderline-SMOTE + XGBoost among the highest (MCC ≈ 0.88; F₂ ≈ 0.82), while all logistic-regression variants remain under MCC = 0.30, indicating inferior performance.
Further refinement is provided by the H-measure in Figure 7(e), which incorporates cost sensitivity and penalizes excessive false positives. Here, Baseline Random Forest and SVM-SMOTE + CatBoost occupy the top positions (H ≈ 0.78), despite not being among the leaders under ROC-AUC. Compared to the bottom six, the top eight H-measure configurations present non-overlapping CIs, confirming a statistically and practically significant separation that ROC-AUC fails to detect.
Rank-correlation analyses reinforce these discrepancies. As reported in Table 8, Kendall’s τ coefficients reveal strong concordance between PR-AUC and the H-measure, and between F₂ and MCC (0.64 ≤ τ ≤ 0.70), but substantially weaker alignment between ROC-AUC and any other metric (τ ≈ 0.04–0.33). The CD diagram in Figure 8 visually supports this conclusion, as configurations clustered centrally under ROC-AUC rankings are widely dispersed in the rankings of other metrics. These results underscore ROC-AUC’s persistent misalignment with metrics that better reflect the trade-offs relevant in
rare-event binary classification.
5.4.2. Bootstrap CIs and DeLong Test (Yeast Dataset)
Figure 9(a-e) show bootstrap-based 95 % confidence intervals for each evaluation metric, while Figure 10 reports a Nemenyi critical-difference diagram derived from 200 stratified bootstrap resamples of the test fold.
Figure 9(a) illustrates the distribution of ROC-AUC scores across all classifier–sampler combinations evaluated on the Yeast dataset. Despite underlying architectural and sampling differences, nearly all configurations attain ROC-AUC values exceeding 0.75, with nine methods clustering within the narrow 0.85–0.90 interval and displaying substantially overlapping bootstrap confidence intervals. The critical difference (CD) diagram in Figure 10 corroborates this compression: no
method pair exceeds the Nemenyi threshold (CD ≈ 2.96) in average rank. This inability of ROC-AUC to distinguish between models is consistent with its known ceiling effect in highly imbalanced settings, where the abundance of negative-class samples artificially inflates the curve’s area—even for classifiers with limited discriminative ability [54].
In contrast, alternative metrics such as PR-AUC, MCC, F₂, and the H-measure offer a substantially more informative view of model performance. As depicted in Figure 9(b), PR-AUC distributes the same twenty configurations across a wide range (0.20–0.85), with SVM-SMOTE paired with logistic regression achieving the highest performance (mean ≈ 0.82; CI: 0.71–0.93), while the Baseline XGB variant falls to the bottom (mean ≈ 0.38; CI: 0.28–0.50). MCC and F₂ scores, shown in Figure 9(c) and 9(d), respectively, reveal similar rankings: the SVM-SMOTE variants dominate, followed by logistic regression with no resampling or with borderline-SMOTE, while ROS and ADASYN configurations underperform significantly. These critical distinctions, invisible under ROC-AUC, become pronounced through threshold-sensitive or
cost-aware metrics.
Further reinforcing this pattern, the H-measure (Figure 9(e)) adds a probabilistic cost
framework to the evaluation [55]. It sharply penalizes models that produce excessive false positives, demoting Baseline XGB to the bottom quartile despite its superficially strong ROC-AUC. Notably, the bootstrap confidence intervals of the top five methods under the H-measure do not overlap with those of the bottom eight, indicating a statistically and operationally meaningful separation in model quality.
Rank-based correlation analyses support these findings. Table 9presents Kendall’s τ coefficients, which demonstrate high agreement between PR-AUC and the H-measure, as well as
between F₂ and MCC (0.84 ≤ τ ≤ 0.89). In contrast, correlations between ROC-AUC and any other metric are negligible (τ ≈ 0.01–0.10), underscoring its divergence from metrics that emphasize positive-class fidelity and real-world utility. Together with the CD analysis, these results confirm that ROC-AUC fails to provide meaningful or reliable rankings in extreme class imbalance. In contrast, PR-AUC, MCC, F₂, and the H-measure offer more sensitive and discriminative evaluation frameworks.
5.4.3. Bootstrap CIs and DeLong Test (Ozone Dataset)
Figure 11(a-e) present stratified-bootstrap 95 % confidence intervals (CIs) for every evaluation metric on the Ozone data, and Figure 12 shows the Nemenyi critical-difference (CD) diagram obtained from 200 bootstrap resamples of the identical test fold.
The evaluation of classifier–sampler configurations on the Ozone dataset reveals similar limitations of ROC-AUC observed in previous benchmarks. As shown in Figure 11(a), all twenty configurations achieve ROC-AUC scores between 0.75 and 0.93, with thirteen methods tightly clustered within the 0.83–0.90 interval and exhibiting largely overlapping 95% confidence intervals. The critical difference (CD) diagram in Figure 12 confirms that only the two extremal configurations—Borderline-SMOTE with CatBoost at the top and Borderline-SMOTE with Random Forest at the bottom—differ by more than the Nemenyi threshold (CD ≈ 2.96). The remaining eighteen methods are statistically indistinguishable under ROC-AUC, reaffirming the ceiling-effect phenomenon in imbalanced settings, where abundant negative examples lead to inflated area-under-curve estimates despite limited model utility [54].
By contrast, alternative metrics reveal substantially greater discriminatory power. Figure 11(b) presents the PR-AUC results, ranging from 0.18 to 0.65. Here, SMOTE combined with Random Forest clearly outperforms other methods (mean ≈ 0.62; CI: 0.49–0.75), while SMOTE with Logistic Regression ranks lowest (mean ≈ 0.14; CI: 0.10–0.22). This ranking pattern is echoed in both the MCC (Figure 11c) and the F₂ score (Figure 11d), where oversampled Random Forest models consistently lead, followed by SVM-SMOTE variants. In contrast, most baseline and ADASYN-based methods perform poorly, with MCC values falling below 0.25.
Further insights are obtained from the H-measure (Figure 11e), which incorporates a probabilistic cost model to penalize false positives more explicitly [55]. Notably, the H-measure elevates SMOTE + RF and Borderline-SMOTE + RF to the top of the rankings—despite their mid-range ROC-AUC scores—while relegating Baseline CatBoost and XGBoost models to the lower quartile. Moreover, the top six configurations under the H-measure exhibit non-overlapping confidence intervals compared to the bottom nine, signifying statistically and operationally meaningful differences that ROC-AUC entirely masks.
Rank correlation analyses further support this divergence in ranking behavior. Table 10 shows that Kendall’s τ coefficients between PR-AUC and the H-measure and between F₂ and MCC remain moderate to high (0.64 ≤ τ ≤ 0.72), confirming their alignment in prioritizing models that balance recall and precision. In contrast, the correlation between ROC-AUC and any other metric is negligible or negative (τ ranging from –0.25 to 0.05), highlighting its persistent misalignment with cost-sensitive and threshold-dependent performance measures. Together with the CD diagram in Figure 12, these findings underscore ROC-AUC’s limited utility as a ranking criterion in severe class imbalance, where more nuanced metrics offer more precise and more actionable discrimination among competing models.
6. Conclusion
This study comprehensively evaluated performance metrics for binary classification in highly imbalanced domains, where the minority class constitutes less than 3% of instances. Using three representative datasets—credit card fraud detection (0.17% prevalence), yeast protein
localization (1.35%), and ozone level detection (2.9%)—we demonstrated that the widely adopted ROC-AUC metric is inadequate in such settings. Its
threshold-free formulation and normalization over the majority class lead to
saturation effects and poor sensitivity to false positives and false negatives.
As a result, ROC-AUC often assigns inflated scores to classifiers with low
operational utility.
Beyond empirical rankings, we introduced robust statistical
testing protocols to evaluate metric behaviour. For each metric, we computed
95% confidence intervals using stratified bootstrapping, while DeLong’s
paired-sample test was applied to compare ROC-AUC values. When evaluating more
than two methods, we employed the Friedman aligned-rank test followed by the
Nemenyi critical-difference procedure. These rigorous statistical techniques
confirmed that ROC-AUC fails to meaningfully differentiate among most classifier–sampler
combinations, often masking substantial variation revealed by other metrics. In
contrast, PR-AUC, MCC, F₂, and H-measure exposed statistically significant
performance gaps that ROC-AUC completely overlooked.
Our results consistently identified the MCC and F₂-score as
the most robust and operationally meaningful metrics. Both demonstrated strong
alignment (Kendall’s τ ≈ 0.89), balancing precision and recall under fixed
thresholds. The H-measure contributed a cost-sensitive and decision-theoretic
dimension to model evaluation, offering valuable nuance despite some
sensitivity to parameter assumptions. PR-AUC, although threshold-free, provided
complementary insights by ranking models based on positive-class precision and
recall trade-offs.
These findings offer a clear recommendation: ROC-AUC should
no longer be the default evaluation metric in rare-event classification.
Instead, researchers and practitioners should adopt a multi-metric reporting
strategy, led by MCC and F₂ for threshold-based evaluation, with PR-AUC and
H-measure used to provide additional perspectives on model ranking and cost
trade-offs. This approach enables a statistically sound and operationally
relevant understanding of model performance, particularly in high-stakes domains
where misclassification costs are asymmetric and minority detection is
critical.
Limitations and Future Work
Despite the strength of the evidence presented, several limitations warrant acknowledgment. (i) The empirical analysis is restricted to three publicly available datasets spanning finance, bioinformatics, and environmental monitoring; evaluating additional domains—such as cybersecurity intrusion detection, clinical event prediction, and autonomous driving—would better assess external validity under diverse operational constraints. (ii) The study focuses exclusively on tabular data. Although the recommended bundle—MCC and F₂ as threshold-dependent metrics, with PR-AUC and H-measure as complementary, threshold-free and cost-sensitive views—is, in principle, model- and modality-agnostic because it operates on predicted scores and confusion matrices, metric behaviour may differ in high-dimensional, unstructured modalities (e.g., computer vision and natural language processing) due to differences in score calibration, class-conditional score distributions, and training practices (e.g., focal or class-balanced losses, hard-negative mining, augmentation/mix-up, prompt-based few-shot regimes). Future studies on non-tabular benchmarks employing contemporary architectures (e.g., CNNs/ViTs for imaging; transformers for text) and modality-appropriate imbalance treatments, with explicit attention to calibration and clinically/operationally relevant operating regions (e.g., low–FPR screening), could test generalizability and reveal any modality-specific adjustments (e.g., alternative thresholding policies or H-measure cost priors). (iii) Adaptive threshold-selection procedures and cost-sensitive loss functions were not considered; integrating such mechanisms may further align MCC and F₂ with stakeholder risk tolerances and deployment objectives. (iv) Dynamic settings—including streaming data and concept drift—were outside the scope; examining how MCC, F₂, H-measure, and PR-AUC perform under temporal and distributional shifts would inform use in evolving systems. (v) Finally, while the analysis employed bootstrap confidence intervals and rank-based statistical tests, future work could leverage more advanced inferential frameworks—such as Bayesian ranking models or multi-metric decision analysis—to strengthen the reliability of metric comparisons in extremely imbalanced regimes.
Author Contributions
Conceptualization, M.I.; Methodology, M.I.; Software, M.I.; Validation, M.I., M.J., and A.B.; Formal analysis, M.I.; Investigation, M.I. and M.J.; Resources, M.I. and M.J.; Data curation, M.I. and M.J.; Writing—original draft preparation, M.I.; Writing—review and editing, M.J., A.B., and H.R.A.; Visualization, M.I.; Supervision, A.B., and H.R.A.; Project administration, M.I. All authors have read and agreed to the published version of the manuscript.
Funding
This research received no external funding.
Institutional Review Board Statement
Not applicable.
Informed Consent Statement
Not applicable.
Data Availability Statement
Conflicts of Interest
The authors declare no conflicts of interest.
References
- C. Elkan, “The foundations of cost-sensitive learning,” in Proceedings of the 17th International Joint Conference on Artificial Intelligence, Morgan Kaufmann, 2001, pp. 973–978.
- M. Kubat and S. Matwin, “Addressing the curse of imbalanced training sets: one-sided selection,” in Proceedings of the 14th International Conference on Machine Learning, Morgan Kaufmann, 1997, pp. 179–186.
- W. X.-Y., J., and Z.-H. Zhou, “Exploratory undersampling for class-imbalance learning,” IEEE Transactions on Systems, Man, and Cybernetics – Part B, vol. 39, no. 2, pp. 539–550, 2009.
- C. Drummond and R. C. Holte, “C4.5, class imbalance, and cost sensitivity: why under-sampling beats over-sampling.” 2003.
- N. V. Chawla, K. W. Bowyer, L. O. Hall, and W. P. Kegelmeyer, “SMOTE: Synthetic minority over-sampling technique,” Journal of Artificial Intelligence Research, vol. 16, pp. 321–357, 2002.
- H. Han, W.-Y. Wang, and B.-H. Mao, “Borderline-SMOTE: A new over-sampling method in imbalanced data sets learning,” in Proceedings of the International Conference on Intelligent Computing, Springer, 2005, pp. 878–887.
- H. N. Nguyen, E. W. Cooper, and K. Kamei, “Borderline over-sampling for imbalanced data classification,” International Journal of Knowledge Engineering and Soft Data Paradigms, vol. 3, no. 1, pp. 4–21, 2011.
- C. Bunkhumpornpat, K. Sinapiromsaran, and C. Lursinsap, “Safe-level-SMOTE: Safe-level-synthetic minority over-sampling technique for handling the class imbalanced problem,” in Proceedings of the 13th Pacific-Asia Conference on Knowledge Discovery and Data Mining, Springer, 2009, pp. 475–482.
- H. He, Y. Bai, E. A. Garcia, and S. Li, “ADASYN: Adaptive synthetic sampling approach for imbalanced learning,” in Proceedings of the IEEE International Joint Conference on Neural Networks, IEEE, 2008, pp. 1322–1328.
- I. Tomek, “Two modifications of CNN,” IEEE Transactions on Systems, Man, and Cybernetics, vol. 6, no. 11, pp. 769–772, 1976.
- D. L. Wilson, “Asymptotic properties of nearest neighbor rules using edited data,” IEEE Transactions on Systems, Man, and Cybernetics, vol. 2, no. 3, pp. 408–421, 1972.
- G. E. A. P. A. Batista, R. C. Prati, and M. C. Monard, “A study of the behavior of several methods for balancing machine learning training data,” SIGKDD Explorations, vol. 6, no. 1, pp. 20–29, 2004.
- M. Imani and H. R. Arabnia, “Hyperparameter optimization and combined data sampling techniques in machine learning for customer churn prediction: a comparative analysis,” Technologies, vol. 11, no. 6, p. 167, 2023. [CrossRef]
- G. Douzas and F. Bacao, “G-SMOTE: A GMM-based synthetic minority oversampling technique for imbalanced learning,” Information Sciences, vol. 512, pp. 1–25, 2019.
- G. Mariani, F. Scheidegger, R. Istrate, J. Alakuijala, C. Bekas, and A. Malossi, “BAGAN: Data augmentation with balancing GAN.” 2018.
- Q. Wei and J. Liu, “Theoretical analysis of synthetic sampling for class imbalance,” Machine Learning, vol. 112, pp. 4073–4102, 2023.
- J. A. Hanley and B. J. McNeil, “The meaning and use of the area under a receiver operating characteristic (ROC) curve,” Radiology, vol. 143, no. 1, pp. 29–36, 1982.
- T. Fawcett, “An introduction to ROC analysis,” Pattern Recognition Letters, vol. 27, no. 8, pp. 861–874, 2006.
- T. Saito and M. Rehmsmeier, “The Precision-Recall Plot Is More Informative than the ROC Plot When Evaluating Binary Classifiers on Imbalanced Datasets,” PLOS ONE, vol. 10, no. 3, p. 0118432, 2015.
- J. Davis and M. Goadrich, “The relationship between precision–recall and ROC curves,” in Proceedings of the 23rd International Conference on Machine Learning, ACM, 2006, pp. 233–240.
- D. J. Hand, “Measuring classifier performance: a coherent alternative to the area under the ROC curve,” Machine Learning, vol. 77, no. 1, pp. 103–123, 2009.
- B. W. Matthews, “Comparison of the predicted and observed secondary structure of T4 phage lysozyme,” Biochimica et Biophysica Acta – Protein Structure, vol. 405, no. 2, pp. 442–451, 1975.
- D. Chicco and G. Jurman, “The advantages of the Matthews correlation coefficient (MCC) over F1 score and accuracy in binary classification evaluation,” BMC Genomics, vol. 21, p. 6, 2020.
- P. Christen, T. Ranbaduge, and A. Vatsalan, “A review of the F-measure: Its history, properties, criticism, and alternatives,” ACM Computing Surveys, 2023. [CrossRef]
- D. M. W. Powers, “Evaluation: From precision, recall and F-measure to ROC, informedness, markedness and correlation,” Journal of Machine Learning Technologies, vol. 2, no. 1, pp. 37–63, 2011.
- K. H. Brodersen, C. S. Ong, K. E. Stephan, and J. M. Buhmann, “The balanced accuracy and its posterior distribution,” in Proceedings of the 20th International Conference on Pattern Recognition, IEEE, 2010, pp. 3121–3124.
- J. Cohen, “A coefficient of agreement for nominal scales,” Educational and Psychological Measurement, vol. 20, no. 1, pp. 37–46, 1960.
- J. R. Landis and G. G. Koch, “The measurement of observer agreement for categorical data,” biometrics, pp. 159–174, 1977.
- D. Chicco and G. Jurman, “The Matthews correlation coefficient (MCC) should replace the ROC AUC as the standard metric for assessing binary classification,” BioData Mining, vol. 16, 4, 2023. [CrossRef]
- E. Richardson, R. Trevizani, J. A. Greenbaum, H. Carter, M. Nielsen, and B. Peters, “The receiver operating characteristic curve accurately assesses imbalanced datasets,” Patterns, vol. 31;5(6):100994. [CrossRef]
- F. Provost and T. Fawcett, “Analysis and visualization of classifier performance: Comparison under imprecise class and cost distributions,” in Proceedings of the Third International Conference on Knowledge Discovery and Data Mining, AAAI Press, 1997, pp. 43–48.
- M. Sokolova and G. Lapalme, “A systematic analysis of performance measures for classification tasks,” Information Processing & Management, vol. 45, no. 4, pp. 427–437, 2009.
- Q. Zhang and X. Geng, “Rethinking AUPRC under class imbalance,” in Proceedings of the 38th Conference on Neural Information Processing Systems, 2024.
- Y. Itaya, J. Tamura, K. Hayashi, and K. Yamamoto, “Asymptotic properties of Matthews correlation coefficient,” Statistics in Medicine, vol. 44, no. 1–2, p. 10303, 2025.
- J. Hernández-Orallo, “ROC curves for regression,” Pattern Recognition, vol. 46, no. 12, pp. 3395–3411, 2013.
- D. J. Hand, “Evaluating diagnostic tests: The area under the ROC curve and the balance of errors,” Statistics in Medicine, vol. 29, no. 14, pp. 1502–1510, Jun. 2010. [CrossRef]
- A. Niculescu-Mizil and R. Caruana, “Predicting good probabilities with supervised learning,” in Proceedings of the 22nd International Conference on Machine Learning, ACM, 2005, pp. 625–632.
- P. A. Flach and M. Kull, “Precision–recall-gain curves: PR analysis done right,” in Advances in Neural Information Processing Systems 28, 2015, pp. 838–846.
- H. He and E. A. Garcia, “Learning from imbalanced data,” IEEE Transactions on Knowledge and Data Engineering, vol. 21, no. 9, pp. 1263–1284, 2009.
- R. Blagus and L. Lusa, “SMOTE for high-dimensional class-imbalanced data,” BMC Bioinformatics, vol. 16, p. 362, 2015.
- M. Imani, Z. Ghaderpour, M. Joudaki, and A. Beikmohammadi, “The Impact of SMOTE and ADASYN on Random Forest and Advanced Gradient Boosting Techniques in Telecom Customer Churn Prediction,” in 10th International Conference on Web Research (ICWR, Tehran, Iran, Islamic Republic of, 2024, pp. 202-209. [CrossRef]
- M. Imani, A. Beikmohammadi, and H. R. Arabnia, “Comprehensive analysis of random forest and XGBoost performance with SMOTE, ADASYN, and GNUS under varying imbalance levels,” Technologies, vol. 13, no. 3, p. 88, 2025. [CrossRef]
- M. Imani, M. Joudaki, A. Beikmohamadi, and H. R. Arabnia, "Customer churn prediction: A systematic review of recent advances, trends, and challenges in machine learning and deep learning," Machine Learning and Knowledge Extraction, vol. 7, no. 3, p. 105, 2025. [CrossRef]
- A. Dal Pozzolo, G. Boracchi, O. Caelen, C. Alippi, and G. Bontempi, “Credit Card Fraud Detection: A Realistic Modeling and a Novel Learning Strategy,” IEEE Transactions on Neural Networks and Learning Systems, vol. 29, no. 8, pp. 3784–3797, 2015.
- K. Nakai, “Yeast [Dataset]. UCI Machine Learning Repository.” 1991. [CrossRef]
- K. Zhang, W. Fan, and X. Yuan, Ozone Level Detection [Dataset. UCI Machine Learning Repository, 2008. [CrossRef]
- R. C. Prati, G. E. A. P. A. Batista, M. C. Monard, and A. A. Freitas, “KEEL: A Software Tool to Assess Evolutionary Algorithms for Data Mining Problems,” Soft Computing, vol. 15, no. 11, pp. 2101–2113, 2015.
- C. C. Aggarwal, Data Mining: The Textbook. Cham, Switzerland: Springer, 2015.
- Y. Liu, Y. Wang, X. Chen, Y. H. Woon, and K. Y. Wong, “Standardization and Normalization of Quantitative Data in Medical Research,” Journal of Biomedical Research, vol. 22, no. 3, pp. 193–200, 2008.
- M. G. Kendall, “A new measure of rank correlation,” Biometrika, vol. 30, no. 1–2, pp. 81–93, 1938.
- H. Abdi, “The Kendall rank correlation coefficient,” Encyclopedia of Measurement and Statistics, pp. 508–510, 2007.
- W. J. Conover, Practical Nonparametric Statistics, 3rd ed. John Wiley & Sons, 1999.
- E. R. DeLong, D. M. DeLong, and D. L. Clarke-Pearson, “Comparing the areas under two or more correlated receiver operating characteristic curves: a nonparametric approach,” Biometrics, vol. 44, no. 3, pp. 837–845, 1988. [CrossRef]
- J. Demsar, “Statistical comparisons of classifiers over multiple data sets,” JMLR, vol. 7, pp. 1-30, 2006.
- D. J. Hand and C. Anagnostopoulos, “A better beta for the H-measure of classifier performance,” Pattern Recogn, vol. 46, pp. 923-933, 2013.
Figure 1.
Multi-metric radar plots for the fraud dataset across five resampling strategies. Axes are scaled to [0,1]; polygons show mean performance across cross-validation folds.
Figure 1.
Multi-metric radar plots for the fraud dataset across five resampling strategies. Axes are scaled to [0,1]; polygons show mean performance across cross-validation folds.

Figure 2.
Multi-metric radar plots for the Yeast dataset across five resampling strategies. Axes are scaled to [0,1]; polygons show mean performance across cross-validation folds.
Figure 2.
Multi-metric radar plots for the Yeast dataset across five resampling strategies. Axes are scaled to [0,1]; polygons show mean performance across cross-validation folds.
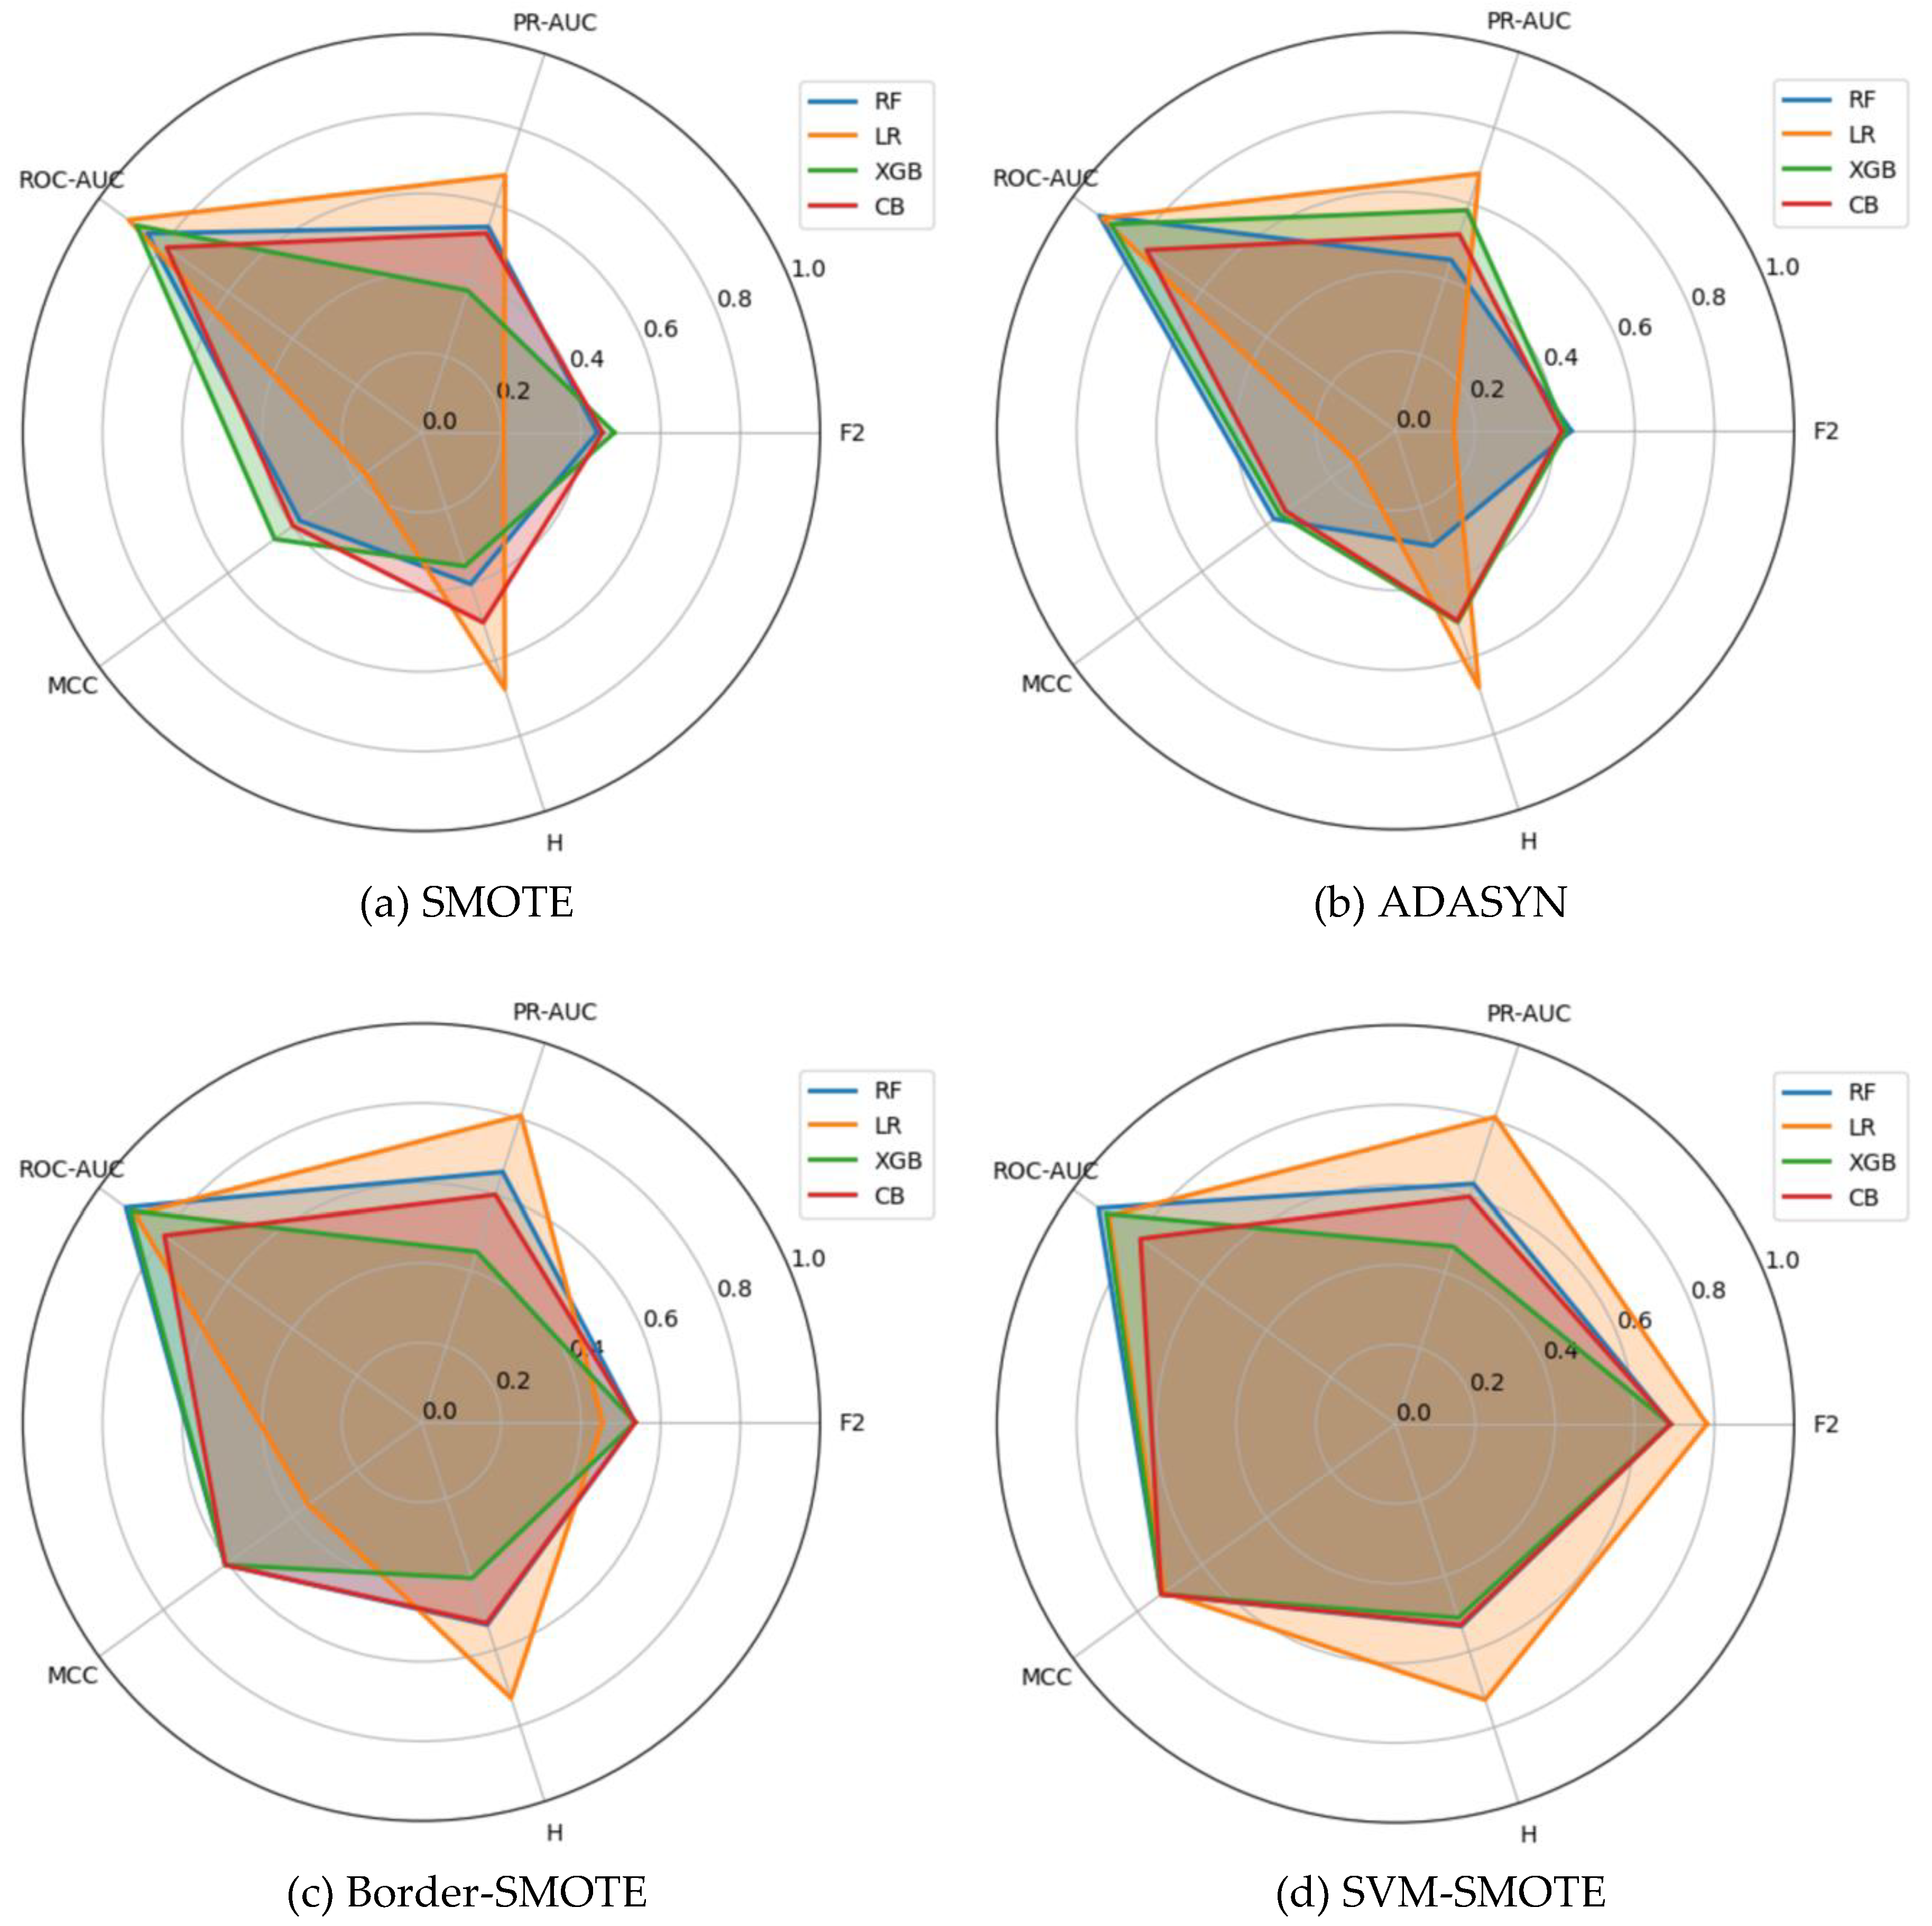
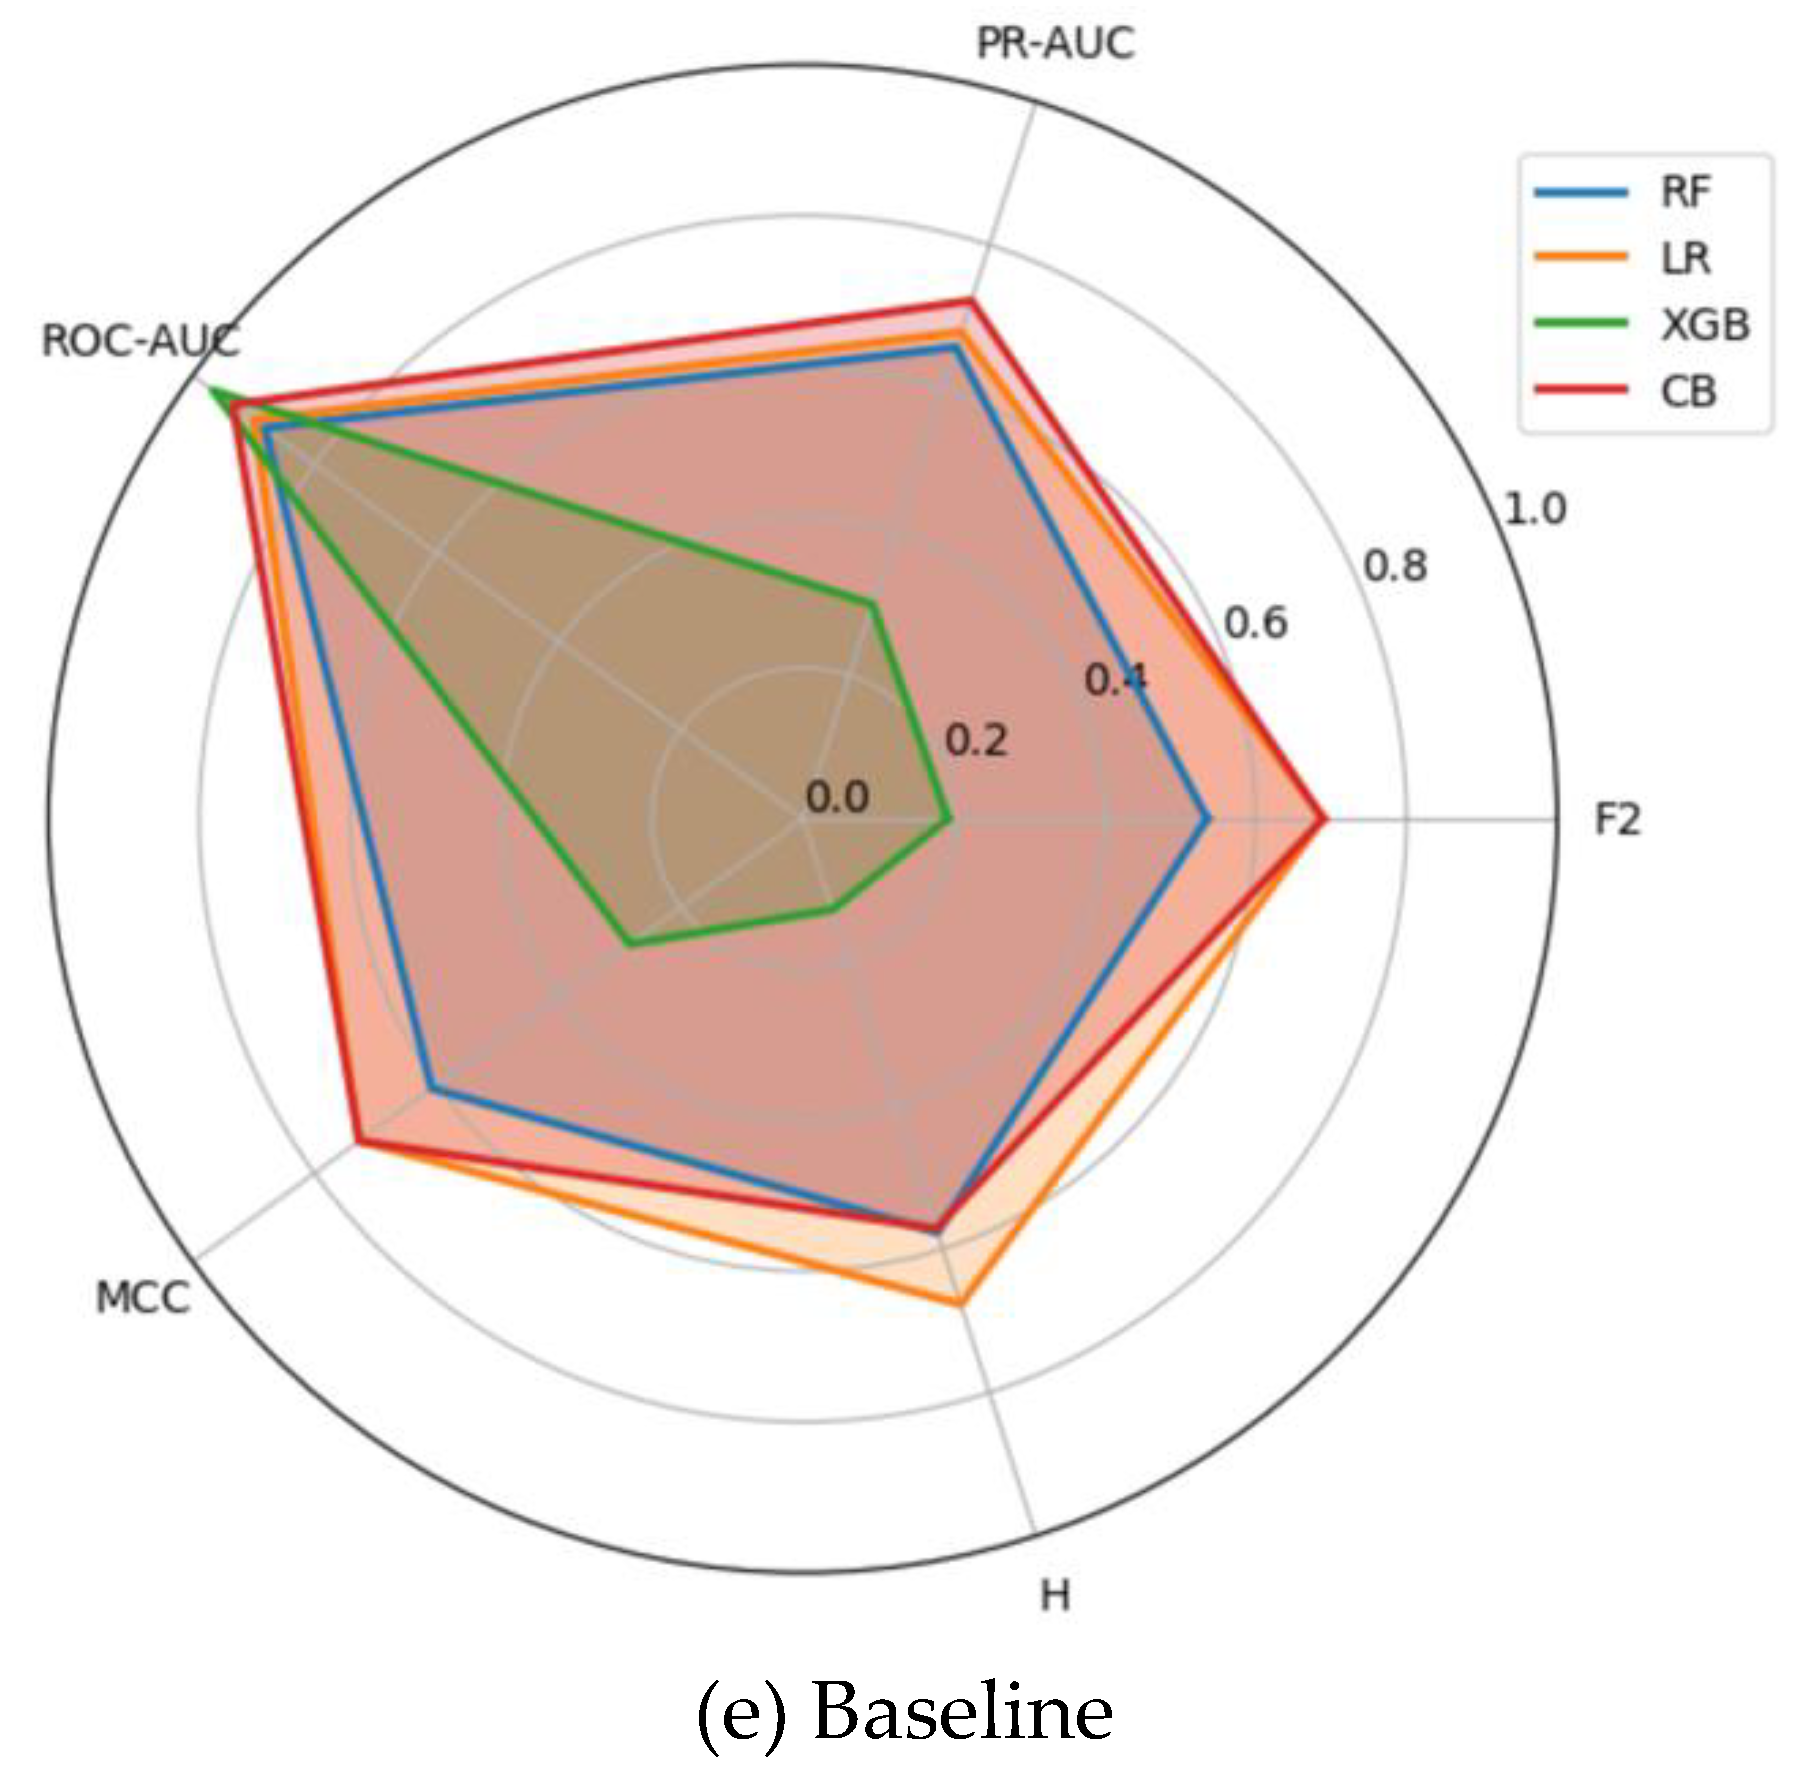
Figure 3.
Multi-metric radar plots for the Ozone dataset across five resampling strategies. Axes are scaled to [0,1]; polygons show mean performance across cross-validation folds.
Figure 3.
Multi-metric radar plots for the Ozone dataset across five resampling strategies. Axes are scaled to [0,1]; polygons show mean performance across cross-validation folds.
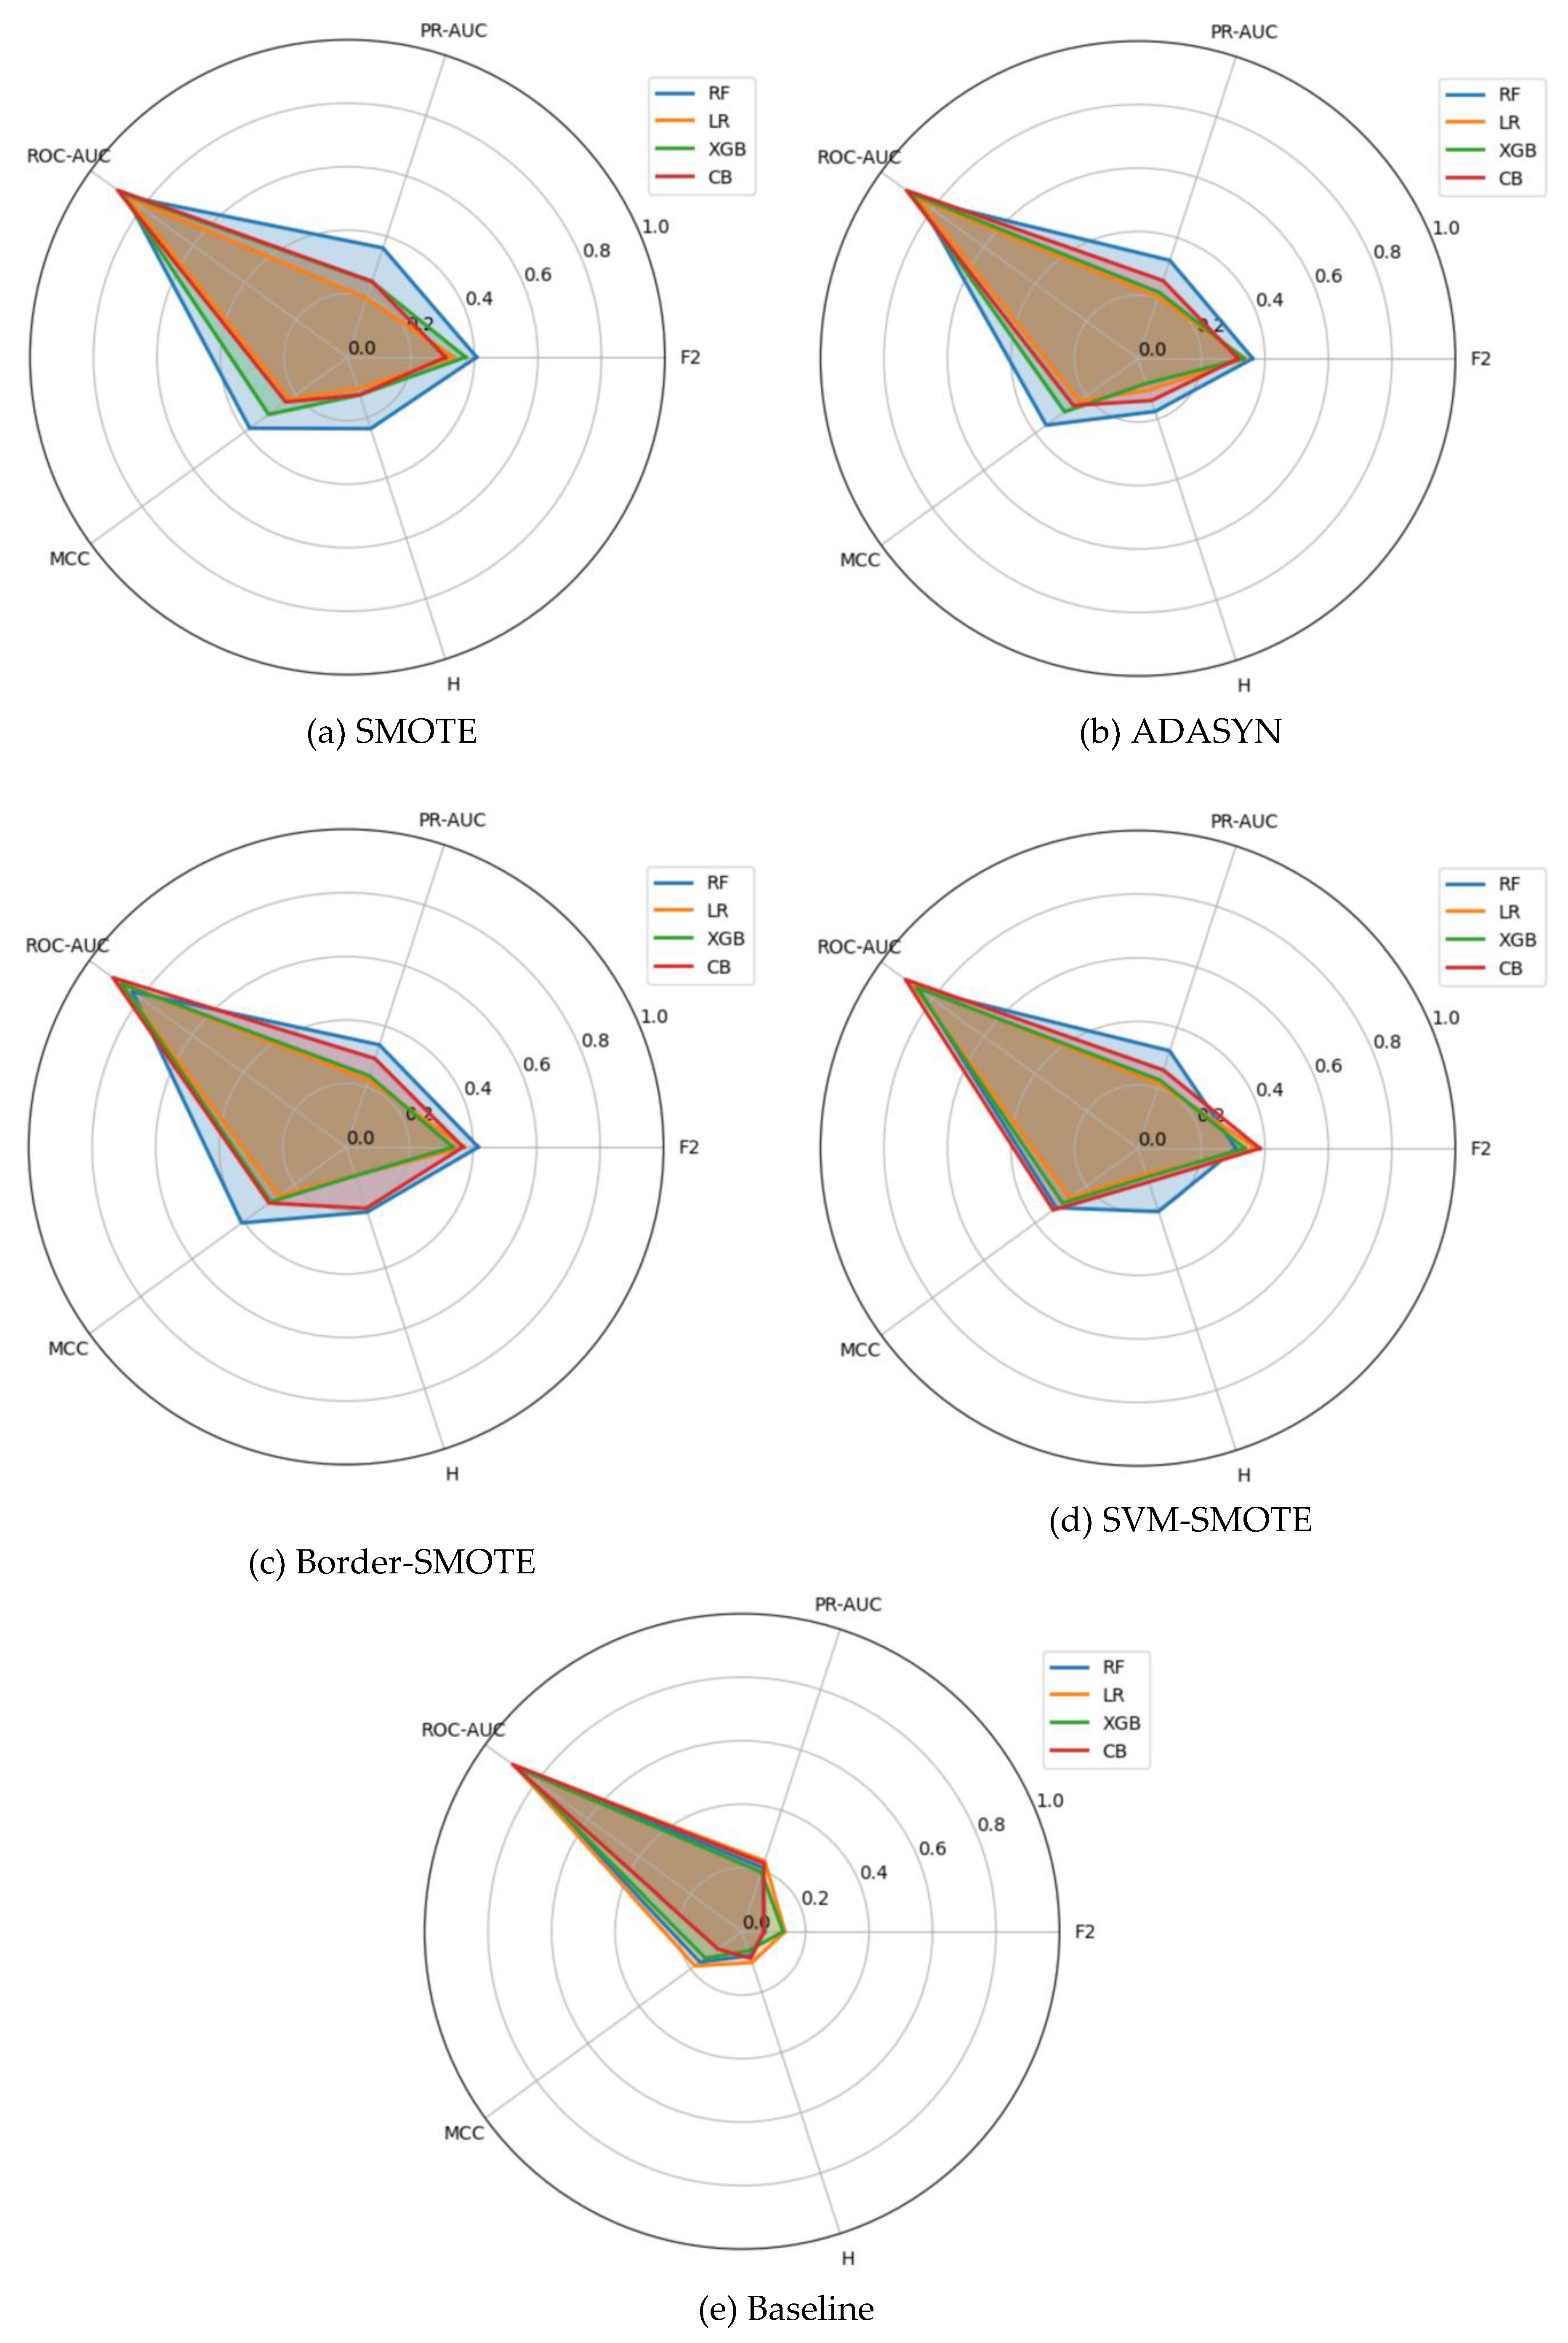
Figure 7.
(a-e) Bootstrap-based 95 % confidence intervals for each evaluation metric on the Fraud dataset.
Figure 7.
(a-e) Bootstrap-based 95 % confidence intervals for each evaluation metric on the Fraud dataset.
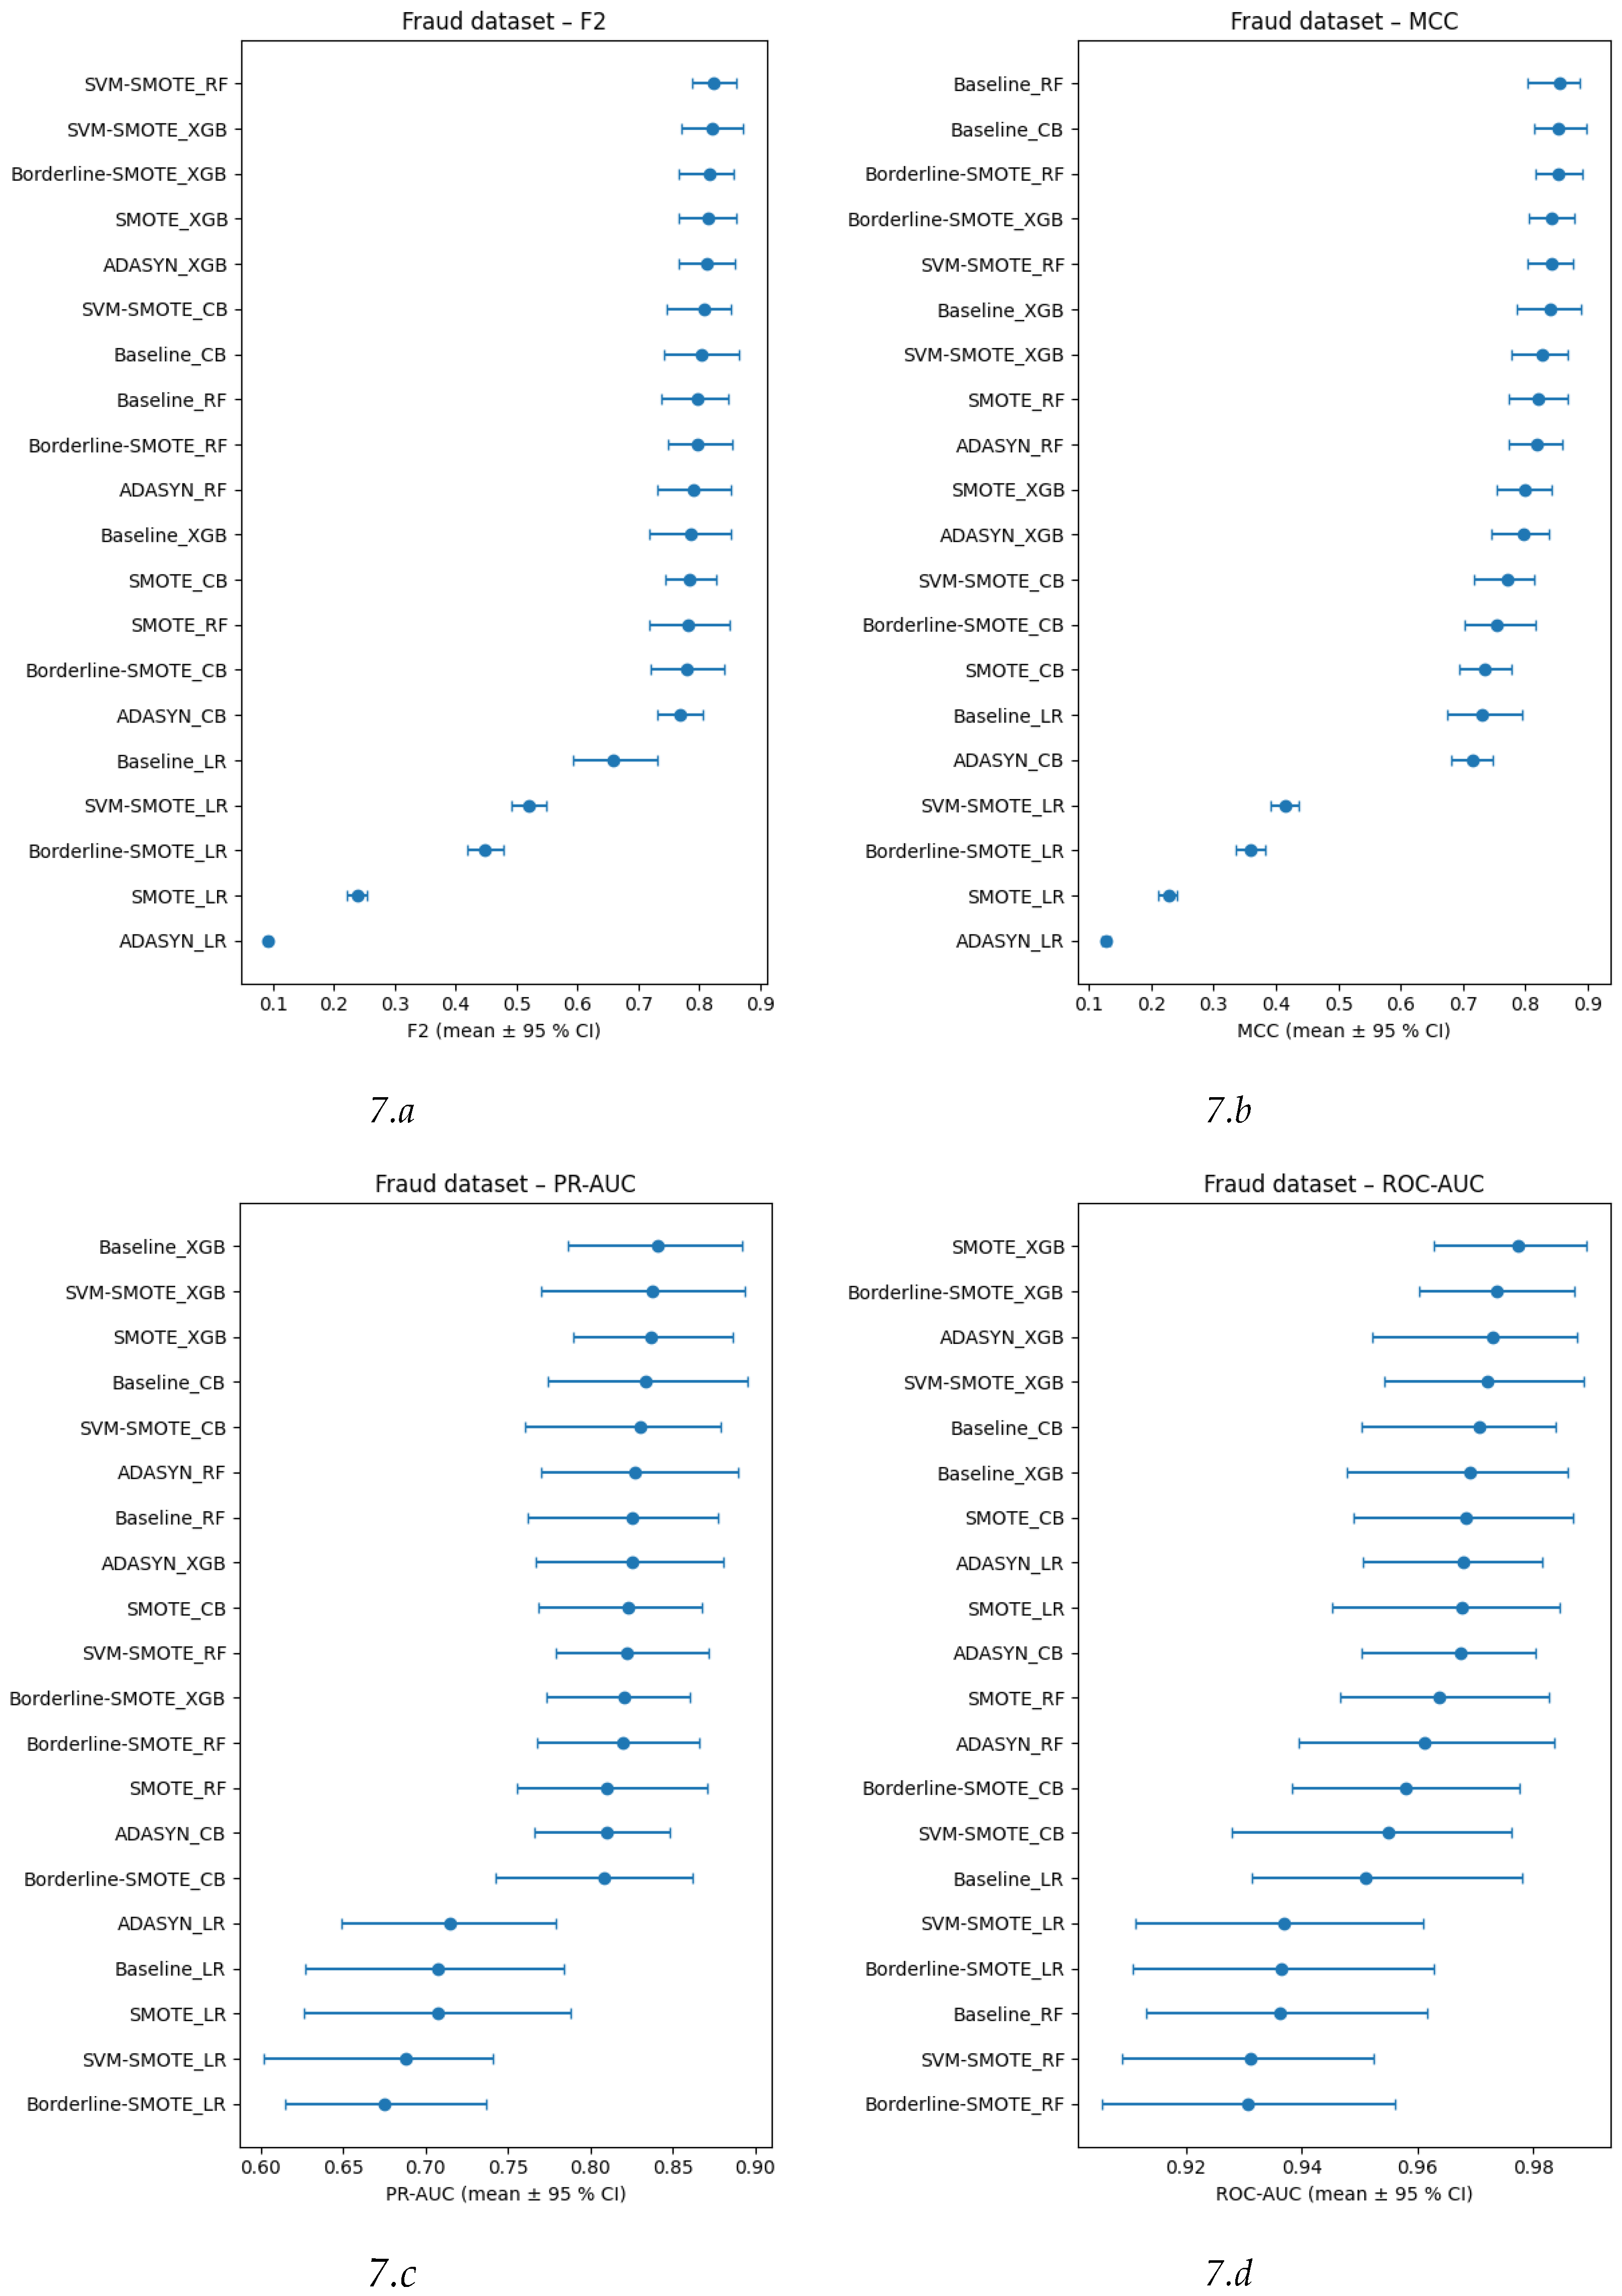
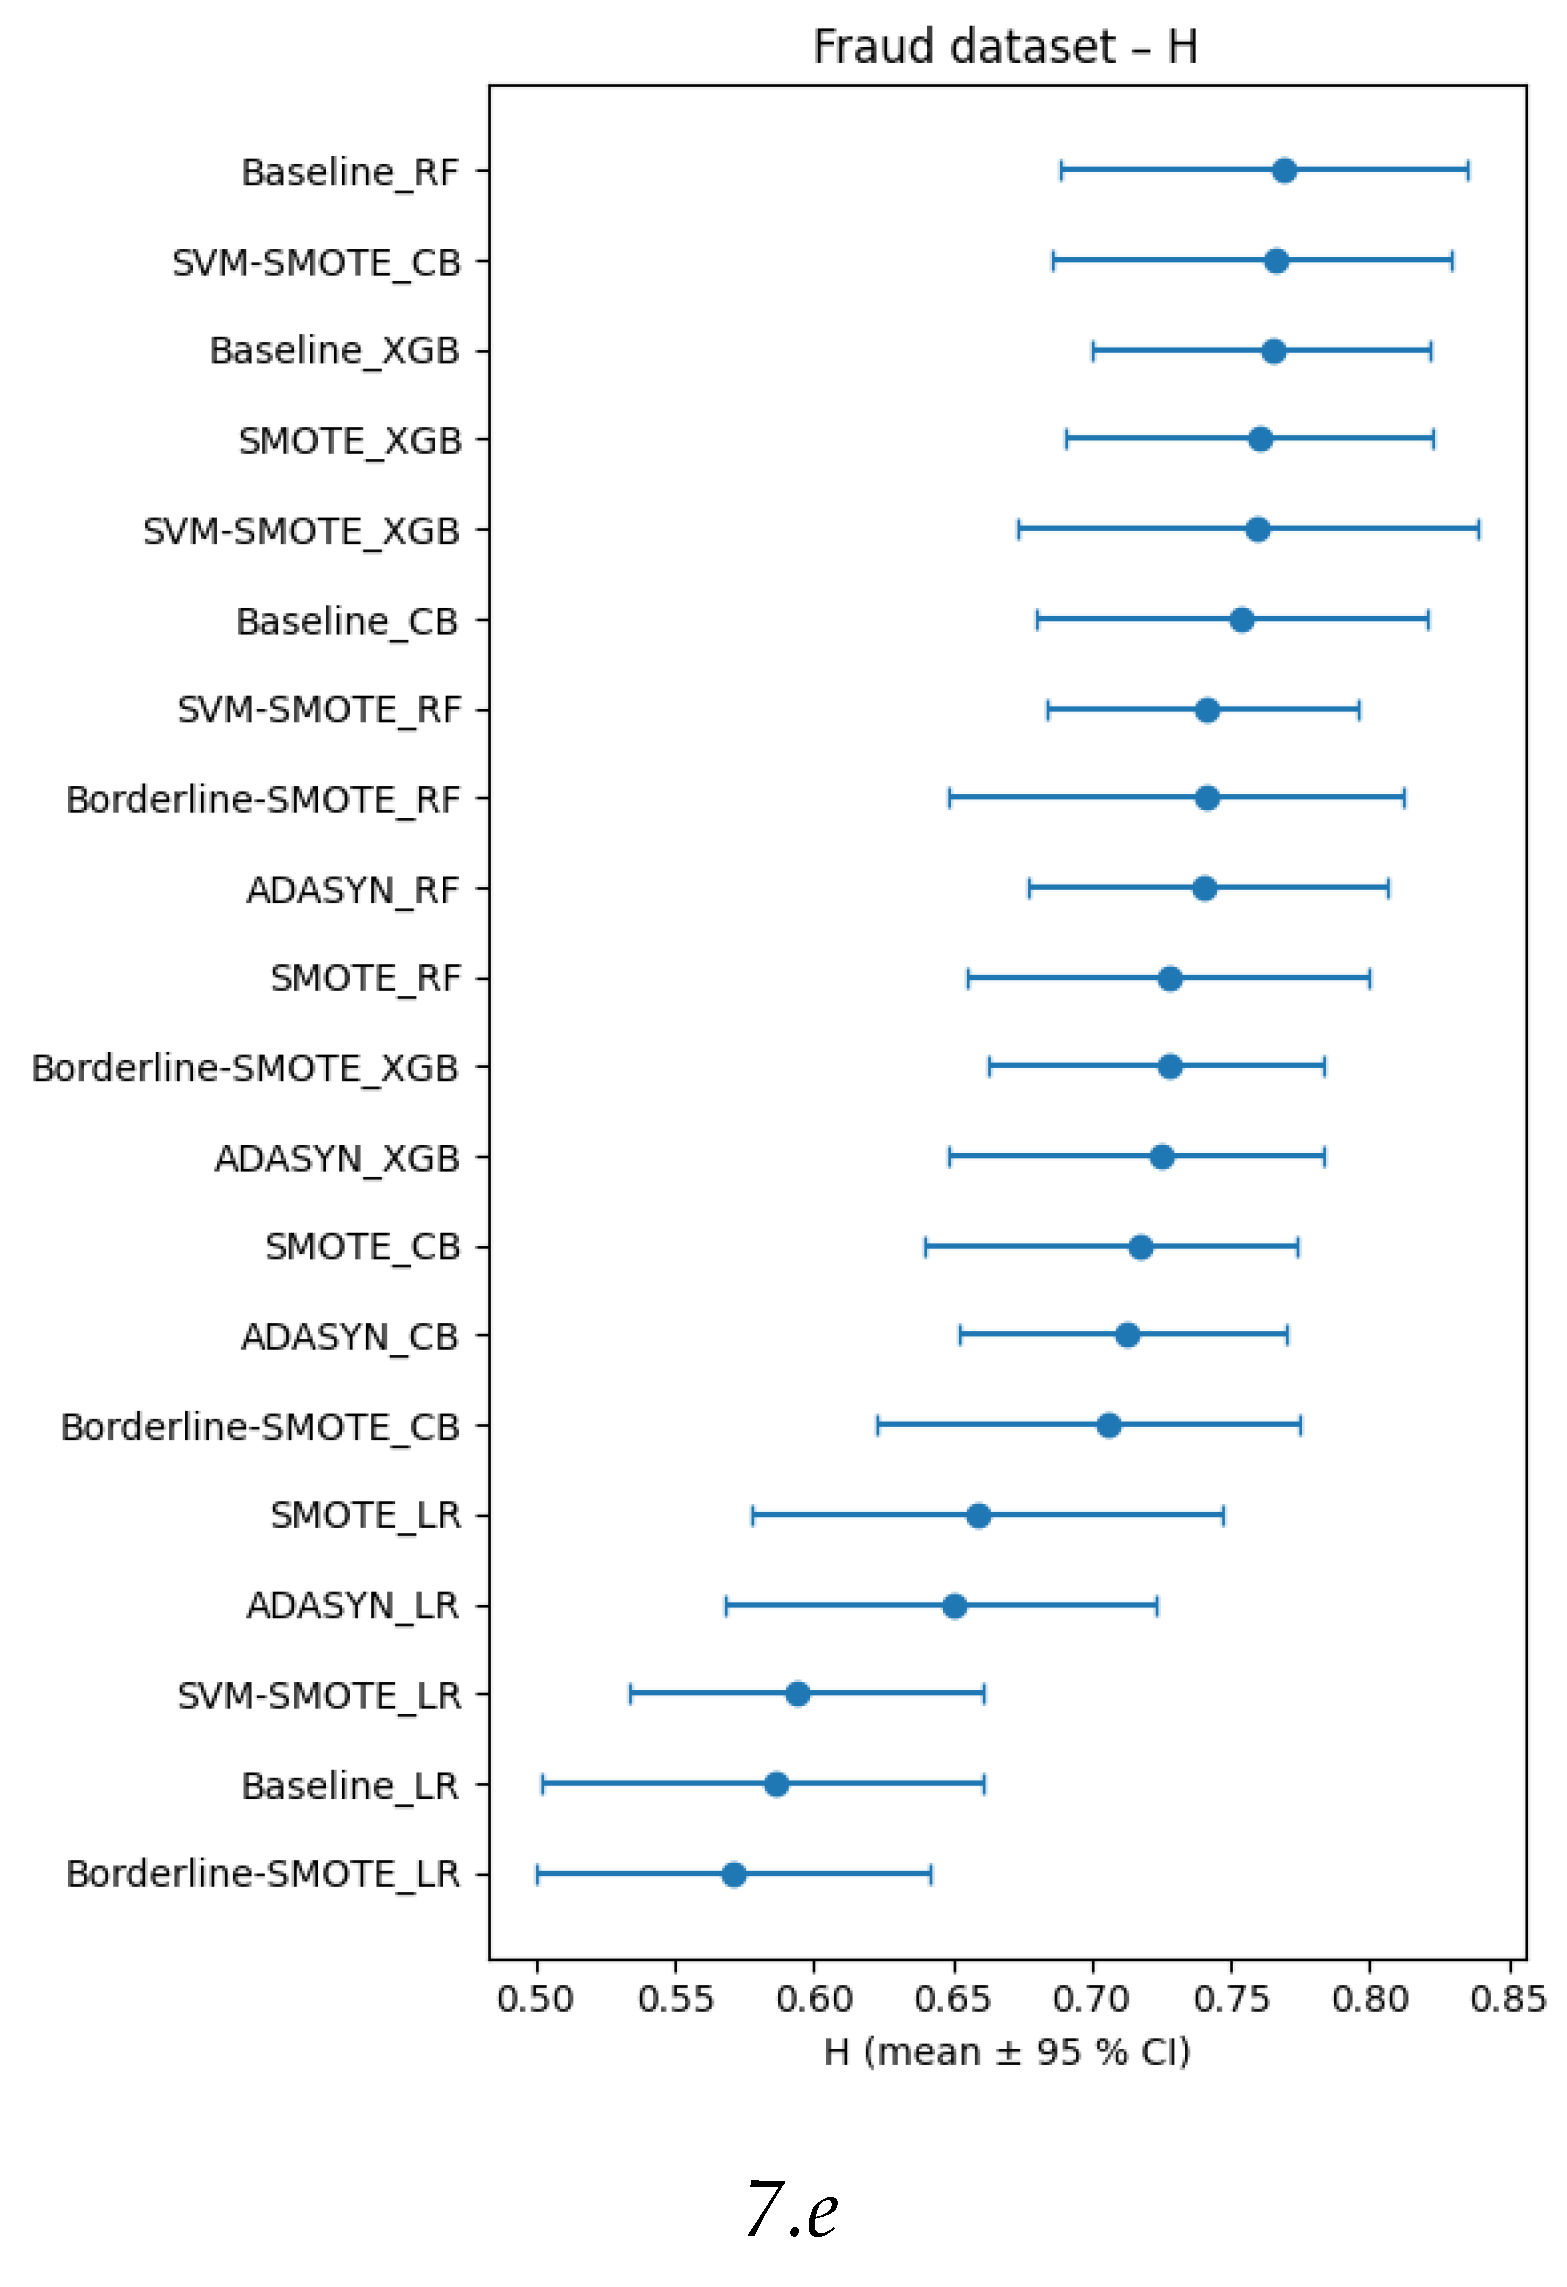
Figure 8.
Nemenyi critical-difference diagram derived from 200 stratified bootstrap resamples of the test fold on the Fraud dataset.
Figure 8.
Nemenyi critical-difference diagram derived from 200 stratified bootstrap resamples of the test fold on the Fraud dataset.
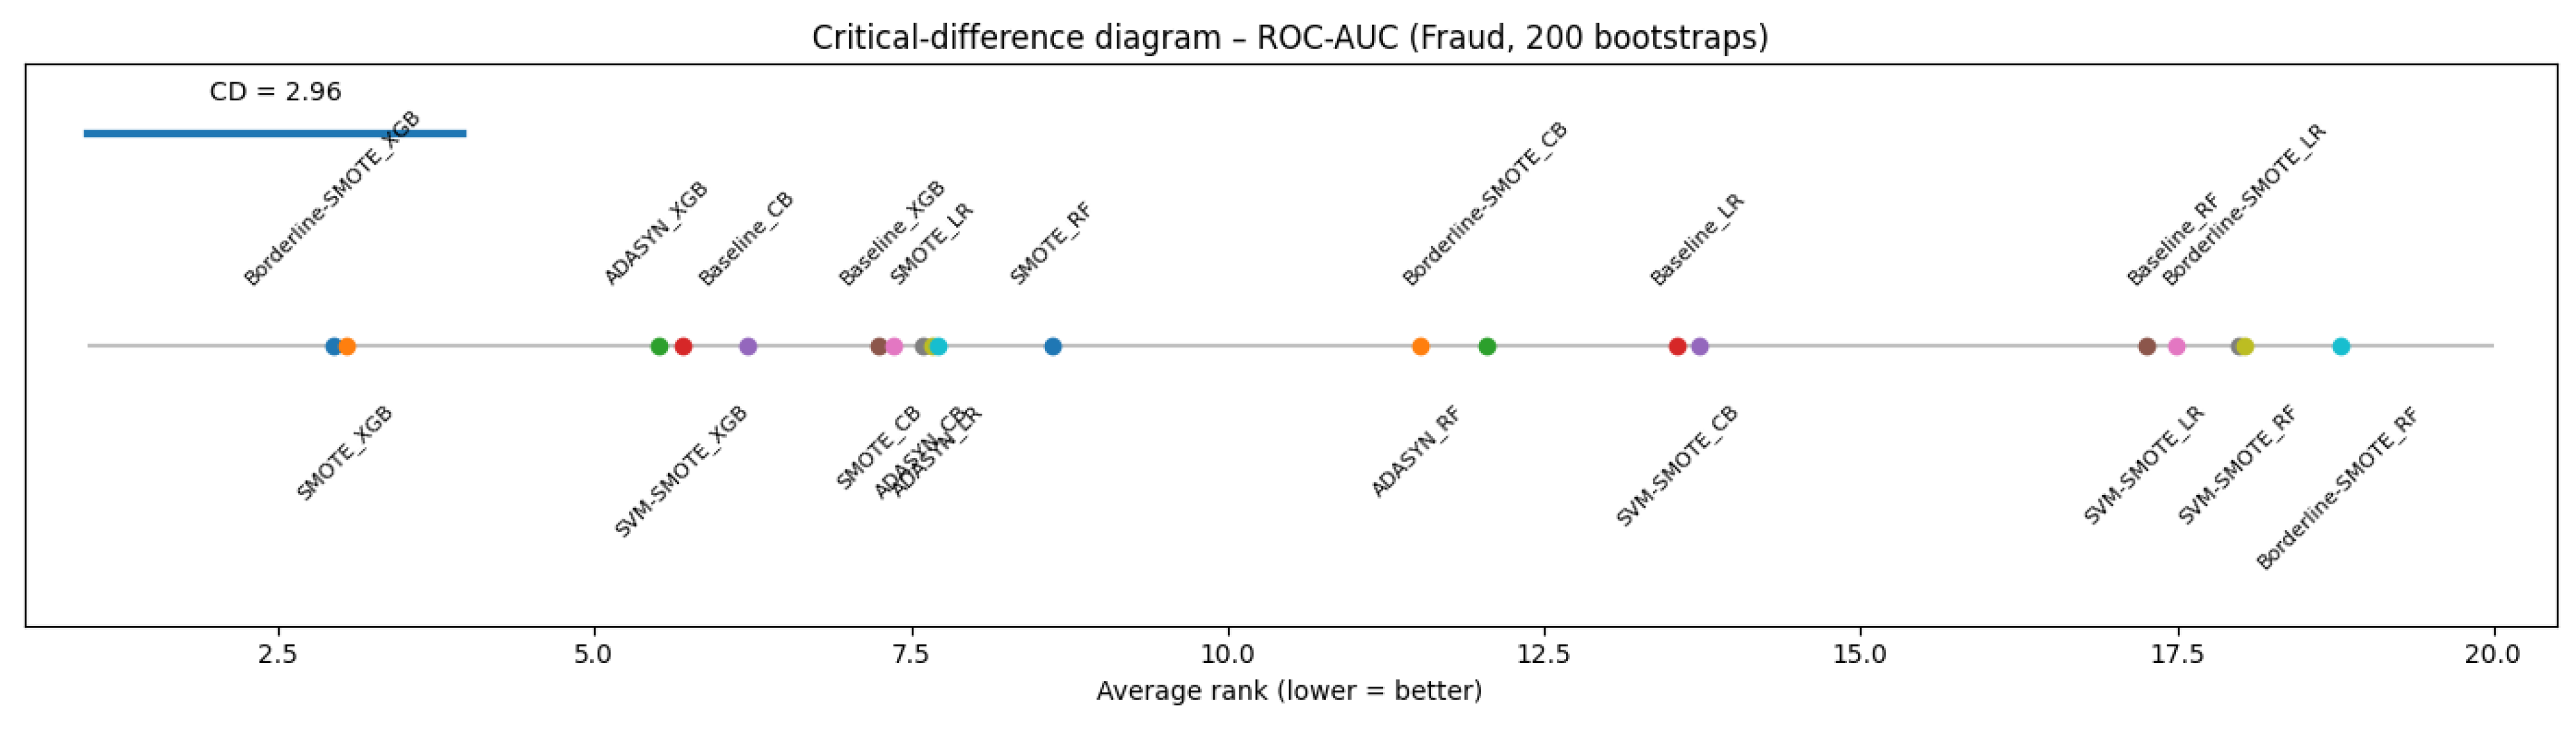
Figure 9.
a-e) Bootstrap-based 95 % confidence intervals for each evaluation metric on the Yeast dataset.
Figure 9.
a-e) Bootstrap-based 95 % confidence intervals for each evaluation metric on the Yeast dataset.
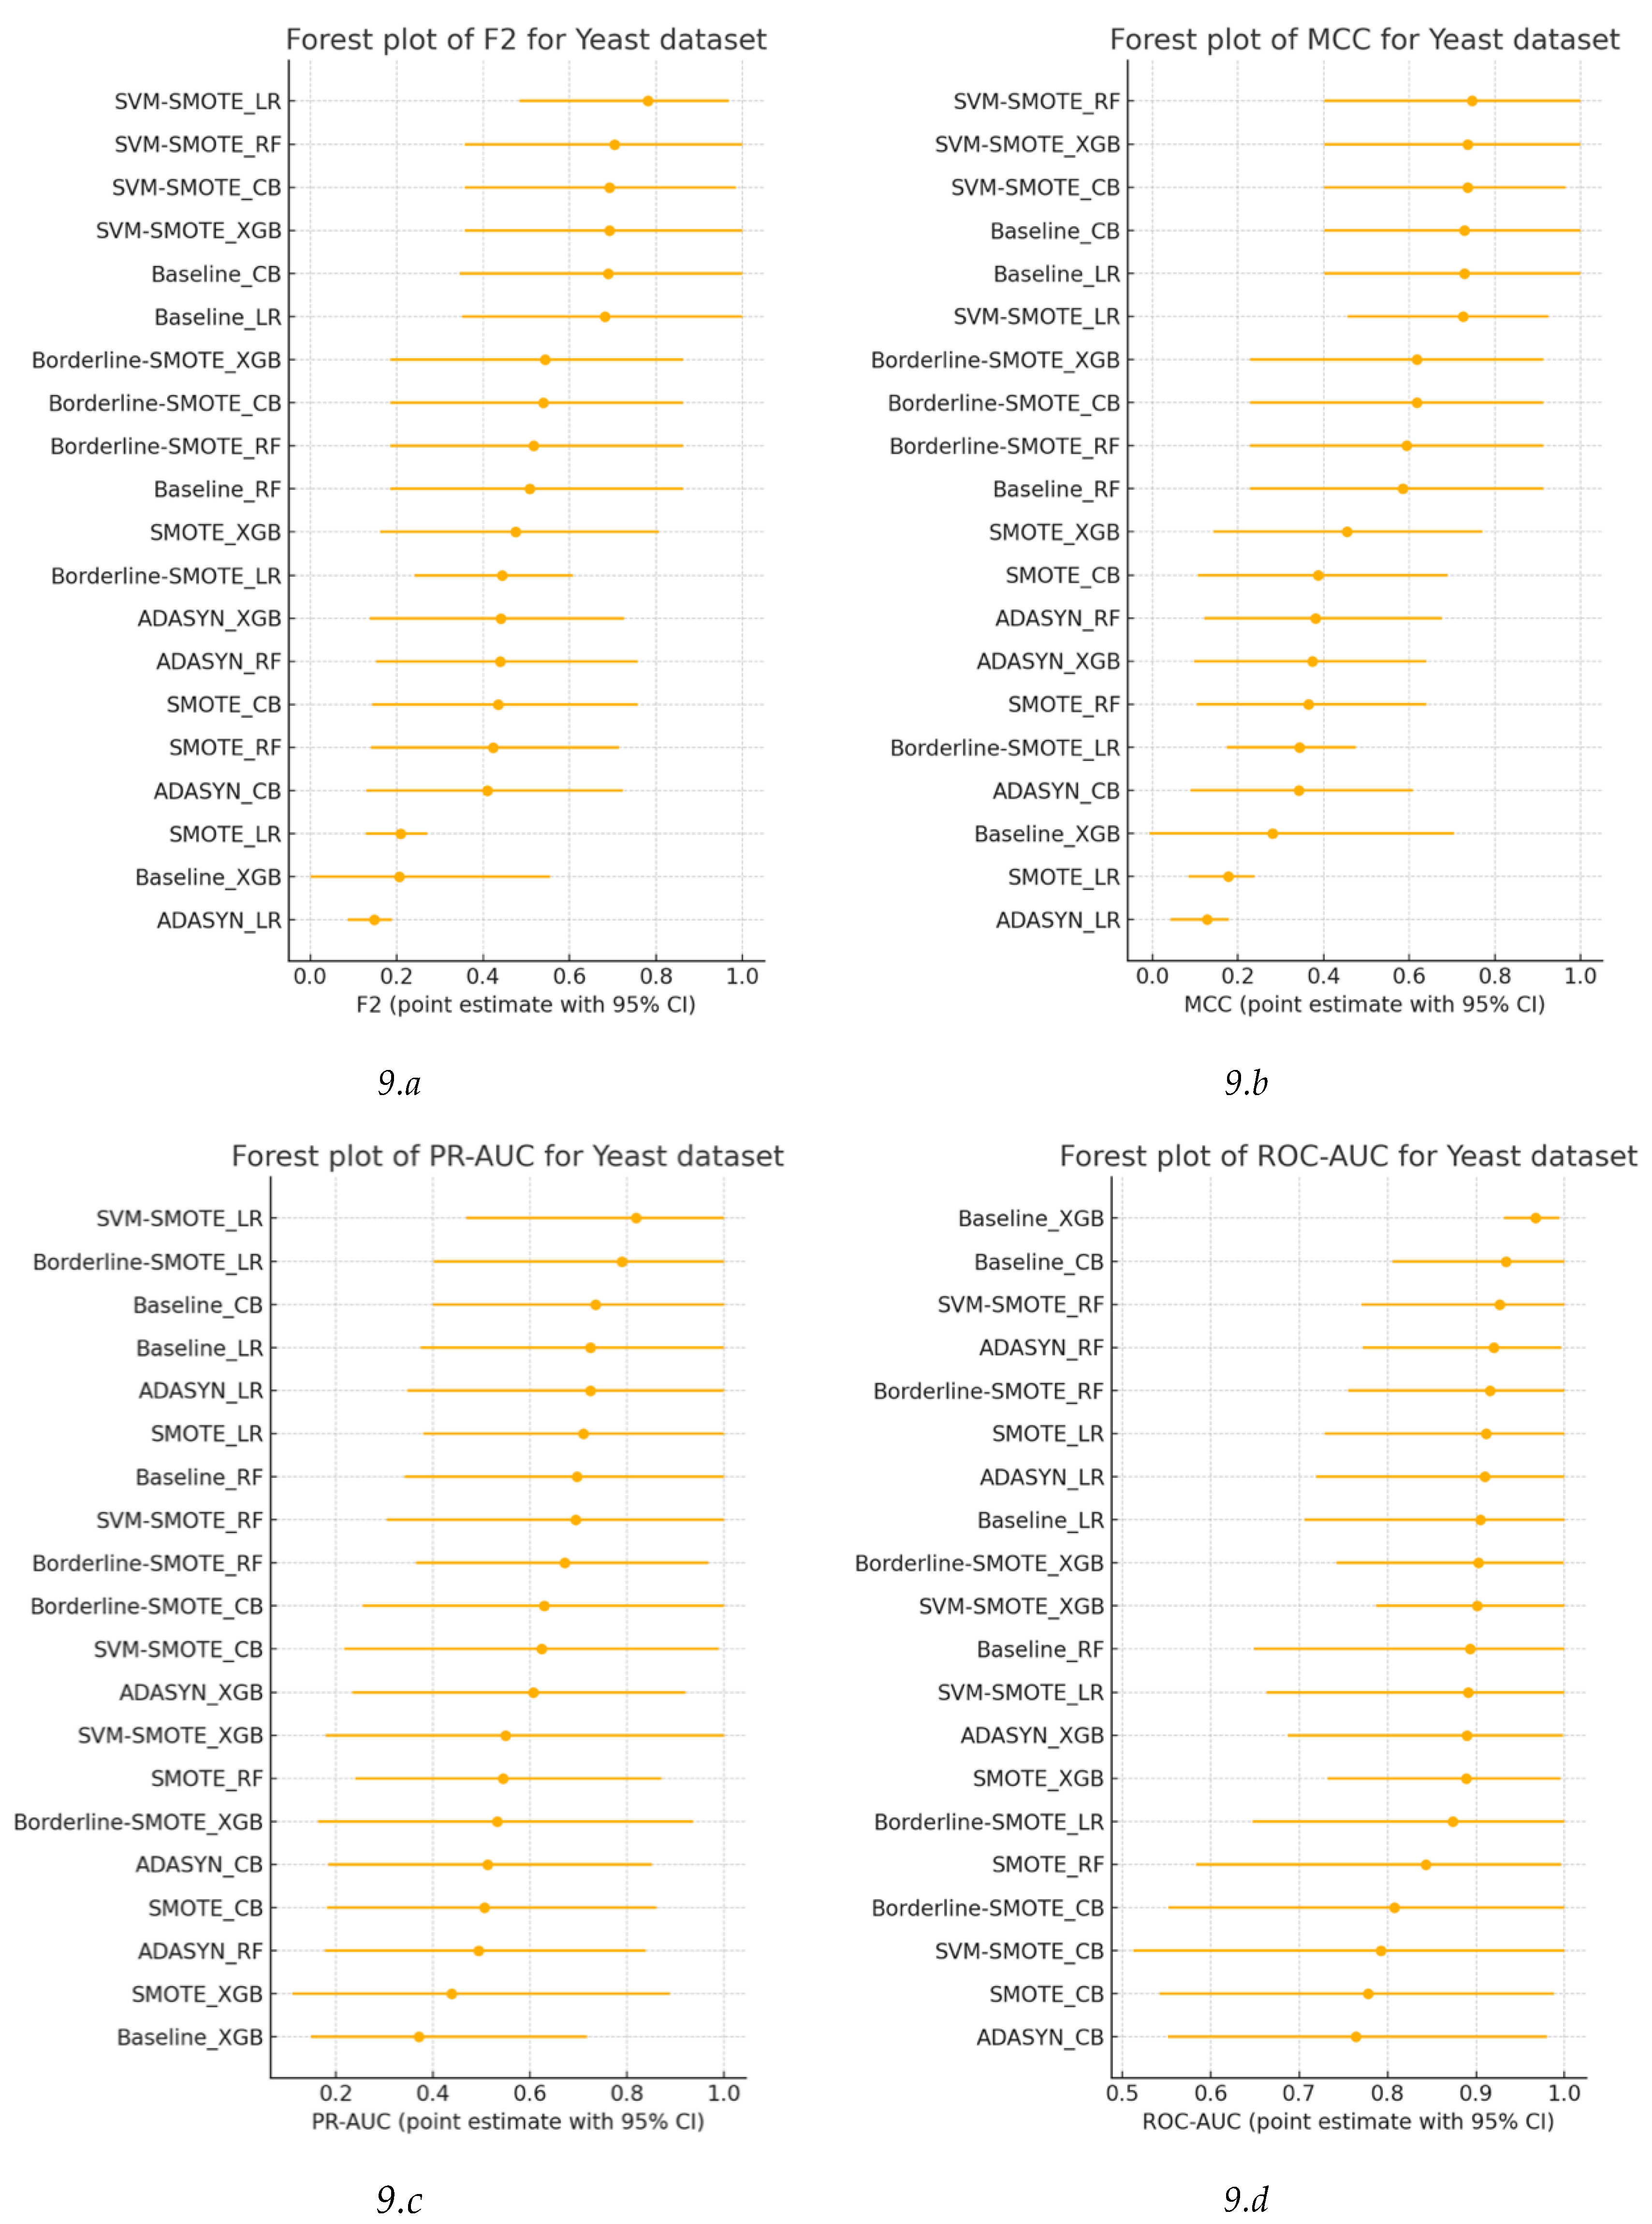
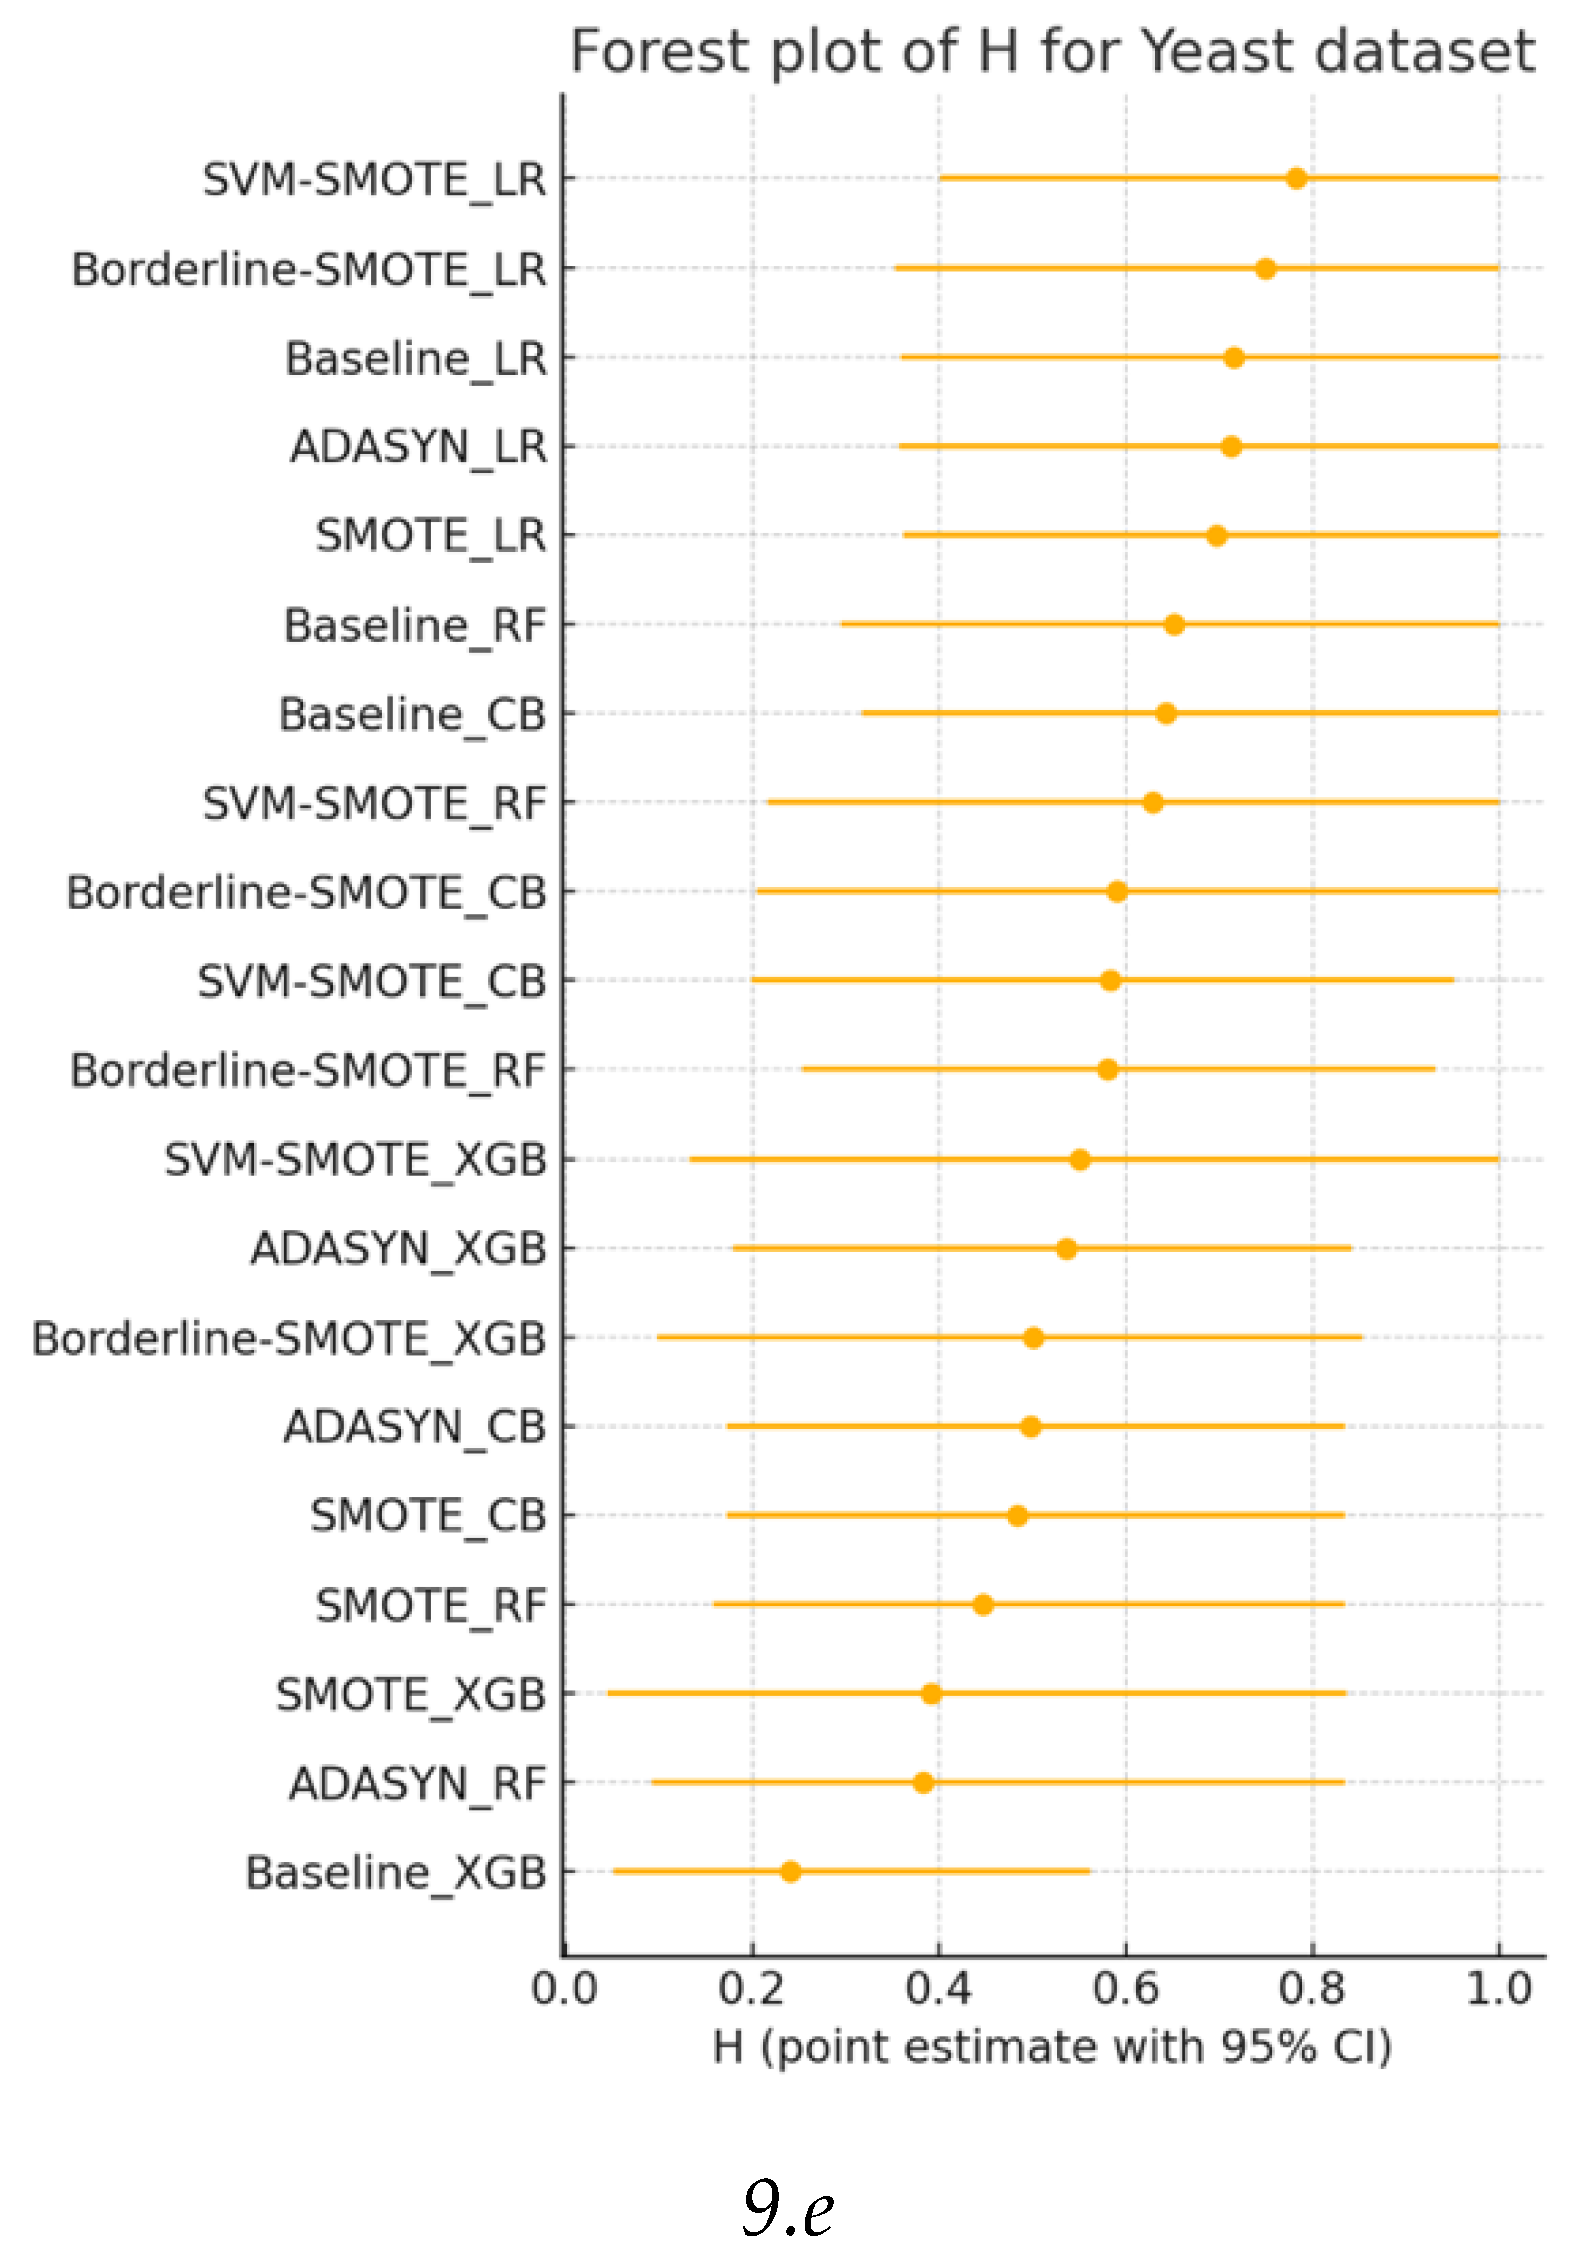
Figure 10.
Nemenyi critical-difference diagram derived from 200 stratified bootstrap resamples of the test fold on the Yeast dataset.
Figure 10.
Nemenyi critical-difference diagram derived from 200 stratified bootstrap resamples of the test fold on the Yeast dataset.
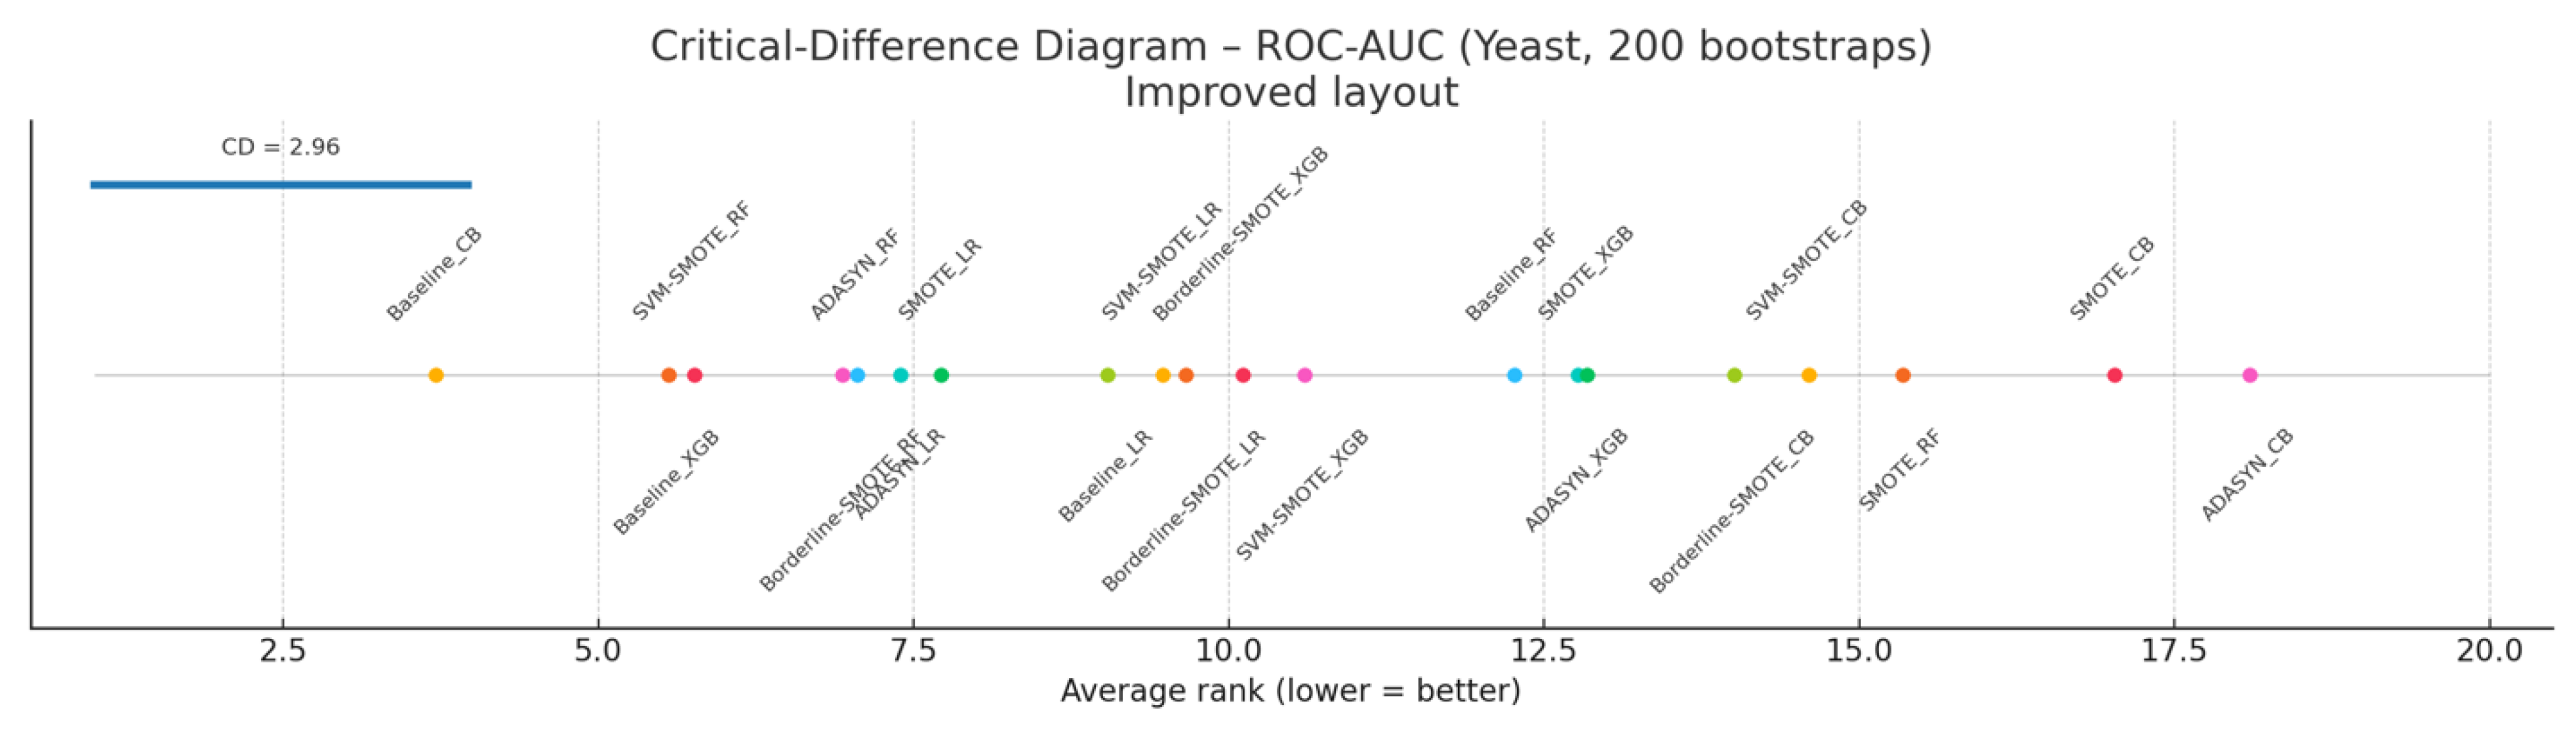
Figure 11.
a-e) Bootstrap-based 95 % confidence intervals for each evaluation metric on the Ozone dataset.
Figure 11.
a-e) Bootstrap-based 95 % confidence intervals for each evaluation metric on the Ozone dataset.
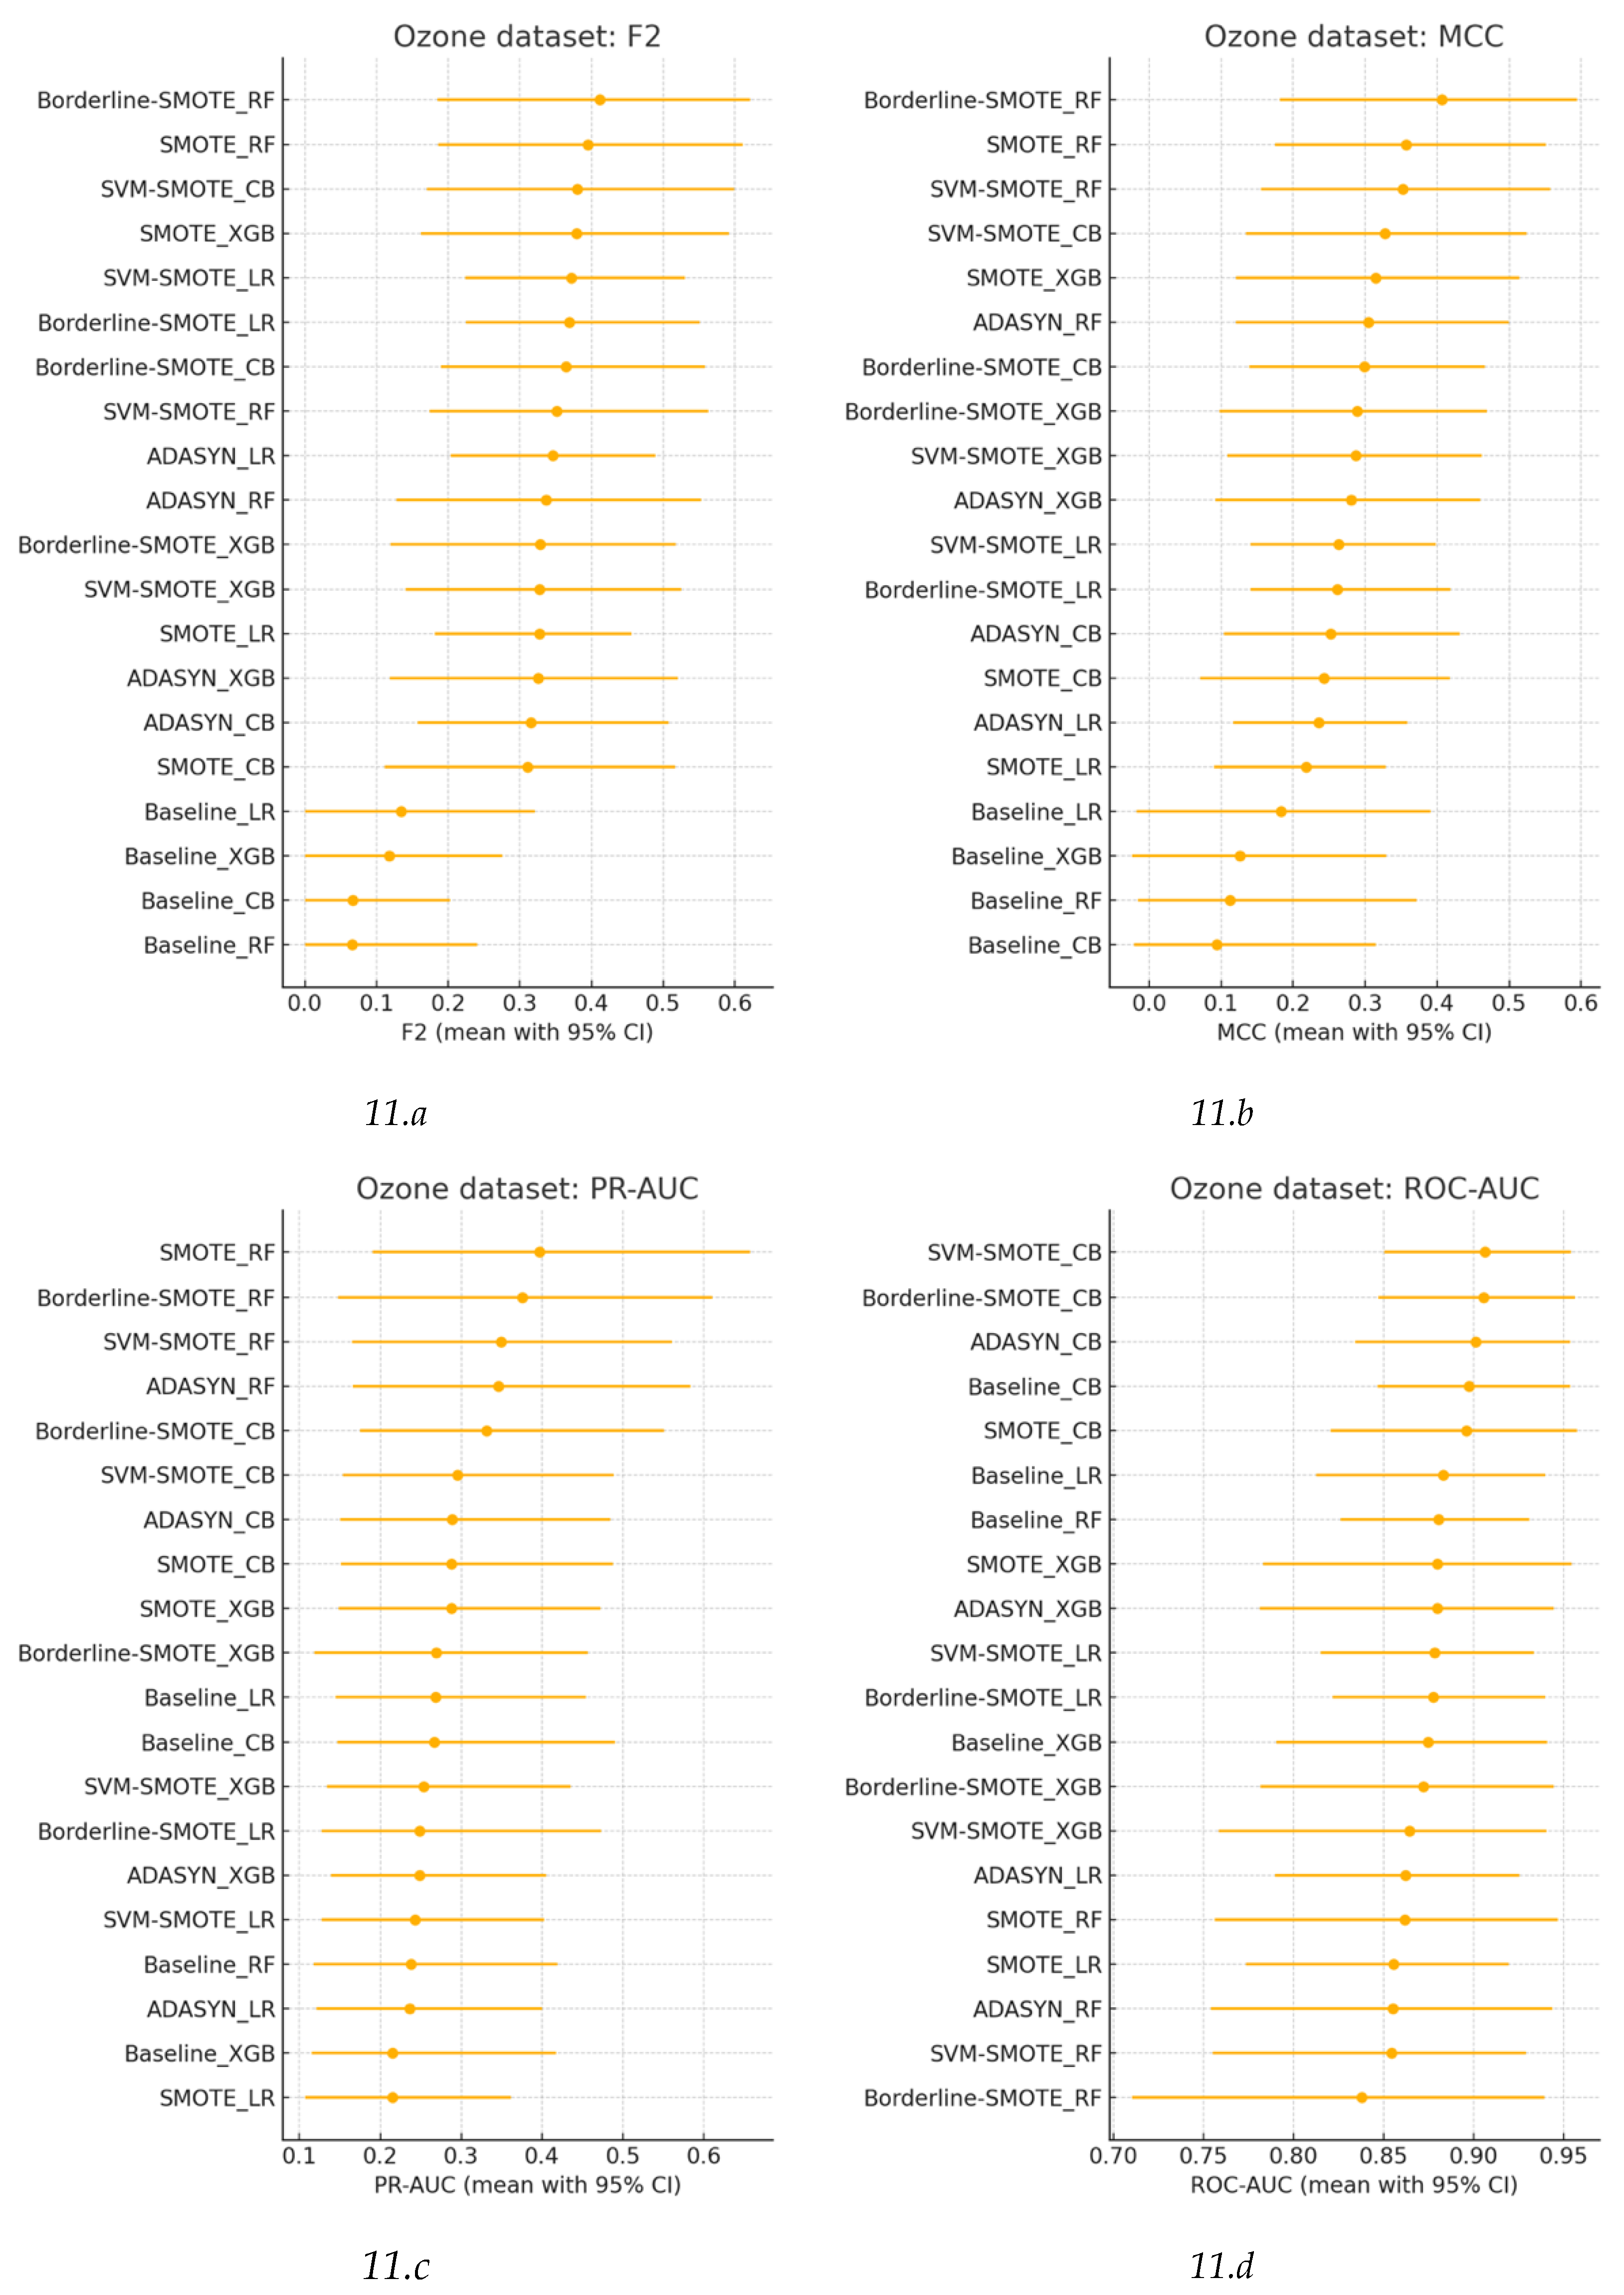
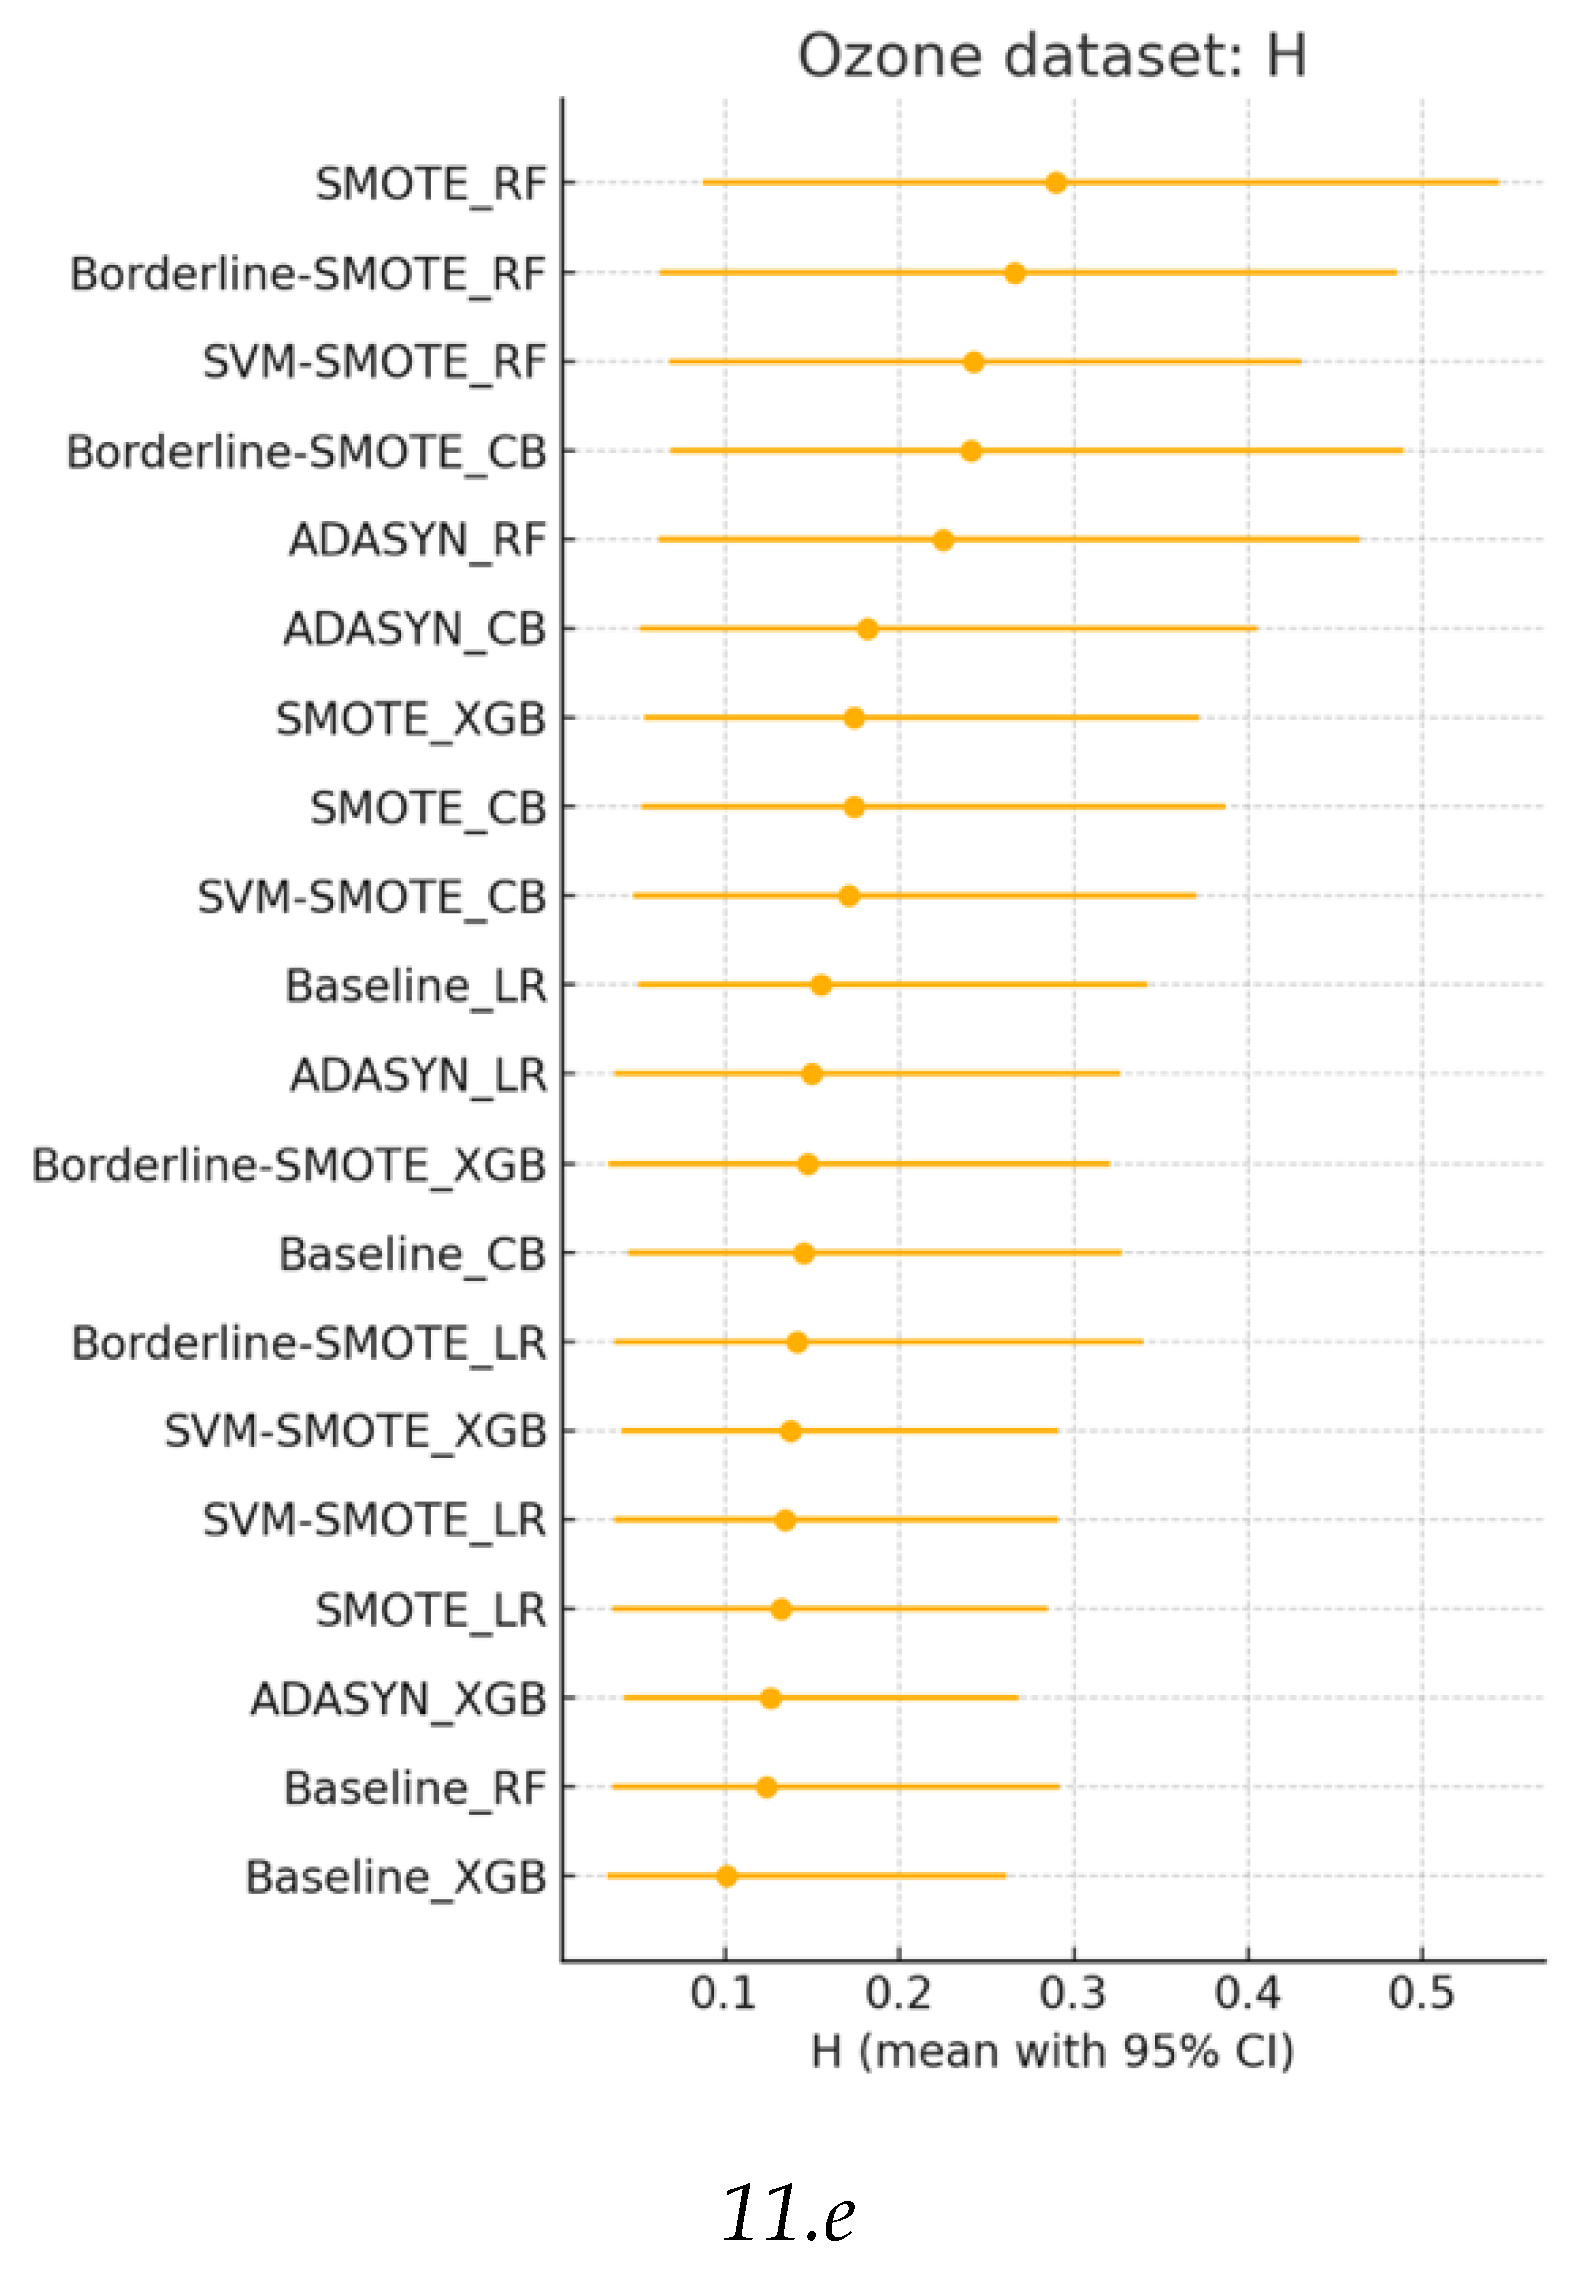
Figure 12.
Nemenyi critical-difference diagram derived from 200 stratified bootstrap resamples of the test fold on the Ozone dataset.
Figure 12.
Nemenyi critical-difference diagram derived from 200 stratified bootstrap resamples of the test fold on the Ozone dataset.
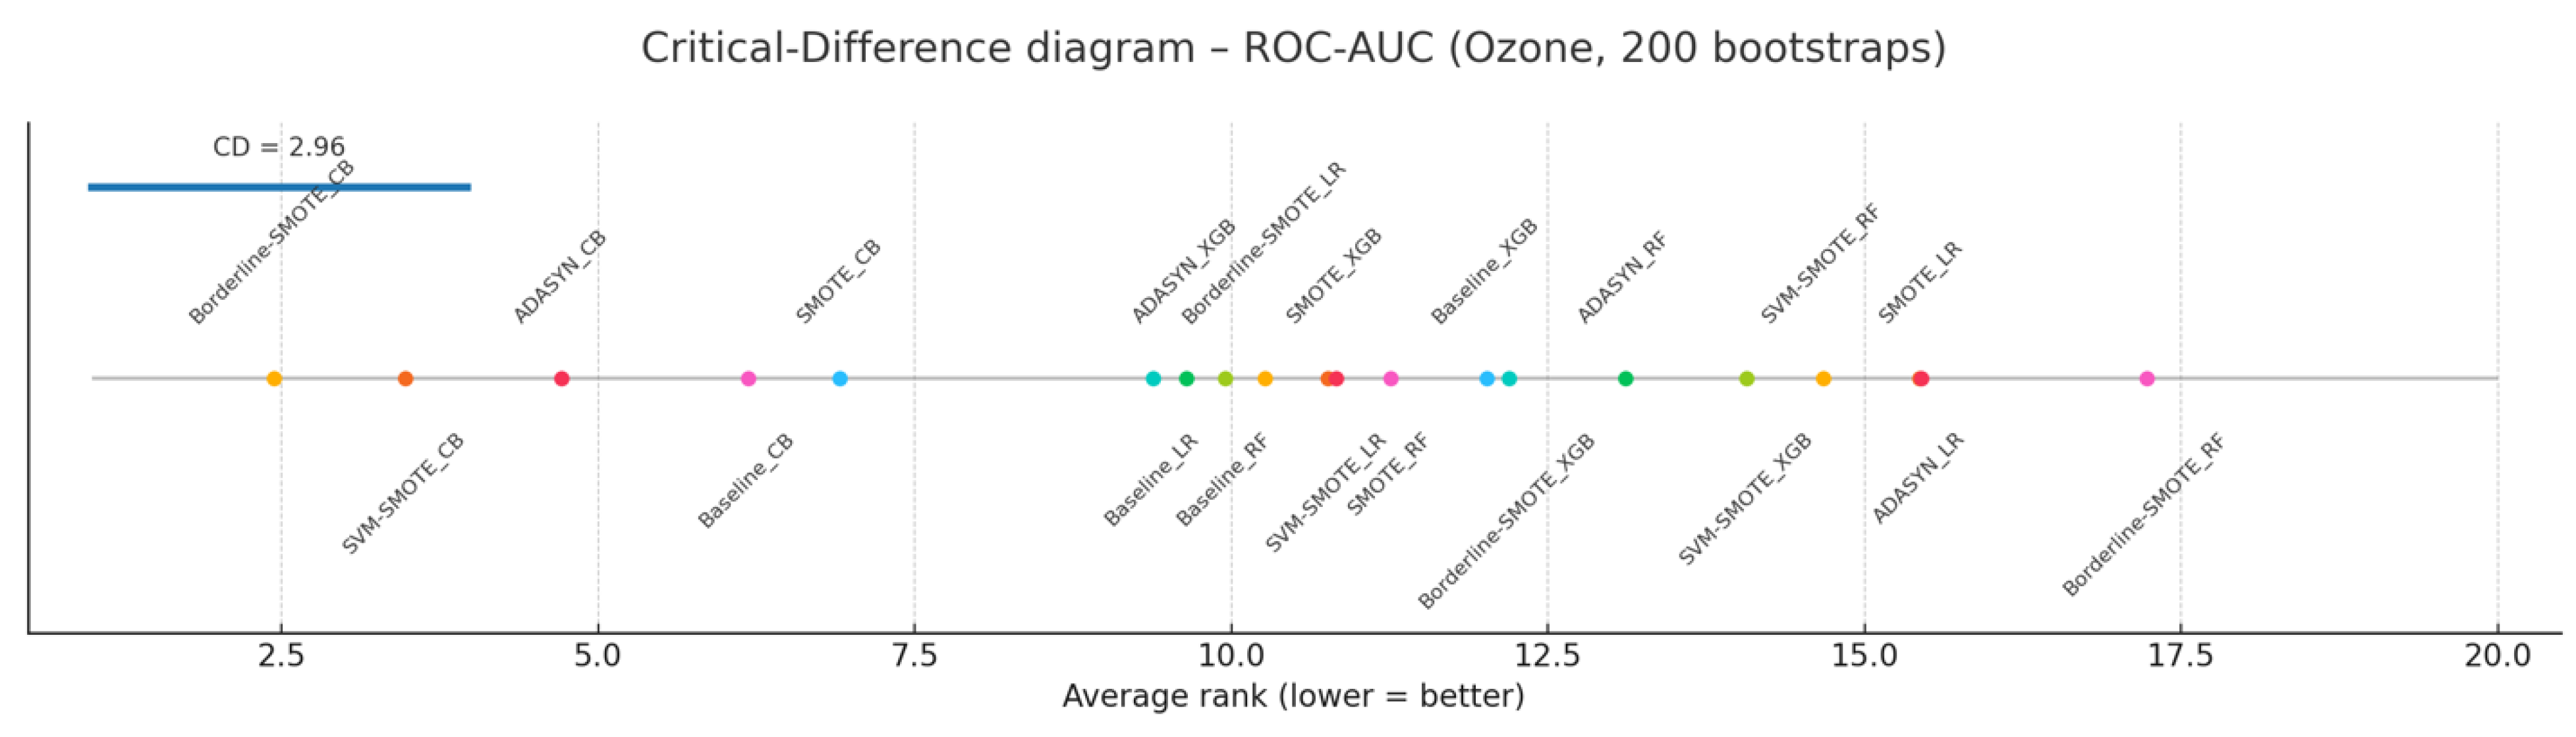
Table 1.
The details of the three publicly available datasets.
| Dataset | Positives | Negatives | Imbalance Rate | Features | Source |
|---|---|---|---|---|---|
| Credit-card Fraud | 492 | 284315 | 0.17% | 28 PCA-obscured transaction attributes | Kaggle [44] |
| Yeast Protein Localisation | 20 | 1464 | 1.35% | 8 physicochemical descriptors | UCI repository [45] |
| Ozone Level Detection | 57 | 1791 | 3.00% | 72 atmospheric covariates | UCI repository [46] |
Table 2.
The results on the credit-card fraud dataset.
| Baseline | SMOTE | Borderline-SMOTE | SVM-SMOTE | ADASYN | ||||||||||||||||
|---|---|---|---|---|---|---|---|---|---|---|---|---|---|---|---|---|---|---|---|---|
| RF | LR | XGB | CB | RF | LR | XGB | CB | RF | LR | XGB | CB | RF | LR | XGB | CB | RF | LR | XGB | CB | |
| ROC-AUC | 0.934 | 0.953 | 0.969 | 0.971 | 0.966 | 0.968 | 0.976 | 0.969 | 0.930 | 0.935 | 0.976 | 0.959 | 0.933 | 0.936 | 0.971 | 0.954 | 0.960 | 0.968 | 0.972 | 0.969 |
| PR-AUC | 0.821 | 0.708 | 0.840 | 0.836 | 0.819 | 0.705 | 0.836 | 0.823 | 0.818 | 0.670 | 0.823 | 0.815 | 0.827 | 0.687 | 0.834 | 0.827 | 0.822 | 0.711 | 0.827 | 0.807 |
| F2 | 0.796 | 0.658 | 0.787 | 0.805 | 0.793 | 0.237 | 0.814 | 0.783 | 0.795 | 0.448 | 0.820 | 0.787 | 0.828 | 0.522 | 0.817 | 0.804 | 0.783 | 0.090 | 0.814 | 0.766 |
| MCC | 0.855 | 0.731 | 0.840 | 0.856 | 0.831 | 0.227 | 0.800 | 0.733 | 0.851 | 0.360 | 0.845 | 0.756 | 0.843 | 0.416 | 0.827 | 0.768 | 0.814 | 0.126 | 0.800 | 0.713 |
| H | 0.761 | 0.574 | 0.756 | 0.749 | 0.727 | 0.651 | 0.752 | 0.706 | 0.732 | 0.558 | 0.727 | 0.702 | 0.739 | 0.587 | 0.751 | 0.751 | 0.727 | 0.638 | 0.717 | 0.698 |
| FP | 5 | 15 | 8 | 7 | 13 | 2019 | 35 | 65 | 6 | 647 | 15 | 50 | 18 | 481 | 22 | 50 | 17 | 6595 | 35 | 71 |
| FN | 35 | 56 | 36 | 33 | 34 | 18 | 26 | 26 | 35 | 26 | 29 | 28 | 27 | 23 | 28 | 25 | 35 | 16 | 26 | 28 |
| TP | 113 | 92 | 112 | 115 | 114 | 130 | 122 | 122 | 113 | 122 | 119 | 120 | 121 | 125 | 120 | 123 | 113 | 132 | 122 | 120 |
| TN | 85290 | 85280 | 85287 | 85288 | 85282 | 83276 | 85260 | 85230 | 85289 | 84648 | 85280 | 85245 | 85277 | 84814 | 85273 | 85245 | 85278 | 78700 | 85260 | 85224 |
Table 3.
The summary of the analysis on the Fraud dataset.
| Metric | Observed range | Sensitivity to FP/FN variations | Key observations |
|---|---|---|---|
| ROC-AUC | 0.930 – 0.976 (∆ ≈ 0.046) | Minimal. ROC-AUC uses the empirical FPR denominator (≈ 85 k) and therefore changes by < 0.01 when FP rises from 5 (RF baseline) to 6595 (LR + ADASYN). | LR baseline vs. LR + SMOTE: FP ×135↑ (15 → 2 019) yet ROC-AUC increases (0.953 → 0.968). |
| PR-AUC | 0.669 – 0.839 (∆ ≈ 0.17) | Moderate. Precision penalises each additional FP, so PR-AUC drops from 0.821 to 0.704 when LR baseline is oversampled with SMOTE (FP 15 → 2019). However, the metric is threshold-free and does not reflect the absolute alarm burden in the deployed cut-off. | CB baseline (FP = 7) vs. CB + ADASYN (FP = 71): PR-AUC falls 0.836 → 0.807, a visible but still modest decline given the ten-fold FP increase. |
| F2 | 0.000 – 0.827 (∆ ≈ 0.83) | High. By quadrupling recall weight, F₂ rewards FP-heavy configurations if they gain enough TP, but collapses when precision implodes. LR + SMOTE attains the highest TP (130) and lowest FN (18) yet F₂ = 0.237—demonstrating severe precision penalty. | RF baseline (TP = 113, FP = 5) vs. RF + ADASYN (TP = 113, FP = 17): identical recall, FP ×3.4 ↑, F₂ drops from 0.795 → 0.782. |
| MCC | 0.125 – 0.855 (∆ ≈ 0.73) | Very high and symmetric. MCC falls almost linearly with either FP or FN explosions. It ranks LR + SMOTE (MCC = 0.227) and LR + ADASYN (0.126) near the bottom despite top-quartile ROC-AUC values, exposing their high alarm costs. | MCC and F₂ exhibit Kendall τ ≈ 0.90 across the grid (see Section 4.4), confirming consistent ordering once a threshold is fixed. |
| H-measure | 0.558 – 0.761 (∆ ≈ 0.203) |
Moderate-to-high. Reflects meaningful sensitivity to FP and FN variations, providing clearer differentiation compared to ROC-AUC. | LR baseline (H=0.574, FP=15) vs. LR + ADASYN (H=0.638, FP=6595): modest numeric change, but clearly identifies classifiers suffering from poor precision, aligning closer to MCC and F₂ in penalizing misclassification. |
Table 4.
The results on the Yeast dataset.
| Baseline | SMOTE | Borderline-SMOTE | SVM-SMOTE | ADASYN | ||||||||||||||||
|---|---|---|---|---|---|---|---|---|---|---|---|---|---|---|---|---|---|---|---|---|
| RF | LR | XGB | CB | RF | LR | XGB | CB | RF | LR | XGB | CB | RF | LR | XGB | CB | RF | LR | XGB | CB | |
| ROC-AUC | 0.882 | 0.899 | 0.966 | 0.934 | 0.850 | 0.908 | 0.884 | 0.790 | 0.917 | 0.888 | 0.902 | 0.797 | 0.921 | 0.888 | 0.897 | 0.791 | 0.918 | 0.908 | 0.882 | 0.772 |
| PR-AUC | 0.657 | 0.679 | 0.299 | 0.722 | 0.543 | 0.679 | 0.375 | 0.526 | 0.660 | 0.809 | 0.450 | 0.600 | 0.633 | 0.809 | 0.468 | 0.599 | 0.451 | 0.679 | 0.582 | 0.518 |
| F2 | 0.536 | 0.690 | 0.192 | 0.690 | 0.441 | 0.207 | 0.484 | 0.455 | 0.536 | 0.455 | 0.536 | 0.536 | 0.690 | 0.781 | 0.690 | 0.690 | 0.441 | 0.146 | 0.429 | 0.417 |
| MCC | 0.608 | 0.727 | 0.283 | 0.727 | 0.377 | 0.174 | 0.455 | 0.398 | 0.608 | 0.351 | 0.608 | 0.608 | 0.727 | 0.717 | 0.727 | 0.727 | 0.377 | 0.125 | 0.358 | 0.341 |
| H | 0.577 | 0.677 | 0.127 | 0.572 | 0.400 | 0.677 | 0.353 | 0.501 | 0.534 | 0.727 | 0.411 | 0.530 | 0.533 | 0.727 | 0.511 | 0.530 | 0.303 | 0.677 | 0.505 | 0.501 |
| FP | 1 | 1 | 1 | 1 | 7 | 92 | 4 | 6 | 1 | 26 | 1 | 1 | 1 | 3 | 1 | 1 | 7 | 142 | 8 | 9 |
| FN | 3 | 2 | 5 | 2 | 3 | 1 | 3 | 3 | 3 | 1 | 3 | 3 | 2 | 1 | 2 | 2 | 3 | 1 | 3 | 3 |
| TP | 3 | 4 | 1 | 4 | 3 | 5 | 3 | 3 | 3 | 5 | 3 | 3 | 4 | 5 | 4 | 4 | 3 | 5 | 3 | 3 |
| TN | 439 | 439 | 439 | 439 | 433 | 348 | 436 | 434 | 439 | 414 | 439 | 439 | 439 | 437 | 439 | 439 | 433 | 298 | 432 | 431 |
Table 5.
The summary of the analysis on the Yeast dataset.
| Metric | Observed range | Sensitivity to FP/FN variations | Key observations |
|---|---|---|---|
| ROC-AUC | 0.772 – 0.966 (∆ ≈ 0.194) | Minimal-to-moderate. Due to the dataset’s high negative class size (≈ 439), ROC-AUC scores exhibit modest sensitivity despite significant false positives variation. | Logistic Regression baseline (FP=1, ROC-AUC=0.899) vs. LR + ADASYN (FP=142, ROC-AUC=0.908): ROC-AUC slightly increases despite an extreme 142-fold FP rise. |
| PR-AUC | 0.299 – 0.809 (∆ ≈ 0.510) | Moderate-to-high. Precision directly penalizes false positives, clearly reflecting severe FP increases. | LR baseline (FP=1, PR-AUC=0.679) vs. LR + ADASYN (FP=142, PR-AUC=0.679): limited numeric change despite significant FP escalation, indicating threshold-free limitation. |
| F₂ | 0.146 – 0.781 (∆ ≈ 0.635) | High. Heavily sensitive to false positives, significantly penalizing classifiers with precision deterioration. | LR + SMOTE: achieves high ROC-AUC (0.908) but very poor F₂ (0.207) due to high FP (92), clearly demonstrating sensitivity to precision collapse. |
| MCC | 0.125 – 0.727 (∆ ≈ 0.602) | Very high and symmetric. Significantly penalizes both false positives and false negatives, clearly reflecting overall performance deterioration. | LR + ADASYN yields MCC=0.125 despite ROC-AUC=0.908, accurately reflecting severe classification cost due to FP (142). MCC consistently ranks high-FP scenarios lower. |
| H-measure | 0.127 – 0.727 (∆ ≈ 0.600) | Moderate-to-high. Reflects significant sensitivity to variations in FP and FN, providing clearer differentiation compared to ROC-AUC. | XGB baseline (H=0.127, FP=1) vs. LR baseline (H=0.677, FP=1): large variation indicating H-measure’s sensitivity to model-specific performance, aligning closely with MCC and F₂. |
Table 7.
The summary of the analysis on the Ozone dataset.
| Metric | Observed range | Sensitivity to FP/FN variations | Key observations |
|---|---|---|---|
| ROC-AUC | 0.833 – 0.908 (∆ ≈ 0.075) | Minimal-to-moderate. Given the relatively high negative class size (≈ 530), ROC-AUC scores remain stable despite notable increases in false positives. | Logistic Regression baseline (FP=4, ROC-AUC=0.881) vs. LR + ADASYN (FP=56, ROC-AUC=0.860): minimal ROC-AUC change despite a 14-fold FP rise, illustrating limited sensitivity. |
| PR-AUC | 0.195 – 0.362 (∆ ≈ 0.167) | Moderate. Precision penalizes increases in false positives but the threshold-free nature limits sensitivity. | Random Forest baseline (PR-AUC=0.211, FP=1) vs. RF + SMOTE (PR-AUC=0.362, FP=11): visible improvement in PR-AUC reflecting better precision-recall balance despite higher FP, indicating threshold-free limitations. |
| F₂ | 0.068 – 0.417 (∆ ≈ 0.349) | High. Strongly sensitive to FP; even moderate FP increases lead to notable F₂ reductions, clearly penalizing precision loss. | XGB with Borderline-SMOTE: moderate ROC-AUC (0.874) contrasts sharply with relatively low F₂ (0.337), clearly revealing the precision collapse impact with FP=15. |
| MCC | 0.094 – 0.407 (∆ ≈ 0.313) | Very high and symmetric. Clearly decreases with increases in FP or FN, accurately reflecting real performance decline. | LR + SMOTE: despite ROC-AUC (0.860), MCC drops significantly to 0.225 due to FP (57), highlighting MCC’s sensitivity to misclassification costs. |
| H-measure | 0.064 – 0.237 (∆ ≈ 0.173) | Moderate-to-high. Captures the performance sensitivity to FP and FN variations more clearly than ROC-AUC, providing a more realistic assessment. | RF + SMOTE (H=0.237, FP=11) clearly outperforms LR + ADASYN (H=0.105, FP=56), effectively reflecting differences in false alarm costs and model reliability. |
Table 8.
Kendall rank correlations (τ) and p-values between metrics on the Fraud dataset.
| Metric 1 | Metric 2 | τ | p-value |
|---|---|---|---|
| PR-AUC | ROC-AUC | 0.337 | 0.039762 |
| PR-AUC | F₂ | 0.565 | 0.000514 |
| PR-AUC | MCC | 0.438 | 0.007054 |
| PR-AUC | H | 0.695 | 0.000003 |
| ROC-AUC | F₂ | 0.216 | 0.183217 |
| ROC-AUC | MCC | 0.047 | 0.770170 |
| ROC-AUC | H | 0.179 | 0.288378 |
| F₂ | MCC | 0.640 | 0.000085 |
| F₂ | H | 0.533 | 0.001043 |
| MCC | H | 0.617 | 0.000146 |
Table 9.
Kendall rank correlations (τ) and p-values between metrics on the Yeast dataset.
| Metric 1 | Metric 2 | τ | p-value |
|---|---|---|---|
| PR-AUC | ROC-AUC | 0.105 | 0.5424221 |
| PR-AUC | F₂ | 0.210 | 0.2109304 |
| PR-AUC | MCC | 0.105 | 0.5318615 |
| PR-AUC | H | 0.840 | 0.0000003 |
| ROC-AUC | F₂ | 0.011 | 0.9475031 |
| ROC-AUC | MCC | 0.039 | 0.8178395 |
| ROC-AUC | H | 0.043 | 0.7947140 |
| F₂ | MCC | 0.893 | 0.0000003 |
| F₂ | H | 0.268 | 0.1132160 |
| MCC | H | 0.162 | 0.3388544 |
Table 10.
Kendall rank correlations (τ) and p-values between metrics on the Ozone dataset.
| Metric 1 | Metric 2 | τ | p-value |
|---|---|---|---|
| PR-AUC | ROC-AUC | 0.053 | 0.773219 |
| PR-AUC | F₂ | 0.301 | 0.064271 |
| PR-AUC | MCC | 0.639 | 0.000086 |
| PR-AUC | H | 0.716 | 0.000001 |
| ROC-AUC | F₂ | -0.185 | 0.255895 |
| ROC-AUC | MCC | -0.248 | 0.127088 |
| ROC-AUC | H | -0.168 | 0.318896 |
| F₂ | MCC | 0.640 | 0.000085 |
| F₂ | H | 0.343 | 0.034859 |
| MCC | H | 0.554 | 0.000653 |
Table 11.
The cross-domain analysis of the three datasets.
| Metric | Fraud | Yeast | Ozone | Cross-domain conclusion |
|---|---|---|---|---|
| ROC-AUC | Nearly flat (0.93–0.98) despite FP 5→6595 | Weak τ with other metrics (≤0.10) | Range only 0.83–0.91 despite FP 1→57 | Insensitive to operational cost; rankings often contradict cost-aware metrics across prevalence levels. |
| PR-AUC | Penalizes FP explosions (↓0.13); limited alarm load insight | Strong τ with H (0.84), weak with others | Moderate discrimination; mid-table for FP-heavy runs | Useful for global ranking; must be complemented by threshold-based metrics for workload estimation. |
| F₂ | Collapses when precision implodes; rises with recall gains if FP moderate | Near-perfect τ with MCC (0.89) | Largest dynamic span (0.07–0.42) | Recall-weighted single-threshold metric aligned closely with MCC when β reflects stakeholder cost ratios. |
| MCC | Linear response to FP and FN; largest discriminative range (0.13–0.86) | Strong concordance with F₂, moderate with PR-AUC | Balances recall & FP (MCC 0.41 vs. ROC-AUC 0.83) | Most stable threshold-dependent measure; symmetric treatment of errors holds across prevalence levels. |
| H-measure | Penalizes FP-heavy models (e.g., XGB+SMOTE); τ = 0.84 with PR-AUC | Strong τ with PR-AUC (0.84), moderate alignment with MCC and F₂ | Flags top FP inflation (e.g., LR+SMOTE); τ = 0.72 with PR-AUC, ≈ 0.05 with ROC | Flags top FP inflation (e.g., LR+SMOTE); τ = 0.72 with PR-AUC, ≈ 0.05 with ROC-AUC |
Disclaimer/Publisher’s Note: The statements, opinions and data contained in all publications are solely those of the individual author(s) and contributor(s) and not of MDPI and/or the editor(s). MDPI and/or the editor(s) disclaim responsibility for any injury to people or property resulting from any ideas, methods, instructions or products referred to in the content. |
© 2025 by the authors. Licensee MDPI, Basel, Switzerland. This article is an open access article distributed under the terms and conditions of the Creative Commons Attribution (CC BY) license (http://creativecommons.org/licenses/by/4.0/).
Copyright: This open access article is published under a Creative Commons CC BY 4.0 license, which permit the free download, distribution, and reuse, provided that the author and preprint are cited in any reuse.