
Submitted:
11 October 2025
Posted:
13 October 2025
You are already at the latest version
Abstract
Battery management systems are essential in electric vehicles and renewable energy applications, especially in ensuring optimal battery health and performance. Especially regarding the state of charge (SOC) in batteries consisting of many cells. The lifetime and efficiency of battery depend on the accuracy of the SOC parameter estimation. Moreover, the system that applies active balancing technology will move cells that have high SOC data to cells that have low SOC. Many methods have been developed, but the long execution time makes it less than optimal when applied. The speed of SOC estimation is also required in active balancing technology in addition to the accuracy factor. Therefore, this study proposes to estimate SOC parameters using a statistical and metaheuristic approach method from voltage and current input data in each battery cell. The experimental results showed that the metaheuristic-based method (ANFIS) had better RSME and R2 values compared to the polynomial and linear regression method.
Keywords:
active balancing
; ANFIS
; battery management system
; linear regression
; state of charge (SoC)
1. Introduction
The Batteries function as energy storage devices, discharging energy periodically as required [1]. The increasing need for batteries requires an increase in the quantity of batteries in the battery industry, as well as research on batteries. When choosing the right battery, each battery type for a system has its own distinct characteristics. Due to its high energy density, lithium-ion batteries are widely used by battery users [1]. This type of battery is often utilized in the automotive industry as an energy source to drive electric motors [2]. In use, lithium-ion batteries need to be assembled into packs to achieve the desired voltage and current capacity per hour. However, various problems are often encountered when using battery packs, one of which is an imbalance between battery cells [3]. A battery pack requires a battery management system to regulate voltage stability during charge and discharge [4,5,6]. This battery with unbalanced cells results in decreased performance of the battery management system (BMS) in regulating the battery charging and discharging process [4,7]. Battery Management System (BMS) performance declines when cell balance is disrupted, as reflected in shortened battery life during charging and discharging cycles [7,8]. The problem of cell imbalance within the battery pack should be addressed by the cell balancing circuit integrated into the battery management system. However, in practice, many battery management system products available on the market lack a cell balancing function within their modules [9]. To increase the battery's longevity, the battery management system must include a balancing technique. Battery cells can be balanced in a variety of ways. Two main categories of cell balancing techniques in battery management systems are active and passive balancing [10,11]. The active cell balancing method includes several system topologies, i.e., cell-to-cell (C2C), pack-to-cell (P2C), and cell-to-pack (C2P) techniques [12,13]. Battery balancing techniques utilize several types of basic components to transfer energy, including resistors, capacitors, and inductors [10,11]. Given the rapid development of electric vehicles, which has increased the demand for BMS and battery balancers, there is a need for a method that effectively integrates battery cell balancers with battery management systems to meet the specific needs and capacities of batteries. However, the availability of battery balancing products on the market does not always align with the capacity of the battery cells. This issue highlights the need for research to develop a method that combines multiple battery cell balancers within the desired battery pack. One commonly used product in the market employs the flying capacitor balancing method. This method includes active balancing methods using C2C topology. This topology has the disadvantage of requiring significant time to achieve cell balancing. Conversely, the C2C method offers the advantage of balancing cells by optimizing the capacity of each available cell [14]. In previous research, the researchers employed the active cell balancing method with a cell-to-cell topology, specifically utilizing the flying capacitor balancing method obtained from the market.
The research developed a combination of two or more identical balancing products to be utilized with the BMS on a miniature 8S4P battery pack. The time required to achieve a balanced state was 600 minutes, with a ratio of 1:3 for discharging conditions and 35:48 for charging conditions before and after using the combined balancers. Considering that battery performance depends on the capacity of the battery being tested and as part of software development, this research used the SOC parameter as an indicator for determining the battery's charging and discharging conditions. State of Charge (SOC) represents the current energy level of a battery, expressed as a percentage of its total capacity, and is crucial for ensuring optimal battery performance and safe operation, particularly in electric vehicles (EVs) and energy storage systems. SOC estimation methods, such as Coulomb counting and voltage-based techniques, provide real-time insights into the battery’s charge level, enabling effective management of its energy use. While, a Battery Management System (BMS) is responsible for overseeing the entire battery’s health and performance, including monitoring and controlling the SOC. The BMS ensures safety by protecting against overcharging, deep discharge, and temperature extremes, while also balancing cell voltages to maximize efficiency and longevity. By integrating SOC data and regulating various battery functions, the BMS optimizes battery operation, enhancing performance, extending lifespan, and ensuring safe and reliable use across different applications. Together, SOC and BMS work in tandem to provide a seamless, efficient, and secure battery management solution. The SOC refers to a battery capacity parameter commonly used as an indicator of the charging and discharging process [15]. To maintain a long battery lifetime, the minimum State of Charge (SOC) for the charging process is between 30% and 50% [16]. Taking into account the importance of the SOC parameter, this study designed a SOC estimator for the BMS with active balancing based on the flying capacitor method, utilizing a statistical approach. The SOC indicates the total remaining battery capacity to supply the load. Accurate SOC estimation is crucial for both the BMS designers and battery users. A battery's capacity is determined by several factors, including discharge time, average current, electrolyte temperature, cut-off voltage limit, storage duration and battery age [17]. Accurately determining the battery's state of charge (SOC) allows designers to make better use of the available capacity, reduce over-engineering, and use lighter, smaller batteries. Users may make sure the battery is neither overcharged nor undercharged by using an accurate battery SOC indication. As a result, the battery's performance is improved and its extended lifespan is preserved. A crucial component of BMS software is accurate SOC estimation. Numerous methods have been put out in the last ten years to estimate battery state of charge (SOC), most of which rely on electrical quantity measurements and battery chemistry [18,19,20,21]. The most accurate way to test a battery's state of charge (SOC) is to physically achieve 100% or 0% SOC by fully charging or discharging the battery. Electric vehicles (EVs) or plug-in hybrid electric vehicles (PHEVs), which are usually charged to capacity every night, are commonly subjected to this test. It enables the SOC estimation algorithm to receive feedback for recalibration [22]. For HEVs, current versus time calculations remain the most widely used technique. This technique is known as the coulomb counting system, where a direct indicator of SOC is obtained from discrete integration of the measured current over time. Since this integration is affected by errors in measuring battery losses and current, the results must be corrected periodically. Therefore, in this research, the SOC parameter indicator is derived not only from the current parameter but also from the total value of the voltage measurement for each normalized cell.
Numerous methods for estimating the SOC parameters have been developed by researchers, including techniques based on measurement [23,24], adaptive filters [25,26], and data-driven algorithms [27,28]. In general, these methods prioritize the accuracy of SOC estimation while often neglecting the execution speed. Despite the fact that the SOC parameter estimation results are accurate, prolonged execution times can impair the performance of the BMS when implemented in hardware. Additionally, most of these methods have been tested on batteries. Therefore, this study proposes the SOC parameter estimation in the BMS using a statistical i.e., linear regression and metaheuristic approach. The regression equation is derived from the current and voltage data collected from the battery pack used in the testing. This equation is subsequently integrated into the BMS software, which serves as the focus of the testing. Since the equation consists of a mere single formula without filtering or looping processes, this method enables better execution speed compared to other non-statistical approaches. The SOC estimation speed of the BMS is one of the factors determining the BMS performance.
The points of contribution from the research we have conducted can be summarized as follows:
- -
- This research proposes the estimation of the SOC parameter using a regression approach.
- -
- This research also includes a comparison with the other statistical method, i.e., the polynomial regression technique.
- -
- This research utilizes LiFePO4 batteries, whereas most other methods employ different types of lithium-ion batteries [29].
The following is the structure of the rest of this paper: Chapter II provides an explanation of the theories and methods related to the topic of this paper, Chapter III contains the discussion of the dataset utilized, Chapter IV covers the results and analysis of the experiments conducted in this study, and finally, Chapter V is a summary of our overall work.
2. Materials and Methods
2.1. LiFePO4
LiFePO4 batteries, formally known as lithium iron phosphate batteries, are part of the lithium-ion battery family. The cathode is primarily composed of iron phosphate (FePO4), while the anode consists of carbon graphite. The trend of utilizing this type of battery continues to rise due to its advantages, including stable performance, long lifespan, enhanced safety, a deeper discharge capacity of approximately 80%, and greater environmental friendliness compared to other lithium-ion batteries [30]. Nonetheless, this battery also has several disadvantages, including its high cost, sensitivity to low temperatures, and lower energy capacity and output voltage compared to other lithium-ion batteries [31]. Given these advantages and disadvantages, this battery is particularly suited for applications that prioritize safety, stability, and long-term durability. Conversely, this type of battery is not suitable for applications that prioritize weight and volume. As the target application of this research is electric motorcycle batteries (electric bikes), which prioritize safety and durability, the LiFePO4 battery is the preferred choice. With this in mind, this research focused on evaluating the performance of this type of battery.
2.2. Flying Capacitor
In battery management systems (BMS), one of the commonly used methods to balance the voltage between different cells in a battery pack is the flying capacitor technique. This technique applies a capacitor connected between two cells to temporarily transfer energy from the cell with the higher voltage level to the lower cell. Its efficient and rapid balancing capability, in comparison to the resistor bleeding method, makes it a suitable choice for electric vehicle (EV) applications. In addition, the charge transfer is not dissipated as heat, which prevents this method from generating high temperatures compared to other techniques. Still, this technique has certain drawbacks, including a complex circuit that necessitates precise switching and a higher cost compared to other methods. This method falls under the category of active balancing techniques, and its topology is illustrated in Figure 1 [32]. B1 to B4 represent the battery cells, S1 to S4 denote the switches, and C1 to C3 indicate the capacitors.
2.3. Polynomial Regression
Regression analysis, in which the correlation between the independent (input) variables and the dependent (output) variables is nonlinear but is modeled using a polynomial equation, is referred to as polynomial regression. Polynomial regression of degree n is as presented in (1).
where: represents the output or dependent variable,, denotes the independent variables, n determines the polynomial degree, and e represents the error or residual.
2.4. Linear Regression
Linear regression is a statistical method that models and analyzes the correlation between one independent variable (y) and one more dependent variable () with a regression coefficient () and error (e). This method is also adopted to predict the value of input variables based on their output variables. Meanwhile, equation (2) demonstrates the correlation between the two.
2.5. Adaptive Neuro Fuzzy Inference System (ANFIS)
Adaptive Neuro-Fuzzy Inference System (ANFIS) is a hybrid system that combines Artificial Neural Networks (ANN) with Fuzzy Inference Systems (FIS). This integration is designed to leverage the learning capability of neural networks while maintaining the interpretability of fuzzy logic systems. ANFIS is typically based on the Sugeno FIS model, which provides a structured and adaptive approach to function approximation and decision-making. The structure of ANFIS consists of five layers, each performing a specific function. The first layer is the fuzzification layer, where each node represents a membership function that defines the degree of input belonging to a fuzzy set. Common membership functions include Gaussian and sigmoid functions, mathematically represented as:
where c is the center and σ is the width of the Gaussian function. The second layer is the rule layer, where each neuron represents a fuzzy rule and computes the firing strength of that rule using the T-norm operation, often multiplication:
The third layer is the normalization layer, which normalizes the rule strengths to ensure they sum up to one:
The fourth layer is the consequent layer, where each node computes a linear function of the input variables, typically expressed as:
where, , are parameters to be learned. Finally, the fifth layer is the output layer, which sums all the outputs of the previous layer to produce the final ANFIS output:
ANFIS learning is achieved through a hybrid training approach, combining backpropagation for the fuzzy membership function parameters and least squares estimation (LSE) for the consequent parameters. The feedforward phase calculates the output based on given inputs, while the backpropagation phase updates the parameters to minimize the error between predicted and actual outputs. ANFIS offers several advantages, including adaptability, interpretability, and powerful function approximation capabilities. It is widely applied in fields such as weather prediction, robotics control, financial forecasting, and medical diagnosis. By combining the strengths of neural networks and fuzzy systems, ANFIS provides a robust framework for modeling complex, nonlinear systems.
2.6. Research Flow
Figure 2 illustrates the research flowchart for estimating the SOC of the battery pack. First, a literature review was conducted to assess the state of the art in SOC estimation research and to identify the most appropriate method for processing battery characterization data. After establishing a statistical method to determine the unknown SOC value at a given current, the statistical analysis further revealed the trend of the battery's SOC value in relation to its service life. Once the appropriate model was obtained, system testing could be performed directly using the active balancing system.
3. Results
This section provides a detailed explanation of the dataset utilized in this research, including the data acquisition strategy and the design of the acquisition device.
3.1. System Architecture
The system architecture for collecting current and voltage data from a battery pack composed of four series of Li-ion 18650 batteries, with a total voltage of 16.4V, is illustrated in Figure 3. After passing through the BMS, the current and voltage were measured by the first INA226 sensor, which then transmitted the measurement data to the ESP32 for monitoring.
The measured power was subsequently transmitted to a buck-boost converter, which adjusts the voltage according to the load requirements by either increasing (boosting) or decreasing (bucking) the voltage. The current and voltage following the buck-boost converter were re-measured by a second INA226 sensor before the power was delivered to the final load. Data from the second INA226 sensor was also transmitted to the ESP32 for further monitoring. The ESP32 microcontroller collected and processed data from both INA226 sensors and could regulate the buck-boost converter to ensure the load would receive a stable and efficient voltage. With this system, the battery condition could be monitored and the power received by the load could be regulated in real-time, allowing the optimization of overall system performance. The data collected by the ESP32 could be utilized for direct monitoring or sent to the database. The database would allow data to be stored in a structured and secure manner.
By storing parameter readings and estimation data, the SOC could access and recover this information as required, utilizing MongoDB for database management. The advantages of MongoDB include its flexible, document-oriented data model, which stores data in JSON format. Additionally, MongoDB does not require a fixed schema, allowing for the storage of documents without predefined structures. It offers high flexibility in data modeling and can easily adapt to changes in data structures. Figure 4 presents the design of the data model using MongoDB, which is set to be implemented. The JSON format represents the measurement data collected from four batteries over a specified period. The data encompasses information on voltage, current, temperature, and SOC. This data was recorded in real-time. The current value remained constant within the 400 mA range.
3.2. Dataset
Table 1 demonstrates several data samples generated from the data acquisition process, which were utilized as test data in this research at a current of 3 A. The use of voltage variation datasets for battery charge or discharge conditions is to determine the distribution of data during the two conditions. With dynamic data distribution, it can produce a representative SOC estimator modeling according to the actual SOC value. While the actual SOC in this dataset is obtained through calculations applied to the BMS software by considering: the initial SOC before the battery charging or discharging process occurs, the maximum battery capacity and measurements of the incoming and outgoing electric current. The total dataset utilized in this study comprised 46 data.
4. Discussion
Utilizing the dataset presented in Table 1, the calculations for the polynomial regression and linear regression methods for the SOC estimation could be obtained, as shown in (8) and (9), respectively.
where: is the voltage value in cell 1 to cell n, is a polynomial regression, and linear regression is denoted by. A comparison graph of the SOC estimation results from the two methods is shown in Figure 5.
Utilizing a statistical approach based on polynomial regression, the Root Mean Square Error (RMSE) was calculated to be 1.2188, accompanied by an R² value of 0.80272. Meanwhile, the linear regression-based approach yielded an RMSE of 1.0829 and an R² value of 0.84426. The RMSE and R² values were calculated using the following equations:
where: n is the number of data, is the predicted value, represents the actual value, and is the actual average value. Given that a smaller RMSE value indicates a closer approximation to the actual SOC and a higher R² value signifies a greater representation of the actual data, linear regression-based modeling serves as a reliable reference for statistic-based SOC modeling in this research.
As a comparison in this study, the metaheuristic method based on adaptive neuro fuzzy inference system is applied to optimize the design of the SOC estimator. The data used as input parameters are the voltage data of the four cells (V1, V2, V3 and V4) and the output is the actual SOC value. Meanwhile, for the training configuration using ANFIS, including: using sugeno inference, the membership function using trapezoid, the number of memberships for each input is 3, and the iteration for training purposes is 10. The training process shows that the initial RMSE results are 0.1429 and the final RMSE when the iteration is the same as the maximum iteration is 0.0992. To find out the contour of the relationship between input and output parameters in this study, we can present it in the surface relationship presented in Table 2.
The use of ANFIS to model the SOC value obtained an RMSE result of 0.09925 and R2 of 0.99869 (representative close to the actual data shown in Figure 6, the ANFIS curve is close to the actual SOC value).
5. Conclusions
This study proposes a statistical and metaheuristic approach utilizing both polynomial regression, linear regression and also adaptive neuro fuzzy inference system (ANFIS) methods to estimate the SOC of cells within Li-Ion battery packs in a battery management system. Voltage data was collected using the INA226 module and transmitted via the ESP32 for storage in the database. The battery management system employed was of the Active Balancing System type with the flying capacitor technique. The test results found that the SOC estimation using ANFIS technique yielded a smaller value, showing a difference of 0.9836 when compared to the linear regression technique. Meanwhile, the R2 value of the ANFIS method was greatest, with value of 0.99869 when compared both linear and polynomial regression method. In conclusion, the findings suggest that the ANFIS method demonstrates superior performance compared to the linear and polynomial regression method for estimating the SOC in lithium-ion battery packs. In further work, the application of the ANFIS-based SOC estimator can be applied to BMS software so that it can produce stable and precise SoC readings for various electric vehicle applications.
Author Contributions
Conceptualization, R.Y. A. and N. R.; methodology, M. R. R.; software, R. Y. A..; validation, N. R. and R. W. S.; formal analysis, S. W.; investigation, F. L. A.; resources, S. C. A. anf N.; data curation, F. E. P.; writing—original draft preparation, R. Y. A..; writing—review and editing, N. R.; visualization, C. W.; supervision, A. J. and N. Z. A.; project administration, N.; funding acquisition, N. Z. A. All authors have read and agreed to the published version of the manuscript.
Funding
This research was funded by Ministry of Education, Culture, Research, and Technology of the Republic of Indonesia (Contract Number 132/SPK/D.D4/PPK.01.APTV/IV/2024).
Data Availability Statement
The original contributions presented in this study are included in this article; further inquiries can be directed to the corresponding author.
Acknowledgments
The researchers express their sincere gratitude to the Directorate of Academic Higher Vocational Education, the Ministry of Education, Culture, Research, and Technology of the Republic of Indonesia for the financial support that made this research possible. Finally, we extend our appreciation to our colleagues for their encouragement and patience throughout the research process.
Conflicts of Interest
The authors declare no conflicts of interest.
References
- J. B. Goodenough and K. S. Park, “The Li-ion rechargeable battery: A perspective,” J Am Chem Soc, vol. 135, no. 4, pp. 1167–1176, Jan. 2013. [CrossRef]
- Y. Ding, Z. P. Cano, A. Yu, J. Lu, and Z. Chen, “Automotive Li-Ion Batteries: Current Status and Future Perspectives,” Electrochemical Energy Reviews 2019 2:1, vol. 2, no. 1, pp. 1–28, Jan. 2019. [CrossRef]
- L. H. Saw, Y. Ye, and A. A. O. Tay, “Integration issues of lithium-ion battery into electric vehicles battery pack,” J Clean Prod, vol. 113, pp. 1032–1045, Feb. 2016. [CrossRef]
- H. A. Gabbar, A. M. Othman, and M. R. Abdussami, “Review of Battery Management Systems (BMS) Development and Industrial Standards,” Technologies 2021, Vol. 9, Page 28, vol. 9, no. 2, p. 28, Apr. 2021. [CrossRef]
- K. Liu, K. Li, Q. Peng, and C. Zhang, “A brief review on key technologies in the battery management system of electric vehicles,” Frontiers of Mechanical Engineering, vol. 14, no. 1, pp. 47–64, Mar. 2019. [CrossRef]
- M. Nasution, “Karakteristik Baterai Sebagai Penyimpan Energi Listrik Secara Spesifik | Nasution | JET (Journal of Electrical Technology).” Accessed: Nov. 07, 2024. [Online]. Available: https://jurnal.uisu.ac.id/index.php/jet/article/view/3797.
- Z. B. Omariba, L. Zhang, and D. Sun, “Review on Health Management System for Lithium-Ion Batteries of Electric Vehicles,” Electronics 2018, Vol. 7, Page 72, vol. 7, no. 5, p. 72, May 2018. [CrossRef]
- Z. B. Omariba, L. Zhang, and D. Sun, “Review of Battery Cell Balancing Methodologies for Optimizing Battery Pack Performance in Electric Vehicles,” IEEE Access, vol. 7, pp. 129335–129352, 2019. [CrossRef]
- B. Balasingam, M. Ahmed, and K. Pattipati, “Battery Management Systems—Challenges and Some Solutions,” Energies 2020, Vol. 13, Page 2825, vol. 13, no. 11, p. 2825, Jun. 2020. [CrossRef]
- H. S, “Overview of cell balancing methods for Li-ion battery technology,” Energy Storage, vol. 3, no. 2, p. e203, Apr. 2021. [CrossRef]
- M. Uzair, G. Abbas, and S. Hosain, “Characteristics of Battery Management Systems of Electric Vehicles with Consideration of the Active and Passive Cell Balancing Process,” World Electric Vehicle Journal 2021, Vol. 12, Page 120, vol. 12, no. 3, p. 120, Aug. 2021. [CrossRef]
- A. B. Ahmad, C. A. Ooi, D. Ishak, and J. Teh, “Cell Balancing Topologies in Battery Energy Storage Systems: A Review,” Lecture Notes in Electrical Engineering, vol. 547, pp. 2019. [CrossRef]
- S. L. Wu, H. C. Chen, and C. H. Chien, “A Novel Active Cell Balancing Circuit and Charging Strategy in Lithium Battery Pack,” Energies 2019, Vol. 12, Page 4473, vol. 12, no. 23, p. 4473, Nov. 2019. [CrossRef]
- K. P. Nivya and K. Deepa, “Active cell balancing for a 2s Lithium ion battery pack using flyback converter and push-pull converter,” IOP Conf Ser Mater Sci Eng, vol. 1070, no. 1, p. 012097, Feb. 2021. [CrossRef]
- Suhariningsih, F. Yulianda, E. Sunarno, and M. A. B. Nugroho, “Battery Management System dengan Fitur Adaptive Current Protection terhadap Suhu,” ELKOMIKA: Jurnal Teknik Energi Elektrik, Teknik Telekomunikasi, & Teknik Elektronika, vol. 12, no. 2, p. 498, Apr. 2024. [Google Scholar] [CrossRef]
- “Battery Minimum State Of Charge.” Accessed: Nov. 12, 2024. [Online]. Available: https://homerenergy.com/products/pro/docs/3.15/battery_minimum_state_of_charge.html.
- T. Huria, M. Ceraolo, J. Gazzarri, and R. 2012 IEEE International Electric Vehicle Conference, IEVC 2012, 2012. [CrossRef]
- S. Piller, M. Perrin, and A. Jossen, “Methods for state-of-charge determination and their applications,” J Power Sources, vol. 96, no. 1, pp. 113–120, Jun. 2001. [CrossRef]
- V. Pop, H. J. Bergveld, P. H. L. Notten, and P. P. L. Regtien, “State-of-the-art of battery state-of-charge determination,” Meas Sci Technol, vol. 16, no. 12, p. R93, Oct. 2005. [CrossRef]
- G. L. Plett, “Extended Kalman filtering for battery management systems of LiPB-based HEV battery packs: Part 1. Background,” J Power Sources, vol. 134, no. 2, pp. 252–292, Aug. 2004. [CrossRef]
- M. Chen and G. A. Rincón-Mora, “Accurate electrical battery model capable of predicting runtime and I-V performance,” IEEE Transactions on Energy Conversion, vol. 21, no. 2, pp. 504–511, Jun. 2006. [CrossRef]
- Y. Muratoglu and A. Alkaya, “Unscented Kalman Filter based State of Charge Estimation for the Equalization of Lithium-ion Batteries on Electrical Vehicles,” Engineering, Technology & Applied Science Research, vol. 9, no. 6, pp. 4876–4882, Dec. 2019. [CrossRef]
- Y. Zhang, W. Song, S. Lin, and Z. Feng, “A novel model of the initial state of charge estimation for LiFePO4 batteries,” J Power Sources, vol. 248, pp. 1028–1033, Feb. 2014. [CrossRef]
- K. S. Ng, Y. F. Huang, C. S. Moo, and Y. C. INTELEC, International Telecommunications Energy Conference (Proceedings), 2009. [CrossRef]
- L. Zhong, C. Zhang, Y. He, and Z. Chen, “A method for the estimation of the battery pack state of charge based on in-pack cells uniformity analysis,” Appl Energy, vol. 113, pp. 558–564, Jan. 2014. [CrossRef]
- R. Zhang et al., “State of the Art of Lithium-Ion Battery SOC Estimation for Electrical Vehicles,” Energies 2018, Vol. 11, Page 1820, vol. 11, no. 7, p. 1820, Jul. 2018. [CrossRef]
- J. C. Alvarez Anton, P. J. Garcia Nieto, C. Blanco Viejo, and J. A. Vilan Vilan, “Support vector machines used to estimate the battery state of charge,” IEEE Trans Power Electron, vol. 28, no. 12, pp. 5919–5926, 2013. [CrossRef]
- E. Chemali, P. J. Kollmeyer, M. Preindl, R. Ahmed, and A. Emadi, “Long Short-Term Memory Networks for Accurate State-of-Charge Estimation of Li-ion Batteries,” IEEE Transactions on Industrial Electronics, vol. 65, no. 8, pp. 6730–6739, Aug. 2018. [CrossRef]
- A. H. Pandyaswargo, A. D. Wibowo, M. F. N. Maghfiroh, A. Rezqita, and H. Onoda, “The Emerging Electric Vehicle and Battery Industry in Indonesia: Actions around the Nickel Ore Export Ban and a SWOT Analysis,” Batteries 2021, Vol. 7, Page 80, vol. 7, no. 4, p. 80, Nov. 2021. [CrossRef]
- L. Lu, X. Han, J. Li, J. Hua, and M. Ouyang, “A review on the key issues for lithium-ion battery management in electric vehicles,” J Power Sources, vol. 226, pp. 272–288, Mar. 2013. [CrossRef]
- W. J. Zhang, “Structure and performance of LiFePO4 cathode materials: A review,” J Power Sources, vol. 196, no. 6, pp. 2962–2970, Mar. 2011. [CrossRef]
- H. Chen, “Research on battery pack dynamic equalization technology with improved flying capacitor,” International Journal of Low-Carbon Technologies, vol. 16, no. 1, pp. 199–204, Mar. 2021. [CrossRef]
Figure 1.
Balancing Cell with Flying Capacitor Topology.
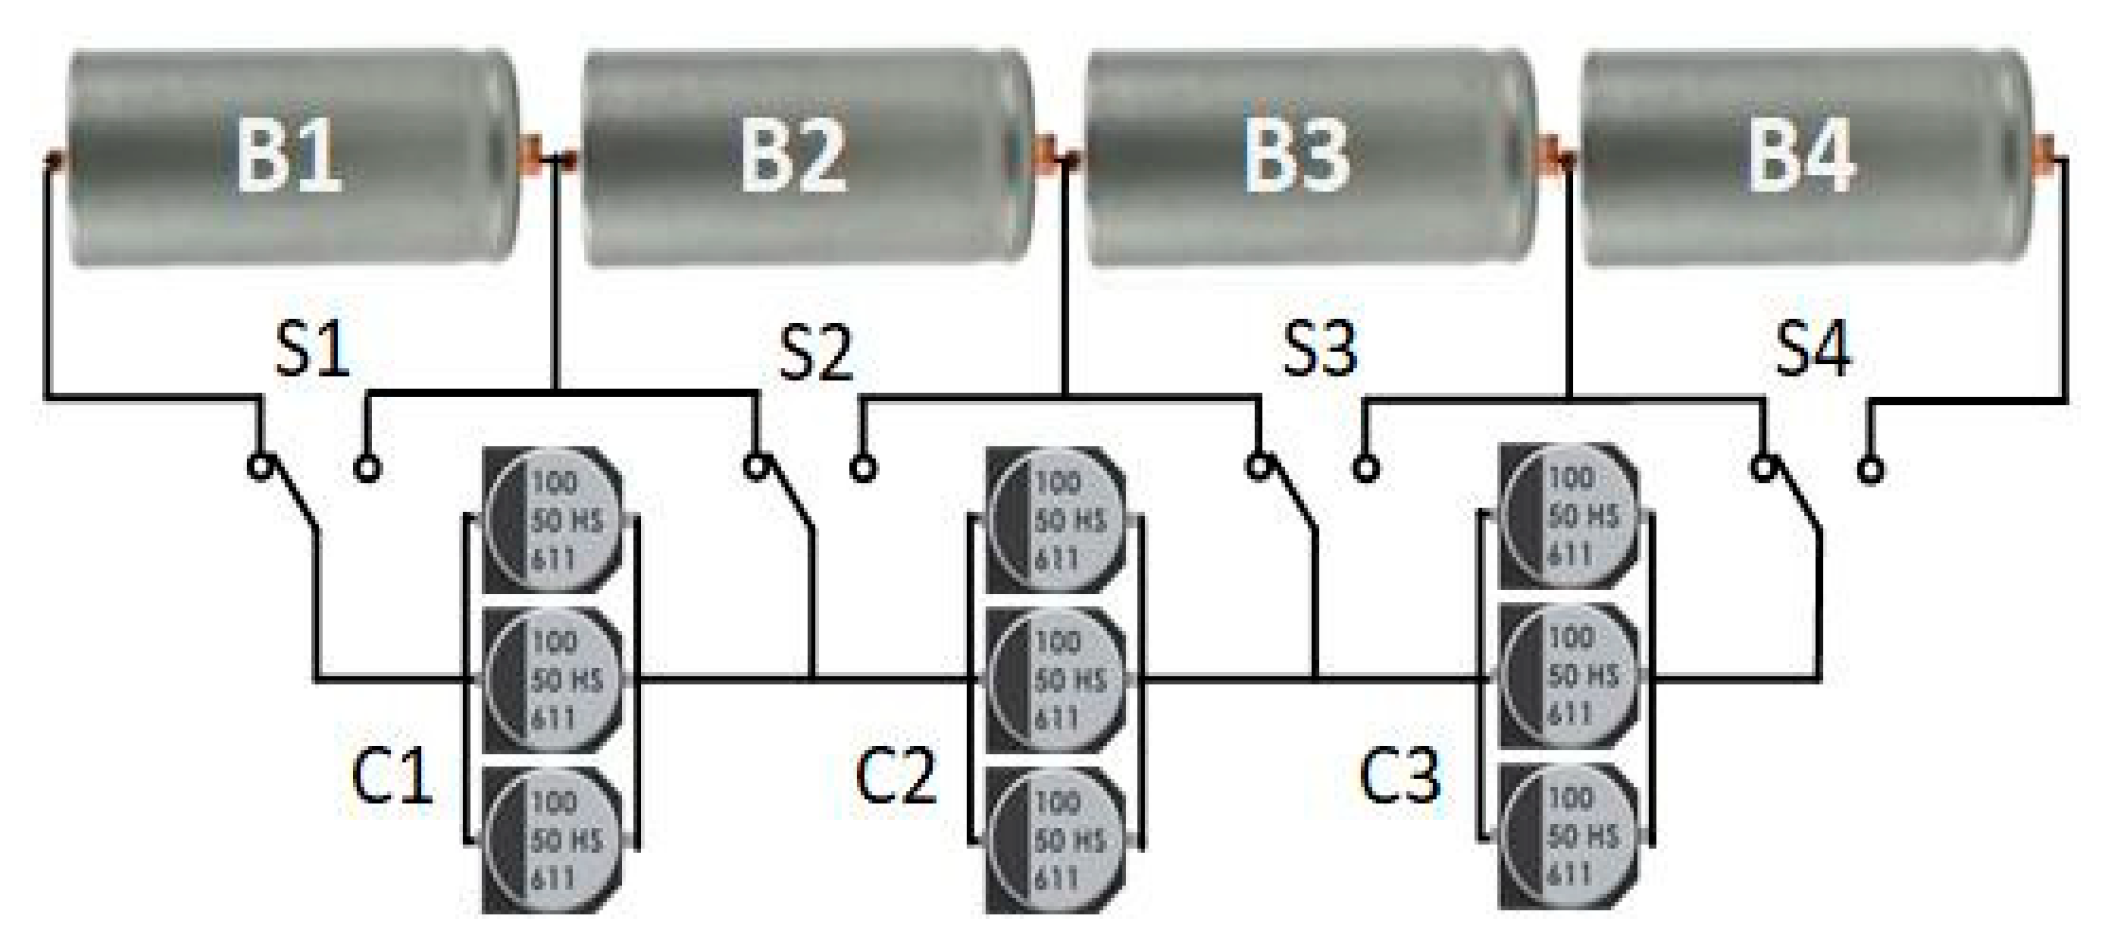
Figure 2.
Flow diagram for SOC estimation research using the active balancing system with statistical algorithm.
Figure 2.
Flow diagram for SOC estimation research using the active balancing system with statistical algorithm.
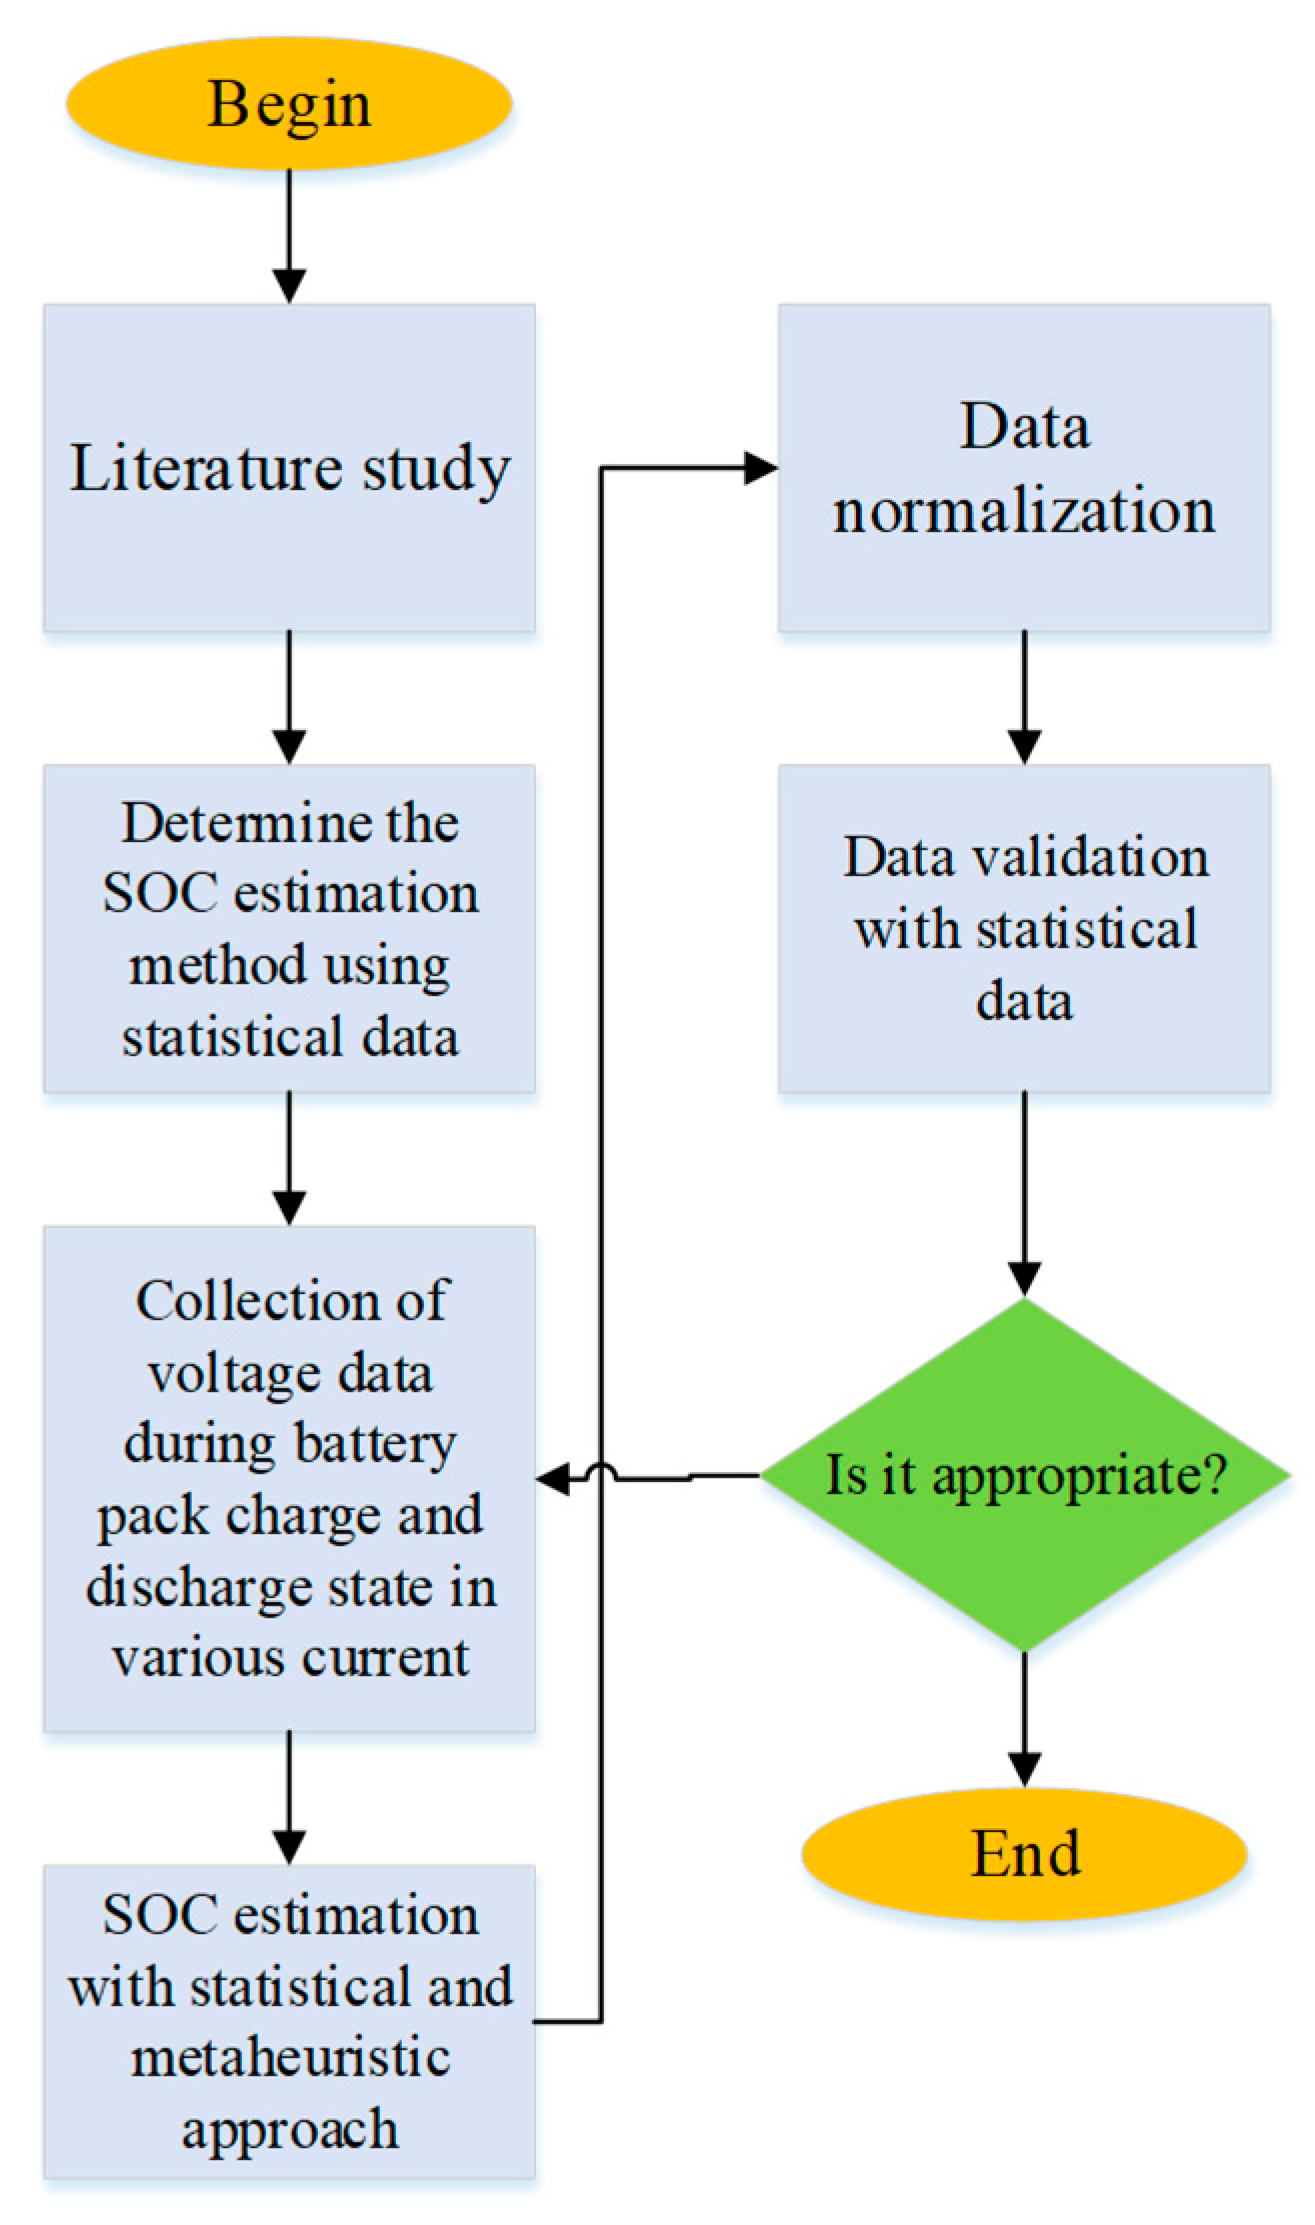
Figure 3.
Flow diagram for SOC estimation research using the active balancing system.
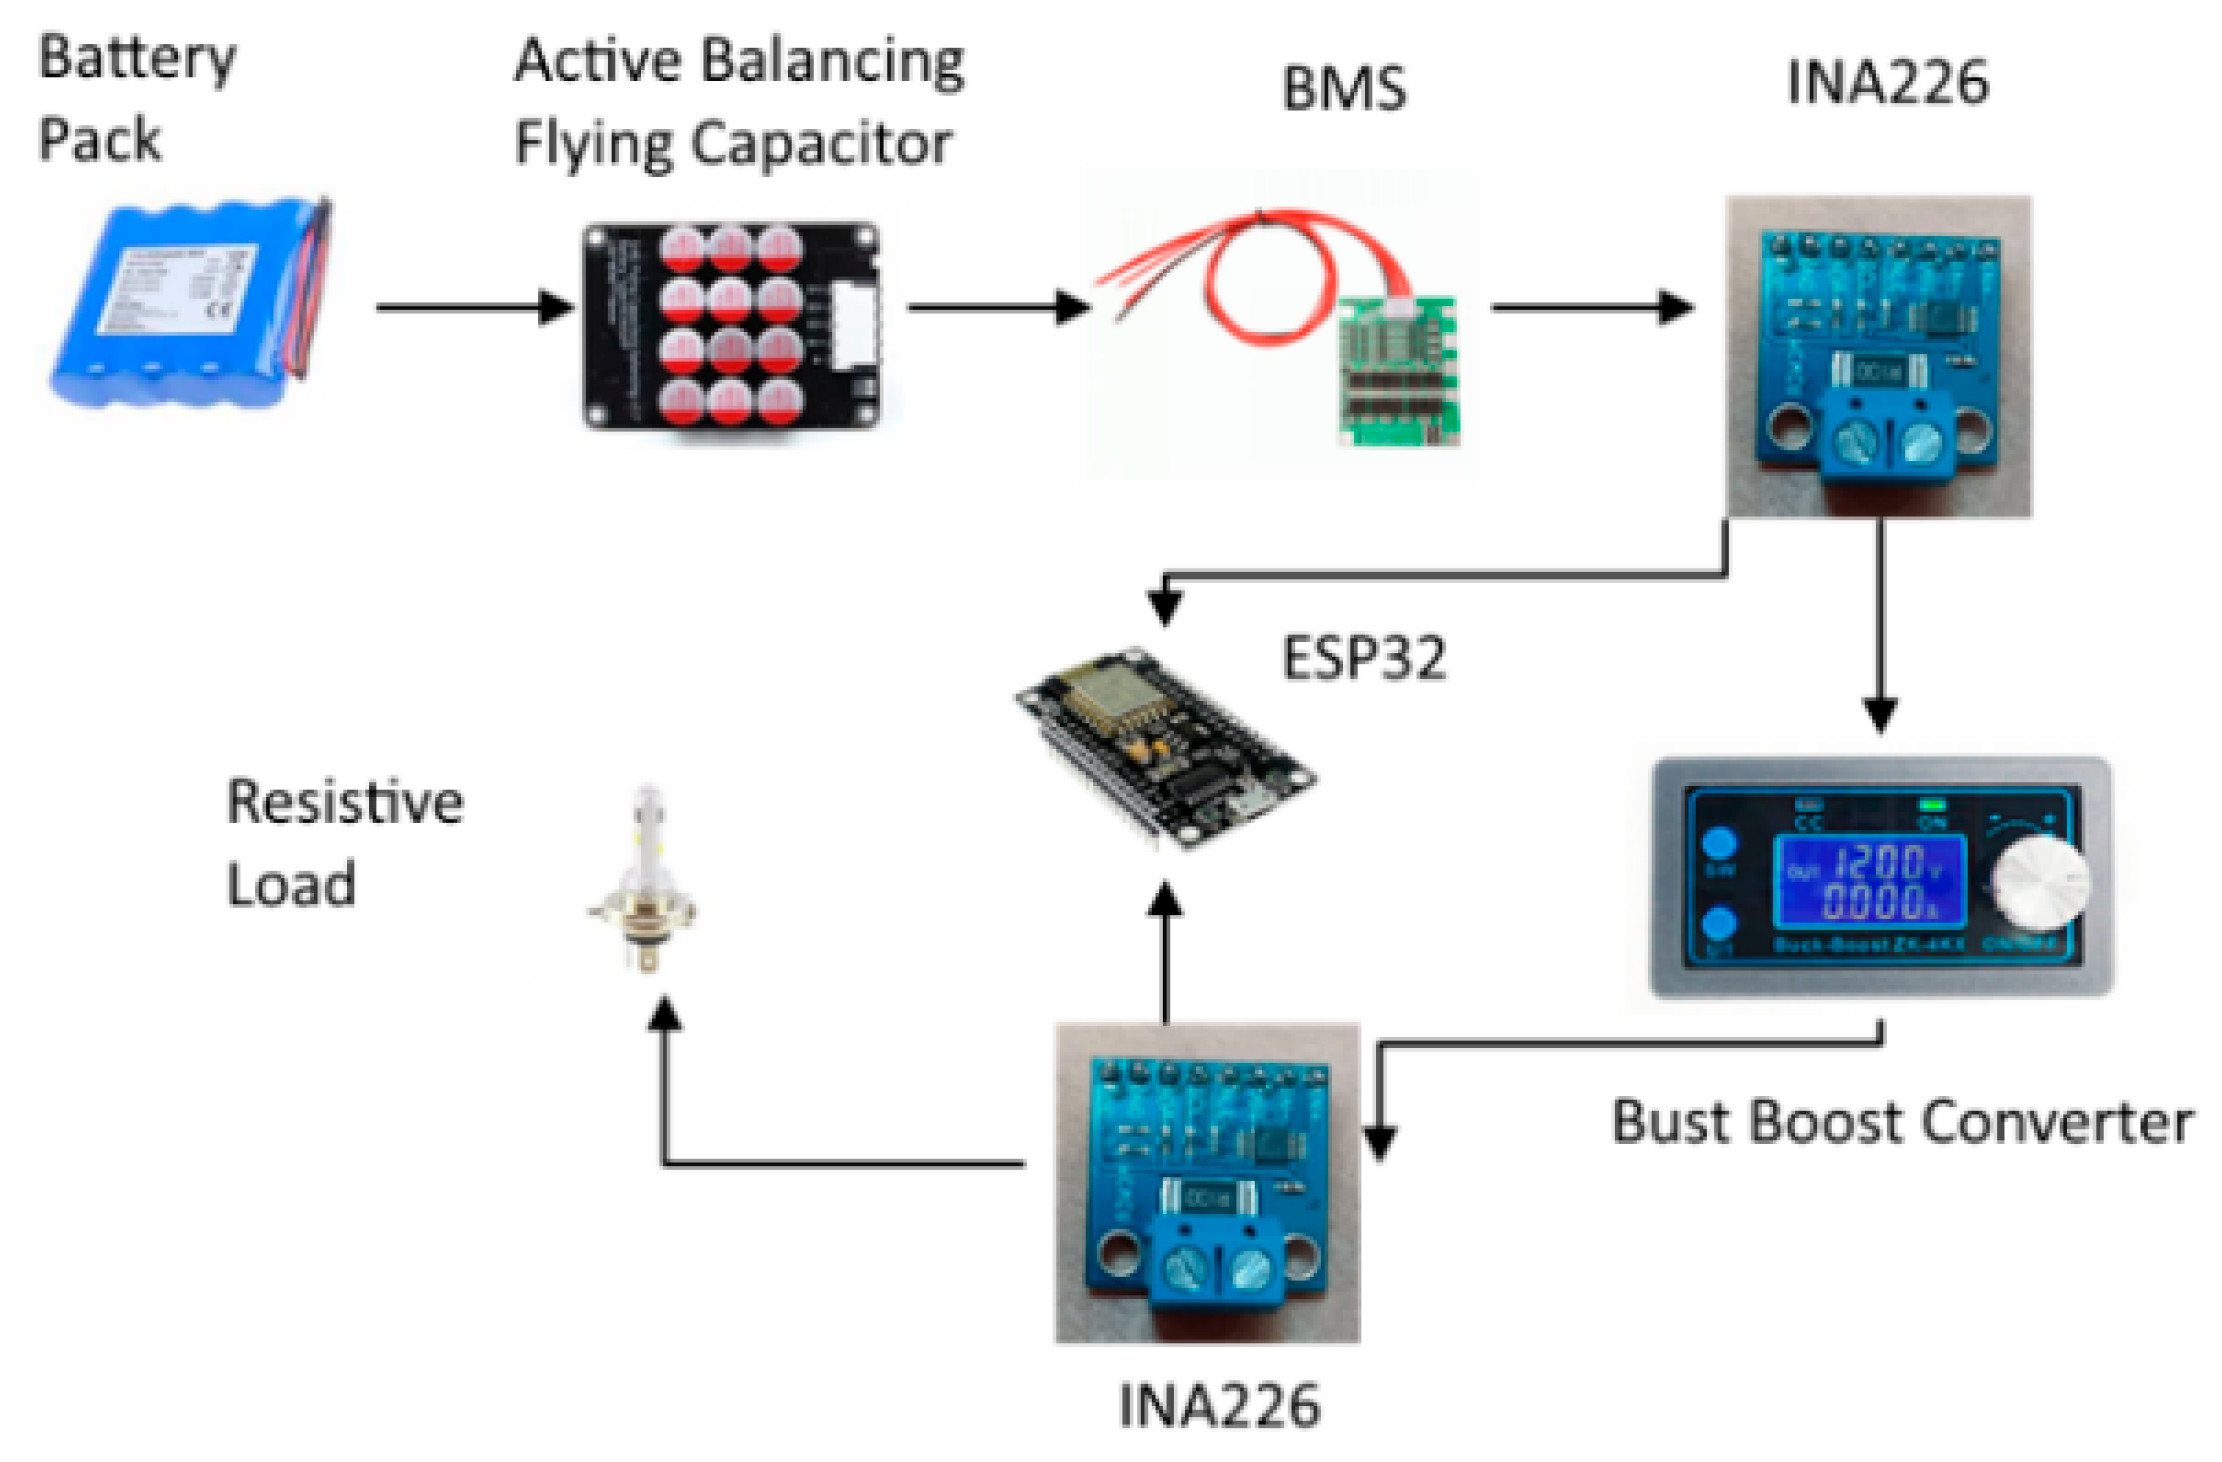
Figure 4.
SOC data view on MongoDB.
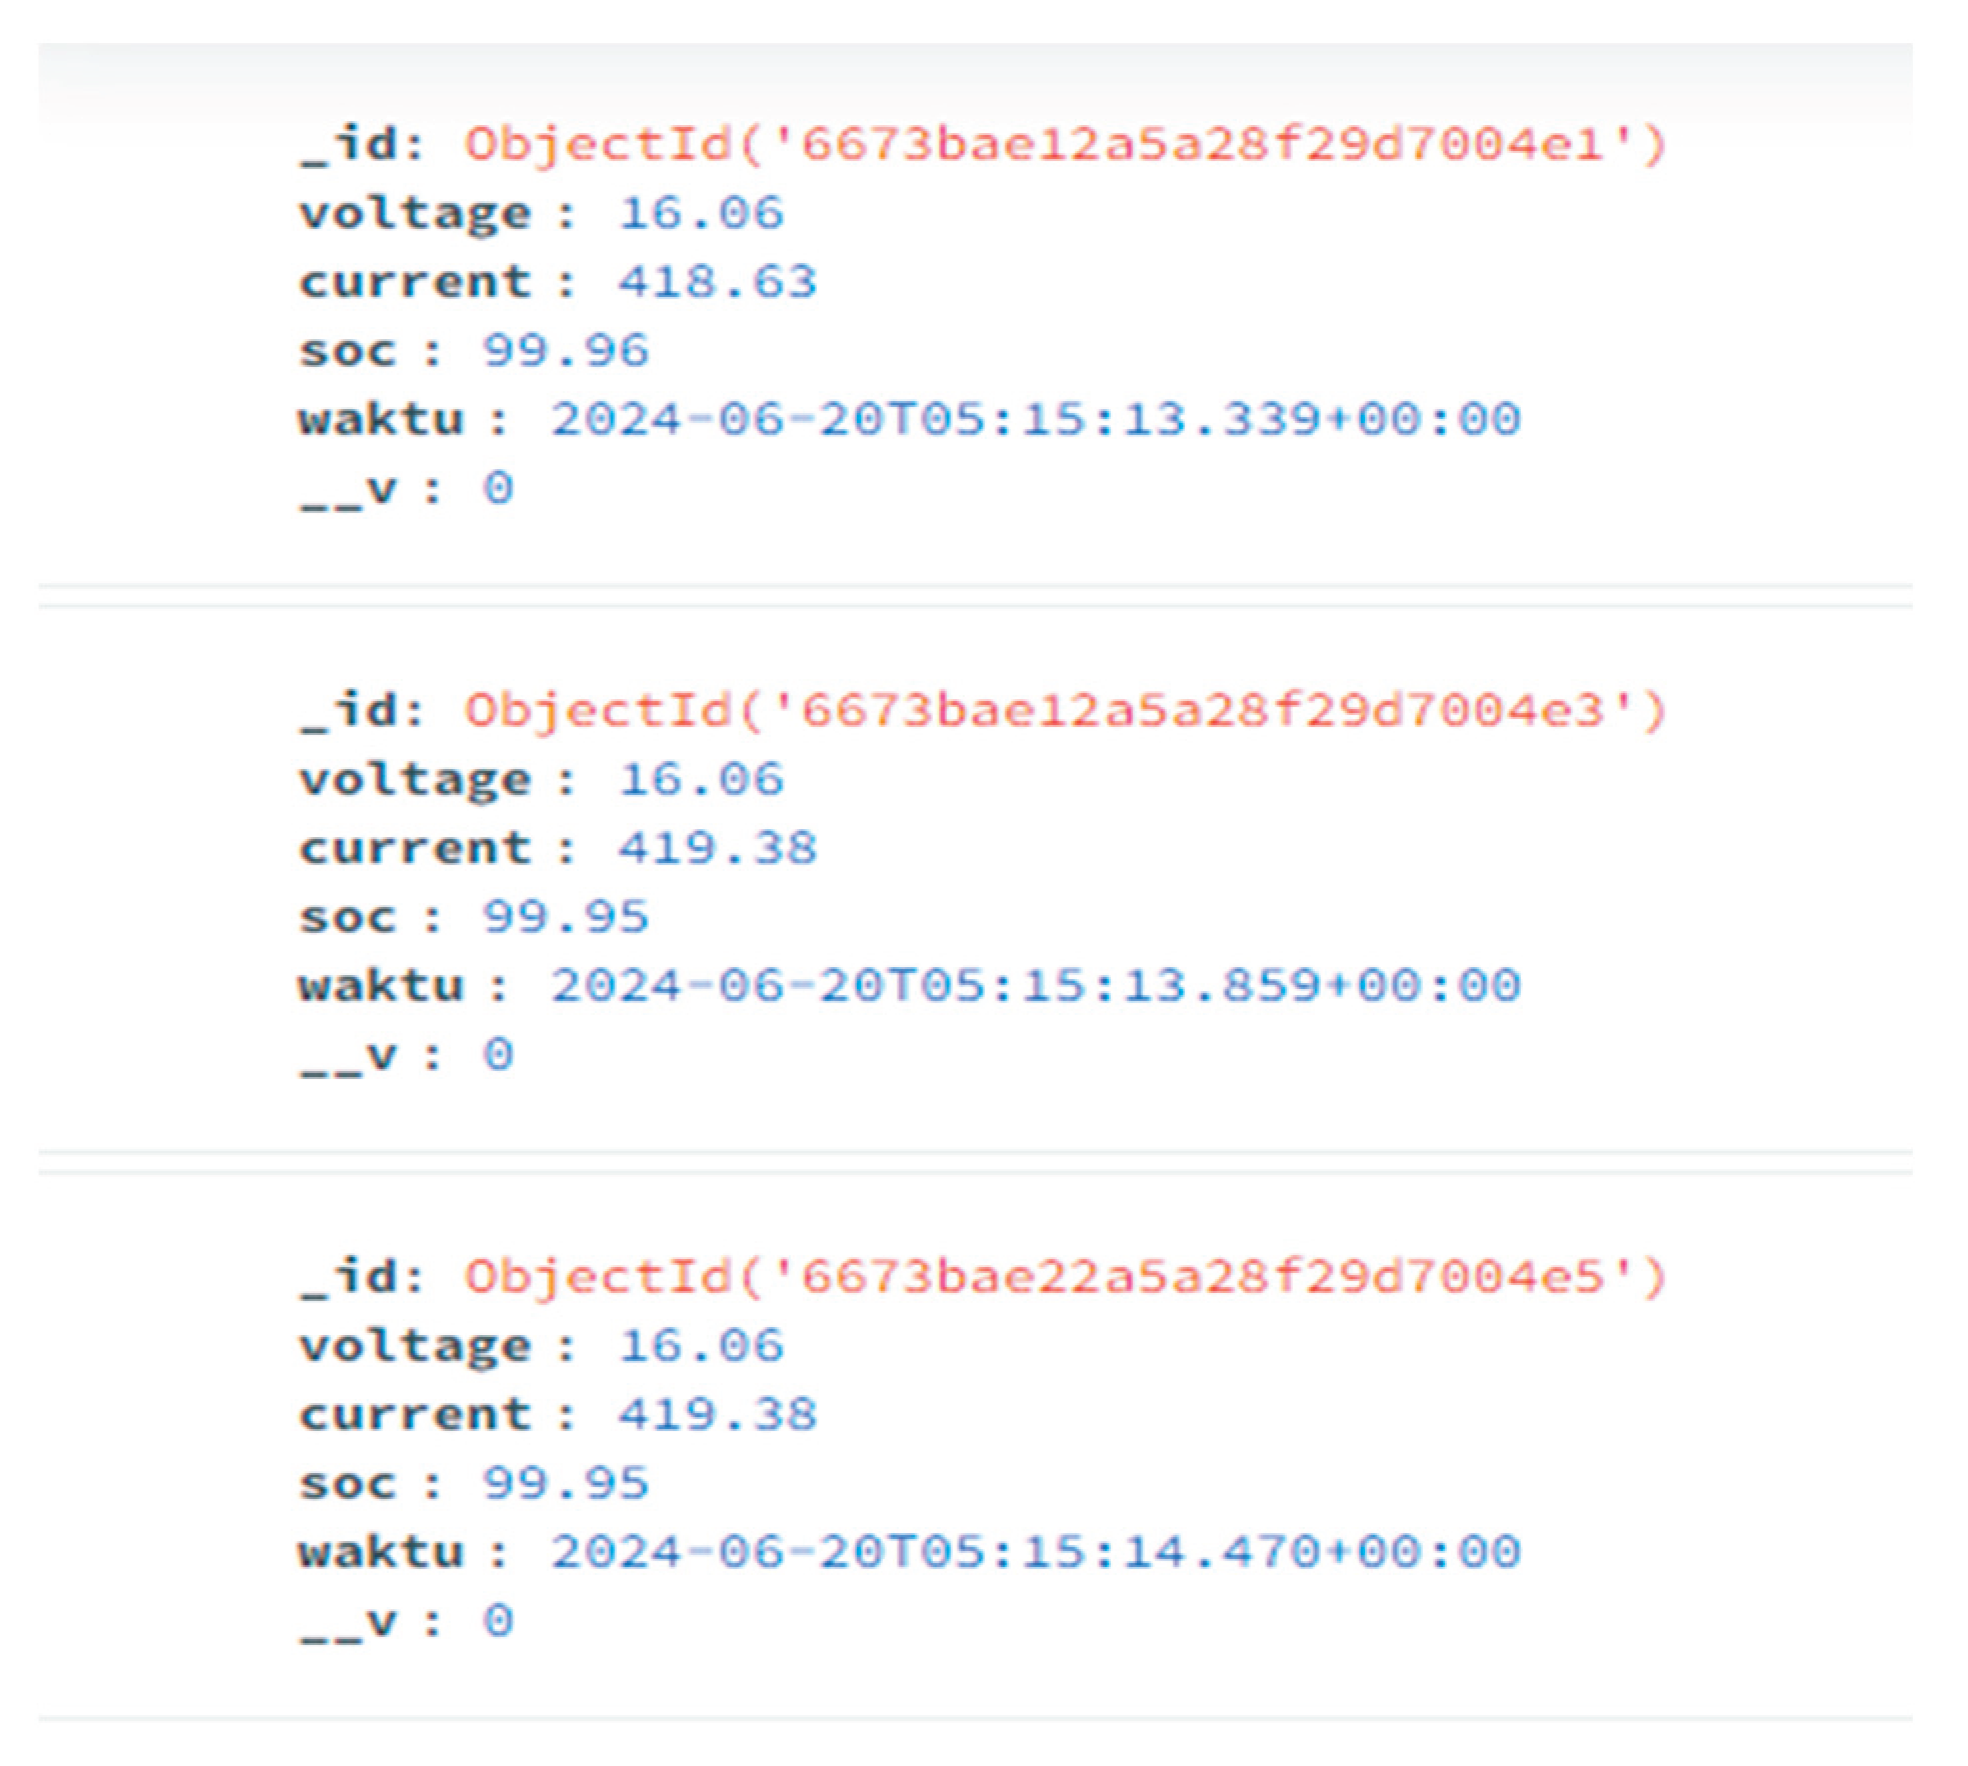
Figure 5.
Comparison of the SOC estimation using polynomial regression and linear regression.
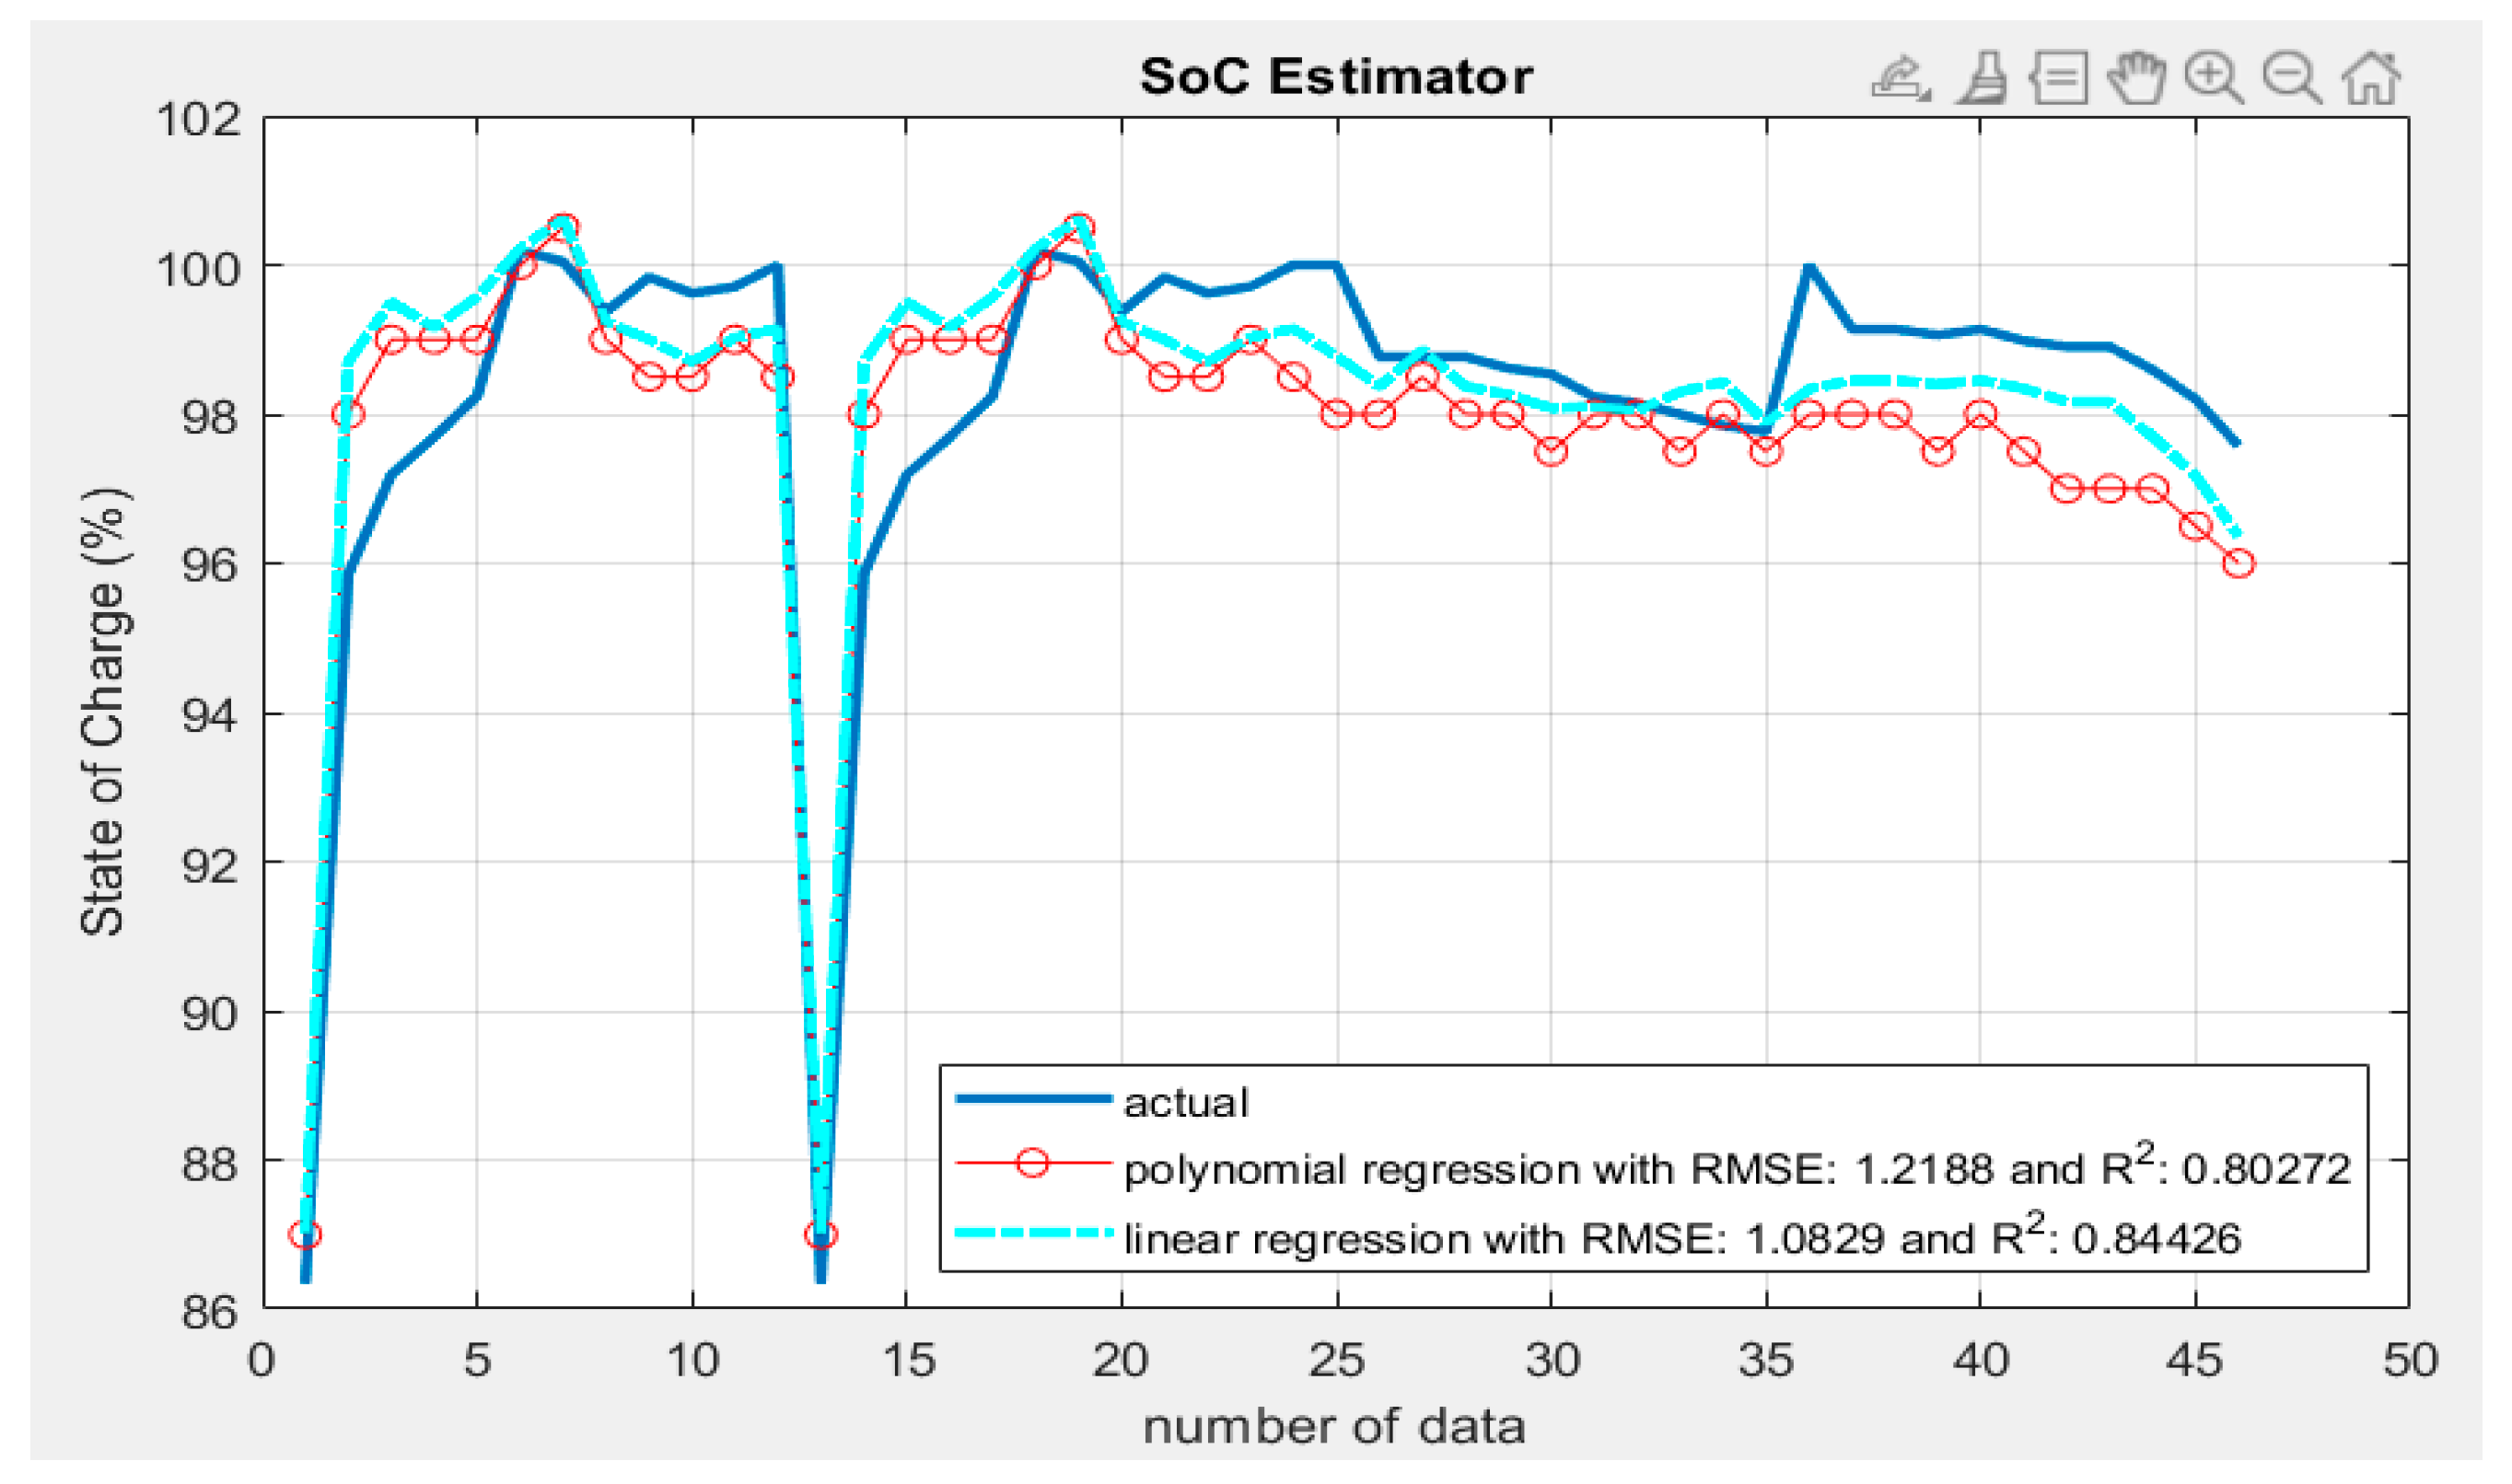
Figure 6.
Comparison of the SOC estimation using statistical and metaheuristic approach.
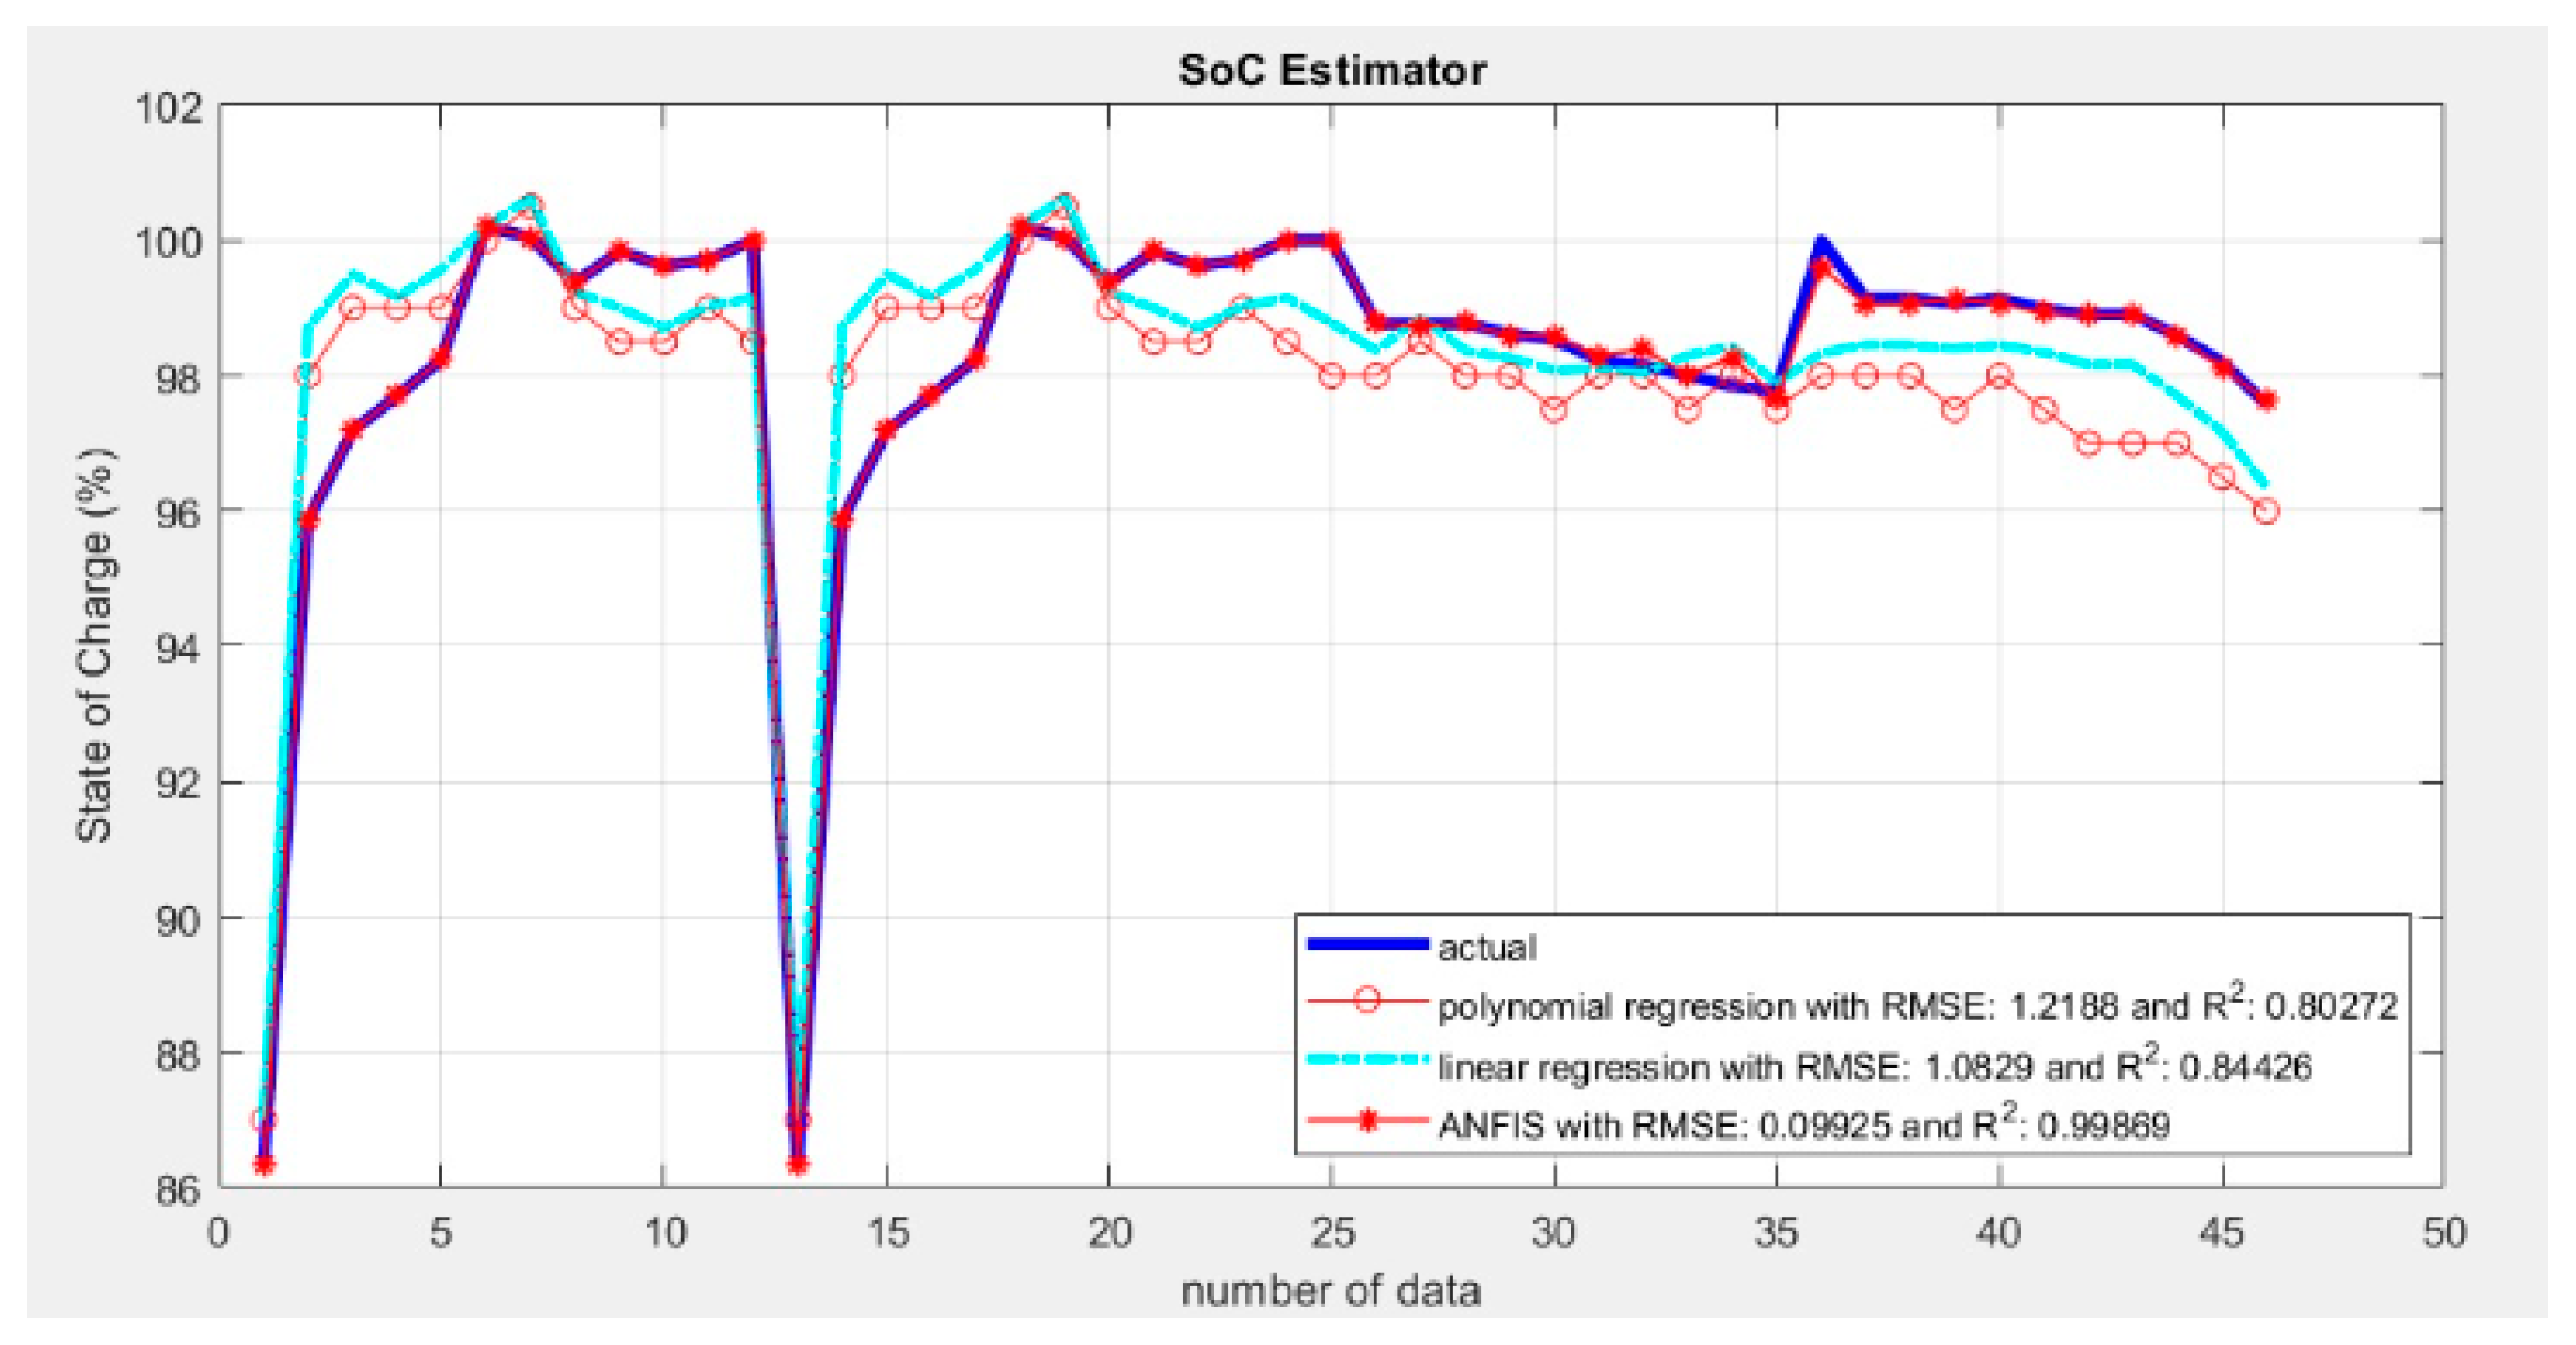

Table 1.
Sample of Dataset of SOC Estimator.
| Id | State (Charge = 1, Discharge = 0) | |||||||
| Time | V1 | V2 | V3 | V4 | Tot V | SOC | State | |
| 1 | 0 | 2.74 | 2.74 | 3.19 | 2.94 | 11.61 | 86 | 1 |
| 2 | 10 | 2.74 | 2.74 | 3.19 | 2.94 | 11.61 | 86 | 1 |
| 3 | 20 | 3.23 | 3.22 | 3.23 | 3.21 | 12.89 | 96 | 1 |
| 4 | 30 | 3.27 | 3.28 | 3.249 | 3.27 | 13.069 | 97 | 1 |
| 5 | 40 | 3.289 | 3.293 | 3.275 | 3.28 | 13.137 | 98 | 1 |
| 6 | 50 | 3.328 | 3.294 | 3.288 | 3.301 | 13.211 | 98 | 1 |
| 7 | 60 | 3.325 | 3.52 | 3.31 | 3.318 | 13.473 | 100 | 1 |
| 8 | 70 | 3.356 | 3.446 | 3.306 | 3.345 | 13.453 | 100 | 1 |
| 9 | 80 | 3.354 | 3.337 | 3.329 | 3.343 | 13.363 | 99 | 1 |
| 10 | 90 | 3.372 | 3.356 | 3.351 | 3.346 | 13.425 | 100 | 1 |
| ... | ... | ... | ... | ... | ... | ... | ... | ... |
| 25 | 0 | 3.25 | 3.24 | 3.25 | 3.25 | 12.99 | 100 | 0 |
| 26 | 12 | 3.2 | 3.2 | 3.22 | 3.21 | 12.83 | 99 | 0 |
| 27 | 24 | 3.21 | 3.2 | 3.21 | 3.21 | 12.83 | 99 | 0 |
| 28 | 36 | 3.2 | 3.2 | 3.22 | 3.21 | 12.83 | 99 | 0 |
| 29 | 48 | 3.2 | 3.19 | 3.22 | 3.2 | 12.81 | 99 | 0 |
| Id | State (Charge = 1, Discharge = 0) | |||||||
| Time | V1 | V2 | V3 | V4 | Tot V | SOC | State | |
| 30 | 60 | 3.19 | 3.19 | 3.22 | 3.2 | 12.8 | 99 | 0 |
| 31 | 72 | 3.18 | 3.18 | 3.21 | 3.19 | 12.76 | 98 | 0 |
| 32 | 84 | 3.18 | 3.18 | 3.21 | 3.18 | 12.75 | 98 | 0 |
| 33 | 96 | 3.18 | 3.17 | 3.2 | 3.18 | 12.73 | 98 | 0 |
| 34 | 108 | 3.17 | 3.17 | 3.19 | 3.18 | 12.71 | 98 | 0 |
| 35 | 120 | 3.16 | 3.17 | 3.2 | 3.17 | 12.7 | 98 | 0 |
| ... | ... | ... | ... | ... | ... | ... | ... | ... |
| 46 | 120 | 3.08 | 3.1 | 3.18 | 3.11 | 12.47 | 98 | 0 |
Table 2.
Surface View Relation.
| 1 | V1, V2, SOC | 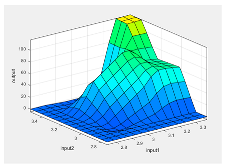 |
| 2 | V1, V3, SOC | 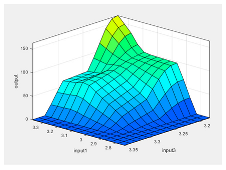 |
| 3 | V1, V4, SOC | 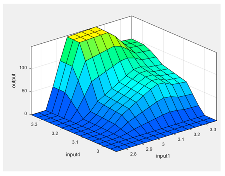 |
| Id | Relation | Surface View |
| 5 | V3, V4, SOC | 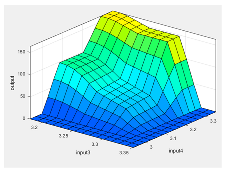 |
| 6 | V2, V3, SOC | 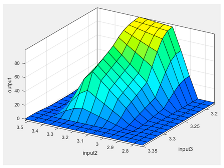 |
Disclaimer/Publisher’s Note: The statements, opinions and data contained in all publications are solely those of the individual author(s) and contributor(s) and not of MDPI and/or the editor(s). MDPI and/or the editor(s) disclaim responsibility for any injury to people or property resulting from any ideas, methods, instructions or products referred to in the content. |
© 2025 by the authors. Licensee MDPI, Basel, Switzerland. This article is an open access article distributed under the terms and conditions of the Creative Commons Attribution (CC BY) license (http://creativecommons.org/licenses/by/4.0/).
Copyright: This open access article is published under a Creative Commons CC BY 4.0 license, which permit the free download, distribution, and reuse, provided that the author and preprint are cited in any reuse.


